corticobasal syndrome: clinical, … · corticobasal syndrome: clinical, neuropsychological,...
TRANSCRIPT

CORTICOBASAL SYNDROME: CLINICAL, NEUROPSYCHOLOGICAL, IMAGING,
GENETIC AND PATHOLOGICAL FEATURES
by
Mario Masellis
A thesis submitted in conformity with the requirements for the degree of Doctorate of
Philosophy in the Graduate Department of Institute of Medical Sciences, University of Toronto
© Copyright by Mario Masellis (2012)

ii
Corticobasal Syndrome: Clinical, Neuropsychological, Imaging, Genetic and Pathological
Features
Doctorate of Philosophy 2012
Mario Masellis
Graduate Department of Institute of Medical Sciences, University of Toronto
ABSTRACT
Corticobasal Syndrome (CBS) is a rare movement and cognitive disorder. There is significant
heterogeneity observed in it clinical presentation, neuroimaging, pathology and genetics.
Understanding this heterogeneity is a priority and may help to shed light on underlying
pathogenic mechanisms. We first demonstrated that truncating mutations in the progranulin gene
(PGRN) can cause familial CBS associated with frontotemporal lobar degeneration (FTLD)-
ubiquitin pathology. This study identified a mutation in PGRN (Intervening Sequence 7+1
guanine > adenine [IVS7+1G>A]) that segregated with CBS in a family. The mutation was
predicted to result in a shortened messenger RNA (mRNA) sequence and the absence of the
mutant PGRN allele was confirmed in the reverse transcriptase-polymerase chain reaction (RT-
PCR) product, which supported the model of haploinsufficiency for PGRN-linked disease. In a
second familial study, clinical, radiological, genetic, and pathological studies were performed to
contrast clinical features of the affected members. Sequencing PGRN revealed a novel,
heterozygous cytosine-adenine dinucleotide deletion in exon 11 (g.2988_2989delCA,
P439_R440fsX6). The proband`s clinical diagnosis was frontotemporal dementia and
parkinsonism (FTDP). The proband‟s brother with the same mutation presented initially as a
progressive non-fluent aphasia (PNFA), and later evolved into a CBS. Pathological analysis

iii
revealed Frontotemporal Lobar Degeneration-Ubiquitin (FTLD-U)/ TAR DNA-binding protein
43 (TDP43) positive pathology. The next studies shift away from pathogenic mechanisms to
focus on brain-behavioural correlations and phenotypic heterogeneity in a prospective sample of
31 CBS cases. We provide the first direct correlative analysis between the severity of ideomotor
apraxia, a common sign in CBS, and cerebral SPECT perfusion imaging. Reductions in perfusion
within the left inferior parietal lobule (t=5.7, p=0.03, Family-Wise Error [FWE] corrected),
including the left angular gyrus (t=5.7, p=0.02, FWE corrected), were associated with more
severe ideomotor apraxia. We stratified the sample into CBS presenting with early motor
features (CBS-M; n=9) or early dementia (CBS-D; n=22), which identified that CBS-M were
more likely to have cortical sensory loss than CBS-D (p=0.005). In contrast, the presence of
aphasia was found to be more common and severe in CBS-D compared to CBS-M (p=0.02).
CBS-M patients had significantly reduced perfusion in the right supplementary and premotor
areas compared to CBS-D (p<0.05).

iv
ACKNOWLEDGEMENTS
I would like to first and foremost thank my supervisor, Dr. Sandra Black, for her support and
mentorship over the many years that I have known her. I first met Dr. Black (a.k.a. Sandy) back
in 2001 when I began my residency program in psychiatry. I attended many of her cognitive
neurology clinics as an intern and it was this initial exposure to the field of neurology and
neurodegenerative disease that made me decide to transfer into the neurology residency program.
The commitment and passion that she displayed towards treating patients and their families
afflicted with these devastating diseases was truly an inspiration for me. She taught me that every
patient has something unique to offer not only in terms of developing my clinical skills, but also
importantly in terms of asking novel questions about the diseases and their heterogeneous
presentations that could be assessed using the scientific method and valuable data gathered from
clinical and neuroimaging studies. In 2004, I had an opportunity to do my fourth year project
course in her lab, which further stimulated me to pursue a career in research and enroll in the
Ph.D. program following completion of my residency. Needless to say, my experiences in her lab
have been outstanding. As a result of this training, I have learned a new research method, applied
neuroimaging, which I now can add to my repertoire of techniques to use in my clinical and
genetic studies. Sandy‟s enthusiasm for research is incredible and her passion to understand and
to investigate novel therapies to treat these devastating disorders has also stimulated me to
pursue a career as a clinician-scientist. I would also like to thank Sandy for her support of my
research ideas, which have led to several peer-reviewed funding projects during and beyond my
training. Thank you Sandy for your ongoing support and I look forward to collaborating with you
on many interesting projects to come!

v
I would also like to thank Dr. James Kennedy (a.k.a. Jim) for his mentorship over many years
and also for his contribution to and participation on my program advisory committee. Jim
stimulated my initial interest in scientific research in the mid-1990s when I completed a M.Sc. in
his laboratory. My thesis was on pharmacogenetics and I am pleased to say that I continue this
very interesting line of research using the combination of my genetic, clinical and neuroimaging
training. I would also like to thank Dr. Robert Chen for his commitment and contributions that he
has made as a member of my program advisory committee. I appreciate the efforts of Dr.
Antonio Strafella for reading my thesis under tight time lines and also for being present at my
final program advisory committee meeting to participate as an additional examiner.
I would like to thank my friends and colleagues: Dr. Brad MacIntosh, Dr. Kie Honjo, Dr. Galit
Kleiner-Fisman, Dr. Ekaterina Rogaeva, Dr. Anthony E. Lang, Dr. Eric Roy, Isabelle Guimont,
Philip Francis, and Gregory Szilagyi. Their technical and thought-stimulating advice and
suggestions have helped to bring me to this point today. I would also like to thank Kayla
Sherborn for her impeccable organizational skills in helping to assemble components of this
thesis.
I would like to thank my in-laws for their support over the last few years and also for their
assistance in making home life more manageable. I would like to thank my parents for providing
me with the opportunities to pursue higher level education and for providing the right
environment for me to succeed. I greatly appreciate their continued support and inspiration and I

vi
am indebted to them for their patience especially over the last few years during the preparation of
this thesis.
Last but not least, I would like to thank my beautiful wife, Paola Masellis, for her incredible
patience and support that she has provided since the first day that I met her and over the course
of the last few years during the completion of this thesis. We have been through a lot together,
especially in recent years, and I am indebted to her kindness, love, and caring attitude. With the
completion of this thesis, I look forward to many good times ahead and many more years of
positive and happy life experiences together with her. Thanks for all that you do!

vii
TABLE OF CONTENTS
TITLE PAGE i
ABSTRACT ii
ACKNOWLEDGEMENTS iv
TABLE OF CONTENTS vii
LIST OF TABLES xi
LIST OF FIGURES xiii
ABBREVIATIONS xvii
CONTRIBUTIONS xxv
1.0: GENERAL INTRODUCTION 1
1.1 Corticobasal Degeneration: Historical Perspective 2
1.2 Epidemiology of CBS 4
1.3 Illustrative case examples 4
1.4 Symptoms and signs of corticobasal syndrome 10
1.4.1 Clinical motor and sensory features 11
1.4.2 Clinical cognitive features 14
1.4.3 Apraxia 19
1.5 Neuroimaging in CBS 21
1.5.1 Structural neuroimaging studies 22
1.5.2 Functional neuroimaging studies: PET and SPECT 25
1.6 Pathological heterogeneity in CBS 31
1.7 Genetics of CBS and CBD 37
1.8 Synopsis and overall research objective 42
1.8.1 Specific objectives 43
1.9 Description of chapters 45
1.9.1 Chapter 2: Novel splicing mutation in the progranulin gene causing
familial corticobasal syndrome
45
1.9.2 Chapter 3: Intra-Familial Clinical Heterogeneity due to FTLD-U with
TDP43 Proteinopathy Caused by a Novel Deletion in Progranulin Gene
(PGRN)
46
1.9.3 Chapter 4: Ideomotor Apraxia in Corticobasal Syndrome: Brain
Perfusion and Neuropsychological Correlates
46
1.9.4 Chapter 5: Clinical, neuropsychological, MRI and SPECT
characterization of a prospective sample of patients with corticobasal
syndrome
47
2.0: NOVEL SPLICING MUTATION IN THE PROGRANULIN GENE CAUSING
FAMILIAL CORTICOBASAL SYNDROME
48
2.1 Summary 49
2.2 Introduction 50
2.3 Methods 53
2.3.1 Subjects 53
2.3.2 Neuropathology 54

viii
2.3.3 Genetic Analysis 54
2.4 Results 55
2.4.1 Clinical features and autopsy results 55
2.4.1.1 Case #4150 (Proband) 57
2.4.1.2 Case #4993 (sister of proband) 61
2.4.1.3 Neuropathology (Case #4993) 61
2.4.2 Genetic analysis 63
2.5 Discussion 64
2.6 Acknowledgements 67
2.7 Addendum 68
3.0: INTRA-FAMILIAL CLINICAL HETEROGENEITY DUE TO FTLD-U WITH
TDP43 PROTEINOPATHY CAUSED BY A NOVEL DELETION IN
PROGANULIN GENE (PGRN)
69
3.1 Abstract 70
3.2 Introduction 71
3.3 Materials and methods 72
3.3.1 Subjects 72
3.3.2 Genetic analysis 73
3.3.3 Neuropathological analysis 74
3.4 Results 74
3.4.1 Clinical, neuropsychological, and radiographic features 74
3.4.2 Neuropathology (III:2) 81
3.4.3 Family history 82
3.4.4 Genetic analysis 83
3.5 Discussion 86
3.6 Acknowledgements 89
4.0 IDEOMOTOR APRAXIA IN CORTICOBASAL SYNDROME: BRAIN
PERFUSION AND NEUROPSYCHOLOGICAL CORRELATES
91
4.1 Abstract 92
4.2 Introduction 93
4.3 Materials and methods 96
4.3.1 Subjects 96
4.3.2 Description of neuropsychological measures 97
4.3.3 Brain SPECT acquisition and processing 99
4.3.3.1 Regional perfusion ratios 99
4.3.4 Data analysis 100
4.3.4.1 Demographic, clinical and neuropsychological measures 100
4.3.4.2 Statistical Parametric Mapping (SPM) SPECT analysis 100
4.3.4.3 Region of interest (ROI) SPECT analysis 101
4.3.4.3.1 Comparison of CBS cases to controls 101
4.3.4.3.2 Confirmation of voxel-wise correlation with WAB praxis using
ROI method
102
4.3.4.4 Brain MRI acquisition and processing 102
4.3.4.4.1 Brain extraction and automated tissue segmentation 103
4.3.4.4.2 Post-hoc MRI analysis 103

ix
4.4 Results 104
4.4.1 CBS vs controls 104
4.4.1.1 Demographic data 104
4.4.1.2 Clinical features 105
4.4.1.3 SPM and ROI SPECT analysis 105
4.4.1.4 CBS sample with praxis scores available 107
4.4.1.5 Comparison of apraxic to borderline/non-apraxic CBS patients:
Neuropsychological and SPECT analysis
109
4.4.1.6 Perfusion versus ideomotor apraxia 113
4.4.1.7 Post-hoc atrophy analysis 117
4.5 Discussion 117
4.6 Acknowledgements 127
5.0 CLINICAL, NEUROPSYCHOLOGICAL, MRI, AND SPECT
CHARACTERIZATION OF A PROSPECTIVE SAMPLE OF PATIENTS WITH
CORTICOBASAL SYNDROME
132
5.1 Abstract 133
5.2 Introduction 134
5.3 Methods 137
5.3.1 Subjects 137
5.3.2 Neuropsychological, neuropsychiatric, and functional measures 139
5.3.3 Brain MRI 140
5.3.4 Brain SPECT 141
5.3.5 Regional perfusion ratios 142
5.3.6 Pathological analysis 142
5.3.7 Data analysis 143
5.3.7.1 Demographic, clinical and neuropsychological measures 143
5.3.7.2 Region of interest (ROI) SPECT analysis 143
5.3.7.3 Statistical Parametric Mapping SPECT analysis 144
5.4 Results 145
5.4.1 CBS cases versus controls 145
5.4.1.1 Neuropsychological, behavioural and functional assessment 145
5.4.1.2 MRI features 146
5.4.2 Early dementia vs. early motor presentations 149
5.4.2.1 Demographic and clinical characteristics 149
5.4.2.2 Neuropsychological, behavioural and functional evaluation 150
5.4.2.3 MRI features 154
5.4.2.4 SPM and ROI SPECT 155
5.4.3 Description of pathological series and relation to MRI findings 156
5.5 Discussion 158
5.5.1 CBS presenting with early dementia vs. early motor features 158
5.5.2 Pathology 164
5.5.3 MRI investigation 166
5.5.4 Limitations 168
5.5.5 Conclusions 169
6.0 SUMMARY AND GENERAL DISCUSSION 171

x
6.1 Representative sample 172
6.1.1 Demographic features 172
6.1.2 Clinical and neuropsychological features 173
6.1.3 Neuropsychiatric features 176
6.2 Apraxia in CBS 178
6.3 Comment on the neuroimaging methods 180
6.4 Can CBS serve as a model of etiology for common sporadic disorders? 185
7.0 CONCLUSIONS AND FUTURE DIRECTIONS 188
8.0 REFERENCES 192

xi
LIST OF TABLES
Chapter 2
Table 1 Scores on neuropsychological and functional measures for
case #4150 compared to standardized scores calculated based
on normal population matched for age and years of education.
Page 58
Chapter 3
Table 1 Raw scores on neuropsychological and functional measures
for proband (III:1) and proband‟s brother (III:2).
Page 76
Chapter 4
Table 1 Demographics of patients with corticobasal syndrome and
control group.
Page 104
Table 2 Clinical characteristics of CBS sample. Page 105
Table 3 Demographic features of CBS presenting with apraxia vs.
those without significant apraxia.
Page 109
Table 4 Mean scores on neuropsychological, neuropsychiatric and
functional measures in CBS presenting with apraxia vs. those
without significant apraxia.
Page 111
Table 5 Areas of hypoperfusion on SPECT in the CBS group that
correlate with WAB praxis scores in the regression analyses.
Page 114
Supplementary
Table 1
Areas of hypoperfusion on SPECT in all CBS patients, CBS
with left side of body most affected, and CBS with right side
of body most affected relative to controls.
Page 130
Chapter 5
Table 1 Case summaries of clinical, pathological, and MRI features of
CBS patients.
Page 147
Table 2 MRI atrophy patterns in CBS cases stratified according to Page 148

xii
body side most affected by motor symptoms.
Table 3 Demographic features of CBS groups presenting with early
dementia versus early motor features.
Page 149
Table 4 Mean scores on neuropsychological measures in CBS patients
presenting with early dementia vs. early motor symptoms.
Page 151
Table 5 Mean scores on behavioural and functional measures in the
CBS group.
Page 154
Table 6 MRI atrophy patterns in CBS cases stratified by the presence
or absence of aphasia as determined by the WAB.
Page 154
Table 7 Areas of relative hypoperfusion on SPECT in CBS patients
presenting with early dementia versus those presenting with
early motor features.
Page 156
Table 8 Areas of relative hypoperfusion on SPECT in CBS patients
presenting with early motor versus those presenting with early
dementia.
Page 156
Supplementary
Table 1
Mean scores on behavioural and functional measures in the
CBS group.
Page 170

xiii
LIST OF FIGURES
Chapter 1
Figure 1 (A) Loss of neurons in the outer layers of the right parietal
cortex and disorganized cortical architecture in the deeper
layers; (B) Swollen, pale neurons with eccentric nuclei in the
left superior parietal region.
Page 2
Figure 2 (A) Brain SPECT showing right parieto-occipital
hypoperfusion, and (B) T1-weighted MRI showing right > left
biparietal atrophy and also a lesser degree of frontal atrophy.
Page 7
Figure 3 (A) Brain SPECT showing left > right bifrontal hypoperfusion,
and (B) T1-weighted MRI showing superior left superior
frontal > parietal atrophy.
Page 10
Figure 4 Macroscopic brain specimen showing left frontal > temporal
atrophy of Pick‟s disease.
Page 32
Figure 5 Microscopic Lewy body pathology showing Lewy bodies,
cytoplasmic stippling, neuropil grains and Lewy neurites
immunostained by antibodies to alpha-synuclein.
Page 33
Figure 6 Microscopic pathology of CBD stained with Gallyas
demonstrating (A) oligodendroglial coils, (B) neuronal pre-
tangles in the precentral region, (C) ballooned neurons, and
(D) astrocytic plaques in the basal ganglia.
Page 35
Figure 7 Microscopic agyrophilic grain disease pathology showing (A)
branched astrocytes in the amygdale, and (B) agyrophilic
grains and coiled bodies in the prosubiculum.
Page 36
Figure 8 Microscopic Alzheimer‟s pathology showing (A) astrocytic
plaques in frontal regions, and (B) neurofibrillary tangles in
the CA1 region of the hippocampus.
Page 36
Figure 9 Schematic representation of the MAPT genomic region and 3-
repeat and 4-repeat Tau transcripts.
Page 39
Figure 10 (A) H1 and H2 linkage disequilibrium blocks showing a 900
kb region of inversion, and (B) sub-structure of the MAPT
gene and associated H1 and H2 haplotypes.
Page 41

xiv
Chapter 2
Figure 1 (A) The pedigree structure of the Canadian family showing the
inheritance of the disease (with age-at-onset). (B) Genomic
DNA (gDNA) and RT-PCR (cDNA) sequence fluorescent
chromatograms around the PGRN mutation (IVS7+1G>A)
observed in the patients and the sequence around common
synonymous variation rs25646; (C) An agarose gel photograph
of the PGRN product from RT-PCR, using RNA obtained from
white blood cells of the affected family member (#4150) and
normal control.
Page 56
Figure 2 Corresponding (A) T1-weighted Magnetic Resonance Imaging
(MRI) and (B) Technetium 99m-ethyl cysteinate dimer (99m
Tc-
ECD) Single Photon Emission Computed Tomography
(SPECT) scans of the brain of Case #4150.
Page 59
Chapter 3
Figure 1 T1-weighted brain MRI and corresponding 99m
Tc-ECD brain
SPECT images of proband‟s brother (III:2) in radiographic
axial orientation- Session 1
Page 79
Figure 2 T1-weighted brain MRI and corresponding 99m
Tc-ECD brain
SPECT images of proband‟s brother (III:2) in radiographic
axial orientation - Session 2
Page 79
Figure 3 T1-weighted brain MRI and corresponding 99m
Tc-HMPAO
(800MBq) brain SPECT images of proband (III:1) in standard
radiographic axial orientation.
Page 79
Figure 4 Micrographs demonstrating a large number of TDP43
inclusions found in the fascia dentata, substantia nigra, and
CA1 region.
Page 82
Figure 5 Detection of PGRN mutation P439_R440fsX6. A) Pedigree
showing family history of neurodegenerative condition. B)
Electropherogram showing start of deletion marked with an
arrow.
Page 84
Figure 6 Amplification from genomic DNA (gDNA; lane 1) using
primers specific for the mutant allele demonstrate the mutant
Page 85

xv
fragment of 153 bp as expected. Amplification from cDNA
(lane 2) shows an absence of the expected product supportive
of non-sense mediated decay.
Chapter 4
Figure 1 Statistical parametric maps (SPM) of bilateral frontal, parietal
and temporal surface regions of the brain showing decreased
perfusion in (A) all CBS cases compared to controls and (B)
CBS cases with predominant symptoms on their left side
(CBS-L) compared to controls overlaid on brain MRI
template.
Page 106
Figure 2 Frequency of different aphasia categories on the Western
Aphasia Battery (WAB) distributed according to the CBS
group with apraxia versus those with borderline/no apraxia.
Page 113
Figure 3 Statistical parametric map of surface regions of the brain
showing decreased perfusion in the left inferior parietal region,
including the angular gyrus, that correlate with WAB praxis
scores in the regression analyses.
Page 115
Supplementary
Figure 1A
Mean proportion of different MRI tissue classes underlying the
FWE-corrected SPM mask.
Page 128
Supplementary
Figure 1B
Mean proportion of different MRI tissue classes underlying the
FDR-corrected SPM mask.
Page 129
Chapter 5
Figure 1 Normalized (z-) scores of neuropsychological measures in
patients with CBS compared to control group.
Page 145
Figure 2 Frequency of (A) extrapyramidal and (B) cortical features of
CBS patients presenting with early dementia vs. early motor
symptoms.
Page 150
Figure 3 Frequency of CBS patients with early dementia vs. early motor
presentation stratified according to category on the Western
Aphasia Battery (WAB).
Page 153

xvi
Figure 4 Statistical parametric maps overlaid on multi-slice brain MRI
template showing decreased perfusion in left fusiform gyrus
(uncorrected p<0.001) in CBS cases presenting with early
dementia versus early motor features.
Page 155

xvii
ABBREVIATIONS
β-CIT 2-β-carbomethoxy-3-β-(4-iodophenyl)-tropane
C Degrees Celsius
μg Micrograms
18F-dopa
18F-6-fluorodopa
3R Three repeat
4R Four repeat
99mTc-ECD Technetium-99m ethyl cysteinate dimer
A Adenine
ABA-2 Apraxia Battery for Adults-2
ACTB Beta Actin
AD Alzheimer‟s disease
ADL Activities of Daily Living
AGD Agyrophilic Grain Disease
AIR Automated Image Registration package
ANCOVA Analysis of covariance
ANOVA Analysis of variance
ANT Anterior
AOO Age of onset
APOE Apolipoprotein E
APX Apraxia
AQ Aphasia quotient
AT Anterior temporal
BAs Brodmann Areas
BNT Boston naming test
xviii
BOLD Blood Oxygen Level Dependent
bp Base pair
bvFTD Behavioral variant of frontotemporal dementia
C Cytosine
CAA Cerebral Amyloid Angiopathy
CBD Corticobasal degeneration
CBS Corticobasal syndrome
CBS-D Corticobasal syndrome presenting with early dementia
CBS-L Corticobasal syndrome cases with left-sided symptoms
CBS-M Corticobasal syndrome presenting with early motor features
CBS-R Corticobasal syndrome cases with right-sided symptoms
cDNA Complimentary deoxyribonucleic acid
CDR Clinical Dementia Rating
CHMP2B Chromatin-modifying protein 2B
CJD Creutzfeldt-Jakob disease
cm Centimeters
Cog Cognitive Neurology Clinic
CSDD Cornell Scale for Depression in Dementia
CSF Cerebrospinal fluid
CT Computerized Tomography
CVLT California Verbal Learning Test
D Aspartic acid
D2 Dopamine D2 receptor
DAD Disability Assessment for Dementia
DAT Dopamine transporter

xix
DEM Dementia onset
D-KEFS Delis-Kaplan Executive Function System
DLB Dementia with Lewy Bodies
DNA Deoxyribonucleic acid
DRS Dementia Rating Scale
DSM-IV Diagnostic and Statistical Manual - IV
DTI Diffusion tensor imaging
EEG Electroencephalograph
F Female
FAS F-, A-, S-word phonemic fluency
FBI Frontal Behavioural Inventory
FDG Fluorodeoxyglucose
FDR False discovery rate
FLAIR Fluid Attenuated Inversion Recovery
fMRI Functional Magnetic Resonance Imaging
FOV Field of View
Fr Frontal
FTD Frontotemporal dementia
FTLD Frontotemporal Lobar Degeneration
FTDP Frontotemporal dementia and parkinsonism
FTDP-17 Frontotemporal dementia with parkinsonism linked to chromosome
17
FTLD-U Frontotemporal Lobar Degeneration-Ubiquitin
FWE Family-Wise Error
FWHM Full width at half maximum

xx
g Gram
G Guanine
gDNA Genomic deoxyribonucleic acid
Gen Generalized
GLM General linear model
GRN Granulin
GWAS Genome wide association studies
HMPAO Hexamethylpropyleneamine Oxime
iADL Instrumental Activities of Daily Living
IBZM 123
I-iodobenzamide
IF Inferior frontal
IP Inferior parietal
IMA Ideomotor apraxia
IMP N-isopropyl-p[123
I]iodoamphetamine
IVS7+1G>A Intervening Sequence 7+1 guanine > adenine
L Left
L-dopa Levodopa
LD Linkage disequilibrium
LFB Luxol fast blue
LKA Limb-kinetic apraxia
M Male
MANCOVA Multivariate analysis of covariance
MAPT Microtubule-Associated Protein Tau
mCi Millicurrie
Mb Megabases

xxi
mBq Megabecquerel
MD Movement Disorders Clinic
MDRS Mattis Dementia Rating Scale
Min Minutes
miRNA Micro ribonucleic acid
mL Milliliter
mm Millimeter
MMSE Mini Mental Status Examination
MND Motor neuron disease
MNI Montreal Neurological Institute
Motor Motor onset
MR Magnetic Resonance
mRNA Messenger ribonucleic acid
MRI Magnetic Resonance Imaging
ms Millisecond
MSA Multiple system atrophy
n Sample size
N/T Not testable
nAPX Those without significant apraxia
NART-R National Adult Reading Test-Revised
NCO Normal cut-off
NEX Number of excitations
NPI Neuropsychiatric Inventory
O Occipital
OMIM On-line Mendelian Inheritance in Man

xxii
p Probability value
P Parietal
P301S Proline301Serine
PCR Polymerase Chain Reaction
PD Parkinson‟s disease
PET Positron Emission Tomography
PGRN Progranulin
PNFA Progressive non-fluent aphasia
POST Posterior
PPA Primary Progressive Aphasia
PSEN1 Presenilin 1
PSP Progressive Supranuclear Palsy
PT Posterior temporal
Q-Q Quantile-Quantile
R Right
rCBF Regional cerebral blood flow
RNA Ribonucleic acid
ROI Regions of interest
RT-PCR Reverse transcriptase-polymerase chain reaction
SD Standard deviation
Sec Second
SEM Standard Error of Mean
SF Superior frontal
SNCA Alpha-synuclein
SNPs Single Nucleotide Polymorphisms

xxiii
SP Superior parietal
SPECT Single-Photon Emission Computed Tomography
SPGR Spoiled gradient
SPM Statistical Parametric Mapping
SPM5 Statistical Parametric Mapping version 5
SPSS Statistical Package for the Social Sciences
SS Scaled Score
SYM Symmetrical
T Thymine
T2/PD T2/Proton density
TDP43 TAR DNA-binding protein 43
Te Temporal
TE Echo time
TMEM106B Transmembrane protein 106B
TMT-A Trail Making Test A
TMT-B Trail Making Test B
TOLA Test of Oral and Limb Apraxia
TR Repetition time
TRODAT [2-[[2-[[[3-(4-chlorophenyl)-8-methyl-8-azabicyclo[3.2.1]oct-2-
yl]methyl](2mercaptoethyl)amino]ethyl]amino]ethanethiolato(3-)-
N2,N2‟,S2,S2‟]oxo-[1R-(exo-exo)]- [99m
Tc] technetium)
([99m
Tc]TRODAT-1)
VBM Voxel-based morphometry
WAB Western Aphasia Battery
WCST Wisconsin Card Sort Test
WMH White Matter Hyperintensities

xxiv
WMS-R Wechsler Memory Scale-Revised
ZS Z-score

xxv
CONTRIBUTIONS
Chapter 2.0 Novel splicing mutation in the progranulin gene causing familial corticobasal
syndrome
Mario Masellis,* Parastoo Momeni,
* Wendy Meschino, Reid Heffner Jr., Christine Sato, Yan
Liang, Peter St George-Hyslop, John Hardy, Juan Bilbao, Sandra Black, and Ekaterina Rogaeva
As published in: Brain (2006); 129: 3115-3123
Mario Masellis extracted the clinical information on all family members, interpreted and
integrated the clinical, neuropsychological, neuroimaging, genetic and pathological data, and was
responsible for writing the manuscript. Sequencing and genotyping was performed by Parastoo
Momeni and Ekaterina Rogaeva. Pathological analysis was done by Reid Heffner Jr. and Juan
Bilbao.
Chapter 3.0 Intra-Familial Clinical Heterogeneity due to FTLD-U with TDP43
Proteinopathy Caused by a Novel Deletion in Progranulin Gene (PGRN)
Tomasz Gabryelewicz*, Mario Masellis*, Mariusz Berdynski
*, Juan M. Bilbao, Ekaterina
Rogaeva, Peter St. George-Hyslop, Anna Barczak, Krzysztof Czyzewski, Maria Barcikowska,
Zbigniew Wszolek, Sandra E. Black and Cezary Zekanowski As published in: J Alzheimers Dis
(2010); 22: 1123-1133.
Mario Masellis extracted the clinical information on the brother of the proband, interpreted and
integrated the clinical, neuropsychological, neuroimaging, genetic and pathological data, and was
responsible for writing a significant proportion of the manuscript with contribution from Tomasz

xxvi
Gabryelewicz. Sequencing of the proband and genotyping of the controls was performed by
Mariusz Berdynski and Cezary Zekanowski. Ekaterina Rogaeva performed the genotyping in the
brother of the proband. Pathological analysis was done by Juan Bilbao.
Chapter 4.0 Ideomotor Apraxia in Corticobasal Syndrome: Brain Perfusion and
Neuropsychological Correlates
Mario Masellis, Philip L. Francis, Kie Honjo, Bradley J. MacIntosh, Isabelle Guimont, Gregory
M. Szilagyi, Wendy R. Galpern, Galit Kleiner-Fisman, James L. Kennedy, Robert Chen, Eric A.
Roy, Curtis B. Caldwell, Anthony E. Lang, Sandra E. Black. As submitted to: Cortex
Mario Masellis clinically assessed several of the patients included in this study, extracted the
clinical information, designed the study, performed the data analysis and wrote the manuscript.
Philip Francis assisted with the SPM analysis of SPECT data and Kie Honjo assisted with the
MRI segmentation procedure. Bradley J. MacIntosh assisted with the atrophy correction
procedure. Wendy R. Galpern, Galit Kleiner-Fisman and Anthony E. Lang assessed and
collected clinical data on patients ascertained from a movement disorders clinic.
Chapter 5.0 Clinical, neuropsychological, MRI and SPECT characterization of a
prospective sample of patients with corticobasal syndrome
Mario Masellis, Philip L. Francis, Isabelle Guimont, Wendy Galpern, Juan Bilbao, Kie Honjo,
Fuqiang Gao1, Gregory Szilagyi, Farrell Leibovitch, James L. Kennedy, Galit Kleiner-Fisman,
Lisa Ehrlich, Robert Chen, Anthony E. Lang, Sandra E. Black

xxvii
Mario Masellis clinically assessed several of the patients included in this study, extracted the
clinical information, designed the study, performed the data analysis and wrote the manuscript.
Philip Francis assisted with the SPM analysis of SPECT data and Kie Honjo assisted with an
independent visual read of the MRI data. Wendy R. Galpern, Galit Kleiner-Fisman and Anthony
E. Lang assessed and collected clinical data on patients ascertained from a movement disorders
clinic. Juan Bilbao performed the neuropathological analysis.

1
1.0 General Introduction

2
1.0 General Introduction
1.1 Corticobasal Degeneration: Historical Perspective
Rebeiz and colleagues described the first case of corticobasal degeneration (CBD) in 1967 and
subsequently characterized three cases from the clinical and pathological perspective in 1968 in
their seminal paper „Corticodentatonigral Degeneration with Neuronal Achromasia‟ in which
they coined the term based on pathological changes noted in the brain (figure 1) [Rebeiz et al.
1967;Rebeiz et al. 1968].
Figure 1. (A) Loss of neurons in the outer layers of the right parietal cortex and disorganized cortical
architecture in the deeper layers, and (B) swollen, pale neurons with eccentric nuclei in the left superior
parietal region. Adapted from Rebeiz et al. [Rebeiz et al. 1968]
A B

3
Since then, many terms have been used to describe this enigmatic disorder of interest to
cognitive and movement disorder neurologists worldwide. These include: cortical degeneration
with swollen chromatolytic neurons, corticobasal ganglionic, cortical basal ganglionic, and the
most common designation, corticobasal degeneration (CBD) [Mahapatra et al. 2004].
Patients suffering from CBD pathology or from the typical clinical syndrome have an insidious
onset and gradual decline in function due to a combination of cortical and subcortical/
extrapyramidal clinical features not attributable to other etiologies such as stroke or tumour
[Boeve et al. 2003]. The cortical features may include focal or asymmetric ideomotor apraxia,
alien limb phenomenon, cortical sensory loss, visual or sensory hemi-neglect, constructional
apraxia, focal or asymmetric myoclonus, and apraxia of speech/nonfluent aphasia. The
extrapyramidal features may consist of appendicular rigidity lacking prominent and sustained L-
dopa response, and appendicular dystonia. Supportive criteria include cognitive dysfunction with
relative preservation of learning and memory on psychometric testing, asymmetric atrophy on
computed tomography or magnetic resonance imaging, typically maximal in frontoparietal
cortical regions, and asymmetric hypoperfusion or hypometabolism on single-photon emission
computed tomography (SPECT) and positron emission tomography (PET), respectively,
typically maximal in frontoparietal cortex ± basal ganglia ± thalamus. The clinical syndrome
produced by CBD pathology is most often markedly asymmetrical with either left or right
hemisphere signs noted in the early stages of the disease although symmetrical cases at onset
have been infrequently described [Hassan et al. 2010].

4
1.2 Epidemiology of CBS
CBS and its most commonly associated underlying pathology, CBD, are extremely rare
syndromic/ pathologic entities and, as a result, it is difficult to estimate their true incidence and
prevalence. Corticobasal syndrome typically presents in the sixth to eighth decade of life and has
a mean age of onset of approximately 63 (standard deviation 7.7) years [Wenning et al. 1998]. It
is estimated that CBS accounts for four to six percent of all cases of parkinsonism and, based on
the incidence of Parkinson‟s disease, it is speculated that the incidence of CBS lies somewhere
between 0.62 to 0.92 per 100,000 per year [Mahapatra et al. 2004;Togasaki and Tanner
2000;Wenning et al. 1998]. Based on the average duration of survival of approximately 7.9
years, prevalence can be estimated at about 4.9 to 7.3 per 100,000 [Mahapatra et al.
2004;Togasaki and Tanner 2000;Wenning et al. 1998]. Despite its rarity, CBS is an extremely
interesting syndrome particularly pertaining to the enormous amount of heterogeneity that can be
seen on multiple levels including clinical, neuropsychological, neuroimaging, genetic and
pathological features. A selection of some of the more common symptoms and signs of CBD will
now be illustrated through a review of two representative cases whose clinical and research data
were included in the thesis experiments.
1.3 Illustrative case examples
Case 1: CBD with early motor presentation
This 65 year old right-handed woman with no relevant past medical history presented at age 62
with the insidious onset and progressive decline in the use of her left arm. Her presenting
complaint was that she could not knit because her “left hand was somewhat awkward.” It would

5
not do what she “wanted it to do.” Shortly thereafter, she noted difficulty using her left hand to
cut steak and onions with a knife and fork, de-bone chicken, button up her jacket and fold
laundry. She also endorsed troubles with going down stairs. She also noted that she was
becoming more “impatient.” She saw a neurologist early on in the disease course at age 62 and
was noted on exam to have difficulties with fine motor coordination of her left hand and to a
lesser degree her left lower extremity. There was also mild pseudoathetosis of the left fingers.
Otherwise, her neurological exam, including “higher mental functions”, was intact. She was
diagnosed with “left upper extremity apraxia” and referred on to a movement disorders clinic
where a provisional diagnosis of corticobasal syndrome was made. This was based on history
and the emergence of left-sided rigidity and overflow dystonic posturing of the left arm while
walking – slight abduction at the shoulder, extended at the elbow and wrist with a clenched fist,
in addition to an action tremor, but none at rest on the left. Initial brain MRI and SPECT scans
were reported as normal. An EEG demonstrated “non-specific bitemporal slow waves.” A trial of
levodopa was initiated for several months with no response; she eventually discontinued it. Her
motor symptoms continued to slowly worsen.
Over time, she noted that her left hand and arm “has a mind of its own.” It moved “against” her
will and she used her right arm to keep her left in check. She also lost the ability to write with
even her right hand. Her husband also endorsed that she was not seeing things as easily in her
left visual world. Her medications at this time included amantadine 100 mg tid. Although there
were no cognitive issues endorsed by the patient or caregiver, cognitive screening revealed an
MMSE of 21/28 (total score reduced to 28 given that apraxia interfered with tasks involving
drawing and writing) with points lost predominantly on attention and delayed recall. A cognitive

6
screening battery revealed difficulties with tasks involving sustained attention, working memory,
executive functions and praxis. Delayed verbal recall was impaired, but benefited from cueing.
Neurological exam revealed left greater than right-sided rigidity and paratonia. She had a classic
alien-limb phenomenon involving the left upper extremity. Proprioception was reduced on the
left and there was bilateral agraphesthesia. There was a left-sided grasp reflex. About two
months after this initial visit, she continued to decline with worsening left-sided dystonia and
apraxia creating an essentially useless left arm. A repeat brain SPECT revealed decreased
perfusion in the right parietal and lateral occipital region (Figure 2). Brain MRI revealed
generalized atrophy most prominent in the right posterior region (Figure 2). Neuropsychological
testing revealed a preservation of frontal lobe executive function. About seven months later (age
66), she was having increasing difficulties with ambulation requiring a cane and wheelchair for
distances. MMSE was 25/28. Shortly thereafter, she lost the ability to ambulate and became
wheel-chair bound. She had moderate dysarthria. Rigidity was present in all four limbs although
it remained worse on the left. Ideomotor apraxia was also becoming worse in the right hand.
There was also evidence for a mild orofacial and oculomotor apraxia. About eight months later
(age 67) she continued to decline with slower speech, increasing word-finding difficulties, and
occasional semantic paraphasia. There were no complaints of memory loss. Her MMSE was
18/28. She developed a classic alien limb phenomenon of her right arm, with constant
involuntary grabbing of the left arm and touching of faces. Her rigidity was severe with
superimposed spasticity and hyperreflexia. Over the next nine months (age 68), her speech
became severely dysarthric and eventually progressed to mutism. Her swallowing also became
impaired and she developed recurrent pneumonia presumably on the basis of aspiration. She
developed severe, generalized rigidity and it was uncomfortable to move her. Approximately,
7
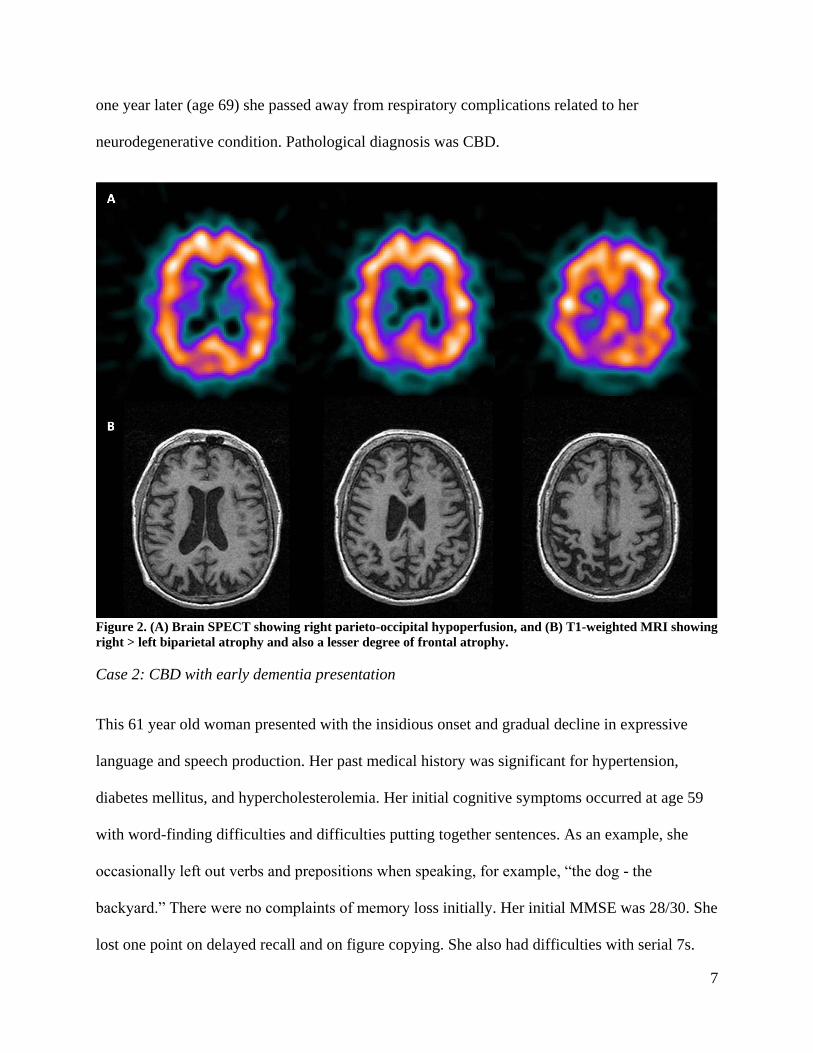
one year later (age 69) she passed away from respiratory complications related to her
neurodegenerative condition. Pathological diagnosis was CBD.
Figure 2. (A) Brain SPECT showing right parieto-occipital hypoperfusion, and (B) T1-weighted MRI showing
right > left biparietal atrophy and also a lesser degree of frontal atrophy.
Case 2: CBD with early dementia presentation
This 61 year old woman presented with the insidious onset and gradual decline in expressive
language and speech production. Her past medical history was significant for hypertension,
diabetes mellitus, and hypercholesterolemia. Her initial cognitive symptoms occurred at age 59
with word-finding difficulties and difficulties putting together sentences. As an example, she
occasionally left out verbs and prepositions when speaking, for example, “the dog - the
backyard.” There were no complaints of memory loss initially. Her initial MMSE was 28/30. She
lost one point on delayed recall and on figure copying. She also had difficulties with serial 7s.

8
Her language was described as non-fluent. Naming, reading, writing, comprehension and
repetition were intact. On this initial assessment, her neurological exam was otherwise normal. A
CT head revealed generalized cerebral atrophy and a brain SPECT revealed mild hypoperfusion
in the posterior parietotemporal regions as well as bifrontally. Her initial diagnosis was primary
progressive non-fluent aphasia (PNFA).
Approximately one year later (age 62), her problems with fluency progressed. Occasionally, she
would substitute in the incorrect word while speaking. She would also repeat words that
someone else had said representing echolalia. Her word pronunciation declined and her speech
became more strained. Despite these difficulties, she was able to sing along to songs. Even
though the patient denied any short-term memory difficulties, her family noted that there was
some forgetfulness as she would often not recall things on a grocery list. Apathy and depressive
symptoms were present with the patient becoming more withdrawn from interaction with others
and also less interested in doing things that she enjoyed. She was frequently tearful. She began to
have postural instability with episodes of spontaneously falling backwards. Her MMSE had
declined to 18/30 with five points lost on orientation, four points lost on attention/calculation,
and one point lost on each of delayed recall, three-step command, and figure-copying. A
cognitive screening battery revealed prominent deficits on tasks involving sustained attention,
working memory, executive functions and ideomotor praxis. Language assessment revealed
strained, effortful speech with paraphasias and decreased spontaneous output. Naming for low
frequency words was impaired as was repetition. Comprehension remained relatively spared.
Short-term memory was also impaired, but benefited from cueing. Visuospatial function was
relatively preserved. Neurological exam revealed slow, hypometric saccades horizontally and

9
difficulty with eliciting downward saccades. She had a positive grasp reflex bilaterally as well as
a snout/pout response. Tone was increased moreso on the right. Strength was within normal
limits as were reflexes and plantar responses. There was some evidence for mild bradykinesia on
rapid alternating movements. Gait revealed some slowing with decreased arm swing on the right.
On pull-test, there was an absence of the postural reflex; she fell straight backwards. The
diagnostic impression at this time was primary progressive non-fluent aphasia evolving into CBS
with some features of Progressive Supranuclear Palsy (PSP). Re-assessment three months later
revealed continual decline in terms of memory, language, falls, apathy and loss of instrumental
activities of daily living. Her exam revealed ongoing troubles with saccadic eye movements and
increasing rigidity and bradykinesia on the right greater than left side. A repeat SPECT scan
revealed moderate to severe hypoperfusion of the left frontal lobe extending to the left temporal
lobe, caudate, and less so to the thalamus (Figure 3). MRI revealed left greater than right-sided
atrophy involving the frontal, temporal and parietal regions (Figure 3). Neuropsychological
testing revealed deficits across all cognitive domains. Her WAB category was anomic aphasia.
Evaluation approximately eight months later (age 63) revealed worsening expressive language
function with preserved comprehension; she could say only one to two words at a time. She
continued to have frequent falls. She progressed to dependence on all activities of daily living.
She could only walk if assisted. Her MMSE score was 8/28. She was able to name 5/6 objects,
and followed some commands. She had no extraocular movements to command or pursuit, but
they were present on vestibular oculoreflex testing. There was increased axial tone with nuchal
hyperextension. There was marked rigidity of the right arm and leg with significantly less
rigidity on the left. There was a severe ideomotor apraxia on the right greater than left. Re-

10
assessment nine months later (age 64) revealed worsening aphasia; she was now only able to say
single word sentences and had difficulties comprehending even simple instructions. Gait had
worsened and she required a two-person assist to transfer, and was wheel-chair bound. On exam,
the MMSE score was 2/28. The physical exam was unchanged except for worsening rigidity and
postural instability. She died at age 65 due to respiratory complications related to the
neurodegeneration. Pathological diagnosis was CBD.
Figure 3. (A) Brain SPECT showing left > right bifrontal hypoperfusion, and (B) T1-weighted MRI showing
superior left superior frontal > parietal atrophy.
1.4 Symptoms and signs of corticobasal syndrome
The two cases described in the preceding section provide an illustrative account of several
common symptoms and signs associated with CBS and also demonstrate the evolution of the

11
clinical syndrome over time. Several classical papers detailing the frequency of clinical signs in
CBS will now be reviewed.
1.4.1 Clinical motor and sensory features
A large prospective study from a movement disorders clinic identified that 64% (23/36) of
patients presenting with CBS had “clumsiness of one hand or arm with loss of manual dexterity”
as the most common initial complaint [Rinne et al. 1994]. A disturbance of gait due to leg
stiffness, jerking, clumsiness, imbalance or combinations thereof, was the next most frequent
presenting complaint (28%; 10/26) [Rinne et al. 1994]. Rare initial presentations included
prominent sensory symptoms, isolated speech disorder with dysarthria, or a prominent
behavioural syndrome [Rinne et al. 1994]. Another early clinical study of 15 patients
demonstrated that postural-action tremor, apraxia, limb dystonia or cortical sensory loss were the
most frequent initial presenting symptoms [Riley et al. 1990]. Wenning and colleagues
[Wenning et al. 1998] found a similar distribution of the most common clinical signs mentioned
above. A retrospective chart review of 147 CBS cases from multiple centers found that rigidity
(92%), apraxia (82%), bradykinesia (80%) and gait disorder (80%) were the most common signs
observed in their sample [Kompoliti et al. 1998].
The disorder progressed over time to involve the ipsilateral limb, typically the leg, and then
eventually involved the contralateral side usually starting with the arm. With progression, other
cortical and extrapyramidal features of the syndrome emerge although many of these signs can
also be present early on. Of the extrapyramidal features, asymmetric rigidity and akinesia/

12
bradykinesia that typically do not respond to levodopa were common findings and eventually
occurred in all patients [Kompoliti et al. 1998;Riley et al. 1990;Rinne et al. 1994]. Limb
dystonia was also a common finding and usually involved the most affected limb with adduction
at the shoulder, flexion posturing at the elbow and clawing of the fingers around the adducted
thumb into the palm, often with skin breakdown – the so-called “clenched fist” [Rinne et al.
1994;Vanek and Jankovic 2001]. Extension of one or more fingers has also been observed
[Rinne et al. 1994;Vanek and Jankovic 2001]. Limb dystonia has been associated with pain in
prior studies [Rinne et al. 1994;Vanek and Jankovic 2001] and may respond to local botulinum
toxin injectons into the affected muscles [Cordivari et al. 2001].
Cortical features that involve the limbs also typically present asymmetrically, but will also
progress to bilateral involvement over time. Apraxia is the most common cortical feature and
will invariably occur in all patients at some point during the course of the disease [Leiguarda et
al. 1994;Rinne et al. 1994;Stamenova et al. 2009]. Apraxia will be discussed in more detail in a
subsequent section. Cortical sensory loss, manifest as agraphesthesia, astereognosis, sensory
extinction, hemi-neglect, and/or loss of two-point discrimination and/or proprioception,
presented asymmetrically in several studies [Kompoliti et al. 1998;Mahapatra et al. 2004;Riley
and Lang 2000;Rinne et al. 1994]. Irregular jerking (myoclonus) in CBS was focal involving one
limb, typically occurred in distal regions, and was elicited with action and/ or evoked by a
stimulus [Riley et al. 1990;Thompson et al. 1994]. The myoclonus was cortical in origin as
determined by electrophysiological studies demonstrating evidence of enhanced cortical
excitability via cutaneous or mixed nerve stimulation [Thompson et al. 1994]. Alien limb
phenomenon is a particularly interesting cortical feature whereby the affected limb acts out on its

13
own, sometimes without the patient being aware of its movement and behavior [Riley et al.
1990]. As in our first case, her left hand had a “mind of its own” and it moved “against her will”
representing what is now considered to be the true form of alien limb phenomenon [Boeve et al.
2003]. “Levitation” of a limb, originally described by Denny-Brown et al. [Denny-Brown et al.
1952], was thought to originate from lesions in the parietal lobe and should be distinguished
from the true alien limb phenomenon. Although both phenomena occur in CBS, levitation is
more common than alien limb phenomenon [Riley et al. 1990] and previous studies that have
grouped these signs together have likely artificially inflated the frequency of “alien limb” in this
syndrome [Kompoliti et al. 1998]. Similar to case 1, asymmetric pyramidal findings including
superimposed spasticity, hyperreflexia, and positive Babinski signs have also been observed
[Kompoliti et al. 1998;Mahapatra et al. 2004;Riley et al. 1990;Rinne et al. 1994;Wenning et al.
1998]. Frontal release signs were often present and can be more pronounced on the most affected
side of the body [Kompoliti et al. 1998;Mahapatra et al. 2004;Riley et al. 1990;Rinne et al.
1994;Wenning et al. 1998].
Eye movement abnormalities similar to that described in case 2, were observed in 72% (26/36)
of CBS cases and were considered supranuclear in nature manifesting as oculomotor apraxia,
saccadic (jerky) pursuit movements, and/or restriction in the range of saccadic and pursuit
movement vertically more than horizontally [Rinne et al. 1994]. In four cases, a frank limitation
of vertical downgaze was noted reminiscent of that observed in progressive supranuclear palsy
(PSP) [Rinne et al. 1994]. Similar findings were noted in other studies [Kompoliti et al.
1998;Mahapatra et al. 2004;Riley and Lang 2000]. The constellation of clinical exam features is
variable across individual patients. That is, not all patients manifest every sign that has been

14
associated with CBS. In addition, the body side most affected and the timing in which the
different clinical signs present is also variable across patients although over time the signs are
present bilaterally.
1.4.2. Clinical cognitive features
The majority of the studies reviewed in the preceding section were conducted in specialist
movement disorder clinics. While several of the early studies acknowledged that a few of their
cases presented with an early dementia syndrome [Rinne et al. 1994;Wenning et al. 1998], a
general conclusion drawn was that early dementia was not a common initial presentation of the
CBS. This viewpoint changed when Grimes et al. [Grimes et al. 1999b] reported that dementia
was the most common initial presentation in a case series of patients selected based on having a
pathological diagnosis of CBD. In a retrospective review of clinical features of 13 patients with a
post-mortem diagnosis of CBD, only four patients had a diagnosis of CBS in life, while six
patients had a primary diagnosis of Alzheimer‟s disease and three were diagnosed with atypical
dementia (two with frontotemporal dementia or Pick‟s disease and one with dementia and
Parkinsonism) [Grimes et al. 1999b]. In longitudinal follow-up, three of the four cases who
presented initially with the classic perceptuomotor disorder went on to develop clinical evidence
for dementia [Grimes et al. 1999b]. In addition, 11 of 13 cases with dementia during the disease
course developed a motor disorder initially, concurrently or at a later time point and the majority
of these patients would have retrospectively met criteria for CBS underscoring the importance of
longitudinal follow-up [Grimes et al. 1999b]. The heterogeneity observed in the initial clinical
presentation and evolution over time of patients with CBD pathology likely results from the

15
differences in the distribution and severity of the underlying histopathological lesions [Lang
2003]. A subsequent study also identified two patients who presented with a frontotemporal
dementia syndrome in life who subsequently were found to have a pathological diagnosis of
CBD demonstrating the overlap of these disorders [Mathuranath et al. 2000].
Several studies have attempted to clarify the nature of the underlying cognitive deficits
associated with CBS and CBD pathology. One of the earliest cognitive studies compared the
neuropsychological profile of 15 patients with a clinical diagnosis of CBS to that of 19 matched
normal controls, as well as to that of patients with PSP (n=15) or Alzheimer‟s disease (AD;
n=15) [Pillon et al. 1995]. CBS patients demonstrated a moderate degree of dementia based on
global measures of cognition used, such as the Mattis Dementia Rating Scale and Raven‟s
Progressive Matrices. They also demonstrated prominent troubles with executive dysfunction
similar to that seen in PSP, but more severe than that observed in Alzheimer‟s disease and this
was thought to be due to abnormal function of the frontal-subcortical circuit including damage to
the basal ganglia and connections with prefrontal cortical regions [Pillon et al. 1995]. Although
mild learning deficits on verbal episodic memory tasks were found in CBS and PSP, the deficits
significantly benefited from semantic cueing in contrast to that observed in AD cases, in which
both cued recognition and recall were impaired [Pillon et al. 1995]. This finding is also
consistent with impaired frontal-subcortical retrieval processes in CBS and PSP compared to
prominent hippocampal involvement of encoding and retrieval processes in AD. Similar to
patients with PSP, CBS patients demonstrated deficits in dynamic motor execution including
difficulties with control and inhibition as well as temporal organization and bimanual
coordination [Pillon et al. 1995]. These motor execution deficits were not observed in patients

16
with AD. In contrast, asymmetric ideomotor apraxia was noted mainly in CBS patients reflecting
involvement of premotor and parietal regions and was not commonly observed in the PSP or AD
groups [Pillon et al. 1995].
Using the Delis-Kaplan Executive Function System, Huey et al. [Huey et al. 2009a] compared
51 patients with behavioural variant FTD and 50 patients with CBS on various standardized
measures of executive function and identified MRI correlates within each of the groups. Both
groups were more impaired on executive functions compared to their performance on an episodic
memory task – the Wechsler Memory Scale-third edition [Huey et al. 2009a]. A between group
comparison revealed that FTD patients were significantly more impaired on most executive
functions than the CBS group, except for those tasks weighted towards motor and/ or
visuospatial abilities, including the Trail Making Test and the two timed measures of the Tower
Test [Huey et al. 2009a]. Within the CBS group, atrophy on MRI in the dorsal frontal, parietal,
and temporal-parietal cortical regions in addition to the thalamus was correlated with
performance on executive tasks [Huey et al. 2009a]. This study confirms in the largest CBS
sample to date ascertained from a single site that executive dysfunction is a prominent feature
associated with CBS implicating significant frontal lobe dysfunction in this disorder. Graham et
al. [Graham et al. 2003b] reviewed the literature on cognitive dysfunction in CBS and
summarized that deficits on frontal lobe tasks such as the Wisconsin Card Sort Test, trail making
and initial letter and category fluency were invariably affected across most patients with CBS.

17
Several studies of CBS have revealed that language impairment is a common cognitive feature of
this disorder. Frattali et al. [Frattali et al. 2000] studied 15 patients with a clinical diagnosis of
CBS and found that eight (53%) of these patients had a classifiable aphasia based on a
standardized language assessment using the Western Aphasia Battery. Six patients were
categorized as having an anomic aphasia, one patient had a Broca‟s aphasia, while one had a
transcortical motor aphasia. An additional patient demonstrated an apraxia of speech [Frattali et
al. 2000]. MRI scans were assessed visually and the patients with language dysfunction were
found to have more frontal, temporal and parietal cortical atrophy as well as subcortical white
matter and callosal changes [Frattali et al. 2000]. Another study followed 35 patients with CBS
longitudinally, 15 with a motor onset and 20 with a cognitive onset, and observed that 13 patients
(37%) in the cognitive onset group presented initially with a disorder of progressive aphasia
[Kertesz et al. 2000b]. Over longitudinal follow up, all but one patient in the motor onset group,
that is, 97% of the sample demonstrated a disorder of language [Kertesz et al. 2000b]. Formal
assessment of language using the Western Aphasia Battery was conducted in 21 CBS patients
and this demonstrated that patients with cognitive onset had significantly lower scores than the
motor-onset group [Kertesz et al. 2000b]. This indicated the presence of more severe forms of
aphasia in the cognitive onset group. Graham et al. [Graham et al. 2003a] also performed a
detailed assessment of language in a series of ten unselected patients with CBS and demonstrated
that eight patients (80%) had language impairment characterized by deficits in phonologic
processing and in spelling (orthographic processing). Only two of their patients demonstrated a
clinically evident non-fluent aphasia [Graham et al. 2003a]. These important early studies of
language function in CBS among others were reviewed and this has lead some authors to
conclude that presentation with a progressive apraxia of speech and/ or progressive non-fluent

18
aphasia is strongly associated with the later development of a CBS and may also be predictive of
CBD pathology [Josephs and Duffy 2008].
There have been very few studies examining visuospatial functioning in CBS. Tang-Wai et al.
[Tang-Wai et al. 2003] reported two cases of patients with pathologically proven CBD, who
presented initially with a progressive focal visuospatial syndrome and then evolved into a full-
blown CBS. A clinical study of 88 patients with atypical parkinsonian syndromes using the
Visual Object and Space Perception battery, including 20 patients with multiple system atrophy,
43 with PSP, and 25 with CBS, demonstrated that only the CBS group had evidence for
significant visuospatial dysfunction that was independent of their performance on other cognitive
tasks [Bak et al. 2006]. They hypothesized that the observed visuospatial deficit reflects
dysfunction of the dorsal visual stream due to involvement of the parietal lobes by the
pathologies that can produce CBS [Bak et al. 2006].
The studies discussed in the preceding paragraphs described cognitive and neuropsychological
features of patients clinically diagnosed with CBS and only a small proportion of these patients
had pathologically confirmed CBD. We will now review the findings of a longitudinal clinical
and neuropsychological study of 15 patients with pathologically proven CBD [Murray et al.
2007]. Similar to prior studies, only six patients (40%) had a clinical diagnosis of CBS in life
whereas other primary or differential diagnoses included progressive non-fluent aphasia,
behavioural variant FTD, Alzheimer‟s disease, atypical dementia, atypical PSP, and dementia
with Lewy bodies [Murray et al. 2007]. Using a comprehensive neuropsychological battery, a

19
specific cognitive profile of CBD was identified that included deficits in the performance of
gestural, language, visuospatial, executive, and social functioning with relative sparing of
episodic memory, even at the late stages of the disease. These neuropsychological deficits
correlated with burden of CBD Tau-related pathology in the frontal and parietal regions as well
as the basal ganglia with minimal involvement of the temporal lobes and hippocampi [Murray et
al. 2007].
1.4.3 Apraxia
In general terms, apraxia is “characterized by loss of the ability to execute or carry out skilled
movements and gestures, despite having the desire and the physical ability to perform them”
(http://www.ninds.nih.gov/disorders/apraxia/apraxia.htm). Apraxia is the main clinical feature
that distinguishes CBS from other parkinsonian disorders and it is observed in 100% of CBS
cases during longitudinal follow-up [Leiguarda et al. 1994;Rinne et al. 1994;Stamenova et al.
2009]. Different types of apraxia have been reported in CBS including subtypes of limb apraxia,
such as limb-kinetic apraxia, ideomotor apraxia (IMA), and ideational/conceptual apraxia.
Orofacial apraxia and apraxia of speech have also been observed. A full description of the types
of apraxia identified in CBS have been extensively reviewed elsewhere [Gross and Grossman
2008;Josephs and Duffy 2008;Leiguarda and Marsden 2000;Stamenova et al. 2009;Zadikoff and
Lang 2005]. Limb apraxia is the most common type observed in CBS and the remainder of this
section will focus on this topic.

20
Several models of limb apraxia have been described in the literature based on original case
studies and series, and the left parietal lobe has been implicated in most [Geschwind
1975;Goldenberg 2009;Heilman and Rothi 1993;Liepmann 1920;Roy 1996]. Although it is
beyond the scope of this thesis to describe these models in detail, highlights of several models
will be briefly reviewed. One of the earliest models postulated the existence of visual mental
images of the intended movement stored in posterior brain regions such as the parieto-occipito-
temporal junction in the dominant left hemisphere that are then transferred forward to central
sensorimotor regions for the task to be carried out [Liepmann 1920;Goldenberg 2009].
Geschwind alternatively proposed that comprehension of verbal commands to carry out a motor
task is achieved in Wernicke‟s area and then is carried forward to the sensorimotor cortex via the
arcuate fasciculus passing under the parietal lobes [Geschwind 1975;Goldenberg 2009].
Therefore, damage in the parietal region on the left can result in apraxia through disruption of
this circuit [Geschwind 1975]. A more recent neuroanatomical theory of praxis based on the
original Liepmann model suggests that „praxicons‟ or „movement formulae‟ are stored in the left
inferior parietal lobule, which then are transformed into „innervatory patterns‟ or „motor schema‟
in the premotor and supplementary motor areas, before being decoded by the primary motor
cortex to perform motor tasks both ipsilaterally and contralaterally [Heilman 1979;Heilman and
Rothi 1993;Ochipa and Gonzalez Rothi 2000]. An information-processing model of apraxia
proposes the existence of three systems: the sensory-perceptual, conceptual, and production
system [Roy 1996]. Depending on where damage occurs across these systems, specific praxis
deficits will be observed [Roy 1996]. The various pathologies that can produce the CBS localize
to the frontoparietal cortex and its subcortical connections and this is thought to be the reason
that limb apraxia is so commonly observed in CBS.

21
As previously mentioned, ideomotor apraxia, limb-kinetic apraxia and, less often,
conceptual/ideational apraxia have been the main subtypes of limb apraxia studied in CBS in that
order [Gross and Grossman 2008;Stamenova et al. 2009;Zadikoff and Lang 2005]. Ideomotor
apraxia is best elicited through voluntary pantomime and/or imitation of hand gestures and tool
use and is characterized by disturbances of spatial organization, sequencing and timing of
gestural limb movements [Rothi et al. 1991]. Limb-kinetic apraxia (LKA) is defined as a loss of
hand and finger dexterity resulting in a breakdown and awkwardness of distal movements [Kleist
1907]. The definitions used for conceptual/ ideational apraxia have been more variable.
Conceptual/ideational apraxia was defined in this thesis as impairment in object/tool or action
knowledge [Stamenova et al. 2009]. However, some studies have distinguished between
conceptual and ideational apraxia with the latter being defined as a failure to sequence tasks
related to tool use correctly. This has resulted in phenomenological/ taxonomic confusion across
studies [Stamenova et al. 2009]. More research is required to better localize the regions of the
brain involved in limb apraxia associated with the CBS and to better understand the network
involved in this phenomenology.
1.5 Neuroimaging in CBS
The cognitive and physical symptoms and signs of the disorder correlate reasonably well with
the location of the maximally affected brain regions, which can often be identified in vivo using
structural neuroimaging (e.g., brain MRI) and functional neuroimaging (e.g., brain perfusion
SPECT or glucose metabolism PET).

22
1.5.1 Structural neuroimaging studies
Riley et al. [Riley et al. 1990] conducted one of the earliest clinical studies in a case series of 15
patients with CBS that examined brain computed tomography and MRI imaging. On visual
inspection of CT and/ or MRI of the brain, asymmetric atrophy worse contralateral to the most
affected side of the body was observed in eight patients, whereas six patients demonstrated
symmetric atrophy [Riley et al. 1990]. One patient did not have any notable atrophy on CT of the
brain [Riley et al. 1990]. Several years later Yamauchi and colleagues [Yamauchi et al. 1998b]
observed that, compared to controls, a group of eight CBS patients had atrophy on MRI of the
corpus callosum, which was most severe in the middle-posterior > middle-anterior > anterior >
posterior regions. The degree of callosal atrophy also was correlated with glucose metabolism as
measured by PET and the latter tended to be asymmetric [Yamauchi et al. 1998b]. Another MRI-
based study comparing 16 patients with CBS to 28 patients with PSP demonstrated that atrophy
on T1-weighted MRI images was most prominent in frontoparietal regions contralateral to the
most affected side of the body in approximately 14/16 (87.5%) of the CBS patients and was not
present in any patients with PSP, who demonstrated mainly midbrain atrophy [Soliveri et al.
1999]. This group also observed the presence of cortical and subcortical white matter signal
changes involving or underlying the atrophic region on proton density and T2-weighted images
in six (37.5%) CBS cases [Soliveri et al. 1999]. Similar findings were observed by a Japanese
group that demonstrated that the parietal, anterior middle, and inferior frontal lobes, and
paracentral regions were significantly more atrophic and tended to be asymmetric in CBS than in
PSP, whereas the brainstem was more atrophic in PSP using MRI-based hemisphere surface
display and volumetry [Taki et al. 2004]. Another study that compared 18 patients with CBS to

23
33 with PSP found that CBS cases as a group had reduced whole brain volumes, and more
selective atrophy involving the parietal lobes and the corpus callosum [Groschel et al. 2004]. The
most severe atrophy was observed in the white matter of the parietal lobes; however, in contrast
to prior studies, there was no tendency for the atrophy to be localized contralateral to the most
affected side of the body [Groschel et al. 2004]. Similar to Soliveri et al. [Soliveri et al. 1999],
midbrain atrophy also differentiated PSP from CBS [Groschel et al. 2004]. Finally, using a
discriminant function analysis in a subset of the sample with pathologically proven CBD or PSP
as well as controls, the combined volumes of the midbrain, brainstem, pons, frontal and parietal
white matter and temporal grey matter were found to differentiate the groups with high accuracy
[Groschel et al. 2004]. The first published voxel-based morphometry (VBM) study that
compared 14 patients with CBS to 15 with PSP identified that atrophy in CBS was more
prominent on the left than the right and involved bilateral premotor regions, superior parietal
lobes and the striatum whereas PSP patients had prominent atrophy involving the midline
subcortical structures including the midbrain, pons, thalamus and striatum as well as minimal
involvement of the frontal lobes [Boxer et al. 2006]. Using a voxel-wise discriminant function
analysis, they were able to correctly distinguish between CBS and PSP patients with 93%
accuracy by using the severity of atrophy in the dorsal pons, midbrain tegmentum and left frontal
eye field [Boxer et al. 2006].
There have been only a few published case series of pathologically proven CBD studied with
MRI. One study examined 17 patients with a clinical diagnosis of CBS of which six had a
pathologically confirmed diagnosis of CBD and 11 had other pathological diagnoses including
PSP, FTD, AD, and Creutzfeldt Jakob Disease [Josephs et al. 2004]. Using a semi-quantitative

24
visual assessment of pre-selected regions of interest bilaterally on MRI, they confirmed findings
of previous studies that demonstrated atrophy on T1-weighted imaging involving the posterior
frontal, superior parietal and middle corpus callosum in both groups and subcortical/
periventricular white matter changes on T2-weighted imaging [Josephs et al. 2004]. However,
there was no difference between the MRI findings in the CBD group vs. that with other
pathologies suggesting that it is the location and distribution of the pathology and not the specific
pathology itself that predicts the CBS [Josephs et al. 2004]. The same group later demonstrated
in a larger series of pathologically proven CBD patients (n=11) compared to controls that
atrophy predominated in the cortical regions bilaterally including the superior, middle and
posterior inferior frontal lobes, the posterior temporal and parietal lobes, and the superior
premotor cortex [Josephs et al. 2008]. The insular cortex and supplementary motor area also
demonstrated atrophy in CBD patients and subcortical grey matter atrophy was observed in the
globus pallidus, putamen and caudate head [Josephs et al. 2008]. There was also a small amount
of white matter atrophy identified in the posterior frontal lobes, the corpus callosum, the external
capsule and the right midbrain in the CBD group [Josephs et al. 2008].
Several recent studies have employed diffusion tensor imaging (DTI) to better characterize the
integrity of the white matter in CBS in order to follow up on prior studies that demonstrated T1-
weighted atrophy and T2-weighted hyperintensities of the white matter in this condition. Borroni
et al. [Borroni et al. 2008b] compared 20 patients with CBS to 21 normal controls using DTI
MRI and demonstrated reduced fractional anisotropy in the long frontoparietal connecting tracts,
the intraparietal associative fibers, and the corpus callosum. Reductions in fractional anisotropy
were also observed in the sensorimotor projections of the cortical hand areas [Borroni et al.
25
2008b]. Another study used tract-based statistics to study 10 patients with CBS and 10 normal
controls and found that CBS patients had higher average apparent diffusion coefficient values
and lower average fractional anisotropy values in the corticospinal tract in the most affected
hemisphere and also in the posterior trunk of the corpus callosum [Boelmans et al. 2009]. The
same group has more recently observed that higher mean diffusivity and lower fractional
anisotropy within the posterior trunk of the corpus callosum can distinguish CBS from
Parkinson‟s disease [Boelmans et al. 2010]. MRI studies to date demonstrate heterogeneity
across CBS patients in terms of the degree and localization of the cortical and subcortical grey
matter atrophy observed and also in the involvement of the white matter and this may be, in part,
responsible for the variability in clinical presentations.
1.5.2 Functional neuroimaging studies: PET and SPECT
Sawle et al. [Sawle et al. 1991] using PET to measure regional cerebral oxygen metabolism were
the first to demonstrate that patients with CBS have hypometabolism predominantly in the
posterior and superior temporal, inferior parietal, and occipital (association) cortices; frontal
association regions also demonstrated reduced metabolism although they did not achieve
statistical significance. This pattern of hypometabolism tended to be asymmetric being lower
contralateral to the most affected side of the body. Following this initial study, several other PET
studies using fluorodeoxyglucose (FDG) as the tracer demonstrated similar findings. One of the
first studies using FDG-PET also demonstrated asymmetric uptake of FDG in five patients with
CBS compared to PD patients and normal controls involving the thalamus, hippocampus and
inferior parietal lobule [Eidelberg et al. 1991]. Asymmetry of parietal lobe metabolic reduction

26
of 5% or more was found in the CBS group whereas the PD and normal control groups
manifested less than 5% reductions [Eidelberg et al. 1991]. Another study demonstrated
significant reductions in FDG uptake in frontal, temporal, sensorimotor and parietal association
cortices in five CBS patients compared to controls and additionally showed involvement of
subcortical structures including the caudate and lentiform nuclei and thalami; reductions were
noted predominantly contralateral to the most affected side of the body [Blin et al. 1992]. Similar
findings were observed in a Japanese study with asymmetric involvement of the parietal cortex,
including the primary sensorimotor and lateral parietal regions, the caudate, putamen and
thalamus contralateral to the most severely affected side in the CBS group [Nagasawa et al.
1996]. Another FDG-PET study compared nine patients with CBS to nine with PSP and
observed that CBS patients had significant metabolic reductions involving the inferior parietal,
lateral temporal, sensorimotor cortices as well as the striatum that were worse contralateral to the
most affected side of the body [Nagahama et al. 1997]. Symmetrical hypometabolism involving
the frontal and parietal lobes and thalami has also been demonstrated in some cases even though
asymmetry was present on the clinical exam suggesting the presence of heterogeneity in the
imaging findings [Taniwaki et al. 1998].
The previous FDG-PET studies described had sample sizes that were small, typically less than
10 CBS patients, and employed mainly region of interest approaches. Garraux et al. [Garraux et
al. 2000] conducted a voxel-based analysis of 22 patients with CBS, 21 PSP patients, and 46
healthy controls. They largely confirmed findings of earlier studies demonstrating asymmetric
metabolic reductions involving the thalamus, putamen, supplementary motor and lateral
premotor areas, the dorsolateral prefrontal cortex and the anterior part of the inferior parietal

27
lobule, which includes the intraparietal sulcus [Garraux et al. 2000]. PSP patients could be
differentiated from CBS patients based on metabolic reductions involving the midbrain, anterior
cingulate and orbitofrontal regions, whereas CBS patients had reductions in posterior frontal
regions including the supplementary motor area as well as the inferior parietal lobule in contrast
to PSP [Garraux et al. 2000]. These FDG-PET findings were also observed in several smaller
case series using voxel-based approaches [Hosaka et al. 2002;Juh et al. 2005;Klaffke et al.
2006]. Finally, an FDG-PET study using a visual assessment method as opposed to semi-
quantitative or quantitative techniques demonstrated the clinical utility of visual assessment in
detecting asymmetric hypometabolism involving the peri-rolandic area, striatum and thalamus
[Coulier et al. 2003].
Other PET tracers have been used to characterize patients with CBS. Sawle et al. [Sawle et al.
1991] were the first to report reductions in basal ganglia uptake of 18
F-6-fluorodopa (18
F-dopa) in
CBS. They found that uptake of 18
F-dopa was most reduced in the caudate contralateral to the
most affected side of the body in all patients [Sawle et al. 1991]. Putaminal reduction of 18
F-dopa
uptake was also most prominent contralateral to the most affected side of the body in all but one
patient who demonstrated bilateral reductions [Sawle et al. 1991]. This study provided the first in
vivo evidence of nigrostriatal dopaminergic denervation, that is, reduction in the number of
functioning nigrostriatal dopaminergic neurons, in CBS. Other studies have confirmed the
finding of reduced 8F-dopa uptake in CBS [Laureys et al. 1999;Nagasawa et al. 1996].

28
Perfusion SPECT, using a variety of tracers, has also been used to image series of patients with
CBS and largely show similar cortical and subcortical involvement as that observed with FDG-
PET metabolic studies. Markus et al. [Markus et al. 1995] were the first to demonstrate that, in
eight CBS patients compared to controls, markedly reduced perfusion on
Hexamethylpropyleneamine Oxime (HMPAO)-SPECT was present bilaterally, but worse
contralateral to the most affected side of the body in subcortical regions including the caudate,
putamen and thalamus, and in cortical regions including the posterior frontal cortex and in all
divisions of the parietal cortex (anterior, superior, posterior, and inferior). In comparison to PD
patients, perfusion was also reduced in the most affected hemisphere in the thalamus, posterior
frontal, as well as the anterior and inferior parietal cortices [Markus et al. 1995]. Using N-
isopropyl-p[123
I]iodoamphetamine (IMP) SPECT in nine patients with CBS, limb apraxia was
the most common clinical finding and hypoperfusion contralateral to the most affected limb was
most prominent in the sensorimotor cortex and posterior parietal cortex [Okuda et al. 1999]. In a
small IMP-SPECT study, asymmetric reductions in regional perfusion were observed in the
frontoparietal regions including the inferior prefrontal, posterior parietal and sensorimotor
cortices in CBS, but not in PSP [Okuda et al. 2000b]. Medial prefrontal perfusion reductions,
however, were seen in both disorders [Okuda et al. 2000b]. Another SPECT study using
Technetium-99m ethyl cysteinate dimer (99m
Tc-ECD SPECT) as a tracer compared nine patients
with CBS to nine with PSP and found that asymmetrical hypoperfusion in the frontal, parietal,
and temporal cortex and basal ganglia, as well as, to a lesser degree, the occipital cortex
differentiated CBS from PSP [Zhang et al. 2001]. The first ECD-SPECT study of CBS to
employ an unbiased, whole brain, voxel-wise analytical technique (statistical parametric
mapping; SPM) demonstrated more widespread brain hypoperfusion than previously observed by

29
region of interest studies, including the frontal, parietal and temporal cortices, as well as the
basal ganglia, thalamus and pontocerebellar regions [Hossain et al. 2003]. However, to our
knowledge, this study did not correct for multiple testing using more modern techniques such as
correcting for the family-wise error [Hossain et al. 2003]. Using HMPAO SPECT and a factor
discriminant analysis applied to regions of interest, Kreisler et al. [Kreisler et al. 2005] identified
seven variables, including the more affected temporoinsular region, the more affected medial
frontal region, the less affected and more affected lateral frontal regions, the less affected
temporoparietal region, and the lateral frontal and parietal asymmetry indices, that correctly
classified patients as having CBS or PD with 100% and 95% accuracy, respectively. A more
recent clinical study that performed both MRI and ECD-SPECT in 16 patients with CBS that
were read by two neuroradiologists blinded to the diagnosis and clinical information found that
SPECT was more sensitive than MRI in detecting asymmetries [Koyama et al. 2007].
Frisoni et al. [Frisoni et al. 1995] were the first to report reductions in uptake of the SPECT
tracer 123
I-iodobenzamide (IBZM; binds to post-synaptic dopamine D2 receptors) in the right
basal ganglia in a case of CBS with prominent left-sided motor involvement and proposed that
reduction in the number of D2 receptors may account for the lack of levodopa responsiveness
seen in CBS. This finding was largely refuted by two papers showing that IBZM uptake on
SPECT was mostly normal in most patients with CBS as combined results across the studies
demonstrated that only three of 17 patients had reductions in IBZM uptake in the basal ganglia
[Klaffke et al. 2006;Plotkin et al. 2005].

30
Finally, several studies have demonstrated the value of using dopamine transporter (DAT)-
SPECT imaging in CBS and other parkinsonian disorders. One of the earliest studies used the
DAT-SPECT tracer, 2-β-carbomethoxy-3-β-(4-iodophenyl)-tropane (β-CIT), to compare 18
patients with multiple system atrophy (MSA), eight with PSP, four with CBS and 48 with PD in
terms of their striatal binding [Pirker et al. 2000]. They found that all patient groups
demonstrated reduced β-CIT striatal binding compared to controls and this tended to be
asymmetric in the PD and CBS groups [Pirker et al. 2000]. Another study by the same group
followed longitudinal changes in striatal β-CIT striatal dopamine transporter binding over time in
36 patients with PD, 10 patients with atypical parkinsonian syndromes including three CBS
cases, and nine patients with essential tremor [Pirker et al. 2002]. They found that the uptake of
β-CIT was reduced in PD and the atypical parkinsonian syndromes, but not in essential tremor
compared to controls [Pirker et al. 2002]. They also observed that the β-CIT striatal uptake
declined more rapidly in those with atypical parkinsonian syndromes compared to PD [Pirker et
al. 2002]. These initial findings of reduced β-CIT striatal uptake in CBS were supported by other
studies [Klaffke et al. 2006;Plotkin et al. 2005]. A single case of pathologically proven CBD did
not demonstrate any reductions in β-CIT striatal uptake visually after four years from disease
onset refuting prior studies [O'Sullivan et al. 2008]. The largest and most recent study using β-
CIT SPECT in 36 patients with CBS, 37 patients with PD and 24 healthy controls demonstrated
that striatal binding reduction was variable across CBS cases and more uniformly reduced with
more hemispheric asymmetry than that observed in PD [Cilia et al. 2011]. There was also no
correlation between striatal β-CIT and clinical features of the disease including severity [Cilia et
al. 2011]. Four CBS patients had normal striatal uptake compared to controls, while four had
strictly unilateral uptake despite all showing bilateral extrapyramidal signs [Cilia et al. 2011].

31
Many of the neuroimaging studies described employed small sample sizes and only a few of the
studies provided a detailed clinical and neuropsychological characterization of their CBS
subjects. Therefore, further neuroimaging studies in a prospective sample that has been well-
characterized clinically are required in order to further understand the heterogeneity observed in
the presentation of CBS and how this correlates with neuroimaging features.
1.6 Pathological Heterogeneity in CBS
CBS is not only heterogeneous in its clinical presentation and in its neuroimaging as previously
described, but there is also substantial pathological heterogeneity that can produce the syndrome.
Ball and colleagues [Ball et al. 1993] described a case of CBS presenting with an alien left limb,
memory loss, cortical myoclonus and bilateral parietal dysfunction with a pathological diagnosis
of AD. Lang and colleagues [Lang et al. 1994] described a case of pathologically proven
“parietal” Pick‟s disease that presented as corticobasal syndrome. Since these two early studies,
there have been several case series published that have demonstrated similar pathological
heterogeneity underlying the corticobasal syndrome. This section reviews these case series and
provides images that demonstrate the variety of pathologies that have been associated with the
CBS.

32
Figure 4. Macroscopic brain specimen showing left frontal > temporal atrophy of Pick’s disease
A study of 11 cases with pathologically confirmed CBD identified overlapping pathology of one
or more of AD, PD, hippocampal sclerosis and PSP in six cases (54%) suggesting that mixed
pathology can be associated with CBD [Schneider et al. 1997]. The cases with mixed CBD and
other pathologies all presented with early memory loss in comparison to those with CBD alone
and the authors proposed that the mixed pathology may account for the variable clinical
presentations observed in CBS [Schneider et al. 1997]. Another study presented clinical
vignettes of several different pathologically confirmed cases of neurodegenerative disease,
including ten with CBD, to six neurologists who then had to make a clinical diagnosis based on
the information that was provided [Litvan et al. 1997]. The accuracy of the clinical diagnosis

33
was then determined and it was observed that the specificity was high at 99.6% meaning that less
than 1% of patients without CBD were diagnosed as having it [Litvan et al. 1997]. However, the
sensitivity was low at 48.3% meaning that only about 50% of patients were accurately diagnosed
with CBD in life [Litvan et al. 1997]. Boeve and colleagues [Boeve et al. 1999] identified 13
Figure 5. Microscopic Lewy body pathology showing Lewy bodies, cytoplasmic stippling, neuropil grains and
Lewy neurites immunostained by antibodies to alpha-synuclein
patients from the Mayo clinic records with a diagnosis of CBS who also had a neuropathological
examination at autopsy and demonstrated that seven cases had a pathological diagnosis of CBD
(53.8%) while six had other diagnoses (46.2%; two with AD, one with Creutzfeldt-Jakob disease
(CJD), one with PSP, one with Pick‟s disease and one with non-specific histopathology) [Boeve
et al. 1999]. Frontotemporal lobar degeneration (FTLD) with motor neuron disease-like

34
inclusions, today known as FTLD-Ubiquitin (U)/TAR DNA-binding protein 43 (TDP43) with
motor neuron disease (MND), has also been documented to produce the CBS [Grimes et al.
1999a]. CJD has also been observed to cause the CBS [Kleiner-Fisman et al. 2004], as has
agyrophilic grain inclusion disease [Rippon et al. 2005]. Another case report identified that
bilateral strokes involving the frontoparietotemporal and occipital regions, worse on the right,
due to ipsilateral occlusion of the distal internal carotid and middle cerebral arteries and severe
stenosis of the left middle cerebral artery was associated with a corticobasal syndrome [Kim et
al. 2009].
An important pathological study that screened all archival data from the Queen Square Brain
Bank over a 20 year period identified 19 pathologically confirmed cases of CBD and 21
clinically diagnosed cases of CBS [Ling et al. 2010]. Of the pathologically confirmed cases, only
five were accurately diagnosed as having CBD in life yielding a sensitivity of 26.3% [Ling et al.
2010]. Alternative clinical diagnoses were eight cases with PSP, two with PD, two with FTD,
one with spastic quadriparesis with myoclonus of unknown etiology, and one incidental case
with Tourette‟s syndrome who died before symptoms of CBS manifested [Ling et al. 2010].
From the clinical standpoint, of the 21 cases diagnosed as having CBS in life, only five had
confirmed CBD pathology, while the rest had alternative pathological diagnoses including six
with PSP, five with AD, two with PD, one with frontotemporal lobar degeneration-
Ubiquitin/TDP43 (FTLD-U/TDP43) with MND, one with FTLD-U/TDP43 subtype 2, and one
with dementia lacking distinctive histopathology resulting in a positive predictive value of 23.8%
[Ling et al. 2010]. Finally, a larger study of 18 cases with pathologically proven CBD and 40

35
cases of CBS due to other histopathologies will now be discussed [Lee et al. 2011]. The
pathologically confirmed cases of CBD presented with four distinct clinical syndromes including
Figure 6. Microscopic pathology of CBD stained with Gallyas demonstrating (A) oligodendroglial coils, (B)
neuronal pre-tangles in the precentral region, (C) ballooned neurons, and (D) astrocytic plaques in the basal
ganglia
executive-motor (n=7; 38.9%), progressive non-fluent aphasia (n=5; 27.8%), behavioural variant
FTD (n=5; 27.8%), and posterior cortical atrophy (n=1; 5.5%) [Lee et al. 2011]. Conversely,
those presenting with a CBS had various underlying pathologies including AD (n=9; 22.5%),
CBD (n=14; 35%), PSP (n=5; 12.5%), FTLD-U/TDP43 (n=5; 12.5%), mixed pathologies (n=5
comprised of two PSP+AD, one CBD+AD, and one FTLD-U/TDP43+AD; 12.5%), Pick‟s
disease (n=1; 2.5%), and one with multiple system tauopathy without agyrophilia (n=1; 2.5%)
[Lee et al. 2011]. As can be seen from this review of prior clinicopathological studies of CBS

36
Figure 7. Microscopic agyrophilic grain disease pathology showing (A) branched astrocytes in the amygdale,
and (B) agyrophilic grains and coiled bodies in the prosubiculum
and CBD, the rate at which CBD pathology is predicted based on having a CBS is highly
variable and in general is low. The variability is likely explained by the small samples sizes used
in even the larger studies. Future studies are required that follow patients longitudinally to death
and characterize them with multiple modalities including clinical examination,
neuropsychological and neuroimaging with subsequent pathological analyses as only this type of
study will improve our ability to predict the specific pathological diagnosis underlying the CBS
in life.
Figure 8. Microscopic Alzheimer’s pathology showing (A) astrocytic plaques in frontal regions, and (B)
neurofibrillary tangles in the CA1 region of the hippocampus

37
1.7 Genetics of CBS and CBD
Genetic analysis of complex syndromes, such as CBS, may be complicated by many factors such
as incomplete penetrance, multiple disease susceptibility loci, gene-environment interactions and
diagnostic uncertainties [Nothen et al. 1993]. The latter is particularly important given the
significant pathological heterogeneity underlying the CBS described in the preceding section.
Two main strategies have been utilized for the genetic study of complex illnesses, such as CBS:
a) linkage or candidate gene studies involving families or affected pairs of relatives, and b)
association studies using candidate genes or genome wide approaches in unrelated cases and
controls. Traditional family-linkage studies follow the segregation of marker alleles in pedigrees
that are multiply affected with the disease phenotype of interest. A model is then proposed to
explain the inheritance pattern of phenotypes and genotypes in the pedigree [Lander and Schork
1994]. Although this is the method of choice for simple Mendelian traits, linkage analysis of
complex traits has limited power in identifying disease susceptibility loci, that is, estimating the
large number of unknown parameters required to model complex traits is extremely difficult [Ott
1990]. A genetic association study design does not require specification of a genetic model and
therefore overcomes many of the limitations inherent in the linkage-based familial approaches
[Crowe 1993;Kidd 1993]. Risch & Merikangas [Risch and Merikangas 1996] have suggested
that association analyses have far greater power than linkage analyses to identify genes involved
in complex genetic diseases. Both approaches have been applied to elucidate genetic factors
contributing to the etiology of CBD.

38
From a genetic epidemiologic perspective, CBD is mainly a sporadic disorder with very few
reported familial cases [Mahapatra et al. 2004]. In sporadic cases, genetic association studies
have identified a particular haplotype that spans the MAPT gene among several other loci, as
being associated with CBD and PSP pathology. Please refer to Caffrey and Wade-Martins
[Caffrey and Wade-Martins 2007] for a comprehensive review. The MAPT gene is localized to
chromosome 17q21 and encodes for the Microtubule-Associated Protein Tau (MAPT)
[Andreadis et al. 1992]. Tau is highly expressed within both central and peripheral nervous
system neurons where it is involved in the assembly and stabilization of microtubules, signal
transduction and maintaining neuronal polarity [Shahani and Brandt 2002]. Hyperphosphorylated
Tau can aggregate in neurons producing pathological Tau inclusions called neurofibrillary
tangles, which are present in several neurodegenerative diseases including AD, PSP, CBD,
agyrophilic grains, FTD Parkinsonism-17 (FTDP-17), and Pick‟s disease [Caffrey and Wade-
Martins 2007].
MAPT is comprised of 16 exons and alternative splicing of exons 2, 3 and 10 yields six mRNA
transcripts that are translated into unique protein isoforms [Goedert et al. 1988;Goedert et al.
1989]. Exons 9 through 12 of MAPT encode for imperfect repeat sequences that code for
microtubule-binding domains and thus play an important role in the main function of the protein
[Caffrey and Wade-Martins 2007]. When exon 10 is spliced out, three repeat (3R) sequences are
generated, whereas the presence of exon 10 results in the generation of four repeat (4R)
sequences [Goedert et al. 1988;Goedert et al. 1989]. The major tangle isoform observed in CBD
is comprised of 4R Tau [Caffrey and Wade-Martins 2007]. MAPT is located within the largest
known block of linkage disequilibrium in the human genome that spans approximately 1.8

39
megabases (Mb) [Caffrey and Wade-Martins 2007]. Two major haplotypes, H1 and H2, have
been defined based on tagging with eight single nucleotide polymorphisms (SNPs; inherited with
H1 haplotype) and a 238 base pair (bp) deletion (inherited with rarer H2 haplotype). Two early
studies demonstrated that the H1 haplotype is over-represented in sporadic CBD cases compared
to controls [Di Maria E. et al. 2000;Houlden et al. 2001].
Figure 9. Schematic representation of the MAPT genomic region and 3-repeat and 4-repeat Tau transcripts.
Adapted from Caffrey and Wade-Martins [Caffrey and Wade-Martins 2007].
In the rare event that CBS and/or CBD pathology are observed to segregate in a family, other
members are typically affected with FTD and/or PSP demonstrating overlap in these conditions
[Boeve et al. 2002;Brown et al. 1996;Brown et al. 1998;Bugiani et al. 1999;Gallien et al.
1998;Tuite et al. 2005;Casseron et al. 2005;Uchihara and Nakayama 2006]. Brown et al. [Brown
et al. 1996] described two families in which a progressive dementia segregated in 15 affected
individuals. Ten individuals were clinically studied and the main presenting features were that of

40
personality change or memory loss with invariable progression into a frontal dementia [Brown et
al. 1996]. Additional features observed were aphasia, limb clumsiness, parkinsonism and gait
imbalance [Brown et al. 1996]. Pathological examination in two individuals revealed swollen
achromatic cortical neurons and corticobasal inclusion bodies in the basal ganglia [Brown et al.
1996]. Patients had features of frontotemporal dementia and/or CBS and the pathology most
closely resembled CBD [Brown et al. 1996]. A similar family was described by the same group
with one member clinically having CBS and a sibling having FTD, while the mother presented
with an early onset dementia with features of a movement disorder [Brown et al. 1998]. The
pathological diagnosis of the individual with CBS was dementia lacking distinctive
histopathological features confirming heterogeneity even in familial cases of the syndrome
[Brown et al. 1998]. Pathological findings of non-distinctive histopathology has also been found
in another study of a kindred that included a patient with CBS and that also segregated FTD in
other individuals [Boeve et al. 2002]. An Italian group identified a family with two afflicted
members, the father presenting as FTD and the son presenting as CBS, with the etiological cause
being a Proline301Serine (P301S) mutation in exon 10 of MAPT that lead to extensive
filamentous hyperphosphorylated Tau pathology [Bugiani et al. 1999]. A Japanese group
identified three siblings, all of whom presented with parkinsonism and frontal dementia, with
typical CBD pathology [Uchihara and Nakayama 2006]. Tuite et al. [Tuite et al. 2005] identified
a consanguinous family with members having clinical diagnoses of PSP and CBS. In two
members who presented as CBS, one had confirmed CBD pathology while the other
demonstrated PSP pathology demonstrating the overlap at both the clinical and pathological level
[Tuite et al. 2005]. Interestingly, no MAPT mutations were identified and only the H1/H1
haplotype was found in the four affected individuals studied [Tuite et al. 2005]. CBS has also

41
been associated with a leucine-rich repeat kinase 2 mutation [Chen-Plotkin et al. 2008]. Given
the pathologic and genetic heterogeneity observed in CBS, future genetic studies of families with
this syndrome and association studies of unrelated individuals are required to identify other
causative genes and/ or genetic risk factors that predispose to this syndrome.
42
Figure 10. (A) H1 and H2 linkage disequilibrium blocks showing a 900 kb region of inversion, and (B) sub-
structure of the MAPT gene and associated H1 and H2 haplotypes. Adapted from Caffrey and Wade-Martins
[Caffrey and Wade-Martins 2007].
1.8 Synopsis and Overall Research Objective
Despite the rarity of CBS compared to other neurodegenerative disorders such as AD and PD, it
represents an important neurodegenerative syndrome to study given the substantial heterogeneity
that is observed in its initial presentation and evolution over time. Understanding this
heterogeneity in CBS may facilitate our understanding of heterogeneity in the more common
neurodegenerations. From a clinical perspective, it is unclear why some CBS patients present
with an early motor syndrome while others present initially with mainly symptoms of dementia.
Comparing these different presentations of CBS in terms of clinical, neuropsychological and
neuroimaging features may help to shed light on the brain regions involved in determining the
type of symptom onset in CBS and this may help to determine which patients presenting with an
early dementia would be at risk of evolving into a CBS. Additionally, there have been few CBS
samples that have been extensively characterized to allow for brain-behaviour correlations using
structural and functional neuroimaging, and this remains an important line of investigation to
understand the localization of some of the observed phenomenology in the brain. Novel genetic
studies are required in order to elucidate additional genes that can cause or increase risk for the
CBS. Finally, more work needs to be done in understanding how clinical and neuroimaging
features map on to the various pathologies that can underlie the CBS, as this will provide insight
into clinicopathological correlations, which may help in the prediction of underlying in vivo
pathological state. Therefore, the overall objective of this thesis is to characterize a prospective
sample of CBS patients in terms of the heterogeneity observed across clinical,
neuropsychological, and neuroimaging features and, in a subset of the sample, to describe

43
genetic and pathological features and how these relate to the clinical phenotype and
neuroimaging findings.
1.8.1 Specific Objectives
The specific objectives of this thesis and related hypotheses are as follows:
A) Objective 1: To characterize the genetic and pathological heterogeneity observed in a
family segregating corticobasal syndrome.
Hypothesis 1: Affected patients will harbor a mutation in one of the genes known to
cause diseases occurring along the spectrum of frontotemporal dementia, including CBS,
and will have associated pathological features that are typical of the identified genetic
mutation.
B) Objective 2: To characterize members of a family that segregate a novel mutation in the
progranulin gene (PGRN) associated with FTD spectrum disorders, including CBS, and
to contrast the heterogeneity observed in their clinical presentation, neuropsychological
testing, and neuroimaging findings.
Hypothesis 2: There will be significant heterogeneity in clinical, neuropsychological, and
neuroimaging features among patients with the same PGRN mutation and this will be
dependent on the hemisphere and lobar region most prominently affected in the early
stages of the disease.
C) Objective 3: To identify brain SPECT perfusion and neuropsychological correlates of
severity of ideomotor apraxia in CBS.

44
Hypothesis 3A: Compared to controls, CBS patients will demonstrate reduced perfusion
on SPECT in an asymmetrical fashion in frontoparietotemporal cortical and subcortical
regions.
Hypothesis 3B: Hypoperfusion within the left frontoparietal network will correlate with
severity of ideomotor apraxia in CBS.
Hypothesis 3C: Patients with more severe apraxia will demonstrate more impairment on
language-based measures.
D) Objective 4: To describe the initial neuropsychological and neuropsychiatric, MRI, and
pathological features of a prospective sample of CBS patients.
Hypothesis 4A: Compared to controls, CBS patients will demonstrate reduced
performance globally on neuropsychological testing with worse performance on
measures assessing executive, visuospatial, language and praxis functions.
Hypothesis 4B: Compared to controls, asymmetric atrophy on MRI contralateral to the
most affected side of the body will be observed.
Hypothesis 4C: In a subset of the CBS sample that came to autopsy, underlying
neuropathological diagnoses will be heterogeneous.
Hypothesis 4D: Atrophy and white matter hyperintensities on MRI in vivo will be
associated with the underlying neuropathology.
E) Objective 5: To compare the clinical, neuropsychological, MRI, and SPECT features of
CBS presenting with early dementia versus those presenting with early motor features.

45
Hypothesis 5A: The CBS group with early dementia will be more likely to have their
right side of the body affected by motor signs, have more profound language deficits, and
have hemispheric atrophy and reduced perfusion in left frontotemporal regions.
Hypothesis 5B: The CBS group with early motor features will be more likely to have
their left side of the body affected by motor signs, and have hemispheric atrophy and
hypoperfusion on SPECT that is more pronounced on the right.
1.9 Description of Chapters
1.9.1 Chapter 2: Novel splicing mutation in the progranulin gene causing familial
corticobasal syndrome
This study was the first to report that mutations in the PGRN gene, discovered in 2006 as a major
cause of frontotemporal dementia, can also cause familial corticobasal syndrome. It provides a
detailed account of two family members afflicted with corticobasal syndrome and characterizes
one of the family members from the clinical, neuropsychological, neuropsychiatric and
neuroimaging perspective. The other sibling is characterized from the pathological standpoint as
having underlying FTLD-U pathology, which, shortly after this publication was accepted, was
found to be a marker of TDP43 pathology [Neumann et al. 2006]. This study extends the
literature on genetic and phenotypic heterogeneity associated with FTD and set the stage for
several follow-up papers confirming our initial findings.

46
1.9.2 Chapter 3: Intra-Familial Clinical Heterogeneity due to FTLD-U with TDP43
Proteinopathy Caused by a Novel Deletion in Progranulin Gene (PGRN)
This paper identifies a novel mutation in the PGRN gene that caused neurodegenerative
presentations in a kindred originally from Poland and characterizes two affected brothers from
the clinical, neuropsychological, and neuroimaging perspective comparing important differences
in presentation and how these correlate with heterogeneous neuroimaging findings between
them. One of the brothers, who initially presented with symptoms of progressive non-fluent
aphasia (PNFA) and then evolved into CBS, is studied from the pathological perspective
demonstrating the expected FTLD-U/ TDP43 pathology. This study extends on the literature
demonstrating allelic and phenotypic heterogeneity in FTD and proposes molecular mechanisms,
which likely underly some of this heterogeneity.
1.9.3 Chapter 4: Ideomotor Apraxia in Corticobasal Syndrome: Brain Perfusion and
Neuropsychological Correlates
This paper replicates findings from previous studies showing that perfusion reductions on
SPECT occur in frontoparietotemporal regions in CBS compared to controls and is the first to
identify that severity of ideomotor apraxia in CBS correlates strongly with reduced perfusion in
the left inferior parietal lobule in patients afflicted with this syndrome. It is the largest SPECT
study of CBS that attempts to understand the neuroanatomical correlates of ideomotor apraxia
and also identifies that several other posterior cognitive functions are more impaired in the CBS
group with significant apraxia compared to those without this feature. The study is one of the
first to provide a comprehensive discussion of limitations in the field of apraxia research and

47
identifies that many of the limitations originate from variable definitions that are currently
applied to the different types of apraxia.
1.9.4 Chapter 5: Clinical, neuropsychological, MRI and SPECT characterization of a
prospective sample of patients with corticobasal syndrome
This paper provides a comprehensive and multi-modal assessment of a prospective sample of
CBS patients using clinical and neuropsychological assessments, MRI and brain SPECT
neuroimaging. It then compares a subgroup of CBS patients presenting with early dementia to
one presenting with early motor features identifying a tendency for the early dementia group to
have symptoms involving the right side of the body and to have more severe language
disturbances whereas the early motor group has symptoms prominently involving the left side of
their body. A subset of the patients came to autopsy and heterogeneity in pathological diagnoses
was observed. The burden and location of the pathology mostly correlated with neuroimaging
features irrespective of the specific underlying pathological diagnoses.

48
2.0 Novel splicing mutation in the progranulin gene causing
familial corticobasal syndrome
Mario Masellis,* Parastoo Momeni,
* Wendy Meschino, Reid Heffner Jr., Christine Sato, Yan
Liang, Peter St George-Hyslop, John Hardy, Juan Bilbao, Sandra Black, and Ekaterina Rogaeva
As published in: Brain (2006); 129: 3115-3123
Mario Masellis extracted the clinical information on all family members, interpreted and
integrated the clinical, neuropsychological, neuroimaging, genetic and pathological data, and was
responsible for writing the manuscript. Sequencing and genotyping was performed by Parastoo
Momeni and Ekaterina Rogaeva. Pathological analysis was done by Reid Heffner Jr. and Juan
Bilbao.
* These authors contributed equally to the work as co-first authors

49
2.1 SUMMARY
Corticobasal Syndrome (CBS) is a rare cognitive and movement disorder characterized by
asymmetric rigidity, apraxia, alien-limb phenomenon, cortical sensory loss, myoclonus, focal
dystonia, and dementia. It occurs along the clinical spectrum of Frontotemporal Lobar
Degeneration (FTLD), which has recently been shown to segregate with truncating mutations in
progranulin (PGRN), a multifunctional growth factor thought to promote neuronal survival. This
study identifies a novel splice donor site mutation in the PGRN gene (IVS7+1G>A) that
segregates with CBS in a Canadian family of Chinese origin. We confirmed the absence of the
mutant PGRN allele in the RT-PCR product which supports the model of haploinsufficiency for
PGRN-linked disease. This report of mutation in the PGRN gene in CBS extends the evidence
for genetic and phenotypic heterogeneity in FTLD spectrum disorders.
Keywords: Corticobasal Syndrome; Frontotemporal Lobar Degeneration; progranulin; gene;
mutation
Abbreviations: CBS = Corticobasal Syndrome; CBD = Corticobasal Degeneration; FTD =
Frontotemporal Dementia; MAPT = microtubule-associated protein tau; FTDP-17 = FTD with
parkinsonism linked to chromosome 17; PSP = Progressive Supranuclear Palsy; MMSE = Mini-
Mental Status Examination; PGRN = progranulin; MND = Motor Neuron Disease; CHMP2B =
Chromatin-modifying protein 2B; MRI = Magnetic Resonance Imaging; SPECT = Single Photon
Emission Computed Tomography; FTLD = Frontotemporal Lobar Degeneration; LFB = luxol
fast blue

50
2.2 INTRODUCTION
In 1967, Rebeiz and colleagues [Rebeiz et al. 1967] described three cases of a progressive,
perceptuo-motor disorder characterized by an asymmetric akinetic-rigid syndrome and apraxia.
They termed the disorder “corticodentatonigral degeneration with neuronal achromasia” based
on identified pathological features. Since then, a variety of terms have been applied to this
enigmatic disorder of interest to cognitive and movement disorder neurologists worldwide
including corticonigral degeneration with neuronal achromasia, cortical degeneration with
swollen chromatolytic neurons, cortical basal ganglionic, corticobasal ganglionic, and the most
common designation, corticobasal degeneration (CBD) [Mahapatra et al. 2004]. This
terminology has caused considerable nosological confusion over the years presumably because
some terms refer to the underlying pathological changes, while others refer to the neural
substrates causing the recognized clinical syndrome.
To add to this nosological uncertainty, extensive research has demonstrated significant clinical
and pathological heterogeneity in CBD [Boeve et al. 2003;Lang 2003]. Specifically, cases
presenting with the “classical” clinical syndrome of CBD often have alternative pathologies (i.e.,
not CBD) underlying the clinical manifestations such as Progressive Supranuclear Palsy (PSP),
Frontotemporal Dementia (FTD), Alzheimer‟s Disease (AD), Dementia with Lewy Bodies
(DLB), and Creutzfeldt-Jacob Disease (CJD). Conversely, pathologically-confirmed cases of
CBD [Dickson et al. 2002] may present with a variety of clinical phenotypes in addition to
“classical” CBD including Primary Progressive Aphasia (PPA) and Frontotemporal Dementia
(FTD). As a result, it has been suggested that the term Corticobasal Syndrome (CBS) be applied

51
to clinically-diagnosed cases presenting with the “classical” features of asymmetric rigidity,
apraxia, alien-limb phenomenon, cortical sensory loss, myoclonus, and focal dystonia [Boeve et
al. 2003;Kertesz et al. 2000a;Lang 2003;Litvan et al. 2003]. Herein, we use the term
Corticobasal Syndrome (CBS) to refer to clinically diagnosed cases without proof of typical
CBD pathology conforming to the clinical diagnostic criteria [Boeve et al. 2003]. Included in
this syndromic definition are patients presenting with early dementia, for which there is evidence
suggesting this to be the most common initial presentation [Bergeron et al. 1998;Grimes et al.
1999b;Mathuranath et al. 2000]. The cognitive symptoms and underlying pathologies of CBS
have many overlapping features with those of FTD prompting current nosological classification
to include CBS as part of the spectrum of FTD [Josephs et al. 2006;Kertesz et al. 2000b;Neary et
al. 1998]. Similar to CBS, several terms have been applied to describe this heterogeneous
disorder including FTD/Pick Complex [Kertesz 2003], Frontotemporal Lobar Degeneration
[Neary et al. 1998], Pick‟s Disease [Pick 1892], and FTD [The Lund and Manchester Groups
1994]. We have adopted the term Frontotemporal Lobar Degeneration (FTLD) in this paper.
FTLD encompasses a wide spectrum of clinical entities ranging from FTD, Primary Progressive
Aphasia, Semantic Dementia, CBS, PSP, FTD-Motor Neuron Disease (FTD-MND), and FTD
with Parkinsonism linked to chromosome 17 (FTDP-17) [Kertesz 2003;Kertesz 2005]. It
represents a group of primary degenerative dementias with predominant frontal and/or temporal
lobe symptoms (e.g. decline in social and personal behavior, apraxia, stereotyped behavior,
hyperorality and aphasia) [Kertesz 2005] and consensus diagnostic and neuropathological criteria
have been proposed [McKhann et al. 2001;Neary et al. 1998]. The neuropathological
characteristics of FTLD include variable frontal, temporal, and basal ganglia atrophy with

52
neuronal loss and gliosis (with tau or ubiquitinated inclusions). The deposition and abnormal
processing of tau encoded by the gene named microtubule-associated protein tau (MAPT) play an
important role in the development of several forms of FTLD, including CBS [Goedert et al.
2000;Hutton 2001;McKhann et al. 2001]. However, up to 60% of FTLD cases lack tau-positive
neuronal inclusions, primarily displaying a microvacuolization of the superficial neuropil in the
cortex (often with ubiquitin-positive inclusions in cortical neurons) [Ince and Morris 2006;Ince
and Morris 2006;Kertesz et al. 2000a].
FTLD is a genetically complex disorder with at least three known causal genes. The aberrant
splicing mutation in Chromatin-modifying protein 2B (CHMP2B) is responsible for autosomal
dominant FTLD in a large Danish family [Skibinski et al. 2005]. However, the CHMP2B is not a
common cause of FTLD since several large series of FTLD patients failed to detect any
CHMP2B mutations [Cannon et al. 2006;Momeni et al. 2006]. Many of the autosomal dominant
FTDP-17 families are explained by mutations in the MAPT gene [Hutton et al. 1998;Poorkaj et
al. 1998;Spillantini et al. 1998]. However, in several FTLD families linked to chromosome
17q21, MAPT mutations were excluded. Recently the disease in many of these families was
explained by truncating mutations in the progranulin gene (PGRN) which was mapped ~1.7 Mb
centromeric of the MAPT locus [Baker et al. 2006;Cruts et al. 2006]. The PGRN gene encodes a
secreted multifunctional growth factor involved in development, wound repair and inflammation.
Patients with PGRN mutations do not have tau-pathology. Instead there are ubiquitin-
immunoreactive neuronal cytoplasmic and intranuclear inclusions, the protein identity of which
remains unknown [Baker et al. 2006;Cruts et al. 2006;Mackenzie et al. 2006].

53
Neurodegeneration in mutation carriers is caused by PGRN haploinsufficiency due to nonsense-
mediated decay since transcript analysis demonstrated the absence of the mutant allele.
Herein, we describe the clinical, neuropathological and genetic findings of a CBS-like disease
which is segregating a novel PGRN mutation in a Canadian family of Chinese origin. This
finding extends knowledge on the clinical, pathologic and genetic heterogeneity of CBS and
FTLD.
2.3 METHODS
2.3.1 Subjects
The proband (Case 4150) was recruited through the Linda C. Campbell Cognitive Neurology
Research Unit at Sunnybrook Health Sciences Centre in Toronto as part of the Sunnybrook
Dementia Study. This is a prospective, longitudinal study of dementia and aging with well over
800 subjects enrolled to date approved by the local Research Ethics Boards. Patients or their
substitute decision makers provide written, informed consent to participate in accordance with
the Declaration of Helsinki. The proband underwent a detailed clinical assessment including:
history and physical examination, and standardized behavioural neurology assessment. Routine
biochemical screening was done to exclude any other causes for their presentation. The patient
was seen every six months for routine clinical follow-up and had yearly prospective longitudinal
assessments which included: detailed neuropsychological battery (measures of general
intelligence and cognition, language, praxis, visuospatial ability, attention and working memory,
and executive functions), measures of neuropsychiatric symptoms and of functional status.

54
Structural and functional neuroimaging of the brain with Magnetic Resonance Imaging (MRI)
and Single Photon Emission Computed Tomography (SPECT), respectively, were performed.
The sister of the proband (Case #4993) was identified through clinical history from the proband.
Information pertaining to this case is limited to that ascertained through a telephone interview
with her caregiver and through an autopsy report as this patient was residing out of country. The
normal control group consisted of 200 unrelated subjects of North American origin (mean age at
time of examination of 72.7 8.4 years).
2.3.2 Neuropathology
Neuropathological examination was carried out by two of the authors (R.H.; J.B.). Paraffin-
embedded sections were stained with Hematoxylin and Eosin, luxol fast blue (LFB),
Bielschowski and Gallyas. Immunostains using commercial antibodies for tau (Dako, #A0024)
and ubiquitin (Vector Labs, #ZPU576) were performed.
2.3.3 Genetic Analysis
Genomic DNA and RNA were extracted from whole blood using Qiagen kits. Two affected
members of the family (Case 4150 and Case 4993) were tested for mutations in exons 1 and 9-13
of the MAPT gene by direct sequencing as previously described [Kertesz et al. 2000a]. The entire
open reading frame with the exon-intron boundaries of the CHMP2B and PGRN genes were
sequenced in both affected individuals as previously described [Baker et al. 2006;Skibinski et al.

55
2005]. RT-PCR primers were designed for PGRN exon 3 (5‟- GCCACTCCTGCATCTTTACC-
3‟) and exon 8 (5‟-TTCTCCTTGGAGAGGCACTT-3‟). The RT-PCR conditions were 94C for
5 min, followed by 40 cycles of 94C for 30 sec, 58C for 30 sec, 72C for 30 sec, and 7 min at
72C. Mutations were detected by direct inspection of the fluorescent chromatographs and by
analysis using the SeqScape software version 1.0 (Applied Biosystems, Foster City, CA).
2.4 RESULTS
2.4.1 Clinical features and autopsy results
This family of Chinese origin presented with inheritance of a progressive neurodegenerative
disorder characterized by dementia and motor decline, including rigidity, dystonia, apraxia,
cortical sensory loss, visuospatial dysfunction and behavioural changes (Figure 1A). Family
records indicate that two out of 12 siblings have been affected with Corticobasal Syndrome. A
third family member has developed early parkinsonism. Two patients were available for the
genetic and clinical study.

56
Figure 1.
(A) The pedigree structure of the Canadian family showing the inheritance of the disease (with age-at-onset).
Affected individuals are shown as filled symbols and the arrow points to the proband. The gender of the
individuals has been masked to protect family confidentiality;
(B) Genomic DNA (gDNA) and RT-PCR (cDNA) sequence fluorescent chromatograms around the PGRN
mutation (IVS7+1G>A) observed in the patients and the sequence around common synonymous variation
rs25646;
(C) An agarose gel photograph of the PGRN product from RT-PCR, using RNA obtained from white blood
cells of the affected family member (#4150) and normal control (the 586bp band corresponds to the PGRN
fragment containing exons 3-8 confirmed by sequencing analysis).

57
2.4.1.1 Case #4150 (Proband)
This 71 year old right-handed woman with a previous history of hyperthyroidism treated with
radioablation and requiring thyroid replacement presented at age 62 with the insidious onset of
behavioural changes including increased irritability, depression, social withdrawal, and
suspiciousness. Subsequently, she began to experience difficulties with short-term memory,
planning, attention, word-finding difficulties, and getting lost in familiar environments.
Abnormalities on her initial examination (age 65) were a left visual field defect which was
thought to be, in part, secondary to profound left hemi-neglect, left cortical sensory loss
(specifically, sensory extinction and agraphesthesia), left-hand ideomotor apraxia, and a dressing
apraxia. These exam features are consistent with right parieto-occipital dysfunction. She scored
20/30 on the Mini-Mental Status Exam (MMSE) putting her in the moderate range of dementia
severity. Cognitive testing confirmed severe visual perceptual dysfunction and also revealed
short-term memory deficits, impaired executive functions, anomic aphasia and apraxia. The
results of the neuropsychological battery and standardized scores are summarized in Table 1. An
MRI of the brain revealed right greater than left hemispheric cortical atrophy and ventricular
dilatation, slightly more prominent in the posterior regions; there were also some periventricular
white matter changes (Figure 2A). A brain SPECT scan demonstrated a large right

58
Demographics, Neuropsychological Battery and Functional Measures (Test name /maximum raw score)
Raw Scores for Case #4150
Standardized Score
Category
Age of Onset 62 - - Age at this testing 65 - - Duration of disease at testing 3 - - Years of education 12 - - General cognition
Folstein’s Mini-Mental Status Examination /30 20 ≥ 28 (NCO) Impaired Mattis Dementia Rating Scale /144 92 2 (SS) Impaired
Memory California Verbal Learning Test – Long Delay Free
Recall /16 4 -2 (ZS) Impaired
Delayed Visual Reproduction /41 0 1st percentile Impaired Language
Western Aphasia Battery – total /100 83 -2 (ZS) Impaired Western Aphasia Battery – comprehension /10 8 -2 (ZS) Impaired Boston Naming /30 19 2 (SS) Impaired Semantic Fluency /20 6 < 10th percentile Borderline-Impaired
Praxis Western Aphasia Battery – praxis /60 48 -2 (ZS) Impaired
Attention & working memory Digit span – forward /12 6 30th percentile Normal Digit span – backward /12 2 5th percentile Borderline
Visuospatial abilities Rey Osterieth Complex Figure – copy /36 0 < 1st percentile Impaired Benton Line Orientation /30 N/A ≤ 4 (SS) Impaired Executive functions
Phonemic fluency (F-, A-, S-words) 16 3 (SS) Impaired Wisconsin Card Sort Test – categories /6 0 > 1 (NCO) Impaired Wisconsin Card Sort Test – perseverative errors 20 0 (NCO) Impaired
Activities of daily living Disability Assessment for Dementia (%) 53 100 (NCO) Impaired
Neuropsychiatric symptoms Neuropsychiatric Inventory – total /144 24 0 (NCO) Abnormal Neuropsychiatric Inventory – apathy /12 8 0 (NCO) Abnormal Neuropsychiatric Inventory – depression /12 8 0 (NCO) Abnormal Neuropsychiatric Inventory – disinhibition /12 0 0 (NCO) Normal Cornell Depression Scale (%) 53 < 25 (NCO) Depressed
Table 1. Scores on neuropsychological and functional measures for case #4150 compared to standardized scores calculated based on normal population matched for age and years of education. Abbreviations: NCO = Normal cut-off; SS = Scaled score (Mean = 10; 1 standard deviation = 3); ZS = Z-score; N/A = Not assessable
parieto-occipital perfusion deficit extending into the temporal and frontal regions with a milder
decrease in perfusion in the left parietal lobe (Figure 2B). The neuropsychological data was

59
collected within a one month time period of the MRI and SPECT images. The provisional
diagnosis was thought to be posterior cortical atrophy, a possible variant of Alzheimer‟s disease.
She was initiated on a cholinesterase inhibitor with no major change in symptoms apart from
some improvement in attention.
Figure 2.
Corresponding (A) T1-weighted Magnetic Resonance Imaging (MRI) and (B) Technetium 99m-ethyl cysteinate
dimer (99mTc-ECD) Single Photon Emission Computed Tomography (SPECT) scans of the brain of Case #4150.
Areas of relative atrophy on MRI and decreased cerebral perfusion on SPECT in the right inferior frontal (IF),
inferior parietal (IP), superior frontal (SF), superior parietal (SP), and occipital (O) regions are demonstrated.
There is a clear asymmetry in cortical atrophy and regional perfusion with the right being more affected than the
left. For the SPECT images, orange-yellow colours represent areas of high perfusion while blue-purple colours
represent areas of low perfusion.
A year after her initial assessment (age 66), the patient‟s cognitive performance continued to
decline (MMSE = 12) and she required assistance in all activities of daily living. She also was

60
developing an asymmetric akinetic-rigid syndrome including prominent rigidity of the left upper
and lower extremities, bradykinesia and a stooped posture with a shuffling gait. The provisional
diagnosis was changed to CBS based on the emergence of an asymmetric akinetic-rigid
syndrome and severe left-sided ideomotor apraxia. She met clinical criteria for CBS [Boeve et al.
2003]. Over the next three months, the patient became verbally and physically aggressive
towards her day-time caregiver. Cognitively, her dementia had progressed into the severe range
and she was completely dependent for self care. She had a positive glabellar tap and bilateral
grasp reflexes consistent with frontal release phenomena. At this point, she was observed to be
constantly biting her finger nails, likely representing repetitive, stereotyped behavior. Clinically,
her akinetic-rigid syndrome had progressed and she now developed dystonic posturing of her left
hand, and worsening left-sided apraxia, the combination of which produced a useless left arm.
Approximately three years after her initial assessment (age 68), she lost the ability to ambulate
and developed corticospinal tract findings on the left side of her body (i.e., left hyperreflexia and
extensor plantar response). Her verbal output declined and she would often repeat phrases such
as “you‟re killing me”. She continued to decline and four years after the initial assessment (age
69), her speech output diminished to the point where she was only able to grunt to indicate her
needs, with relative preservation of verbal comprehension. Eventually, she became mute and lost
the ability to comprehend and interact with others. Recently, she developed dysphagia to liquids
and is able to eat only pureed foods. Currently (age 71), she is bed-bound with end-stage CBS
about nine years into the course of her illness.

61
2.4.1.2 Case #4993 (sister of proband)
This deceased 61 year old woman had a history of dementia and motor decline since age 57
consisting of axial and extremity rigidity and aphasia. She had significant contractures and
flexion posturing of her upper extremities and right lower extremity. She required complete
personal care and gastrostomy tube feeds for nutrition towards the end of her disease course. Her
clinical diagnosis by a neurologist was CBS. She passed away at age 61 from medical
complications related to her neurodegenerative disorder. Disease duration in this patient was
about four years.
2.4.1.3 Neuropathology (Case #4993).
Gross: The whole brain weighed 940 grams unfixed. Examination of the right half of the fixed
brain demonstrated mild to moderate sulcal widening in the frontotemporal regions. Coronal
sections showed a well-defined and regular cortical ribbon without focal defects. Significant
widening of the circular sulcus and Sylvian fissure was noted. The caudate nucleus and putamen
were atrophic. The hippocampus was normal in size. The substantia nigra was normally
pigmented. There were no gross abnormalities of the cerebellum, pons, medulla, or cervical
spinal cord.
Microscopic: Severe pancortical micro-vacuolation associated with neuronal loss and gliosis was
seen in the frontal cortex. Similar changes were seen in the insular and temporal cortices and in
the basal ganglia. The vacuoles varied in size and were more numerous in the superficial layers
of the cortex. Vacuoles were not encountered in the thalamus, brainstem, cerebellum and spinal
cord. The vacuoles were located within neuronal cytoplasm and the neuropil. Patchy myelin

62
pallor was demonstrated in the white matter underlying the atrophic cortical areas. This finding
was best seen in LFB stains. The hippocampus was well-preserved. There was some neuronal
loss in the substantia nigra with an absence of Lewy bodies in the brainstem or cerebral cortex.
Bunina bodies were not seen in the motor nuclei of the cranial nerves. Bielschowski stains
demonstrated no neocortical senile plaques but rare, probably age-related, plaques were
identified in the hippocampus. No astrocytic plaques were observed in Gallyas stains. There
were no axonal spheroids. Immunostains for tau protein were performed and showed no
reactivity in neurons or other cells. Immunostains for ubiquitin demonstrated ubiquitin-reactive
neuronal cytoplasmic inclusions. Ubiquitin-reactive neuronal intranuclear inclusions were not
seen. Scattered neurites in the frontotemporal cortex were also ubiquitin positive. These findings
are compatible with the diagnosis of FTD with ubiquitin-only positive inclusions also referred to
as FTD-MND-type inclusion or FTD-U pathology [Lipton et al. 2004;Mackenzie and Feldman
2005;Mann et al. 2000;Taniguchi et al. 2004].
The third affected family member (brother of proband), after retiring at age 65, experienced
“dizzy” spells and did not feel well. He saw a number of doctors and he was told that he had
early Parkinsonism. Although he was never diagnosed with a dementing illness, he has been
unable to drive or prepare meals for himself. Information pertaining to this brother was limited to
history from a family member. There was no history of dementia or Parkinsonism in either
parent. The father died in his sixties from tuberculosis. The mother died at age 65 from
“pulmonary edema”. The other siblings are unaffected.

63
2.4.2 Genetic Analysis
Due to the clinical course and strong family history of disease, we performed mutation analysis
of all three known FTLD genes (MAPT, CHMP2B and PGRN) for patients #4150 and #4993. We
did not observe any sequence variations in the MAPT and CHMP2B genes. However, in the
PGRN gene we identified a novel heterozygous single nucleotide G-to-A mutation in the
invariant “GT” splice donor site 3‟of exon 7 (genomic position 5680; Accession Number
AC003043) (Figure 1B). The exon numbering was according to the National Center for
Biotechnology Information (http://www.ncbi.nlm.nih.gov/) and our exon 7 corresponds to exon 6
in the published report [Baker et al. 2006]. The IVS7+1G>A mutation segregates with the
disease in the two affected family members (#4150 and #4993) tested and was not found in 200
normal controls.
The mutation is predicted to have dramatic consequences on the maturation process of PGRN
mRNA leading to the removal of exon 7 which would create a frame shift and truncate the
protein to half its normal length (amino acid position 236). Likely such a transcript will be
destroyed by nonsense mediated decay. In agreement with this, the result of the RT-PCR, using
RNA isolated from the white blood cells of patient #4150, revealed only the wildtype product on
agarose gel (Figure 1C). The specificity of this RT-PCR product, containing exons 3-8 of the
PGRN gene, was confirmed by direct sequencing analysis. Importantly, this patient, who is
heterozygous (T>C) for a common synonymous polymorphism in exon 5 (D128D; rs25646)
using genomic DNA, showed only the “C” allele in the RT-PCR product (Figure 2B). Hence, the
RT-PCR result demonstrates the absence of the mutant PGRN transcript.

64
2.5 DISCUSSION
In the family reported here, the novel splice donor site mutation in the PGRN gene
(IVS7+1G>A) affects the sequence that is important in the recognition of the intron/exon
boundary and removal of the intron [Berget 1995]. There are no doubts about the pathological
nature of this mutation. It segregates with the disease in two affected family members and was
absent in 200 unrelated normal controls. The predicted consequence of the splicing mutation is
either the expression of the truncated protein or the haploinsufficiency of PGRN due to nonsense
mediated decay. According to the published reports the second possibility is more likely [Baker
et al. 2006;Cruts et al. 2006]. Indeed, our attempt to evaluate the pathological consequences of
the IVS7+1G>A mutation by RT-PCR using RNA from the blood cells of patient #4150 did not
identify aberrant PGRN transcripts (Figure 1C). Instead we confirmed the absence of the mutant
PGRN allele in the RT-PCR product (Figure 1B). Hence, the progression from normal function
to the disease state would result from the reduction of the PGRN level, further supporting the
model of haploinsufficiency for PGRN-linked FTLD. Previously, a different splicing mutation
(named IVS8+1G>A) was reported in one family; however, a source of RNA was not available
to confirm the haploinsufficiency mechanism [Baker et al. 2006].
The cases described in this family met clinical criteria for CBS [Boeve et al. 2003]. Pathology in
one affected individual demonstrated ubiquitin-positive, tau-negative cytoplasmic inclusions
consistent with the pathology reported in the original FTLD families in which PGRN mutations
co-segregate with disease [Baker et al. 2006;Cruts et al. 2006]. To our knowledge, this is the first
report of mutation in PGRN causing familial CBS with underlying FTD-MND-type inclusion
pathology. This type of pathology has been demonstrated previously in sporadic cases of CBS

65
[Grimes et al. 1999a;Kertesz et al. 2005]. One could surmise that these previously reported
“sporadic” cases may come from families with PGRN mutations that were non-penetrant.
Previous familial studies have demonstrated that CBS coexists with PSP, and/or FTLD [Boeve et
al. 2002;Brown et al. 1996;Brown et al. 1998;Bugiani et al. 1999;Gallien et al. 1998;Tuite et al.
2005;Uchihara and Nakayama 2006]. Only two of these studies had more than one affected
individual with CBS making this a relatively uncommon presentation in FTLD families [Tuite et
al. 2005;Uchihara and Nakayama 2006]. Our study extends this literature in that two of the
affected family members have CBS, while one has early parkinsonism which may be evolving
into a dementing condition based on history. Perhaps, the novel splice donor site mutation in
PGRN identified in this family predicts the phenotypic expression of CBS as opposed to FTLD
or PSP. However, this would be unlikely given the current haploinsufficiency model proposed
for PGRN mutation. Another possibility may be that the FTLD phenotype may be differentially
expressed in Asians such that CBS is more likely to occur. Reasons for this might include
epigenetic factors, modifier genes, and/or environmental influences that “tip the balance” in
favour of one particular manifestation of FTLD over another.
The proband in our study presented initially with behavioural symptoms consisting of increased
irritability, depression, social withdrawal, and suspiciousness. Prominent visuospatial
dysfunction was present early on in the clinical course. Subsequently, she had difficulties with
short-term memory, executive functions, and expressive language. MRI and SPECT imaging of
the brain (Figures 2A and 2B) demonstrated cortical atrophy and reduced perfusion, respectively,

66
in the right parieto-occipital greater than right frontotemporal regions which was clearly
asymmetrical when compared to the left hemisphere. This suggested an initial diagnosis of
posterior cortical atrophy although clinically there were also deficits of anterior cerebral
dysfunction. Once the extrapyramidal features evolved, the diagnosis of CBS became clear.
We have previously reported a case of a patient with sporadic CBS who presented initially with
prominent visuospatial dysfunction and a hemi-neglect syndrome similar to the proband in the
current study [Kleiner-Fisman et al. 2003]. Interestingly, final pathological diagnosis in this
patient confirmed ubiquitin positive, tau negative inclusions consistent with FTD-MND-type
inclusion pathology (unpublished data) similar to the pathology observed in the current study.
Visuospatial dysfunction in CBS has also been observed rarely [Mendez 2000;Okuda et al.
2000a] with one study demonstrating underlying typical CBD pathology [Tang-Wai et al. 2003].
Therefore, CBS presenting with prominent visuospatial dysfunction does not necessarily predict
the specific underlying pathological diagnosis.
Although both cases described in this family were diagnosed with CBS, there were significant
differences in their clinical course. The proband presented at age 62 with behavioural symptoms
and posterior cerebral dysfunction and evolved over a few years into CBS and is still living nine
years after disease onset, although nearing end-stage disease. The sister of the proband presented
at a younger age (57 years old) and had early and prominent motor features which eventually
lead to death at age 61, four years after symptom onset. Unknown environmental or genetic

67
factors or stochastic events must contribute to this variability in age of onset and disease severity
within families and will require further investigation.
Clinical diagnosis along the FTLD spectrum is challenging and frequently longitudinal follow-up
of patients is required to ascertain the most likely provisional diagnoses. Take, for example, the
prospective, clinic-based cohort of FTLD patients of Kertesz et al. [Kertesz et al. 2005] that was
followed longitudinally to autopsy. In this cohort, the authors describe patients presenting with
initial syndromes ranging from behavioural variants of FTLD, CBS, PSP, to primary progressive
aphasia. The majority of these patients then went on to develop second and/or third syndromes
with significant clinical overlap along the FTLD spectrum. Added to this complexity is the fact
that there were a variety of pathologies underlying each of the clinical phenotypes ranging from
tau positive to tau negative types. For the most part, the clinical syndrome of FTLD observed is
dependent more on “the distribution of the underlying pathological state rather than on its
nature” [Lang 2003]. It is hoped that as we learn more about the underlying molecular
pathogenic mechanisms of FTLD spectrum disorders, diagnostic accuracy in life will improve
and this will also lead to potential therapies to prevent or cure these debilitating disorders.
2.6 ACKNOWLEDGEMENTS
This work was supported by grants from the Japan-Canada and Canadian Institutes of Health
Research Joint Health Research Program, Parkinson Society of Canada (ER), Canadian Institutes
of Health Research (PSGH; SB – MT13129), Howard Hughes Medical Institute, Canada
Foundation for Innovation (PH). MM is supported by a Medical Scientist Training Fellowship

68
from the McLaughlin Centre for Molecular Medicine, University of Toronto. JH was supported
by the NIA/NIH Intramural Program. The authors would like to thank Edward Huey, MD for
constructive criticisms; Mr. Shahryar Rafi-Tari for his assistance in preparing the neuroimaging
figure; Ms. Isabel Lam for her assistance in preparing the table of neuropsychological data.
2.7 ADDENDUM
Since this original paper was published, we have subsequently confirmed that the proband
described in this study had a pathological diagnosis of FTLD-U/ TDP43 consistent with that
observed in association with PGRN mutation.

69
3.0 Intra-Familial Clinical Heterogeneity due to FTLD-U
with TDP43 Proteinopathy Caused by a Novel Deletion in
Progranulin Gene (PGRN)
Tomasz Gabryelewicz*, Mario Masellis*, Mariusz Berdynski
*, Juan M. Bilbao, Ekaterina
Rogaeva, Peter St. George-Hyslop, Anna Barczak, Krzysztof Czyzewski, Maria Barcikowska,
Zbigniew Wszolek, Sandra E. Black and Cezary Zekanowski
As published in: J Alzheimers Dis (2010); 22: 1123-1133.
Mario Masellis extracted the clinical information on the brother of the proband, interpreted and
integrated the clinical, neuropsychological, neuroimaging, genetic and pathological data, and was
responsible for writing a significant proportion of the manuscript with contribution from Tomasz
Gabryelewicz. Sequencing of the proband and genotyping of the controls was performed by
Mariusz Berdynski and Cezary Zekanowski. Ekaterina Rogaeva performed the genotyping in the
brother of the proband. Pathological analysis was done by Juan Bilbao.
* These authors contributed equally to the work as co-first authors

70
3.1 ABSTRACT
Frontotemporal dementia (FTD) is one of the commonest forms of early-onset dementia,
accounting for up to 20% of all dementia patients. Recently, it has been shown that mutations in
progranulin gene (PGRN) cause many familial cases of FTD. Members of a family affected by
FTD spectrum disorders were ascertained in Poland and Canada. Clinical, radiological,
molecular, genetic, and pathological studies were performed. A sequencing analysis of PGRN
exons 1-13 was performed in the proband. Genotyping of the identified PGRN mutation and
pathological analysis was carried out in the proband‟s brother. The onset of symptoms of FTD in
the proband included bradykinesia, apathy, and somnolence followed by changes in personality,
cognitive deficits, and psychotic features. The proband‟s clinical diagnosis was FTD and
parkinsonism (FTDP). DNA sequence analysis of PGRN revealed a novel, heterozygous
mutation in exon 11 (g.2988_2989delCA, P439_R440fsX6). The mutation introduced a
premature stop codon at position 444. The proband‟s brother with the same mutation had a
different course first presenting as progressive non-fluent aphasia, and later evolving symptoms
of behavioral variant of FTD. He also developed parkinsonism late in the disease course
evolving into corticobasal syndrome. Pathological analysis in the brother revealed
Frontotemporal Lobar Degeneration-Ubiquitin (FTLD-U)/TDP43 positive pathology. The novel
PGRN mutation is a disease-causing mutation and is associated with substantial intra-familial
clinical heterogeneity. Although presenting features were different, rapid and substantial
deterioration in the disease course was observed in both family members.
Keywords: corticobasal syndrome, frontotemporal dementia, haploinsufficiency, parkinsonism,
progranulin mutation, progressive non-fluent aphasia

71
3.2 INTRODUCTION
Frontotemporal dementia (FTD) is a clinically, genetically, and neuropathologically
heterogeneous disorder, accounting for 20% of early-onset dementia [Neary et al.
1998;Neumann et al. 2009]. FTD is characterized by behavioral and language dysfunction,
without amnesia, and consensus clinical and pathological diagnostic criteria have been proposed
[McKhann et al. 2001;Neary et al. 1998;The Lund and Manchester Groups 1994;Cairns et al.
2007].
Progranulin gene (PGRN, GRN [OMIM 138945]) mutations were shown to be common in
sporadic and familial FTD [Baker et al. 2006;Cruts et al. 2006;Gass et al. 2006]. PGRN is a 593
amino acid glycoprotein, composed of 7.5 evolutionary conserved tandem repeats, which are
cleaved, forming a family of granulin peptides. It is a growth factor important in neural
development [Ahmed et al. 2007]. A haploinsufficiency mechanism was identified to be the
etiology underlying PGRN-associated neurodegeneration, which causes frontotemporal lobar
degeneration with ubiquitin-positive, tau-negative inclusions (FTLD-U) [Baker et al. 2006;Cruts
et al. 2006]. TDP43 was found to be the major pathological protein underlying FTLD-U
pathology [Neumann et al. 2006].
From a clinical perspective, there is much to learn about how specific symptoms of FTD map
onto FTLD pathological subtypes. PGRN mutations have been associated with substantial
phenotypic heterogeneity in clinical presentation with a variety of diagnoses being observed:
behavioral variant FTD (bvFTD), progressive non-fluent aphasia (PNFA), corticobasal syndrome
(CBS), Alzheimer's disease, parkinsonism, and FTD with Parkinson‟s (FTDP) [Benussi et al.

72
2008;Kelley et al. 2009;Masellis et al. 2006;Rademakers et al. 2007;Rohrer et al. 2009;Yu et al.
2010]. This clinical heterogeneity results from the same PGRN mutation causing pathology in
different hemispheres and lobar regions [Rademakers et al. 2007]. The molecular mechanism
underlying this clinical variability in different family members is unknown.
In this report, we describe the clinical, neuropsychological, and radiographic features at onset
and longitudinally in two brothers from the first Polish kindred identified to have a novel PGRN
mutation. Pathological characterization was performed in the index case‟s brother.
3.3 MATERIALS AND METHODS
3.3.1 Subjects
Genealogical data was ascertained in Poland. The proband was living in Warszawa, Poland. His
brother was living in Toronto, Canada. They underwent assessment in specialized dementia
clinics. Clinical evaluation included history, physical examination, and cognitive screening.
Routine biochemical screening was done. Brain MRI and SPECT were performed.
Neuropsychological, neuropsychiatric, and functional measures were completed. Baseline and
ten month follow-up data are presented for the brother.
The case-control group for genetic analysis consisted of 90 patients with familial or sporadic
FTD (age-matched) and 200 elderly, neurologically healthy controls from the Polish population.
All participants or their relatives provided written, informed consent in accordance with the
Helsinki Declaration and the study was approved by the appropriate ethics committees.

73
3.3.2 Genetic analysis
DNA was isolated from peripheral leukocytes using standard procedures [Zekanowski et al.
2003b]. Intronic primers were used to amplify and sequence all (1-13) PGRN exons [Baker et al.
2006;Cruts et al. 2006]. Additionally, all exons of MAPT and PSEN1 were amplified and
sequenced to exclude mutations or rare polymorphisms [Zekanowski et al. 2003b;Zekanowski et
al. 2003a]. Amplification products were purified with ExoSAP IT (USB) and sequencing was
carried out using the BigDye Terminator v1.1 Cycle Sequencing Kit (Applied Biosystems) and
the ABI PRISM 3130 Genetic Analyzer (Applied Biosystems). RNA was extracted from the
proband‟s leukocytes using TRIzol reagent (Ambion) according to manufacturer's instructions.
cDNA prepared from 5 μg of RNA using Superscript II (Invitrogen) was used as a template for
quantitative PCR with Power SYBR Green PCR Master Mix on an ABI PRISM 7500 instrument
(Applied Biosystems) according to manufacturer‟s` protocols. Relative 2-ΔΔCt
method with ACTB
as a reference gene was used to estimate levels of PGRN mRNA. Primers were designed for
PGRN cDNA: forward 5'-ATCCAGAGTAAGTGCCTCTCCAA-3', reverse 5'-
CTCACCTCCATGTCACATTTCAC-3', and for ACTB: 5'-CCGCAAAGACCTGTACGCCA-3'
and 5'-TGGACTTGGGAGAGGACTGG-3'.
Absence of mutated mRNA was confirmed using the PCR method with reverse primer specific
for the frameshifted region (5‟-GTCTGCTGCTCGGACCAC-3‟ and 5‟-
GTCACAGCCGATGTCTCG-3‟). Absence of the mutation in the case-control groups was
confirmed using restriction fragment length polymorphism analysis with AvaI (Fermentas) or
direct sequencing.

74
3.3.3 Neuropathological analysis
Paraffin-embedded sections were stained with haematoxylin and eosin, Luxol fast blue,
Bielschowski and Gallyas. Immunostains using commercial antibodies for tau (Dako, A0024),
ubiquitin (Vector Labs, ZPU576), α-synuclein (Vector Labs), and subsequently with TDP43
(ProteinTech Group, Inc.) were performed.
3.4 RESULTS
3.4.1 Clinical, neuropsychological, and radiographic features
Proband (III:1). The proband was a 65-year-old right-handed male with no medical history. He
had 16 years of education and worked as a managing director of a company. At age 62, the first
symptoms were slowness, apathy and somnolence. The patient became withdrawn, less talkative,
gave up hobbies and had trouble handling familiar objects. After several months, his social
judgment deteriorated with a breakdown in formalities. He became disinhibited and significant
personality changes were observed. He developed cognitive symptoms thereafter including
aphasia and memory impairment.
Two years later (age 64), he stopped working and driving. Urinary incontinence occurred. The
patient underwent neurologic assessment and had evidence for dementia and parkinsonism.
Mini-Mental State Exam (MMSE) was 20. The patient deteriorated rapidly over the next few
months with insomnia and psychotic symptoms. He had significant irritability when opposed.
Motor re-examination showed moderately impaired monotone, slurred speech; minimal
hypomimia; resting tremor of upper extremities, moderate in amplitude; moderate rigidity;

75
severe motor slowness and multi-step turning with postural instability. The symptoms progressed
throughout the ensuing observation period.
Neuropsychological assessment (age 64) showed impairment of executive functions, speech,
attention, and visuospatial functions (Table 1, III:1). He had spared autobiographical memory.
Word-finding difficulties were pronounced both in spontaneous speech and in verbal fluency
tasks with perseverations. He had problems switching between categories. The proband‟s verbal
learning was impaired, with a flat, plateau-like curve, and with intact delayed memory. Working
memory was severely disturbed. Copy of the Rey-Osterrieth Complex Figure was disorganized
with visuospatial and perseverative errors; most details were omitted on its delayed reproduction.
Naming and visual gnosis was intact. The patient had problems with gesture and spatial praxis
because of difficulties in motor switching. Sequencing of motor learning was severely impaired
with perseverations. This was also manifest as disturbed reciprocal coordination with a strong
tendency to repeat only one motor action without inhibition. The patient required help in
dressing and showering, and falls occurred daily. The patient manifested loss of initiative and a
lack of interest in daily routine activities. He had difficulties with speech and his handwriting
became illegible. Psychiatric examination showed psychotic features, including visual
hallucinations (faces on windows), bizarre delusions, and misidentifications.

76
Table 1. Raw scores on neuropsychological and functional measures for proband (III:1) and proband’s brother (III:2).
III:2 Session1
III:2 Session 2
III:1
Demographics
Age of Onset (years) 55 - 62
Age at testing (years) 57 58 64
Duration of disease at testing (years) 2 3 2
Years of education 18 - 16
Neuropsychological Battery and Functional Measures (Test name/Maximum raw score)
General cognition
Folstein’s Mini-Mental Status Examination /30 19** 9** 22**
Mattis Dementia Rating Scale /144 96** N/T N/A
Blessed Information, Memory and Concentration Scale /37
N/A N/A 32
Memory
California Verbal Learning Test - Long Delay Free Recall /16
1** N/T N/A
Delayed Visual Reproduction /41 0** N/T N/A
Auditory verbal learning of 10 words list /First attempt/last attempt/delayed reproduction
N/A N/A 4/6/5
Rey Osterieth Complex Figure - reproduction /36 N/A N/A 6**
Address item from BIMC/5 N/A N/A 2
Language
Western Aphasia Battery - total /100 67.8** 40.4** N/A
Western Aphasia Battery – Aphasia Category Anomic Broca’s N/A
Western Aphasia Battery – Spontaneous Speech Content
7** 2** N/A
Western Aphasia Battery – Spontaneous Speech Fluency 5** 1** N/A
Western Aphasia Battery - comprehension /10 7.9** 5.8** N/A
Western Aphasia Battery – Repetition /10 8.4** 6.9** N/A
Western Aphasia Battery – Naming /10 5.6** 4.5** N/A
Boston Naming /30 13** N/T N/A
Boston Naming /20 N/A N/A 20
Semantic Fluency 6* 1** 10*
Praxis
Western Aphasia Battery - praxis /60 52** 34** N/A
Praxis of gesture /5 N/A N/A 4*
Reciprocal coordination I/10 II/10
N/A N/A 5 10*
Motor sequences learning I/5 N/A N/A 3

77
II/5 2
Attention & working memory
Digit span - forward /12 6 N/T 4*
Digit span - backward /12 3* N/T 3*
Serial 7’s test /14 N/A N/A 1**
Visuospatial abilities
Rey Osterieth Complex Figure - copy /36 36 26.5 28
Benton Line Orientation /30 28 22 N/A
Visual gnosis /17 N/A N/A 14
Executive functions
Phonemic fluency (F-, A-, S-words) 3** N/T N/A
Phonemic fluency (K-words) N/A N/A 2**
Wisconsin Card Sort Test - categories /6 1** N/T N/A
Wisconsin Card Sort Test - perseverative errors 40** N/T N/A
Activities of daily living
Disability Assessment for Dementia (%) 96 24** N/A
Neuropsychiatric symptoms
Neuropsychiatric Inventory - total /144 4** 14** 23**
Neuropsychiatric Inventory- delusions/12 0 0 2**
Neuropsychiatric Inventory- hallucinations/12 0 0 6**
Neuropsychiatric Inventory - euphoria /12 2** 4** 0
Neuropsychiatric Inventory- anxiety/12 0 0 2**
Neuropsychiatric Inventory - apathy /12 2** 4** 6**
Neuropsychiatric Inventory – depression /12 0 0 1**
Neuropsychiatric Inventory - disinhibition /12 0 2** 2**
Neuropsychiatric Inventory – Irritability /12 0 0 4**
Neuropsychiatric Inventory - appetite /12 0 4** 0
Cornell Depression Scale (%) 8 3 11 Session 2 scores were obtained 10 months after session 1 scores for III:2. Unmarked scores are normal based on
comparison to healthy population matched for age and years of education. *Borderline-Impaired; **Impaired; N/T =
Not testable; N/A = Not available
He was diagnosed with FTDP based on neurologic, psychiatric, physical, and
neuropsychological examinations. Brain MRI and SPECT results supported this diagnosis and
correlated with his symptoms and findings (Figure 3). Specifically, there was atrophy in the right
anterior temporal region and bifrontally, more prominent on the right. There was reduced
perfusion bifrontally, more prominent on the right and extending into the right superior parietal
region.

78
Proband’s brother (III:2). The proband‟s brother was a right-handed male with no relevant
medical history. He was assessed at age 57. He spoke Polish and English fluently. He had 18
years of education. Two years prior, he first presented with the insidious onset and gradual
decline in speech fluency; he had frequent word-finding difficulties that interrupted verbal
output. He often reverted to his native tongue. Comprehension was intact. However, he
continued to work as an engineer.
MMSE was 22/30. Spontaneous speech revealed word-finding difficulties with no paraphasic
errors. Comprehension, repetition, naming, and reading were intact. A written description of the
Cookie Theft Picture revealed use of simplified sentences with a sparse, but accurate description.
There was mild impairment in working memory and executive functions. His neurological exam
was normal except for mild increase in tone in the right arm with contralateral limb activation.
The initial diagnosis was PNFA.
Four months later, neuropsychological testing revealed moderate impairments in most domains
with relative sparing of visuospatial and visuoconstructive tasks (Table 1, session 1, III:2). On
the Western Aphasia Battery (WAB), his category was anomic. The aphasia over-estimated his
deficits. He, however, remained independent functionally with only minor troubles having a
phone conversation and taking messages. Initial MRI revealed bilateral frontal > anterior
temporal atrophy, which was prominent on the left (Figure 1A, B, C). Corresponding brain
SPECT revealed left > right bifrontal hypoperfusion extending into the left parietal region
(Figure 1B, C).

79
Figures 1 and 2. T1-weighted brain MRI and corresponding 99mTc-ECD brain SPECT images of proband‟s brother
(III:2) in radiographic axial orientation. Asymmetric atrophy on MRI is seen affecting the left frontal > parietal
regions with ventricular enlargement (III:2 – Session 1) which progresses as seen in Figure 2 (III:2 – Session 2).
Perfusion deficits in the left > right frontoparietal regions in Figure 1 (III:2 – Session 1) also progress to more
bilateral involvement along with left temporal involvement seen in figure 2 (III:2 – Session 2).
Figure 3. T1-weighted brain MRI and corresponding 99mTc-HMPAO (800MBq) brain SPECT images of proband
(III:1) in standard radiographic axial orientation. Bilateral frontal and temporal regions demonstrate significant
atrophy with ventricular enlargement seen on axial slices of T1 weighted images in MRI. Corresponding axial
images of functional SPECT showing perfusion defect in frontal and temporal regions, bilaterally. There was a
predilection for the right hemisphere both in terms of atrophy and perfusion deficits. Orange-yellow color represents
areas of normal perfusion on SPECT, while blue-purple color represents relative decreases in perfusion.
AT=anterior temporal; PT=posterior temporal; O=occipital; IF=inferior frontal; IP=inferior parietal; SF=superior
frontal; SP=superior parietal.
Clinical assessment seven months later (age 58) revealed deterioration in multiple spheres of
cognition, behavior and function. He perseverated and had difficulties shifting sets. He giggled
excessively. He ate quickly cramming food into his mouth and pocketing it in his cheeks. He
developed a craving for chocolate. He became disinhibited and impulsive. He stopped
maintaining oral hygiene and had trouble eating with utensils. He had difficulties arising from a
chair and climbing stairs. His gait was slow with decreased arm swing on the right. Formal

80
testing of praxis revealed both conceptual and ideomotor deficits. His score on the Frontal
Behavioral Inventory was 29, above the cut-off indicating FTD. The diagnosis remained PNFA,
but his syndrome evolved to include bvFTD.
Prospective re-evaluation on neuropsychological testing ten months after his first session
revealed significant deterioration (Table 1, session 2, III:2). MMSE was 9/30. WAB category
indicated a Broca‟s aphasia. He remained within normal limits on visuospatial tasks. From the
neuropsychiatric perspective, there was evidence for euphoria, disinhibition, apathy, and appetite
dysregulation. A repeat brain MRI demonstrated worsening atrophy of left > right
frontotemporoparietal regions (Figure 2A-C).
He became incontinent. He spoke with one word at a time. He was unable to follow instructions.
He required constant supervision. Physical exam revealed worsening parkinsonism with
hypomimia, right > left rigidity, difficulties arising from a chair, decreased right arm swing,
stooped posture and festinating gait. Re-evaluation on SPECT revealed progressive global
perfusion deficits with occipital sparing (Figure 2A-C). With the emergence of an asymmetric
akinetic-rigid syndrome associated with apraxia, his final diagnosis evolved to include CBS.
Eventually, he progressed to full mutism. At age 60, he was bed-ridden. He developed
progressive dysphagia. He passed away six years after disease onset (age 61) from complications
due to his neurodegeneration.

81
3.4.2 Neuropathology (III:2)
The brain weighed 1,230 grams. Macroscopic examination disclosed atrophy of the frontal lobes,
worse on the left. Temporal and left parietal involvement was present. There was atrophy of the
caudate head.
Microscopic examination revealed severe pan-cortical atrophy, worse in anterior frontal regions
with microvacuolization. There was cell loss, gliosis, and pallor of the subcortical white matter.
Ubiquitin-positive threads co-localized with the microvacuolar changes. Many neurons displayed
“comma”-shaped perinuclear inclusions. Rare ubiquinated intranuclear inclusions were
demonstrable. Ubiquinated inclusions were abundant in the cingulum, mesiofrontal lobe,
precentral gyrus, temporal and parietal lobes, but less so in the latter with segmentally spared
areas. A dramatic decrease in ubiquitin pathology was noted in transition from the precentral to
postcentral gyrus. Primary visual cortex was spared. Silver stain and immunostaining for tau and
α-synuclein was negative.
Subcortical grey matter revealed neuronal ubiquinated granular and filamentous inclusions in
caudate, putamen, thalamus, posterior hypothalamus and nucleus accumbens. Globus pallidus
and nucleus basalis of Meynert were spared. In limbic regions, the cornu ammonis of CA1 was
severely gliotic and shrunken. Microvacuolar changes involving the parahippocampal gyrus were
noted, with sparing of the perirhinal cortex. Ubiquitin positive inclusions were observed in
neurons of the fascia dentata.

82
The anterior 1/3 of the cerebral peduncles bilaterally was degenerated. The midbrain was small.
Estimated cell loss in the substantia nigra was 60% with severe gliosis and macrophages present.
There was no immunostaining for tau or α-synuclein. The pons was small with pallor of the
descending tracts. In the medulla, there was no α-synuclein staining. Rare neurons in the inferior
olive contained filamentous ubiquinated inclusions. Medullary motor nuclei were intact with no
ubiquinated inclusions observed. The cerebellum was unremarkable. Motor neurons in the spinal
cord were not affected.
Autopsy sections were re-examined with immunostains for TDP43 (Figure 4). TDP43 positive
neuropil threads, neuronal cytoplasmic stippled staining, neuronal cytoplasmic filamentous
inclusions, glial [oligo] cytoplasmic and neuronal intranuclear inclusions were found in the
frontal cortex, anterior striatum, fascia dentata, substantia nigra, and CA1 region. Final
pathological diagnosis was FTLD-U/TDP43 proteinopathy.
Figure 4. Micrographs demonstrating a large number of TDP43 inclusions (neuropil threads, neuronal cytoplasmic
stippled staining, neuronal cytoplasmic filamentous inclusions, glial [oligo] cytoplasmic and neuronal intranuclear
inclusions) found in the fascia dentata, substantia nigra, and CA1 region.
3.4.3 Family history
There was a strong family history of early-onset dementia and parkinsonism, suggesting
autosomal dominant inheritance (Figure 5). The proband‟s mother (II:2) died at age 64, with a
surmised progressive aphasia. Age of onset was 60. The maternal aunt had parkinsonism and

83
dementia and died ca. 65 years (II:3). The proband‟s father (II:1) was neurologically intact and
died at age 62 of lung cancer.
3.4.4 Genetic analysis
A novel PGRN dinucleotide deletion in exon 11 (g.2988_2989delCA, c.1536_1537delCA,
P439_R440fsX6) was identified in the proband and his affected brother (Figure 5). Both the
sense and the complementary DNA strand were sequenced. The mutation causes a frameshift at
codon 441, and introduces a stop codon at position 444. The mutation was absent in a group of
90 Polish patients with FTD (mean age=59.7 ± 13 years) and 200 ethnically matched
neurologically healthy controls (mean age=72.7 ± 7 years; MMSE≥28).
RT-PCR analysis of PGRN mRNA levels in peripheral leukocytes from the proband revealed a
two-fold decrease of the cDNA transcript as compared to controls without the mutation. PCR
using a primer specific to the mutant cDNA resulted in absence of amplification product (Figure
6).

84
Figure 5. Detection of PGRN mutation P439_R440fsX6. A) Pedigree showing family history of neurodegenerative
condition. Black symbols: patients affected with FTD and neurodegeneration; white symbols: unaffected individuals
or individuals with no clinical diagnosis available. B) Electropherogram showing start of deletion marked with an

85
arrow. The resulting PGRN mutation P439_R440fsX6 is shown at the bottom of the chromatogram of the proband
and his affected brother.
Figure 6. Amplification from genomic DNA (gDNA; lane 1) using primers specific for the mutant allele
demonstrate the mutant fragment of 153 bp as expected. Amplification from cDNA (lane 2) shows an absence of the
expected product supportive of non-sense mediated decay. Ladder: GeneRuler 1kb DNA Ladder (Fermentas), the
lowest band is 250 bp (lane 3); positive control: cDNA amplified 84 bp fragment of β-actin gene (lane 4).

86
3.5 DISCUSSION
We describe a novel PGRN mutation causing a frameshift introducing a premature stop codon.
RT-PCR analysis of PGRN mRNA levels confirmed the PGRN transcript decrease in the
proband as compared to normal. Additionally, no amplification products of the mutant allele
were detected suggesting that mRNA with the premature stop codon is rapidly degraded as a
result of non-sense mediated decay [Baker and Parker 2004]. There are no doubts about the
pathological nature of this mutation. It segregates with the disease in two affected family
members, it is absent in 200 normal controls, and immunohistochemistry confirms FTLD-
U/TDP43 pathology associated with mutant PGRN.
Patients affected with different PGRN mutations showed a broad range of age of onset (AOO;
48-83 years), with a mean of 597 years, often resulting in no family history recorded [Brouwers
et al. 2008;Gass et al. 2006]. Another study also showed a highly variable AOO ranging from 49
to 88 years, with variable disease duration ranging from one to 14 years [Kelley et al. 2009].
This novel PGRN deletion is associated with a rapid disease course and clear inheritance pattern.
Consistent with other studies, AOO was variable with the proband‟s brother developing
symptoms seven years earlier.
The clinical course of FTD in the two siblings was different, particularly at illness onset (Table
1). The proband‟s clinical features suggested early medial and dorsolateral prefrontal
involvement with slowing, lack of motivation, and apathy. Shortly thereafter, social impairment
and disinhibition were present, suggesting progression to orbitofrontal and right anterior
temporal structures. Parkinsonism was also present. The behavioral disturbance correlated well

87
with bifrontal and anterior temporal atrophy and hypoperfusion, worse on the right (Figure 3).
Language problems were observed later than behavioral impairment. The proband also had
psychotic features including hallucinations, which is atypical in FTD.
In contrast, language disturbances came first in the proband‟s brother. These were expressive
with an early anomia progressing to a Broca‟s aphasia and then to mutism. The initial symptoms
of PNFA correlate with atrophy and hypoperfusion predominantly in the left frontal region
(Figure 1A-C). Later on, behavioral disturbance developed, which suggested progression to
orbitofrontal and right anterior temporal regions, with social impropriety and disinhibition,
culminating in apathy and cognitive decline. As the disease progressed from PNFA to include
bvFTD so did the atrophy and perfusion deficits involving frontotemporal regions bilaterally
(Figure 2A-C). Apraxia was likely accounted for by the left frontoparietal involvement (Figures
1C and 2C) and these findings supported the third diagnosis of CBS. Visuospatial function was
relatively preserved, correlating well with intact perfusion and absent pathology in the occipital
regions, bilaterally.
The most common clinical presentation of PGRN mutation includes behavioral symptoms, with
apathy as the dominant feature [Beck et al. 2008], similar to the proband. However, as is the case
with his brother, clinical presentations of PNFA due to PGRN mutation are also frequent
[Snowden et al. 2006]. Several studies have confirmed this strong association between PNFA
and PGRN mutations with the typical FTLD-U/TDP43 pathology [Beck et al. 2008;Moreno et
al. 2009;Pickering-Brown et al. 2008;Skoglund et al. 2009]. In particular, similar to the brother‟s
pathological findings, FTLD-U, type 3 pathology, was found to be most commonly associated

88
with the clinical phenotype of PNFA [Snowden et al. 2007]. In one series, semantic dementia
cases were associated with MAPT mutations whereas PNFA with associated apraxia predicted
PGRN mutations [Pickering-Brown et al. 2008]. These particular case series were enriched with
familial forms of FTD or were selected for based on a priori identification of PGRN mutation.
Studies of predominantly sporadic cases of primary progressive aphasia selected for based on
availability of pathological material demonstrated the opposite trend. Specifically, non-fluent
presentations were associated with Tau pathology [Josephs et al. 2006;Knibb et al. 2006], while
fluent cases were associated with ubiquitin pathology [Knibb et al. 2006]. Longitudinal studies
of familial and sporadic aphasic variants of FTD followed clinically until death with subsequent
pathological characterization are warranted to clarify these apparent discrepant findings.
In the current study, both the proband and his brother developed parkinsonism. Indeed, FTD and
parkinsonism due to PGRN mutation is common [Josephs et al. 2007;Wong et al. 2009] and is
more variable than that due to FTDP-17 with MAPT mutations [Boeve and Hutton 2008]. In the
former, there are often posterior features, such as limb apraxia and visuospatial dysfunction,
which results in a wider clinical spectrum of diagnoses including dementia with Lewy bodies or
CBS [Boeve and Hutton 2008].
In general, the clinical heterogeneity and course of the affected siblings with this novel
P439_R440fsX6 dinucleotide deletion resembles the course of other FTD patients with short-
segment nucleotide PGRN deletions [Benussi et al. 2008;Borroni et al. 2008a;Llado et al.
2007;Skoglund et al. 2009]. The particular type of mutation does not predict the clinical
syndrome, but rather it is the location of the pathology which is most significant.

89
To date, significant progress has been made in understanding the allelic heterogeneity of PGRN
mutation in FTD. This paper extends the literature on the allelic and phenotypic heterogeneity of
FTD. However, progress in terms of understanding the variable clinical presentation of FTD, i.e.,
specific diagnoses, age of onset, hemispheric and specific lobar involvement and duration of
disease remain to be explained. Studies examining polymorphism within PGRN miRNA binding
sites and peripheral expression levels of PGRN may help to shed light on this phenotypic
heterogeneity [Finch et al. 2009;Rademakers et al. 2008]. Using the approach of early
identification of those at risk of developing FTD by imaging and CSF biomarkers coupled with a
better understanding of genetic, epigenetic, and environmental modulators of disease will
facilitate future development of preventative treatments and/or disease-modifying therapies for
these devastating FTD syndromes.
3.6 ACKNOWLEDGMENTS
The authors would like to thank Dr Jaroslaw B.Cwikla from Dep. of Radiology and Diagnostic
Imaging, Medical Centre for Postgraduate Education and CSK, MSWiA in Warsaw for
comments and creating figure 1. The authors would also like to thank Mr. Mike Misch, Gregory
Szilagyi, and Mark Gravely for creating Figures 1, 2, and 3 and Ms. Isabel Lam for creating
Table 1. MM is supported by a Canadian Health Institutes of Research (CIHR) Clinician
Scientist Award and the Department of Medicine, Sunnybrook Health Sciences Centre. This
research is supported by operating grants from the CIHR (SEB, MT13129; PSGH & ER,
MT417763) and the Ontario Research Fund (PSGH). ZW is supported by NIH/NINDS
1P50NS072187-01, 1RC2NS070276-01, 1R01NS057567-01A2; Carl Edward Bolch, Jr. and

90
Susan Bass Bolch Gift, and Mayo Clinic Florida Research Committee. CZ and MB are supported
by grant PBZ-MEiN-0/2/20/17.

91
4.0 Ideomotor Apraxia in Corticobasal Syndrome: Brain
Perfusion and Neuropsychological Correlates
Mario Masellis, Philip L. Francis, Kie Honjo, Bradley J. MacIntosh, Isabelle Guimont, Gregory
M. Szilagyi, Wendy R. Galpern, Galit Kleiner-Fisman, James L. Kennedy, Robert Chen, Eric A.
Roy, Curtis B. Caldwell, Anthony E. Lang, Sandra E. Black
As submitted to: Cortex
Mario Masellis clinically assessed several of the patients included in this study, extracted the
clinical information, designed the study, performed the data analysis and wrote the manuscript.
Philip Francis assisted with the SPM analysis of SPECT data and Kie Honjo assisted with the
MRI segmentation procedure. Brad J. MacIntosh assisted with the atrophy correction procedure.
Wendy R. Galpern, Galit Kleiner-Fisman and Anthony E. Lang assessed and collected clinical
data on patients ascertained from a movement disorders clinic.

92
4.1 Abstract
Ideomotor apraxia is one of the most common clinical features of corticobasal syndrome and is
associated with disability and reduced quality of life. Previous electrophysiological and
neuroimaging studies of apraxia implicated a role of the left frontoparietal network. However,
the specific nodes within this network have yet to be fully elucidated. The current study provides
the first direct correlative analysis between the severity of ideomotor apraxia in corticobasal
syndrome and cerebral perfusion imaging using brain SPECT. Reductions in perfusion within the
left inferior parietal lobule (t=5.7, p=0.03, Family-Wise Error [FWE] corrected), including the
left angular gyrus (t=5.7, p=0.02, FWE corrected), were associated with more severe ideomotor
apraxia as measured by the Western Aphasia Battery praxis scale. Results remained significant
even after controlling for the most affected side of the body. After categorizing the patients into
those with or without apraxia, language, visuospatial and visual memory functions were more
impaired in those with apraxia suggesting the involvement of overlapping networks, specifically,
bilateral occipitoparietal and left peri-Sylvian, subserving these related higher cognitive
processes. This study provides further evidence for the importance of the left inferior parietal
lobule in the dominant hemisphere frontoparietal praxis network and provides new insights into
associated cognitive dysfunction.
Keywords: apraxia; SPECT; perfusion; neuropsychology; corticobasal syndrome

93
4.2 Introduction
Corticobasal Syndrome (CBS) is a rare and debilitating neurodegenerative syndrome
characterized by asymmetric rigidity, apraxia, dystonia, myoclonus, alien-limb phenomenon,
cortical sensory loss, frontosubcortical dementia, behavioral disturbances, and speech and
language abnormalities including apraxia of speech and progressive non-fluent aphasia (PNFA).
There is significant pathological heterogeneity that can produce the syndrome including
corticobasal degeneration, progressive supranuclear palsy (PSP), frontotemporal lobar
degeneration (FTLD)-Tau (Pick‟s disease) and FTLD-Ubiquitin/TDP43, and Alzheimer‟s
disease [Kertesz et al. 2005;Lee et al. 2011;McMonagle et al. 2006;Wadia and Lang 2007].
Apraxia is the hallmark that distinguishes CBS from other parkinsonian disorders in the early
stages of disease and it is the most common clinical feature occurring cross-sectionally in 70%
and longitudinally in 100% of cases [Leiguarda et al. 1994;Rinne et al. 1994;Stamenova et al.
2009]. Apraxia is defined as a higher-order “neurological disorder characterized by loss of the
ability to execute or carry out skilled movements and gestures, despite having the desire and the
physical ability to perform them” (http://www.ninds.nih.gov/disorders/apraxia/apraxia.htm).
There are many types of apraxia observed in CBS including apraxia of speech, limb-kinetic
apraxia, ideomotor apraxia (IMA), and ideational/conceptual apraxia, which have been
extensively described elsewhere [Gross and Grossman 2008;Josephs and Duffy 2008;Leiguarda
and Marsden 2000;Stamenova et al. 2009;Zadikoff and Lang 2005].
Ideomotor apraxia, best elicited by asking a patient to pantomime and/or imitate hand gestures
and tool use, is characterized by disturbances of timing, sequencing and spatial organization of

94
gestural movement of the limbs [Rothi et al. 1991]. It has been the most extensively studied
apraxia type in CBS [Zadikoff and Lang 2005], although there have been only a paucity of
studies that have directly correlated specific measures of praxis with brain imaging findings in
this disorder. Peigneux et al. [Peigneux et al. 2001] were the first to examine the association of
upper limb apraxia with fluorodeoxyglucose positron emission tomography (FDG-PET) imaging
in a case series of 18 patients with CBS. Their sample was stratified into CBS with and without
apraxia based on a standardized praxis measure. Using a global praxis performance score, the
bilateral anterior cingulate gyri demonstrated mild reductions in metabolism in the apraxic group
(uncorrected p < 0.001) [Peigneux et al. 2001]. Alternatively, stratification using a praxis
correction score resulted in hypometabolism contralateral to the most affected body side in the
superior parietal lobule, medial frontal gyrus and supplementary motor area, as well as the
middle frontal gyrus in the apraxic group (uncorrected p < 0.001) [Peigneux et al. 2001]. This
study, however, did not correlate PET images of metabolism with praxis measures, nor did their
imaging analysis correct for multiple comparisons on a voxel-by-voxel basis. Other small PET
and single photon emission computed tomography (SPECT) studies of apraxia have been
conducted in CBS samples, but these did not specifically look at the relationship between praxis
measure and functional imaging; rather they were a comparison of CBS versus controls and only
indirect associations with apraxia were made [Zadikoff and Lang 2005].
Functional neuroimaging studies with FDG-PET and SPECT have shown reduced metabolism
and perfusion, respectively, in frontoparietotemporal regions in CBS patients compared to
controls [Eidelberg et al. 1991;Garraux et al. 2000;Markus et al. 1995;Okuda et al. 1999]. The
hypoperfusion tends to be contralateral to the most affected side of the body. Similarly,

95
asymmetrical atrophy on MRI can also be seen in CBS and the atrophy usually is more
prominent contralateral to the most affected side of the body [Riley et al. 1990;Savoiardo et al.
2000;Soliveri et al. 1999]. Perfusion SPECT was used in the current study given that prior
research of focal cortical atrophy syndromes, such as FTLD, have shown that perfusion
reductions on SPECT are more extensive than atrophy detected on MRI in the early stages of
disease and in longitudinal follow-up, indicating increased sensitivity of this modality as a
potential biomarker [Gregory et al. 1999;Gabryelewicz et al. 2010;Mendez et al. 2007].
The primary objectives of the current study were 1) to identify regions of reduced perfusion
using brain SPECT in a prospectively recruited sample of CBS cases compared to controls, 2) to
determine which of these regions directly correlate with performance on a standardized global
measure of ideomotor praxis using the Western Aphasia Battery (WAB) [Kertesz and Poole
1974;Kertesz 2007] accounting for effects of lateralization of motor symptoms and underlying
atrophy on MRI, and 3) to compare the demographic, clinical, neuropsychological and SPECT
characteristics of CBS patients with significant apraxia to those without this feature defined
based on performance on the WAB praxis subscale. The secondary objective of this study was to
explore the different subcomponents of the WAB praxis scale and their association with brain
SPECT perfusion.

96
4.3 Materials and Methods
4.3.1 Subjects:
Thirty-one patients with a clinical diagnosis of CBS according to proposed diagnostic criteria
[Boeve et al. 2003] were recruited through two academic clinics: the Linda C. Campbell
Cognitive Neurology Research Unit at Sunnybrook Health Sciences Centre and the Movement
Disorders Centre at the Toronto Western Hospital, University Health Network. Patients provided
informed consent to participate according to the Declaration of Helsinki and were followed as
part of a prospective, longitudinal study of dementia and ageing approved by the local Research
Ethics Board. The patients underwent a detailed neurological exam, including a screening
assessment for apraxia in both upper limbs comprised of asking them to pantomime five gestures
(two intransitive and three transitive ones). Patient handedness was determined using a
standardized questionnaire [Bryden 1977]. The side of greatest rigidity and/or apraxia on clinical
examination by a cognitive and/or movement disorders neurologist with expertise in the clinical
assessment and diagnosis of CBS defined the motor-onset of symptoms. Although one side of
the body was more prominently affected than the other side in all patients initially, motor signs,
including apraxia, were indeed present bilaterally and became more evident as the disease
progressed. Diagnostic consensus was achieved through review by at least two neurologists
(AEL, MM and/or SEB). All patients were followed longitudinally to ensure diagnostic
accuracy. This is important because in advanced disease, the proportion of patients fulfilling
three of the most commonly applied diagnostic criteria for CBS was similar at approximately
90%, indicating that all criteria could be applied equally well in late stage disease [Mathew et al.
2011].

97
4.3.2 Description of neuropsychological measures:
Neuropsychological tests assessing general cognitive functions included Folstein‟s Mini-Mental
State Examination (MMSE) [Folstein et al. 1975], and Mattis Dementia Rating Scale (DRS)
[Mattis 1976]. Measures of language function and naming included: the Western Aphasia
Battery (WAB), which calculates an aphasia quotient based on combined subscores of fluency,
content, comprehension, repetition and naming, with a maximum score of 100 and lower scores
representing more severe impairment [Kertesz and Poole 1974;Kertesz 2007]; the Boston
Naming Test (BNT) [Williams et al. 1989]; and semantic/categorical fluency [Gladsjo et al.
1999]. The visual reproduction subtest of the Wechsler Memory Scale-Revised (WMS-R) was
used to assess visual memory [Lezak 1983]. Visuospatial function was assessed using the Rey-
Osterrieth Complex Figure Test [Lezak 1983;Osterrieth 1944;Rey 1941], and the Benton Line
Orientation task, which is motor-free and assesses visuospatial orientation and attention [Lezak
1983]. Additional standardized neuropsychological, neuropsychiatric and functional measures
were performed as previously described [Masellis et al. 2006].
Praxis was assessed using the WAB praxis scale [Kertesz and Poole 1974;Kertesz 2007]. The
WAB is a valid and reliable measure of language and other higher cortical functions [Kertesz
2007] and the WAB praxis scale has been used to correlate stroke lesion localization and size
with severity of ideomotor apraxia [Kertesz and Ferro 1984]. Briefly, patients were asked to
pantomime gestures using their bucco-facial musculature and their less affected limb. Since CBS
is strikingly asymmetric in presentation and since the apraxia most often co-exists in the same

98
limb where the extrapyramidal and cortical sensory features reside, the less affected limb was
selected for praxis assessment scoring to avoid contamination with the sensory and
extrapyramidal signs. Gestures fall into four categories: upper limb intransitive or transitive,
bucco-facial, or complex. Examples include waving goodbye (intransitive gesture), using a
toothbrush (transitive gesture), blowing out a match (bucco-facial gesture), and pretending to
drive a car (complex gesture). There were five different gestures asked in each of the four
categories. For all of the gestures, if the patient was unsuccessful at pantomime, they were asked
to imitate the gestures. For transitive gestures, if they were unsuccessful at both pantomime and
imitation, they were then handed the tool and asked to demonstrate how to use it. Three points
were given if the gesture was performed correctly on pantomime; two points were given if there
was approximate performance on pantomime or good performance on imitation only; one was
given if there was approximate performance on imitation or if performed correctly with the
actual tool or object; and no points were given if the patient was unable to perform the task, the
gesture was unrecognizable or unrelated, and for erroneous use of the actual object. Approximate
performance on gestural tasks was defined by the occurrence of the following types of errors:
inaccurate positioning of the hand or limb in space, improper finger configuration, a breakdown
in the core characteristics of the movement, and/or deficits in the sequence of an action, such as
omission or addition of movement elements, as well as a change in the order in which an action
should be carried out. Apraxia was scored out of 60 with lower scores indicating more severe
IMA [Kertesz and Poole 1974;Kertesz 2007]. Trained psychometrists with a Bachelor‟s or
Master‟s degree in Psychology administered all the tests, including the WAB, and were
completely blind to all neuroimaging measures.

99
4.3.3 Brain SPECT acquisition and processing:
SPECT imaging employed a triple-head gamma camera (Prism 3000XP; Phillips Medical
Systems Inc., Cleveland, Ohio) and was performed a minimum of 30 minutes and a maximum of
120 minutes after injection of 20 mCi (740 MBq) of Technetium-99m ethyl cysteinate dimer
(99m
Tc-ECD SPECT). Patients were asked to rest quietly during the acquisition phase. 120 views
were acquired uniformly over 360 degrees using all three detectors fitted with ultra-high
resolution fan-beam collimators. Each view consisted of a 128 × 128 pixel image. Total imaging
time was 19 minutes. Reconstruction was performed using a ramp-filtered back-projection
algorithm followed by a 3-dimensional restoration post-filter (Wiener filter, multiplier 1.0).
Reconstructed image resolution was typically 9.7 mm full width at half maximum (FWHM).
Ellipses were fit to the approximate location of the outline of the head in each transaxial image,
and a calculated attenuation correction applied [Matsuda et al. 1995]. Voxel dimensions were
2.18 × 2.18 × 3.56 mm.
4.3.3.1 Regional perfusion ratios:
Reconstructed SPECT images were co-registered to a template that was an average of 14
healthy, elderly control scans. A T1-weighted MRI with dimensions similar to the SPECT
template was the source of 79 bilateral regions of interest (ROI) as previously described
[Lobaugh et al. 2000]. To obtain ROI intensity values, we used a common transformation to
move from the SPECT template space to MRI space. The cerebellum is frequently used to
normalize SPECT counts in studies of dementia [Stamatakis et al. 2001]. However, crossed
cerebellar diaschisis may lead to relative differences in perfusion between the left and right
cerebellar hemispheres, and, if whole cerebellum is used as the reference region in these cases,

100
regional cerebral blood flow (rCBF) may be overestimated in a particular ROI. We, therefore,
applied the following rule: if there was more than a 5% difference in counts between left and
right cerebellar hemispheres, we use the hemisphere that was more perfused as the reference
region. If there was no difference then the whole cerebellum was used as the reference region. In
this way, semiquantitative perfusion ratios can be derived and regional Z scores calculated
[Lobaugh et al. 2000].
4.3.4 Data analysis:
Statistical analysis of demographic, clinical, neuropsychological and ROI SPECT variables was
performed using the Statistical Package for the Social Sciences (SPSS), version 16.
4.3.4.1 Demographic, clinical and neuropsychological measures:
Categorical demographic and clinical data were analyzed using chi-square or Fisher exact tests.
Normality of continuous demographic and neuropsychological data was assessed based on
examination of Q-Q probability plots. Normally distributed data were analyzed using
independent sample t-tests or ANOVA, otherwise, Mann Whitney U tests were performed.
4.3.4.2 Statistical Parametric Mapping (SPM) SPECT analysis:
SPECT scans were converted to Analyze 7.5 format. Statistical Parametric Mapping version 5
(SPM5, Wellcome Department of Imaging Neuroscience, University College London) was used
for all imaging processing. Images were spatially normalized to a standard SPECT template in
Montreal Neurological Institute (MNI) space [Stamatakis et al. 2001] with re-sampling of voxel
dimensions of 2 × 2 × 2 mm. Images were then smoothed using an isotropic Gaussian kernel (12

101
mm FWHM). A thresholded mean voxel value was chosen for global calculation, and global
normalization was achieved by proportional scaling to an arbitrarily chosen constant value set at
50 mL/100 g/min. Voxel-by-voxel regression analysis was performed between perfusion and
praxis measures. Alternatively, voxel-by-voxel analyses were performed using unpaired t-tests to
compare 1) CBS patients to controls, and 2) apraxic to borderline/non-apraxic patients.
Covariates were incorporated if they were significantly different between groups. We reported
significance using a voxel-wise p-value threshold (p < 0.05) corrected for multiple comparisons
and an extent threshold of at least 20 contiguous voxels. Our correction methodologies included
either controlling the family-wise error (FWE) rate [Worsley et al. 1996] or controlling the false
discovery rate (FDR) [Genovese et al. 2002]. Controlling the FWE rate is more conservative but
is known to be associated with type II errors. A whole brain mask was used to exclude
extracranial voxels from the analysis. The maximal peak coordinates of the perfusion
differences were converted to Talairach space using the Yale Non-linear MNI to Talairach
Converter [Lacadie et al. 2008] (http://www.bioimagesuite.org/Mni2Tal/index.html). These
converted coordinates were translated into anatomical brain regions and Brodmann Areas (BAs)
using Talairach Daemon Client [Lancaster et al. 2000] (http://www.talairach.org/client.html).
4.3.4.3 Region of interest (ROI) SPECT analysis:
4.3.4.3.1 Comparison of CBS cases to controls
Normality of ROI SPECT data was confirmed as described above. Independent sample t-tests
between CBS and control groups were conducted to compare mean perfusion ratios of individual
ROIs within frontal, parietal, temporal, basal ganglia, and thalamic regions previously shown to
be affected in CBS [Markus et al. 1995;Okuda et al. 1999]. ROIs that were statistically

102
significant on the t-test analyses were included in a multivariate analysis of covariance
(MANCOVA). „Years of education‟ was included as a covariate since it was the only
demographic variable that differed significantly between the cases and controls.
4.3.4.3.2 Confirmation of voxel-wise correlation with WAB praxis using ROI method
Regions of hypoperfusion identified on the voxel-by-voxel regression analysis allowed us to pre-
select the most relevant ROI to perform a Pearson correlation and linear regression analysis with
WAB praxis scores. This analysis provided for an independent confirmation of the voxel-wise
findings using the bottom up approach for data reduction given the sample size.
Since there is left hemisphere specialization for praxis control, and since CBS is typically
asymmetric in presentation, the potential confounding effect of symptom lateralization was
controlled for in the SPM and ROI regression analyses by incorporation of right- versus left-
sided motor presentation as a covariate.
4.3.4.4 Brain MRI acquisition and processing:
Structural MRI was obtained in 29 of the 31 patients using a standard protocol. Images were
acquired on a 1.5T Signa MR imager (GE Medical Systems, Milwaukee, Wis.) and consisted of
the following acquisitions: 1) T1-weighted (axial 3D spoiled gradient [SPGR] echo, with echo
time [TE] 5 ms, repetition time [TR] 35 ms, flip angle 35°, number of excitations [NEX] 1, field
of view [FOV] 22 × 16.5 cm, in-plane resolution 0.859 × 0.859 mm and slice thickness 1.2–1.4
mm), 2) proton-density and 3) T2-weighted images (interleaved axial spin echo, with TEs 30 and

103
80 ms, TR 3 s, NEX 0.5, FOV 20 × 20 cm, in-plane resolution 0.781 × 0.781 mm and slice
thickness 3 mm).
4.3.4.4.1 Brain Extraction and Automated Tissue Segmentation:
Twenty-one of the 29 MRI scans were of sufficient quality to undergo semi-automated image
analysis. Poor image quality was primarily due to head motion artifacts. Brain extraction and
automated tissue segmentation were based on previously described methods [Kovacevic et al.
2002]. Images were co-registered to the T1-weighted image using the Automated Image
Registration package (AIR, v.5.2.3). T2/PD images were used collectively to extract brain and
subdural/ventricular CSF, then the masked T1 was segmented using a T1-based protocol
whereby local intensity histograms are fitted to four Gaussian curves to derive cut-offs for
classifying each voxel as white matter, grey matter, or cerebrospinal fluid (CSF) [Kovacevic et
al. 2002]. This is important for calculating the Total Intracranial Volume in correcting for head
size, especially in focal atrophy syndromes like CBS. The methods of Kovacevic et al. have been
updated and more details of the MRI image processing pipeline have been described [Ramirez et
al. 2011].
4.3.4.4.2 Post-hoc MRI analysis:
A post-hoc analysis was performed on the FWE- and FDR-corrected group statistical maps.
These two maps were outputted as masks and transformed into each participant‟s MRI T1-
weighted image space. Registering of the group SPECT SPM masked results into participant
coordinate space allowed for the characterization of tissue types that were defined by the group
SPM result. The proportion of grey matter, white matter, and CSF underlying the SPM masks

104
was calculated for each patient. Mean and standard deviation values for each tissue class were
calculated across all patients to estimate the degree of atrophy underlying the SPM masks.
4.4 Results
4.4.1 CBS vs. controls
4.4.1.1 Demographic data
Demographic feature CBS
(n=31)
Controls
(n=31)
Gender 19 (61.3%) F
12 (38.7%) M
19F
12M
Handedness 29 (93.5%) R
2 (6.5%) L
29R
2L
Age of Onset (mean SEM years) 65.2 1.7 N/A
Age at Investigation (mean SEM years) 68.5 1.7 70.0 1.2
Duration of symptoms (mean SEM years) 3.3 0.4 N/A
Years of Education (mean SEM years)* 12.4 0.6 14.5 0.5
Initial body side most affected 16 (51.6%) R
15 (48.4%) L
N/A
Table 1. Demographics of patients with corticobasal syndrome (CBS) and control group.
F=female; M=male; R=right; L=left; SEM = standard error of mean; N/A = not applicable. * t(60) = -2.7, p = 0.008;
initial body side most affected was defined based on where most prominent motor symptoms were observed.

105
4.4.1.2 Clinical features
Clinical characteristics Frequency (%) at
time of investigation
(N=31)
Frequency (%) at
follow-up
(N=31)
Extrapyramidal features
Rigidity (asymmetric) 28 (90.3%) 31 (100%)
Dystonia (asymmetric) 16 (51.6%) 18 (58.1%)
levodopa trial with poor
response*
13 (41.9%) 13 (41.9%)
Tremor – postural/action 8 (25.8%) 11 (35.6%)
Cortical features
Apraxia (asymmetric) 28 (90.3%) 31 (100%)
Cortical sensory loss 19 (61.3%) 19 (61.3%)
Alien-limb phenomenon 1 (3.2%) 3 (9.7%)
Limb levitation 7 (22.6%) 10 (32.3%)
Myoclonus 9 (29.0%) 13 (41.9%)
Early dementia 22 (71.0%) 22 (71.0%)
Language disturbance 24 (77.4%) 24 (77.4%) Table 2. Clinical characteristics of CBS sample.
* 13 patients had a trial of levodopa and all responded poorly based on clinical assessment. Average time for
emergence of additional signs on follow-up was 1.0 ± 0.3 years. All findings described above are based on clinical
examination.
Rigidity and IMA were asymmetric in the early stages of the disease and eventually occurred in
all patients. Early dementia was defined clinically according to DSM-IV criteria. Cortical
sensory loss in this study was defined by the presence of one or more of the following
abnormalities: extinction to double simultaneous tactile stimuli and/or astereognosis and/or
agraphesthesia. Limb levitation was distinguished from true alien limb phenomenon.
4.4.1.3 SPM and ROI SPECT analyses
Two methods, SPM and ROI analyses, were used to compare perfusion differences between all
CBS cases and controls, CBS cases with left-sided symptoms (CBS-L) vs. controls, and CBS

106
cases with right-sided symptoms (CBS-R) vs. controls. See figure 1 and supplementary table 1,
which provides anatomical locations of the reduced perfusion and the statistical results.
Figure 1. Statistical parametric maps (SPM) of bilateral frontal, parietal and temporal surface regions of the
brain showing decreased perfusion in (A) all CBS cases compared to controls and (B) CBS cases with
predominant symptoms on their left side (CBS-L) compared to controls overlaid on brain MRI template.
N.B. Refer to Supplementary Table 1 for details of analysis and results. Green areas are corrected for multiple
testing using Family-Wise Error methods, while red areas are corrected using False Discovery Rate methods.
Areas of significantly reduced perfusion among CBS individuals compared to controls using ROI
and voxel-wise approaches were: bilateral dorsolateral prefrontal association cortices, bilateral
primary sensorimotor cortices, bilateral anterior cingulate regions, right superior and inferior
parietal lobules, left superior parietal lobule, right superior and middle temporal gyri, right

107
fusiform gyrus and right insula. The left supramarginal gyrus ROI showed reduced perfusion in
CBS vs. controls in the individual t-test analysis, but when incorporated into the GLM
multivariate analysis, it showed a trend for significance (p=0.06). Three of these regions
remained significant after correcting the FWE: right middle frontal gyrus, left superior frontal
gyrus and left superior parietal lobule (Figure 1 and Supplementary Table 1). CBS patients with
predominant left-sided symptoms as compared to controls demonstrated reduced perfusion in the
same cortical regions as in the entire patient sample using the FDR correction except that these
regions lateralized mainly to the right hemisphere. Areas of reduced perfusion in CBS-L versus
controls were: superior and middle frontal gyri and post-central gyrus all lateralized to the right
hemisphere (FWE corrected; Supplementary Table 1 and Figure 1). An area of reduced perfusion
in CBS-R versus controls was the dorsal aspect of the left inferior frontal gyrus (ROI method).
When the stringency of the SPM analysis was reduced (uncorrected p-value <0.001), left
frontoparietal regions including the left inferior parietal lobule demonstrated reduced perfusion
in CBS-R vs. controls (data not shown). No significant areas of relative hyperperfusion were
observed in the CBS group.
4.4.1.4 CBS sample with praxis scores available
WAB praxis data were available on 87.1% (27/31) of the CBS patients. Severe dementia was the
reason for three CBS patients being unable to complete the WAB praxis task; MMSE scores
were 10 or less in these patients and they were unable to complete any other neuropsychological
tests as a result. One patient with an MMSE score of 24/30 and a DRS score of 99/144 was
unable to complete the WAB and most other tests due to poor effort secondary to severe apathy

108
(apathy score on the Neuropsychiatric Inventory = 8) [Cummings 1997]. The body side most
affected by CBS symptoms and signs was right in 51.9% (14/27) of CBS patients and left in
48.1% (13/27; Table 3). Mean MMSE and total DRS scores were 23.2 ± 1.0 and 114.1 ± 1.2
(DRS cut-off for dementia in this age group = 123/144), respectively, suggesting that the CBS
patients were on average only mildly demented.
The mean WAB praxis scale total score of the CBS sample was 53.2 ± 1.6. There were no
statistically significant differences in mean WAB praxis scale total scores between those
presenting with their right side of the body most affected compared to those with the left side
most affected. Based on a normal control group matched for age and education obtained through
our longitudinal study, scores of greater than 57.1 are considered in the normal range (between 0
and -1.5 standard deviations [SD]), whereas scores of between 57.1 and 56.1 are considered
borderline apraxic (between -1.5 to -2 SD). Scores of less than or equal to 56.1 are considered in
the apraxic range; that is, -2 SD and below. Based on these cut-offs, 29.6% (8/27) of CBS
patients had no apraxia at the time of their initial investigation; 18.5% (5/27) had borderline
apraxia, while more than half (51.9%; 14/27) had clear IMA of varying severity. Importantly, all
patients eventually developed apraxia as their disease progressed over the longitudinal
observation period.

109
Demographic variable CBS-APX (n=14) CBS-nAPX (n=13) Summary (n=27)
Gender 11 (78.6%) F
3 (21.4%) M
5 (38.5%) F
8 (61.5%) M
16 (59.3%) F
11 (40.7%) M
Handedness 13 (92.9%) R
1 (7.1%)L
12 (92.3%) R
1 (7.7%) L
25 (92.6%) R
2 (7.4%) L
Site of recruitment 9 (64.3%) Cog
5 (35.7%) MD
8 (61.5%) Cog
5 (38.5%) MD
17 (63.0%) Cog
10 (37.0%) MD
Dementia vs. motor
onset
10 (71.4%) Dem
4 (28.6%) Motor
8 (61.5%) Dem
5 (38.5%) Motor
18 (66.7%) Dem
9 (33.3%) Motor
Age of Onset
(mean SEM years)
68.4 2.3
64.7 2.2
66.6 ± 1.6
Age at Investigation
(mean SEM years)
71.7 2.3
68.1 2.2
70 ± 1.6
Duration of symptoms
(mean SEM years)
3.4 0.6
3.4 0.5
3.4 ± 0.4
Years of Education
(mean SEM years)
12.1 0.5
12.8 0.1
12.4 ± 0.6
Body side most affected 7 (50.0%) R
7 (50.0%) L
7 (53.8%) R
6 (46.2%) L
14 (51.9%) R
13 (48.1%) L
Table 3. Demographic features of CBS presenting with apraxia (CBS-APX) vs. those
without significant apraxia (CBS-nAPX).
F = Female; M = Male; Cog = Cognitive Neurology Clinic; MD = Movement Disorders Clinic;
R = Right; L = Left; Dem = Dementia onset; Motor = Motor onset
4.4.1.5 Comparison of apraxic to borderline/non-apraxic CBS patients: Neuropsychological and
SPECT analysis
The CBS group was stratified into 1) those with apraxia and 2) those with borderline/no apraxia.
There were no significant differences in demographic features between CBS patients with
apraxia and those with borderline or no apraxia (Table 3). There were also no significant
differences in any of the clinical features between the two groups (data not shown). Table 4
compares neuropsychological, neuropsychiatric and functional measures between the two
groups. Mean MMSE scores were slightly lower in the apraxic vs. borderline/non-apraxic group
(21.2 ± 1.6 vs. 25.3 ± 1.1, respectively; t(25) = -2.1, p = 0.04). However, no significant
differences were observed on the mean DRS scores indicating that the groups did not differ

110
significantly in terms of dementia severity. Mean scores on the delayed visual reproduction were
also worse in the apraxic vs. borderline/non-apraxic group (5.3 ± 1.9 vs. 14.4 ± 3.4, respectively;
t(15) = -2.4, p = 0.03 adjusted for unequal variances). A similar finding was observed for the
mean scores on the immediate visual reproduction task (apraxic: 12.9 ± 3.0 vs. non-apraxic: 22.6
± 3.0; t(17) = -2.2, p = 0.04). There was a good correlation noted between WAB praxis and
immediate visual reproduction scores (Pearson r=0.50, p=0.03) suggesting that the degree of
apraxia may account for some of the variance in this relationship. However, there was no
correlation observed between scores on the delayed visual reproduction and the WAB praxis
scale (Pearson r=0.32, p=0.17) suggesting that this association was mostly independent of degree
of motor impairment. Another significant difference between the apraxic and non-apraxic groups
was in the Benton Judgement of Line Orientation test (7.3 ± 2.9 vs. 18.6 ± 3.2, respectively;
t(19) = -2.6, p = 0.02) suggesting more right parieto-occipital involvement in the group with
apraxia.

111
Psychometric Measures CBS-APX (n) CBS-nAPX (n)
General cognition
MMSE /30 [n=27]* 21.2 ± 1.6 (14) 25.3 ± 1.1 (13)
Clock total /10 [n=8] 6.3 ± 1.5 (4) 7.5 ± 1.3 (4)
MDRS /144 [n=25] 105.9 ± 6.0 (12) 121.6 ± 5.2 (13)
NART /127.8 [n=19] 108.4 ± 2.6 (8) 106.8 ± 2.9 (11)
Raven‟s Progressive Matrices [n=22] 19.6 ± 1.3 (10) 23.8 ± 2.6 (12)
Memory
CVLT Long Delay Free Recall /16 [n=21] 6.2 ± 0.8 (9) 6.8 ± 0.9 (12)
Delayed Visual Reproduction /41 [n=19]* 5.3 ± 1.9 (8) 14.4 ± 3.4 (11)
Language
WAB total /100 [n=23]* 81.1 ± 3.8 (13) 91.8 ± 1.9 (10)
WAB content /10 7.7 ± 0.5 8.8 ± 0.3
WAB fluency /10 7.8 ± 0.6 9.1 ± 0.2
WAB comprehension /10* 8.7 ± 0.3 9.8 ± 0.1
WAB repetition /10 8.4 ± 0.4 9.4 ± 0.2
WAB naming /10* 8.0 ± 0.3 8.9 ± 0.3
Boston Naming /30 [n=22] 23.8 ± 1.6 (10) 24.2 ± 1.4 (12)
Semantic Fluency /20 [n=26]* 7.4 ± 1.0 (14) 12.6 ± 2.2 (12)
Praxis
WAB praxis /60 [n=27] ¥ 48.7 ± 2.7 (14) 58.0 ± 0.3 (13)
Attention & working memory
Digit span - forward /12 [n=23] 7.1 ± 0.9 (11) 7.0 ± 0.8 (12)
Digit span - backward /12 [n=23] 4.6 ± 1.0 (11) 4.5 ± 0.8 (12)
Visuospatial abilities
Rey Osterieth Complex Figure – Copy /36 [n=20] 12.6 ± 4.1 (9) 20.5 ± 4.1 (11)
Benton Line Orientation /30 [n=21]* 7.3 ± 2.9 (10) 18.6 ± 3.2 (11)
Executive functions
Phonemic fluency (FAS) [n=21] 14.2 ± 2.3 (10) 23.6 ± 4.4 (11)
Trail Making Test A (time in seconds) [n=19] 133.4 ± 27.2 (8) 90.8 ± 14.7 (11)
Trail Making Test B (time in seconds) [n=13] 206.0 ± 43.4 (4) 218.2 ± 55.6 (9)
WCST categories /6 [n=22] 1.6 ± 0.4 (9) 2.0 ± 0.4 (13)
WCST perseverative errors [n=22] 16.9 ± 6.3 (9) 8.2 ± 1.9 (13)
Neuropsychiatric features
Neuropsychiatric Inventory – Total /144 [n=25] 11.8 ± 3.2 (12) 7.9 ± 2.3 (13)
Cornell Depression Scale (%) [n=26] 25.6 ± 4.7 (13) 19.0 ± 2.9 (13)
Functional measures
Disability Assessment for Dementia (DAD; %) [n=26] 70.4 ± 7.7 (13) 79.4 ± 6.8 (13)
DAD-Activities of Daily Living (%) 81.1 ± 8.0 86.8 ± 6.3
DAD-Instrumental Activities of Daily Living (%) 65.2 ± 9.3 73.9 ± 8.1 Table 4. Mean scores (± SEM) on neuropsychological, neuropsychiatric and functional measures in CBS
presenting with apraxia (CBS-APX) vs. those without significant apraxia (CBS-nAPX).
The number of patients (n) tested is listed next to individual measures. Missing data is secondary to the inability of
the patient/caregiver to complete the test. MMSE = Folstein‟s Mini-Mental State Exam; NART = National Adult
Reading Test; MDRS = Mattis Dementia Rating Scale; CVLT = California Verbal Learning Test; WAB = Western

112
Aphasia Battery; FAS = F-, A-, and S-phonemic fluency; WCST = Wisconsin Card Sort Test. Independent samples
t-tests were used to compare MMSE, NART, Clock, MDRS, Boston naming, semantic fluency, visual reproduction,
forward and backward digit span, CVLT, Benton, Trails A and B mean scores between groups. Mann Whitney U
test was used to compare scores on FAS, WAB, Rey and WCST between groups. *p≤0.05; ≦≤0.005
The Western Aphasia Battery (WAB) praxis scores were correlated with WAB total scores
(Spearman‟s rho = 0.52, p<0.01). Furthermore, WAB total scores were significantly lower in the
apraxic compared to the non-apraxic group (81.1 ± 3.8 vs. 91.8 ± 1.9, respectively; Mann-
Whitney U test, p = 0.05; Table 4). This may account for the reduced MMSE scores in the
apraxic group since MMSE is heavily weighted towards language function. In support of this, a
strong correlation was observed between the WAB total and MMSE scores (Spearman‟s rho =
0.77, p<0.0005). Although all WAB subscores tended to be lower in the apraxic group, the
comprehension and naming subscores were significantly worse (Table 4). Figure 2 demonstrates
that CBS patients with apraxia tended to have more severe aphasic disturbances than those
without apraxia consistent with the mean WAB total score differences between the groups. Mean
semantic fluency scores were also lower in the apraxic vs. non-apraxic group (7.4 ± 1.0 vs. 12.6
± 2.2, respectively; t(16) = -2.2, p = 0.05; Table 4). With respect to the SPECT perfusion data, no
significant differences were observed between the apraxic and non-apraxic groups, after
correcting for multiple comparisons.

113
Figure 2. Frequency of different aphasia categories on the Western Aphasia Battery (WAB) distributed
according to the CBS group with apraxia versus those with borderline/no apraxia.
4.4.1.6 Perfusion versus ideomotor apraxia
The SPECT scans were, on average, acquired within 3.9 ± 1.4 weeks of the neuropsychological
assessment including the WAB praxis measurement. Severity of IMA was positively correlated
with perfusion in the left inferior parietal lobule, including the left angular gyrus (i.e., WAB
praxis scores decrease as perfusion decreases). This was seen on the FWE- and FDR-corrected
maps shown in Figure 3 (see Table 5 for details). There were no negative correlations or areas of
relative hyperperfusion observed in association with the praxis measure. The use of the „body
side most affected‟ covariate did not significantly change the results.

114
Anatomical locus
(Brodmann area)
Talairach
Coordinates
No. of
voxels
SPM t-score
(p-value)
ROI
x y z
Parietal region – SPM (FWE-corr)
Left angular gyrus (39) -42 -70 31 46 5.7 (p=0.02) Yes
Left inferior parietal lobule (40) -50 -52 47 59 5.7 (p=0.03) Yes
Parietal region – SPM (FDR-corr)
Left inferior parietal lobule (39) -44 -64 38 632 5.3 (p=0.01) Yes Table 5. Areas of hypoperfusion on SPECT in the CBS group that correlate with WAB praxis scores in the
regression analyses.
„Body side most affected‟ was included as a covariate in both Statistical Parametric Mapping (SPM) and Region of
Interest (ROI) analyses. All p-values were corrected for multiple testing in SPM analysis using Family Wise Error
(FWE-corr) and False Discovery Rate (FDR-corr), and in ROI analysis within a general linear model. Column
denoted ROI refers to overlapping regions of decreased perfusion between the SPM and ROI analyses.

Figure 3. Statistical parametric map of surface regions of the brain showing decreased perfusion in the left inferior parietal region, including the
angular gyrus, that correlate with WAB praxis scores in the regression analyses.
These have been overlaid on the „Collin‟ brain MRI template. Red areas are corrected for multiple testing using the False Discovery Rate, while green areas are
corrected using the more conservative Family Wise Error method. Refer to text and Table 5 for details of analysis and results

ROI analysis was also performed to serve as an independent confirmation of the SPM result.
Pearson correlation analysis revealed a significant positive correlation between perfusion in the
left inferior parietal ROI (comprised of left angular and supramarginal gyri) and WAB praxis
scores (r = 0.64, p < 0.001). To gauge the independent contribution of perfusion within the left
inferior parietal region in predicting WAB praxis scores and to control for the potential bias of
symptom lateralization in CBS, we conducted a hierarchical regression analysis with stepwise
variable entry. In this model, perfusion in the left inferior parietal region and „most affected side
of body‟ served as the independent predictors. WAB praxis scores represented the dependent
variable. These results were similar to the SPM analysis. Specifically, reduced perfusion in the
left inferior parietal region significantly predicted reduced performance on the WAB praxis scale
accounting for 42% of the variance in the relationship (F[1, 25] = 17.7, R2 = 0.42, p < 0.001).
„Body side most affected‟ did not enter into the overall model as significant.
To further explore the relationship between perfusion and praxis performance, separate SPM
regression analyses were conducted using individual subscores on the WAB praxis scale. No
individual WAB praxis subscores, including intransitive, transitive, bucco-facial, or complex
gestures, correlated with hypoperfusion or hyperperfusion after correction for multiple testing. In
an exploratory analysis set out to better delineate neural components of the praxis network, the
stringency of the SPM analyses was subsequently reduced by setting the threshold voxel level p-
value to <0.001, uncorrected. Intransitive gesture scores demonstrated correlation with reduced
perfusion in more posterior regions including the left inferior occipital, fusiform, and lingual
gyri, as well as the left and right superior parietal lobules. Transitive gesture scores were
associated with reduced perfusion in angular and supramarginal gyri, the superior parietal lobule,

117
the precentral and postcentral gyri, and the inferior occipital gyrus all located only within the left
hemisphere. Complex gesture scores were correlated with the same left posterior regions as in
the transitive gesture regression; however, more left anterior regions demonstrated reduced
perfusion including the superior and middle frontal gyri. Finally, bucco-facial gestures were
correlated with hypoperfusion in the left inferior and middle frontal gyri as well as the left
precentral gyrus.
4.4.1.7 Post-hoc atrophy analysis
The average tissue type in the FWE-corrected SPM mask was found to be: 50% in white matter,
37% in grey matter, and 13% in CSF. Similar results were obtained with the FDR-corrected SPM
mask (white matter: 51%; grey matter: 35%; and CSF: 14%). Please refer to Supplementary
Figure 1.
4.5 Discussion
To our knowledge, this is the first brain SPECT study demonstrating that perfusion in the left
inferior parietal lobule is significantly correlated with severity of IMA in CBS. This result was
identified using a whole brain voxel-by-voxel SPM regression analysis that accounted for
multiple comparisons and was corroborated by a region of interest linear regression analysis.
Left inferior parietal atrophy, that is, the effect of partial volume averaging, is unlikely to be a
major contributor to this result based on the estimate that approximately 85% of the tissue
underlying the hypoperfused region was classified as brain parenchyma.

118
Several models of apraxia have emerged in the literature based on original case studies and
series, and the majority of these implicate a role of the left parietal lobe [Geschwind
1975;Goldenberg 2009;Heilman and Rothi 1993;Liepmann 1920;Roy 1996]. Several animal and
human studies have attempted to identify the underlying neural substrates of IMA.
Neuroanatomical and electrophysiological studies in monkeys demonstrate the importance of the
parietofrontal circuit in transforming visual and tactile sensory information into knowledge for
limb movements [Leiguarda and Marsden 2000]. A functional MRI study of pantomiming use of
tools in healthy adults implicated the dominant, left intraparietal and dorsolateral frontal cortices
suggesting that these regions may be important in determining ideomotor praxis [Moll et al.
2000]. Lesional studies also confirm the role of the left hemisphere in apraxia, in particular the
inferior parietal and premotor/supplementary motor areas [Gross and Grossman 2008;Leiguarda
and Marsden 2000;Stamenova et al. 2009]. The majority of these studies have included patients
with strokes and CBS [Buxbaum et al. 2007;Goldenberg and Spatt 2009;Jacobs et al.
1999;Kertesz and Ferro 1984].
The main types of limb apraxia identified in CBS are IMA, limb-kinetic apraxia and, less often,
conceptual/ideational apraxia [Gross and Grossman 2008;Stamenova et al. 2009;Zadikoff and
Lang 2005]. Limb-kinetic apraxia (LKA; loss of hand and finger dexterity resulting in a
breakdown and awkwardness of distal movements) [Kleist 1907] is thought to reflect sensory-
motor control dysfunction [Liepmann 1920]. In CBS and in one study of pathologically-proven
corticobasal degeneration (CBD), it has been associated with involvement of the ventral

119
premotor cortex bilaterally, although worse on the side contralateral to the LKA deficit
[Leiguarda et al. 2003;Tsuchiya et al. 1997;Zadikoff and Lang 2005]. Conceptual/ideational
apraxia, defined in this paper as impairment in object/tool or action knowledge, has been less
well studied in CBS [Stamenova et al. 2009]. We summarized data across nine studies that
looked for both ideomotor and conceptual/ideational apraxia in CBS, and approximately 27%
(30/112) of CBS patients demonstrated a conceptual deficit [Chainay and Humphreys
2003;Graham et al. 1999;Jacobs et al. 1999;Kertesz et al. 2000b;Leiguarda et al. 1994;Pillon et
al. 1995;Soliveri et al. 2005;Spatt et al. 2002;Stamenova et al. 2011]. There was a high degree of
variability in the occurrence of conceptual/ideational apraxia with several studies demonstrating
no conceptual deficit [Chainay and Humphreys 2003;Graham et al. 1999;Jacobs et al.
1999;Pillon et al. 1995;Soliveri et al. 2005;Stamenova et al. 2011], while three studies
demonstrated frequencies ranging from 30% to 60% [Kertesz et al. 2000b;Leiguarda et al.
1994;Spatt et al. 2002]. It is likely that these discrepancies across the studies occurred as a result
of differences in definition of this apraxia type, diagnostic heterogeneity, and/or methodological
differences in the assessments utilized. In terms of anatomical localization, conceptual
knowledge of tool use and action has been suggested to reside in the left inferior parietal lobule
[Heilman et al. 1982], and this was later shown to be restricted to mechanical knowledge
[Ochipa et al. 1992]. In contrast, semantic knowledge on the prototypical use of tools has been
shown to localize to the left temporal lobe [Hodges et al. 1999].
More recently, two studies have directly correlated structural changes on MRI to standardized
measures of ideomotor praxis in CBS [Borroni et al. 2008b;Huey et al. 2009b]. In 20 patients
with CBS, the first of these studies demonstrated a significant positive correlation between total

120
score on the de Renzi test of praxis and grey matter density in the bilateral parietal operculum
[Borroni et al. 2008b]. Using a pre-specified hypothesis, they also found that total scores
positively correlated with fractional anisotropy in the left dorsolateral parietofrontal associative
fibers on diffusion tensor imaging [Borroni et al. 2008b]. A smaller study of 16 patients with
progressive non-fluent aphasia including three with CBS found that limb apraxia as assessed by
the Apraxia Battery for Adults-2 (ABA-2) correlated with loss of gray matter volume in the left
inferior parietal lobe [Rohrer et al. 2010b]. Notwithstanding important differences between these
studies and our current one (e.g., imaging modalities, praxis assessment tools, and diagnostic
heterogeneity), consistent findings are that the left hemisphere is invariably involved in IMA and
that the majority of studies identify the dominant inferior parietal lobule as an important
neuroanatomical correlate. From our structural MRI analysis, approximately 50% of the tissue
underlying the hypoperfused left inferior parietal region was white matter while approximately
35% was grey matter. These findings support those of Borroni et al. [Borroni et al. 2008b]
suggesting the importance of underlying white matter disease (either perfusion abnormalities or
loss of white matter tract integrity) as a potential contributor to IMA in CBS. The current finding
is also consistent with contemporary theories of apraxia previously described as well as a
correlational study using the subtraction method of lesion overlap in stroke, in which the critical
area of overlap in apraxic compared to non-apraxic patients was in the centrum semiovale deep
to the parietal cortex including the long association tracts, such as the superior longitudinal and
frontal occipital fasciculi [Roy et al. 1998].
Given that a deficit in tool or action knowledge (i.e., ideational/conceptual apraxia) is an
uncommon finding in CBS, why do our results demonstrate such a strong association between

121
hypoperfusion in the left inferior parietal lobule where the purported „praxicons‟ are thought to
reside, and IMA as assessed by the WAB praxis scale? The reason, in part, may be the result of
what the WAB praxis assessment tool is actually evaluating. Although the total score on the
WAB praxis scale best represents severity of IMA, the score in patients with more severe
impairment is partly accounted for by failure of actual tool use, which reflects a conceptual
deficit. The definition of conceptual/ideational apraxia has also been variable from study to study
resulting in some degree of phenomenological/taxonomic confusion. Some studies distinguish
between ideational apraxia defined as a failure to sequence tasks related to tool use correctly and
“conceptual apraxia” defined (as in this paper) as a loss of knowledge relating to tool and action
use. Given the common feature of tool use across different assessments of apraxia (ideomotor,
conceptual and ideational), it is likely that there will be some degree of overlap in the brain
regions most correlated with deficits across the studies.
An alternative way of putting our finding into context is to explain the association of left inferior
parietal lobule hypoperfusion with IMA in CBS as being related to the dysfunction of a larger
circuit or network that is involved in determining both simple and more complex gestural
movements. Indeed, when we reduce the stringency of our analysis and examine different
subcomponents of the WAB praxis assessment, a larger network emerges. For example,
performance of transitive gestures correlate with hypoperfusion predominantly in the entire left
parietal lobe (inferior and superior divisions) as well as within the left sensorimotor cortex. In
examining complex gestures, the same regions are implicated; however, hypoperfusion extends
into the left premotor and supplementary motor areas as well. These results suggest that
performance of transitive and more complex gestures is more strongly linked to left hemispheric

122
function [Kroliczak and Frey 2009]. Based on our hypoperfusion results in this CBS sample, it is
plausible that as gestures performed by healthy individuals increase in complexity more of the
left parietofrontal network is recruited to carry out the task. Although the reduced stringency of
this SPECT-WAB praxis subscore regression analysis increases the chances that the more
extensive area shown is a false positive result, prior studies have shown that it is acceptable to
use an uncorrected p-value of <0.005 in correlational analyses with SPM in a sample of this size
[Desgranges et al. 1998;Kas et al. 2011].
A large voxel-based morphometry study of 48 patients with CBS demonstrated that gray matter
volume loss in the left middle frontal and precentral gyri as well as the left caudate nucleus
correlated with reduced performance on the Test of Oral and Limb Apraxia (TOLA) [Huey et al.
2009b]. To some extent, these data are at odds with the results of the current study and we
propose as one possible explanation for this discrepancy that atrophy on MRI in the left frontal-
subcortical grey matter and hypoperfusion in the left inferior parietal lobule may each account
for unique variance associated with IMA severity in CBS. We did not look at volumetric
correlations and Huey et al. [Huey et al. 2009b] did not examine perfusion/metabolism so further
studies will be necessary to confirm this hypothesis. Another possible explanation for these
discrepant findings is diagnostic heterogeneity between the two studies. A prior study has shown
that patients with posterior lesions or fluent aphasia have a more severe form of apraxia –
including both ideomotor and conceptual/ideational types – than patients presenting with more
anterior lesions or non-fluent aphasia [Heilman et al. 1982]. Since about 67% of our sample
presented with early cognitive problems with the apraxic group having lower scores on the WAB
and more severe forms of aphasia compared to the borderline/non-apraxic group, then this might

123
be one possible explanation for the discrepant findings. Although Huey et al. [Huey et al. 2009b]
did not specify the proportion of their sample presenting with early cognitive symptoms or
aphasia, scores on the Mattis DRS were comparable (Huey et al.: 116/144 vs. current: 114/144)
indicating a similar degree of global cognitive impairment in the two patient samples. Huey et al.
[Huey et al. 2009b] did not include any specific assessments of aphasia so we were not able to
compare the samples in this regard. The most affected side of the body was also similar between
samples as well (Huey et al.: 46% right-sided vs. current: 52% right-sided).
We further subdivided our sample into those with and without significant apraxia based on a -2
SD cut-off from controls (i.e. WAB praxis score ≤ 56.1). Our WAB praxis cut-off score was
higher than that of ≤ 49.7 used in one of the earliest studies of IMA in stroke patients [Kertesz
and Ferro 1984]. The control group in this original study was derived from non-brain injured
hospitalized patients, whereas our control group were healthy, elderly volunteers who were
living in the community. It is conceivable that the „non-brain‟ medical conditions or drug
therapies of the control group of Kertesz & Ferro [Kertesz and Ferro 1984] might have affected
their overall cognitive performance on the WAB praxis task.
In our stratified analysis, several interesting observations were made. As expected, given that
both language and praxis are most often lateralized to the dominant left hemisphere and are
represented in overlapping neuroanatomical networks, apraxic patients demonstrated
significantly lower WAB total scores and had more severe forms of aphasia than the
borderline/non-apraxic group. Comprehension difficulties and anomia were significantly more

124
pronounced in the apraxic group in addition to an observed reduction in semantic fluency. This
suggests more left temporal lobe involvement in the apraxic group. Visuospatial orientation and
attention were also significantly worse in the apraxic group as evidenced by lower Benton
judgement of line orientation scores indicating more prominent right parieto-occipital
dysfunction. We have previously shown that performance on the Benton line orientation task
correlated with reduced perfusion of the right parietal lobe in Alzheimer‟s disease of varying
severity [Tippett and Black 2008]. The parietal lobes are prominently affected by the underlying
pathology in CBS [Wadia and Lang 2007] and although the neurodegenerative process usually
starts asymmetrically, it progresses relentlessly to involve bilateral structures. Indeed in the
current study, there was a significant correlation between performance on the WAB praxis and
Benton line orientation task with even stronger correlations observed between perfusion of left
and right parietal regions (data not shown) supporting our finding.
An unexpected finding was that the apraxic group demonstrated lower scores on the Wechsler
Memory Scale-Revised (WMS-R) delayed visual reproduction task than the non-apraxic group.
This finding could not be accounted for by the severity of the apraxia alone. In humans and in
monkeys, two pathways have been identified for the processing of visual information: the
occipitotemporal pathway or ventral stream and the occipitoparietal pathway or dorsal stream
[Ungerleider et al. 1998]. The ventral visual stream is important for object vision including
characteristics such as pattern, shape and colour, while the dorsal visual stream is important for
spatial perception (e.g., judging distance and orientation of objects relative to each other) and
also is involved in visually guided reaching [Goodale and Milner 1992;Ungerleider et al. 1998].
The visual reproduction task asks subjects to examine four drawings of several geometric figures

125
oriented in space in relation to each other, each for ten seconds. After a ten second (immediate
visual reproduction) and 30 minute delay (delayed visual reproduction) they are asked to draw
the four pictures from memory. Scoring is based on the ability to accurately recall the shapes and
patterns as well as the distance and orientation in relation to each other thereby taxing both the
ventral and dorsal visual streams, respectively [Lezak 1983;Wechsler 1987]. A BOLD fMRI
study in healthy volunteers demonstrated that activity in the posterior parietal cortex bilaterally is
strongly correlated with the capacity limit to store visual information (i.e., visual short-term
memory) [Todd and Marois 2004]. We hypothesize that the poor performance of the apraxic
group on delayed visual reproduction may be due to involvement of the posterior parietal cortex
within the dorsal visual stream, a network which also overlaps with the frontoparietal praxis
system.
In the SPECT analyses of all CBS cases versus controls, there was reduced perfusion noted in
bilateral dorsolateral and medial frontal/prefrontal regions, as well as bilateral parietal regions in
the CBS group. Additionally, reduced perfusion was also evident to a lesser degree in right
temporal regions and insula. Our results confirm in a larger sample, previous SPECT studies of
CBS demonstrating reduced perfusion in frontoparietotemporal regions [Hossain et al.
2003;Koyama et al. 2007;Markus et al. 1995;Okuda et al. 1999;Okuda et al. 2000b;Zhang et al.
2001]. We further investigated whether perfusion reductions tended to be lateralized opposite to
the most affected side of the body by comparing CBS-L and CBS-R to their respective control
groups. In CBS-L, the regions of hypoperfusion localized to the right hemisphere including
dorsolateral prefrontal cortex, primary somatosensory cortex, superior parietal lobe and some
temporal regions. In contrast, the CBS-R group demonstrated reduced perfusion only in the left

126
inferior frontal gyrus in the ROI analysis. However, when the stringency of the SPM analysis
was lowered, hypoperfusion in the left frontoparietal region was seen in the CBS-R group.
Overall, then, our study confirms a lateralization of perfusion defects contralateral to the most
affected side of the body in CBS.
Strengths of the present study include ascertainment of CBS cases from both cognitive and
movement disorders clinic, use of standardized neuropsychological assessments including a
language battery, use of brain SPECT perfusion that attempted to account for effects of
underlying atrophy on MRI, and the combined approach of an unbiased, whole brain voxel-by-
voxel analysis followed by confirmation using a more robust region of interest method. Although
the CBS sample size was relatively large considering the rarity of this diagnosis, from a
statistical perspective it is indeed a small sample. Although we did not have pathological
confirmation of CBD diagnosis on the entire sample, 25% of the sample came to autopsy with
pathological confirmation of CBD in 63% of cases (5/8 cases; unpublished data); this rate of
diagnostic accuracy is similar to prior studies [Wadia and Lang 2007]. Other pathologies
included PSP (12.5%; 1/8 cases), FTLD-U/TDP43 proteinopathy (12.5%; 1/8 cases), and
combined dementia with agyrophilic grains, CBD and cerebral amyloid angiopathy
(AGD/CBD/CAA; 12.5%; 1/8 cases). Other limitations include a cross-sectional design and
assessment of predominantly IMA. Furthermore, we only had volumetric MRI data on 21 of the
27 patients who had WAB and SPECT completed. Therefore, we were unable to estimate the
degree of atrophy underlying the SPM mask in these six patients. However, qualitative visual
examination of their MRI data did not reveal any tendency for the apraxic subgroup to have more
left parietal atrophy than the non-apraxic subgroup. Another limitation is that the WAB praxis

127
measure does not provide a full picture of the nature of the disruption to limb praxis since it
confounds pantomime, imitation and tool use. The same limitation also applies to the ABA-2 and
de Renzi apraxia tests used in the other studies [Borroni et al. 2008b;Rohrer et al. 2010b].
This study suggests that severity of left inferior parietal lobule hypoperfusion corresponds to
IMA as it becomes more severely affected in CBS supporting a central role for this structure in
the dominant hemisphere frontoparietal praxis network. Dysfunction in language, visuospatial
and visual memory performance is more frequent in CBS patients with apraxia due to
involvement of overlapping brain networks that subserve these related higher cognitive
processes. Future work will involve use of a comprehensive assessment of apraxia using a
conceptual model [Stamenova et al. 2011] together with SPECT and MRI imaging modalities in
order to better identify the neuroanatomical correlates of the different apraxia types.
4.6 Acknowledgements
This work was supported by an operating grant from the Canadian Institutes of Health Research
[MT13129 to S.E.B.] and a New Investigator Award from the Parkinson Society Canada [2011-
19 to M.M.]. M.M. was supported by a Canadian Institutes of Health Research Clinician
Scientist Award. We thank the patients and their families for the time and effort that they
committed to participate in this study.

128
Supplementary Figure 1A. Mean proportion of different MRI tissue classes underlying the FWE-corrected
SPM mask.
Error bars denote standard deviation.

129
Supplementary Figure 1B. Mean proportion of different MRI tissue classes underlying the FDR-corrected
SPM mask.
Error bars denote standard deviation.

Group Anatomical locus
(Brodmann area)
Talairach
Coordinates
No. of
voxels
SPM t-score
(p-value) or
x Y z ROI F-score
(p-value)
CBS-all Frontal regions – SPM
vs. Right middle frontal gyrus (6) 48 8 44 10972 5.7 (p=0.003)
controls Right superior frontal gyrus (10) 30 56 23 184 4.2 (p=0.005)
Right inferior frontal gyrus (47) 44 17 -3 225 4.0 (p=0.006)
Left superior frontal gyrus (6) -18 9 68 10972 5.3 (p=0.003)
Left superior frontal gyrus (8) -8 43 48 48 3.6 (p=0.008)
Left precentral gyrus (44) -52 12 3 100 3.7 (p=0.007)
Frontal regions – ROI
Left middle frontal gyrus - dorsal - - - 1740 3.5 (p=0.04)
Left inferior frontal gyrus - dorsal - - - 1105 8.0 (p=0.001)
Left anterior cingulate - middle - - - 623 4.8 (p=0.01)
Right precentral gyrus - - - 2723 3.4 (p=0.04)
Right inferior frontal gyrus - dorsal - - - 1128 5.8 (p=0.005)
Parietal regions – SPM
Left superior parietal lobule (7) -32 -55 60 10972 5.0 (p=0.003)
Right postcentral gyrus (2) 50 -25 42 1246 4.6 (p=0.004)
Right inferior parietal lobule (40) 65 -24 29 1246 4.0 (p=0.006)
Right angular gyrus (39) 50 -74 33 57 3.8 (p=0.007)
Parietal regions – ROI
Left postcentral gyrus - - - 2675 3.4 (p=0.04)
Right superior parietal lobule - - - 2132 3.3 (p=0.05)
Right supramarginal gyrus - - - 1295 3.3 (p=0.05)
Limbic regions – SPM
Right cingulate (24) 4 -8 41 107 3.9 (p=0.006)
8 8 35 107 3.4 (p=0.01)
Left cingulate (24) 0 -12 41 52 3.7 (p=0.007)
Temporal regions – SPM
Right middle temporal gyrus (21) 71 -45 2 138 3.8 (p=0.006)
Right fusiform gyrus (37) 42 -44 -15 34 3.7 (p=0.007)
Temporal regions – ROI
Right superior temporal gyrus lateral - - - 1473 3.5 (p=0.04)
Other regions – ROI
Right insula - - - 1973 4.9 (p=0.01)

131
CBS-L Frontal regions – SPM
vs. Right superior frontal gyrus (6) 28 -3 67 2331 5.4 (p=0.008)
controls Right middle frontal gyrus (6) 48 8 44 2331 5.7 (p=0.008)
Right inferior frontal gyrus (47) 46 17 -1 1300 5.3 (p=0.008)
Left superior frontal gyrus (6) -18 4 70 122 4.9 (p=0.008)
Frontal regions - ROI
Right superior frontal gyrus - dorsal - - - 1984 3.4 (p=0.05)
Right precentral gyrus - - - 2723 7.3 (p=0.003)
Left anterior cingulate - middle - - - 623 4.0 (p=0.03)
Parietal regions - SPM
Right postcentral gyrus (1) 36 -36 66 2331 5.7 (p=0.008)
Right postcentral gyrus (2) 46 -27 40 22 4.2 (p=0.009)
Right superior parietal lobule (7) 24 -71 57 192 4.7 (p=0.008)
Temporal regions - SPM
Right transverse temporal gyrus (41) 50 -23 12 1300 4.8 (p=0.008)
Right superior temporal gyrus (22) 59 -6 4 1300 4.6 (p=0.008)
Temporal regions - ROI
Right middle temporal gyrus lateral - - - 1962 4.5 (p=0.02)
Limbic – ROI
Right insula - - - 1973 6.0 (p=0.007)
CBS-R Frontal regions – ROI
vs. Left inferior frontal gyrus - dorsal - - - 1105 6.2 (p=0.006)
controls Supplementary Table 1. Areas of hypoperfusion on SPECT in all CBS patients, CBS with left side of body
most affected, and CBS with right side of body most affected relative to controls.
CBS-all; n=31 cases and 31 matched, normal controls; refer to Figure 2A
CBS-L; n=15 cases and 15 matched, normal controls; refer to Figure 2B
CBS-R; n=16 cases and 16 matched, normal controls
„Years of education‟ was included as a covariate in both Statistical Parametric Mapping (SPM) and Region of
Interest (ROI) analyses. All p-values were corrected for multiple testing in SPM analysis using False Discovery Rate
(FDR), or included in ROI analysis within a general linear model multivariate ANCOVA.

132
5.0 Clinical, neuropsychological, MRI and SPECT
characterization of a prospective sample of patients with
corticobasal syndrome
Mario Masellis, Philip L. Francis, Isabelle Guimont, Wendy Galpern, Juan Bilbao, Kie Honjo,
Fuqiang Gao1, Gregory Szilagyi, Farrell Leibovitch, James L. Kennedy, Galit Kleiner-Fisman,
Lisa Ehrlich, Robert Chen, Anthony E. Lang, Sandra E. Black
Mario Masellis clinically assessed several of the patients included in this study, extracted the
clinical information, designed the study, performed the data analysis and wrote the manuscript.
Philip Francis assisted with the SPM analysis of SPECT data and Kie Honjo assisted with an
independent visual read of the MRI data. Wendy R. Galpern, Galit Kleiner-Fisman and Anthony
E. Lang assessed and collected clinical data on patients ascertained from a movement disorders
clinic. Juan Bilbao performed the neuropathological analysis.

133
5.1 Abstract
Corticobasal syndrome (CBS) is a rare and debilitating syndrome characterized by the unique
combination of lateralized cortical and extrapyramidal features that occurs due to a variety of
underlying neurodegenerative pathologies. In this paper, we describe the initial
neuropsychological, MRI and SPECT imaging profile of a prospective series of 31 consecutive
CBS patients ascertained from a movement disorders and a cognitive neurology clinic. The
sample was stratified into CBS presenting with early dementia (CBS-D; n=22) vs. early motor
features (CBS-M; n=9), which identified that CBS-M had a higher occurrence of cortical sensory
loss than CBS-D (100% vs. 45.5%, respectively; p=0.005). Conversely, the presence of aphasia,
as determined by the Western Aphasia Battery, was found to be more common and severe in
CBS-D compared to CBS-M (88.2% vs. 33.3%, respectively; p=0.02). These findings are
associated with lateralization of the motor signs to the right side in CBS-D. CBS-D also
demonstrated more difficulties with simple attention span and visuospatial orientation/attention
on neuropsychological testing. Atrophy patterns on MRI did not distinguish between CBS-D and
CBS-M. However, CBS-M patients had significantly reduced perfusion in the right
supplementary and premotor areas compared to CBS-D (p<0.05). A subset of eight patients was
followed to autopsy with 7 patients having a tauopathy and 1 patient exhibiting non-tau
pathology, specifically, frontotemporal lobar degeneration-ubiquitin/TDP43 proteinopathy
(FTLD-U/TDP43). Atrophy and white matter changes on MRI correlated with the burden of
underlying brain pathology. This study emphasizes the importance of performing detailed
clinical and multimodal phenotyping to characterize heterogeneity in CBS. It also provides new
insights into the neuropsychological and neuroimaging correlates of lateralized brain dysfunction
in the syndrome.

134
5.2 Introduction
The first description of corticobasal syndrome (CBS) was in 1967 by Rebeiz and colleagues who
later characterized three cases of this syndrome from the clinical and pathological perspective
[Rebeiz et al. 1967;Rebeiz et al. 1968]. The scientific literature on this topic was sparse until the
late 1980s and early 1990s during which there were several case series published characterizing
the unique clinical features of CBS [Gibb et al. 1989;Mahapatra et al. 2004;Riley et al.
1990;Rinne et al. 1994]. Since then, much has been learned about the clinical, neuroimaging,
genetic and pathological heterogeneity of this enigmatic disorder.
The clinical diagnosis of CBS is made based on an insidious onset and progressive neurological
decline including at least one cortical (e.g., apraxia, non-fluent aphasia/apraxia of speech,
cortical sensory loss, myoclonus, alien limb phenomenon) and one extrapyramidal feature (e.g.,
rigidity, dystonia), which is not attributable to any other identifiable cause of brain dysfunction
[Boeve et al. 2003]. However, there have been no formally accepted, consensus clinical
diagnostic criteria [Mahapatra et al. 2004]. There are two main early clinical presentations of
CBS. The first is the “classical” perceptuo-motor disorder without early dementia, which often
presents to movement disorders clinics. The second subtype presents with an early dementia
occurring along the spectrum of frontotemporal lobar degeneration (FTLD), most commonly the
behavioural variant of frontotemporal dementia (bvFTD) or progressive non-fluent aphasia
(PNFA). This subtype is most likely to present first to dementia clinics. There is evidence
suggesting that early dementia is the more frequent initial presentation of CBS [Bergeron et al.
1998;Grimes et al. 1999b;Mathuranath et al. 2000] yet, because the initial symptoms may be

135
non-specific, the movement disorder presentation is easier to recognize. This may have created a
referral bias in CBS research particularly in many of the early studies, which ascertained patients
predominantly from movement disorders clinics. Several studies have overcome this bias by
examining patients with both types of presentations [Josephs et al. 2008;Kertesz et al.
2000b;Kertesz et al. 2005;McMonagle et al. 2006;Murray et al. 2007;Riley et al. 1990]. Few
studies, however, have directly compared CBS patients presenting with early motor vs. early
dementia features [Josephs et al. 2008;Kertesz et al. 2000b;McMonagle et al. 2006], and, to our
knowledge, no studies have investigated whether perfusion SPECT can help differentiate
between these two subtypes of CBS.
Both structural and functional neuroimaging studies may support a diagnosis of CBS. Early MRI
studies have demonstrated asymmetrical cortical atrophy in frontoparietal regions and,
frequently, subcortical white matter T2/FLAIR hyperintensities contralateral to the most affected
side of the body [Riley et al. 1990;Savoiardo et al. 2000;Soliveri et al. 1999;Tokumaru et al.
1996;Winkelmann et al. 1999]. These initial findings have been confirmed by more recent MRI
studies in larger patient cohorts [Boxer et al. 2006;Groschel et al. 2004;Grossman et al.
2004;Josephs et al. 2008;Koyama et al. 2007;Taki et al. 2004;Yekhlef et al. 2003]. Sawle et al.
[Sawle et al. 1991] using PET to measure regional cerebral oxygen metabolism were the first to
demonstrate that patients with CBS have hypometabolism predominantly in the posterior and
superior temporal, inferior parietal, and occipital (association) cortices; frontal association
regions also demonstrated reduced metabolism although they did not achieve statistical
significance. This pattern of hypometabolism tended to be asymmetric, being more prominent
contralateral to the most affected side of the body. This frontoparietotemporal pattern of reduced

136
activity has been confirmed by other studies employing 18-fluoro-deoxyglucose (18-FDG)-PET
[Blin et al. 1992;Coulier et al. 2003;Eidelberg et al. 1991;Garraux et al. 2000;Hosaka et al.
2002;Juh et al. 2005;Klaffke et al. 2006;Laureys et al. 1999;Nagahama et al. 1997;Nagasawa et
al. 1996;Taniwaki et al. 1998;Yamauchi et al. 1998a] and perfusion tracers (HMPAO, ECD and
IMP) using SPECT [Hossain et al. 2003;Koyama et al. 2007;Markus et al. 1995;Okuda et al.
1999;Okuda et al. 2000b;Zhang et al. 2001]. Several of these studies also demonstrated reduced
asymmetric activity in the basal ganglia and thalamus contralateral to the most affected side of
the body. Reduced dopamine transporter binding of TRODAT [Lai et al. 2004] and β-CIT
[Pirker et al. 2000;Plotkin et al. 2005] in the basal ganglia has also been demonstrated in CBS.
It is critically important to follow patients longitudinally to ensure that clinical criteria for CBS
have been met, as the neurological features of the full syndrome may not be present at onset, but
may develop over time. This was eloquently shown in a longitudinal, prospective cohort of
patients with initial diagnoses ranging from bvFTD, CBS, Progressive Supranuclear Palsy (PSP)
to PNFA, the majority of whom then went on to develop second and/or third syndromes with
significant clinical overlap along the FTLD spectrum [Kertesz et al. 2005;McMonagle et al.
2006]. In addition to the clinical heterogeneity in presentation and evolution of CBS, there is also
significant pathological heterogeneity [Lee et al. 2011] leading some to propose the term „Pick
Complex‟ to encompass the varying pathologies occurring along this disease spectrum [Kertesz
et al. 2000b]. Given this pathological heterogeneity, prospective, longitudinal studies that follow
patients with CBS to autopsy are required in order to obtain a more accurate estimate of the
neuropathological substrates of this rare syndrome.

137
Our prior study provided the initial characterization of a prospectively recruited sample of CBS
cases vs. controls in terms of demographics, clinical, and SPECT imaging features and identified
that perfusion within the left inferior parietal lobule correlated with a measure of ideomotor
apraxia (chapter 4). The purpose of the current study using this sample was threefold: 1) to
describe the initial standardized neuropsychological and neuropsychiatric, and MRI
(qualitatively) profile of a prospective cohort of 31 CBS patients ascertained from either a
movement disorders or a cognitive neurology clinic; 2) to compare the clinical,
neuropsychological/neuropsychiatric, MRI, and, in particular, SPECT imaging features of CBS
patients presenting with early dementia vs. early motor symptoms; and 3) to identify the
underlying neuropathological substrates in a subset of this sample who came to autopsy. Novel
aspects of this study include the comparison of SPECT perfusion measures in the early motor vs.
early dementia subgroups and also the integration of clinical, neuropsychological, MRI, SPECT,
and pathological data, whenever possible. This study is also unique in that it used two different
techniques to analyze the SPECT data, namely, region of interest analysis and statistical
parametric mapping (SPM).
5.3 Methods
5.3.1 Subjects:
31 subjects with a clinical diagnosis of CBS according to proposed diagnostic criteria [Boeve et
al. 2003] were recruited consecutively through two academic clinics as previously described
(chapter 4). They were matched to 31 normal healthy controls as closely as possible with respect

138
to age, sex, and years of education. CBS subjects and controls were ascertained and followed as
part of the Sunnybrook Dementia Study, a prospective, longitudinal study of dementia and
ageing, approved by the local Research Ethics Board. Participants or their substitute decision
makers provide written, informed consent to participate in accordance with the Declaration of
Helsinki. All subjects underwent detailed clinical evaluations including: history, general and
neurological physical exam, routine laboratory investigations, and standardized behavioural
neurology assessment [Darvesh et al. 2005]. The side of greatest rigidity and/or apraxia defined
the motor-onset of symptoms. Patients were seen every 6 months for routine clinical follow-up
and had yearly prospective, longitudinal assessments which included: standardized measures of
neuropsychological performance, neuropsychiatric symptoms and functional status. Structural
and functional neuroimaging of the brain with MRI and SPECT were also performed annually.
Additional inclusion criteria were: age between 40 and 90 years, have a knowledgeable
caregiver, minimum educational attainment of grade 6 and fluent in English. Their SPECT and
neuropsychological evaluations needed to be completed within three months of each other.
Exclusion criteria were: presence of secondary/reversible causes of dementia that were untreated,
concomitant neurological or psychiatric illness/substance use and abuse, including clinically
relevant depression, history of significant head trauma, early vertical gaze palsy, rest tremor,
autonomic disturbances, sustained responsiveness to levodopa, and lesions on neuroimaging
suggesting another pathological condition.

139
5.3.2 Neuropsychological, neuropsychiatric and functional measures:
Neuropsychological tests assessing general intelligence and cognition included Folstein‟s Mini-
Mental State Examination (MMSE) [Folstein et al. 1975]; Mattis Dementia Rating Scale (DRS),
which ranges from 0 to 144, with lower scores representing more impairment [Mattis 1976];
Clock Drawing Test, which ranges from 0 to 10, with lower scores representing more
impairment [Rouleau et al. 1992]; the National Adult Reading Test-Revised (NART-R), which
provides a measure of premorbid verbal intelligence [Blair and Spreen 1989], and Raven‟s
Progressive Matrices, which provides a measure of premorbid non-verbal intelligence [Raven
1947]. Tests assessing learning and episodic memory included the California Verbal Learning
Test (CVLT), which assesses verbal memory [Delis et al. 1987], while the visual reproduction
subtest of the Wechsler Memory Scale-Revised (WMS-R) assesses visual memory [Lezak 1983].
Measures of language function and naming included: the Boston Naming Test (BNT), which is
scored out of 30 with lower scores representing more impairment [Williams et al. 1989];
semantic/categorical fluency [Gladsjo et al. 1999]; and the comprehension subscale of the
Western Aphasia Battery (WAB) [Kertesz and Poole 1974]. Initially, the full WAB was given to
all patients, but in the last few years it has only been administered if there is anomia detected on
the BNT. The WAB calculates an aphasia quotient based on combined subscores of fluency,
content, comprehension, repetition and naming, with a maximum score of 100 and lower scores
represent more severe impairment [Kertesz and Poole 1974]. Ideomotor praxis was assessed
using the WAB praxis subscale, which is scored out of 60 with lower scores indicating more
severe apraxia [Kertesz and Poole 1974]. Attention and working memory was assessed using the
Forward and Backward Digit Span tests from the WMS-R [Lezak 1983;Wechsler 1987]. Several
assessments of executive function were employed including: phonemic (F-, A-, and S-word)
140
fluency [Gladsjo et al. 1999;Lezak 1983]; the Trail Making Test A and B (TMT-A and -B) that
measure speed of psychomotor processing and mental flexibility [Lezak 1983]; and the
Wisconsin Card Sort Test (WCST) [Heaton 1981]. Visuospatial function was assessed using the
Rey-Osterrieth Complex Figure Test scored out of 36 with lower scores indicating worse
visuospatial function [Lezak 1983;Osterrieth 1944;Rey 1941]; and the Benton Line Orientation
task, which is motor-free and assesses visuospatial orientation and attention [Lezak 1983].
Behavioural function was investigated using the Neuropsychiatric Inventory (NPI-12), a
caregiver-based interview assessing 12 common neuropsychiatric features of dementia;
maximum score is out of 144 with lower scores indicating lesser degrees of psychopathology
[Cummings 1997]. Severity of depressive symptoms was assessed using the Cornell Scale for
Depression in Dementia (CSDD); higher scores indicate more severe depressive symptoms
[Alexopoulos et al. 1988]. Functional assessment was performed using the Disability
Assessment for Dementia (DAD), which assesses both basic and instrumental activities of daily
living including subcomponents of initiation, planning and performance [Gelinas et al. 1999].
5.3.3 Brain MRI:
Structural MRI was obtained in 29 of the 31 patients using a standard protocol. Images were
acquired on a 1.5T Signa MR imager (GE Medical Systems, Milwaukee, Wis.) and consisted of
the following acquisitions: 1) T1-weighted (axial 3D spoiled gradient [SPGR] echo, with echo
time [TE] 5 ms, repetition time [TR] 35 ms, flip angle 35°, number of excitations [NEX] 1, field
of view [FOV] 22 × 16.5 cm, in-plane resolution 0.859 × 0.859 mm and slice thickness 1.2–1.4

141
mm), 2) proton-density and 3) T2-weighted images (interleaved axial spin echo, with TEs 30 and
80 ms, TR 3 s, NEX 0.5, FOV 20 × 20 cm, in-plane resolution 0.781 × 0.781 mm and slice
thickness 3 mm). MRI images were qualitatively interpreted by a neurologist (KH) blinded to all
clinical, neuropsychological, neuropsychiatric, SPECT, and pathological data. Asymmetry and
lobar localization of the maximal atrophy was described. Localization of T2/PD white matter
changes was also noted.
5.3.4 Brain SPECT:
SPECT imaging was acquired with a triple-head gamma camera (Prism 3000XP; Phillips
Medical Systems Inc., Cleveland, Ohio) while the patient was resting comfortably and was
performed a minimum of 30 minutes and a maximum of 120 minutes after injection of 20 mCi
(740 MBq) of Technetium-99m ethyl cysteinate dimer (99m
Tc-ECD SPECT). Each view
consisted of a 128 × 128 pixel image with a typical reconstructed image resolution of 9.7 mm
full width at half maximum. The total imaging time was 19 minutes. Reconstruction was
performed by using a ramp-filtered back-projection algorithm followed by a 3-dimensional
restoration post-filter (Wiener filter, multiplier 1.0). Ellipses were fit to the approximate location
of the outline of the head in each transaxial image, and a calculated attenuation correction
applied [Matsuda et al. 1995]. Voxel dimensions were 2.18 × 2.18 × 3.56 mm.

142
5.3.5 Regional perfusion ratios:
Uptake of 99m
Tc-ECD is approximately proportional to regional cerebral blood flow (rCBF)
[Matsuda et al. 1995] such that brain SPECT can be used to provide semi-quantitative measures
of regional brain perfusion. Reconstructed images were co-registered to a SPECT template that
was an average of 14 healthy, elderly control scans. A T1-weighted MRI with dimensions similar
to the SPECT template was the source of 79 bilateral regions of interest (ROI) as previously
described [Lobaugh et al. 2000]. In order to obtain ROI intensity values, we used a common
transformation to move from the SPECT template space to MRI space. The cerebellum is
frequently used to normalize SPECT counts in studies of dementia [Stamatakis et al. 2001].
However, crossed cerebellar diaschisis may lead to relative differences in perfusion between the
left and right cerebellar hemispheres, and, if whole cerebellum is used as the reference region
then this may overestimate rCBF in a particular ROI. We, therefore, applied the following rule: if
there was more than a 5% difference in counts between left and right cerebellar hemispheres, we
use the hemisphere that is more perfused as the reference region. If there is no difference then
we use the whole cerebellum as the reference region. In this way, semi-quantitative perfusion
ratios are derived and regional Z scores are calculated [Lobaugh et al. 2000].
5.3.6 Pathological analysis:
Neuropathological examination was carried out by one of the authors (J.B.). Paraffin-embedded
sections were stained with haematoxylin and eosin, Luxol fast blue (LFB), Bielschowski and
Gallyas. Immunostains using commercial antibodies for tau (Dako, A0024), ubiquitin (Vector
Labs, ZPU576), and α-synuclein (Vector Labs) were performed. Immunostaining with

143
commercial antibodies for TDP43 (ProteinTech Group, Inc.) was performed, when
Frontotemporal Lobar Degeneration-Ubiquitin-positive, Tau-negative pathology (FTLD-U) was
demonstrated.
5.3.7 Data analysis:
Statistical analysis of demographic, clinical, neuropsychological, MRI and ROI SPECT variables
was performed using the Statistical Package for the Social Sciences (SPSS), version 16.
5.3.7.1 Demographic, clinical and neuropsychological measures:
Categorical demographic and clinical data were analyzed using chi-square or Fisher exact tests.
In comparing neuropsychological test results to the control sample, normalized z-scores were
calculated. Normality of continuous demographic and neuropsychological data was determined
by examining Q-Q probability plots. Parametric methods (e.g., independent samples t-test) were
used if the data fit a normal distribution, otherwise non-parametric tests (e.g., Mann Whitney U
test) were performed.
5.3.7.2 Region of interest (ROI) SPECT analysis:
Normality of ROI SPECT data was confirmed as described above. Independent sample t-tests
between CBS and control groups were conducted to compare mean perfusion ratios of individual
ROIs within frontal, parietal, temporal, basal ganglia, and thalamic regions, areas previously
shown to be affected in CBS. ROIs that were statistically significant on the t-test analysis were
included in a multivariate, general linear model (GLM) analysis of covariance (ANCOVA).

144
5.3.7.3 Statistical Parametric Mapping SPECT analysis:
SPECT scans were decompressed, converted to Analyze 7.5 format, and each axial slice was
visually inspected for image quality. Statistical Parametric Mapping version 5 (SPM5,
Wellcome Department of Imaging Neuroscience, University College London) was used to pre-
process and analyze the scans. The images were spatially normalized to a standard SPECT
template in Montreal Neurological Institute (MNI) space [Stamatakis et al. 2001]. This step re-
sampled the voxel dimensions to 2 × 2 × 2 mm. The scans were then smoothed using an
isotropic Gaussian kernel (12 mm FWHM). A thresholded mean voxel value was chosen for
global calculation, and global normalization was achieved by proportional scaling to 50 mL/100
g/min. Voxel-by-voxel t-tests were performed to identify regions with differences in relative
cerebral perfusion between groups. We reported significance using a voxel-wise p-value
threshold (p < 0.05) corrected for multiple comparisons and an extent threshold of at least 20
contiguous voxels. Our correction methodologies included either controlling the family-wise
error (FWE) rate [Worsley et al. 1996] or controlling the false discovery rate (FDR) [Genovese
et al. 2002]. A whole brain mask was used to exclude extracranial voxels from the analysis. The
maximal peak coordinates of the perfusion differences were converted to Talairach space using
the Yale Non-linear MNI to Talairach Converter [Lacadie et al. 2008]
(http://www.bioimagesuite.org/Mni2Tal/index.html). These converted coordinates were
translated into anatomical brain regions and Brodmann Areas (BAs) using Talairach Daemon
Client [Lancaster et al. 2000] (http://www.talairach.org/client.html).

145
5.4 Results
5.4.1 CBS cases vs. controls
5.4.1.1 Neuropsychological, behavioural and functional assessment
Figure 1. Normalized (z-) scores of neuropsychological measures in patients with CBS compared to control
group.
Z-score cut-off of -2.8 corresponds to a p-value of ≤ 0.0026 (Bonferroni-correction for multiple testing). WCST-per
= Wisconsin Card Sort Test-perseverative errors (n=22); WCST-cat = Wisconsin Card Sort Test-categories (n=22);
TMT = Trail Making Test (TMT-A, n=19; TMT-B, n=13); FAS = F-, A-, S-word phonemic fluency (n=21); Benton
Judgement of Line Orientation (n=21); Rey Osterieth Complex Figure Copy (n=20); Digit span B = Backward (23);
F = Forward (23); Semantic fluency (n=26); Boston Naming (n=22); WAB = Western Aphasia Battery (n=23);
WAB-praxis (n=27); DVR = WMS-III-R delayed visual reproduction (n=19); CVLT = California Verbal Learning
Test-long delay free recall (n=21); Raven‟s progressive matrices (n=22); NART = New Adult Reading Test (n=19);
MDRS = Mattis Dementia Rating Scale (n=26); Clock Drawing Test (n=9); MMSE = Mini-Mental State Exam
(n=31). Missing data is secondary to the inability of the patient to complete the test.
Patients were mildly demented at the time of their initial evaluation based on their mean MMSE
score of 21.7 (Standard Error of the Mean = 1.2) and fell below the cut-off for dementia on the
Mattis Dementia Rating Scale (MDRS); mean score in CBS patients was 113.5 (4.1) /144
(MDRS cut-off for dementia in this age group = 123/144). Cognitive domains most impaired

146
were working memory, executive functions, praxis, visuospatial abilities and language tasks
involving fluency and naming, with relative preservation of comprehension. Although delayed
free recall on the CVLT was impaired, delayed cued recall was better (data not shown). Of the
23 CBS patients for which WAB data was available, the classification was as follows: 26.1%
(6/23) had no aphasia; 8.7% (2/23) were borderline aphasic; 47.8% (11/23) had an anomic
aphasia; 8.7% (2/23) had a Broca‟s aphasia; 4.4% (1/23) had a conduction aphasia; and 4.4%
(1/23) had a Wernicke‟s aphasia.
Patients were moderately impaired on both basic and instrumental activities of daily living
assessed using the Disability Assessment for Dementia. In terms of frequency of
neuropsychiatric symptoms, 24/29 (82.8%) CBS patients had at least one neuropsychiatric
symptom present (Supplementary Table 1). Neuropsychiatric symptoms are presented in order
from most common to least common: apathy (58.6%), depressive symptoms (41.4%), abnormal
appetite and eating behaviour (41.4%), irritability (34.5%), agitation (31.0%), anxiety (27.6%),
aberrant night-time behaviour (24.1%), disinhibition (17.2%), aberrant motor behaviour (6.9%),
and delusions (3.5%; Supplementary Table 1). No patients had hallucinations or euphoria. 13/30
(43.3%) had a CSDD score > 25% supportive of significant depressive symptomatology
(Supplementary Table 1), although none met DSM-IV diagnostic criteria for depression or had a
history of clinically relevant depression before the neurodegenerative presentation.
5.4.1.2 MRI features
Table 1 provides case summaries of clinical, pathological and MRI features of the CBS patients.
Two patients did not have MRI examinations completed due to claustrophobia.

Table 1. Case summaries of clinical, pathological, and MRI features of CBS patients. M = Male; F = Female; FTLD-U/TDP43 = Frontotemporal lobar
degeneration-ubiquitin+/Tar DNA binding protein+; AGD = agyrophilic grain disease; CAA = cerebral amyloid angiopathy; CBD = Corticobasal degeneration;
PSP = Progressive supranuclear palsy; L = Left; R = Right; SYM = Symmetrical; O = occipital; P = Parietal; Fr = frontal; Te = Temporal; Gen = Generalized;
POST = posterior; ANT = anterior
AGE OF
ONSET SEX
TYPE OF
PRESENTATION PATHOLOGY
AFFECTED
SIDE OF
BODY
HEMISPHERIC
ATROPHY
LOBAR
PREDILECTION
WHITE MATTER
HYPERINTENSITY
65 F Dementia FTLD-U/TDP43 L R O,P > Fr,Te R>L POST
63 F Dementia AGD/CBD/CAA R L Gen R=L ANT/POST
77 F Dementia N/A R L Fr,Te,P R=L ANT/POST
74 F Motor CBD L SYM Fr,Te,P R=L ANT
75 M Motor N/A R SYM Gen R=L ANT
58 F Dementia N/A L SYM O,P > Te R=L ANT
86 M Dementia N/A L SYM Fr,Te,P R=L ANT
61 F Dementia CBD R L Fr,Te,P L ANT
75 F Dementia N/A R L Fr,P R=L ANT
63 F Motor CBD L SYM Gen R=L ANT/POST
70 F Dementia N/A R SYM Fr,Te,P R=L ANT
57 F Dementia CBD R L Te,P,O > Fr L>R POST
59 F Dementia N/A L SYM P,O > Fr,Te L>R POST
57 M Dementia N/A L R P > Te,O R=L mild
62 F Dementia N/A L SYM P > Fr,Te R=L mild
54 M Dementia N/A L R Gen Absent
59 M Motor N/A L SYM P R>L POST
71 F Motor N/A L R Fr,Te,P R=L ANT/POST
76 M Motor N/A L SYM P > Fr,Te L>R POST
69 M Dementia N/A L R P,T > F R=L ANT
49 F Dementia N/A R SYM P > Fr,Te,O L>R ANT/POST
80 F Dementia N/A R L Fr,Te,P > O L>R POST
68 F Motor N/A R L Fr,Te,P > O R=L mild
55 F Dementia N/A R SYM P > Fr R=L mild
69 F Dementia CBD L R Fr,P > Te R=L mild
71 F Motor N/A R SYM Te,P R=L ANT/POST
46 M Dementia N/A R L Gen R=L mild
62 M Dementia PSP R SYM P Absent
58 M Dementia N/A R L P > Te Absent
67 M Dementia N/A R No MRI N/A N/A
65 M Motor N/A L No MRI N/A N/A

Table 2. MRI atrophy patterns in CBS cases stratified according to body side most affected by motor
symptoms.
All percentages are calculated based on total of 29 CBS patients who had MRI scans.
In terms of lobar predilection, parietal>temporal>frontal atrophy was most commonly seen with
only eight (27.6%) patients having evidence for occipital involvement. Generalized lobar atrophy
was observed in five patients; three with maximal involvement contralateral to the most affected
side of the body, while two had symmetrical generalized atrophy.
The majority of patients (89.7%; 26/29) demonstrated subcortical T2/PD white matter
hyperintensities (WMH) on MRI; 10.3% (3/29) of patients showed no WMH. Of the patients
with WMH, 15.4% (4/26) had maximal WMH contralateral to the most affected side of the body
corresponding to the region of maximal atrophy. 7.7% (2/26) of patients with symmetrical
cortical atrophy had WMH contralateral to the most affected side of the body. 7.7% (2/26) of
patients with symmetrical atrophy had WMH ipsilateral to the most affected side of the body.
69.2% (18/26) of patients had symmetrical WMH independent of the most affected side of the
body and of cortical atrophy.
MRI atrophy pattern
Asymmetric Symmetric
Right Left
Motor
side
Left 6 (20.7%) 0 (0%) 8 (27.6%)
Right 0 (0%) 9 (31%) 6 (20.7%)
Column Totals 15 (51.7%) 14 (48.3%)

149
5.4.2 Early dementia vs. early motor presentations
5.4.2.1 Demographic and clinical characteristics
There were no statistically significant differences between the early motor and dementia groups
in terms of gender, handedness, years of education, age of onset, and body side most affected
(Table 3).
Demographic variable CBS-dementia (n=22) CBS-motor (n=9)
Gender 14 (63.6%) F
8 (36.4%) M
5 (55.6%) F
4 (44.4%) M
Handedness 21 (95.5%) R
1 (4.5%)L
8 (88.9%) R
1 (11.1%) L
Site of recruitment* 19 (86.4%) Cog
3 (13.6%) MD
1 (11.1%) Cog
8 (88.9%) MD
Age of Onset
(mean SEM years)
63.6 2.1
69.1 1.9
Age at Investigation
(mean SEM years)
66.8 2.1
72.6 2.0
Duration of symptoms
(mean SEM years)
3.2 0.4
3.4 0.7
Years of Education
(mean SEM years)
12.2 0.7
12.9 0.9
Body side most affected 13 (59.1%) R
9 (40.9%) L
3 (33.3%) R
6 (66.6%) L Table 3. Demographic features of CBS groups presenting with early dementia versus early motor features.
F = Female; M = Male; Cog = Cognitive Neurology Clinic; MD = Movement Disorders Clinic; R = Right; L = Left;
*Fisher‟s Exact test, p<0.0005.
In terms of clinical characteristics (Figure 2), CBS patients presenting with early motor features
were statistically more likely to have cortical sensory loss (defined as occurrence of
astereognosis, agraphesthesia and/or sensory extinction) as compared to the early dementia group
(Fisher‟s Exact Test [2-tailed], p=0.005; Figure 2B). This association was driven by the higher
occurrence of astereognosis in the CBS-M group (77.8% [7/9 cases]; Fisher‟s Exact Test [2-
tailed], p=0.01) compared to CBS-D (22.7% [5/22]). There were no differences between the

150
CBS-M and -D groups in terms of agraphesthesia or extinction to double simultaneous stimuli.
Because sensory extinction is known to localize to the right parietal region, the sample was
stratified into those presenting with their left side of the body most affected vs. those involving
mainly their right body. Consistent with this localization, there was a trend for CBS-L patients to
have higher rates of sensory extinction than CBS-R patients (CBS-L: 33.3% [5/15] vs. CBS-R:
6% [1/16 cases]; Fisher‟s Exact test, p=0.08). There were no significant differences between the
CBS-L and CBS-R groups in terms of occurrence of agraphesthesia or astereognosis. Of the 11
patients who died, time to death was not significantly different between the eight patients who
presented with early dementia (80 ± 17 months) and the three patients with early motor features
(91 ± 9 months).
Figure 2. Frequency of (A) extrapyramidal and (B) cortical features of CBS patients presenting with early
dementia vs. early motor symptoms.
CSL = Cortical sensory loss; *Fisher‟s Exact Test, p = 0.005
5.4.2.2 Neuropsychological, behavioural and functional evaluation
CBS patients presenting with early dementia had statistically significant lower scores on MMSE;
WAB aphasia quotient (AQ) and subscores including content, fluency, repetition, and
2A 2B
*

151
comprehension; Boston naming; forward digit span; and Benton line orientation than those
presenting with early motor features (See Table 4). This indicates relative difficulties in general
cognition, language function, and tasks involving sustained attention and visuospatial orientation
and attention.
Psychometric Measures CBS-D (n) CBS-M (n)
General cognition
MMSE /30 [n=31]¥ 19.8 ± 1.5 (22) 26.6 ± 1.0 (9)
Clock Drawing Test /10 [n=9] 6.8 ± 1.1 (6) 7.0 ± 1.7 (3)
NART /127.8 [n=19] 104.4 ± 2.5 (11) 111.7 ± 2.6 (8)
Raven‟s Progressive Matrices /36 [n=22]* 18.8 ± 1.3 (14) 27.3 ± 3.0 (8)
MDRS /144 [n=26] 108.0 ± 5.3 (17) 123.9 ± 4.7 (9)
Memory
CVLT Long Delay Free Recall /16 [n=21] 5.9 ± 0.7 (13) 7.6 ± 1.2 (8)
Delayed Visual Reproduction /41 [n=19] 8.7 ± 2.8 (12) 13.7 ±4.1 (7)
Language
WAB total /100 [n=23]* 82.7 ± 3.0 (17) 94.5 ± 1.9 (6)
WAB content /10* 7.8 ± 0.4 9.1 ± 0.4
WAB fluency /10* 8.0 ± 0.5 9.3 ± 0.2
WAB comprehension /10¥ 8.9 ± 0.3 9.9 ± 0.1
WAB repetition /10¥ 8.5 ± 0.3 9.8 ± 0.1
WAB naming /10 8.1 ± 0.3 9.0 ± 0.4
Boston Naming /30 [n=22]* 22.2 ± 1.3 (14) 27.1 ± 0.8 (8)
Semantic Fluency /20 [n=26] 8.3 ± 1.2 (18) 13.3 ± 2.8 (8)
Praxis
WAB praxis /60 [n=27] 51.7 ± 2.4 (18) 56.1 ± 0.9 (9)
Attention & working memory
Digit span - forward /12 [n=23] ¥
5.9 ± 0.6 (15) 9.1 ± 0.7 (8)
Digit span - backward /12 [n=23] 3.9 ± 0.8 (15) 5.8 ± 0.9 (8)
Visuospatial abilities
Rey Osterieth Complex Figure – Copy /36 [n=20] 13.8 ± 3.6 (12) 21.7 ± 4.9 (8)
Benton Line Orientation /30 [n=21]* 9.5 ± 2.6 (13) 19.3 ± 4.2 (8)
Executive functions
Phonemic fluency (FAS) [n=21] 16.6 ± 2.8 (13) 23.1 ± 5.4 (8)
Trail Making Test A (time in seconds) [n=19] 119.9 ± 14.3 (12) 89.6 ± 31.7 (7)
Trail Making Test B (time in seconds) [n=13] 273.6 ± 63.3 (7) 145.5 ± 28.5 (6)
WCST categories /6 [n=22] 1.6 ± 0.4 (13) 2.1 ± 0.4 (9)
WCST perseverative errors [n=22] 12.5 ± 3.8 (13) 10.6 ± 4.7 (9) Table 4. Mean scores (± SEM) on neuropsychological measures in CBS patients presenting with early
dementia vs. early motor symptoms.
The number of patients (n) tested is listed next to individual measures. Missing data is secondary to the inability of
the patient to complete the test. CBS-D = Early dementia; CBS-M = Early motor; MMSE = Folstein‟s Mini-Mental

152
State Exam; NART = National Adult Reading Test; MDRS = Mattis Dementia Rating Scale; CVLT = California
Verbal Learning Test; WAB = Western Aphasia Battery; FAS = F-, A-, and S-phonemic fluency; WCST =
Wisconsin Card Sort Test. Independent samples t-tests were used to compare MMSE, NART, Clock, MDRS,
Boston naming, semantic fluency, visual reproduction, forward and backward digit span, CVLT, Benton, Trails A
and B mean scores between groups. Mann Whitney U test was used to compare scores on FAS, WAB, Rey and
WCST between groups. *p≤0.05; ≦≤0.005
The early dementia group was statistically more likely to have a language disturbance based on
combined aphasia categories on the WAB as compared to those presenting with early motor
features (Fisher‟s Exact Test [2-tailed], p=0.02). Specifically, 33.3% of the early motor group
had an anomic aphasia, while the rest had no aphasia. Contrast this to 88.2% of the early
dementia group having a language disturbance (borderline aphasia: 11.8%; anomic aphasia:
52.9%; Broca‟s aphasia: 11.8%; conduction aphasia: 5.9%; Wernicke‟s aphasia: 5.9%) while
11.8% had no aphasia (Figure 3). This difference was even more striking when aphasia
classification was stratified according to side of maximal motor involvement. Specifically, 100%
(10/10) of patients presenting with their right side of the body most affected had evidence for an
aphasic disturbance, whereas only 46% (6/13) of those with left sided motor symptoms were
classified as having aphasia (Fisher‟s Exact Test [2-tailed], p = 0.007). Additionally, mean WAB
AQ scores were lower in those presenting with the right side of the body most affected (78.9 ±
3.8) compared to the left (91.0 ± 2.6) [Mann-Whitney U test (2-tailed), p = 0.005].

153
Figure 3. Frequency of CBS patients with early dementia vs. early motor presentation stratified according to
category on the Western Aphasia Battery (WAB). None of the functional or behavioural measures were statistically different between the early dementia and early
motor groups (Table 5).

154
Behavioural/Functional Measures CBS-D (n) CBS-M (n)
Activities of daily living
DAD (%) [n=30] 65.7 ± 7.0 (21) 75.8 ± 9.9 (9)
DAD ADL (%) 77.0 ± 7.6 76.0 ± 9.1
DAD iADL (%) 58.6 ± 7.8 75.7 ± 10.5
Neuropsychiatric symptoms
NPI total /144 [n=29] 14.4 ± 3.4 (20) 7.1 ± 2.7 (9)
NPI apathy /12 4.1 ± 1.0 2.1 ± 1.3
NPI appetite and eating behaviour /12 2.3 ± 0.7 1.8 ± 1.2
NPI dysphoria/depression /12 1.7 ± 0.6 0.6 ± 0.2
NPI night-time behaviour /12 1.1 ± 0.5 1.7 ± 1.1
NPI irritability/lability /12 1.3 ± 0.5 0.4 ± 0.3
NPI agitation/aggression /12 1.1 ± 0.6 0.3 ± 0.2
NPI aberrant motor behaviour /12 0.8 ± 0.6 0.0 ± 0.0
NPI disinhibition /12 0.7 ± 0.3 0.0 ± 0.0
NPI anxiety /12 0.7 ± 0.3 0.2 ± 0.2
NPI delusions /12 0.3 ± 0.3 0.0 ± 0.0
NPI hallucinations /12 0.0 ± 0.0 0.0 ± 0.0
NPI euphoria /12 0.0 ± 0.0 0.0 ± 0.0
NPI caregiver distress /12 7.9 ± 1.9 4.2 ± 1.6
Cornell Depression Scale (%) [n=30] 24.3 ± 3.1 (21) 19.3 ± 4.9 (9) Table 5. Mean scores (± SEM) on behavioural and functional measures in the CBS group.
The number of patients (n) tested is listed next to individual measures. Missing values are secondary to the inability
of the caregiver to complete the test. CBS-D = Early dementia; CBS-M = Early motor; DAD = Disability
Assessment for Dementia; ADL = Activities of daily living; iADL = Instrumental activities of daily living; NPI =
Neuropsychiatric Inventory. There were no statistically significant differences between groups.
5.4.2.3 MRI features
There were no significant differences between the early dementia and motor groups in terms of
symmetry/asymmetry of atrophy on MRI. Stratifying CBS patients with asymmetric MRI
atrophy into those with and without aphasia using the WAB, there was a trend for aphasic
patients to have left hemispheric atrophy compared to those without aphasia (Fisher‟s Exact Test,
p=0.06; Refer to Table 6).
MRI atrophy pattern
Asymmetric* Symmetric
Right Left
Aphasia
Present (n=17) 2 6 7
Absent (n=6) 3 0 3 Table 6. MRI atrophy patterns in CBS cases stratified by the presence or absence of aphasia as determined
by the WAB. Fisher‟s exact test, p=0.06*

155
5.4.2.4 SPM and ROI SPECT
Figure 4 and tables 7 and 8 demonstrate results of SPM and ROI SPECT analysis comparing
perfusion in the CBS patients presenting with early dementia to those with early motor features.
In the early dementia versus early motor groups, cortical areas of relative hypoperfusion were
identified in the left fusiform gyrus (uncorrected p<0.001); this result did not survive correction
for multiple testing using FDR or FWE methods. However, employing ROI MANCOVA
analysis, CBS patients presenting with early motor symptoms had relatively reduced perfusion in
the right precentral gyrus and right paracentral lobule (supplementary motor area) as well as in
the left middle posterior cingulate region compared to those with early dementia.
Figure 4. Statistical parametric maps overlaid on multi-slice brain MRI template showing decreased
perfusion in left fusiform gyrus (uncorrected p<0.001) in CBS cases presenting with early dementia versus
early motor features.

156
Group Anatomical locus
(Brodmann area)
Talairach
Coordinates
No. of
voxels
SPM t-score
(p-value)
X y Z
CBS-d Occipitotemporal region - SPM
vs. Left fusiform gyrus (19) -34 -76 -11 215 4.5 (p<0.001)
CBS-m Table 7. Areas of relative hypoperfusion on SPECT in CBS patients presenting with early dementia (CBS-d)
versus those presenting with early motor features (CBS-m).
Data are shown for only SPM analysis since no areas of hypoperfusion were shown with ROI; Uncorrected p-value
of p<0.001 used.
Group Anatomical locus
(Brodmann area)
No. of
voxels
ROI F-score
(p-value)
CBS-m Frontal regions – ROI
vs. Right paracentral lobule 741 7.0 (p<0.01)
CBS-d Right precentral gyrus 2723 4.9 (p<0.04)
Limbic regions - ROI
Left posterior cingulate - middle 512 5.1 (p<0.03) Table 8. Areas of relative hypoperfusion on SPECT in CBS patients presenting with early motor (CBS-m)
versus those presenting with early dementia (CBS-d).
Data are shown for ROI analyses only since SPM results failed to demonstrate any relative perfusion differences in
this comparison. All p-values for the ROI analysis are derived from a multivariate ANOVA running under a general
linear model.
5.4.3 Description of pathological series and relation to MRI findings
Of the 31 CBS patients in our series, 11 patients died from their neurodegeneration usually from
malnutrition and/or aspiration pneumonia secondary to severe dysphagia. The average time to
death was 82.7 (SEM 12.2; range 32 to 159) months or approximately 7 years. Pathological
analysis was performed on 8 of the 11 patients who died. 5 patients met pathological criteria for
CBD, one had PSP, one had FTLD-U/TDP43 proteinopathy and one had combined dementia
with agyrophilic grains, CBD and cerebral amyloid angiopathy (AGD/CBD/CAA). The average
time to death in the pathologically-confirmed CBD group was 79.2 (22.5) months with a range of
32 to 159 months. The patient with pathologically-proven PSP died after approximately 94
months, while the time to death in the AGD/CBD/CAA and FTLD-U/TDP43 patients were 117

157
and 112 months, respectively. The CBS cases with FTLD-U/TDP43 (left motor symptoms),
AGD/CBD/CAA (right motor symptoms), or PSP (right motor symptoms) pathology presented
with an early dementia syndrome. 60% (3/5) of the CBD cases presented with an early dementia
syndrome; two of these cases had right-sided motor symptoms while one had left-sided
involvement. 40% (2/5) of the CBD cases presented with early motor features and both had the
left side prominently affected by motor symptoms.
There was a relatively good association between the severity and lateralization of cortical
atrophy/subcortical white matter changes observed on MRI in vivo with that of the underlying
pathology. Of the CBS cases with a pathological diagnosis of CBD, the pattern of cortical
atrophy detected on MRI matched that detected by pathological investigation in 60% (3/5) of
cases; in the two cases that did not match, MRI-detected atrophy was asymmetrical while the
macroscopic brain pathology showed symmetrical atrophy. Also in 100% (5/5) of the CBD
group, the severity of white matter changes on MRI correlated well with the severity of
underlying Tau-positive threads and glial coils observed in the white matter with associated
pallor and gliosis. The case with FTLD-U/TDP43 demonstrated marked right > left-sided
cortical atrophy worse in the parieto-occipital region, but also involving the frontotemporal
regions on MRI [Masellis et al. 2006]. There was also severe underlying white matter
hyperintensities worse on the right in the posterior regions. These MRI findings are strongly
correlated with pathological changes of underlying cortical and white matter atrophic and gliotic
changes. The generalized left > right-sided atrophy seen on MRI in the AGD/CBD/CAA case
was discordant with the symmetrical atrophic changes noted on pathology. However, MRI white
matter hyperintensities did correlate with white matter neuropil threads and coiled bodies.

158
Finally, the mild symmetrical atrophy on MRI detected in the PSP case and absence of white
matter changes correlated well with that of the cortical atrophy seen on pathology as well as the
minimal white matter gliotic changes. None of the cases had evidence for clasmatodendrosis in
the white matter.
5.5 Discussion
This study provides a comprehensive and integrated multi-modal assessment of a prospective
cohort of CBS patients using clinical data, standardized neuropsychological, neuropsychiatric
and functional measures, as well as brain MRI and SPECT data. Patients were ascertained from
both university-based cognitive and movement disorders clinics overcoming the important
limitation of selection bias in prior studies. Many prior studies did not stratify patients based on
most affected motor side of the body as well as presenting syndrome – dementia or motor – and
our study significantly adds to the literature that has studied lateralization in this syndrome.
Finally, our CBS cohort was followed prospectively over time with about 25% of our sample
coming to autopsy, which was performed in 72% (8/11) who died during the course of the study.
We will now discuss highlights and novel findings of this study.
5.5.1 CBS presenting with early dementia vs. early motor features
There have been very few studies that directly compare the clinical and neuropsychological
profiles of CBS presenting with early dementia (CBS-D) vs. early motor features (CBS-M)
[Kertesz et al. 2000b;McMonagle et al. 2006]. The current study represents the first attempt to

159
compare these CBS subtypes in terms of their relative brain perfusion on SPECT as a biomarker
of brain dysfunction. Compared to previous studies, it also provides a more comprehensive,
comparative neuropsychological assessment of these CBS subtypes that cover all domains of
cognitive functioning.
A highly significant finding was that all CBS patients presenting with early motor features
demonstrated cortical sensory loss on clinical examination in comparison to less than half of
those presenting with early dementia. To our knowledge, this is the first study to demonstrate
this finding. Although sensory extinction can be represented bilaterally in the parietal regions, it
is more commonly associated with lesions involving the right (non-dominant) superior parietal
lobe, specifically, areas 5 and 7 in the inferior part [Rizzo and Eslinger 2004;Ropper and Brown
2005]. Although we could not localize precisely to this region based on the nature of our data,
the CBS patients with prominent symptoms involving the left side of the body had higher rates of
sensory extinction. Agraphesthesia (ability to recognize figures drawn on the hand) has been
associated with lesions of the left intraparietal sulcus [Rizzo and Eslinger 2004]. However, in our
sample, we did not observe any association of left hemispheric/parietal atrophy with presence of
agraphesthesia. This may be due to low power to detect a difference using cateogorical data
(presence/absence of left hemispheric atrophy on MRI) secondary to a relatively small sample
size. Astereognosis (an inability to tactually perceive both texture [ahylognosis] and shape
[amorphognosis] of an object with the hands) localizes to parietal areas 1 (ahylognosis), and 2
through 5 (amorphognosis) and is bilaterally represented [Rizzo and Eslinger 2004]. Our
findings support the bilateral localization of this clinical phenomenon in that there was no
lateralization of MRI-rated atrophy observed.

160
Lateralization in our sample is further supported by a careful examination of language function
within the CBS-D vs. -M groups. Specifically, patients with language dysfunction classified
according to the WAB were more likely to have their right side of the body most affected, which
was more commonly the case in the early dementia group. Similar to prior studies [Kertesz et al.
2000b;McMonagle et al. 2006], our CBS patients presenting with early dementia tended to
perform more poorly on the WAB as exemplified by lower mean aphasia quotients and were
more likely to be classified as having severe aphasic disturbances. Furthermore, the CBS-D
group had significant impairments in naming on the Boston Naming Test compared to the CBS-
M group. This association was even stronger when examining for the presence of aphasic
disturbance based on the most affected motor side of the body with 100% of right side afflicted
patients demonstrating aphasia compared to less than half of those with their left body side
affected. Compared to a trend towards this finding in McMonagle et al. [McMonagle et al.
2006], our study achieved high statistical significance. This difference may be due to patient
selection biases – all of our patients had to have substantial asymmetric rigidity and/or apraxia at
some point during the disease course to increase the specificity of the CBS diagnosis whereas 5
patients in McMonagle et al [McMonagle et al. 2006] had clinical findings that were
symmetrical and “atypical” for CBS; our patients were recruited prospectively from both a
cognitive or movement disorders clinic; or this discrepancy may be due to other unknown biases
in the data due to small sample sizes across both patient series.

161
Although right-sided motor involvement was strongly associated with aphasia in this study, an
examination of MRI data did not show such a predictable relationship with side of maximal
atrophy. Patients with aphasia tended to have either symmetric or left hemispheric atrophy on
MRI compared to those without aphasia who had symmetric or right hemispheric atrophy. These
results did not achieve statistical significance, but were based on a small sample size. This lack
of an association of aphasia with side of atrophy is consistent with the study of McMonagle et al
[McMonagle et al. 2006]. Asymmetric atrophy on MRI was not found to predict the CBS-D vs.
CBS-M presentation. Few studies have directly compared these two subtypes of CBS utilizing
MRI. One MRI study demonstrated that pathologically-proven CBD patients (n = 11) had more
cortical and subcortical grey matter atrophy on MRI if they presented with dementia symptoms
(CBD-D) compared to a higher degree of subcortical white matter atrophy in motor-onset CBD
(CBD-M) [Josephs et al. 2008]. Similar to our study, their analysis comparing CBD-M and
CBD-D cases was completed qualitatively by visual inspection even though they used voxel-
based morphometric analysis when comparing CBD patients to controls [Josephs et al. 2008].
The lack of association between MRI-rated atrophy and pattern of CBS presentation is likely due
to the fact that even though one hemisphere may be more selectively vulnerable at an earlier
stage of disease, ultimately the pathology underlying CBS is bilateral and frequently does not
always correlate perfectly with the clinical syndrome. Perfusion deficits may be more sensitive to
detect asymmetry in CBS presenting with cognitive- versus motor-onset.
We hypothesized that the CBS-D group would show reduced perfusion in the left peri-Sylvian
region compared to CBS-M given that aphasia was more common and severe in this group.
Conversely, we hypothesized that the CBS-M group would show reduced perfusion in the right

162
parietal region compared to the CBS-D group because of the high preponderance of cortical
sensory loss. There were no significant areas of reduced perfusion between the CBS-D and CBS-
M groups identified that survived correction for multiple testing. This was likely on the basis of
the small sample size in each CBS group (CBS-D, n = 22; CBS-M, n = 9) so there was
insufficient power to detect any differences using the conservative SPM method. Even when the
stringency of a whole brain SPM analysis was reduced to explore the data, the only area which
showed reduced perfusion in CBS-D versus -M was the left fusiform gyrus. The fusiform gyri
have been identified as important neural correlates of both facial and word recognition and
perception [Rizzo and Eslinger 2004]. Damage to the right fusiform gyrus is associated with
prosopagnosia, an inability to recognize faces [Rizzo and Eslinger 2004]. The left fusiform gyrus
plays an important role in recognition and processing of visual word forms and as such is also
known as the „visual word form area‟ important in processing strings of letters [Cohen et al.
2000]. However, a more recent study has also shown its importance in perception and memory of
faces [Mei et al. 2010]. To our knowledge, there have been no prior studies demonstrating
reduced perfusion or atrophy in this region in CBS nor has prosopagnosia or impaired processing
of letter strings been observed as a feature of CBS. However, in a combined group of
neurodegenerative disorders including a small subsample with CBS, empathy loss was associated
with atrophy in the right fusiform gyrus among other frontotemporal regions [Rankin et al.
2006]. The authors suggest that the importance of this region in facial perception may be related
to its association with empathy. Future studies will need to clarify whether or not this structure is
indeed important in CBS, especially given that our result could be a false positive association.

163
Interestingly, in the ROI analysis, the supplementary motor area on the right showed reduced
perfusion in CBS-M compared to CBS-D. This may be an important neural correlate of the
motor disorder associated with CBS and the observation that it lateralizes to the right in CBS-M
patients is consistent with the finding of an increased number of left-sided motor presenters in
the CBS-M group. In the longitudinal study of McMonagle et al. [McMonagle et al. 2006], there
was a shorter onset to the development of motor symptoms in patients with prominent right
hemispheric atrophy or left-sided akinesia in support of our perfusion findings. Our finding is
further substantiated by a voxel-based morphometry (VBM) MRI study demonstrating that
pathologically-proven CBD patients presenting with a prominent extrapyramidal syndrome, as
opposed to dementia, had atrophy compared to controls involving the superior premotor cortex
extending into the posterior superior, middle and inferior frontal lobes [Josephs et al. 2008].
Grey matter involvement of the supplementary motor area and parietal lobes was also observed
[Josephs et al. 2008]. Although the atrophy pattern was bilateral, it was slightly more
pronounced in the right hemisphere [Josephs et al. 2008]. A limitation of this study was that it
did not document the most affected side of the body in their CBS sample [Josephs et al. 2008].
Consistent with our patients meeting DSM-IV criteria for a diagnosis of dementia, MMSE scores
were, as expected, found to be significantly lower in the CBS-D versus CBS-M group. The CBS-
D group performed significantly worse on the forward digit span indicating a lower primary
attention span suggestive of fronto-subcortical dysfunction. The CBS-D group also showed
significantly more deficits on the Benton judgement of line orientation indicative of right
parieto-occipital dysfunction. These tests do not rely on intact motor function so the differences
are likely not related to the degree of motor impairment or apraxia.

164
To our knowledge, no studies have compared neuropsychiatric features in CBS-D versus CBS-M
case series using the Neuropsychiatric Inventory. Although our results did not achieve statistical
significance, the CBS-D group had higher rates of apathy, irritability, and depressive symptoms
which typically involve the limbic-prefrontal circuit. Abnormal appetite and eating behaviours
were also seen in CBS-D versus CBS-M suggestive of more temporal lobe involvement in this
group. Using the Frontal Behavioural Inventory (FBI), a validated, caregiver-administered rating
scale of frontotemporal behavioural symptoms, Kertesz et al. [Kertesz et al. 2000b]
demonstrated variable, but higher scores on the FBI in cognitive-onset CBS patients compared to
motor-onset CBS consistent with this disorder having symptoms occurring along the spectrum of
FTLD.
5.5.2 Pathology
CBS is not only a clinically heterogeneous disorder, but it is also highly variable in terms of the
underlying pathologies that can cause the syndrome. It is the location and burden of the
pathology that produces the clinical syndrome with likely a lesser contribution coming from the
specific pathological changes [Lang 2003]. As such, the clinical syndrome of CBS does not
always predict the specific underlying pathology of CBD [Ling et al. 2010]. Wadia & Lang
[Wadia and Lang 2007] reviewed several studies (total of 83 cases) demonstrating that the CBS
predicts CBD pathology approximately 55% of the time. The second most common pathology
was PSP (21%) followed by Pick‟s disease (7%) [Wadia and Lang 2007]. McMonagle et al.
[McMonagle et al. 2006] followed 19 CBS patients prospectively until autopsy. Specifically,
165
they found that a clinical diagnosis of CBS predicted CBD pathology in 58% of the cases, and
predicted underlying Tau histology in 84% of cases. Other pathologies included Alzheimer‟s
disease, FTLD-U pathology, and Gerstmann Straussler Scheinker disease [McMonagle et al.
2006]. Our study also followed patients prospectively until autopsy and found that the CBS
predicted CBD histology in 63% of cases. The rates of CBD pathology in our CBS sample are
similar to prior studies [Boeve et al. 1999;McMonagle et al. 2006]. Other Tau based pathologies
(25%) included mixed CBD with agyrophilic grains and PSP. Although the majority of our cases
were sporadic, one of our patients with CBS had a strong family history of CBS and ended up
having FTLD-U/TDP43 pathology due to PGRN mutation [Masellis et al. 2006]. With the
identification of mutations in PGRN as a major cause of FTLD spectrum disorders and in
particular because the FTLD-U/TDP43 pathology often affects the parietal lobes, CBS related to
PGRN mutation has been more commonly identified in recent years [Benussi et al. 2008;Benussi
et al. 2009;Gabryelewicz et al. 2010;Gass et al. 2006;Ghetti et al. 2008;Guerreiro et al.
2008;Kelley et al. 2009;Le, I et al. 2008;Lopez de et al. 2008;Moreno et al. 2009;Rademakers et
al. 2007;Rohrer et al. 2009;Spina et al. 2007;Yu et al. 2010].
We observed an association between atrophy patterns and white matter hyperintensities found on
MRI with findings on neuropathological examination. For the most part, the white matter
changes on MRI correlated with underlying pathological white matter atrophy and gliosis. In the
two CBD cases, who did not show corresponding asymmetry on the pathological examination,
we suspect that by the time of death, the asymmetrical cortical atrophy observed on MRI had
progressed to symmetrical involvement.

166
5.5.3 MRI investigation
Assuming that 1) the presenting lateralized clinical syndrome correlates most strongly with the
area of maximal brain pathology and 2) brain atrophy on MRI is a biomarker of the underlying
burden of pathology, then why do only half of our cases demonstrate asymmetrical brain atrophy
contralateral to the most affected body side? One possibility is that the heterogeneous nature of
pathology underlying CBS may cause varying degrees of atrophy and of hemispheric/lobar
asymmetry. This may be even the case within subtypes of the same pathological substrate; a
study that examined MRI atrophy patterns in patients with diagnoses occurring along the FTLD
spectrum stratified according to type 1, 2, or 3 FTLD-U/TDP43 pathological subtypes
demonstrated that type 1 and 3 pathology were associated with asymmetrical atrophy whereas
type 2 pathology was associated with symmetrical atrophy [Rohrer et al. 2010a]. Similarly,
Whitwell et al. [Whitwell et al. 2010] stratified patients presenting with CBS based on their
underlying pathological diagnosis and compared the subgroups based on their MRI patterns of
atrophy. Although they did not comment on this specifically, it can be extrapolated from their
paper that CBS patients with FTLD-U/TDP43 and AD pathology tended to have more
asymmetrical MRI atrophy whereas those with CBD pathology had more symmetrical atrophy
patterns [Whitwell et al. 2010].
Another possible explanation to account for the lack of asymmetrical atrophy in half of our CBS
patients is that assessment of grey matter loss on MRI may not be a sensitive enough measure.
As such, SPECT perfusion or FDG-PET hypometabolism may be more sensitive in detecting

167
hemispheric asymmetries in CBS compared to MRI. Consistent with this, Mendez et al [Mendez
et al. 2007] found that the use of SPECT/PET increased the sensitivity of establishing the correct
diagnosis of FTD (90.5%) compared to MRI atrophy patterns (63.5%). We have also recently
shown in a case that initially presented with PNFA and later evolved to CBS with underlying
FTLD-U/TDP43 pathology due to a novel PGRN mutation that longitudinal SPECT perfusion
loss in the less affected hemisphere occurred before atrophy had progressed on that side
[Gabryelewicz et al. 2010]. Similarly, in two cases of very early stage FTD followed
longitudinally, neuroimaging can be initially normal, but when perfusion abnormalities and
atrophy are eventually shown on SPECT and MRI, respectively, the perfusion abnormalities are
more extensive than the atrophy patterns [Gregory et al. 1999].
Subcortical white matter disease may also be contributing to some of the clinically lateralized
dysfunction and should also be considered as a potential biomarker underlying asymmetry in
CBS. Examining our MRI data, close to 90% of CBS cases demonstrated hyperintensities in the
white matter on T2/PD sequences, and, in about 23%, these were localized contralateral to the
most affected side of the body correlating with side of maximal atrophy (15%) or occurred
contralateral to the motor deficits independent of atrophy in symmetrical cases (8%). This data is
descriptive, but supports the idea that some white matter hyperintensities do not just represent
age-associated microangiopathy [Levy-Cooperman et al. 2008b], but instead may be the result of
white matter glial damage related to CBD [Tan et al. 2005;Forman et al. 2002]. Our MRI-
pathological correlative data confirm this is indeed the case in CBS due to a variety of
pathologies. Recent diffusion tensor imaging (DTI) studies examining the integrity of white
matter tracts adds stronger evidence to this argument. Specifically, two studies have shown

168
reduced fractional anisotropy and increased mean diffusivity in CBS occurring contralateral to
the most affected side of the body compared to controls, suggesting that damage to the integrity
of white matter tracts may account for some of the contralateral clinical findings [Boelmans et al.
2009;Bozzali et al. 2008]. Another DTI study found that mean diffusivity was elevated in the
motor thalamus in CBD ipsilateral to the most affected hemisphere (i.e., contralateral to most
affected side of the body), while mean diffusivity was elevated bilaterally in anterior and medial
thalamic areas in PSP [Erbetta et al. 2009].
5.5.4 Limitations
In terms of limitations, although our sample size would be considered reasonably large given the
rarity of the CBS phenotype, from a statistical perspective, the sample was indeed small with a
low power to detect differences especially with the use of non-parametric measures as well as
with multivariate analyses. This was particularly evident in the SPM analyses that attempted to
correct for multiple testing. Other limitations include the fact that not all patients were able to
complete the neuropsychological tests given that their degree of dementia or alternatively degree
of motor disability may have precluded this. Along the same lines, it is difficult to know if
impaired performance on tasks that involve writing and drawing were affected by the cognitive
disruption, motor disability or both. As such, our neuropsychological data is likely biased in
favour of those with milder forms of CBS and this will further reduce the power of the analysis.
Another limitation is that we employed a qualitative instead of a quantitative analysis of the MRI
data since there were only 21 patients who completed MRIs that were not degraded by motion

169
artifact. Therefore, only about 2/3 of the sample had useable MRI data for a quantitative analysis,
which is currently in progress in an extended sample.
5.5.5 Conclusions
The current study provides a cross-sectional examination of neuropsychological, MRI and
SPECT features of a prospectively ascertained sample of CBS patients around the time of their
initial diagnosis with a subset followed until autopsy. It highlights the importance of having a
phenotypically well-characterized sample of patients diagnosed with CBS and provides new
insights into the neuropsychological and neuroimaging correlates of lateralized brain dysfunction
in the syndrome. Future studies will include analyzing neuropsychological, SPECT and MRI
changes longitudinally as the disease progresses with correlation to underlying pathology. Only
this kind of study will yield a true incidence of CBD and related pathological subtypes of the
syndrome. Finally, we believe that one of the issues that makes identification and replication of
genomic risk factors for neurodegenerative syndromes challenging is the significant
heterogeneity across these conditions. It will be increasingly necessary that groups share their
data in order to conduct larger studies, and, more importantly, efforts are made to develop novel
endophenotypes of these syndromes that will facilitate the identification of genomic and
epigenomic risk factors for CBS [Masellis et al. 2010].

170
Behavioural/Functional Measures Scores
Activities of daily living
DAD (%) [n=30] 68.8 ± 5.7
DAD ADL (%) 76.7 ± 5.9
DAD iADL (%) 63.9 ± 6.4
Neuropsychiatric symptoms
NPI total /144 [n=29] 12.1 ± 2.5
NPI apathy /12 3.5 ± 0.8
NPI appetite and eating behaviour /12 2.1 ± 0.6
NPI dysphoria/depression /12 1.3 ± 0.5
NPI night-time behaviour /12 1.2 ± 0.5
NPI irritability/lability /12 1.0 ± 0.4
NPI agitation/aggression /12 0.9 ± 0.4
NPI aberrant motor behaviour /12 0.6 ± 0.4
NPI disinhibition /12 0.5 ± 0.2
NPI anxiety /12 0.5 ± 0.2
NPI delusions /12 0.2 ± 0.2
NPI hallucinations /12 0.0 ± 0.0
NPI euphoria /12 0.0 ± 0.0
NPI caregiver distress /12 6.7 ± 7.5
Cornell Depression Scale (CSDD; %) [n=30] 22.8 ± 2.6 Supplementary Table 1. Mean scores (± SEM) on behavioural and functional measures in the CBS group.
The number of patients (n) tested is listed next to individual measures. Missing values are secondary to the inability
of the patient or caregiver to complete the test. DAD = Disability Assessment for Dementia; ADL = Activities of
daily living; iADL = Instrumental activities of daily living; NPI = Neuropsychiatric Inventory. CSDD = Cornell
Scale for Depression in Dementia.

171
6.0 Summary and General Discussion

172
6.0 Summary and General Discussion
This thesis has examined several aspects of CBS through the comprehensive study of 31 patients
who met criteria for the clinical syndrome [Boeve et al. 2003]. Multi-modal assessments were
used to characterize the patients including a detailed neurological examination by a movement
disorder and/ or cognitive neurologist with experience in diagnosing the condition,
comprehensive neuropsychological and neuropsychiatric testing, qualitative visual assessment of
MRI scans, and semi-quantitative assessment of SPECT perfusion images using both region of
interest and voxel-wise approaches to data analysis. Additionally, a subset of eight patients
underwent neuropathological examination in order to identify the underlying pathological
substrate of the syndrome and also to correlate imaging features with the burden of observed
pathology. Finally, two families that segregated CBS and related FTD spectrum disorders due to
PRGN mutation are discussed in terms of their heterogeneity in clinical and neuroimaging
findings. This thesis provides many new insights into aspects of CBS from both the genetic and
brain-behaviour correlative perspective and also confirms many findings of previous studies. The
overall thesis findings will now be discussed in the context of prior literature. Limitations and
future recommendations will be also be reviewed.
6.1 Representative sample
6.1.1 Demographic features
The mean age of onset in our CBS sample was approximately 65 years, and 61% of our sample
was female. Our basic demographics compare well to those of previously published case series
of CBS that have shown a mean age of onset of approximately 63 [Wenning et al. 1998] and 61

173
years [Murray et al. 2007] with a predominance of affected females in several studies
[Mahapatra et al. 2004]. Differences in age of onset between our study and others might reflect
the fact that these studies included only pathologically confirmed cases of CBD, some of whom
did not meet clinical criteria for CBS, while our study included clinically-diagnosed cases with a
small proportion of pathologically-confirmed ones. When we examined the age of onset in our 5
pathologically-confirmed cases of CBD, it was 64.8 (standard error of the mean 3.0) years
similar to that found in our entire patient sample.
6.1.2 Clinical and neuropsychological features
In terms of clinical features, about half of the patients presented with right-sided predominant
symptoms, while the left was most severely affected in the other half. This distribution of
asymmetry is consistent with other large studies [Huey et al. 2009a;Riley et al. 1990;Rinne et al.
1994;Shelley et al. 2009]. Overall, there does not seem to be a predilection for one hemisphere
over another, although this has been seen perhaps as an artifact in smaller samples by chance
alone [Chang et al. 2007]. At the time of their initial presentation, on average, about three years
into the course of the disease, the most common symptoms/signs were asymmetric rigidity and
apraxia, which eventually occurred in all patients. This was very similar to several large studies
[Kompoliti et al. 1998;Riley and Lang 2000;Rinne et al. 1994;Wenning et al. 1998].
Patients presenting with early dementia before the onset of motor features was also relatively
frequent affecting approximately 71% of the sample. The frequent occurrence of an early
dementia presentation is similar to previous studies [Bergeron et al. 1998;Grimes et al.
174
1999b;Mathuranath et al. 2000], although it may have been biased in our study because close to
2/3 of patients were recruited from a cognitive neurology clinic. However, there were some cases
with early dementia who presented to a movement disorders clinic initially. The presence of a
language or speech disturbance was also very common in our study. Cortical sensory loss
manifested by extinction to double blind tactile stimuli, agraphesthesia and/or astereognosis was
also relatively frequent followed by dystonia. Contrary to previous studies, alien limb
phenomenon in our cohort was uncommon, although limb levitation was relatively common.
This likely reflects the fact that many prior studies did not distinguish between these two
phenomena, as there is debate as to the true definition of alien-limb phenomenon (reviewed in
Boeve et al., 2003 Lang). Apart from the differences highlighted above, our cohort presented
with similar clinical features as previous cohorts [Bergeron et al. 1998;Grimes et al.
1999b;Mathuranath et al. 2000] suggesting our sample is representative.
As expected, compared to the normal control group, the CBS patients were significantly
impaired across all domains of cognitive functioning and were mildly demented based on MMSE
and MDRS scores. Most pronounced deficits were noted on tests of working memory, executive
functions, praxis, and visuospatial abilities. This cognitive profile is quite typical of prior studies
in CBS, which have shown frontal subcortical and visuospatial dysfunction as well as significant
apraxia, the latter being the most common finding [Graham et al. 2003b].
Another study compared several tasks of executive function using the Delis-Kaplan Executive
Function System (D-KEFS) in CBS to an FTD group [Huey et al. 2009a]. This study found that

175
although both groups exhibited prominent executive dysfunction, performance on most executive
tests tended to be worse in FTD except for tasks such as Trail Making and timed measures of the
Tower test. These tests require intact motor and visuospatial function that are more impaired in
CBS than in FTD [Huey et al. 2009a].
Episodic memory disturbance has also been documented, although this tends to be variable
across individual patients and based on severity of illness [Graham et al. 2003b]. It is thought to
reflect dysfunction of frontal subcortical circuits, rather than primary hippocampal involvement,
and, as such, episodic memory function in CBS also tends to be less affected than that seen in
AD [Graham et al. 2003b]. Two other studies have also confirmed relative preservation of
episodic memory function in CBS [Huey et al. 2009a;Murray et al. 2007]. Although we did not
compare episodic memory performance in our cohort directly with that of an AD cohort,
performance on delayed cued recall on the CVLT was better than delayed free recall supporting
the premise that it may be associated with poor use of strategic processes in encoding and
retrieval (i.e., frontal-subcortical dysfunction) as proposed by Pillon and Dubois [Pillon and
Dubois 2000].
Aphasia was commonly associated with CBS in our sample. Based on purely a clinical
assessment, 77% of patients had an observed language disturbance. This finding was strongly
supported using the WAB, a formal rating instrument of language function, as approximately
74% of the sample was identified as having an aphasic disturbance at the time of their initial
neuropsychological testing. Based on the data available, we were not able to determine how

176
many individuals had an associated apraxia of speech, which along with progressive non-fluent
aphasia, have been proposed to be clinical markers of both CBD and PSP pathology [Josephs and
Duffy 2008]. The most common language disturbances seen in our sample were anomic and non-
fluent aphasia subtypes, which are consistent with findings of previous studies [Ferrer et al.
2003;Frattali et al. 2000;Graham et al. 2003a;Kertesz et al. 2000b;McMonagle et al.
2006;Murray et al. 2007]. One patient had a Wernicke‟s aphasia, which has previously been
observed [McMonagle et al. 2006], while another patient had a conduction aphasia with
reasonably intact comprehension and fluency, but impaired repetition. Graham et al. [Graham et
al. 2003a] found that phonologic processing was impaired in a series of 10 unselected CBS
patients. Only two of their patients had a full syndrome of progressive non-fluent aphasia. In a
review of the literature that included 399 patients with CBS, 34% had aphasia, and, of 39
patients with sufficient language characterization to allow for stratification into different aphasic
groups, 56% of these patients had a non-fluent presentation [Graham et al. 2003b]. They
proposed that patients with early troubles in phonologic processing may represent part of the
same spectrum with PNFA being at the more severe extreme.
6.1.3 Neuropsychiatric features
The majority of CBS patients in our sample experienced neuropsychiatric symptoms. Apathy
was both the most frequent and severe symptom in CBS patients followed by abnormal
appetite/eating behaviour and depressive symptoms. Litvan et al [Litvan et al. 1998] used the
NPI 10-item version, which does not assess for abnormal appetite/eating behaviour or aberrant
night-time behaviour, to compare behavioural symptoms in 15 CBS and 34 PSP patients. In

177
contrast to our results, they found that depressive symptoms in CBS were more common than
apathy, the latter being more severe in PSP [Litvan et al. 1998]. Their CBS sample was smaller
than ours, which may have accounted for the difference seen between our sample and theirs.
Alternatively, it may reflect differences between the two groups in the caregivers‟ interpretation
of observed patient signs. Irrespective of these inter-group differences, both depression and
apathy have been shown to localize to overlapping regions of the limbic-prefrontal circuit, which
are affected in CBS.
To our knowledge, there have been no studies which directly correlate apathy or depressive
symptoms to specific brain areas in CBS. Dorsolateral prefrontal and anterior cingulate regions
have been shown to be hypometabolic in FDG-PET studies of primary depression [Liotti and
Mayberg 2001] and hypoperfused in ECD-SPECT studies of depressive symptoms associated
with AD [Levy-Cooperman et al. 2008a]. With respect to apathy, MRI studies have
demonstrated that atrophy in the dorsolateral prefrontal cortex and anterior cingulate gyrus was
associated with apathy in FTD [Zamboni et al. 2008]. Similarly, in Alzheimer‟s disease, apathy
was associated with reduced blood flow on SPECT in the anterior cingulate gyrus and
orbitofrontal regions [Lanctot et al. 2007]. Therefore, it is likely that these regions also play a
role in mediating apathy and depressive symptoms in CBS.
Similar to our results, Litvan et al. [Litvan et al. 1998] also found that irritability and agitation
were also relatively frequent in CBS. Symptoms of anxiety and disinhibition were more frequent
in our CBS patients than theirs; this difference likely occurred by chance due to small sample

178
sizes. A retrospective review of 36 pathologically-proven cases of CBD found that eight of these
patients had well-documented neuropsychiatric problems including: behavioural dyscontrol,
depression, compulsive behaviour, irritability and disinhibition [Geda et al. 2007]. The majority
of these eight patients had clinical diagnoses occurring along the spectrum of FTD, while only
two patients clinically had CBS [Geda et al. 2007]. The symptoms were identified
retrospectively and there was no use of formal psychometric measures to detect symptoms. Both
of these factors likely account for the lower occurrence of neuropsychiatric symptoms in this
study from the Mayo clinic compared to ours. However, we cannot exclude that the specificity of
identifying true CBD pathology may also be contributing to this discrepant finding between
samples. Other studies have confirmed the occurrence of frontal behaviours in CBS [Borroni et
al. 2009;Kertesz et al. 2000b]. None of our prospectively ascertained CBS patients experienced
visual hallucinations similar to findings of a retrospective review of 36 pathologically-proven
cases of CBD [Geda et al. 2007] and extending on the findings of a prospective study of 11
patients with CBS [Cooper and Josephs 2009] in a larger sample.
6. 2 Apraxia in CBS
As discussed in chapter 4, there have been inconsistent findings with respect to subtypes of limb
apraxia observed in CBS. Ideomotor apraxia is the most commonly documented apraxia with all
patients developing this at some point during the course of the disease followed by limb-kinetic
apraxia, although many studies did not examine specifically for this subtype. However, the
occurrence of conceptual/ ideational apraxia appears to be highly variable with several studies
not demonstrating this phenomenon, while others demonstrated it in 30 to 60% of the CBS

179
patients studied [Kertesz et al. 2000b;Leiguarda et al. 1994;Spatt et al. 2002]. There are several
reasons why conceptual/ ideational apraxia appears to be so variable in CBS and important
reasons include the way that this subtype is defined and also the fact that different rating
instruments have been used to assess for this phenomenon. In addition, one predicts that there
would be inconsistency in our ability to map conceptual/ ideational apraxia to specific brain
regions based on this variable nosology. However, other difficulties with characterizing this type
of apraxia may be even more fundamental in nature as discussed below.
Phenomenological confusion obviously exists because of the fact that „artificial‟
neuropsychological constructs, such as conceptual/ ideational apraxia, have been synthesized by
neuropsychologists, cognitive neurologists and behavioural scientists somewhat independently in
order explain observed behaviours. The reality is that praxis, especially relating to tool use, has
slowly evolved over time in response to evolutionary forces to which humans (and their
primitive ancestors) have been subjected. Therefore, definitions that we create and simplistic
models of clinical localization to discrete brain regions are likely to be inadequate in the study of
brain-behaviour relationships [Masellis et al. 2010], as emerging functional connectivity
methods are now revealing [Greicius et al. 2004].
Notwithstanding these issues, many questions remain unanswered with respect to limb praxis in
general and apraxia in neurodegenerative disease: Why does praxis appear to reside mainly in the
dominant hemisphere? What evolutionary forces (environmental factors) combined with
individual heritability (genes) caused the phenomenon to localize there? What disease specific

180
factors cause apraxia to manifest? Questions relating to the latter include: what specific
hemispheric, cortical and subcortical lobar involvement predisposes to the different subtypes of
apraxia and what are the specific effects of the underlying neurodegenerative pathology in
determining apraxia? Answers to these questions will have to come from well-designed
prospective and longitudinal neuroimaging and neuropsychological studies of corticobasal
syndrome followed to death with subsequent histopathological, genomic and epigenomic
analyses.
6.3 Comment on the neuroimaging methods
The current study is unique in that SPECT imaging was analyzed using two different approaches.
This included the unbiased, „top-down‟ SPM method, which is more stringent, in addition to the
hypothesis-driven, „bottom-up‟ ROI method, which examines mean perfusion differences
referenced to the cerebellum across select brain regions hypothesized to be involved in the
pathophysiology of disease. Although both methods often identify the same regions affected in
the between group comparisons, occasionally there was no overlap seen. This is because the
methods look at the data in different ways. Statistical parametric maps are image processes based
on voxel values relating to intensity in the case of SPECT, that, under the null hypothesis, fall
under a known distribution such as the Student‟s t- or F distributions
(http://www.fil.ion.ucl.ac.uk/spm/doc/intro/). Multivariate analysis of covariance is performed
on a voxel-by-voxel basis using the general linear model and Gaussian Random Field theory to
make inferences about the spatially extended data (http://www.fil.ion.ucl.ac.uk/spm/doc/intro/).
Voxels of altered intensity that cluster together and survive correction for multiple testing

181
identify areas of altered perfusion between or within groups depending on the type of association
being performed. Contrast this to the ROI method that looks at the mean perfusion in a defined
region of interest (ROI) referenced to the cerebellum. The number of voxels within that region is
pre-defined and the ROIs are based on a template map that is usually traced on a structural MRI.
The use of the ROI method may facilitate the identification of potentially „false negative‟ areas
(type II errors) of reduced perfusion missed by the stringent SPM analysis, while at the same
time the SPM method may either identify important smaller regions of reduced perfusion
„washed out‟ in the larger ROI or alternatively emphasize the most strongly hypoperfused
regions in the CBS group. In this way, the methods are used in synergy to capture the most
salient regions of reduced perfusion in CBS.
As described in the introduction, two main functional neuroimaging techniques, PET and
SPECT, have been used to characterize CBS from the perspective of alterations in cerebral
metabolism and perfusion, respectively. A brief discussion of these two nuclear medicine
imaging modalities will now be provided in order to contrast strengths and weaknesses of both
techniques. The literature will also be reviewed in terms of how they compare with respect to
ability to assist in the accurate diagnosis of dementia. The focus of the discussion will be on
FDG-PET compared to HMPAO- or ECD-SPECT.
The basic underlying principles of PET and SPECT neuroimaging are similar: a radionuclide-
labeled tracer is given intravenously and is taken up by the brain and based on its kinetic
properties (absorption, distribution and metabolism) combined with the decay of the radionuclide

182
and the detection of the latter, images of the brain can be obtained that demonstrate relative
distribution of the tracer in different cerebral regions. For the most part, cerebral glucose
metabolism parallels cerebral perfusion, but occasionally this relationship breaks down in the
presence of cerebrovascular disease [Silverman 2004]. The most commonly used PET tracer is
18F-fluorodeoxyglucose (FDG), which serves as a marker of cerebral glucose metabolism [Bailey
et al. 2005;Frackowiak and Friston 1994]. The radioactively-labeled 18F isotope is synthesized
in a cyclotron by accelerating protons into the nuclei of fluorine atoms. This results in fluorine
with an extra proton in the nucleus producing an unstable isotope, 18F, with a relatively short
half-life. The 18F isotope is then incorporated into the deoxyglucose molecule forming FDG.
FDG is then administered to the subject intravenously and gets distributed regionally in the brain
reflecting cerebral glucose metabolism. After a delay to ensure the appropriate uptake of FDG in
the brain, the subject is placed in a PET scanner, which is comprised of arrays of gamma ray
detectors that encircle the subject‟s head. As the isotope undergoes positron emission decay, the
emitted positron travels a very short distance usually in the range of millimeters dissipating
energy until it encounters an electron. The interaction between the positron and the electron
annihilate each other and results in two gamma photons that travel in opposite directions from
each other. The gamma detectors that encircle the subject‟s head are set up in such a way as to
only detect coincident gamma photons, that are, ones detected simultaneously by two detectors
oriented directly across from each other. The scanner, therefore, detects the site of the
annihilation event and the distance between this and the emitting nucleus limits the spatial
resolution of the technique. During the scanning process, multiple detections are obtained all
oriented along lines each in one plane or slice and from these reconstructed images of the three-
dimensional brain can be derived.

183
Brain SPECT has some important fundamental differences that result in practical advantages and
important limitations of this technique compared to PET [Rahmim and Zaidi 2008]. SPECT also
uses radionuclide tracers to study CBS and other dementias with the most common ones being,
Tc99-HMPAO and -ECD, and these are taken up at a rate that is proportional to cerebral blood
flow [Matsuda et al. 1995]. Therefore, SPECT provides a measure of regional cerebral perfusion
to the brain as opposed to glucose metabolism. SPECT tracers also emit gamma radiation.
However, the gamma photon is detected directly by a camera comprised of a series of physical
collimators lying over detection crystals and photomultiplier arrays. The collimators reject
photons that are not within a small angular range thereby facilitating the localization of the origin
of the gamma ray [Rahmim and Zaidi 2008]. The gamma camera usually rotates 360 degrees
around the patient‟s head allowing for two dimensional images that can then be reconstructed
into a three-dimensional view of the brain. Because the camera only detects one gamma photon
for every emission event, the spatial resolution of SPECT is much lower than that of PET and
this is a relative weakness of the technique [Rahmim and Zaidi 2008]. On the other hand, the
main advantage of this technique has to do with cost and availability. This is because the
radionuclide tracers typically used are more stable in terms of their gamma decay and can
therefore be synthesized off-site and transported to the imaging centre. In other words, there is
no need for a cyclotron on site to synthesize the compounds. In addition, the cameras used are
typically less expensive than the PET scanner technology. As a result of these factors, SPECT
imaging can be acquired more quickly, is significantly cheaper and is more widely available
[Colloby and O'Brien 2004].

184
There have been a few studies that have compared SPECT and PET in the same group of patients
with Alzheimer‟s disease in order to determine the ability of these investigations to improve
diagnostic accuracy [Silverman 2004]. In general, the degree of hypometabolism detected by
FDG-PET is usually greater than the magnitude of hypoperfusion abnormalities seen with
perfusion SPECT although the regions of deficit observed by both methods are similar for AD
[Silverman 2004]. Side-by-side FDG-PET and perfusion SPECT studies of AD have
demonstrated higher sensitivity and diagnostic accuracy of FDG-PET [Silverman 2004]. Studies
using high-resolution SPECT cameras have shown that perfusion SPECT has 15 to 20% reduced
accuracy in the diagnosis of AD compared to FDG-PET [Mielke and Heiss 1998]. An important
study that compared 26 patients with AD to six healthy controls using both HMPAO-SPECT and
FDG-PET data in a voxel-wise analysis found that the correlation across the whole brain using
both methods achieved statistical significance, but the strength of the association was weak
(average correlation coefficient [r] across all patients = 0.43) [Herholz et al. 2002]. However,
this correlation improved substantially when the analysis was restricted to clusters of abnormal
voxels in the temporoparietal and the posterior cingulate association cortices (r=0.90) [Herholz et
al. 2002]. Despite this improved correlation, the tracer uptake reductions using FDG-PET were
substantially more pronounced than that observed with HMPAO-SPECT indicating the former to
be more sensitive in detecting abnormalities [Herholz et al. 2002]. In addition, although tracer
uptake reductions correlated with severity of the dementia using both methods, the correlation
was stronger for PET compared to SPECT [Herholz et al. 2002]. Finally, this study also showed
that distinction of AD patients from controls was better over a wider range of z-thresholds for
FDG-PET than HMPAO-SPECT indicating increased sensitivity of the former [Herholz et al.
2002]. A more recent study compared the sensitivities of mesiotemporal atrophy on MRI,

185
reduced perfusion/hypometabolism in temporoparietal and posterior cingulate cortices on ECD-
SPECT/FDG-PET, respectively, and CSF biomarkers of beta-amyloid 1-42, total tau and
phosphorylated tau in 207 AD patients of varying severity [Morinaga et al. 2010].
Mesiotemporal atrophy on MRI was identified in 77.4%, reduced perfusion and metabolism in
the pre-defined regions in 81.6% (ECD-SPECT) and 93.1% (FDG-PET), and the typical CSF
profile for AD (that is, reduced beta-amyloid and increased total and phosphorylated tau) in 94%
of all the AD patients [Morinaga et al. 2010]. Using the Clinical Dementia Rating (CDR) scale,
used to assess severity of dementia with higher scores being more severe, they observed that all
investigations were sensitive at a CDR of 2, whereas at a CDR of 1 only the FDG-PET and CSF
biomarkers showed high sensitivity [Morinaga et al. 2010]. Finally at the mildest stages of
disease (CDR of 0.5), usually corresponding to cases of amnestic mild cognitive impairment,
only CSF biomarkers showed high sensitivity [Morinaga et al. 2010]. Limitations of this study
were that there was no control group so a discriminant function analysis could not be done, and
also that cases were not pathologically confirmed.
6.4 Can CBS serve as a model of etiology for common sporadic disorders?
Although CBS is a rare syndrome, it can serve as a good model of complex disease due to a
variety of observations. As discussed throughout this thesis, there is substantial pathological
heterogeneity that can produce the syndrome and this can make it difficult to identify genetic and
environmental factors that increase risk for the disease in clinically diagnosed cases. As shown
by recent studies in FTD and PSP, increasing the homogeneity of the sample by inclusion of only
one specific pathological subtype, for example, recent genome wide association studies (GWAS)

186
of FTLD-U/ TDP43 and PSP pathological cases, makes it easier to identify genetic risk factors
for the disease [Hoglinger et al. 2011;Van Deerlin et al. 2010]. In CBS, the pathological
heterogeneity can account for the multiple disease susceptibility loci observed (i.e., genetic
heterogeneity), for example, MAPT and PGRN mutations. However, within patients having a
pathological diagnosis of CBD, there are likely other disease susceptibility loci that have not yet
been discovered that can produce the typical pathology. The reason for this may be that different
pathways in the processing of the MAPT gene and the tau protein might yield the final common
pathology of CBD and therefore a systems biology approach will be helpful in sorting out the
genetic heterogeneity of the disease [Noorbakhsh et al. 2009]. Genetic modifiers may also
contribute to the heterogeneity of the CBS as demonstrated by a study identifying that common
variants in the TMEM106B gene can increase risk for FTLD-U/ TDP43 pathology even within
those harbouring PGRN mutations [Van Deerlin et al. 2010]. Clinical phenotypic variability is
due mainly to the area of the brain most affected by the underlying pathology and this may also
lead to misdiagnosis, which will further confound genetic studies of CBS. Finally, using PRGN
mutation as an example, the age of onset of individuals with FTD and/ or CBS due to PGRN
mutation is highly variable with some not developing disease until their late 80s [Kelley et al.
2009] and this may result in apparent incomplete penetrance of the disease-causing gene
mutation. All of these features of CBS can be observed in complex, non-Mendelian diseases.
Common neurodegenerative diseases, such as Alzheimer‟s and Parkinson‟s disease, are generally
considered sporadic disorders although rarely Mendelian segregation within families is observed
due to identified disease-causing mutations. This is similar to that observed in CBS and given the
rarity of CBS as a clinical entity, one can assume that there are even more numerous pathways

187
leading to AD and PD pathology and that these routes are even more complex in nature.
Recently, through the application of GWAS in very large, multicentre case-control cohorts,
several genes for many of the common neurodegenerative disorders have been identified, each of
which confers an incremental risk to individuals possessing the gene variants [2011;Do et al.
2011;Hollingworth et al. 2011;Naj et al. 2011;Nalls et al. 2011]. The genes include ones already
known to be involved in the underlying pathology of these disorders, for example, apolipoprotein
E (APOE) for Alzheimer‟s disease and alpha-synuclein (SNCA) for Parkinson‟s disease, as well
as many novel genes. The exact role that these genes play and the regional effects that their
variants have on the brain and secondarily on neurological and cognitive functions are mostly
unknown. Based on what we have learned about CBS, it is hypothesized that certain variants,
alone or in combination, strongly increase or decrease risk for these common neurodegenerations
in smaller subsets of the large GWAS samples rather than conferring a small risk to the entire
patient sample, that is, genetic heterogeneity. Other mechanisms of disease within these
identified candidate genes flagged by the GWAS, such as epigenomic factors, for example, DNA
methylation, must also be considered. In order to sort out the complexities of the
neurodegenerations in the post-genomics era, novel approaches such as “reverse phenotyping”
will be required in order to understand the regional brain effects that these genomic and
epigenomic factors have [Joober 2011;Schulze and McMahon 2004].

188
7.0 Conclusions and future directions

189
7.0 Conclusions and future directions
Corticobasal syndrome (CBS) is a unique cognitive and motor disorder. Better understanding of
this rare clinical entity with respect to etiology, clinical and neuroimaging features will provide
new insights that should improve our research approach to other more common, complex
neurodegenerative disorders, such as AD and PD. This thesis work has demonstrated genetic and
pathological heterogeneity underlying the CBS with discovery that PGRN mutation – producing
FTLD-U/ TDP43 pathology – can manifest as a fairly classical picture of the syndrome from the
clinical, cognitive, and neuroimaging perspective. It underscores the importance of obtaining
brain tissue for histopathological study as identification of the underlying pathology will
facilitate subgrouping of clinical cases based on pathology so that heterogeneity is reduced in the
attempts to discover underlying genetic factors.
Furthermore, the well-characterized clinical sample of CBS patients used in this study has
allowed us to expand our understanding of the different phenotypic presentations of the CBS and
associated clinical, cognitive and neuroimaging features. Those presenting with early dementia
tended to have the right side of the body most affected and also had more significant language
dysfunction indicating that the burden of underlying pathology was most pronounced in the left
hemisphere although the SPECT and MRI studies did not confirm this. Apart from issues related
to reduced power, we hypothesize that the reason leftwards asymmetry on MRI and SPECT was
not seen may be because, at the stage that the patients were studied, the microscopic pathology
that might have been asymmetrically more pronounced on the left did not appear to translate into
changes that could be detected in vivo using neuroimaging. The contrary was seen in the early
motor group who tended to have the left side of the body most affected with significant
reductions in perfusion involving the right supplementary and premotor areas.

190
We have also shown that even within the same family, there can be substantial heterogeneity in
clinical presentation due to the same PGRN mutation. The reason for this is that although the
predicted pathology in the brain will be the same in the affected family members, the
hemispheric and lobar localization of the pathology and its severity will determine the observed
clinical syndrome. Therefore, studies that focus on attempting to discern early imaging and other
biomarkers of disease that can predict a specific underlying pathological type in vivo will be
challenged by this heterogeneity in clinical presentation. We propose that future studies
attempting to look for early biological risk factors of CBS will need to examine subgroups of
CBS patients that are classified according to genetic or pathological type, as well as classified
according to in vivo hemispheric and lobar localization on neuroimaging, or even cognitive
endophenotypes, comparing “OMIC” measures across these subgroups. Since the sample size
within each subgroup will likely be small, multicentre studies will be necessary in order to
enhance the sample and thereby power of this approach.
Brain-behavioural correlative studies in CBS are an important line of research that can further
enhance our understanding of the phenomenon observed in the syndrome. This is exemplified by
our study examining severity of ideomotor apraxia and its association with hypoperfusion in the
left inferior parietal lobule. The inconsistencies across studies in terms of localization of limb
apraxia in CBS stem largely from differences in the tools used to assess this phenomenon and
also from the different nosologies used to describe the subtypes of apraxia to date. Investigators
working in this field will have to decide upon accepted diagnostic tools and definitions such that

191
studies are performed in a consistent fashion. We anticipate that this will resolve many of the
inconsistencies in the apraxia literature.
As our CBS sample size increases, we anticipate completing multi-modal neuroimaging analyses
including MRI brain with assessment of both grey matter atrophy and quantification of
underlying white matter disease using our on-site developed program, Lesion Explorer [Ramirez
et al. 2011], diffusion tensor imaging in a subset of patients, combined with brain SPECT
perfusion. We also plan on correlating this imaging dataset with a comprehensive assessment of
apraxia using a conceptual model in order to better identify the neuroanatomical correlates of the
different apraxia subtypes [Stamenova et al. 2011]. Finally, in a subset of the CBS cases,
longitudinal neuropsychological and neuroimaging data is available and further analysis of this
data will allow us to track the progression of the disease in terms of the most affected brain
regions and how these correlate with the neuropsychological and pathological measures over
time. Only this kind of longitudinal study will allow us to develop better in vivo biomarkers of
underlying pathology.

192
8.0 References

193
8.0 References
A two-stage meta-analysis identifies several new loci for Parkinson's disease. PLoS Genet 2011;
7: e1002142.
Ahmed Z, Mackenzie IR, Hutton ML, Dickson DW. Progranulin in frontotemporal lobar
degeneration and neuroinflammation. J Neuroinflammation 2007; 4: 7.
Alexopoulos GS, Abrams RC, Young RC, Shamoian CA. Cornell Scale for Depression in
Dementia. Biol Psychiatry 1988; 23: 271-284.
Andreadis A, Brown WM, Kosik KS. Structure and novel exons of the human tau gene.
Biochemistry 1992; 31: 10626-10633.
Bailey DL, Townsend DW, Valk PE, Maisey MN. Positron Emission Tomography: Basic
Sciences. Secaucus, NJ: Springer-Verlag; 2005.
Bak TH, Caine D, Hearn VC, Hodges JR. Visuospatial functions in atypical parkinsonian
syndromes. J Neurol Neurosurg Psychiatry 2006; 77: 454-456.
Baker KE, Parker R. Nonsense-mediated mRNA decay: terminating erroneous gene expression.
Curr Opin Cell Biol 2004; 16: 293-299.
Baker M, Mackenzie IR, Pickering-Brown SM et al. Mutations in progranulin cause tau-negative
frontotemporal dementia linked to chromosome 17. Nature 2006.
Ball JA, Lantos PL, Jackson M, Marsden CD, Scadding JW, Rossor MN. Alien hand sign in
association with Alzheimer's histopathology. J Neurol Neurosurg Psychiatry 1993; 56: 1020-
1023.
Beck J, Rohrer JD, Campbell T et al. A distinct clinical, neuropsychological and radiological
phenotype is associated with progranulin gene mutations in a large UK series. Brain 2008; 131:
706-720.
Benussi L, Binetti G, Sina E et al. A novel deletion in progranulin gene is associated with FTDP-
17 and CBS. Neurobiol Aging 2008; 29: 427-435.
Benussi L, Ghidoni R, Pegoiani E, Moretti DV, Zanetti O, Binetti G. Progranulin
Leu271LeufsX10 is one of the most common FTLD and CBS associated mutations worldwide.
Neurobiol Dis 2009; 33: 379-385.
Bergeron C, Davis A, Lang AE. Corticobasal ganglionic degeneration and progressive
supranuclear palsy presenting with cognitive decline. Brain Pathol 1998; 8: 355-365.
Berget SM. Exon recognition in vertebrate splicing. J Biol Chem 1995; 270: 2411-2414.

194
Blair JR, Spreen O. Predicting premorbid IQ: A revision of the National Adult Reading Test.
Clinical Neuropsychologist 1989; 3: 129-136.
Blin J, Vidailhet MJ, Pillon B, Dubois B, Feve JR, Agid Y. Corticobasal degeneration: decreased
and asymmetrical glucose consumption as studied with PET. Mov Disord 1992; 7: 348-354.
Boelmans K, Bodammer NC, Suchorska B et al. Diffusion tensor imaging of the corpus
callosum differentiates corticobasal syndrome from Parkinson's disease. Parkinsonism Relat
Disord 2010; 16: 498-502.
Boelmans K, Kaufmann J, Bodammer N et al. Involvement of motor pathways in corticobasal
syndrome detected by diffusion tensor tractography. Mov Disord 2009; 24: 168-175.
Boeve BF, Hutton M. Refining frontotemporal dementia with parkinsonism linked to
chromosome 17: introducing FTDP-17 (MAPT) and FTDP-17 (PGRN). Arch Neurol 2008; 65:
460-464.
Boeve BF, Lang AE, Litvan I. Corticobasal degeneration and its relationship to progressive
supranuclear palsy and frontotemporal dementia. Ann Neurol 2003; 54 Suppl 5: S15-S19.
Boeve BF, Maraganore DM, Parisi JE et al. Pathologic heterogeneity in clinically diagnosed
corticobasal degeneration. Neurology 1999; 53: 795-800.
Boeve BF, Maraganore DM, Parisi JE et al. Corticobasal degeneration and frontotemporal
dementia presentations in a kindred with nonspecific histopathology. Dement Geriatr Cogn
Disord 2002; 13: 80-90.
Borroni B, Alberici A, Agosti C, Cosseddu M, Padovani A. Pattern of behavioral disturbances in
corticobasal degeneration syndrome and progressive supranuclear palsy. Int Psychogeriatr 2009;
21: 463-468.
Borroni B, Archetti S, Alberici A et al. Progranulin genetic variations in frontotemporal lobar
degeneration: evidence for low mutation frequency in an Italian clinical series. Neurogenetics
2008a; 9: 197-205.
Borroni B, Garibotto V, Agosti C et al. White matter changes in corticobasal degeneration
syndrome and correlation with limb apraxia. Arch Neurol 2008b; 65: 796-801.
Boxer AL, Geschwind MD, Belfor N et al. Patterns of brain atrophy that differentiate
corticobasal degeneration syndrome from progressive supranuclear palsy. Arch Neurol 2006; 63:
81-86.
Bozzali M, Cercignani M, Baglio F et al. Voxel-wise analysis of diffusion tensor MRI improves
the confidence of diagnosis of corticobasal degeneration non-invasively. Parkinsonism Relat
Disord 2008; 14: 436-439.
Brouwers N, Sleegers K, Engelborghs S et al. Genetic variability in progranulin contributes to
risk for clinically diagnosed Alzheimer disease. Neurology 2008; 71: 656-664.

195
Brown J, Lantos PL, Roques P, Fidani L, Rossor MN. Familial dementia with swollen
achromatic neurons and corticobasal inclusion bodies: a clinical and pathological study. J Neurol
Sci 1996; 135: 21-30.
Brown J, Lantos PL, Rossor MN. Familial dementia lacking specific pathological features
presenting with clinical features of corticobasal degeneration. J Neurol Neurosurg Psychiatry
1998; 65: 600-603.
Bryden MP. Measuring handedness with questionnaires. Neuropsychologia 1977; 15: 617-624.
Bugiani O, Murrell JR, Giaccone G et al. Frontotemporal dementia and corticobasal
degeneration in a family with a P301S mutation in tau. J Neuropathol Exp Neurol 1999; 58: 667-
677.
Buxbaum LJ, Kyle K, Grossman M, Coslett HB. Left inferior parietal representations for skilled
hand-object interactions: evidence from stroke and corticobasal degeneration. Cortex 2007; 43:
411-423.
Caffrey TM, Wade-Martins R. Functional MAPT haplotypes: bridging the gap between genotype
and neuropathology. Neurobiol Dis 2007; 27: 1-10.
Cairns NJ, Bigio EH, Mackenzie IR et al. Neuropathologic diagnostic and nosologic criteria for
frontotemporal lobar degeneration: consensus of the Consortium for Frontotemporal Lobar
Degeneration. Acta Neuropathol 2007; 114: 5-22.
Cannon A, Baker M, Boeve B et al. CHMP2B mutations are not a common cause of
frontotemporal lobar degeneration. Neurosci Lett 2006; 398: 83-84.
Casseron W, Azulay JP, Guedj E, Gastaut JL, Pouget J. Familial autosomal dominant cortico-
basal degeneration with the P301S mutation in the tau gene: an example of phenotype variability.
J Neurol 2005; 252: 1546-1548.
Chainay H, Humphreys GW. Ideomotor and ideational apraxia in corticobasal degeneration: a
case study. Neurocase 2003; 9: 177-186.
Chang KH, Chuang CC, Lyu RK et al. Clinical characteristics of corticobasal syndrome amongst
Chinese in Taiwan. Parkinsonism Relat Disord 2007; 13: 219-223.
Chen-Plotkin AS, Yuan W, Anderson C et al. Corticobasal syndrome and primary progressive
aphasia as manifestations of LRRK2 gene mutations. Neurology 2008; 70: 521-527.
Cilia R, Rossi C, Frosini D et al. Dopamine Transporter SPECT Imaging in Corticobasal
Syndrome. PLoS One 2011; 6: e18301.
Cohen L, Dehaene S, Naccache L et al. The visual word form area: spatial and temporal
characterization of an initial stage of reading in normal subjects and posterior split-brain patients.
Brain 2000; 123 ( Pt 2): 291-307.

196
Colloby S, O'Brien J. Functional imaging in Parkinson's disease and dementia with Lewy bodies.
J Geriatr Psychiatry Neurol 2004; 17: 158-163.
Cooper AD, Josephs KA. Photophobia, visual hallucinations, and REM sleep behavior disorder
in progressive supranuclear palsy and corticobasal degeneration: a prospective study.
Parkinsonism Relat Disord 2009; 15: 59-61.
Cordivari C, Misra VP, Catania S, Lees AJ. Treatment of dystonic clenched fist with botulinum
toxin. Mov Disord 2001; 16: 907-913.
Coulier IM, de Vries JJ, Leenders KL. Is FDG-PET a useful tool in clinical practice for
diagnosing corticobasal ganglionic degeneration? Mov Disord 2003; 18: 1175-1178.
Crowe RR. Candidate genes in psychiatry: an epidemiological perspective. Am J Med Genet
1993; 48: 74-77.
Cruts M, Gijselinck I, van der ZJ et al. Null mutations in progranulin cause ubiquitin-positive
frontotemporal dementia linked to chromosome 17q21. Nature 2006.
Cummings JL. The Neuropsychiatric Inventory: assessing psychopathology in dementia patients.
Neurology 1997; 48: S10-S16.
Darvesh S, Leach L, Black SE, Kaplan E, Freedman M. The behavioural neurology assessment.
Can J Neurol Sci 2005; 32: 167-177.
Delis DC, Kramer JH, Kaplan E, Ober BA. California Verbal Learning Test: Adult Version. San
Antonio: Psychological Corporation; 1987.
Denny-Brown D, Meyer JS, Horenstein S. The significance of perceptual rivalry resulting from
parietal lesion. Brain 1952; 75: 433-471.
Desgranges B, Baron JC, de lS, V et al. The neural substrates of memory systems impairment in
Alzheimer's disease. A PET study of resting brain glucose utilization. Brain 1998; 121 ( Pt 4):
611-631.
Di Maria E., Tabaton M, Vigo T et al. Corticobasal degeneration shares a common genetic
background with progressive supranuclear palsy. Ann Neurol 2000; 47: 374-377.
Dickson DW, Bergeron C, Chin SS et al. Office of Rare Diseases neuropathologic criteria for
corticobasal degeneration. J Neuropathol Exp Neurol 2002; 61: 935-946.
Do CB, Tung JY, Dorfman E et al. Web-based genome-wide association study identifies two
novel loci and a substantial genetic component for Parkinson's disease. PLoS Genet 2011; 7:
e1002141.
Eidelberg D, Dhawan V, Moeller JR et al. The metabolic landscape of cortico-basal ganglionic
degeneration: regional asymmetries studied with positron emission tomography. J Neurol
Neurosurg Psychiatry 1991; 54: 856-862.

197
Erbetta A, Mandelli ML, Savoiardo M et al. Diffusion tensor imaging shows different
topographic involvement of the thalamus in progressive supranuclear palsy and corticobasal
degeneration. AJNR Am J Neuroradiol 2009; 30: 1482-1487.
Ferrer I, Hernandez I, Boada M et al. Primary progressive aphasia as the initial manifestation of
corticobasal degeneration and unusual tauopathies. Acta Neuropathol 2003; 106: 419-435.
Finch N, Baker M, Crook R et al. Plasma progranulin levels predict progranulin mutation status
in frontotemporal dementia patients and asymptomatic family members. Brain 2009; 132: 583-
591.
Folstein MF, Folstein SE, McHugh PR. "Mini-mental state". A practical method for grading the
cognitive state of patients for the clinician. J Psychiatr Res 1975; 12: 189-198.
Forman MS, Zhukareva V, Bergeron C et al. Signature tau neuropathology in gray and white
matter of corticobasal degeneration. Am J Pathol 2002; 160: 2045-2053.
Frackowiak RS, Friston KJ. Functional neuroanatomy of the human brain: positron emission
tomography--a new neuroanatomical technique. J Anat 1994; 184 ( Pt 2): 211-225.
Frattali CM, Grafman J, Patronas N, Makhlouf F, Litvan I. Language disturbances in
corticobasal degeneration. Neurology 2000; 54: 990-992.
Frisoni GB, Pizzolato G, Zanetti O, Bianchetti A, Chierichetti F, Trabucchi M. Corticobasal
degeneration: neuropsychological assessment and dopamine D2 receptor SPECT analysis. Eur
Neurol 1995; 35: 50-54.
Gabryelewicz T, Masellis M, Berdynski M et al. Intra-familial clinical heterogeneity due to
FTLD-U with TDP-43 proteinopathy caused by a novel deletion in progranulin gene (PGRN). J
Alzheimers Dis 2010; 22: 1123-1133.
Gallien P, Verin M, Rancurel G, De Marco O, Eden G. First familial cases of corticobasal
degeneration. 1998. p. A428.
Garraux G, Salmon E, Peigneux P et al. Voxel-based distribution of metabolic impairment in
corticobasal degeneration. Mov Disord 2000; 15: 894-904.
Gass J, Cannon A, Mackenzie IR et al. Mutations in progranulin are a major cause of ubiquitin-
positive frontotemporal lobar degeneration. Hum Mol Genet 2006; 15: 2988-3001.
Geda YE, Boeve BF, Negash S et al. Neuropsychiatric features in 36 pathologically confirmed
cases of corticobasal degeneration. J Neuropsychiatry Clin Neurosci 2007; 19: 77-80.
Gelinas I, Gauthier L, McIntyre M, Gauthier S. Development of a functional measure for persons
with Alzheimer's disease: the disability assessment for dementia. Am J Occup Ther 1999; 53:
471-481.

198
Genovese CR, Lazar NA, Nichols T. Thresholding of statistical maps in functional neuroimaging
using the false discovery rate. Neuroimage 2002; 15: 870-878.
Geschwind N. The apraxias: neural mechanisms of disorders of learned movement. Am Sci
1975; 63: 188-195.
Ghetti B, Spina S, Murrell JR et al. In vivo and postmortem clinicoanatomical correlations in
frontotemporal dementia and parkinsonism linked to chromosome 17. Neurodegener Dis 2008;
5: 215-217.
Gibb WR, Luthert PJ, Marsden CD. Corticobasal degeneration. Brain 1989; 112 ( Pt 5): 1171-
1192.
Gladsjo JA, Schuman CC, Evans JD, Peavy GM, Miller SW, Heaton RK. Norms for letter and
category fluency: demographic corrections for age, education, and ethnicity. Assessment 1999;
6: 147-178.
Goedert M, Ghetti B, Spillantini MG. Tau gene mutations in frontotemporal dementia and
parkinsonism linked to chromosome 17 (FTDP-17). Their relevance for understanding the
neurogenerative process. Ann N Y Acad Sci 2000; 920: 74-83.
Goedert M, Spillantini MG, Potier MC, Ulrich J, Crowther RA. Cloning and sequencing of the
cDNA encoding an isoform of microtubule-associated protein tau containing four tandem
repeats: differential expression of tau protein mRNAs in human brain. EMBO J 1989; 8: 393-
399.
Goedert M, Wischik CM, Crowther RA, Walker JE, Klug A. Cloning and sequencing of the
cDNA encoding a core protein of the paired helical filament of Alzheimer disease: identification
as the microtubule-associated protein tau. Proc Natl Acad Sci U S A 1988; 85: 4051-4055.
Goldenberg G. Apraxia and the parietal lobes. Neuropsychologia 2009; 47: 1449-1459.
Goldenberg G, Spatt J. The neural basis of tool use. Brain 2009; 132: 1645-1655.
Goodale MA, Milner AD. Separate visual pathways for perception and action. Trends Neurosci
1992; 15: 20-25.
Graham NL, Bak T, Patterson K, Hodges JR. Language function and dysfunction in corticobasal
degeneration. Neurology 2003a; 61: 493-499.
Graham NL, Bak TH, Hodges JR. Corticobasal degeneration as a cognitive disorder. Mov Disord
2003b; 18: 1224-1232.
Graham NL, Zeman A, Young AW, Patterson K, Hodges JR. Dyspraxia in a patient with
corticobasal degeneration: the role of visual and tactile inputs to action. J Neurol Neurosurg
Psychiatry 1999; 67: 334-344.

199
Gregory CA, Serra-Mestres J, Hodges JR. Early diagnosis of the frontal variant of
frontotemporal dementia: how sensitive are standard neuroimaging and neuropsychologic tests?
Neuropsychiatry Neuropsychol Behav Neurol 1999; 12: 128-135.
Greicius MD, Srivastava G, Reiss AL, Menon V. Default-mode network activity distinguishes
Alzheimer's disease from healthy aging: evidence from functional MRI. Proc Natl Acad Sci U S
A 2004; 101: 4637-4642.
Grimes DA, Bergeron CB, Lang AE. Motor neuron disease-inclusion dementia presenting as
cortical-basal ganglionic degeneration. Mov Disord 1999a; 14: 674-680.
Grimes DA, Lang AE, Bergeron CB. Dementia as the most common presentation of cortical-
basal ganglionic degeneration. Neurology 1999b; 53: 1969-1974.
Groschel K, Hauser TK, Luft A et al. Magnetic resonance imaging-based volumetry
differentiates progressive supranuclear palsy from corticobasal degeneration. Neuroimage 2004;
21: 714-724.
Gross RG, Grossman M. Update on apraxia. Curr Neurol Neurosci Rep 2008; 8: 490-496.
Grossman M, McMillan C, Moore P et al. What's in a name: voxel-based morphometric analyses
of MRI and naming difficulty in Alzheimer's disease, frontotemporal dementia and corticobasal
degeneration. Brain 2004; 127: 628-649.
Guerreiro RJ, Santana I, Bras JM et al. Novel progranulin mutation: screening for PGRN
mutations in a Portuguese series of FTD/CBS cases. Mov Disord 2008; 23: 1269-1273.
Hassan A, Whitwell JL, Boeve BF et al. Symmetric corticobasal degeneration (S-CBD).
Parkinsonism Relat Disord 2010; 16: 208-214.
Heaton RK. Wisconsin Card Sorting Manual. Odessa: Psychological Assessment Resources,
Inc.; 1981.
Heilman KM. Apraxia. In: Heilman KM, Valenstein E, editors. Clinical Neuropsychology. New
York: Oxford University Press; 1979.
Heilman KM, Rothi LJ, Valenstein E. Two forms of ideomotor apraxia. Neurology 1982; 32:
342-346.
Heilman KM, Rothi LJG. Apraxia. In: Heilman KM, Valenstein E, editors. Clinical
Neuropsychology. New York, Oxford: Oxford University Press; 1993. p. 141-64.
Herholz K, Schopphoff H, Schmidt M et al. Direct comparison of spatially normalized PET and
SPECT scans in Alzheimer's disease. J Nucl Med 2002; 43: 21-26.
Hodges JR, Spatt J, Patterson K. "What" and "how": evidence for the dissociation of object
knowledge and mechanical problem-solving skills in the human brain. Proc Natl Acad Sci U S A
1999; 96: 9444-9448.

200
Hoglinger GU, Melhem NM, Dickson DW et al. Identification of common variants influencing
risk of the tauopathy progressive supranuclear palsy. Nat Genet 2011; 43: 699-705.
Hollingworth P, Harold D, Sims R et al. Common variants at ABCA7, MS4A6A/MS4A4E,
EPHA1, CD33 and CD2AP are associated with Alzheimer's disease. Nat Genet 2011; 43: 429-
435.
Hosaka K, Ishii K, Sakamoto S et al. Voxel-based comparison of regional cerebral glucose
metabolism between PSP and corticobasal degeneration. J Neurol Sci 2002; 199: 67-71.
Hossain AK, Murata Y, Zhang L et al. Brain perfusion SPECT in patients with corticobasal
degeneration: analysis using statistical parametric mapping. Mov Disord 2003; 18: 697-703.
Houlden H, Baker M, Morris HR et al. Corticobasal degeneration and progressive supranuclear
palsy share a common tau haplotype. Neurology 2001; 56: 1702-1706.
Huey ED, Goveia EN, Paviol S et al. Executive dysfunction in frontotemporal dementia and
corticobasal syndrome. Neurology 2009a; 72: 453-459.
Huey ED, Pardini M, Cavanagh A et al. Association of ideomotor apraxia with frontal gray
matter volume loss in corticobasal syndrome. Arch Neurol 2009b; 66: 1274-1280.
Hutton M. Missense and splice site mutations in tau associated with FTDP-17: multiple
pathogenic mechanisms. Neurology 2001; 56: S21-S25.
Hutton M, Lendon CL, Rizzu P et al. Association of missense and 5'-splice-site mutations in tau
with the inherited dementia FTDP-17. Nature 1998; 393: 702-705.
Ince PG, Morris JC. Demystifying lobar degenerations: tauopathies vs Gehrigopathies.
Neurology 2006; 66: 8-9.
Jacobs DH, Adair JC, Macauley B, Gold M, Gonzalez Rothi LJ, Heilman KM. Apraxia in
corticobasal degeneration. Brain Cogn 1999; 40: 336-354.
Joober R. The 1000 Genomes Project: deep genomic sequencing waiting for deep psychiatric
phenotyping. J Psychiatry Neurosci 2011; 36: 147-149.
Josephs KA, Ahmed Z, Katsuse O et al. Neuropathologic features of frontotemporal lobar
degeneration with ubiquitin-positive inclusions with progranulin gene (PGRN) mutations. J
Neuropathol Exp Neurol 2007; 66: 142-151.
Josephs KA, Duffy JR. Apraxia of speech and nonfluent aphasia: a new clinical marker for
corticobasal degeneration and progressive supranuclear palsy. Curr Opin Neurol 2008; 21: 688-
692.
Josephs KA, Petersen RC, Knopman DS et al. Clinicopathologic analysis of frontotemporal and
corticobasal degenerations and PSP. Neurology 2006; 66: 41-48.

201
Josephs KA, Tang-Wai DF, Edland SD et al. Correlation between antemortem magnetic
resonance imaging findings and pathologically confirmed corticobasal degeneration. Arch
Neurol 2004; 61: 1881-1884.
Josephs KA, Whitwell JL, Dickson DW et al. Voxel-based morphometry in autopsy proven PSP
and CBD. Neurobiol Aging 2008; 29: 280-289.
Juh R, Pae CU, Kim TS, Lee CU, Choe B, Suh T. Cerebral glucose metabolism in corticobasal
degeneration comparison with progressive supranuclear palsy using statistical mapping analysis.
Neurosci Lett 2005; 383: 22-27.
Kas A, de Souza LC, Samri D et al. Neural correlates of cognitive impairment in posterior
cortical atrophy. Brain 2011; 134: 1464-1478.
Kelley BJ, Haidar W, Boeve BF et al. Prominent phenotypic variability associated with
mutations in Progranulin. Neurobiol Aging 2009; 30: 739-751.
Kertesz A. Pick Complex: an integrative approach to frontotemporal dementia: primary
progressive aphasia, corticobasal degeneration, and progressive supranuclear palsy. Neurologist
2003; 9: 311-317.
Kertesz A. Frontotemporal dementia: one disease, or many?: probably one, possibly two.
Alzheimer Dis Assoc Disord 2005; 19 Suppl 1: S19-S24.
Kertesz A. Western Aphasia Battery, Revised: Examiner's Manual. San Antonio: Harcourt
Assessment, Inc.; 2007.
Kertesz A, Ferro JM. Lesion size and location in ideomotor apraxia. Brain 1984; 107 ( Pt 3):
921-933.
Kertesz A, Kawarai T, Rogaeva E et al. Familial frontotemporal dementia with ubiquitin-
positive, tau-negative inclusions. Neurology 2000a; 54: 818-827.
Kertesz A, Martinez-Lage P, Davidson W, Munoz DG. The corticobasal degeneration syndrome
overlaps progressive aphasia and frontotemporal dementia. Neurology 2000b; 55: 1368-1375.
Kertesz A, McMonagle P, Blair M, Davidson W, Munoz DG. The evolution and pathology of
frontotemporal dementia. Brain 2005; 128: 1996-2005.
Kertesz A, Poole E. The aphasia quotient: the taxonomic approach to measurement of aphasic
disability. Can J Neurol Sci 1974; 1: 7-16.
Kidd KK. Associations of disease with genetic markers: deja vu all over again. Am J Med Genet
1993; 48: 71-73.
Kim YD, Kim JS, Lee ES, Yang DW, Lee KS, Kim YI. Progressive "vascular" corticobasal
syndrome due to bilateral ischemic hemispheric lesions. Intern Med 2009; 48: 1699-1702.

202
Klaffke S, Kuhn AA, Plotkin M et al. Dopamine transporters, D2 receptors, and glucose
metabolism in corticobasal degeneration. Mov Disord 2006; 21: 1724-1727.
Kleiner-Fisman G, Bergeron C, Lang AE. Presentation of Creutzfeldt-Jakob disease as acute
corticobasal degeneration syndrome. Mov Disord 2004; 19: 948-949.
Kleiner-Fisman G, Black SE, Lang AE. Neurodegenerative disease and the evolution of art: the
effects of presumed corticobasal degeneration in a professional artist. Mov Disord 2003; 18: 294-
302.
Kleist K. Apraxie. Jarbuch Psychiatr Neurol 1907; 28: 46-112.
Knibb JA, Xuereb JH, Patterson K, Hodges JR. Clinical and pathological characterization of
progressive aphasia. Ann Neurol 2006; 59: 156-165.
Kompoliti K, Goetz CG, Boeve BF et al. Clinical presentation and pharmacological therapy in
corticobasal degeneration. Arch Neurol 1998; 55: 957-961.
Kovacevic N, Lobaugh NJ, Bronskill MJ, Levine B, Feinstein A, Black SE. A robust method for
extraction and automatic segmentation of brain images. Neuroimage 2002; 17: 1087-1100.
Koyama M, Yagishita A, Nakata Y, Hayashi M, Bandoh M, Mizutani T. Imaging of corticobasal
degeneration syndrome. Neuroradiology 2007; 49: 905-912.
Kreisler A, Defebvre L, Lecouffe P et al. Corticobasal degeneration and Parkinson's disease
assessed by HmPaO SPECT: the utility of factorial discriminant analysis. Mov Disord 2005; 20:
1431-1438.
Kroliczak G, Frey SH. A common network in the left cerebral hemisphere represents planning of
tool use pantomimes and familiar intransitive gestures at the hand-independent level. Cereb
Cortex 2009; 19: 2396-2410.
Lacadie CM, Fulbright RK, Rajeevan N, Constable RT, Papademetris X. More accurate
Talairach coordinates for neuroimaging using non-linear registration. Neuroimage 2008; 42:
717-725.
Lai SC, Weng YH, Yen TC et al. Imaging early-stage corticobasal degeneration with
[99mTc]TRODAT-1 SPET. Nucl Med Commun 2004; 25: 339-345.
Lancaster JL, Woldorff MG, Parsons LM et al. Automated Talairach atlas labels for functional
brain mapping. Hum Brain Mapp 2000; 10: 120-131.
Lanctot KL, Moosa S, Herrmann N et al. A SPECT study of apathy in Alzheimer's disease.
Dement Geriatr Cogn Disord 2007; 24: 65-72.
Lander ES, Schork NJ. Genetic dissection of complex traits. Science 1994; 265: 2037-2048.

203
Lang AE. Corticobasal degeneration: selected developments. Mov Disord 2003; 18 Suppl 6:
S51-S56.
Lang AE, Bergeron C, Pollanen MS, Ashby P. Parietal Pick's disease mimicking cortical-basal
ganglionic degeneration. Neurology 1994; 44: 1436-1440.
Laureys S, Salmon E, Garraux G et al. Fluorodopa uptake and glucose metabolism in early
stages of corticobasal degeneration. J Neurol 1999; 246: 1151-1158.
Le B, I, Camuzat A, Hannequin D et al. Phenotype variability in progranulin mutation carriers: a
clinical, neuropsychological, imaging and genetic study. Brain 2008; 131: 732-746.
Lee SE, Rabinovici GD, Mayo MC et al. Clinicopathological correlations in corticobasal
degeneration. Ann Neurol 2011; 70: 327-340.
Leiguarda R, Lees AJ, Merello M, Starkstein S, Marsden CD. The nature of apraxia in
corticobasal degeneration. J Neurol Neurosurg Psychiatry 1994; 57: 455-459.
Leiguarda RC, Marsden CD. Limb apraxias: higher-order disorders of sensorimotor integration.
Brain 2000; 123 ( Pt 5): 860-879.
Leiguarda RC, Merello M, Nouzeilles MI, Balej J, Rivero A, Nogues M. Limb-kinetic apraxia in
corticobasal degeneration: clinical and kinematic features. Mov Disord 2003; 18: 49-59.
Levy-Cooperman N, Burhan AM, Rafi-Tari S et al. Frontal lobe hypoperfusion and depressive
symptoms in Alzheimer disease. J Psychiatry Neurosci 2008a; 33: 218-226.
Levy-Cooperman N, Ramirez J, Lobaugh NJ, Black SE. Misclassified tissue volumes in
Alzheimer disease patients with white matter hyperintensities: importance of lesion segmentation
procedures for volumetric analysis. Stroke 2008b; 39: 1134-1141.
Lezak MD. Neuropsychological Assessment. New York: Oxford University Press; 1983.
Liepmann H. Apraxie. In: Brugsch H, editor. Ergebnisse der gesamten Medizin. Wien, Berlin:
Urban & Schwarzenberg; 1920. p. 516-43.
Ling H, O'Sullivan SS, Holton JL et al. Does corticobasal degeneration exist? A
clinicopathological re-evaluation. Brain 2010; 133: 2045-2057.
Liotti M, Mayberg HS. The role of functional neuroimaging in the neuropsychology of
depression. J Clin Exp Neuropsychol 2001; 23: 121-136.
Lipton AM, White CL, III, Bigio EH. Frontotemporal lobar degeneration with motor neuron
disease-type inclusions predominates in 76 cases of frontotemporal degeneration. Acta
Neuropathol (Berl) 2004; 108: 379-385.
Litvan I, Agid Y, Goetz C et al. Accuracy of the clinical diagnosis of corticobasal degeneration:
a clinicopathologic study. Neurology 1997; 48: 119-125.

204
Litvan I, Bhatia KP, Burn DJ et al. Movement Disorders Society Scientific Issues Committee
report: SIC Task Force appraisal of clinical diagnostic criteria for Parkinsonian disorders. Mov
Disord 2003; 18: 467-486.
Litvan I, Cummings JL, Mega M. Neuropsychiatric features of corticobasal degeneration. J
Neurol Neurosurg Psychiatry 1998; 65: 717-721.
Llado A, Sanchez-Valle R, Rene R et al. Late-onset frontotemporal dementia associated with a
novel PGRN mutation. J Neural Transm 2007; 114: 1051-1054.
Lobaugh NJ, Caldwell CB, Black SE, Leibovitch FS, Swartz RH. Three brain SPECT region-of-
interest templates in elderly people: normative values, hemispheric asymmetries, and a
comparison of single- and multihead cameras. J Nucl Med 2000; 41: 45-56.
Lopez de MA, Alzualde A, Gorostidi A et al. Mutations in progranulin gene: clinical,
pathological, and ribonucleic acid expression findings. Biol Psychiatry 2008; 63: 946-952.
Mackenzie IR, Baker M, West G et al. A family with tau-negative frontotemporal dementia and
neuronal intranuclear inclusions linked to chromosome 17. Brain 2006; 129: 853-867.
Mackenzie IR, Feldman HH. Ubiquitin immunohistochemistry suggests classic motor neuron
disease, motor neuron disease with dementia, and frontotemporal dementia of the motor neuron
disease type represent a clinicopathologic spectrum. J Neuropathol Exp Neurol 2005; 64: 730-
739.
Mahapatra RK, Edwards MJ, Schott JM, Bhatia KP. Corticobasal degeneration. Lancet Neurol
2004; 3: 736-743.
Mann DM, McDonagh AM, Snowden J, Neary D, Pickering-Brown SM. Molecular
classification of the dementias. Lancet 2000; 355: 626.
Markus HS, Lees AJ, Lennox G, Marsden CD, Costa DC. Patterns of regional cerebral blood
flow in corticobasal degeneration studied using HMPAO SPECT; comparison with Parkinson's
disease and normal controls. Mov Disord 1995; 10: 179-187.
Masellis M, Momeni P, Meschino W et al. Novel splicing mutation in the progranulin gene
causing familial corticobasal syndrome. Brain 2006; 129: 3115-3123.
Masellis M, Zinman L, Black SE. More than just 'frontal': disentangling behavioural disturbances
in amyotrophic lateral sclerosis. Eur J Neurol 2010; 17: 5-7.
Mathew R, Bak TH, Hodges JR. Diagnostic criteria for corticobasal syndrome: a comparative
study. J Neurol Neurosurg Psychiatry 2011.
Mathuranath PS, Xuereb JH, Bak T, Hodges JR. Corticobasal ganglionic degeneration and/or
frontotemporal dementia? A report of two overlap cases and review of literature. J Neurol
Neurosurg Psychiatry 2000; 68: 304-312.
205
Matsuda H, Yagishita A, Tsuji S, Hisada K. A quantitative approach to technetium-99m ethyl
cysteinate dimer: a comparison with technetium-99m hexamethylpropylene amine oxime. Eur J
Nucl Med 1995; 22: 633-637.
Mattis S. Mental status examination for organic mental syndrome in the elderly patient. In:
Bellak L, Karasu TB, editors. Geriatric Psychiatry. New York: Grune & Stratton; 1976.
McKhann GM, Albert MS, Grossman M, Miller B, Dickson D, Trojanowski JQ. Clinical and
pathological diagnosis of frontotemporal dementia: report of the Work Group on Frontotemporal
Dementia and Pick's Disease. Arch Neurol 2001; 58: 1803-1809.
McMonagle P, Blair M, Kertesz A. Corticobasal degeneration and progressive aphasia.
Neurology 2006; 67: 1444-1451.
Mei L, Xue G, Chen C, Xue F, Zhang M, Dong Q. The "visual word form area" is involved in
successful memory encoding of both words and faces. Neuroimage 2010; 52: 371-378.
Mendez MF. Corticobasal ganglionic degeneration with Balint's syndrome. J Neuropsychiatry
Clin Neurosci 2000; 12: 273-275.
Mendez MF, Shapira JS, McMurtray A, Licht E, Miller BL. Accuracy of the clinical evaluation
for frontotemporal dementia. Arch Neurol 2007; 64: 830-835.
Mielke R, Heiss WD. Positron emission tomography for diagnosis of Alzheimer's disease and
vascular dementia. J Neural Transm Suppl 1998; 53: 237-250.
Moll J, de Oliveira-Souza R, Passman LJ, Cunha FC, Souza-Lima F, Andreiuolo PA. Functional
MRI correlates of real and imagined tool-use pantomimes. Neurology 2000; 54: 1331-1336.
Momeni P, Rogaeva E, Deerlin VV. Genetic variability in CHMP2B and Frontotemporal
dementia. Neurobiol Dis 2006.
Moreno F, Indakoetxea B, Barandiaran M et al. "Frontotemporoparietal" dementia: clinical
phenotype associated with the c.709-1G>A PGRN mutation. Neurology 2009; 73: 1367-1374.
Morinaga A, Ono K, Ikeda T et al. A comparison of the diagnostic sensitivity of MRI, CBF-
SPECT, FDG-PET and cerebrospinal fluid biomarkers for detecting Alzheimer's disease in a
memory clinic. Dement Geriatr Cogn Disord 2010; 30: 285-292.
Murray R, Neumann M, Forman MS et al. Cognitive and motor assessment in autopsy-proven
corticobasal degeneration. Neurology 2007; 68: 1274-1283.
Nagahama Y, Fukuyama H, Turjanski N et al. Cerebral glucose metabolism in corticobasal
degeneration: comparison with progressive supranuclear palsy and normal controls. Mov Disord
1997; 12: 691-696.
Nagasawa H, Tanji H, Nomura H et al. PET study of cerebral glucose metabolism and
fluorodopa uptake in patients with corticobasal degeneration. J Neurol Sci 1996; 139: 210-217.

206
Naj AC, Jun G, Beecham GW et al. Common variants at MS4A4/MS4A6E, CD2AP, CD33 and
EPHA1 are associated with late-onset Alzheimer's disease. Nat Genet 2011; 43: 436-441.
Nalls MA, Plagnol V, Hernandez DG et al. Imputation of sequence variants for identification of
genetic risks for Parkinson's disease: a meta-analysis of genome-wide association studies. Lancet
2011; 377: 641-649.
Neary D, Snowden JS, Gustafson L et al. Frontotemporal lobar degeneration: a consensus on
clinical diagnostic criteria. Neurology 1998; 51: 1546-1554.
Neumann M, Sampathu DM, Kwong LK et al. Ubiquitinated TDP-43 in frontotemporal lobar
degeneration and amyotrophic lateral sclerosis. Science 2006; 314: 130-133.
Neumann M, Tolnay M, Mackenzie IR. The molecular basis of frontotemporal dementia. Expert
Rev Mol Med 2009; 11: e23.
Noorbakhsh F, Overall CM, Power C. Deciphering complex mechanisms in neurodegenerative
diseases: the advent of systems biology. Trends Neurosci 2009; 32: 88-100.
Nothen MM, Propping P, Fimmers R. Association versus linkage studies in psychosis genetics. J
Med Genet 1993; 30: 634-637.
O'Sullivan SS, Burn DJ, Holton JL, Lees AJ. Normal dopamine transporter single photon-
emission CT scan in corticobasal degeneration. Mov Disord 2008; 23: 2424-2426.
Ochipa C, Gonzalez Rothi LJ. Limb apraxia. Semin Neurol 2000; 20: 471-478.
Ochipa C, Rothi LJ, Heilman KM. Conceptual apraxia in Alzheimer's disease. Brain 1992; 115 (
Pt 4): 1061-1071.
Okuda B, Kodama N, Tachibana H, Sugita M, Tanaka H. Visuomotor ataxia in corticobasal
degeneration. Mov Disord 2000a; 15: 337-340.
Okuda B, Tachibana H, Kawabata K, Takeda M, Sugita M. Cerebral blood flow correlates of
higher brain dysfunctions in corticobasal degeneration. J Geriatr Psychiatry Neurol 1999; 12:
189-193.
Okuda B, Tachibana H, Kawabata K, Takeda M, Sugita M. Cerebral blood flow in corticobasal
degeneration and progressive supranuclear palsy. Alzheimer Dis Assoc Disord 2000b; 14: 46-52.
Osterrieth PA. The test of copying a complex figure: A contribution to the study of perception
and memory. 1944. p. 286-356.
Ott J. Cutting a Gordian knot in the linkage analysis of complex human traits. Am J Hum Genet
1990; 46: 219-221.
Peigneux P, Salmon E, Garraux G et al. Neural and cognitive bases of upper limb apraxia in
corticobasal degeneration. Neurology 2001; 57: 1259-1268.

207
Pick A. U¨ ber die Beziehungen der senilen Hirnatrophie zur Aphasie. Prag MedWochenschr
1892; 17: 165-167.
Pickering-Brown SM, Rollinson S, Du PD et al. Frequency and clinical characteristics of
progranulin mutation carriers in the Manchester frontotemporal lobar degeneration cohort:
comparison with patients with MAPT and no known mutations. Brain 2008; 131: 721-731.
Pillon B, Blin J, Vidailhet M et al. The neuropsychological pattern of corticobasal degeneration:
comparison with progressive supranuclear palsy and Alzheimer's disease. Neurology 1995; 45:
1477-1483.
Pillon B, Dubois B. Memory and executive processes in corticobasal degeneration. Corticobasal
degeneration and related disorders. Philadelphia: Lippincott Williams & Wilkins; 2000. p. 91-
101.
Pirker W, Asenbaum S, Bencsits G et al. [123I]beta-CIT SPECT in multiple system atrophy,
progressive supranuclear palsy, and corticobasal degeneration. Mov Disord 2000; 15: 1158-
1167.
Pirker W, Djamshidian S, Asenbaum S et al. Progression of dopaminergic degeneration in
Parkinson's disease and atypical parkinsonism: a longitudinal beta-CIT SPECT study. Mov
Disord 2002; 17: 45-53.
Plotkin M, Amthauer H, Klaffke S et al. Combined 123I-FP-CIT and 123I-IBZM SPECT for the
diagnosis of parkinsonian syndromes: study on 72 patients. J Neural Transm 2005; 112: 677-692.
Poorkaj P, Bird TD, Wijsman E et al. Tau is a candidate gene for chromosome 17 frontotemporal
dementia. Ann Neurol 1998; 43: 815-825.
Rademakers R, Baker M, Gass J et al. Phenotypic variability associated with progranulin
haploinsufficiency in patients with the common 1477C-->T (Arg493X) mutation: an
international initiative. Lancet Neurol 2007; 6: 857-868.
Rademakers R, Eriksen JL, Baker M et al. Common variation in the miR-659 binding-site of
GRN is a major risk factor for TDP43-positive frontotemporal dementia. Hum Mol Genet 2008;
17: 3631-3642.
Rahmim A, Zaidi H. PET versus SPECT: strengths, limitations and challenges. Nucl Med
Commun 2008; 29: 193-207.
Ramirez J, Gibson E, Quddus A et al. Lesion Explorer: a comprehensive segmentation and
parcellation package to obtain regional volumetrics for subcortical hyperintensities and
intracranial tissue. Neuroimage 2011; 54: 963-973.
Rankin KP, Gorno-Tempini ML, Allison SC et al. Structural anatomy of empathy in
neurodegenerative disease. Brain 2006; 129: 2945-2956.

208
Raven JC. Colored Prorgessive Matrices Sets A, Ab, B. Oxford: Oxford Psychologists Press
Ltd.; 1947.
Rebeiz JJ, Kolodny EH, Richardson EP, Jr. Corticodentatonigral degeneration with neuronal
achromasia: a progressive disorder of late adult life. Trans Am Neurol Assoc 1967; 92: 23-26.
Rebeiz JJ, Kolodny EH, Richardson EP, Jr. Corticodentatonigral degeneration with neuronal
achromasia. Arch Neurol 1968; 18: 20-33.
Rey A. L'examen psychologique dans les cas d'encephalopathie traumatique. 1941. p. 215-85.
Riley DE, Lang AE. Clinical Diagnostic Criteria. Corticobasal degeneration and related
disorders. Philadelphia: Lippincott Williams & Wilkins; 2000. p. 29-34.
Riley DE, Lang AE, Lewis A et al. Cortical-basal ganglionic degeneration. Neurology 1990; 40:
1203-1212.
Rinne JO, Lee MS, Thompson PD, Marsden CD. Corticobasal degeneration. A clinical study of
36 cases. Brain 1994; 117 ( Pt 5): 1183-1196.
Rippon GA, Staugaitis SM, Chin SS, Goldman JE, Marder K. Corticobasal syndrome with novel
argyrophilic glial inclusions. Mov Disord 2005; 20: 598-602.
Risch N, Merikangas K. The future of genetic studies of complex human diseases. Science 1996;
273: 1516-1517.
Rizzo M, Eslinger PJ. Principles and Practice of Behavioral Neurology and Neuropsychology.
Philadelphia: WB Saunders; 2004.
Rohrer JD, Beck J, Warren JD et al. Corticobasal syndrome associated with a novel
1048_1049insG progranulin mutation. J Neurol Neurosurg Psychiatry 2009; 80: 1297-1298.
Rohrer JD, Geser F, Zhou J et al. TDP-43 subtypes are associated with distinct atrophy patterns
in frontotemporal dementia. Neurology 2010a; 75: 2204-2211.
Rohrer JD, Rossor MN, Warren JD. Apraxia in progressive nonfluent aphasia. J Neurol 2010b;
257: 569-574.
Ropper AH, Brown RH. Adams and Victor's Principles of Neurology. New York: McGraw-Hill;
2005.
Rothi LJG, Ochipa C, Heilman KM. A cognitive neuropsychological model of limb praxis.
Cognitive Neuropsychology 1991; 8: 443-458.
Rouleau I, Salmon DP, Butters N, Kennedy C, McGuire K. Quantitative and qualitative analyses
of clock drawings in Alzheimer's and Huntington's disease. Brain Cogn 1992; 18: 70-87.
Roy EA. Hand preference, manual asymmetries and limb apraxia. In: Elliot D, Roy EA, editors.
Manual asymmetries in motor control. Boca Raton: CRC Press; 1996. p. 215-36.

209
Roy EA, Black SE, Blair N, Dimeck PT. Analyses of deficits in gestural pantomime. J Clin Exp
Neuropsychol 1998; 20: 628-643.
Savoiardo M, Grisoli M, Girotti F. Magnetic resonance imaging in CBD, related atypical
parkinsonian disorders, and dementias. Adv Neurol 2000; 82: 197-208.
Sawle GV, Brooks DJ, Marsden CD, Frackowiak RS. Corticobasal degeneration. A unique
pattern of regional cortical oxygen hypometabolism and striatal fluorodopa uptake demonstrated
by positron emission tomography. Brain 1991; 114 ( Pt 1B): 541-556.
Schneider JA, Watts RL, Gearing M, Brewer RP, Mirra SS. Corticobasal degeneration:
neuropathologic and clinical heterogeneity. Neurology 1997; 48: 959-969.
Schulze TG, McMahon FJ. Defining the phenotype in human genetic studies: forward genetics
and reverse phenotyping. Hum Hered 2004; 58: 131-138.
Shahani N, Brandt R. Functions and malfunctions of the tau proteins. Cell Mol Life Sci 2002;
59: 1668-1680.
Shelley BP, Hodges JR, Kipps CM, Xuereb JH, Bak TH. Is the pathology of corticobasal
syndrome predictable in life? Mov Disord 2009; 24: 1593-1599.
Silverman DH. Brain 18F-FDG PET in the diagnosis of neurodegenerative dementias:
comparison with perfusion SPECT and with clinical evaluations lacking nuclear imaging. J Nucl
Med 2004; 45: 594-607.
Skibinski G, Parkinson NJ, Brown JM et al. Mutations in the endosomal ESCRTIII-complex
subunit CHMP2B in frontotemporal dementia. Nat Genet 2005; 37: 806-808.
Skoglund L, Brundin R, Olofsson T et al. Frontotemporal dementia in a large Swedish family is
caused by a progranulin null mutation. Neurogenetics 2009; 10: 27-34.
Snowden J, Neary D, Mann D. Frontotemporal lobar degeneration: clinical and pathological
relationships. Acta Neuropathol 2007; 114: 31-38.
Snowden JS, Pickering-Brown SM, Mackenzie IR et al. Progranulin gene mutations associated
with frontotemporal dementia and progressive non-fluent aphasia. Brain 2006; 129: 3091-3102.
Soliveri P, Monza D, Paridi D et al. Cognitive and magnetic resonance imaging aspects of
corticobasal degeneration and progressive supranuclear palsy. Neurology 1999; 53: 502-507.
Soliveri P, Piacentini S, Girotti F. Limb apraxia in corticobasal degeneration and progressive
supranuclear palsy. Neurology 2005; 64: 448-453.
Spatt J, Bak T, Bozeat S, Patterson K, Hodges JR. Apraxia, mechanical problem solving and
semantic knowledge: contributions to object usage in corticobasal degeneration. J Neurol 2002;
249: 601-608.

210
Spillantini MG, Murrell JR, Goedert M, Farlow MR, Klug A, Ghetti B. Mutation in the tau gene
in familial multiple system tauopathy with presenile dementia. Proc Natl Acad Sci U S A 1998;
95: 7737-7741.
Spina S, Murrell JR, Huey ED et al. Corticobasal syndrome associated with the A9D Progranulin
mutation. J Neuropathol Exp Neurol 2007; 66: 892-900.
Stamatakis EA, Wilson JT, Wyper DJ. Spatial normalization of lesioned HMPAO-SPECT
images. Neuroimage 2001; 14: 844-852.
Stamenova V, Roy EA, Black SE. A model-based approach to understanding apraxia in
Corticobasal Syndrome. Neuropsychol Rev 2009; 19: 47-63.
Stamenova V, Roy EA, Black SE. Limb apraxia in corticobasal syndrome. Cortex 2011; 47: 460-
472.
Taki M, Ishii K, Fukuda T, Kojima Y, Mori E. Evaluation of cortical atrophy between
progressive supranuclear palsy and corticobasal degeneration by hemispheric surface display of
MR images. AJNR Am J Neuroradiol 2004; 25: 1709-1714.
Tan CF, Piao YS, Kakita A et al. Frontotemporal dementia with co-occurrence of astrocytic
plaques and tufted astrocytes, and severe degeneration of the cerebral white matter: a variant of
corticobasal degeneration? Acta Neuropathol 2005; 109: 329-338.
Tang-Wai DF, Josephs KA, Boeve BF, Dickson DW, Parisi JE, Petersen RC. Pathologically
confirmed corticobasal degeneration presenting with visuospatial dysfunction. Neurology 2003;
61: 1134-1135.
Taniguchi S, McDonagh AM, Pickering-Brown SM et al. The neuropathology of frontotemporal
lobar degeneration with respect to the cytological and biochemical characteristics of tau protein.
Neuropathol Appl Neurobiol 2004; 30: 1-18.
Taniwaki T, Yamada T, Yoshida T et al. Heterogeneity of glucose metabolism in corticobasal
degeneration. J Neurol Sci 1998; 161: 70-76.
The Lund and Manchester Groups. Clinical and neuropathological criteria for frontotemporal
dementia. J Neurol Neurosurg Psychiatry 1994; 57: 416-418.
Thompson PD, Day BL, Rothwell JC, Brown P, Britton TC, Marsden CD. The myoclonus in
corticobasal degeneration. Evidence for two forms of cortical reflex myoclonus. Brain 1994; 117
( Pt 5): 1197-1207.
Tippett WJ, Black SE. Regional cerebral blood flow correlates of visuospatial tasks in
Alzheimer's disease. J Int Neuropsychol Soc 2008; 14: 1034-1045.
Todd JJ, Marois R. Capacity limit of visual short-term memory in human posterior parietal
cortex. Nature 2004; 428: 751-754.

211
Togasaki DM, Tanner CM. Epidemiologic aspects. Adv Neurol 2000; 82: 53-59.
Tokumaru AM, O'uchi T, Kuru Y, Maki T, Murayama S, Horichi Y. Corticobasal degeneration:
MR with histopathologic comparison. AJNR Am J Neuroradiol 1996; 17: 1849-1852.
Tsuchiya K, Ikeda K, Uchihara T, Oda T, Shimada H. Distribution of cerebral cortical lesions in
corticobasal degeneration: a clinicopathological study of five autopsy cases in Japan. Acta
Neuropathol 1997; 94: 416-424.
Tuite PJ, Clark HB, Bergeron C et al. Clinical and pathologic evidence of corticobasal
degeneration and progressive supranuclear palsy in familial tauopathy. Arch Neurol 2005; 62:
1453-1457.
Uchihara T, Nakayama H. Familial tauopathy mimicking corticobasal degeneration an autopsy
study on three siblings. J Neurol Sci 2006; 246: 45-51.
Ungerleider LG, Courtney SM, Haxby JV. A neural system for human visual working memory.
Proc Natl Acad Sci U S A 1998; 95: 883-890.
Van Deerlin V, Sleiman PM, Martinez-Lage M et al. Common variants at 7p21 are associated
with frontotemporal lobar degeneration with TDP-43 inclusions. Nat Genet 2010; 42: 234-239.
Vanek Z, Jankovic J. Dystonia in corticobasal degeneration. Mov Disord 2001; 16: 252-257.
Wadia PM, Lang AE. The many faces of corticobasal degeneration. Parkinsonism Relat Disord
2007; 13 Suppl 3: S336-S340.
Wechsler D. Wechsler Memory Scale-Revised manual. San Antonio: The Psychological
Corporation; 1987.
Wenning GK, Litvan I, Jankovic J et al. Natural history and survival of 14 patients with
corticobasal degeneration confirmed at postmortem examination. J Neurol Neurosurg Psychiatry
1998; 64: 184-189.
Whitwell JL, Jack CR, Jr., Boeve BF et al. Imaging correlates of pathology in corticobasal
syndrome. Neurology 2010; 75: 1879-1887.
Williams BW, Mack W, Henderson VW. Boston Naming Test in Alzheimer's disease.
Neuropsychologia 1989; 27: 1073-1079.
Winkelmann J, Auer DP, Lechner C, Elbel G, Trenkwalder C. Magnetic resonance imaging
findings in corticobasal degeneration. Mov Disord 1999; 14: 669-673.
Wong SH, Lecky BR, Steiger MJ. Parkinsonism and impulse control disorder: presentation of a
new progranulin gene mutation. Mov Disord 2009; 24: 618-619.

212
Worsley KJ, Marrett S, Neelin P, Vandal AC, Friston KJ, Evans AC. A unified statistical
approach for determining significant signals in images of cerebral activation. Hum Brain Mapp
1996; 4: 58-73.
Yamauchi H, Fukuyama H, Nagahama Y et al. Atrophy of the corpus callosum, cortical
hypometabolism, and cognitive impairment in corticobasal degeneration. Arch Neurol 1998a; 55:
609-614.
Yamauchi H, Fukuyama H, Nagahama Y et al. Atrophy of the corpus callosum, cortical
hypometabolism, and cognitive impairment in corticobasal degeneration. Arch Neurol 1998b;
55: 609-614.
Yekhlef F, Ballan G, Macia F, Delmer O, Sourgen C, Tison F. Routine MRI for the differential
diagnosis of Parkinson's disease, MSA, PSP, and CBD. J Neural Transm 2003; 110: 151-169.
Yu CE, Bird TD, Bekris LM et al. The spectrum of mutations in progranulin: a collaborative
study screening 545 cases of neurodegeneration. Arch Neurol 2010; 67: 161-170.
Zadikoff C, Lang AE. Apraxia in movement disorders. Brain 2005; 128: 1480-1497.
Zamboni G, Huey ED, Krueger F, Nichelli PF, Grafman J. Apathy and disinhibition in
frontotemporal dementia: Insights into their neural correlates. Neurology 2008; 71: 736-742.
Zekanowski C, Peplonska B, Styczynska M, Gustaw K, Kuznicki J, Barcikowska M. Mutation
screening of the MAPT and STH genes in Polish patients with clinically diagnosed
frontotemporal dementia. Dement Geriatr Cogn Disord 2003a; 16: 126-131.
Zekanowski C, Styczynska M, Peplonska B et al. Mutations in presenilin 1, presenilin 2 and
amyloid precursor protein genes in patients with early-onset Alzheimer's disease in Poland. Exp
Neurol 2003b; 184: 991-996.
Zhang L, Murata Y, Ishida R, Saitoh Y, Mizusawa H, Shibuya H. Differentiating between
progressive supranuclear palsy and corticobasal degeneration by brain perfusion SPET. Nucl
Med Commun 2001; 22: 767-772.