cos551, fall 2003 mona singh - computer science …mona/lecture/phylogeny-slides.pdf · nucleic...
TRANSCRIPT

Phylogenetics
COS551, Fall 2003
Mona Singh

Phylogenetics• Phylogenetic trees illustrate the
evolutionary relationships among groups of organisms, or among a family of related nucleic acid or protein sequences
• E.g., how might have this family been derived during evolution

Hypothetical Tree Relating Organisms

Phylogenetic Relationships Among Organisms
• Entrez: www.ncbi.nlm.nih.gov/Taxonomy
• Ribosomal database project: rdp.cme.msu.edu/html/
• Tree of Life: phylogeny.arizona.edu/tree/phylogeny.html

Globin Sequences

Phylogeny Applications• Tree of life: Analyzing changes that have
occurred in evolution of different organisms
• Phylogenetic relationships among genes can help predict which ones might have similar functions (e.g., ortholog detection)
• Follow changes occuring in rapidly changing species (e.g., HIV virus)

Phylogeny Packages• PHYLIP, Phylogenetic inference package
– evolution.genetics.washington.edu/phylip.html– Felsenstein– Free!
• PAUP, phylogenetic analysis using parsimony– paup.csit.fsu.edu– Swofford

What data is used to build trees?
• Traditionally: morphological features (e.g., number of legs, beak shape, etc.)
• Today: Mostly molecular data (e.g., DNA and protein sequences)

Data for Phylogeny
• Can be classified into two categories:– Numerical data
• Distance between objectse.g., distance(man, mouse)=500,
distance(man, chimp)=100
Usually derived from sequence data
– Discrete characters• Each character has finite number of states
e.g., number of legs = 1, 2, 4
DNA = {A, C, T, G}

Rooted vs Unrooted Trees
Rooted tree Unrooted tree
Internal node
External node
Root
Note: Here, each node has three neighboring nodes

Terminology• External nodes: things under comparison;
operational taxonomic units (OTUs)• Internal nodes: ancestral units; hypothetical; goal is
to group current day units• Root: common ancestor of all OTUs under study.
Path from root to node defines evolutionary path• Unrooted: specify relationship but not evolutionary
path– If have an outgroup(external reason to believe certain
OTU branched off first), then can root
• Topology: branching pattern of a tree• Branch length: amount of difference that occurred
along a branch

How to reconstruct trees• Distance methods: evolutionary distances are
computed for all OTUs and build tree where distance between OTUs “matches” these distances
• Maximum parsimony (MP): choose tree that minimizes number of changes required to explain data
• Maximum likelihood (ML): under a model of sequence evolution, find the tree which gives the highest likelihood of the observed data

Number of possible treesGiven n OTUs, there are unrooted trees
2,027,02510
155
34
13
unrooted treesOTUs

Number of possible treesGiven n OTUs, there are rooted trees
34,459,42510
1055
154
33
Rooted treesOTUs
Bottom Line: an enumeration strategyover all possible trees to find the best one under some criteria is not feasible!

ParsimonyFind tree which minimizes number of changes needed to explain data
Ex: 123456
A GTCGTAB GTCACTC GCGGTA D ACGACAE ACGGAA

Parsimony • For given example tree and alignment, can do this
for all sites, and get away with as few as 9 changes
• Changing the tree (either the topology or labeling of leaves) changes the minimum number of changes need
• Two computational problems– (Easy) Given a particular tree, how do you find
minimum number of changes need to explain data? (Fitch)
– (Hard) How do you search through all trees?

Parsimony: Fitch’s algorithm
Idea: construct set of possible nucleotides for internal nodes,based on possible assignments of children

Parsimony: Fitch’s algorithm
• For each site:
– Each leaf is labeled with set containing observed nucleotide at that position
– For each internal node i with children j and k with labels Sj and Sk
• Total # changes necessary for a site is # of union operations
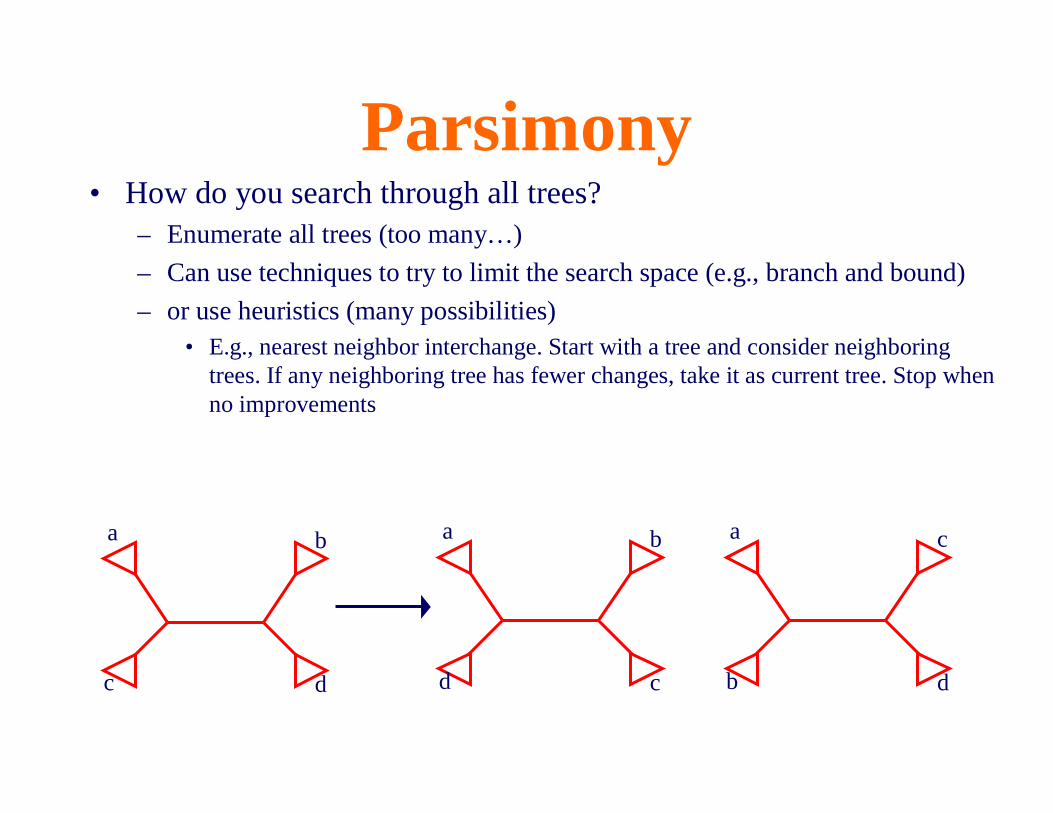
Parsimony• How do you search through all trees?
– Enumerate all trees (too many…)
– Can use techniques to try to limit the search space (e.g., branch and bound)
– or use heuristics (many possibilities)• E.g., nearest neighbor interchange. Start with a tree and consider neighboring
trees. If any neighboring tree has fewer changes, take it as current tree. Stop when no improvements
a
c
b
d
a
d
b
c
a
b
c
d

Parsimony weaknesses
Parsimony analysis implicitly assumes that rate of changealong branches are similar
G G
A AReal tree: two long brancheswhere G has turned to A independently
G
G A
A
Inferred tree

Distance Methods• Input: given an n x n matrix M where
Mij>=0 and Mij is the distance between objects i and j
• Goal: Build an edge-weighted tree where each leaf (external node) corresponds to one object of M and so that distances measured on the tree between leaves i and jcorrespond to Mij

Distance Methods
0371315E
061214D
01214C
012B
0A
EDCBA
A tree exactly fitting the matrix does not always exist.

Distance Method Criteria• Try to find the tree with distances dij which
“best fits” the distance data Mij
• Different possibilities for “best”– Cavalli-Sforza criterion: minimize
– Fitch-Margoliash criterion: minimize
• Unfortunately, both lead to computationally intractable problems (e.g., enumerating)

Distance Method Heuristic: UPGMA
• UPGMA (Unweighted group method with arithmetic mean)– Sequential clustering algorithm– Start with things most similar
• Build a composite OTU
– Distances to this OTU are computed as arithmetic means
– From new group of OTUs, pick pair with highest similarity etc.
• Average-linkage clustering

UPGMA: Visually
1
2
3
5
4
1 2 3 5 4

UPGMA Example
0111412D
097C
08B
0A
DCBA
M B(AC) = (MBA + MBC)/2 = (8+9)/2=8.5M D(AC) = (MDA + MDC)/2= (12+11)/2=11.5

UPGMA Example
01411.5D
08.5B
0AC
DBAC
M (ABC)D = (MAD + MBD + MCD)/3 = (12+14+11)/3

UPGMA: Example
012.33D
0ABC
DABC

UPGMA weaknesses
0111412D
097C
08B
0A
DCBA
In fact, exact fitting tree exists !

UPGMA weaknesses• UPGMA assumes that the rates of evolution
are the same among different lineages• In general, should not use this method for
phylogenetic tree reconstruction (unless believe assumption)
• Produces a rooted tree• As a general clustering method (as we
discussed in an earlier lecture), it is better…

Distance Method: Neighbor Joining
• Most widely-used distance based method for phylogenetic reconstruction
• UPGMA illustrated that it is not enough to just pick closest neighbors
• Idea here: take into account averaged distances to other leaves as well
• Produces an unrooted tree

Neighbor Joining (NJ)
Start off with star tree; pull out pairs at a time
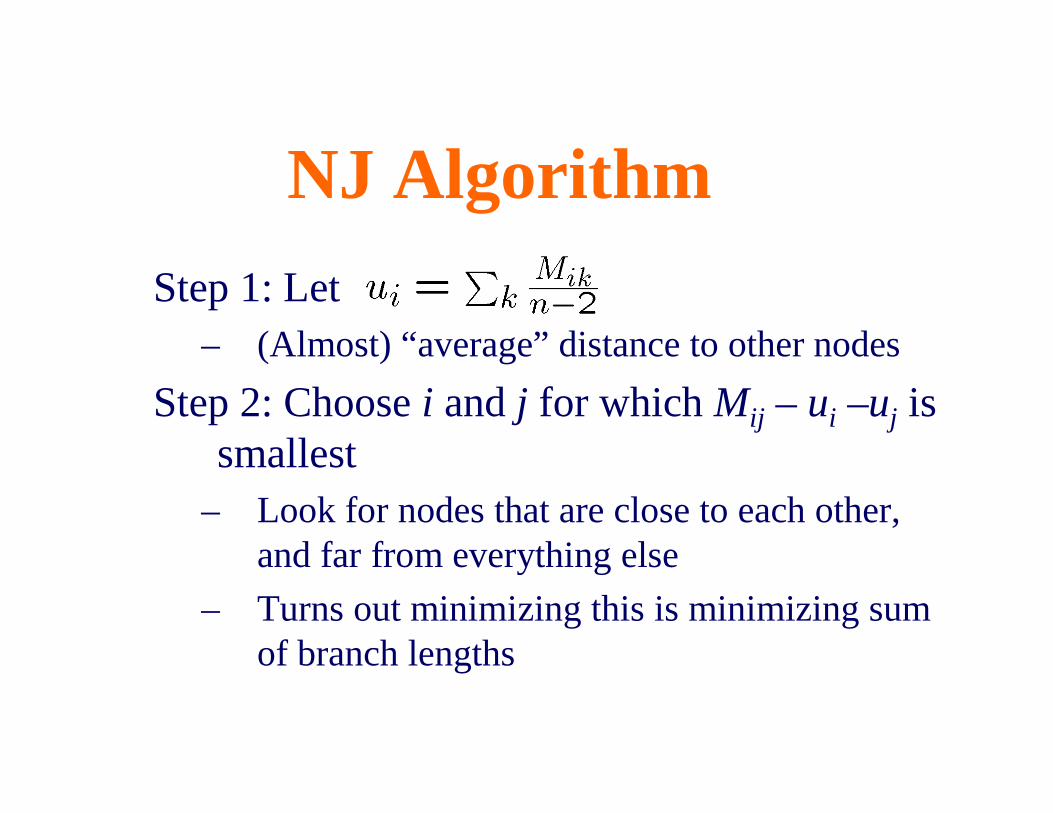
NJ AlgorithmStep 1: Let
– (Almost) “average” distance to other nodes
Step 2: Choose i and j for which Mij – ui –uj is smallest
– Look for nodes that are close to each other, and far from everything else
– Turns out minimizing this is minimizing sum of branch lengths

NJ algorithmStep 3: Define a new cluster (i, j), with a
corresponding node in the tree
Distance from i and j to node (i,j):
di, (i,j) = 0.5(Mij + ui-uj)
dj, (i,j) = 0.5(Mij +uj-ui)
i
j
(i,j)
Default: split distance butif on average one is further away, make it longer

NJ AlgorithmStep 4: Compute distance between new cluster
and all other clusters:M(ij)k = M ik+M jk – Mij
2 i
j(i,j)
k
Step 5: Delete i and j from matrixand replace by (i, j)
Step 6: Continue until only 2 leaves remain

NJ Performance• Works well in practice
• If there is a tree that fits the matrix, it will find it
• Can sometimes get trees with negative length edges (!)

Computing Distances Between Sequences
Could compute fraction of mismatches between two sequences; however, this is an underestimateof actual distance

Computing Distances Between Sequences
E.g., many underlying substitutionspossible
Use models ofsubstitution to correct these values

Computing Distances Between Sequences
Jukes & Cantor model-Each position in DNA sequence is independent
-Each position can mutateswith same probability toany another base
Correction to observed substitution rate (see notes):

Ex: Computing Distances Between Sequences
• Alignment of two DNA sequences– Length of alignment (non gapped positions): 100
– Number of differences: 25
• Naïve distance calculation = 25/100 = ¼
• Correction
• Other models for DNA, also protein (e.g., PAM)

Maximum Likelihood• Given a probabilistic model for nucleotide
(or protein) substitution (e.g., Jukes & Cantor), pick the tree that has highest probability of generating observed data– I.e., Given data D and model M, find tree T
such that Pr(D|T, M) is maximized
• Models gives valuespij(t), the probability of going from nucleotide i to j in time t

Maximum Likelihood• Makes 2 independence assumptions
– Different sites evolve independently
– Diverged sequences (or species) evolve independently after diverging
• If Di is data for ith site

Maximum LikelihoodHow to calculate Pr(Di|T,M) ?
pxy(t) ~ probof going from xto y in time t

Maximum Likelihood• Given tree topology and branch lengths, can
efficiently calculate Pr(D|T, M) using dynamic programming– I.e., don’t have to enumerate over all internal states
• Finding best maximum likelihood tree is expensive– Must consider all topologies
– Find best edge lengths for each topology• Idea: use some search procedure, e.g., EM, to optimize these
lengths

Assessing Reliability: Bootstrap
Say we’ve inferred the following tree
1 2 3 4
Would like to get confidencelevels that 1 & 2 belong together,and 3&4 belong together

Assessing Reliability: Bootstrap
Say we’re given following alignment:12345678
1 GCAGTACT
2 GTAGTACT
3 ACAATACC
4 ACAACACT
We’ll create a pseudosampleby choosing sites randomlyuntil N sites are chosen(N is length of alignment)

Assessing Reliability: Bootstrap
Say chose 6th, 1st, 6th, 8th, …12345678 6168 …
1 GCAGTACT AGAT …
2 GTAGTACT AGAT …
3 ACAATACC AAAC …
4 ACAACACT AAAT …

Assessing Reliability: Bootstrap
• Use pseudosample to construct tree
• Repeat many times
• Confidence of (1) and (2) together is fraction of times they appear together in trees generated from pseudosamples
1 2 3 4
90
95

Phylogeny Flowchart
Distance Methods
ML Methods
MPMethods
Family ofsequences
Buildalignment
Recognizablesimilarity
Strongsimilarity
(Mount, Bioinformatics)
Y
Y
N
N

Difference in Methods• Maximum-likelihood and parsimony methods
have models of evolution• Distance methods do not necessarily
– Useful aspect in some circumstances• E.g., trees built based on whole genomes, presence or absence
of genes
• Religious wars over which methods to use– Most people now believe ML based methods are best:
most sensitive at large evolutionary distances – but also most time-consuming & depend on specific model of evolution used
• Most commonly used packages contain software for all three methods: may want to use more than 1 to have confidence in built tree

Phylip• Parsimony
– DNApenny or Protpars
• Distance– Compute distance measure using DNAdist or
Protdist– Neighbor (can use NJ or UPGMA)
• ML– DNAml