cost analysis of fuel cell system for transportationjmfent/adl doe report.pdf · assessment of the...
TRANSCRIPT

Cost Analysis of Fuel CellSystem for Transportation
Baseline System Cost Estimate
Arthur D. Little, Inc.Acorn ParkCambridge, Massachusetts02140-2390
Ref 49739SFAA No. DE-SCO2-98EE50526Topic 1 Subtopic 1C
Task 1 and 2 Final Report to:Department of Energy:
March 2000

EC/db/IR49739-0300 1
The following report summarizes the results of a DOE fundedassessment of the cost of a 50 kW fuel cell system for transportationincluding a multi-fuel capable reformer, a PEM fuel cell, and balance-of-plant components.
The results of the model should only be considered in conjunctionwith the assumptions used in selecting and scaling the systemcomponents. The components have been scaled using technologyassumed available in Year 2000 and costed assuming productionvolumes of 500,000 vehicles.
In developing the system configuration and component manifest wehave tried to capture all of the essential engineering components andimportant cost contributors. However, the system selected for costingdoes not claim to solve all of the technical challenges facing fuel celltransportation systems or satisfy PNGV fuel cell vehicle performancetargets.
The system specifications and cost projections presented in thisreport will be updated during the Year 2000 based on discussions withthe general fuel cell development community.

EC/db/IR49739-0300 2
Project Team
Program Manager: Donna Lee HoANL Technical Advisor: Robert Sutton
Arthur D. Little Team
Primary Contact: Eric J. Carlson Stephen A. Mariano
Core Team:Dr. Scott HynekDr. Suresh SriramuluGraham Stevens
Argonne National LaboratorySystem Thermodynamic Model
Primary Contact: Dr. Romesh Kumar
Dr. Ezzat Danial DossDr. Rajesh Ahluwalia
Our program was supported by the system modeling group within ArgonneNational Laboratory.
Our program was supported by the system modeling group within ArgonneNational Laboratory.
EC/db/IR49739-0300 3
Table of Contents
Cost Modeling
2 Next Steps
3
1 Project Overview
Appendix
Technology Assessment
PNGV Targets
i Executive Summary

EC/db/IR49739-0300 4
Factory CostFactory Cost
Fuel CellFuel Cell
Fuel Fuel ProcessorProcessor
BOPBOP
SystemSystemAssemblyAssembly
TotalTotal
($)($)
8,850
4,310
500
1,040
14,700
($/kW)($/kW)
177
86
10
21
294
PNGV Goals($/kW)PNGV Goals($/kW)
Yr 2000Yr 2000 Yr 2004Yr 2004
100
30
40
10
Not listedseparately inPNGV Goals
130 50
The Year 2000 baseline fuel cell and fuel processor system cost estimate isat least $300/kW.
Basis: 50 kWe net, 500,000 units/yr ** Sub-system components described in body of the report
The system components were scaled by estimated performance availablein Year 2000, but cost modeled as if in production at high volume.
Sub-Sub-SystemSystem
Yr Yr 2000 Estimate*2000 Estimate*
Fuel Cell60%
FuelProcessor
29%
Balance of Plant3%
Assembly & Indirect
8%
Cost Breakdown by Sub-SystemCost Breakdown by Sub-System** **
Executive Summary System Cost By Sub-System
Not Complete without design assumptions

EC/db/IR49739-0300 5
Specific Power Year 2000Specific Power Year 2000(W/kg)(W/kg)
Sub-SystemSub-System WeightWeight(kg)(kg)
Baseline SystemBaseline SystemEstimateEstimate
PNGVPNGVTargetTarget
Fuel Cell 295 169 350
FuelProcessor 215 233 600
The power density of the individual sub-systems must be increasedsignificantly for the system to meet PNGV performance targets.
Executive Summary System Performance Power Density
Basis: 50 kWe net; * Total includes 110 kg for Balance-of-Plant components
Total* 620 80 250
For reference, the fuel cell stack alone has a specific power of 315 W/kg(56 kWe/179 kg). Specification of fuel cell operation at high efficiency (e.g.0.8 volts) approximately doubles the size and cost of the fuel cell.
Not Complete without design assumptions

EC/db/IR49739-0300 6
Table of Contents
Cost Modeling
2 Next Steps
3
1 Project Overview
Appendix
Technology Assessment
PNGV Targets
i Executive Summary

EC/db/IR49739-0300 7
To assist DOE in the development of fuel cell system technologies byproviding cost and manufacturing analysis.
� To develop an independent cost estimate of PEMFC system costsincluding a sensitivity analysis to:
� Operating parameters� Fuel type
� Materials of construction
� Manufacturing processes
� To identify opportunities for system cost reduction through breakthroughsin component and manufacturing technology
� To provide annual updates to the cost estimate for four (4) years astechnology evolves
Project Overview Objectives

EC/db/IR49739-0300 8
Project Overview Approach
In the 1999 year program we completed Tasks 1 and 2. This reportsummarizes our findings and results for these tasks.
Task 1:PEMFC System
TechnologySynopsis
Task 2:Develop Cost
Model and Baseline
Estimates
Task 3:Identify
Opportunities for System
Cost Reduction
Tasks 4, 5, 6 & 7:
AnnualUpdates
� Develop baselinesystem specification
� Project technologydevelopments
� Assess impact onsystem performance
� Identify manufacturingprocesses
� Develop cost model
� Specify manufacturingprocesses andmaterials
� Develop productionscenarios
� Baseline cost estimate
� Perform sensitivityanalysis to designparameters andmanufacturingprocesses
� Perform risk analysisto key parameters
� Assess technologyevolution
� Revise Year 1 costestimates based ontechnologydevelopments andrevised projections
Year 1 (1999–2000) Years 2, 3, 4, and 5

EC/db/IR49739-0300 9
The PEMFC cost model results reported here were developed based on thecritical assumptions listed below.
� Fuel processor, fuel cell stack, and directly related balance-of-plantcomponents are included in the estimated factory cost of the PEMFCsystem
� Factory cost includes fixed and variable costs but excludes corporatecharges (e.g. profit, sales and general expenses)
� Based on Year 2000 available technology
� High efficiency commensurate with PNGV goals (e.g. 35-40%)� Water self-sufficiency
� Fuel flexible (designed for gasoline)
� Autothermal Reformer (ATR)� Turbocompressor (e.g. Allied Signal)
� Based on high production volumes (500,000 vehicles per year)
Project Overview Critical Assumptions and Issues

EC/db/IR49739-0300 10
The following additional issues should also be kept in mind as wediscuss the Year 2000 baseline system technology and cost.
� Several balance-of-plant (BOP) components included in the system havenot figured significantly in earlier cost models of PEMFC systems
� The anode tailgas burner plays several key roles (startup, energyrecovery, and emissions control)
� Controls and sensors based on current technology and costingcontribute significantly to the BOP
� Batteries for parasitic power drains during startup (e.g. compressor andpumps) for approximately “10 minutes” have not been considered
� Assumption of 95oF ambient temperature does not consider operation inwarmer climates and potentially underestimates heat exchanger size
� Fuel processor catalyst materials are an area of active research anddevelopment
� Performance, cost, and robustness assumptions of these catalysts arecritical to scaling and costing the fuel processor
Project Overview Critical Assumptions and Issues

EC/db/IR49739-0300 11
Packaging (Piping, Electrical, …..)Start-up Power (battery); Anode TailgasBurner
A fuel cell vehicle would contain the PEMFC system modeled in this projectalong with additional electric drive train components.
Included in DOE PEMFC System Analyzed
FuelTank
• PowerConditioning
• Electric Motor• Electric Drive
Train
• RegenerativeBraking System(Battery)
Managers (Controllers and Sensors)
Air Thermal Water Safety
Other:• AC/Heating• Driver Interface
Fuel Processor Fuel Cell
Project Overview Definition of DOE PEMFC System
Not included in system analyzed

EC/db/IR49739-0300 12
Fuel Processor Sub-SystemFuel Processor Sub-System Fuel Cell Sub-SystemFuel Cell Sub-System Balance-of-PlantBalance-of-Plant
� ReformateGenerator
� ATR� HTS� Sulfur Removal� LTS� Steam Generator� Air Preheater� Steam Superheater� Reformate Humidifier
� ReformateConditioner
� NH3 Removal� PROX� Anode Gas Cooler� Economizers (2)� Anode Inlet Knockout
Drum
� Fuel Cell Stack (UnitCells)
� Stack Hardware� Fuel Cell Heat
Exchanger� Compressor/Expander� Anode Tailgas Burner� Sensors & Control
Valves
� Startup Battery� System Controller� System Packaging� Electrical� Safety
Individual components have been distributed between the major sub-systems as shown below for the Year 2000 baseline system.
Project Overview Baseline System Component Segmentation by Sub-System
� Fuel Supply� Fuel Pump� Fuel Vaporizer
� Sensors & Control Valves for each section
� Water Supply� Water Separators (2)� Heat Exchanger� Steam Drum� Process Water
Reservoir

EC/db/IR49739-0300 13
The major components and sub-systems of the baseline system are shownbelow:
Project Overview System Schematic
Fue l Supp lyRe f ormateGenera tor
Re f ormateCond itioner
Fue l Ce ll S tac k
Fue l Proc es s orW ater Supp ly
Stac k Coo lingSy s tem
In teg rated Ta ilgasBurner
Compres s ed A irSupply
Con tro l &Elec tr ic a l Sy s tem
Fuel
H2
O2
H2O

EC/db/IR49739-0300 14
We used an integral reformategenerator/shift reactorcontaining a: CATR, airpreheater, superheater,humidifier, HTS, ZnO sulfurremoval bed, steam generator,and LTS. The general designis similar to that shown in aRolls Royce patent.
Project Overview Reformate Generator
Catalyst space velocities were based on catalyst activities publishedby Argonne National Laboratory.

EC/db/IR49739-0300 15
Catalyst BedsCatalyst Beds
ParameterParameter ATRATR HTSHTS LTSLTS PROXPROX
Temperature C 1030 430 230 205
Catalyst Pt/NiFe3O4/CrO3
Cu/ZnO Pt
Support Alumina Alumina Alumina Alumina
GSHV (1/hour) 15,000 10,000 5,000 10,000
Bed Volume (L) 10.3 13.3 26.5 13.3
Bed Weight (kg) 13 17 37 15
Clean-up BedsClean-up Beds
The design parameters for the fuel processor were chosen to achieve highcold gas efficiency.
Project Overview Fuel Processor Catalysts and Bed Materials
SulfurSulfurRemovalRemoval
NHNH33RemovalRemoval
490
ZnO
None
NA
2.8
8
80
ActivatedCarbon
None
None
5.5
3
The catalyst activities are based on suggested values from ANL/DOE.
Phi = 2.9; Steam/Carbon Ratios: ATR - 2.2, System Total - 3.5

EC/db/IR49739-0300 16
A high unit cell voltage rather than a high power operating point on the fuelcell polarization curve was selected to satisfy overall system efficiency goals.
Project Overview Fuel Cell Sub-System Operating Conditions
OperatingOperatingConditionsConditions UnitsUnits BaselineBaseline
AssumptionsAssumptions
Unit Cell Voltage volts 0.8
Anode Stoichiometry 1.2
Current Density mA/cm2 310
Power Density * mW/cm2 250
Temperature oC 80
Percent anode air bleed % 1
Fuel Utilization % 85
Stack ParameterStack Parameter ValueValue
Fuel Cell Module Voltage(volts)
300
Net Power (kW) 50
Net System ParasiticPower (kW)
6
Number of Stacks in Series 2
Current (Amperes) 186
Unit Cells per Stack 188
Cooling Plates per Cell 1H2 Concentration
(dry basis)% 40
Active Area (cm2 ) 600Cathode Stoichiometry 2.0
*Combined anode and cathode Pt loading: 0.8 mg/cm2 ; Ru loading on anode: 0.2 mg/cm2
This is a major departure from current practice, and is being reexamined by Arthur D. Littleand other DOE contractors.

EC/db/IR49739-0300 17
A current density of 300 mA/cm2 at 0.8 volts was selected on the basis ofnear term projections of available stack and unit cell data.
Project Overview Fuel Cell Polarization Curves
0.4
0.5
0.6
0.7
0.8
0.9
1
cell
pote
ntia
l (V
)
0 0.2 0.4 0.6 0.8 1 1.2 1.4 current density (A/cm²)
NG2000 H2 NG3000 H2 NG2000 ref NG3000 ref
0
0.2
0.4
0.6
0.8
1
0 0.2 0.4 0.6 0.8 1 1.2 1.4
Ref, 2.1 atm H2, 3.1 atm H2, 2.1 atm
current density (i/mA cm–2)
cell
pote
ntia
l, E
/V
Stack data from Energy Partners, Inc. NG2000 was astack of 600 cm2 active area, NG 2000 - 292 cm2 activearea, NG 3000 - 596 cm2 active area. Reformatecomposition was 40 % H2, 40 % N2, 20 % CO2. H2/air =1.2/2 Stoichiometry.
Single cell data from W. L. Gore and Associatesemploying the PRIMEA@ MEAS. Cell area area was 25cm2. Reformate composition was 100 ppm CO, 100 ppmCH4, 48 % H2, 31 % N2, 21 % CO2. H2/air = 1.5/2Stoichiometry, pressure = 2.1 atm, temperature = 77 0C.
Source: B. Bahar, C. Cavalca, S. Cleghorn, J. Kolde, D. Lane, M. Murthy,and G. Rusch, J. New Mat. Elect. Sys., 2 (1999) 179
Stack DataStack Data Single Cell DataSingle Cell Data

EC/db/IR49739-0300 18
Project Overview Baseline System Definition Other Sub-Systems
The PNGV system description does not account for the complexity of manyof the components within the system.
ComponentComponent DescriptionDescription
Integrated Tailgas Burner 3 reaction zones
Compressed Air Supply Compressor/expander, cathodehumidifier,air filter, valves
Fuel Processor WaterSupply
2 water separators, cathodecondenser, process water
radiator, process water pump,steam drum, filters, valves,
sensors
Stack Cooling System Stack radiator, stack coolingwater pump, valve, sensors
Startup Power Batteries, switching regulator
Controls & ElectricalSystem
Main control board, main wireharness, power wiring,
contactor (safety)

EC/db/IR49739-0300 19
Specific Power Year 2000Specific Power Year 2000(W/kg)(W/kg)
Sub-SystemSub-System WeightWeight(kg)(kg)
Baseline SystemBaseline SystemEstimateEstimate
PNGVPNGVTargetTarget
Fuel Cell 295 169 350
FuelProcessor 215 233 600
The power density of the individual sub-systems must be increasedsignificantly for the system to meet PNGV performance targets.
Project Overview System Performance Power Density
Basis: 50 kWe net; * Total includes 110 kg for BOP
Total* 620 80 250
For reference, the fuel cell stack alone has a specific power of 315 W/kg(56 kWe/179 kg). Operation of the fuel cell at high efficiency (high voltage)approximately doubles the size of the fuel cell.
Not Complete without design assumptions

EC/db/IR49739-0300 20
Per DOE’s direction, we have estimated the system cost up to andincluding factory costs.
Project Overview Definition of DOE Cost Basis
Directlabor
DirectMaterials
FactoryExpense
GeneralExpense
SalesExpense
Profit
AutomobileAutomobileOEMOEMPricePrice
Fixed Costs• Equipment and Plant Depreciation• Tooling Amortization• Equipment Maintenance• Utilities• Indirect Labor• Cost of capital
Variable Costs• Manufactured Materials• Purchased Materials• Fabrication Labor• Assembly Labor• Indirect Materials
DOE Cost Estimate (Factory Cost)
Corporate Expenses (example)• Research and Development• Sales and Marketing• General & Administration• Warranty• Taxes
Excluded from DOE Cost Estimate

EC/db/IR49739-0300 21
Project Overview Cost Model Assumptions
We have assumed manufacturing and purchased part decisions areconsistent with current OEM or major vehicle integrator practices andproduction volumes equal to 500,000 units per year.
FuelProcessor
Balanceof
Plant
Fuel CellModule
� Unit Cell Components� Assembly� Testing
� Packaging (containers, piping)� Assembly
� Packaging (containers, piping)� Assembly
ManufacturedManufactured
� Raw materials� Perfluorosulfonic acid film� Fuel Cell Hardware
� Pump, valves, filters, fittings� Sensors� Catalysts� Heat exchangers
� Pump, valves, filters, fittings� Sensors� Catalysts� Heat exchangers� Compressor/Expander� Batteries, regulator� Control board� Wiring harness
PurchasedPurchased
Source CategorySource Category

EC/db/IR49739-0300 22
Factory CostFactory Cost
Fuel CellFuel Cell
Fuel Fuel ProcessorProcessor
BOPBOP
SystemSystemAssemblyAssembly
TotalTotal
($)($)
8,850
4,310
500
1,040
14,700
($/kW)($/kW)
177
86
10
21
294
PNGV Goals($/kW)PNGV Goals($/kW)
Yr 2000Yr 2000 Yr 2004Yr 2004
100
30
40
10
Not listedseparately inPNGV Goals
130 50
The estimated Year 2000 baseline fuel cell and fuel processor costs areapproximately double the Year 2000 PNGV goal of $130/kW.
*Estimated accuracy ±20% ; Basis: 50 kWe net, 500,000 units/yr
The system components were scaled by Year 2000 performanceassumptions, but cost modeled at high production volumes.
Sub-Sub-SystemSystem
Yr Yr 2000 Estimate*2000 Estimate*
Fuel Cell60%
FuelProcessor
29%
Balance of Plant3%
Assembly & Indirect
8%
Cost Breakdown by Sub-System Cost Breakdown by Sub-System
Project Overview System Cost By Sub-System
Not Complete without design assumptions

EC/db/IR49739-0300 23
Project Overview Fuel Cell Sub-System Cost Breakdown
The fuel cell stack dominates the fuel cell sub-system cost.
Basis: 50 kWe net, 500,000 units/yr
Stack Sub-SystemsStack Sub-Systems ($)($)
Fuel Cell Stack 7,050
Cooling System 480
Tailgas Burner 460
Total $8,850
Air Supply 860
($/kW)($/kW)
140
10
10
177
17
Year 2000 Factory CostYear 2000 Factory Cost
PNGV GoalPNGV Goal Yr 2000Yr 2000 100
Tailgas Burner5%
Air Supply10%
Fuel Cell Stack80%
Cooling System5%
Fuel Cell Stack Sub-System CostFuel Cell Stack Sub-System CostBreakdownBreakdown
(Cost: $8,850) (Cost: $8,850)
Not Complete without design assumptions
Important Assumptions: Combined anode and cathode Pt loading: 0.8 mg/cm2 ; Ru loading onanode: 0.2 mg/cm2; Power Density at 0.8 volts: 250 mW/cm2

EC/db/IR49739-0300 24
Fuel Cell Stack Cost Breakdown Fuel Cell Stack Cost Breakdown by Component (Fuel Cell Cost: $7,050)by Component (Fuel Cell Cost: $7,050)
MEA Cost BreakdownMEA Cost Breakdown(Materials and Process: $236/m(Materials and Process: $236/m22))
The membrane electrode assemblies (MEA) with their precious metalloading and polymer electrolyte dominate the cost of the fuel cell stack.
Basis: 50 kWe net, 500,000 units/yr; Total: Pt - 180 g, Ru - 45 g (50% MEA cost)*Membrane priced at $55/m2
BipolarPlate15%
Gaskets5%
MEA76%
Other4%
Electrodes67%
Gas DiffusionLayers
8%
Membrane25%
Specification of a high efficiency (0.8V) design point for the fuel cell versushigh power (0.6 V) approximately doubles the size and cost of the fuel cell.
*
Project Overview System Cost Breakdowns Fuel Cell
Not Complete without design assumptions

EC/db/IR49739-0300 25
Fuel ProcessorFuel ProcessorSub-SystemSub-System ($)($) ($/kW)($/kW)
The fuel processor sub-system represents approximately 35% of thesystem cost and is approximately three times the Year 2000 PNGV goal of$30/kW.
Fuel Supply
Reformate Generation
100
2,035
Reformate Conditioning 1,015
TotalTotal 4,3104,310
2
40
20
8686
Basis: 50 kWe net, 500,000 units/yr
Water Supply 1,160 24
Factory CostFactory Cost
PNGV GoalPNGV Goal Yr 2000Yr 2000 30
Water Supply27%
Fuel Supply2%
Reformate Generation
47%
Reformate Conditioning
24%
Fuel Processor Cost BreakdownFuel Processor Cost Breakdown by Subsystem (Total: $4,310) by Subsystem (Total: $4,310)
Project Overview System Cost Breakdowns Fuel Processor
Not Complete without design assumptions

EC/db/IR49739-0300 26
Breakdown by Material Costs (Total: $11,930)Breakdown by Material Costs (Total: $11,930)Breakdown by Cost Type (Total: $14,700)Breakdown by Cost Type (Total: $14,700)
Performance advances which reduce component size and catalyst loadingswill have major impact on system economics due to the significantmaterials contribution to cost.
*Purchased components from suppliers makeup approximately 25% of thematerial costs.
Material81%
Other1%
Indirect Labor5%
DirectLabor13%
MEA45%
Stainless7%
Balance of Stack3%
FP Catalysts10%
Bipolar Plates7%
Pumps/Motors3%Compress/
Expand4%
Sensors5%
Radiators6%
Valves8%
Circuit Boards/Wiring
2%
Project Overview System Cost By Cost Type
Not Complete without design assumptions

EC/db/IR49739-0300 27
Platinum pricing and loadings are significant factors in the economics ofthe fuel cell system. Platinum is approximately 20% of the total system costat present loadings and fuel cell performance.
ATRATR PROXPROX TailgasTailgasBurnerBurner
Precious Metal (PM) Pt Pt Pt
Bed Weight (kg) 3.2 14.8 2.9
Fuel CellFuel CellMEAMEA
Pt
---
Ru
---
Loading%
mg/cm2
0.5
---
0.2
---
0.5
---
---
0.8
---
0.2
PM Weight (g) 9 13 8 181 45
Cost* $115 $175 $105 $2,450 $75
* Based on Pt cost of $13.5 per gram
Project Overview Precious Metal Cost
211 g
$2,844
Total Pt
For the Year 2000 Baseline System, 500,000 vehicles would requireapproximately 52 metric tons of platinum.(1995 Pt estimated reserves - 5,000 metric tons; 1996 annual production - 73 metric tons).

EC/db/IR49739-0300 28
Table of Contents
Cost Modeling
2 Next Steps
3
1 Project Overview
Appendix
Technology Assessment
PNGV Targets

EC/db/IR49739-0300 29
In Year 2000, we will assess the opportunities for cost reduction throughadvances in component, system and manufacturing technologies.
� Present baseline cost model results to developers forfeedback and discussion of potential improvements inperformance and technology
� Develop advanced system configuration scenarios
� Model cost impact of technology advances
� Present results to developers for feedback
� Report cost model projections for advancedtechnology scenarios
Next Steps

EC/db/IR49739-0300 30
Table of Contents
Cost Modeling
2 Next Steps
3
1 Project Overview
Appendix
Technology Assessment
PNGV Targets

EC/db/IR49739-0300 31
Technology Assessment
We have worked closely with the system modeling group of ArgonneNational Laboratory to arrive at the baseline system configuration. Thiseffort has taken longer and involved greater effort than originallyanticipated.
Projection of technology developments and assessment of their impacton system performance will be performed as part of Task 3.
Task 1:Task 1:PEMFC PEMFC SystemSystem
TechnologyTechnologySynopsisSynopsis
Task 2:Develop CostModel and Baseline
Estimates
Task 3:Identify
Opportunities for System
Cost Reduction
� Develop baselinesystem specification
� Project technologydevelopments
� Assess impact onsystem performance
� Identify manufacturingprocesses

EC/db/IR49739-0300 32
DOE mandated several aspects of the Year 2000 baseline systemspecification. These have the potential to significantly impact system scaleand cost.
� The system was designed to satisfy the PNGV efficiency goals at ratedpower, leading to the following model parameter inputs:
� Cell voltage = 0.8V
� Anode hydrogen utilization = 85%� Compressor efficiency = 70%
� Expander efficiency = 80%
� The system was not modeled under simulated driving cycle conditions,where the vehicle spends a small percentage of the time at full power
� Design at optimum power point would reduce size of fuel cell
� Must employ “today’s technology”
Technology Assessment Baseline System Design Perspective
The specification of 0.8 volt operating point at full power is a majordeparture from current practice where system developers havetraditionally designed for maximum power to minimize the size of the fuelcell, and will be reexamined in Task 3.

EC/db/IR49739-0300 33
DOE also mandated several other aspects of the system specification.
� Must be “fuel-flexible” with emphasis on gasoline
� Should use certain components:
� Catalytic autothermal reformer� Turbocompressor, high speed motor (Allied Signal)
� System pressure equal to 3 atm.
� Must be water-sufficient
� In the modeling process 95°F was selected as the ambient temperaturedesign point- the design does not specifically address issues raised by operation at
higher temperatures, e.g. in the Southwest
Technology Assessment Baseline System Design Perspective
The PNGV technical committee strongly recommended that the ambientdesign temperature should be raised to at least 120°F. This will be doneduring Year 2000.

EC/db/IR49739-0300 34
Arthur D. Little was not chartered to design a system which solves all of theproblems now facing developers. The design does not address or fullyaddress issues such as:
� Fast Startup (PNGV goals)
� Freezing Conditions
� Safety
� Operation below the design point
� Some components may only provide quoted efficiencies at fullpower, e.g. the compressor/expander
� Components necessary to accommodate transients or start-up may bemissing
� Not all control issues have been addressed, or even identified
Consideration of the above issues will increase the cost of the system.
Technology Assessment Baseline System Design Perspective

EC/db/IR49739-0300 35
The system model diagram below illustrates the complexity of the chemicalsystem. The state points from this model were used to scale the systemcomponents.
Technology Assessment Analytic Model of Design
State parameters and mass/thermal flows calculated by Argonne National LaboratorySystem configuration arrived at jointly by Arthur D. Little and Argonne National Laboratory
airaircp
poxsp
poxsp
htrairpox boiler
sd
sdsp
proc2mx
sd
heatsuperpox
fuel
fuelpump
vapfuel
poxhtrair
heatsuper
htsmx
procwater
procpump
htssp
htsmx
hts
remsulfur
boiler
ltsmx
htssp
ltssp
ltsmx
lts
econ1wat
prox
proxsp
prox
econ0wat
proxsp
humcmx
ltssp
poxwsp
econ0wat
econ0wat
econ1wat
econ0wat
anodecool
refsph2o
pefc
poxwsp
humcsp
humcmx
pefc
condsr
condair
condfan condsrcondsrcondsr
h2ocsp
burner
fcwater
fcpump
anodecool pefc
radiat
radiatair
radiatfan
radiatradiatfc
water radiat
h2ocsp
cond1mx
refsph2o
cond1mx
proc1mx
humcsp
proc1mx
proc2mx
radproc
procair
procfan
radprocrad
procprocwater
radproc
pefc
burner
vapfuel
1gt
sdsp
t 308.00p 1.0000m 0.0677
t 478.06p 3.2000m 0.0677
t 478.06p 3.2000m 0.0514
t 478.06p 3.2000m 0.0163
t 900.00p 3.2000m 0.0163
t 457.80p 11.000m 0.0099
t 457.80p 11.000m 0.0099
t 457.80p 11.000m 0.0010
t 457.80p 11.000m 0.0008
t 457.80p 11.000m 0.0089
t 900.00p 11.000m 0.0089
t 308.00p 1.0000m 0.0032
t 308.10p 3.2000m 0.0032
t 420.00p 3.2000m 0.0032
t 1300.0p 3.1000m 0.0284
t 1157.7p 3.1000m 0.0284
t 989.00p 3.1000m 0.0284
t 314.98p 1.0000m 0.1000
t 315.09p 11.000m 0.1000
t 315.09p 11.000m 0.0045
t 700.00p 3.1000m 0.0329
t 764.32p 3.1000m 0.0329
t 764.32p 3.1000m 0.0329
t 480.00p 3.1000m 0.0329
t 315.09p 11.000m 0.0955
t 315.09p 11.000m 0.00e+000
t 480.00p 3.1000m 0.0329
t 497.57p 3.1000m 0.0329
t 420.00p 3.1000m 0.0329
t 478.06p 3.2000m 0.0002
t 431.46p 3.1000m 0.0330
t 478.06p 3.2000m 0.0512
t 315.09p 11.000m 0.0955
t 315.09p 11.000m 0.0099
t 400.00p 11.000m 0.0099
t 457.80p 11.000m 0.0099
t 373.92p 3.1000m 0.0330
t 353.00p 3.1000m 0.0330
t 353.00p 3.1000m 0.0265
t 315.09p 11.000m 0.0856
t 315.09p 11.000m 0.0027
t 353.00p 3.2000m 0.0539
t 353.00p 3.0000m 0.0558
t 308.00p 1.0000m 0.3808
t 308.58p 1.0050m 0.3808
t 333.00p 1.0050m 0.3808
t 328.80p 3.0000m 0.0558
t 328.80p 3.0000m 0.0460
t 330.00p 1.0000m 0.8409
t 330.03p 3.2000m 0.8409
t 334.51p 3.2000m 0.8409
t 348.00p 3.2000m 0.8409
t 308.00p 1.0000m 2.5239
t 308.58p 1.0050m 2.5239
t 330.00p 3.2000m 0.8409
t 333.00p 1.0050m 2.5239
t 328.80p 3.0000m 0.0098
t 353.00p 3.1000m 0.0065
t 338.48p 3.0000m 0.0163
t 315.09p 11.000m 0.0829
t 319.11p 3.0000m 0.0992
t 320.24p 3.0000m 0.1000t 308.00
p 1.0000m 0.4838
t 308.58p 1.0050m 0.4838
t 314.98p 3.0000m 0.1000
t 313.00p 1.0050m 0.4838
t 353.00p 3.0000m 0.0246
t 540.29p 3.0000m 0.0707
t 524.36p 3.0000m 0.0707
t 418.76p 1.0000m 0.0707
t 457.80p 11.000m 0.0002
Baseline 50-kW Design -- Gasoline Partial Oxidation PEM System

EC/db/IR49739-0300 36
A. Fuel Value of “gasoline”A. Fuel Value of “gasoline”
B. Fuel Value of H2 into PEM Fuel CellB. Fuel Value of H2 into PEM Fuel Cell
C. Cold Gas Efficiency of Fuel Processor [B/A]C. Cold Gas Efficiency of Fuel Processor [B/A]
D. Output from PEM Fuel CellD. Output from PEM Fuel Cell
E. Fuel Cell Efficiency [D/B]E. Fuel Cell Efficiency [D/B]
F. Output from ExpanderF. Output from Expander
G. Parasitic LoadsG. Parasitic Loads
H. System Efficiency [(D+F-G)/A]H. System Efficiency [(D+F-G)/A]
Based onBased onHHVHHV
145.7 kW
122.8 kW
84.3 %
Based onBased onLHVLHV
135.8 kW
104.0 kW
76.5 %
56.5 kW
46% 54%
8.2 kW
14.3 kW
34.6% 37.1 %
The table below summarizes the system efficiencies at full power.
Technology Assessment System Energy Balance/Efficiency
The overall efficiency for a drive cycle is estimated to be greater than40% by ANL, however, the drive cycle efficiency will be heavilyinfluenced by the efficiency of the compressor/expander at partial load.
I. Radiator Rejected HeatI. Radiator Rejected Heat 75.5 kW

EC/db/IR49739-0300 37
A carbon bed absorber and multi-zone PROX reactor were used to clean upammonia and CO from the reformate.
Technology Assessment Fuel Processor Reformate Conditioner - PROX
The ZnO sulfur removal bed is integrated into the reformate generator.
Exit
Inlet
Air
Water
Air
Air
Water
Air
Prox Stage 2
Prox Stage 1
Insulation

EC/db/IR49739-0300 38
Current DOE system configurations do not include an ammoniascrubber.
� PROX� The PROX would have similar dimensions as an automotive catalytic converter
(18”Lx5”D), except that- it would be chopped in half (the easy way) to make two stages- it would be built to withstand 30 psig- one must contrive to distribute air reasonably evenly in both stages- one must control the air flow to each stage, thus requiring two motor operated valves- one must contrive to control its temperature
� Its catalyst could resemble, at least for costing purposes, the catalyst found in anautomotive catalytic converter
Technology Assessment Fuel Processor Reformate Conditioner
� Ammonia Cleanup� Equilibrium calculations suggest the likelihood of ~150 ppm ammonia in reformate� This ammonia would likely harm the PEMFC in time� Ammonia can be removed from the anode inlet stream by passing it through a bed of
activated charcoal� This bed requires no flow control valves, but it does require periodic replacement

EC/db/IR49739-0300 39
The economizers and the anode cooler are used to cool the reformateto the inlet temperatures of the PROX and the PEMFC.
Technology Assessment Fuel Processor Economizers
Indirect heat exchange was selected over water injection.
HX Duty LMTD ∆pref H W D UAkBtuh kW °C in wc in in in Btuh/°F
High tempeconomizer
13.5 4.0 29 7 4.25 6 32 259
Low tempeconomizer
12.2 3.6 44 3 4.25 6 12.5 154
Anodecooler
53.3 16 31 N/A 4.25 6 22 955

EC/db/IR49739-0300 40
The fuel cell module is split into two stacks connected in series. Each stackis approximately 3 feet in length with 600 cm2 active area per cell.
Technology Assessment Fuel Cell
Source: Ballard Power Systems
Fuel Flow Field Plates Membrane Electrode Assembly
Electricity+ –
Air
A filter press type cell configuration with internal manifolds for all flowstreams was adopted for costing the fuel cell.
1 feet
1 feet
3 feet

EC/db/IR49739-0300 41
Fuel FlowOxidant Flow
Coolant Flow
Unit Cell
We have used molded graphite/polymer composite* bipolar plates withintegral cooling channels. The bipolar plate is molded in two pieces andbonded together.
H+
Technology Assessment Fuel Cell Unit Cell Design
MembraneElectrodeAssembly

EC/db/IR49739-0300 42
Bipolar
Plate
Gas Diffusion
Layer- AnodeAnode
Electrolyte
MembraneCathode
Gas Diffusion
Layer - Cathode
Graphite in
Vinyl Ester
PTFE Treated
Carbon Paper
Pt/Ru on
Carbon Support
Perfluorosulfonic
Acid
Pt on
Carbon Support
PTFE Treated
Carbon Paper
4750 100 20 40 20 100
Layer
Material
Thickness (um)
Pt: 0.4Ru: 0.2 0.4
CatalystLoading(mg/cm2)
H+
We have used catalysts and catalyst loadings which correspond todemonstrated performance data.
Technology Assessment Fuel Cell Unit Cell Materials

EC/db/IR49739-0300 43
Electrochemical Electrochemical LayersLayers
InterconnectInterconnect
We have based our design on a pitch of 5 with one cooling plate percell.
Anode (µm)
Electrolyte (µm)
Cathode (µm)
Wt./area (g/cm2)
Vol./area (cm3/cm2)
Interconnect (µm)
Wt./area (g/cm2)
Vol./area (cm3/cm2)
ADLADL19991999
120
40
120
0.36
0.08
4320
1.29
0.43
Total Unit CellTotal Unit Cell
Wt./area (g/cm2)
Vol./area (cm3/cm2)
0.65
0.51
Pitch (cells per inch) 5
Density (g/cm3) 1.3
Technology Assessment Fuel Cell Layer Thicknesses

EC/db/IR49739-0300 44
Technology Assessment Fuel Cell Issues
Demonstration of fuel cell technology is progressing, but long-termperformance on reformate must still be demonstrated/
� Long term performance (> 5000 hrs) with real reformate and ambientair (e.g. on roads) must be demonstrated
� Anode and cathode catalyst stability in the presence of lowconcentrations of poisons (e.g. ppb levels)
� Increased power density while operating on reformate and at high fuelutilization.
� New membrane materials may allow operation at higher temperaturesthan allowed by the perfluorosulfonic acid membranes and lessenissues associated with water management.

EC/db/IR49739-0300 45
The integrated tailgas burner, start-up steam generator, fuel vaporizerperforms the following functions:
� It warms up the fuel processor.
� It disposes of the startup gases produced by the fuel processor oncethe fire is lit in the reformer but the reformate’s [CO] is not yet lowenough to be allowed into the fuel cell.
� It removes energy from the combustible species in the anode tailgasstream.
� It assures low exhaust emissions
� It can vaporize fuel and water
Technology Assessment Integrated Tailgas Burner
EC/db/IR49739-0300 46
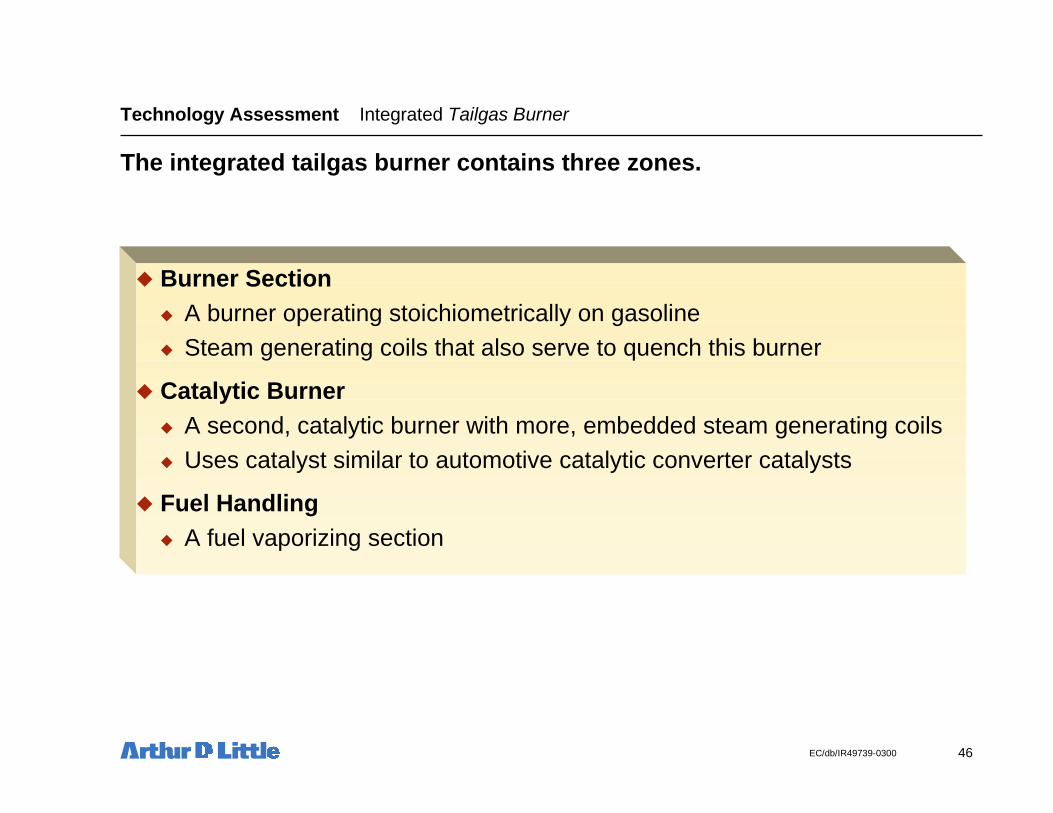
� Burner Section� A burner operating stoichiometrically on gasoline� Steam generating coils that also serve to quench this burner
� Catalytic Burner� A second, catalytic burner with more, embedded steam generating coils� Uses catalyst similar to automotive catalytic converter catalysts
� Fuel Handling� A fuel vaporizing section
Technology Assessment Integrated Tailgas Burner
The integrated tailgas burner contains three zones.

EC/db/IR49739-0300 47
The tailgas burner, start-up steam generator, fuel vaporizer’s catalysttemperature must be maintained within a specific temperature window
� If it operates too hot, the catalyst is degraded
� If it operates too cold, it doesn’t burn off the methane slip
� This implies the need for an sort of airflow modulating system, such asa temperature-controlled motor-operated valve
The tailgas burner is a major component, fully as large as any otherpackage within the fuel processor, and generally less well understood.
Technology Assessment Integrated Tailgas Burner

EC/db/IR49739-0300 48
We assumed that system and subsystem control will be accomplishedby a single main controller.
� There could instead be a multiplicity of smaller controllers, but thiswould seem to serve no particular purpose.
� The controller board is one of those items that truly does decrease incost with manufacturing volume, for most of its cost is the amortizationof its development cost.
� The cost of the connectors, fuses and cooling could be greater than thecost of the controller board.
� The major portion of the cost of controlling will be:
� Actuators (such as automatic valves)
� Sensors (thermocouples are probably the least expensive of thesensors)
� Signal conditioners (such as T/C A/D circuits)
Technology Assessment Controls

EC/db/IR49739-0300 49
We have identified the following sensors as being likely necessary:
� 16 temperature sensors, probably thermocouples, located throughout thesystem
� 1 oxygen sensor, located within the tailgas burner
� 1 sulfur sensor, located downstream of the ZnO bed
� 1 CO sensor, located downstream of the PROX
� 1 pressure sensor, located upstream of the backpressure regulator
� 1 ammonia sensor, located downstream of the activated charcoal bed
� 1 pH sensor, located within the process water system
Technology Assessment Controls - Sensors
� We anticipate that significant engineering and development effort will berequired to eliminate these sensors or to significantly reduce their cost.
� We have not identified the additional sensors which might be required forsafety.

EC/db/IR49739-0300 50
Proportional control valves are necessary to control several criticalprocess flows.
� Water Flows to� Reformate humidifier� Low temperature economizer (thence to steam generator)� Cathode air humidifier� Bypass anode cooler
� Air flow to� ATR (reforming zone)� Each section of the PROX� The anode inlet air bleed� Tailgas burner
� Back pressure regulator to maintain steam pressure� Maintains the pressure of the entire process water system.� Must be capable of having its setpoint adjusted remotely by the main
controller, so that the CATR can maintain the appropriate steam/carbon ratioduring power increase transients.
Technology Assessment Controls - Valves
Cost effective control of gas streams at low flowrates needs to be developed.

EC/db/IR49739-0300 51
Solenoid-operated diverter valves are necessary to accommodate transientand upset conditions.
� We use three way solenoid-operated diverter valves in the followinglocations:
� Condensate in/out of steam generator
� Steam in/out of steam generator� Process water pump discharge to humidifiers/warmup steam
generator
� Anode inlet stream to PEMFC/tailgas burner
� We use two way solenoid-operated valves where simple diversion isn’tenough (where flow may need to go to both places at once)
� Fuel to fuel vaporizer/start-up burner
Technology Assessment Controls - Diverter Valves

EC/db/IR49739-0300 52
Full ExpanderOutput
No ExpanderOutput
10 minutes parasitic loads 14.3 kW 2.4 kWh 14.3 kW 2.4 kWh less 10 minutes expander (8.2 kW) (1.4 kWh) less 8 minutes radiator fan (1.5 kW) (0.2 kWh) (1.5 kW) (0.2 kWh) net 4.6 kW 0.8 kWh 12.8 kW 2.2 kWh# of 12VDC, 40 Amp-hrbatteries discharged to 80%(25% margin)
2 5.5
Technology Assessment Balance-of-Plant Startup Battery
There must be a startup battery of considerable capacity to providepower to the fuel processor during its warm-up period.
� It is not intended to power the vehicle during the fuel processor’s warm-upperiod.
� A hybrid battery for transient power during driving and startup propulsion, ifneeded, will probably be an additional battery
The cost model assumes six batteries.

EC/db/IR49739-0300 53
The “system” radiator will eventually consist of three separate circuits: thetailgas condenser, the process water cooler and the fuel cell cooler. Fornow, they have been sized as separate heat exchangers.
� A higher power design point for the fuel cell cooler would require a larger fuel cell cooler.
� Increasing the ambient temperature design point (now 95°F) will increase the size of all theradiators.
� The fuel cell cooler is sized for an air side pressure drop of 0.5 inches, which is about whatautomotive fans can deliver. Were we to include the dynamic head of a moving vehicle, it couldbe a bit smaller.
Technology Assessment Thermal Management
HX Duty LMTD ∆pair H W D UAkBtuh kW °C in wc in in in Btuh/°F
TailgasCondenser
31.6 9.3 18 0.3 8.5 27 15 976
ProcessWaterCooler
7.5 2.2 7 0.2 10 23 1.5 598
Fuel CellCooler
216.8 64 20 0.5 21 55 3.75
6,022
The three air-cooled heat exchangers could perhaps be combined intoa single heat exchanger that would be 24” high and 48” wide.

EC/db/IR49739-0300 54
The thermal management system would also contain fans.
� The individual or integrated heat exchangers could be cooled by a pairof 24” diameter automotive-style fans
� Each of these fans can move 3000 cfm of air against 0.5 in wc.
� Each of these fans will require 350 watts of shaft power.
Technology Assessment Thermal Management

EC/db/IR49739-0300 55
Technology Assessment Sub-System Weight Breakdowns
The fuel processor and fuel cell sub-systems account for approximately80% of the overall system weight.
ComponentsComponents WeightWeight(kg)(kg)
Fuel Cell Stack 179
Cooling System 63
Tailgas Burner 38
Total 295
Air Supply 15
Fuel Cell Sub-SystemFuel Cell Sub-System
Fuel Supply
Reformate Generator
Reformate Conditioner
Total
Water Supply
2
114
52
215
47
ComponentsComponents WeightWeight(kg)(kg)
Fuel Processing Sub-SystemFuel Processing Sub-System

EC/db/IR49739-0300 56
Table of Contents
Cost Modeling
2 Next Steps
3
1 Project Overview
Appendix
Technology Assessment
PNGV Targets

EC/db/IR49739-0300 57
Cost Modeling
A cost estimate has been developed for the system specified in theTechnology Assessment.
� Develop cost model
� Specify manufacturingprocesses andmaterials
� Develop productionscenarios
� Baseline cost estimate
Task 1:PEMFC System
TechnologySynopsis
Task 2:Task 2:Develop CostDevelop Cost
Model and Model and BaselineBaseline
EstimatesEstimates
Task 3:Identify
Opportunities for System
Cost Reduction

EC/db/IR49739-0300 58
Fuel Cell Stack
Fuel Processor
Balance of Plant
Water, Air, and Thermal Management
Power Conditioning
Controls & Sensors
The cost model will be built on our fundamental understanding of thecomponent subsystem technologies, and possible manufacturingprocesses.
Definition ofSubsystem and
System OperatingParameters
DevelopSubsystem and
ComponentDesign
Cost Analysis
e.g.,• Temperature• Pressure• Power• Density Define Baseline
Designs
Bottoms-Up Model
• Materials• Manufacturing• Processes
TotalSystem
Cost
e.g.,• Fuel• CO at outlet, …
e.g.,• Flow rates• Fuel purity
Specifications forComponents
Industry Projectedor Available Data
Component
System Specification/Design Cost Modeling
Other
Cost Modeling Approach

EC/db/IR49739-0300 59
The assumptions listed below impact the cost of the various systems
Fuel ProcessorFuel Processor
ANL Catalyst Activities
Startup Time 10 minutes
100 ppm CO
Vessel pressure safetyfactor 2.5 (not ASME)
The design for high efficiency has a major impact on sizing of the fuelcell and consequently its cost.
Cost Modeling Assumptions
Fuel CellFuel Cell
250 mW/cm2
300 V Stack
600cm2 active area
Active Area 80% of Area
Anode 0.2/0.4 Ru/Pt mg/cm2
Cathode 0.4 Pt mg/cm2
Membrane $50/ m2
OtherOther
Turbocompressor $500
Net Parasitics 6 KW
Max Ambient Temp 95 F
Stack Temp 80C
Negligible pressure drops insystem

EC/db/IR49739-0300 60
Cost Modeling System Cost Breakdowns Fuel Cell
The electrodes, electrolyte membrane, and bipolar plate dominate thecost of the fuel cell.
� $2.25 per lb was assumed for the high purity specialized graphite usedin the bipolar plates
� High volume (150,000 short tons assumed)� 99.99% pure materials now cost $1.75 - 2.00 per lb
Mtl Cost ($/m2)
Process Cost ($/m2)
Total Cost ($/m2)
Unit Cell Weight/Area
(g/cm2)
Total Fuel Cell Module Weight
Total Fuel Cell
Module Mtl Cost
($)
Total Fuel Cell Module Process Cost ($)
Total Fuel Cell Module
Cost ($)
Total Fuel Cell Module
Cost ($/kW)
Anode GDL $8.81 $0.48 $9.29 0.021 5.09 $200 $11 $211 $4Anode Active Layer $80.58 $2.11 $82.69 0.002 0.09 $1,828 $48 $1,875 $38Electrolyte $56.13 $1.78 $57.91 0.008 1.78 $1,273 $40 $1,313 $26Cathode Active Layer $75.20 $1.98 $77.18 0.002 0.00 $1,706 $45 $1,750 $35Cathode GDL $8.81 $0.48 $9.29 0.021 5.36 $200 $11 $211 $4
$229.51 $6.84 $236.35 0.054 12.33 $5,206 $155 $5,361 $107$37.19 $8.48 $45.67 0.584 133.13 $844 $192 $1,036 $21
2.52 $142 $234 $376 $84.05 $17 $2 $19 $0.4
10.12 $25 $1 $26 $12.05 $48 $1 $49 $1
10.98 $35.5 $2.8 $38.4 $0.774.42 $37 $2 $40 $1
$106 $106 $2$266.70 $15.32 $282.02 0.638 179.60 $6,354 $697 $7,051 $141
Final Assy
Stack Costs
MEA TotalBipolar Interconnect2
Active Area Basis1
Total Unit Cell
MEA
GasketsEnd Plates
Current CollectorInsulator
Outer WrapTie Bolts

EC/db/IR49739-0300 61
Table of Contents
Cost Modeling
2 Next Steps
3
1 Project Overview
Appendix
Technology Assessment
PNGV Targets

EC/db/IR49739-0300 62
CharacteristicCharacteristic UnitsUnitsCalendar YearCalendar Year
19971997 20002000 20042004
Energy Efficiency @ 25% peak power % 35 40 48
Power Density W/L 200 250 300
Specific Power W/kg 200 250 300
Cost $/kW 300 150 50
Startup to full power min 2 1 0.5
Transient Response (time from 10 to 90% power) sec 30 20 10
Emissions <Tier 2 < Tier 2 < Tier 2
Durability hour 1000 2000 5000
PNGV Goals Integrated System Targets
The listed goals pertain to a gasoline fueled flexible fuel system whichincludes fuel processor, fuel cell stack, and auxiliaries but excludes thegasoline tank and DC-DC converter.
EC/db/IR49739-0300 63
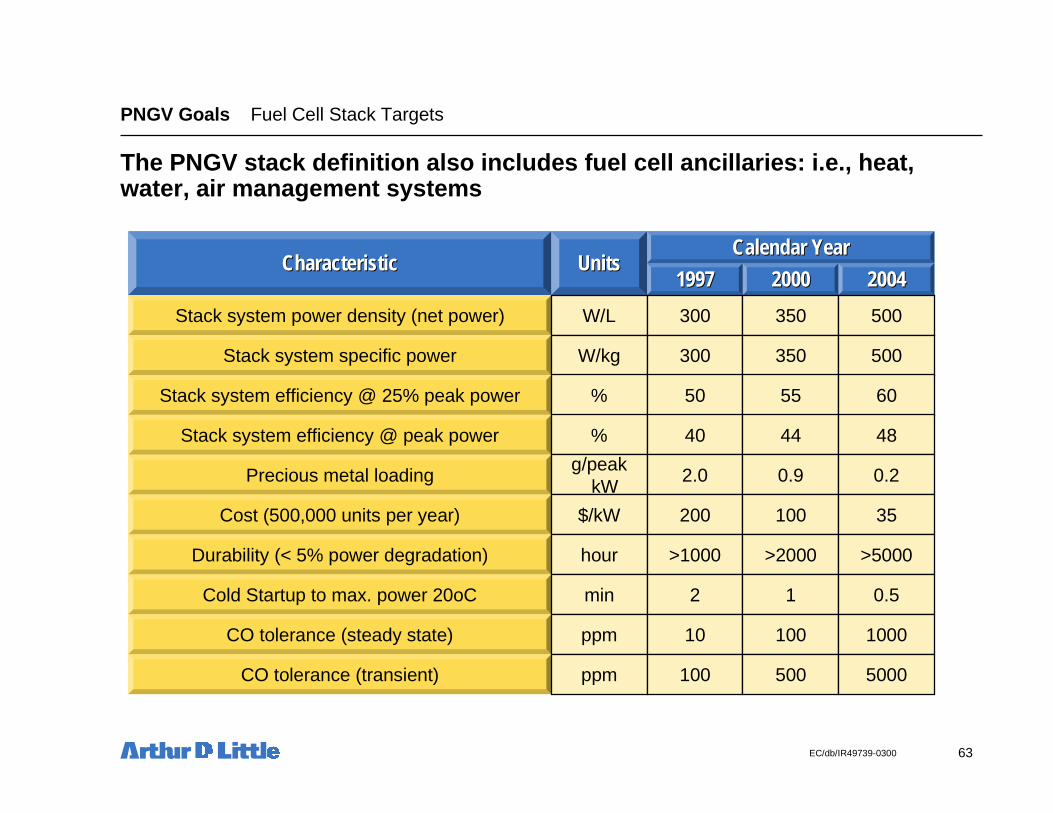
CharacteristicCharacteristic UnitsUnitsCalendar YearCalendar Year
19971997 20002000 20042004
Stack system power density (net power) W/L 300 350 500
Stack system specific power W/kg 300 350 500
Stack system efficiency @ 25% peak power % 50 55 60
Stack system efficiency @ peak power % 40 44 48
Precious metal loadingg/peak
kW2.0 0.9 0.2
Cost (500,000 units per year) $/kW 200 100 35
Durability (< 5% power degradation) hour >1000 >2000 >5000
Cold Startup to max. power 20oC min 2 1 0.5
CO tolerance (steady state) ppm 10 100 1000
CO tolerance (transient) ppm 100 500 5000
PNGV Goals Fuel Cell Stack Targets
The PNGV stack definition also includes fuel cell ancillaries: i.e., heat,water, air management systems

EC/db/IR49739-0300 64
CharacteristicCharacteristic UnitsUnitsCalendar YearCalendar Year
19971997 20002000 20042004
Energy efficiency % 70 75 80
Power Density W/L 400 600 750
Specific Power W/kg 400 600 750
Cost (500,000 units per year) $/kW 50 30 10
Transient response (time from 10 to 90%power)
sec 30 20 10
Start-up to full power min 2.0 1 0.5
Durability (< 5% power degradation) hour >1000 >2000 >5000
H2S content in product streamNH3 content in product stream
ppm0
<100
<100
<10
PNGV Goals Fuel-Flexible Fuel Processor Targets
The fuel processor includes controls, shift reactors, CO clean-up, and heatexchangers.
CO content steady state ppm 100 10 10
CO content transient ppm 5000 500 100
Fuel Processor efficiency = total fuel cell system efficiency/fuel cell stack system efficiency, where total fuel cell system efficiency accountsfor thermal integration