cost-benefit analysis of medication assisted treatment and needle-syringe programs in georgia
TRANSCRIPT
Cost-benefit analysis of Medication Assisted Treatment and Needle-
Syringe Programs in Georgia
Irma KirtadzeAddiction Research Center Alternative Georgia
July 2016

Gratitude
• USAID & CzDA• UNAIDS, EHRN, AIDS center & GHRN
• Carl Schütte (Consultant)

Overview• Population of Georgia - 3.7 million1
• People living with HIV/AIDS - is around 7,0002 • HCV prevalence in general population – 6.7%3
• Problem (injection) drug use - 49,700; (2.00%-2.04% among 18-64 year old population)4
• HIV/AIDS prevention interventions for PWID:– OST / MAT– NSP
1 Census 2014. http://census.ge/ge/results/census2 http://aidscenter.ge/epidsituation_eng.html 3 Shapatava, E., et al., 20064 Curatio International Foundation & Bemoni Public Union, 2015

HR Interventions
• 18 MAT sites, 2013 total expenditure 5,934,531 GEL – expenses per client 1,711 GEL per patient – only 995,419 GEL (16%) shared by GFATM
• 14 centers, 2013 total expenditure on NSP - 1,343,774 GEL – expenses per client - 255 GEL– source GFATM
Georgian Harm Reduction Network, 2015.
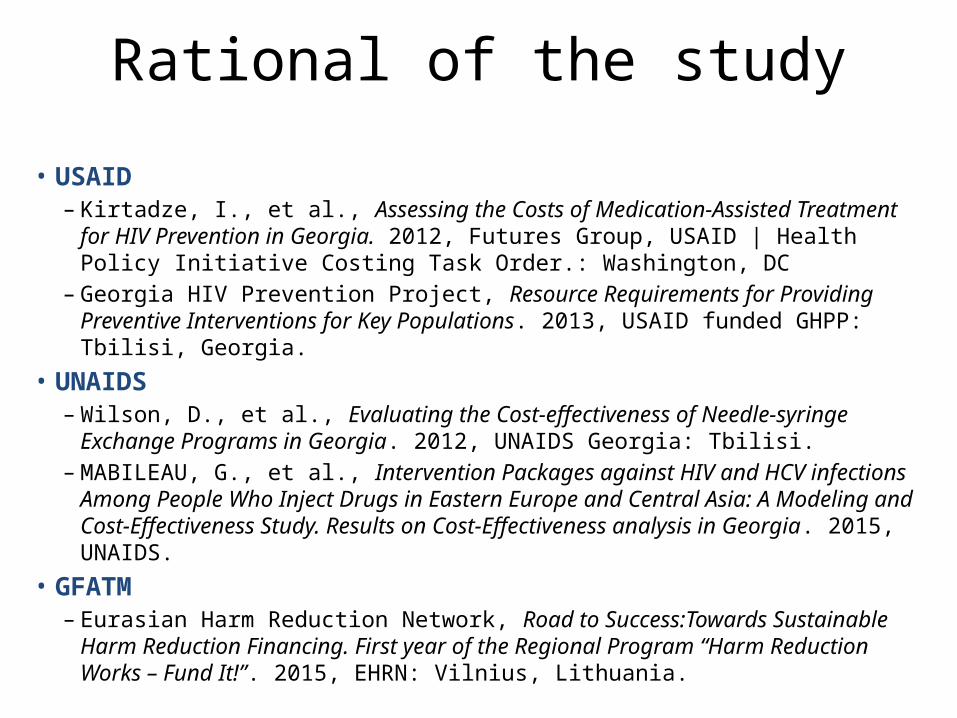
Rational of the study
• USAID – Kirtadze, I., et al., Assessing the Costs of Medication-Assisted Treatment for HIV
Prevention in Georgia. 2012, Futures Group, USAID | Health Policy Initiative Costing Task Order.: Washington, DC
– Georgia HIV Prevention Project, Resource Requirements for Providing Preventive Interventions for Key Populations. 2013, USAID funded GHPP: Tbilisi, Georgia.
• UNAIDS – Wilson, D., et al., Evaluating the Cost-effectiveness of Needle-syringe Exchange
Programs in Georgia. 2012, UNAIDS Georgia: Tbilisi.– MABILEAU, G., et al., Intervention Packages against HIV and HCV infections Among
People Who Inject Drugs in Eastern Europe and Central Asia: A Modeling and Cost-Effectiveness Study. Results on Cost-Effectiveness analysis in Georgia. 2015, UNAIDS.
• GFATM– Eurasian Harm Reduction Network, Road to Success:Towards Sustainable Harm
Reduction Financing. First year of the Regional Program “Harm Reduction Works – Fund It!”. 2015, EHRN: Vilnius, Lithuania.

Objectives
Main objective of CBA is to provide policy makers and planners with insights into several key questions:
– What are the cost-benefits of NSP and MAT services using 3 different scenarios?
– Determine more cost-beneficial scenario (which scenario results in the best cost-benefit ratio?);
– What are the costs and benefits of scaling-up MAT/NSP services?

Methodology
• Case study that contains both descriptive and analytical components, quantitative cost benefit analyses that involve following:– Determine costs – identifying and describing costs; – Calculate benefits – attributing benefits (analyzing
the contribution of the intervention to achieving the observed outcomes);
– Compare alternatives - comparing costs and benefits (analyzing the relationships between costs and benefits)
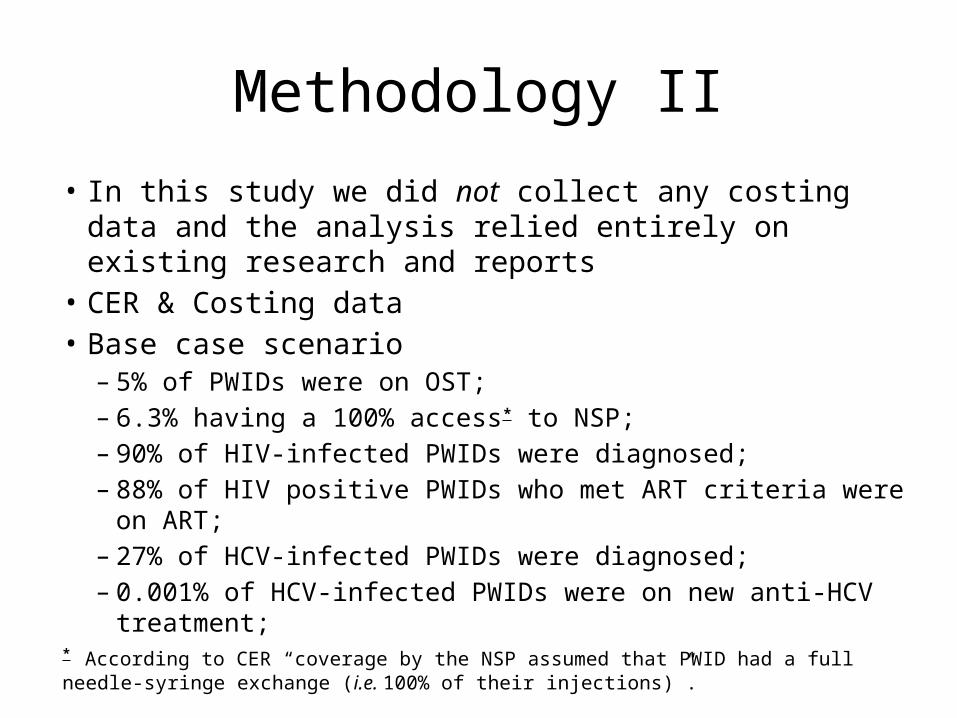
Methodology II• In this study we did not collect any costing data and the
analysis relied entirely on existing research and reports • CER & Costing data• Base case scenario
– 5% of PWIDs were on OST;– 6.3% having a 100% access* to NSP;– 90% of HIV-infected PWIDs were diagnosed;– 88% of HIV positive PWIDs who met ART criteria were on ART;– 27% of HCV-infected PWIDs were diagnosed;– 0.001% of HCV-infected PWIDs were on new anti-HCV treatment;
* According to CER “coverage by the NSP assumed that PWID had a full needle-syringe exchange (i.e. 100% of their injections)”.

Key input variables
ParametersValues
2013 - HIV 2013 - HCV
People who inject drugs 45,000
Period (n) (periods of growth) 19
Growth rate in PWID 2%
Inflation rate (USD) 1%
HIV / HCV prevalence in PWIDs 3.45% 51%
% increase in HIV / HCV prevalence 0 0
% diagnosed 95% 27%
% with CD4 <350 57%
% of ART-eligible treated (among HIV-diagnosed) 88% 0.001%
HIV / HCV prevalence in PWIDs (CER) 1552.5 22950
# diagnosed 1474.875 6196.5
# with CD4 <350 840.67875 0
# of ART-eligible / HCV treated (among diagnosed) 739.7973 0.061965
% of HIV positive PWID treated 48% 0.000%

Methodology III• 3 scenarios out of 9 of CER (5,10 & 20 years)
– Strategy 2 - Increase of NSP: only NSP coverage is increased from the 2013 level to 40% of PWIDs reached at 100%;
– Strategy 3 - Increase of NSP and MAT: strategy 2) + increase of MAT coverage from the 2013 level to 20% of PWIDs;
– Strategy 6- Increase of NSP, MAT, ART: NSP coverage is increased from the 2013 level to 40% of PWIDs reached at 100%; increase of MAT coverage from the 2013 level to 20% of PWIDs, ART coverage is increased from the 2013 level to 90% of PWIDs;
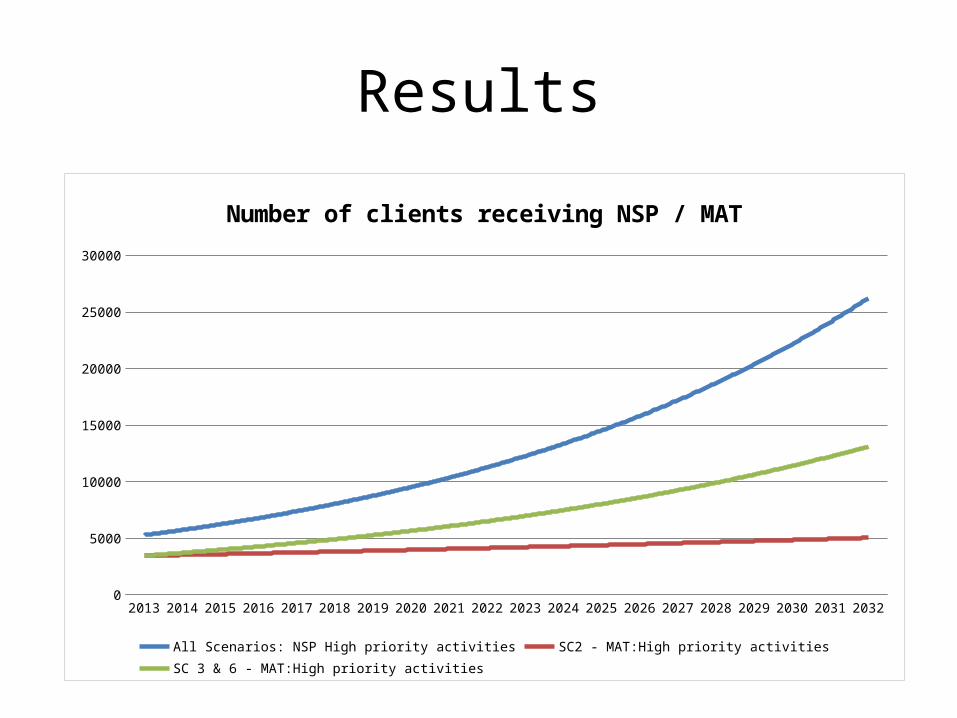
Results
2013 2014 2015 2016 2017 2018 2019 2020 2021 2022 2023 2024 2025 2026 2027 2028 2029 2030 2031 20320
5000
10000
15000
20000
25000
30000
Number of clients receiving NSP / MAT
All Scenarios: NSP High priority activities SC2 - MAT:High priority activities SC 3 & 6 - MAT:High priority activities

Results
20132014
20152016
20172018
20192020
20212022
20232024
20252026
20272028
20292030
20312032
$0
$5,000,000
$10,000,000
$15,000,000
$20,000,000
$25,000,000
$30,000,000
$35,000,000
Total annual intervention costs in USD
Scenario 2 Scenario 3 Scenario 6 Baseline
Results
2013 2014 2015 2016 2017 2018 2019 2020 2021 2022 2023 2024 2025 2026 2027 2028 2029 2030 2031 20320
200
400
600
800
1000
1200
1400
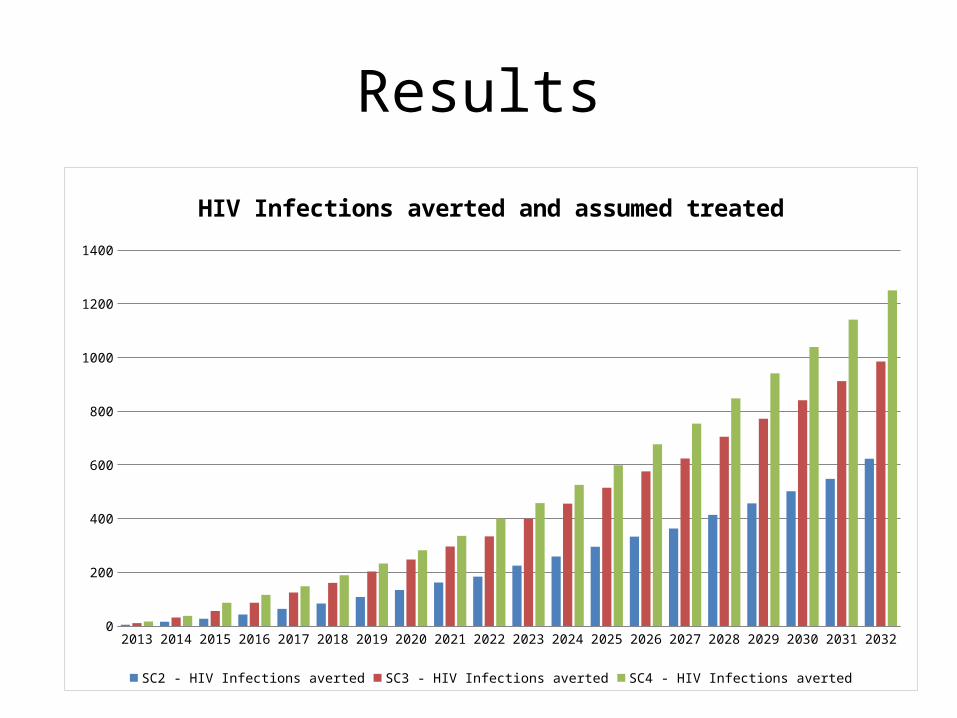
HIV Infections averted and assumed treated
SC2 - HIV Infections averted SC3 - HIV Infections averted SC4 - HIV Infections averted

Results
2013 2014 2015 2016 2017 2018 2019 2020 2021 2022 2023 2024 2025 2026 2027 2028 2029 2030 2031 20320
2000
4000
6000
8000
10000
12000
14000
16000
18000
HCV Infections averted and assumed treated
SC2 - HCV Infections averted SC3 - HCV Infections averted SC6 - HCV Infections averted

Results
• Almost no difference between scenario 3 and 6 which implies that increased HIV treatment coverage has virtually no impact on HCV infections averted.
• The incremental net present value cost per HCV infection averted for SC 2 is $2,559 while for SC 3 and 6 the same value is much higher at $5,371 and $5,712 respectively.

Net Present Valuefor all 3 scenarios over 20 years
• The net present value of each scenario reflects the total intervention costs less the discounted costs of lifetime treatment for HIV and the cost of treatment for HCV discounted (3%) back to the base year- 2013.
• 2 Scenario:– NPV of incremental cost = $ 24,111,916– Savings = $42,744,429
• 3 Scenario:– NPV of incremental cost = $87,038,158– Savings = $72,690,930
• 6 Scenario: – NPV of incremental cost = $92,667,031– Savings = $76,677,648

Net Present Valuefor all 3 scenarios over 20 years
Scenario Net NPV
2 $ 18,632,512
3 $ -4,347,228
6 $ -5,989,383

Results of sensitivity analysis
• Discounted savings associated with increased treatment coverage in scenario 2 are increased by an amount of $2.4 million and the total NPV increases to $21.0 million
• Discounted savings associated with increased treatment coverage in scenario 2 are increased by an amount of $1.6 million and the total NPV increases to $20.2 million
• The NPV is more sensitive to a 5% increase or decrease in HCV treatment coverage than a 5% fluctuation in the price of HCV treatment
5% increase in HCV treatment coverage
$ 2,369,077 $ 21,001,590 5% increase in HCV treatment price $ 1,660,852 $ 20,293,364
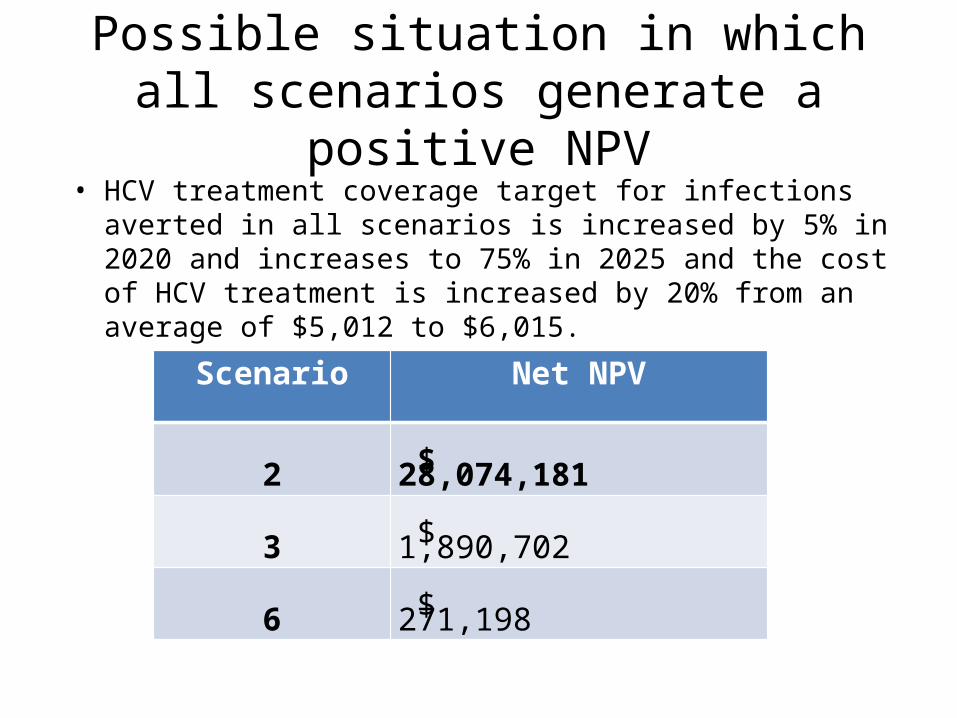
Possible situation in which all scenarios generate a positive NPV
• HCV treatment coverage target for infections averted in all scenarios is increased by 5% in 2020 and increases to 75% in 2025 and the cost of HCV treatment is increased by 20% from an average of $5,012 to $6,015.
Scenario Net NPV
2 $ 28,074,181
3 $ 1,890,702
6 $ 271,198

Limitations
• Secondary data analysis• Model based calculation• Other benefits (social-psychological-criminal)
were not quantified, which may impact on the PNV of all scenarios.

Practical implications of CBA results
• From a NPV perspective SC.2 is more attractive, as the cost of MAT programme is expensive, and appears to be less effective at generating infections averted.
• The NPV of scenario 2 is however significant and at least the NSP programme should be expanded rapidly for long term benefits associated with averting HCV infections and related treatment.
• If policy and practical barriers are introduced to NSP programme and coverage not achieved this will impact significantly on NPV, i.e. less infections will be averted and more will have to be spent on HCV treatment.
