cost benefit analysis of smart metering and direct load ... · energy smart meter working group ....
TRANSCRIPT

29 February 2008
Cost Benefit Analysis of Smart Metering and Direct Load Control
Overview Report for Consultation
Report for the Ministerial Council on Energy Smart Meter Working Group

Project Team
Adrian Kemp
Ann Whitfield
Brendan Quach
Yuliya Hedynach
Tara D’Souza
NERA Economic Consulting Darling Park Tower 3 201 Sussex Street Sydney NSW 2000 Tel: +61 2 8864 6500 Fax: +61 2 8864 6549 www.nera.com
Consultation Report - Cost Benefit Analysis of Smart Metering and DLC
Contents
NERA Economic Consulting
Contents
Glossary i
Executive Summary iii
1. Introduction 1 1.1. Background to the Project 1 1.2. The Project Team 2 1.3. Stakeholder Involvement 4 1.4. Invitation for Submissions 5 1.5. Structure of the Report 6
2. Assessment of Smart Metering and Direct Load Control 7
2.1. What are the potential motivations for a mandatory smart metering rollout or a DLC rollout? 7
2.2. Summary of National Results 8 2.3. Discussion 11
3. Methodology and Approach 14 3.1. Scope of the Analysis 14 3.2. Assumed Functionality 14 3.3. Scenarios 18 3.4. Counterfactual 22 3.5. Second Round Impacts 24 3.6. Urban, Rural and Remote Analysis 25 3.7. Identification and Treatment of Transfer Payments 25
4. Key Assumptions 28 4.1. Time Period for the Analysis 28 4.2. Rollout Timeframe 29 4.3. Discount Rate 31
5. Assessment of Costs 32 5.1. Smart Meter Scenarios 32 5.2. Direct Load Control rollout (Scenario 3) 41
6. Assessment of Benefits 43 6.1. Business Efficiencies/ Service Quality Improvements 43 6.2. Avoided Metering Costs 46 6.3. Demand Response Benefits 47 6.4. Impact of Scenarios on Benefits 55

Consultation Report - Cost Benefit Analysis of Smart Metering and DLC
Contents
NERA Economic Consulting
7. Queensland 58 7.1. Key Jurisdictional Characteristics 58 7.2. Results of the Cost Benefit Analysis 59 7.3. Discussion 63 7.4. Summary 67
8. New South Wales 68 8.1. Key Jurisdictional Characteristics 68 8.2. Results of the Cost Benefit Analysis 69 8.3. Discussion 74 8.4. Summary 78
9. Australian Capital Territory 79 9.1. Key Jurisdictional Characteristics 79 9.2. Results of the Cost Benefit Analysis 79 9.3. Discussion 82 9.4. Summary 84
10. Victoria 85 10.1. Key Jurisdictional Characteristics 85 10.2. Results of the Cost Benefit Analysis 86 10.3. Discussion 90 10.4. Summary 95
11. South Australia 97 11.1. Key Jurisdictional Characteristics 97 11.2. Results of the Cost Benefit Analysis 98 11.3. Discussion 102 11.4. Summary 107
12. Tasmania 108 12.1. Key Jurisdictional Characteristics 108 12.2. Results of the Cost Benefit Analysis 109 12.3. Discussion 112 12.4. Summary 114
13. Western Australia 115 13.1. Key Jurisdictional Characteristics 115 13.2. Results of the Cost Benefit Analysis 116 13.3. Discussion 120 13.4. Summary 124
14. Northern Territory 125 14.1. Key Jurisdictional Characteristics 125

Consultation Report - Cost Benefit Analysis of Smart Metering and DLC
Contents
NERA Economic Consulting
14.2. Results of the Cost Benefit Analysis 125 14.3. Discussion 129 14.4. Summary 132
15. National Assessment 133 15.1. Summary of Jurisdictional Analysis 133 15.2. Stakeholder Analysis 137 15.3. Urban, Rural and Remote Assessment 140 15.4. Consumer assessment 149
16. Minimum National Functionality 153 16.1. Review of the Phase 1 Functionality Recommendations 154 16.2. Additional functionalities requiring further consideration
and analysis 164 16.3. Final Recommended National Minimum Smart Meter
Functionality 185
17. Assessment of Rollout Scenarios Against the MCE Required Objectives 188
17.1. Objectives Applying to the Rollout 188 17.2. Assessment 188
18. Conclusions and Recommendations 195 18.1. Risks and Uncertainties Arising from the Results 195 18.2. Conclusions on the Jurisdictional Analysis 196 18.3. Conclusions on the Smart Metering Scenarios 197 18.4. Conclusions on Non-Smart Metering DLC Scenario 202 18.5. Qualitative Benefits 203 18.6. Conclusions on the Consumer Impacts 204 18.7. Implications for Greenhouse Gas Emissions 205 18.8. Transitional Regulatory, Legal and Technical Issues 206
Appendix A. Submissions Received in Response to the Phase 1 Overview Report 208
Appendix B. List of Stakeholders Consulted/RFIs sent as part of Phase 2 209
Appendix C. Summary of Cost Benefit Analysis for each Jurisdiction on a per NMI Basis 211
Appendix D. Results of the Cost Benefit Analysis for each Jurisdiction (NPV terms) 211

Consultation Report - Cost Benefit Analysis of Smart Metering and DLC
Contents
NERA Economic Consulting
Appendix E. NMI Breakdown by Jurisdiction 212

List of Tables
NERA Economic Consulting
List of Tables
Table E.1 Final functionalities recommended for inclusion in a minimum national meter specification viii
Table E.2 Net Present Value of Benefits and Costs ($m) – National (Excluding HAN, Accumulation Meter Counterfactual) xi
Table E.3 Assessment of Rollout Scenarios Against MCE Required Objectives: Relative Ranking of Scenarios xxv
Table 2.1 Net Present Value of Benefits and Costs ($m) – National (Excluding HAN) 8 Table 3.1 Minimum National Functionality for a Smart Metering System 15 Table 3.2 Functionalities Subject to Further Assessment 17 Table 3.3 Functionalities Included in a Direct Load Control Scenario 18 Table 3.4 Comparison of smart meter scenarios 21 Table 5.1 Allocation of costs between scenarios 36 Table 6.1 Benefits accruing to the meter provider 56 Table 7.1 NPV of Costs and Benefits ($m) – Queensland 60 Table 7.2 Breakdown of Costs and Benefits (NPV, $m) – Queensland 62 Table 8.1 NPV of Costs and Benefits ($m) – New South Wales 71 Table 8.2 Breakdown of Costs and Benefits (NPV,$m) – New South Wales (winter
peaking load) 72 Table 8.3 Breakdown of Costs and Benefits (NPV,$m) – New South Wales (summer
peaking load) 73 Table 9.1 NPV of Costs and Benefits ($m) – Australian Capital Territory 80 Table 9.2 Breakdown of Costs and Benefits (NPV,$m) – Australian Capital Territory 81 Table 10.1 NPV of Costs and Benefits ($m) – Victoria 87 Table 10.2 Breakdown of Costs and Benefits (NPV,$m) – Victoria 89 Table 10.3 NPV of Benefits and Costs Using Alternative Counterfactual ($m) – Victoria,
Scenario 1 92 Table 11.1 NPV of Costs and Benefits ($m) – South Australia 100 Table 11.2 Breakdown of Costs and Benefits (NPV,$m) – South Australia 101 Table 12.1 NPV of Costs and Benefits ($m) – Tasmania 110 Table 12.2 Breakdown of Costs and Benefits (NPV,$m) – Tasmania 111 Table 13.1 NPV of Costs and Benefits ($m) – Western Australia 117 Table 13.2 Breakdown of Costs and Benefits (NPV,$m) – Western Australia 119 Table 14.1 NPV of Costs and Benefits ($m) – Northern Territory 127 Table 14.2 Breakdown of Costs and Benefits (NPV,$m) – Northern Territory 128 Table 15.1 Summary of Results by Jurisdiction – Accumulation Meter Counterfactual 133 Table 15.2 Summary of Results by Jurisdiction – Accumulation Meter Counterfactual 134 Table 15.3 Summary of Results by Jurisdiction – Current Metering Policy Counterfactual
Net Benefit (NPV, $m) 135 Table 15.4 Summary of Results by Jurisdiction – Current Metering Policy Counterfactual
Net Benefit per NMI (NPV, $) 136 Table 15.5 Stakeholder Breakdown – National (NPV, $m) 138 Table 15.6 Urban and Rural/Remote Breakdown ($m) – National, Total NPV 143 Table 15.7 Urban and Rural/Remote Breakdown ($) - National, NPV per NMI 145 Table 15.8 Communications Technologies Assumed 147 Table 15.9 Summary of Jurisdictional Bill Impacts – Average Consumption Customer 151 Table 16.1 Draft Recommendations from Phase 1 of Functionalities to be Included in a
Minimum National Functionality 154 Table 16.2 NPV of Costs and Benefits ($m) - Functionality 15, National 165 Table 16.3 NPV of Costs and Benefits ($m) - Functionality 15, Jurisdictional Breakdown 165 Table 16.4 NPV of Costs and Benefits ($m) - Functionality 16, National 168 Table 16.5 NPV of Costs and Benefits ($m) - Functionality 16, Jurisdictional Breakdown 169 Table 16.6 Assumptions for Functionalities 15, 16 and Scenario 3 176 Table 16.7 NPV of Costs and Benefits ($m) - Functionalities 15, 16AB and 16C, National 178 Table 16.8 Final Functionalities Recommended for Inclusion in a Minimum National Meter
Specification 186 Table 17.1 Assessment of Rollout Scenarios Against MCE Required Objectives: 189

List of Figures
NERA Economic Consulting
List of Figures
Figure E.1 Interaction Between Workstreams v Figure E.2 NPV of Benefits and Costs ($m) - National Scenario 1 (Excluding HAN,
Accumulation Meter Counterfactual) xi Figure E.3 NPV of Benefits and Costs ($m) - National Scenario 1 (Including HAN,
Accumulation Meter Counterfactual) xiii Figure E.4 Summary of Results by Jurisdiction – Net Benefit (NPV, $m) (Excluding HAN,
Current Metering Policy Counterfactual) xvii Figure E.5 Summary of Results by Jurisdiction – Net Benefit (NPV, $m) (Excluding HAN,
Accumulation Counterfactual) xviii Figure 1.1 Interaction Between Workstreams 3 Figure 2.1 NPV of Benefits and Costs ($m) - National Scenario 1 (Excluding HAN) 9 Figure 4.1 Assumed Jurisdictional Rollout Profiles 30 Figure 7.1 NPV of Benefits and Costs ($m) – Queensland, Scenario 1 59 Figure 7.2 NPV of Benefits and Costs ($m) – Queensland, Scenario 3 60 Figure 7.3 Annual Network Efficiency Benefits ($m) – Queensland, Scenario 1 64 Figure 8.1 NPV of Benefits and Costs ($m) – New South Wales, Scenario 1 70 Figure 8.2 NPV of Benefits and Costs ($m) – New South Wales, Scenario 3 70 Figure 8.3 Annual Network Efficiency Benefits ($m) – New South Wales, Scenario 1 75 Figure 9.1 NPV of Benefits and Costs ($m) – Australian Capital Territory, Scenario 1 80 Figure 9.2 Annual Network Efficiency Benefits ($m) – Australian Capital Territory,
Scenario 1 83 Figure 10.1 NPV of Benefits and Costs ($m) – Victoria, Scenario 1 86 Figure 10.2 NPV of Benefits and Costs ($m) – Victoria, Scenario 3 87 Figure 10.3 NPV of Benefits and Costs Using Alternative Counterfactual ($m) – Victoria,
Scenario 1 92 Figure 10.4 Annual Network Efficiency Benefits ($m) – Victoria, Scenario 1 93 Figure 11.1 NPV of Benefits and Costs ($m) – South Australia, Scenario 1 99 Figure 11.2 NPV of Benefits and Costs ($m) – South Australia, Scenario 3 99 Figure 11.3 Annual Network Efficiency Benefits ($m) – South Australia, Scenario 1 103 Figure 12.1 NPV of Benefits and Costs ($m) – Tasmania, Scenario 1 109 Figure 12.2 Annual Network Efficiency Benefits ($m) – Tasmania, Scenario 1 113 Figure 13.1 NPV of Benefits and Costs ($m) – Western Australia, Scenario 1 116 Figure 13.2 NPV of Benefits and Costs ($m) – Western Australia, Scenario 3 117 Figure 13.3 Annual Network Efficiency Benefits ($m) – Western Australia, Scenario 1 121 Figure 14.1 NPV of Benefits and Costs ($m) – Northern Territory, Scenario 1 126 Figure 14.2 NPV of Benefits and Costs ($m) – Northern Territory, Scenario 3 126 Figure 14.3 Annual Network Efficiency Benefits ($m) – Northern Territory, Scenario 1 130 Figure 15.1 Summary of Results by Jurisdiction – Accumulation Meter Counterfactual
Excluding HAN, Net Benefit ($m) 134 Figure 15.2 Summary of Results by Jurisdiction – Current Metering Policy Counterfactual
Excluding HAN, Net Benefit ($m) 137 Figure 15.3 Urban and Rural/Remote Breakdown (Sm) – National Total NPV 141 Figure 15.4 Urban and Rural/Remote Breakdown (Sm) – National NPV per NMI 142 Figure 16.1 NPV of Benefits and Costs ($m) - Functionality 15, National 165 Figure 16.2 NPV of Benefits and Costs ($m) - Functionality 16C with an IHD, National 169 Figure 16.3 Smart metering system communications chain 180

List of Boxes
NERA Economic Consulting
List of Boxes
Box 6.1: Impact on Greenhouse Gas Emissions 49 Box 6.2: Demand Response Benefits – Key Assumptions 50 Box 6.3: Pass-through of Network Signals in Retail Tariffs 53

Consultation Report - Cost Benefit Analysis of Smart Metering and DLC
Glossary
NERA Economic Consulting i
Glossary
B2B Business-to-business (communications hub)
COAG Council of Australian Governments
CPP Critical Peak Price/Pricing
CRA CRA International
DITR Department of Industry, Tourism and Resources
DLC Direct Load Control
DRED Demand response enabling device
DUOS Distribution use of system
EMCa Energy Market Consulting associates
GPRS General packet radio service
HAN Home area network
IHD In-home display
IMO Independent Market Operator (Western Australia)
kVa Kilovolt-ampere (measure of maximum demand)
MW Megawatts (1,000,000 watts)
MCE Ministerial Council on Energy
MDA Meter data aggregation
MDM Meter data management
NEM National Electricity Market
NEMMCO National Electricity Market Management Company
NER National Electricity Rules
NERA NERA Economic Consulting
NMI National Metering Identifier
NPV Net present value
PLC Power line carrier
PSTN Public switched telephone network (dial up)
PV Photovoltaic (solar cells)
RFI Request for information
SMSWG Smart Meter Stakeholder Working Group
SMWG Smart Meter Working Group
SWIS South West Interconnected System
TOU Time of Use

Consultation Report - Cost Benefit Analysis of Smart Metering and DLC
Glossary
NERA Economic Consulting ii
USE Unserved energy
WA IMO Western Australia Independent Market Operator
WEM Western Australia Wholesale Electricity Market

Consultation Report - Cost Benefit Analysis of Smart Metering and DLC
Executive Summary
NERA Economic Consulting iii
Executive Summary
NERA Economic Consulting (NERA) has been engaged by the Ministerial Council on Energy’s Smart Meter Working Group (SMWG) to estimate the net benefits associated with a mandatory rollout of smart metering, and a non-smart meter direct load control alternative. This report summarises the results of Phase 2 of the national cost benefit analysis and includes the estimates of the costs and benefits of smart metering and direct load control for each jurisdiction. It also provides NERA’s final recommendation as to the national minimum functionality for smart meters.
What are smart meters?
Smart meters are electricity meters that are capable of measuring and recording energy consumption in short intervals. They are also capable of two-way communication, which enables energy providers to read and control features of the meter remotely.1
Smart meters provide energy providers with capabilities that can deliver benefits, including:
lowering the cost of distribution network service providers’ and retail businesses’ services;
avoiding network augmentation and reducing unserved energy by facilitating the introduction of innovative tariff products and enabling direct load control capabilities that change the time of use of, and total demand for, electricity; and
enhancing service performance.
These benefits need to be weighed against the costs of a large scale rollout. These costs include the cost of purchasing and installing the meters, communications costs, and the cost of upgrading distributors’ and retailers’ billing and management systems to process and store more detailed usage data and the upgrade of the National Electricity Market Management Company (NEMMCO) and the Western Australia Independent Market Operator (WA IMO) data management systems. The costs and benefits of a smart meter rollout must also be weighed against the costs and benefits associated with other demand management alternatives.
At its meeting in April 2007 the Council of Australian Governments (COAG) endorsed a staged approach for the national mandated rollout of electricity smart meters to areas where benefits outweigh costs, as indicated by the results of a cost benefit analysis.
A national cost benefit analysis of smart metering
In July 2007, the SMWG appointed a team of consultants to undertake the cost benefit analysis required by COAG.2 The cost benefit analysis is intended to provide the basis for future Ministerial Council on Energy (MCE) decisions with regard to smart meters.
1 Meters that are capable of measuring and recording energy in short intervals but do not have two-way communication
abilities ( ‘interval meters’) are distinguished from ‘smart meters’ which do have a two-way communication ability.

Consultation Report - Cost Benefit Analysis of Smart Metering and DLC
Executive Summary
NERA Economic Consulting iv
The Terms of Reference for the cost benefit analysis divided the project into two work phases.
Phase 1 involved an incremental assessment of a list of smart metering functionalities for the purpose of recommending those functions to be included in a minimum national functionality. At its meeting on 13 December 2007 the MCE agreed to establish a minimum functionality for smart meters in the National Electricity Rules in line with the recommendations made as part of Phase 1 of our study and following the consideration of submissions on Phase 1. Our final recommendations on the national minimum functionality as presented in this Overview Report are consistent with the MCE’s decision. We note that the MCE is considering further specific requirements for the home area network to support in-home displays and direct load control of appliances. Our conclusions in relation to the associated functionality that would facilitate the home area network are outlined in this report.
Phase 2 addresses the further question of whether the costs of rolling out smart meters (or of undertaking an alternative direct load control scenario) exceed the benefits, given the particular circumstances of each jurisdiction and regional differences within those jurisdictions (ie, urban, rural and remote areas). This assessment is intended to assist the MCE in determining any specific areas where replacement and rollout may be exempted or delayed on the basis of local factors that are demonstrated to reduce net benefits for consumers.
This Overview Report constitutes the second output of the cost benefit analysis, and is being released for public consultation. This report has been prepared by NERA and is not endorsed by the SMWG, the Standing Committee of Officials (SCO) or the MCE. The SMWG will consider the recommendations in the report after the receipt of submissions from all interested parties. The SMWG will then develop recommendations for further consideration of the SCO and the MCE.
The cost benefit analysis was undertaken by four consulting teams
The national cost benefit analysis has been undertaken in six interlinked workstreams by separate consulting teams. Each workstream has been conducted in parallel and this Overview Report brings together the different streams of analysis to calculate the net benefits of alternative approaches to a smart metering rollout and a direct load control rollout.
The consulting teams involved in this review and their respective workstreams are:
NERA Economic Consulting (NERA): Workstream 1 - Coordination (including responsibility for this Phase 2 Overview Report and resulting recommendations); Workstream 4 - Consumer Impacts;
CRA International (CRA): Workstream 2 - Network Impacts; Workstream 5 - Economic Impacts (market and greenhouse modelling);
KPMG: Workstream 3 - Retailer Impacts; and
2 The team of consultants that has been involved in this assignment are discussed in the following section.

Consultation Report - Cost Benefit Analysis of Smart Metering and DLC
Executive Summary
NERA Economic Consulting v
Energy Market Consulting associates (EMCa): Workstream 6 - Transitional Implementation Costs and their allocation.
Figure E.1 sets out the interactions between each of these workstreams in relation to the estimation of costs and benefits that inform this Overview Report.
Figure E.1 Interaction Between Workstreams
# Note: Reductions in hedging costs arise both as a result of more detailed metering data leading to improved forecasting and from reductions in peak wholesale energy demand.
Stakeholders have been closely involved in the analysis
The estimation of costs and benefits has benefited from information provided by distributors, retailers, metering providers, market operators and consumer representative organisations. Detailed information requests were sent to electricity businesses and metering providers, and in addition a series of structured workshops were held with relevant stakeholders. This information has formed the basis of the cost and benefit estimates developed particularly by EMCa, CRA International and KPMG.
The assessment considered four scenarios
To assess the costs and benefits of a smart metering rollout and a non-smart meter direct load control alternative the SMWG developed three smart metering rollout scenarios and one non-smart meter rollout scenario for assessment. These scenarios are:
Costs
Benefits
Demand related benefits
Workstream 4 (NERA)Impact on demand
Workstream5 (CRA)
Impact on the NEM (includinggreenhouse gasemissions)
Workstream4 (NERA)Consumersurplus
Workstream2 (CRA)Networkdeferralbenefits
Workstream3 (KPMG)Retailerbenefits:• Lower
hedgingcosts #
Workstream 3(KPMG)Retailer benefits:• Retailer business
efficiencies• Lower hedging
costs #• Reduction in
bad debt• Reduction in
working capital
Overview ModelWorkstream 1 (NERA)
Workstream 6 (EMCa)• Meter/Device costs• Communications systems costs• Backend IT costs• Systems-related operating costs• System refresh costs
Avoidedmetercosts
Distributorbusinessefficiencies
Reductionin unservedenergy
Workstream 3 (KPMG)Retailer non-systemsrelated operating costs
Workstream 2 (CRA)

Consultation Report - Cost Benefit Analysis of Smart Metering and DLC
Executive Summary
NERA Economic Consulting vi
Scenario 1: Distributor-led rollout – where each distribution network service provider is given the responsibility for owning and installing meters and associated metering data services within its area of operations as a monopoly service provider; 3
Scenario 2: Retailer-led rollout – where retailers have responsibility for procuring the installation of meters and data management services within a competitive market for these services;
Scenario 3: Non-smart meter direct load control (DLC) device rollout – which does not involve the installation of smart meters, and distributors have responsibility for retrofitting direct load control devices on high energy using appliances such as air- conditioners and pool pumps; and
Scenario 4: Centralised communications as part of a retailer-led rollout – where the entire Australian smart meter communications system is provided by either a new centralised agency or an existing market operator.
The scenarios are intended to estimate the range of costs and benefits which vary according to the rollout approach adopted. These are not intended to be conclusive of the options available to the MCE but rather to provide an understanding of how the costs and benefits may change under alternative approaches to rolling out smart metering and how these compare to a non smart metering alternative.
The scenarios have the potential to affect the costs of a smart meter rollout through differences in:
the infrastructure necessary for implementation;
the potential for the achievement of economies of scale; and
the scope for competitive provision of meters and meter data management services.4
Similarly, the benefits among scenarios may differ. This may be due to differences in the incentives retailers and distributors have for product innovation including the development of time of use tariffs (TOU) and critical peak pricing (CPP). There may also be benefits that distributors could achieve where they have the responsibility for the detailed design of the rollout that may not be realisable to the same extent under a retailer-led or a centralised communications rollout and vice versa.
The different scenarios also affect the allocation of the costs and benefits between retailers and distributors, particularly those costs and benefits associated with the role of the meter provider. Differences in the allocation of costs and benefits may change the incentives that 3 Note that while in this scenario the responsibility for providing meters is a monopoly this implies only that metering
assets are included in the distributor’s regulatory asset base and the distributor controls purchasing. Meter purchasing and related installation and maintenance services are still competitively purchased from the market, as in current practice, and regulatory incentives would maintain pressure on these costs.
4 The competitive provision of meters and meter data management services is a substitute for the monopoly provision and subsequent regulation of those services and may result in a different distribution of costs and benefits between consumers and the providers of those services depending on the relative efficiency of competition versus regulation in uncovering the true price of services.

Consultation Report - Cost Benefit Analysis of Smart Metering and DLC
Executive Summary
NERA Economic Consulting vii
either distributors or retailers have to invest in systems required to achieve some benefits, absent their inclusion in a mandated rollout.
Recommended national minimum functionality
The analysis of costs and benefits for the smart meter scenarios are based on the recommended national minimum functionality.5
After consideration of the submissions received on the Phase 1 reports, and further assessment of functions that we were unable to conclusively make a recommendation about in Phase 1, the functions in Table E.1 are recommended for inclusion in the minimum national functionality specification.
A description of each functionality is provided in section 3.2 of this report.
We note that a recommendation that emerges from this Overview Report is that an interface with a Home Area Network (HAN)6 should also be incorporated within the national minimum functionality for a smart meter rollout. This is discussed further below.
Following the identification of the functionalities that should be included in the minimum national functionality specification it will be necessary to clearly specify the performance requirement for each functionality and to undertake related technical work (such as in relation to managing the risks associated with a lack of interoperability, where this is found to be material). These are tasks that should be worked through by technical experts in consultation with stakeholders.
5 The costs and benefits associated with the inclusion of an interface to a Home Area Network in the minimum national
functionality are shown separately in the main body of the report, as discussed in the following section. 6 Functionality 16.

Consultation Report - Cost Benefit Analysis of Smart Metering and DLC
Executive Summary
NERA Economic Consulting viii
Table E.1 Final functionalities recommended for inclusion in a
minimum national meter specification No. Functionality
Core functions
1 Half-hourly consumption measurement and recording
2 Remote reading
3 Local reading – hand-held device
4 Local reading – visual display on meter
5 Communication and data security
6 Tamper detection
7 Remote time clock synchronisation
8 &14 Load management at meters through a dedicated controlled circuit
Energy measurement
9 Daily remote reading
10 Power factor measurement (three phase meters only)
11 Import/export metering
Switching and load management
12 Remote connect/disconnect
13 Supply capacity control
Facilitation of Customer Interaction
16 Interface with a Home Area Network
Supply and service monitoring
19 Quality of supply and other event recording
20 Meter loss of supply and detection
Upgradeability and configurability
25 Remote configuration
26 Remote software upgrades
29 Plug and play device commissioning
An interface with a home area network should be included in the national minimum functionality and would facilitate provision of an in home display by retailers
The analysis undertaken as part of Phase 1 was not able to conclusively resolve whether some of the functions identified for consideration by the SMWG, should be included in a national minimum functional specification for a smart meter. These functions included the interface to a HAN (functionality 16).
In Phase 2 of the analysis we have considered this functionality in more detail.
Consultation Report - Cost Benefit Analysis of Smart Metering and DLC
Executive Summary
NERA Economic Consulting ix
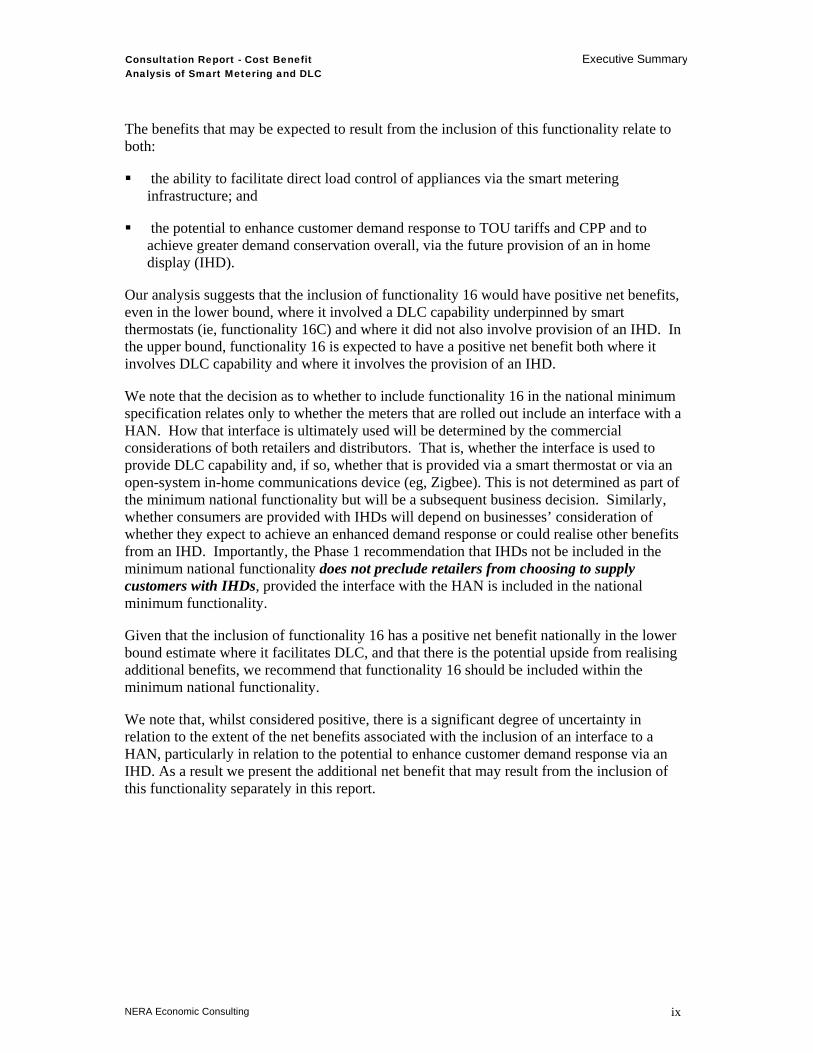
The benefits that may be expected to result from the inclusion of this functionality relate to both:
the ability to facilitate direct load control of appliances via the smart metering infrastructure; and
the potential to enhance customer demand response to TOU tariffs and CPP and to achieve greater demand conservation overall, via the future provision of an in home display (IHD).
Our analysis suggests that the inclusion of functionality 16 would have positive net benefits, even in the lower bound, where it involved a DLC capability underpinned by smart thermostats (ie, functionality 16C) and where it did not also involve provision of an IHD. In the upper bound, functionality 16 is expected to have a positive net benefit both where it involves DLC capability and where it involves the provision of an IHD.
We note that the decision as to whether to include functionality 16 in the national minimum specification relates only to whether the meters that are rolled out include an interface with a HAN. How that interface is ultimately used will be determined by the commercial considerations of both retailers and distributors. That is, whether the interface is used to provide DLC capability and, if so, whether that is provided via a smart thermostat or via an open-system in-home communications device (eg, Zigbee). This is not determined as part of the minimum national functionality but will be a subsequent business decision. Similarly, whether consumers are provided with IHDs will depend on businesses’ consideration of whether they expect to achieve an enhanced demand response or could realise other benefits from an IHD. Importantly, the Phase 1 recommendation that IHDs not be included in the minimum national functionality does not preclude retailers from choosing to supply customers with IHDs, provided the interface with the HAN is included in the national minimum functionality.
Given that the inclusion of functionality 16 has a positive net benefit nationally in the lower bound estimate where it facilitates DLC, and that there is the potential upside from realising additional benefits, we recommend that functionality 16 should be included within the minimum national functionality.
We note that, whilst considered positive, there is a significant degree of uncertainty in relation to the extent of the net benefits associated with the inclusion of an interface to a HAN, particularly in relation to the potential to enhance customer demand response via an IHD. As a result we present the additional net benefit that may result from the inclusion of this functionality separately in this report.

Consultation Report - Cost Benefit Analysis of Smart Metering and DLC
Executive Summary
NERA Economic Consulting x
Smart metering is estimated to deliver net benefits of between $179 million and $3.9 billion nationally7
Table E.2 summarises the overall net benefit resulting from the analysis, considered nationally across all of the jurisdictions in Australia, for each of the alternative rollout scenarios. The maximum net benefits of smart metering (excluding the costs and benefits that may accrue from the interface with a HAN) are estimated to arise from a distributor-led rollout of smart metering (Scenario 1), with a range of between $179 million and $3.9 billion in net present value (NPV) terms over a twenty year period. For the alternative rollout scenarios 2 and 4, the net benefit of smart metering is negative in the lower bound, reflecting both the higher costs associated with those scenarios and the lower level of expected benefits.
The net benefits reported in Table E.2 reflects a counterfactual of accumulation meters for each jurisdiction. We have also examined a counterfactual reflecting a continuation of the current metering policy in each jurisdiction. Under this counterfactual, the overall national net benefit increases.8
7 Excluding the net benefits that may accrue from the interface with a HAN. The potential additional net benefits that
may arise as the result of the inclusion of this interface are discussed below. 8 Jurisdictional results under this second counterfactual are discussed further below.

Consultation Report - Cost Benefit Analysis of Smart Metering and DLC
Executive Summary
NERA Economic Consulting xi
Table E.2 Net Present Value of Benefits and Costs ($m) – National
(Excluding HAN, Accumulation Meter Counterfactual)
Figure E.2 NPV of Benefits and Costs ($m) - National Scenario 1 (Excluding HAN, Accumulation Meter Counterfactual)
0
1,000
2,000
3,000
4,000
5,000
6,000
7,000
SMI Costs Avoided meter costs Business efficienciesand other benefits
Demand response
National SMI costsAvoided meter
costs
Business efficiencies and other benefits
Demand response Net position
Scenario 1 Distributor-led Minimum Net Benefit (4,343) 1,756 2,516 250 179 Maximum Net Benefit (2,717) 2,606 3,307 738 3,934
Scenario 2 Retailer-led Minimum Net Benefit (5,978) 1,756 2,101 250 (1,870) Maximum Net Benefit (3,587) 2,606 2,652 738 2,410
Scenario 3 Non-smart meter DLC Minimum Net Benefit (369) n/a n/a 403 34
Maximum Net Benefit (128) n/a n/a 746 618
Scenario 4 Centralised communications Minimum Net Benefit (5,631) 1,756 2,101 250 (1,524) Maximum Net Benefit (3,332) 2,606 2,652 738 2,664

Consultation Report - Cost Benefit Analysis of Smart Metering and DLC
Executive Summary
NERA Economic Consulting xii
Figure E2 is a waterfall diagram and should be interpreted as follows. The solid component of each of the bars represents the lowest end of the range estimated for the Smart Metering Infrastructure (SMI)9 costs, avoided meter costs, business efficiencies or demand response. The potential additional cost or benefit for each of the categories (as reflected by the upper end of the estimation range in each case) is indicated by the hatched areas. The colour of the hatched area corresponds to the colour of the solid area for each of the categories. The bars representing the benefits are shown so that the total of the low range for the benefits can be read directly from the graph. The total magnitude of the additional benefits (i.e, the top end of the ranges) is then indicated by the height of the uppermost hatched areas in the demand response bars.10 The waterfall diagram allows for both upper and lower ranges of total benefits to be compared directly with upper and lower ranges of the costs.
Inclusion of an interface with a HAN in the smart metering functionality increases the demand response benefit estimated for the three smart meter rollout scenarios compared with the estimates presented above, as well as increasing the rollout costs. The additional net benefit that may be realisable from the inclusion of the HAN ranges from $39 million (in NPV terms over the twenty year period) to $392 million.11 The net benefits including the HAN for a distributor-led rollout are illustrated in Figure E.3.
9 SMI refers to all the communication and data management support requirements of smart meters in addition to the
meters themselves. 10 Note that there are three hatched areas in the demand response bar, indicating the additional benefit (upper end of the
range) for the avoided meter costs (shaded blue), business efficiencies (shaded green) and demand response (shaded purple).
11 The lower bound estimate reported above reflects the incremental net benefit from utilising the HAN capability to facilitate DLC using smart thermostats (functionality 16C), assuming the lower bound uptake for DLC of 7.5 percent and no IHD. The upper estimate reflects a 15 percent take-up rate for DLC (functionality 16C) plus an additional 7% conservation effect associated with providing customers with an IHD. This additional conservation effect is highly uncertain and has been estimated to be zero in the lower bound of our analysis (in which circumstance the provision of an IHD would result in a negative net benefit). See discussion in section 16.2.

Consultation Report - Cost Benefit Analysis of Smart Metering and DLC
Executive Summary
NERA Economic Consulting xiii
Figure E.3 NPV of Benefits and Costs ($m) - National Scenario 1 (Including HAN, Accumulation Meter Counterfactual)
0
1,000
2,000
3,000
4,000
5,000
6,000
7,000
8,000
SMI Costs Avoided meter costs Business efficienciesand other benefits
Demand response
The cost of smart metering is estimated to be between $2.7 billion and $4.3 billion (in NPV terms)
The total costs of a national smart metering rollout have been estimated as ranging from $2.7 billion to $4.3 billion in NPV terms over a 20 year period, for a distributor-led rollout. The costs rise to over $5.9 billion for a retailer led rollout (upper bound). These estimates are based on the transitional cost estimates made by EMCa,12 along with estimates of operational costs and IT and modem refresh costs (as applicable) made by CRA and KPMG.13 These estimates have been developed through an extensive cost build up exercise, which includes estimating the costs of:
smart meters and their installation in each jurisdiction;
communications infrastructure;
meter data and communications management systems;
market operator systems to mange changes to market settlement information and new metering-related business to business transactions;
retailer systems to support the retailer activities expected to be undertaken as a result of the rollout of smart meters in each scenario; and
12 EMCa Workstream 1Transitional Costs Consultation Report (February 2008), section 12.2, Table 12-2. Note that the
costs in EMCa’s report have been present valued as part of the overall cost benefit modelling undertaken by NERA. 13 CRA Workstream 2 Network Impact Consultation Report (February 2008), section 16. KPMG, Retail Impact
Consultation Workstream Report (February 2008), Section 7.

Consultation Report - Cost Benefit Analysis of Smart Metering and DLC
Executive Summary
NERA Economic Consulting xiv
distributor systems to support the distributor activities expected to be undertaken as a result of the rollout of smart meters in each scenario.
In addition, an allowance has been made for program management costs relating to the smart metering infrastructure rollout.
The costs differed between each scenario due to:
differences in the assumed communications infrastructure considered by EMCa to be appropriate to support each scenario;
differences in the non-communications infrastructure, eg, the number of meter data management systems required; and
differences in meter costs between scenarios.
The benefits of smart metering are estimated to be between $4.5 billion and $6.7 billion (in NPV terms) The benefits associated with a national rollout of smart metering have been estimated by CRA, KPMG and NERA to be between $4.5 billion and $6.7 billion in NPV terms over the twenty year period of analysis, under the distributor-led rollout scenario. The value of the benefits falls under the alternative rollout scenarios, to $4.1 billion in the lower bound for both the retailer-led rollout and the centralised communications scenario
The majority of the benefits result from avoided meter costs associated with not having to replace the existing meter stock and business efficiency benefits for distributors (totalling approximately 39 to 44 per cent14 and 41 to 55 per cent of total benefits, respectively). In contrast, demand response benefits represent between 6 and 12 per cent of total estimated benefits (excluding the potential demand response benefits associated with including an interface to the HAN).
CRA estimate that the potential benefit arising from avoiding the need to replace the existing meter stock ranges from $1.7 billion to $2.6 billion. This estimate is based on a number of factors, including assumptions regarding the amount of installation time, and thereby costs incurred to replace existing meters in each jurisdiction and the existing mix of meters in each jurisdiction.15
CRA also identify a number of distributor business efficiency benefits resulting from smart metering, which total between $2.1 billion and $2.9 billion in NPV terms over the twenty year period of the analysis. These benefits include:
the avoided cost of routine manual meter reading;
the avoided cost of special meter reads (ie, when customers move into or out of a premise);
14 This percentage reflects the counterfactual of accumulation meters in each jurisdiction, and is higher under the
alternative counterfactual of a continuation of each jurisdiction’s current metering policies. 15 CRA Workstream 2 Network Impact Consultation Report (February 2008), section 6.

Consultation Report - Cost Benefit Analysis of Smart Metering and DLC
Executive Summary
NERA Economic Consulting xv
the avoided costs of manual disconnections and reconnections;
reductions in calls to faults and emergency lines; and
avoided costs of customer complaints about voltage quality of supply.
KPMG identify a number of retailer benefits resulting from smart metering, which total between $98 million and $196 million in NPV terms over the twenty year period of the analysis (or between 4 to 6 per cent of the total estimate of business efficiencies). These benefits include:
a reduction in call centre costs as a result of fewer high bill enquiries;
a reduction in bad-debt and working capital requirements;
a reduction in hedging costs, due to interval data leading to improved forecasting; and
other cost reductions, including costs for data validation and settlement and management time.
KPMG estimate that call centre costs rise initially as customers query new tariff products that are introduced following a smart metering rollout, however these costs subsequently are expected to decrease.
The final benefit category results from changes in the time of use and level of electricity demand by consumers which leads to:
the deferral of peak network augmentation;
reductions in retailers’ hedging costs as a result of reductions in peak wholesale prices;
the deferral of peak generating capacity;16 and
reductions in the level of unserved energy, generation operating costs and carbon emissions resulting from changes in the pattern of electricity market dispatch.
The demand response benefits are calculated based on assumptions in relation to the TOU tariffs and CPP products that may be offered following a smart meter rollout and the likely take-up rate of those tariffs (developed by KPMG as part of the retail workstream17) and estimates of the demand response resulting from the introduction of these tariffs, which have been developed by NERA.18 CRA have taken these estimates of demand response and estimated both the potential value of the network deferral benefits that may occur and the impact on the electricity market (including the reduction in greenhouse gas emissions). 16 We note that CRA has concluded that the relatively small size of the overall system demand reductions that have been
estimated to follow a rollout of smart meters or a DLC alternative would not be sufficient to defer generation investment in practice. However, CRA have estimated benefits in relation to a reduction in unserved energy, resulting from the demand reduction. CRA Workstream 5 Market Impact Consultation Report (February 2008), section 4.2.
17 KPMG, Workstream 3 Retail Impacts Consultation Report (February 2008), Appendix A. 18 NERA, Workstream 4 Consumer Impacts Consultation Report (February 2008), section 5.

Consultation Report - Cost Benefit Analysis of Smart Metering and DLC
Executive Summary
NERA Economic Consulting xvi
Nationally the demand response benefits range between $250 million and $738 million in NPV terms over the twenty year period of the analysis (excluding the demand response benefits that may arise from including an interface to a HAN). This represents between 6 and 12 per cent of total benefits resulting from the introduction of smart metering. Including an interface to a HAN may increase the total demand response benefits by between a further $169 million to $925 million.19
Part of the demand response benefits resulting from the introduction of smart metering is the potential for reductions in carbon emissions due to changes in the pattern and level of customer demand leading to changes in the pattern of generation dispatch. The impact of a smart meter rollout on greenhouse gases depends critically on:
the extent to which the introduction of TOU and CPP tariffs shifts demand from peak to off-peak periods versus reducing overall consumption;
whether smart meters also result in an energy conservation impact; and
whether smart meters also enable DLC.
Overall CRA has estimated that greenhouse gas emissions will fall as a result of a smart meter rollout.20 Over the twenty year period of the cost benefit analysis the total reduction in greenhouse cases is estimated to be between 597,000 tonnes and 12.3 million tonnes. This excludes any additional demand impacts associated with the HAN. The extent of the reduction in emissions is greater where smart meters also enable DLC and where it is assumed that the provision of IHDs engenders an additional energy conservation impact.
The net benefits of smart metering are not unequivocally positive for all jurisdictions
The national aggregated results mask differences in the underlying net benefits by jurisdiction, as both the costs and benefits vary according to the circumstances present in each jurisdiction. Figures E.4 and E.5 below summarise the results for scenario 1 for each jurisdiction, and indicate the upper and lower ranges for the net benefit (in NPV terms) estimated in each case. The results are shown for both the counterfactual of a continuation of each jurisdiction’s current metering policy and the counterfactual of accumulation metering. The accumulation metering counterfactual provides a useful baseline for the assessment and puts all jurisdictions on an equal footing. However, in considering decisions for specific jurisdictions, their current meter replacement policies and activities may be the more appropriate baseline.
The adoption of the counterfactual of current metering policy increases the net benefit in Queensland, NSW and Tasmania (compared to the counterfactual of accumulation metering), but does not alter the overall outcomes of the cost benefit analysis for these jurisdictions. For
19 The bottom end of this range reflects the use of the HAN to provide DLC capability only whilst the upper end of the
range reflects the provision of an IHD leading to an additional 7% energy conservation response. As discussed in section 16.2.3 of this report, there is considerable uncertainty in relation to the potential energy conservation response. It should also be noted that the additional benefits reported above have associated additional costs. The scope for additional net benefits from inclusion of the HAN have been discussed earlier.
20 CRA Workstream 5 Market Impact Consultation Report (February 2008), section 4.3.2.

Consultation Report - Cost Benefit Analysis of Smart Metering and DLC
Executive Summary
NERA Economic Consulting xvii
Victoria, the adoption of the current policy counterfactual of new and replacement metering being interval meters results in the net benefit calculated for Victoria of a distributor-led smart meter rollout being positive in both the lower and upper bound.21
Detailed results for each jurisdiction are provided in chapters 7 to 14.
Figure E.4 Summary of Results by Jurisdiction – Net Benefit (NPV, $m), Scenario 1
(Excluding HAN, Current Metering Policy Counterfactual)
-200
0
200
400
600
800
1,000
1,200
1,400
1,600
1,800
QLD NSW ACT VIC SA TAS WA NT
NPV
$m
21 If the accumulation metering counterfactual is adopted, the net benefit calculated for Victoria falls, such that it becomes
negative in the lower bound.

Consultation Report - Cost Benefit Analysis of Smart Metering and DLC
Executive Summary
NERA Economic Consulting xviii
Figure E.5 Summary of Results by Jurisdiction – Net Benefit (NPV, $m), Scenario 1
(Excluding HAN, Accumulation Counterfactual)
-500
0
500
1,000
1,500
2,000
QLD NSW ACT VIC SA TAS WA NT
NPV
$m
A range of sensitivities have been performed on the jurisdictional results, the outcomes of which are reported in the body of the report.
The results indicate that a distributor-led rollout of smart metering in Queensland, New South Wales and Western Australia would deliver positive net benefits on the basis of the estimated avoided meter costs and business efficiencies alone. The positive net benefits in these jurisdictions are not contingent on also obtaining demand response benefits. The inclusion of an interface with a home area network in these jurisdictions would likely further increase the net benefits (through further enhancing the demand response), particularly if direct load control was targeted to maximise both participation and the resultant network deferral benefits.
In Victoria smart metering delivers positive net benefits in both the upper and lower bound, when considered against the current metering policy counterfactual. In this case, the rollout would be justified solely on the basis of avoided meter costs and business efficiency benefits alone. If the accumulation counterfactual is assumed then in order to achieve a positive net benefit, the cost of the rollout needs to be towards the lower bound of the estimated range, and business efficiency benefits towards the upper end of the range. Demand response benefits should be more aggressively pursued (through the introduction of TOU tariffs and/or CPP, or direct load control programs) in order to make up any shortfall between benefits and costs on business efficiency and avoided meter costs. The inclusion of an interface with a home area network would likely further increase the net benefits (by enhancing the demand response), particularly if direct load control was targeted to maximise both participation and the resultant network deferral benefits. However, on the basis of our analysis, the

Consultation Report - Cost Benefit Analysis of Smart Metering and DLC
Executive Summary
NERA Economic Consulting xix
incremental impact of inclusion of the HAN would not of itself be sufficient to ensure that there was a positive net benefit in rolling out smart meters under the accumulation counterfactual22 without also achieving costs towards the lower end of the range or business efficiency benefits towards the upper end of the range.
The results of the cost benefit analysis for South Australia show that for a rollout of smart metering to have a net positive benefit, it is necessary to have costs at the low end of the range estimated. Per customer business efficiency benefits are lower in South Australia than the national average, mainly due to much lower avoided costs for special reads (15% of the national average, driven by lower property churn, and much lower reading costs), lower avoided costs for routine meter reading and less reduction assumed in the cost of calls to faults and emergencies lines. Demand response benefits may assist in meeting any shortfall between costs and benefits in South Australia but would not result in a rollout becoming net positive if costs were at the high end of the range estimated, even taking into account the additional demand response that may be achievable with the inclusion of an interface to the HAN.
A decision whether or not to rollout smart meters in South Australia therefore appears to be dependent both on a view as to the reasonableness of the estimates presented in relation to the distribution efficiency benefits and the meter and installation costs, and also on the likelihood of the estimated demand response benefits. The consecutive peak days experienced in South Australia may increase the uncertainty associated with achieving a sustained demand response, particularly via TOU and CPP tariffs.
For the Australian Capital Territory, Tasmania and the Northern Territory our results indicate that the justification for a smart meter rollout is dependent on whether the bottom end of the range of cost estimates can be achieved together with the upper end of the avoided meter costs and business efficiency benefits. Additionally, in these jurisdictions we do not believe that there are likely to be significant demand response benefits. Therefore it is unlikely that there will be the same scope for potential ‘upside’ through demand response as there is in Victoria and South Australia.
The above results suggest that a national mandatory smart metering rollout may not be justified in all jurisdictions. We have therefore considered the implications for smart meters being rolled out in some, but not all, jurisdictions. This is particularly relevant for jurisdictions operating in the National Electricity Market (eg, Tasmania and the Australian Capital Territory). The main implications are:
the requirement to settle the wholesale market on the basis of net system load profiles, rather than actual usage information would remain; and
retailers operating across jurisdictions may require different business processes for managing customer switching and services provided through smart metering, such as special reads. This is likely to increase the costs associated with managing a smart metering rollout.
22 This is true even where a 7% conservation impact from the provision of IHDs is included, which we consider to be an
aggressive assumption.
Consultation Report - Cost Benefit Analysis of Smart Metering and DLC
Executive Summary
NERA Economic Consulting xx
EMCa indicates that there are unlikely to be particular economies of scale associated with a mass rollout of smart meters across each jurisdiction. For this reason there is unlikely to be rollout cost differences between a national rollout compared with individual jurisdictional rollouts.
We have also considered the difference in the expected net benefit of a smart meter rollout between urban, rural and remote areas. Both costs per national meter identification (NMI) and business efficiency benefits per NMI are greater for customers in rural and remote areas than for urban customers. In relative terms, the higher benefit per NMI in rural and remote areas exceeds the increase in costs per NMI for these customers on the basis of the estimates provided by EMCa and CRA. As a result, the net benefit per NMI of a smart meter rollout is greater for customers in rural and remote areas than it is for customers in urban areas. This implies that the benefits of a smart meter rollout will be greatest where customers in rural and remote areas are also included, rather than limiting a rollout to urban areas only. We note that the analysis has assumed power line carrier (PLC) communications technology for rural and remote areas. EMCa notes in its report that it considers that there are adequate answers to the concerns raised in relation to PLC such that it can be considered a viable technology for rural Australia, for the purposes of this analysis.23 We have, however, also conducted sensitivity analysis based on alternatives to PLC. This analysis indicates that the relative outcomes of the cost benefit analysis in each jurisdiction would not be changed if PLC was found not to be viable.
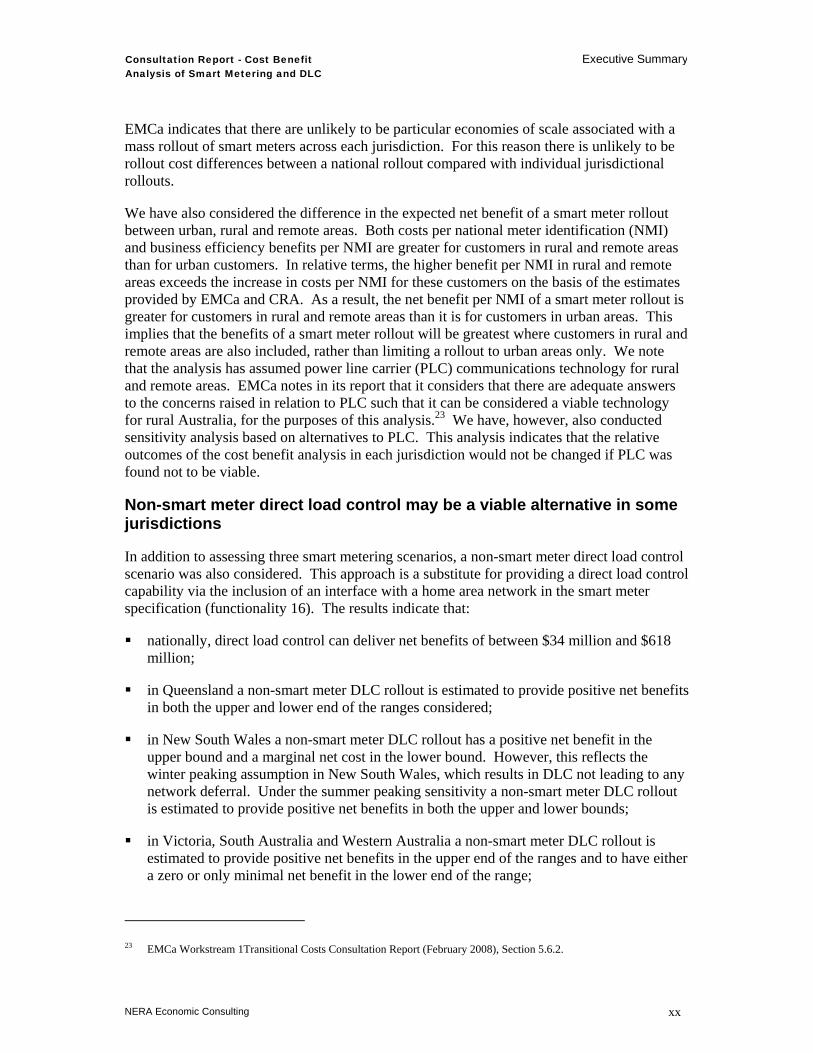
Non-smart meter direct load control may be a viable alternative in some jurisdictions
In addition to assessing three smart metering scenarios, a non-smart meter direct load control scenario was also considered. This approach is a substitute for providing a direct load control capability via the inclusion of an interface with a home area network in the smart meter specification (functionality 16). The results indicate that:
nationally, direct load control can deliver net benefits of between $34 million and $618 million;
in Queensland a non-smart meter DLC rollout is estimated to provide positive net benefits in both the upper and lower end of the ranges considered;
in New South Wales a non-smart meter DLC rollout has a positive net benefit in the upper bound and a marginal net cost in the lower bound. However, this reflects the winter peaking assumption in New South Wales, which results in DLC not leading to any network deferral. Under the summer peaking sensitivity a non-smart meter DLC rollout is estimated to provide positive net benefits in both the upper and lower bounds;
in Victoria, South Australia and Western Australia a non-smart meter DLC rollout is estimated to provide positive net benefits in the upper end of the ranges and to have either a zero or only minimal net benefit in the lower end of the range;
23 EMCa Workstream 1Transitional Costs Consultation Report (February 2008), Section 5.6.2.

Consultation Report - Cost Benefit Analysis of Smart Metering and DLC
Executive Summary
NERA Economic Consulting xxi
to the extent that a DLC rollout may be more effective in reducing peak demand (as a result of the avoidance of customer response fatigue on consecutive peak days), Scenario 3 may provide a more appropriate and cost effective strategy in South Australia as it provides a DLC capability without incurring the higher costs of a smart meter rollout; and
for the Northern Territory, the Australian Capital Territory and Tasmania a DLC rollout is not expected to result in a positive net benefit as result of the particular characteristics of load in those jurisdictions and the limited scope for network deferral.
Ultimately it is relevant to consider whether providing direct load control via smart metering infrastructure is more or less cost effective compared to via a direct communications device as examined as part of Scenario 3. Based on cost information provided by EMCa, NERA estimates that the incremental cost of providing direct load control capabilities via the smart metering rollout (ie, functionality 16AB or 16C) is lower than a stand-alone DLC rollout as in Scenario 3. In addition there is a potential for a larger demand response where DLC is implemented via smart meters to the extent that additional conservation may be achievable via provision of an IHD.24
This suggests that for those jurisdictions where smart metering is otherwise justified direct load control capabilities should be implemented via the smart metering infrastructure. However, for those jurisdictions where smart metering is not justified on the basis of business efficiency or avoided meter cost benefits there may be benefits from implementing a non-smart meter direct load control program.
Uncertainties in relation to the analysis
The results presented in this report provide the best estimate of costs and benefits given information available over the course of this study. There is necessarily a degree of uncertainty in the estimation of both costs and benefits. Some of these uncertainties are captured within the ranges reported. The approach taken in this report is conservative, given that in the majority of cases we compare the high end of the cost estimates with the low end of the benefits. We also note that there are potential additional benefits in relation to distributor business efficiencies and customer service that have not been quantified and are therefore not reflected in the net benefit results presented in this report.
Based on information provided to EMCa by a number of the Victorian distributors, we are aware that the cost of smart metering infrastructure estimated by the Victorian distributors for the purpose of assessing the costs to pass through to customers by the Essential Services Commission (ESC) is above the upper bound of the costs estimated by EMCa. EMCa notes in its report that it has taken account of information provided by Victorian distributors to the extent possible given its limitations in scope and comparability.25 Nevertheless EMCa comments that it appears that the aggregate costs as assessed by the Victorian distributors are ‘somewhat higher’ than EMCa’s assessment.26
24 NERA, Consumer Impact Consultation Report (February 2008), Section 7.1. 25 EMCa Workstream 1Transitional Costs Consultation Report (February 2008), section 14.6 26 EMCa Workstream 1Transitional Costs Consultation Report (February 2008), section 14.6.1

Consultation Report - Cost Benefit Analysis of Smart Metering and DLC
Executive Summary
NERA Economic Consulting xxii
EMCa comments that there is a difference between the balance of probability on which it has formed judgements for the purposes of the cost benefit analysis and the level of certainty that is reasonably sought by a commercial entity seeking regulatory cost recovery for a large investment. At this stage there are uncertainties, particularly in regard to communications technologies suitable for rural areas and these will be best resolved through implementation of some kind (whether by further trialling or through a prototype scale rollout). EMCa also notes the difference in scope of the estimates.27 For example there is a difference between the cost of an IT business plan, which involves consideration of a range of benefits and other factors, and the incremental cost that is attributable to smart metering alone. EMCa has based its cost estimates for this analysis on the reasonable investment required to accommodate smart metering, using existing systems where this is considered to be generally feasible. As is appropriate for the national cost benefit analysis, this does not take account of any of the other factors which might drive different decisions for a particular business. EMCa is comfortable with the assumptions that it has taken for the purposes of this cost benefit analysis.28
Given the above uncertainties, the results in this report are indicative of the likely benefits and costs of a smart metering rollout for each jurisdiction, and highlight where further, and more detailed business case assessments of the costs and benefits could be undertaken. These detailed business cases would naturally be part of any implementation process, in estimating costs and benefits specific to particular businesses, and would be supported by further trials as proposed by MCE in its December 1997 decision. This will allow the risks associated with the costs and benefits being different from those assumed as part of this study to be appropriately managed. Results from these assessments may influence the nature of a roll-out in individual jurisdictions.
Consumers on average will be better off, but smart metering capabilities raise new consumer protection concerns
The implications for households of smart metering or direct load control programs will vary according to the specific household’s characteristics. The implications of smart metering for vulnerable consumers may therefore be of particular concern. The introduction of smart metering will potentially affect consumers by:
providing an opportunity to benefit from lower bills because of opportunities provided by new tariff product offerings;
initial increases in tariffs as the costs of the initial smart metering rollout are passed through to consumers; and
improvements in the service provided to customers.
Over time business cost savings resulting from the introduction of smart metering would be expected to be passed through to customers in the form of lower tariffs, either through the regulatory price setting framework (for distribution businesses and for retail businesses in those jurisdictions where there is no retail competition) or through competition. The 27 EMCa Workstream 1Transitional Costs Consultation Report (February 2008), section 14.6.5 28 EMCa Workstream 1Transitional Costs Consultation Report (February 2008), section 14.6.2
Consultation Report - Cost Benefit Analysis of Smart Metering and DLC
Executive Summary
NERA Economic Consulting xxiii
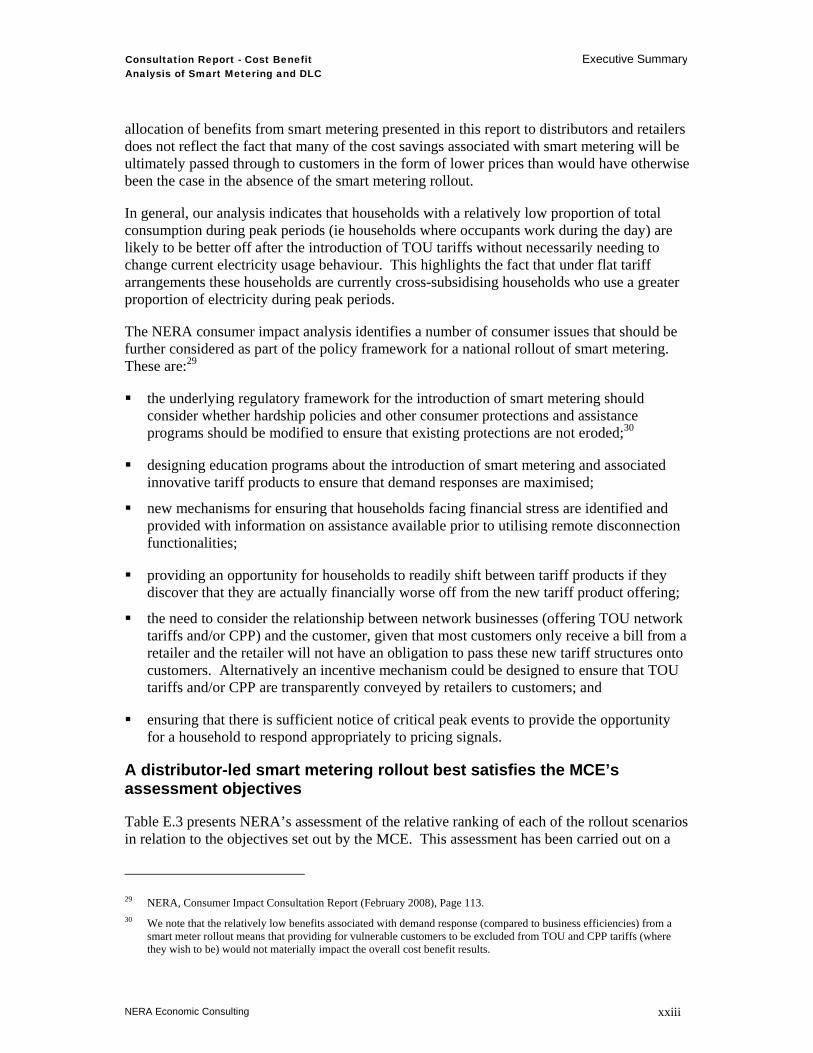
allocation of benefits from smart metering presented in this report to distributors and retailers does not reflect the fact that many of the cost savings associated with smart metering will be ultimately passed through to customers in the form of lower prices than would have otherwise been the case in the absence of the smart metering rollout.
In general, our analysis indicates that households with a relatively low proportion of total consumption during peak periods (ie households where occupants work during the day) are likely to be better off after the introduction of TOU tariffs without necessarily needing to change current electricity usage behaviour. This highlights the fact that under flat tariff arrangements these households are currently cross-subsidising households who use a greater proportion of electricity during peak periods.
The NERA consumer impact analysis identifies a number of consumer issues that should be further considered as part of the policy framework for a national rollout of smart metering. These are:29
the underlying regulatory framework for the introduction of smart metering should consider whether hardship policies and other consumer protections and assistance programs should be modified to ensure that existing protections are not eroded;30
designing education programs about the introduction of smart metering and associated innovative tariff products to ensure that demand responses are maximised;
new mechanisms for ensuring that households facing financial stress are identified and provided with information on assistance available prior to utilising remote disconnection functionalities;
providing an opportunity for households to readily shift between tariff products if they discover that they are actually financially worse off from the new tariff product offering;
the need to consider the relationship between network businesses (offering TOU network tariffs and/or CPP) and the customer, given that most customers only receive a bill from a retailer and the retailer will not have an obligation to pass these new tariff structures onto customers. Alternatively an incentive mechanism could be designed to ensure that TOU tariffs and/or CPP are transparently conveyed by retailers to customers; and
ensuring that there is sufficient notice of critical peak events to provide the opportunity for a household to respond appropriately to pricing signals.
A distributor-led smart metering rollout best satisfies the MCE’s assessment objectives
Table E.3 presents NERA’s assessment of the relative ranking of each of the rollout scenarios in relation to the objectives set out by the MCE. This assessment has been carried out on a
29 NERA, Consumer Impact Consultation Report (February 2008), Page 113. 30 We note that the relatively low benefits associated with demand response (compared to business efficiencies) from a
smart meter rollout means that providing for vulnerable customers to be excluded from TOU and CPP tariffs (where they wish to be) would not materially impact the overall cost benefit results.

Consultation Report - Cost Benefit Analysis of Smart Metering and DLC
Executive Summary
NERA Economic Consulting xxiv
national basis. The rankings for some objectives may differ for particular jurisdictions and we note these in the discussion in the report.
For each objective we have ranked how well each of the scenarios meets that objective compared to the alternative scenarios. A ‘1’ indicates that that scenario meets the objective better than all other scenarios. A ‘2’ indicates that the scenario is ranked second, and so on. Where a scenario does not have an impact on meeting a particular objective this is indicated in the table by a dash (‘-‘).
For many of the objectives each of the smart meter rollout scenarios (ie, Scenarios 1, 2 and 4) are ranked equally. This is consistent with the findings of the analysis that the benefits are not expected to be materially different between the scenarios.
The table also indicates how well overall each of the objectives is achieved by each of the rollout scenarios. The dark shaded cells in the table indicate where the particular rollout scenario is expected to have a significant impact in relation to the corresponding objective. The lighter shaded cells indicate where the particular rollout scenario is expected to have only a moderate impact in relation to the corresponding objective. Finally, where cells are not shaded a scenario has either no impact or a negligible impact on meeting a particular objective.

Consultation Report - Cost Benefit Analysis of Smart Metering and DLC
Executive Summary
NERA Economic Consulting xxv
Table E.3 Assessment of Rollout Scenarios Against MCE Required Objectives:
Relative Ranking of Scenarios
MCE Objectives
Scenario 1 Distributor-led
smart meter rollout
Scenario 2 Retailer-led smart meter
rollout
Scenario 3 Non smart meter DLC
rollout
Scenario 4 Retailer-led smart meter rollout with
centralised communications
Reducing peak demand1 2 2 1 2
Efficiency and innovation in electricity business operations 1 2 - 2
Promoting the long-term interests of electricity consumers 1 2 3 2
Promoting retail competition 1 1 - 1
Enabling consumers to better manage energy use and greenhouse gas emissions
1 1 - 1
Managing distributional price impacts for vulnerable customers 2 2 1 2
Promoting energy efficiency and greenhouse benefits 1 1 2 1
Providing a platform for other demand side response measures and avoiding discrimination against technologies
1 1 2 1
1 Note that the smart meter scenarios would be ranked ahead of the non-smart meter DLC rollout if an interface with a HAN is included in the smart meter specification.

Consultation Report - Cost Benefit Analysis of Smart Metering and DLC
Introduction
NERA Economic Consulting
1
1. Introduction
This report has been prepared by NERA Economic Consulting (NERA) for the Ministerial Council on Energy’s (MCE) Smart Meter Working Group (SMWG) and constitutes the final output of the cost benefit analysis of a mandatory smart meter rollout, together with the accompanying workstream reports prepared by the other consultant teams appointed by the SMWG.
1.1. Background to the Project
‘Smart meters’ are electricity meters that are capable both of measuring and recording energy consumption in short intervals, and of two-way communication, enabling energy providers to read and control features of the meter remotely.31
Smart meters can potentially provide a number of benefits. These include: facilitating new tariff products that can change the pattern and level of electricity demand; providing capabilities that enable cost efficiencies to be achieved by distribution and retail businesses; and by providing service performance enhancements. However, these benefits need to be weighed against the costs of a large scale rollout. The costs include, amongst others, the cost of purchasing and installing the meters themselves as well as the cost of upgrading billing and management systems to process and store more detailed usage data. Finally, the costs and benefits of a smart meter rollout must also be weighed against the costs and benefits associated with other demand management alternatives.
At its meeting in April 2007 the Council of Australian Governments (COAG) endorsed a staged approach for the national mandated rollout of electricity smart meters to areas where benefits for consumers outweigh costs as indicated by the results of a cost benefit analysis to be completed by the end of 2007. COAG noted that the economic benefits are maximised, and the costs of installation are minimised, if a smart meter rollout is large in scale and based on a consistent national framework and functionality.
In July 2007 the SMWG appointed a team of consultants to undertake the cost benefit analysis required by COAG. The cost benefit analysis is intended to provide the basis for future MCE decisions with regard to smart meters.
Phase 1 of the analysis was released at the beginning of October 2007. The Phase 1 Overview Report addressed the question of what functionalities should be included in a minimum national functionality for a rollout of smart meters. The analysis carried out in Phase 1 focused on the incremental costs and benefits of smart metering system functionalities identified by the SMWG over and above the costs and benefits of an assumed set of ‘core’ smart meter functionalities. The Phase 1 analysis was conducted at a national level and resulted in a recommended list of functionalities for inclusion in a minimum national functionality for a rollout of smart meters.
31 Meters that are capable of measuring and recording energy in short intervals but do not have two-way communication
abilities (‘interval meters’) are distinguished from ‘smart meters’ which do have two-way communication abilities.

Consultation Report - Cost Benefit Analysis of Smart Metering and DLC
Introduction
NERA Economic Consulting
2
For a small number of functionalities, we were unable to reach a firm recommendation as part of Phase 1. These functionalities have been considered further during Phase 2 in light of submissions received following the Phase 1 report and further analysis undertaken by the consultant teams.
At its meeting on 13 December 2007 the MCE agreed to support an initial minimum functionality for smart meters in the National Electricity Rules (NER), in line with the recommendations made as part of Phase 1 of our study and following the consideration of submissions on Phase 1.32 Our final recommendations in relation to the national minimum functionality as presented in this Phase 2 report are consistent with the MCE’s decision. We note that the MCE has indicated that it is considering further specific requirements for the home area network to support in-home displays and appliance control. Our conclusions in relation to functionality 15 and 1633 will assist the MCE in deciding whether additional functionalities should be included in the national minimum functionality.
The primary focus of the Phase 2 analysis has been on whether the costs of rolling out smart meters (or of undertaking an alternative demand management scenario) exceed the benefits, given the particular circumstances of different jurisdictions. In addition, we have examined differences in the costs and benefits for urban, rural and remote areas within each jurisdiction.34 This assessment is intended to assist the MCE in determining any specific areas where replacement and rollout may be exempted or delayed on the basis of local factors that are demonstrated to reduce net benefits for consumers.
The Phase 2 analysis compiles the best information available to each of the consulting teams on the likely costs and benefits resulting from a national smart metering rollout and a non-smart meter direct load control rollout. However, as experience develops in the implementation of smart metering and direct load control in Australia, particularly in the current Victorian rollout, these costs and benefits will necessarily become clearer.
1.2. The Project Team
The Terms of Reference for this analysis identified six interlinked workstreams required for the cost benefit analysis. Separate consultants have been engaged by the SMWG to undertake each workstream in parallel.
This Overview Report summarises the analysis undertaken by each workstream and brings the outputs together in order to identify the net benefits of rolling out smart meters (or of undertaking an alternative demand management scenario) for each jurisdiction. The cost benefit analysis has considered four alternative rollout scenarios, as defined by the SMWG. In addition to presenting the results of the cost benefit analysis this report also assesses each of these four scenarios against the objectives set out by the MCE.
32 MCE 14th Meeting Communiqué, 13 December 2007 33 Functionality 15 is the provision of an interface with other load control devices, and functionality 16 is the provision of
an interface to a home area network using an open standard. 34 Off-grid and small-grid customers are not included in the cost benefit assessment presented in this report.

Consultation Report - Cost Benefit Analysis of Smart Metering and DLC
Introduction
NERA Economic Consulting
3
This Overview Report is accompanied by separate reports (prepared by each of the individual consultants) for each workstream.
The consultants involved in this review and their respective workstreams are:
NERA Economic Consulting (NERA): Workstream 1 - Coordination (including responsibility for this Overview Report and resulting recommendations); Workstream 4 - Consumer Impacts;
CRA International (CRA): Workstream 2 - Network Impacts; Workstream 5 - Economic Impacts (market and greenhouse modelling);
KPMG: Workstream 3 - Retailer impacts; and
Energy Market Consulting associates (EMCa): Workstream 6 - Transitional implementation costs and their allocation.
Figure 1.1 illustrates the interaction of each of the workstreams.
Figure 1.1 Interaction Between Workstreams
# Reductions in hedging costs arise both as a result of more detailed metering data leading to improved forecasting and from reductions in peak wholesale energy demand.
In drawing together the costs and benefits identified in each of the individual workstreams NERA has endeavoured to ensure that the assumptions adopted are consistent. We have also discussed the key drivers of the costs and benefits with each of the responsible consultants in order to understand what is driving the overall cost benefit results for each jurisdiction. However, we stress that the responsibility for the quantification of costs and benefits remains with the relevant workstream consultants. Interested parties are referred to the relevant
Costs
Benefits
Demand related benefits
Workstream 4 (NERA)Impact on demand
Workstream5 (CRA)
Impact on the NEM (includinggreenhouse gasemissions)
Workstream4 (NERA)Consumersurplus
Workstream2 (CRA)Networkdeferralbenefits
Workstream3 (KPMG)Retailerbenefits:• Lower
hedgingcosts #
Workstream 3(KPMG)Retailer benefits:• Retailer business
efficiencies• Lower hedging
costs #• Reduction in
bad debt• Reduction in
working capital
Overview ModelWorkstream 1 (NERA)
Workstream 6 (EMCa)• Meter/Device costs• Communications systems costs• Backend IT costs• Systems-related operating costs• System refresh costs
Avoidedmetercosts
Distributorbusinessefficiencies
Reductionin unservedenergy
Workstream 3 (KPMG)Retailer non-systemsrelated operating costs
Workstream 2 (CRA)

Consultation Report - Cost Benefit Analysis of Smart Metering and DLC
Introduction
NERA Economic Consulting
4
workstream reports for the justification of the costs and benefits that represent the inputs into the analysis contained in this Overview Report.
1.3. Stakeholder Involvement
1.3.1. Consultation on the Phase 1 analysis
The results outlined in the Phase 1 reports have benefited from the direct input of stakeholders. Stakeholders were involved in a number of ways during Phase 1 of the analysis.35
The Phase 1 Overview Report and the accompanying consultant reports for each workstream were released for public consultation at the beginning of October 2007. During the consultation phase of the Phase 1 report we were seeking input from stakeholders on those assumptions that are likely to drive the conclusions drawn from our analysis.
A list of submissions received in response to the Phase 1 reports are set out in Appendix A. Stakeholder responses have been incorporated into the analysis in this report and the accompanying consultant workstream reports. A discussion of the responses received as relevant to particular issues is included within each report.
1.3.2. Phase 2
This Phase 2 Report has also benefited greatly from the involvement of stakeholders who have been consulted and involved in developing the analysis.
As part of Phase 2 the consultant teams held a series of workshops in each of the States and Territories.36 These workshops involved representatives from relevant state government departments, regulators, distribution and retail businesses and consumer groups.
In addition, a series of structured working meetings were held with retailers and with representatives of the distribution businesses. The aim of the working meetings was to involve industry participants in the formulation of the assumptions and approach, particularly where data limitations and uncertainties required assumptions on inputs to the cost benefit analysis.
Consultants from across the different workstreams were involved in each of these meetings in order to ensure that the different strands of analysis were fully integrated, based on a common set of assumptions, and a common understanding of the circumstances of the relevant businesses and jurisdictions.
In addition to the jurisdictional workshops and individual meetings, stakeholders have been involved in the Phase 2 analysis through the following:
35 See pages.2-4 of NERA, Phase 1 Overview Report (October 2007). 36 Representatives from the Northern Territory were involved in jurisdictional workshops in Victoria and have also been
consulted by telephone. In all of the other States and Territories personal meetings have been held with stakeholders in their respective jurisdiction.

Consultation Report - Cost Benefit Analysis of Smart Metering and DLC
Introduction
NERA Economic Consulting
5
a request for information (RFI) package37 distributed by the transitional cost workstream to:
– a selection of retailers and distributors to gather information on the transitional cost impacts for distributor and retailer business and IT systems and communications management;
– the National Electricity Market Management Company (NEMMCO) and the Western Australia Independent Market Operator (IMO) to gather information on the costs for meter data transaction management; and
– communication service providers and smart metering infrastructure providers to gather information on the costs of communications, meters and in-house systems;
from the network impact workstream a RFI package was sent to all distributors;
a series of interviews with retailer impact and consumer impact workstreams;
sixteen customer focus groups for the consumer impact workstream involving consumers in both urban and rural areas in Victoria, New South Wales, Queensland and Tasmania and in urban areas only for South Australia and Western Australia;
a workshop on customer bill impacts for the consumer impact workstream held in Sydney on 16 November 2007 involving representatives from fourteen consumer advocacy groups drawn from all jurisdictions (with the exception of the Northern Territory);
presentations and discussions with the Smart Meter Stakeholder Working Group (SMSWG) during a workshop held in Sydney on 5 December 2007 to discuss the preliminary findings of the cost benefit analysis; and
subsequent meetings with Victorian distribution network businesses in December 2007 where more detailed information on the costs of the Victorian smart metering rollout was provided.
A complete list of stakeholders consulted as part of Phase 2 is provided in Appendix B.
1.4. Invitation for Submissions
The SMWG is inviting written submissions on the issues and results raised in this Overview Report and each individual workstream report.
Submissions are due on the date specified in the MCE Bulletin that accompanies the release of this report.
Submissions should be in PDF format and emailed to [email protected].
37 For a more detailed description of the information request process see section 2.7 in EMCa Workstream 1Transitional
Costs Consultation Report (February 2008).

Consultation Report - Cost Benefit Analysis of Smart Metering and DLC
Introduction
NERA Economic Consulting
6
1.5. Structure of the Report
The remainder of this Overview Report is structured as follows:
Section 2 presents a high level summary of the motivations for a mandatory rollout of smart metering or a direct load control (DLC) alternative to provide the context for our analysis;
Section 3 discusses the methodology and approach used for the cost benefit analysis including the assumptions made in the base case in relation to the introduction of a carbon trading scheme, the counterfactual assumed for meter replacement policy in the absence of a smart meter rollout, and the identification and treatment of transfer payments;
Section 4 describes the key assumptions underpinning the cost benefit analysis;
Section 5 presents a general assessment of transitional costs including the approach taken to establish cost estimates, the key drivers of those cost estimates and the implications of the alternative scenarios for the costs estimated;
Section 6 presents a general assessment of benefits including the key drivers of benefits and the implications of the alternative scenarios for the benefits estimated;
Sections 7 through 14 presents the results of the cost benefit analysis for each jurisdiction. In each case the costs and benefits are first summarised and then followed by a discussion of the particular characteristics of the jurisdiction that are driving the results;
Section 15 presents the aggregate cost benefit results across all of Australia as well as a breakdown of these aggregate results by stakeholder and by urban, rural and remote regions;
Section 16 revisits the Phase 1 question of the appropriate national minimum functionality for a smart meter rollout and sets out NERA’s final recommendation;
Section 17 assesses each of the four SMWG rollout scenarios against the MCE defined objectives; and
Section 18 sets out NERA’s conclusions.
In addition, the appendices provide additional, detailed information:
Appendix A: List of submissions received on the Phase 1 reports;
Appendix B: List of stakeholders consulted as part of Phase 2;
Appendix C: A summary of the cost benefit analysis results for each jurisdiction on a per NMI basis;
Appendix D: A summary of the cost benefit analysis results for each jurisdiction by stakeholder.
Appendix E: NMI numbers per jurisdiction.

Consultation Report - Cost Benefit Analysis of Smart Metering and DLC
Assessment of Smart Metering and Direct Load Control
NERA Economic Consulting
7
2. Assessment of Smart Metering and Direct Load Control
This section provides a short summary of the potential drivers for a smart meter rollout or for an alternative non-smart meter DLC rollout before presenting a high level overview of the aggregate results of the cost benefit analysis for Australia as a whole.
The detailed results for each jurisdiction are contained in sections 7 through 14 of this report.
2.1. What are the potential motivations for a mandatory smart metering rollout or a DLC rollout?
There are three main potential motivations for a smart metering rollout:
1. First, to provide a capability to manage network demand where jurisdictions face significant maximum demand growth, in order to delay the need for expensive investment in network capacity and peak generation;
2. Second, to achieve business efficiencies from the avoidance of costs, or better delivery of existing services (including the development of innovative new products and increased retail competition); and
3. Third, to reduce greenhouse gas emissions.
These three motivations are all reflected in the list of objectives that the MCE has required a smart meter rollout to be assessed against.38
For a non-smart meter rollout of direct load control (DLC) infrastructure, only the first and third of these drivers apply. There are no business efficiency benefits associated with a DLC rollout.
In relation to the third driver we note that the impact of a smart metering rollout on greenhouse gas emissions will depend critically on how demand changes as a result of changes in customer behaviour and particularly on the extent to which demand is reduced rather than simply shifted from peak to off-peak times.39 This in turn will be affected by whether smart meters also incorporated DLC functionality.40 If DLC can operate without affecting customers’ thermal comfort levels a DLC rollout (distinct from a smart meter rollout) would unambiguously result in a reduction in greenhouse gas emissions, as it would result in an overall reduction in demand rather than a shifting in demand.41
38 An assessment of the alternative rollout scenarios against the MCE objectives is contained in section 17 of this report. 39 This is because the marginal generator operating during peak and off-peak times is likely to create different amounts of
carbon emissions per megawatt of electricity produced. 40 A discussion of functionalities 15 and 16, which would both support DLC, is contained in section 16.2 of this report. 41 If this assumption does not hold, then a DLC program might lead to increased electricity consumption in time periods
where load is not controlled, as air-conditioner users seek to achieve a desirable comfort level. The impact of smart metering on greenhouse gas emissions is discussed in detail in section 6.3 of this report.

Consultation Report - Cost Benefit Analysis of Smart Metering and DLC
Assessment of Smart Metering and Direct Load Control
NERA Economic Consulting
8
2.2. Summary of National Results
Table 2.1 summarises the results of the cost benefit analysis across the whole of Australia. The table shows the maximum and minimum estimates of rollout costs, avoided meter costs,42 business efficiencies and demand response benefits, for each of the four rollout scenarios. It also sets out the maximum and minimum range for the overall net benefits for each scenario.43 The rollout scenarios are described in section 3.3.
Table 2.1 Net Present Value of Benefits and Costs ($m) – National (Excluding HAN)
National SMI costsAvoided meter
costs
Business efficiencies and other benefits
Demand response Net position
Scenario 1Distributor-led
Minimum Net Benefit (4,343) 1,756 2,516 250 179
Maximum Net Benefit (2,717) 2,606 3,307 738 3,934
Scenario 2Retailer-led
Minimum Net Benefit (5,978) 1,756 2,101 250 (1,870)
Maximum Net Benefit (3,587) 2,606 2,652 738 2,410
Scenario 3Non-smart meter DLC
Minimum Net Benefit (369) n/a n/a 403 34
Maximum Net Benefit (128) n/a n/a 746 618
Scenario 4Centralised communications
Minimum Net Benefit (5,631) 1,756 2,101 250 (1,524)
Maximum Net Benefit (3,332) 2,606 2,652 738 2,664
These results exclude the costs and benefits for smart meters associated with an interface to the HAN (ie, functionality 16). As discussed in section 16.2, NERA’s recommendation following Phase 2 of the analysis is that an interface with a HAN should be included within the minimum national functionality. The additional net benefit associated with including functionality 16 are reported below.
42 The avoided meter costs given in the table are based on a counterfactual of accumulation metering. The cost benefit
analysis has also considered a second counterfactual based on a continuation of each jurisdiction’s current meter replacement policy. See discussion in section 3.4.1.
43 The maximum net benefit is calculated on the basis of the highest benefit estimate for each category of benefits and the lowest rollout cost estimate. The lowest net benefit is calculated on the basis of the lowest benefit estimate for each category of benefits and the highest rollout cost estimate.

Consultation Report - Cost Benefit Analysis of Smart Metering and DLC
Assessment of Smart Metering and Direct Load Control
NERA Economic Consulting
9
It can be seen from Table 2.1 that the rollout scenario with the greatest net benefit is scenario 1, which corresponds to the distributor-led smart meter rollout. Scenario1 has a positive net benefit under both the maximum and the minimum estimates. Scenario 3 has also produced positive minimum and maximum net benefits but both the minimum and the maximum net benefit under Scenario 3 are lower than those under Scenario 1. Scenarios 2 and 4 have a negative minimum net benefit and a positive maximum net benefit. However, in Scenarios 2 and 4 the positive maximum net benefit is lower than the maximum net benefit estimated for Scenario 1.
Figure 2.1 illustrates the results for Scenario 1 in a waterfall diagram and its interpretation is given in detail below.
Figure 2.1 NPV of Benefits and Costs ($m) - National Scenario 1 (Excluding HAN)
0
1,000
2,000
3,000
4,000
5,000
6,000
7,000
SMI Costs Avoided meter costs Business efficienciesand other benefits
Demand response
The solid component of each of the bars represents the lowest end of the range estimated for the Smart Metering Infrastructure (SMI)44 costs, avoided meter costs, business efficiencies or demand response. The potential additional cost or benefit for each of the categories (as reflected by the upper end of the estimation range in each case) is indicated by the hatched areas. The colour of the hatched area corresponds to the colour of the solid area for each of the categories. The bars representing the benefits are shown so that the total of the low range for the benefits can be read directly from the graph (i.e, it is $4,522 as represented by the top of the solid area shown for demand response benefits). The total magnitude of the additional benefits (i.e, the top end of the ranges) is then indicated by the height of the uppermost hatched areas in the demand response bars.45 The waterfall diagram allows for both upper and lower ranges of total benefits to be compared directly with upper and lower ranges of the costs. 44 SMI refers to all the communication and data management support requirements of smart meters in addition to the
meters themselves. 45 Note that there are three hatched areas in the demand response bar, indicating the additional benefit (upper end of the
range) for the avoided meter costs (shaded blue), business efficiencies (shaded green) and demand response (shaded purple).

Consultation Report - Cost Benefit Analysis of Smart Metering and DLC
Assessment of Smart Metering and Direct Load Control
NERA Economic Consulting
10
The figure shows that on the basis of the low cost estimate a smart meter rollout under Scenario 1 is justified by the low end estimate of the avoided meter costs and business efficiencies. In this case, the low end of these two benefit categories is 57 per cent above the low cost estimate. If the high end cost estimate is taken then these two benefit categories are only 2 per cent below the cost estimate. If the high business efficiency estimate is taken together with the avoided meter costs it is 36 per cent above the high cost estimate.
Figure 2.1 also shows that the demand response benefits (which include benefits from both network deferral and a reduction in greenhouse gas emissions, in addition to other market benefits) are estimated to be relatively low on a national basis. In Scenario 1 the demand response benefits range from between 6 and 11 per cent as a proportion of total benefits. The benefits of network deferral account for the bulk of demand response benefits (for example, in Scenario 1 a nationwide network deferral benefit represents between 83 per cent (lower demand response) and 51 per cent (higher demand response) of the total demand response benefits). In comparison, greenhouse benefits represent 2 per cent of total demand response benefits in the lower demand response case and 12 percent in the higher demand response case.
We have also examined the net benefits where an interface with a HAN (functionality 16) is included within the functionality of smart meters. We have considered the incremental net benefit that may be achieved in two cases:
1. Where the inclusion of an interface with the HAN facilitates DLC thereby reducing demand but where an IHD is not provided; and
2. Where the inclusion of an interface with the HAN facilitates DLC and results in a further 7 per cent reduction in demand, via provision of an IHD.
Figure 2.2 illustrates the results of the cost benefit analysis for Scenario 1, including the HAN.
Figure 2.2 NPV of Benefits and Costs ($m) - National Scenario 1 (Including HAN)
0
1,000
2,000
3,000
4,000
5,000
6,000
7,000
8,000
SMI Costs Avoided meter costs Business efficienciesand other benefits
Demand response

Consultation Report - Cost Benefit Analysis of Smart Metering and DLC
Assessment of Smart Metering and Direct Load Control
NERA Economic Consulting
11
Inclusion of an interface with a HAN in the smart metering functionality would increase the demand response benefit estimated for the smart metering scenarios compared with the estimates presented above, as well as increasing the rollout costs. The additional net benefit that may be realisable from the inclusion of the HAN ranges from $39 million to $392 million (in NPV terms over the twenty year period) in the case of Scenario 1.46
2.3. Discussion
On the basis of the potential drivers for a smart meter or DLC rollout discussed in the previous sections we note that the results of the cost benefit analysis appear to indicate that in Australia a smart meter rollout could be justified on the avoided meter costs and business efficiencies alone. The results suggest that any network deferral benefits or greenhouse gas emissions reductions would be an additional benefit.
We note that the size of the annual network efficiency benefits estimated by CRA is substantial. On an annual basis it represents around 14 to 18 per cent of distributors’ current annual operating cost requirements (under Scenario 1).
A recent survey notes that reductions in overall energy demand, and in carbon emissions, have not been identified as major benefits in many of the international studies of smart metering. However, in many cases this is because these benefits did not drive smart meter rollouts in those countries and therefore were not evaluated.47
CRA notes in its network workstream report that avoided meter reading costs make up the bulk of the total benefits for smart meter rollout cases in North America, in one case accounting for around 68 per cent of the total benefits estimated. However, they also note that meter reading is conducted on a monthly basis in North America and hence is considerably more expensive than in Australia, where meters tend to be read less frequently.
In a recent report from the United Kingdom the expected business efficiency benefits of smart meters did not add up to a business case for widespread (as opposed to targeted) smart meter installation and the carbon reduction potential continued to be a central part of the overall cost benefit case for smart meters.48
The results presented in this report provide the best estimate of costs and benefits given information available over the course of this study. There is necessarily a degree of uncertainty in the estimation of both costs and benefits. Some of these uncertainties are captured within the ranges reported. The approach taken in this report is conservative, given that in the majority of cases we compare the high end of the cost estimates with the low end
46 The lower bound estimate reported above reflects the incremental net benefit from utilising the HAN capability to
facilitate DLC using smart thermostats (functionality 16C), assuming the lower bound uptake for DLC of 7.5 per cent and no IHD. The upper estimate reflects a 15 per cent take-up for DLC (functionality 16C) plus an additional 7 per cent conservation effect associated with providing customers with an IHD. This additional conservation effect is highly uncertain and has been estimated to be zero in the lower bound of our analysis (in which circumstance the provision of an IHD would result in a negative net benefit). See discussion in section 16.2.
47 Sustainability First, Smart Meters: Commercial, Policy and Regulatory Drivers, Gill Owen and Judith Ward, March 2006.
48 Sustainability First, Smart Meter in Great Britain: the next steps? Gill Owen and Judith Ward, July 2007.

Consultation Report - Cost Benefit Analysis of Smart Metering and DLC
Assessment of Smart Metering and Direct Load Control
NERA Economic Consulting
12
of the benefits estimates. We also note that there are potential additional benefits in relation to distributor business efficiencies and customer service that have not been quantified and are therefore not reflected in the net benefit results presented in this report.49
However, there remains uncertainty as to the likely costs and benefits associated with a smart metering rollout in Australia. We note that were the actual costs to be 5 per cent higher than the high end estimate presented in this report or benefits were to be 5 per cent lower than the low end estimates contained in this report the positive minimum net benefit case becomes a negative minimum net benefit case in the lower bound.50 The results in this report are indicative of the likely benefits and costs of a smart metering rollout for each jurisdiction, and highlight where further, and more detailed business case assessments of the costs and benefits could be undertaken. This will allow the risks associated with the costs and benefits being different from those assumed as part of this study to be appropriately managed. Results from these assessments may influence the nature of a roll-out in individual jurisdictions.
We are aware that the cost of smart metering infrastructure estimated by the Victorian distributors for the purpose of assessing the costs to pass through to customers by the ESC is above the cost estimated by EMCa. EMCa notes in its report that it has taken account of information provided by Victorian distributors to the extent possible given its limitations in scope and comparability.51 Nevertheless EMCa comments that it appears that the aggregate costs as assessed by the Victorian distributors are ‘somewhat higher’ than EMCa’s assessment.52 We understand that this difference in costs is greater than 5 per cent.
EMCa comments that there is a difference between the balance of probability on which it has formed judgements for the purposes of the cost benefit analysis and the level of certainty that is reasonably sought by a commercial entity seeking regulatory cost recovery for a large investment. At this stage there are uncertainties, particularly in regard to communications technologies suitable for rural areas, and these will be best resolved through implementation of some kind (whether by further trialling or through a prototype scale rollout). However, EMCa is comfortable with the assumptions that it has taken for the purposes of this cost benefit analysis.53
Stakeholders may have alternative views as to the level of certainty surrounding particular elements of the cost and benefit estimates. We note in this regard that the disaggregated costs and benefits outlined in the relevant consultant workstream reports and also in the overall cost benefit model allow stakeholders to evaluate the impact on the overall results of altering particular categories of costs and/or benefits.
Finally, we note that on a jurisdictional basis the net benefits of a smart meter rollout or of an alternative DLC rollout may differ from the aggregate national picture presented above. The
49 See discussion in section 18.5. 50 This result holds even where the incremental net benefit associated with the provision of an interface to the HAN is also
included. 51 EMCa Workstream 1Transitional Costs Consultation Report (February 2008), section 14.6 52 EMCa Workstream 1Transitional Costs Consultation Report (February 2008), section 14.6.1 53 EMCa Workstream 1Transitional Costs Consultation Report (February 2008), section 14.6.2

Consultation Report - Cost Benefit Analysis of Smart Metering and DLC
Assessment of Smart Metering and Direct Load Control
NERA Economic Consulting
13
jurisdictional appraisals of the net benefit of smart meters are presented in sections 7 through 14 of this report and in greater detail in Appendix D.

Consultation Report - Cost Benefit Analysis of Smart Metering and DLC
Methodology and Approach
NERA Economic Consulting
14
3. Methodology and Approach
This section sets out the general methodology that underpins the cost benefit analysis and highlights some key areas of our approach.
In particular this section covers:
the scope of the cost benefit analysis;
the assumed functionality of both a smart metering rollout and a direct load control alternative;
the four rollout scenarios defined by the SMWG and their role in the analysis;
key features of the base case against which the cost benefit analysis is being assessed;
our approach to assessing differences in costs and benefits between rural/remote areas and urban areas for each jurisdiction; and
the identification and treatment of transfer payments within the cost benefit analysis.
3.1. Scope of the Analysis
The cost benefit analysis has been conducted for each of the jurisdictions in Australia.
The analysis relates to the costs and benefits of a smart meter rollout (or a non-smart meter DLC alternative) to small residential customers and small commercial customers.
‘Small’ customers have been taken as being those with a total annual demand below 160 MWh for all jurisdictions with the exception of Queensland (100 MWh/year), Tasmania (150 MWh/year) and the Northern Territory (750 MWh/year). The threshold adopted for small customers for these three jurisdictions reflects data availability.54
The analysis is restricted to those small customers connected directly to the main grid. In the case of Western Australia this means the South West Interconnected System (SWIS) whilst for the Northern Territory it means the network around Darwin and Katherine only.
3.2. Assumed Functionality
3.2.1. Smart metering system
The Phase 1 analysis considered what functionalities should be included in a national minimum functionality for a smart metering rollout. In particular, it defined a core set of functionalities assumed to be common to any smart meter rollout and then assessed the incremental costs and benefits of adding functionalities to this core set. The core set
54 In particular the thresholds adopted for Queensland and Tasmania reflect the thresholds applying to the introduction of
retail competition in those jurisdictions, whilst for the Northern Territory data is not further disaggregated in relation to customers below 750 MWh/year.

Consultation Report - Cost Benefit Analysis of Smart Metering and DLC
Methodology and Approach
NERA Economic Consulting
15
comprised those functionalities that the consultant teams considered necessary for a meter to be considered ‘smart’ as well as those functionalities common to all electronic electricity meters.55
The recommended set of functionalities that resulted from the Phase 1 analysis is summarised in Table 3.1 below.
Table 3.1 Minimum National Functionality for a Smart Metering System
No. Functionality Description
1, 10 & 11
Half-hourly consumption measurement and recording
Meters record active energy in 30 minute intervals
3 Local reading – hand-held device
Meters are capable of being read on-site by a meter reader using a special meter reading device
4 Local reading – visual display on meter
Meters are also capable of being read on-site by the customer using a visual display
5 Communications and data security
All data from the meter is securely transmitted
6 Tamper detection The meter system would support detection of attempts to tamper with the meter and would communicate any such attempts remotely.
7 Remote time clock synchronisation
Remote setting of the clock in the meter and maintenance of clock accuracy, in order to ensure that half-hourly data reads correspond to actual time of use.
8 & 14 Load management at meters through a dedicated controlled circuit
Continued support for current arrangements for load management at dedicated control circuits, ie, hot-water control systems. Broadcast commands can be sent to 99 per cent of meters within 1 minute (case C).
2 & 9 Remote reading (daily) Daily remote collection of the previous trading day’s 30 minute interval energy data.
12 Remote connect/disconnect
Connect/disconnect contactor on all direct-connect meters, able to be controlled both locally and remotely, and with ability to check the status remotely. Performance levels are for up to 2 per cent of meters, action completed for 90 per cent of those meters within 10 minutes (Case B).
13 Supply capacity control Smart meters shall have two supply capacity limit settings – a normal limit and an emergency limit. This functionality applies only to direct connected meters (ie: does not apply to CT connected meters).
19 Quality of supply and other event recording
Enables meters to record information in relation to quality of supply events or other events (eg: outage, undervoltage, disconnection, meter loss of supply, change of settings). The event log can then be read remotely.
55 See discussion in Section 3.2 of NERA’s Phase 1 Overview Report (September 2007) for a more detailed discussion of
the functionalities considered to be ‘core’.

Consultation Report - Cost Benefit Analysis of Smart Metering and DLC
Methodology and Approach
NERA Economic Consulting
16
No. Functionality Description
20 Meter loss of supply detection and outage detection
All smart meter systems would include a means of detecting loss of supply to meters including those at individual customer’s premises (e.g. using a routine service ping). Smart meter systems would also include means for outage detection, either at meters or at distribution transformers. When a meter loss of supply or outage is detected it would be alarmed.
25 Remote reconfiguration Enables meter settings to be remotely changed. Settings would include, for example: times for controlled load switching; thresholds for quality of supply events; and supply capacity control settings.
26 Remote software upgrades
The software in the meter can be upgraded remotely by the responsible person over the communications link. The software shall be installed in the meter without the need for a site visit or action from the customer.
29 Plug and play device commissioning
Allows meters to be activated and registered on the system remotely once installed, rather than manually.
The costs and benefits of rollout scenarios involving smart metering systems presented in this report are based on the functionalities set out above.
For a limited number of functionalities we were not able to make a definitive recommendation in Phase 1 as to their inclusion in the national minimum functionality. These functionalities are set out in Table 3.2.

Consultation Report - Cost Benefit Analysis of Smart Metering and DLC
Methodology and Approach
NERA Economic Consulting
17
Table 3.2 Functionalities Subject to Further Assessment
No. Functionality Description
15 Interface for other load control devices
Allows electric devices in the home to be cycled at peak times (ie, turned on and off remotely at short intervals), such as air-conditionerss and pool pumps.
Case A: Action performed at 90 per cent of meters within 1 hour
Case B: Action performed at 90 per cent of meters within 1minute
16 Capability to interface with a Home Area Network (HAN)
Provides the capability for both direct load control via the HAN and the provision of an IHD.
Case A: DLC facilitated by a HAN. Performance level sets out requirements for messaging capabilities.
Case B: DLC facilitated by a HAN. Faster delivery of messages than for Case A.
Case C: DLC facilitated via smart thermostats.
21 Customer supply monitoring
The meter would send an alarm if it detected:
reverse polarity at a customer’s connection;
degradation of the customer’s neutral; and
degradation of the customer’s earth connection (from switchboard to earth).
The overall cost benefit analysis presented in this report has been conducted on the basis of excluding functionalities 15 (interface with other load control devices) and 16 (interface to home area network using open standard). However, we have undertaken an incremental cost benefit assessment for each of these functionalities in order to inform the SMWG’s decision as to whether they should also be included in the minimum national functionality. Since these two functionalities are substitutes for each other (both resulting in changes to final demand) we have assessed them separately rather than together. The results of the incremental cost benefit analysis for these functionalities are reported in Section 16.2, at which point we recommend that functionality 16 should be included in the minimum national functionality. Where relevant we refer to the potential additional net benefit that may result from including functionality 16 in reporting the jurisdictional results in sections 7 through 14.
Functionality 21 (customer supply monitoring) was shown to have a positive incremental net benefit in our Phase 1 analysis. However, significant concerns were raised by the consultant teams regarding its practicality. This functionality is discussed further in Section 16.2 of this report.
Finally, the interoperability and standards functionalities (23 and 24) have also been further examined as part of Phase 2. Our conclusions on these functionalities are set out in Section 16.2 of this report.

Consultation Report - Cost Benefit Analysis of Smart Metering and DLC
Methodology and Approach
NERA Economic Consulting
18
3.2.2. Direct load control
The cost benefit analysis has also considered a direct load control alternative to smart metering, which is Scenario 3 provided by the SMWG.
Table 3.3 lists functionalities that have been assumed in relation to direct load control.
Table 3.3 Functionalities Included in a Direct Load Control Scenario
No. Functionality Description
30 Signal receiver and switch located on appliance
Signal receiver and switch located on high energy use appliances (air-conditionerss, pool pumps, etc), with no meter intermediary.
31 Uniquely addressable signal receiver Capability to identify and contact signal receiver through unique address. Provides capability to group demand response into appliance type, customer type, or region, etc, as needed. Also allows addition and removal of customers from demand management program without site visit.
The costs and benefits that have been estimated for Scenario 3 therefore assume these functionalities.
3.3. Scenarios
We have been asked to analyse the costs and benefits of a smart meter rollout (or of a demand management alternative) in relation to four alternative scenarios. The scenarios were developed by the SMWG in consultation with interested stakeholders from each of the jurisdictions and provided to the project team. While there is an almost limitless number of alternative approaches to implementing the rollout program the scenarios represent points in a spectrum of possible alternative approaches and provide an indication of the range of costs and benefits associated with a mandatory smart meter rollout (or demand management alternative). Importantly, the actual rollout strategy adopted may differ from any of the four scenarios presented here. The consultants have not been asked to advise on the rollout strategy to adopt.
There are three scenarios for a smart meter rollout and one scenario involving the retrofitting of direct load control devices in the absence of a smart meter. These are:
Scenario 1: distributor-led rollout – where each distribution network service provider is given the responsibility for owning and installing meters and associated metering data services within its area of operations and there is no scope for the competitive provision of these services;
Scenario 2: retailer-led rollout – where retailers have responsibility for procuring the installation of meters and data management services within a competitive market for these services;
Scenario 3: DLC device rollout – which does not involve the installation of smart meters, and distributors have responsibility for retrofitting direct load control devices on high energy using appliances such as air-conditionerss and pool pumps; and

Consultation Report - Cost Benefit Analysis of Smart Metering and DLC
Methodology and Approach
NERA Economic Consulting
19
Scenario 4:56 centralised communications as part of a retailer-led rollout – where the entire Australian smart meter communications system is provided by either a new centralised agency or an existing market operator.
The remainder of this sub-section outlines the role of the scenarios in the cost benefit analysis and then describes each of the scenarios in greater detail. There are a number of matters that are relevant to our assessment of the costs and benefits of each scenario and these are also discussed briefly below.
3.3.1. The role of scenarios in the analysis
The scenarios that are being considered as part of the cost benefit analysis represent alternative approaches to rolling out smart meters (or a DLC alternative).
The scenarios have the potential to affect the costs of a smart meter rollout through differences in:
the infrastructure necessary for implementation;
the potential for the achievement of economies of scale; and
the scope for competitive provision of meters and meter data management services.
The competitive provision of meters and meter data management services is a substitute for the monopoly provision and subsequent regulation of those services. This may result in a different distribution of costs and benefits between consumers and the providers of those services depending on the relative efficiency of competition versus regulation in uncovering the true price of services.
Similarly, the benefits among scenarios may differ. This may be due to differences in the incentives retailers and distributors have for product innovation, including the development of TOU and CPP tariffs. There may also be benefits that distributors could achieve where they have the responsibility for the detailed design of the rollout that may not be realisable to the same extent under a retailer-led or a centralised communications rollout, and vice versa.
The different scenarios also affect the allocation of the costs and benefits between retailers and distributors, particularly those costs and benefits associated with the role of the meter provider. Differences in the allocation of costs and benefits may change the incentives that either distributors or retailers have to invest in systems required to achieve some benefits absent their inclusion in a mandated rollout.
Each of the smart meter scenarios assumes that the rollout of smart meters is mandatory across all small customers. A mandatory rollout is important because it is likely that neither distributors nor retailers would otherwise invest optimally in a smart meter rollout on their own. This is because of the market failure resulting from the benefits and costs accruing to different stakeholders within the electricity supply chain. The reason why our analysis has been structured to consider the relative costs and benefits across both distributors and 56 Scenario 4 could be a retailer or distributor led rollout and is presented here as a retailer led rollout for exposition
purposes only.

Consultation Report - Cost Benefit Analysis of Smart Metering and DLC
Methodology and Approach
NERA Economic Consulting
20
retailers is to allow us to examine this issue in detail and to identify where the costs may outweigh the benefits when considered overall.
The consideration of scenarios in the analysis is not intended to inform a view as to the relative merits of one scenario over another. Rather, the results provide some insight into what the costs and benefits might be in particular circumstances (such as the competitive provision of metering), which allows for different views as to the validity of those circumstances to then be considered. It also allows for the consideration of how well alternative rollout scenarios may meet the objectives set out by the MCE as well as the risks and policy implications of alternative approaches.
Each scenario should therefore be considered illustrative of the costs and benefits associated with a particular rollout approach. The scenarios allow examination of the sensitivity of the costs and benefits of a smart meter rollout (or DLC alternative) to changes in the regulatory environment and ownership. Net benefits may be maximised, however, through combining elements of a number of scenarios as part of the final rollout decision. The results will therefore inform subsequent evaluation of the relative merits of alternative rollout approaches, as may be considered by the MCE. In the conclusions presented at the end of this report, we present a further alternative rollout strategy (a ‘franchise rollout’) which we believe will help to ensure that the business efficiency benefits estimated for a smart meter rollout are actually achieved in practice. However, there is no intention to recommend a preferred scenario as part of our analysis. Ultimately, any rollout decisions will be a matter for the MCE as it considers the results from our study.
3.3.2. Description of the scenarios being considered
The three smart meter rollout scenarios differ in:
the allocation of the roles and responsibilities throughout the metering chain;
the ownership of the meters (which has implications for customer churn where there is retail competition);
the scope for competition in metering services;57 and
communications infrastructure required to provide services.
The differences are summarised in Table 3.4 below.
57 Any difference in the scope for competition in metering services among the scenarios is a working assumption for the
purposes of our analysis. This does not reflect, in any way, a view as to the feasibility of competition in metering services in the market, or as between each of the scenarios.

Consultation Report - Cost Benefit Analysis of Smart Metering and DLC
Methodology and Approach
NERA Economic Consulting
21
Table 3.4 Comparison of smart meter scenarios
Distributor-led
Scenario 1 Retailer-led Scenario 2
Centralised communications
Scenario 4*
Roles and responsibilities
- responsible person Distributor Retailer Retailer
- meter provider Meter
provider/distributor Meter provider/retailers Meter provider/retailers
- communications provider
Meter data provider/distributor
Public communications provider/distributor/ third party provider
Third party communications provider
- local meter data & communications manager
Distributor Meter data provider/retailer
Third party communications provider
- market meter data and transaction manager
Market operator Market operator Market operator
Ownership of meters Distributors Meter provider/retailers Meter provider
Scope for competition in meter service provision to retailers
Distributor responsible for the meter provider
and meter data manager roles
Retailers responsible for appointing meter provider and meter data manager, which can be themselves
Retailers responsible for appointing meter
provider, which can be themselves
Communications infrastructure
Distributors would have their own private
communications network
Multiple open access communications network
to facilitate access to meters by all competitive
meter data managers
Single shared communications network
with open protocols
* Scenario 4 could be either a distributor- or retailer-led rollout and is presented here as a retailer led rollout for exposition purposes only.
How each of the scenarios affects the costs and benefits of a smart meter rollout is discussed further in sections 5 and 6 respectively.
In addition to the three smart meter rollout scenarios, we have been asked to consider a non-smart meter rollout of DLC. Under this scenario, distributors are assumed to be the party responsible for the rollout and have a mandatory requirement to make an offer to all customers to retrofit a DLC capability on those existing appliances that are capable of direct load control. Distributors are allowed to recover the costs of the retrofit as part of their distribution use of system (DUOS) charges. For the purposes of the analysis we have assumed that air-conditioners and pool pumps would be targeted for DLC under this scenario, based on the appliances that are currently subject to DLC trials in Australia.

Consultation Report - Cost Benefit Analysis of Smart Metering and DLC
Methodology and Approach
NERA Economic Consulting
22
3.4. Counterfactual
The costs and benefits associated with each of the rollout scenarios have been measured against a counterfactual in which there is a continuation of ‘business as usual’.
Three features of the assumed counterfactual warrant particular mention:
1. The assumption made regarding the policy on new and replacement metering in each jurisdiction, absent any rollout of smart metering;
2. The counterfactual assumptions in relation to direct load control; and
3. The introduction of a carbon trading scheme.
Each of these assumptions is discussed below.
3.4.1. Metering policy
The costs and benefits of a smart meter rollout (or a DLC alternative) have been compared in each jurisdiction against two counterfactuals:
an assumption of the continued use of accumulation metering; and
an assumption of a continuation of each jurisdiction’s policy for meter replacement.
Jurisdictions currently vary in relation to their policies for meter replacement. Replacement meters are currently one or the other of a combination of an electromechanical or electronic accumulation or manually read interval meter. The details of each jurisdiction’s metering policy is set out in sections 7 through 14 where the results for each jurisdiction are discussed. In the case of Western Australia we note that Western Power is currently planning to replace almost a third of its total meter stock due to accuracy problems. This replacement program is incorporated into our counterfactual based on a continuation of this current policy.
We note that for some jurisdictions distribution businesses are currently rolling out manually read interval meters for new and replacement meters in anticipation of a smart meter rollout. Assessing the costs and benefits of a smart meter rollout against a counterfactual which itself depends on the assumption of a smart meter rollout risks distorting the analysis. If the overall cost-benefit of a smart meter rollout were to be found to be negative for a jurisdiction, prompting a decision to delay a smart meter rollout, the current new and replacement metering policies may change, which would in turn have implications for the costs and benefits of a smart meter rollout.
To address this concern we have considered as an ‘alternate counterfactual’ a continuation of the use of accumulation meters in each jurisdiction. This alternate counterfactual allows us to examine the impact of the new and replacement metering policy in each jurisdiction on the outcome of the cost benefit analysis. In the case of Western Australia we note that Western Power’s accelerated meter replacement program is also incorporated in the accumulation counterfactual.
Where a jurisdiction’s new and replacement metering policy includes the installation of interval metering we have adopted the assumption that these meters continue to be read as

Consultation Report - Cost Benefit Analysis of Smart Metering and DLC
Methodology and Approach
NERA Economic Consulting
23
accumulation meters and that customers do not face TOU tariffs or CPP as a result. To the extent that this is not the case in practice (and we are aware that EnergyAustralia in New South Wales does currently provide customers with interval meters and TOU tariffs) then the demand response benefit will be overestimated. However, we do not consider that this has a material quantitative impact on the analysis and does not alter the conclusions.
The results of the cost benefit analysis presented in this report are based on the counterfactual of accumulation metering. The impact of adopting the alternative counterfactual is discussed in the relevant chapter for each jurisdiction.
Victoria is committed to a rollout of smart meters from 2009. The counterfactual for Victoria could therefore be argued to be one in which smart meters are already in place. However, it is unclear what would then constitute a ‘rollout’ under each of the scenarios we have been asked to consider. We have therefore adopted as a counterfactual assumption for Victoria a new and replacement metering policy based on interval meters, as this represents the practice of the majority of other jurisdictions and therefore represents one view of the policy that would have been adopted by Victoria if the decision had not been made to rollout smart meters.58 Adopting this counterfactual assumption for Victoria allows us to estimate the full costs and benefits associated with each of the SMWG rollout scenarios. We have also assessed the costs and benefits for Victoria against the alternative counterfactual of a continuation of the use of accumulation meters.
3.4.2. Direct load control
The counterfactual for all scenarios assumes the continued operation of current customer circuit-based load control, such as ripple control. Apart from this, the scenarios assume that there is no means, other than through smart metering, direct load control and associated infrastructure assessed as part of this analysis, by which retailers, distributors or market operators can remotely connect to meters or remotely communicate with in-home circuit controls, with in-home appliances or with home area networks for any of the functionality considered as part of this analysis. In other words, no functionality considered in this analysis is assumed to be available other than as a result of deployments, investments and ongoing expenditure required under the scenarios considered in this analysis.
3.4.3. Introduction of a carbon trading scheme
We have assumed as part of the counterfactual that a carbon trading scheme is introduced in Australia from 2012. A carbon price of $15 per tonne in 2012 has been assumed by CRA, which rises to $20 per tonne in 2020 and $40 per tonne in 2030. These projections are discussed further in the CRA Market Impact workstream report.59
58 In assessing the interval meter counterfactual, we have further assumed that customers with interval meters will be
billed as though their electricity use was recorded with an accumulation meter. This allows us to consider the full demand response benefits that would result from the introduction new tariff products under the smart metering rollout. We note that this counterfactual differs from the Victorian Interval Metering Rollout decision (IMRO) in that it does not include an accelerated rollout component.
59 CRA Workstream 5 Market Impact Consultation Report (February 2008), section 3.6.2

Consultation Report - Cost Benefit Analysis of Smart Metering and DLC
Methodology and Approach
NERA Economic Consulting
24
The assumption of the introduction of a carbon trading scheme means that the retail tariffs assumed to be offered in each jurisdiction in the absence of a smart meter rollout have been modified to reflect expected carbon prices. KPMG provided estimates of the magnitude of the adjustment to tariffs required, based on modelling work undertaken by CRA.60 NERA as part of the customer impact workstream has then estimated the impact on customer demand (and therefore the load duration curve) in each jurisdiction that is expected to arise as a result of these carbon-modified tariffs.
This change in demand is reflected in the counterfactual against which the various rollout scenarios are assessed and is distinct from any further impact on demand flowing from the introduction of smart meters or DLC.
3.5. Second Round Impacts
It is important to recognise that the cost benefit analysis presented in this report focuses only on the first round impact of a smart meter rollout, or a DLC alternative. That is, the costs associated with the rollout and the benefits that flow from the rollout are captured in our analysis at the point at which they are first incurred (for costs) or first accrue (for benefits). For example, under Scenario 1 the costs of the smart meters themselves are initially borne by the distributors, and therefore appear in our analysis as a cost to distributors. Likewise, business efficiency benefits from no longer having to manually read meters also accrue to the distributor in the first instance under this scenario.
However, in the longer term both the costs of the smart meter rollout (or DLC alternative) and many of the benefits can be expected to flow through to consumers. This ‘second round impact’ can be expected to occur as a result of both competition (where present) and the regulatory price setting process. Specifically, tariffs in the longer term can be expected to reflect a passing through of the net costs and benefits of the rollout.
For example, although it is distributors that initially benefit from a reduction in meter reading costs (under rollout Scenario 1), at the time of the next regulatory review all or at least part of this benefit can be expected to be passed through to consumers in the form of lower network prices. In the case of business efficiency benefits that accrue to retailers, these can also be expected to be passed through to consumers in the form of lower retail tariffs, either through regulation (in those jurisdictions where there is no retail competition) or via competitive pressures.
This second round impact has not been incorporated in the cost benefit analysis. One of the aims of Phase 2 of the analysis is to highlight where there are differences in the costs and benefits between jurisdictions, which in turn will inform the MCE’s decision as to the timing for the rollout in each jurisdiction. Where the cost benefit analysis on the basis of the first round impact has highlighted differences in costs and benefits between jurisdictions, we would not expect this to substantially change if the further iteration between net costs and tariffs were also included. For this reason, we do not believe that it would impact the net benefit results sufficiently to change the conclusions drawn from our analysis.
60 KPMG Retail Impact Workstream Consultation Report (February 2008), Appendix A.5.3.

Consultation Report - Cost Benefit Analysis of Smart Metering and DLC
Methodology and Approach
NERA Economic Consulting
25
However, the party to whom the costs and benefits accrue will change as a result of these second round benefits, with the majority of costs and benefits ultimately flowing to consumers. This should be borne in mind when considering the stakeholder breakdown of costs and benefits presented in this report.
3.6. Urban, Rural and Remote Analysis
In addition to the aggregate cost benefit analysis for each jurisdiction, we have also assessed how the costs and benefits are likely to vary among urban, rural and remote areas. It should be noted that off-grid and small-grid customers are not included in our cost benefit assessment.
Both EMCa in estimating transitional costs and CRA in estimating network business efficiency benefits have identified separately the overall costs and benefits for urban and rural/remote areas. For some of the key categories, the rural/remote assessment has been further disaggregated into a rural and a remote category.
The distinction between urban and rural is notionally at a density of less than 100 customers per square kilometre.61 However, direct data on the number of NMIs were not always available on this basis and broad estimates of the ratio were made using available data. For those distributors with a strong rural base, 10 per cent of customers were assigned to a ‘remote’ category.
The resulting allocation of customers nationally is as follows:
86 per cent urban; and
14 per cent rural/remote, comprising 10 per cent ‘rural’ and 4 per cent ‘remote’.
On the costs side, the urban/rural/remote split was used to assign different communications technologies and different meter installation costs within each region within a jurisdiction.
On the benefits side, the urban/rural/remote split was used to disaggregate the overall results to provide indications of relativities between the benefits for urban, rural and remote areas.
Our breakdown of the cost benefit analysis for urban, rural and remote areas is presented in section 15.2.
3.7. Identification and Treatment of Transfer Payments
A particular feature of this cost benefit analysis is that we have been asked to consider how the costs and benefits accrue among the relevant stakeholders. This means that it is important to consider transfers that may arise between each stakeholder as well as the overall net benefit associated with each rollout scenario.
61 This description of the allocation of urban, rural and remote customers is taken from EMCa’s Workstream 1Transitional
Costs Consultation Report (February 2008), section 2.5.

Consultation Report - Cost Benefit Analysis of Smart Metering and DLC
Methodology and Approach
NERA Economic Consulting
26
Transfers between consumers and electricity retailers, networks and generators arise as a result of:
1. Changes in customer demand, either as a result of customer response to TOU and CPP tariffs, general energy conservation or DLC; 62
2. Incentive payments to customers from either distributors, retailers or demand aggregators in order to encourage them to take up DLC tariffs;
3. Changes in the hedging requirements faced by retailers, either as a result of changes in demand or through the provision of better usage information to retailers to enable them to more accurately forecast prices in the wholesale market; and
4. Changes in retailers’ working capital and bad debt requirements, as a result of more frequent bill payments.
NERA has estimated the consumer benefit associated with reductions in consumer bills as a result of changes in demand arising from a rollout of smart meters. The change in customer bills creates a direct financial transfer between consumers and electricity service providers (retailers, networks and generators). As a result, bill reductions are included in the modelling both as a benefit to customers and as a cost to retailers, networks and generators (in proportion to their relative share of the total cost of supplying electricity).
For DLC, there is an assumed payment to customers in order to provide them with an incentive to take up DLC tariffs. This payment represents a transfer from whichever business is assumed to make it. In the analysis in this report the incentive payment has been assumed to come from distributors in order to realise a network deferral benefit. However, incentive payments could equally be paid by a retailer or a third party aggregator. Since such payments are simply a transfer, the assumption made about who makes the incentive payment does not affect the overall results.
For demand reductions brought about by either a general energy conservation effect or enhanced responsiveness to TOU and CPP tariffs, there is a cost to consumers from the lost opportunity to benefit from the amount of electricity use that was curtailed. This arises over that which they would have paid to use. This cost to customers has been estimated by NERA and reflects a net loss to society, rather than a transfer. There is no equivalent lost consumption opportunity in relation to demand reduction achieved via DLC, since it is assumed that consumers do not notice any difference in thermal comfort when air-conditionerss are cycled and therefore there is no loss of value to the customer from using the appliance that is being controlled.
In addition, we have treated cost savings to retailers arising from lower hedging costs and working capital as transfer payments, apart from any reductions in transactions costs that may result.
Retailers’ hedging costs may be reduced both where there is a reduction in peak demand and as a result of the availability of better information to retailers which enables improved 62 See chapter 2 of the Consumer Impact Report for a complete description of the methodology used to estimate the
transfers associated with customer demand changes from TOU tariffs and CPP.

Consultation Report - Cost Benefit Analysis of Smart Metering and DLC
Methodology and Approach
NERA Economic Consulting
27
forecasting of wholesale prices. However, a reduction in the hedging costs paid by retailers also represents a reduction in the revenue earned by the counterparties to those hedges, which in the majority of cases are the generators. We have included this transfer within our modelling. However, we have assumed an overall saving of 2 per cent of the changed value of hedges, as representing the transaction costs that are avoided.63 This reduction in transactions costs is included in the model as a benefit, rather than a transfer.
Working capital can be considered as a transfer between retailers and consumers. More frequent bill payments results in a reduction in working capital costs for retailers but will also reduce the interest earned on those funds by customers. We have assumed that the entire change in working capital is a transfer, i.e. there is no overall transaction cost saving.64
Finally, we have also incorporated changes in bad debt expenses into our analysis. KPMG has distinguished between the transfer component of a change in bad debt and the overall reduction in systems costs that are associated with a reduction in bad debt.
There are potential differences in opinion as to whether hedging, working capital, and bad debt should be treated as transfers and the extent of the overall net saving associated with these items. However, we note that the change in the value of transactions costs considered is of an order of magnitude different from the costs and other benefits identified in relation to each scenario. As a result, whether or not these transactions are treated as transfers does not change the picture presented in the cost benefit analysis.
63 This reflects the assumptions made by KPMG, KPMG Retail Impacts Workstream Consultation Report (February
2008), section 8.4.1. 64 This again reflects the assumptions made by KPMG, which have been revised since Phase 1, given that savings are
likely to be marginal.

Consultation Report - Cost Benefit Analysis of Smart Metering and DLC
Key Assumptions
NERA Economic Consulting
28
4. Key Assumptions
4.1. Time Period for the Analysis
We have adopted a 20 year time period for the quantitative cost benefit analysis beginning in the 2008/2009 financial year. We chose 1 July 2008 as the start of the assessment period to coincide with:
an assumed national mandate for the rollout of smart metering to commence on 1 January 2009; and
the requirement to model financial years for consistency with the outputs of the CRA market model.
The reason for using a 20 year time period was to ensure that the costs and benefits of a rollout of smart meters (or a DLC alternative) were assessed over the full life cycle of the meters. This means that we have also included directly the costs associated with the replacement of smart meters at the end of their 15 year useful life.
In order to take into account differences in asset lives between smart meters and the meters they would be replacing (and in particular the 40 year life of current accumulation meters), we have annualised the costs of meters and their installation costs, both for the smart meter rollout and for the meter counterfactuals. 65 This means that the estimated annual avoided cost for meters with an asset life of 40 years will be smaller than for meters with a shorter asset life, say 15 years, because the total cost of the meter is spread over its assumed life.
The annualised cost of a meter therefore increases when:
the installation cost rise;
the economic life of a meter decreases; and/or
the discount rate increases.
This approach ensures that our analysis accounts for differences in the meter life for smart meters compared with older style meters. Specifically, our analysis considers:
the financial impact of the shorter technical standard life of a smart meter (i.e. 15 years) compared to the counterfactual which includes disk accumulation meters which have a 40 year technical standard life;
the financial impact of different expected failure rates of different metering stock;66
the financial impact of abolition rates (ie, customer initiated meter replacements);67 and
65 The annualised cost is calculated so as to equate the installed cost of a meter with the present value of a constant real
annual payment over the expected economic life of the meter. The constant annual payment is a consequence of the decision to use a real pre tax WACC as the discount factor for our cost-benefit analysis.
66 Higher failure rates lower the expected economic life of a meter, thereby increasing the annualised cost of the meter. 67 Higher abolition rates lower the expected economic life the meter, thereby increasing the annualised cost of the meter.

Consultation Report - Cost Benefit Analysis of Smart Metering and DLC
Key Assumptions
NERA Economic Consulting
29
the impact of growth in customer numbers over the assessment period, as the annualised cost is applied to the growing stock of meters.68
Annual customer growth rates have been estimated for each distributor on the basis of either forecasts provided by businesses or current growth rates from publicly available regulatory statements. Note that the sensitivity analysis undertaken in Phase 1 suggested that different assumptions on growth rates do not have a material impact on the cost-benefit analysis, as most costs and benefits vary with customer numbers.
Finally, our analysis does not explicitly take account of the costs associated with the existing meter stock being made redundant due to the rollout of smart metering, as these sunk costs are not relevant to an economic cost benefit analysis to determine whether to proceed with a smart metering rollout. How these redundant assets are subsequently treated by the regulatory framework will, however, be a relevant policy issue to be considered as part of the rollout.
4.2. Rollout Timeframe
4.2.1. Smart meter scenarios
Conversion of the existing national stock of electricity meters to smart meters entails the replacement of roughly 10 million meters. The size and scale of this task necessitates that the rollout of smart meters occurs over a number of years. We have assumed for our analysis that the rollout of smart meter infrastructure begins on 1 January 2009, following a decision by the MCE during 2008.
For each jurisdiction an indicative rollout assumption was made. The general approach was to assume that jurisdictions would start with a smart metering trial and associated planning period of up to two years, during which only a limited number of smart meters would be installed. This is followed by an accelerated rollout period, where all existing meters would be replaced by 31 December 2014. For Victoria, however, the rollout assumption used is consistent with current commitments to deploy smart meters.69 For Western Australia, the rollout assumption also differs due to a known short term requirement to replace around 300,000 electronic 3 phase meters.70 Figure 4.1 illustrates the assumed jurisdictional meter rollout profiles.
68 We note that for the overall cost benefit analysis NERA has calculated the annualised replacement cost of smart
metering systems, exclusive of the lower installation costs associated with the rollout due to economies of density. The benefits of lower installation costs were explicitly sourced from the EMCa cost data.
69 Victorian Government Gazette, Order in Council No S 200, Tuesday 28 August 2007. 70 We note that that the final numbers and the exact timing of this meter replacement program is subject to finalisation by
Western Power. We also understand that Western Power may not have access to sufficient resources (eg, meter technicians) to allow smart meters to be rolled out in the SWIS by the end of 2014.

Consultation Report - Cost Benefit Analysis of Smart Metering and DLC
Key Assumptions
NERA Economic Consulting
30
Figure 4.1 Assumed Jurisdictional Rollout Profiles
0%
20%
40%
60%
80%
100%
2009 2010 2011 2012 2013 2014 2015
General Profile WA VIC
These profiles are not intended to denote optimal strategies for each jurisdiction with respect to the deployment of smart meters. Rather, these profiles represent plausible rollout strategies that could be achieved with the commitment by the jurisdiction for an accelerated deployment of smart metering infrastructure.
4.2.2. Non-smart meter DLC rollout
For Scenario 3 we have assumed that the rollout of a DLC capability would occur more quickly than for the smart meter scenarios. This is driven by an assumption that the retrofit of a DLC device only occurs for those customers that take up a DLC option, rather than for all customers. The logistics of organising a DLC retrofit to the 7.5 per cent of customers that are assumed to take up a DLC option (or 15 per cent in the high demand response case)71 are therefore likely to be more straightforward.
However, it is likely that it will still take time to recruit customers into the DLC program, and as a result we have not assumed that the uptake rates will be achieved in the first year of the program. Rather, we have assumed a linear rollout over the three years, beginning 1 January 2009 and finishing 31 December 2011.
71 The assumptions for take-ups that underlie the cost benefit analysis are discussed in section 6.3, Box 6.2.

Consultation Report - Cost Benefit Analysis of Smart Metering and DLC
Key Assumptions
NERA Economic Consulting
31
4.3. Discount Rate
To ensure that the timing of benefits and costs is appropriately considered within the cost benefit analysis it is necessary to use an appropriate discount rate. The discount rate is used to convert the stream of benefits and costs over the 20 year time period into present value terms, i.e. 2008/09 values.
The choice of a discount rate has the potential to impact significantly the assessment of the net benefit of the different rollout scenarios. This is because the costs are incurred predominately at the beginning of the period, when the meters are rolled out (or when DLC devices are installed) while the benefits tend to grow throughout the period.
In determining the discount rate we have considered the objective of the cost benefit analysis: to assess the net benefits of alternative rollout scenarios in order to inform the SMWG’s decision on the rollout of smart meters (or a DLC alternative). Given this objective, it is appropriate to use a discount rate that reflects the project specific cost of capital.
Our analysis has therefore applied a real pre-tax discount rate of 8 per cent to all costs and benefits of the smart meter rollout. This is consistent with current market estimates of the commercial discount rate of a private enterprise investment in the electricity sector.72
To assess the robustness of our analysis, we have undertaken sensitivity testing with discount rates of 6.5 per cent and 9.5 per cent. The lower rate approximates the real pre tax weighted average cost of capital (WACC) commonly used by energy regulators in Australia.
72 An 8 per cent discount rate was applied by VENCorp in its most recent Regulatory Test application.
VENCorp, New Large Transmission Network Asset: Additional 500/220kV Transformation to Support West Metropolitan Melbourne and Geelong Area Load Growth, September 2005, p27.

Consultation Report - Cost Benefit Analysis of Smart Metering and DLC
Assessment of Costs
NERA Economic Consulting
32
5. Assessment of Costs
This section summarises the estimation of the costs associated with each of the smart meter rollout scenarios and the DLC rollout scenario.
The major area of costs is the transitional costs associated with the rollout under each scenario. The estimation of the transitional costs has been undertaken by EMCa and full details are contained in EMCa’s workstream report.
The estimation of on-going distribution costs has been undertaken by CRA as part of the network workstream. Finally, the impact on retailers’ costs has been estimated by KPMG and is discussed in detail in their retail workstream report.
5.1. Smart Meter Scenarios
5.1.1. Identification of costs
The following six categories of transitional costs have been estimated for each of the three smart meter rollout scenarios:
1. meters and their installation;
2. communications;
3. meter data and communications management;
4. market operator systems to manage changes to market settlement information and new metering-related B2B transactions;
5. retailer systems to support the retailer activities expected to be undertaken as a result of the rollout of smart meters in each scenario; and
6. distribution systems to support the distributor activities expected to be undertaken as a result of the rollout of smart meters in each scenario.
In addition, an allowance has been made for program management costs relating to the (SMI) rollout (the direct costs of which are covered by the first three categories above).73
With the exception of items 4, 5 and 6 (which are directly related to market operators, retailers and distributors, respectively), the party who bears each of the above costs will depend on the particular rollout scenario assumed (discussed in section 5.1.4.1 below).
In addition to the initial transition costs, there will also be ongoing operating costs associated with smart meters and their associated infrastructure, including communications operating costs. Further, it is expected that over the twenty year period of the analysis all of the IT components of the infrastructure will need to be refreshed and (in scenarios 2 and 4) there will be a refresh of communication modems which reflects technology advances and the
73 Any transitional costs associated with regulatory changes that may be incurred have not been explicitly factored into
this analysis.

Consultation Report - Cost Benefit Analysis of Smart Metering and DLC
Assessment of Costs
NERA Economic Consulting
33
contestability of metering and meter communications services. As a result, the following two cost categories have also been included in the analysis:74
7. ongoing annual operational costs, based on a rate of 15 per cent of the IT related transitional cost (items 3-6 above). The operating costs associated with communications are based on an estimate of an annual maintenance cost and backhaul data charges; and
8. a modem refresh for scenarios 2 and 4 (which differs depending on scenario and jurisdiction) and an information technology (IT) system refresh in 2020 based on 40 per cent of the original cost.
The incremental IT operational and refresh costs calaculated under (7) and (8) above are, however, discounted by a further 50 per cent for Meter Data Management systems, Retailers and DBs’ systems, reflecting the reality that to an extent the new and changed systems will be replacing similar existing systems. Operating and refresh costs for Network Management Systems and Market Operators’ systems are not discounted, since these are additional to existing systems.
5.1.2. Transitional Costs
In order to identify the transitional costs associated with the smart meter rollout, EMCa developed RFIs to seek cost information from providers of meters and associated communications infrastructure, retailers, distributors, market operators and communications providers. EMCa has then made an estimate of costs based on this industry input, a bottom-up cost analysis of affected systems, as well as data obtained from previous business cases, such as the Victorian Advanced Interval Communications Study. The approach to quantifying the costs associated with each of these categories is set out in detail in EMCa’s workstream report.
The cost of meters is the major component of the cost of a smart metering rollout. In EMCa’s overall transitional cost estimate the cost of meters comprises between 48-62 per cent of the total cost.75 We understand that differences between EMCa’s high and low cost estimates for meters relate to the range of vendor quotes received. Differences in costs between the jurisdictions are largely driven by the different meter styles in those jurisdictions and the rural/urban/remote split, which affects the communications technology adopted (which in turn affects the choice of meter and therefore meter cost). EMCa considers that the cost estimates for meters that they have provided are reasonably certain since they are based on information provided by meter vendors and meter providers and a range of data was received and compared. There is less uncertainty in the cost of the metering device than in the choice of communications technology (which affects the choice of meter).
The meter installation cost is the second largest cost item for a smart meter rollout. Installation costs account for between 18 to 23 per cent of the overall transitional costs. 74 These assumptions are discussed in EMCa Workstream 1Transitional Costs Consultation Report (February 2008),
section 12.4 and 12.5. 75 See EMCa Workstream 1Transitional Costs Consultation Report (February 2008), Executive Summary, page iv. We
note that EMCa distinguishes in its report between transitional costs (which reflect the capital costs associated with the initial rollout) and ongoing operational costs.

Consultation Report - Cost Benefit Analysis of Smart Metering and DLC
Assessment of Costs
NERA Economic Consulting
34
EMCa has advised us that it considers the estimated cost of installations to also have a reasonable degree of certainty, at least in regard to standard installations, as the information has been obtained to a large extent from meter installers and meter providers. The main area of uncertainty in this regard is the expected incidence of difficult installations and the cost of dealing with these, which will not be known until mass rollout installations are well underway.
Therefore, taken together the estimate of meter and installation costs accounts for 71 to 80 per cent of the total transitional cost estimated by EMCa.
The third most important cost category is distributor costs, which account for between 6 and 8 per cent of overall transitional costs. EMCa has noted that its estimates of the cost of distributors’ systems are below those that have been provided by some distributors, though in line with the estimates provided by other distributors. However, EMCa considers that this reflects the narrower scope of the systems that it has costed, compared to the IT programs of some distributors. That is, the incremental systems costs estimated by EMCa are based only on the changes to systems necessary to accommodate smart meters and to realise the associated distributor benefits. EMCa’s view of the distributors’ cost estimates is that these are often difficult to distinguish from systems changes for purposes not strictly related to the introduction of smart metering.
Finally, the fourth most important cost category is the provision of communications. Communications costs account for around 4 per cent of transitional costs. However, there are significant ongoing operational costs for communications where point to point services such as Global Packet Radio service (GPRS), or Public Switched Telephone Network (PSTN) (dial-up) or satellite are required. These are assumed to be required to a greater extent under scenarios 2 and 4. The range of communications costs reflects different assumptions about the technology adopted.
5.1.3. Retailer recurrent costs
KPMG has estimated the impact on retailers’ recurrent costs in relation to each of the rollout scenarios.76
In the short term KPMG notes that there may be increases in customer communications costs (an increase of $2 per customer per annum), call centre costs (an increase of $1.80 per customer per annum) and other costs (an increase of $2 per customer per annum), such as those associated with billing, dealing with customer complaints and general management time devoted to the rollout. KPMG has assumed that these additional costs would apply for three years following the year in which a customer received a smart meter.
In aggregate, the increase in retail costs in scenario 1 is estimated to be between $89 million and $101 million in NPV terms, which is just 2 to 3 per cent of the total cost for rollout under scenario 1 in NPV terms.
76 These retail operating cost estimates are discussed in sections 8.2 and 8.3 of KPMG Workstream 3 Retail Impacts
Consultation Report (February 2008).

Consultation Report - Cost Benefit Analysis of Smart Metering and DLC
Assessment of Costs
NERA Economic Consulting
35
5.1.4. Impact of scenarios on costs
There are differences in the roles of distributors, retailers and the centralised infrastructure provider under each of the alternative smart meter rollout scenarios. This means that the allocation of the cost categories set out above to distributors, retailers and the centralised infrastructure provider will be different for each scenario. We discuss these changes in allocation below.
In addition to a difference in the allocation of costs between scenarios there is also a difference in the level of costs estimated for each scenario. A priori, costs can be expected to differ under each of the three scenarios as a result of:
1. differences in the infrastructure required (including communications infrastructure);
2. differences in economies of scale and scope; and
3. differences in the likely extent of competition in the provision of metering and data services (and the extent to which this competition is more effective than regulation in revealing efficient cost levels).
The extent to which these cost differences are expected to be material is discussed below.
5.1.4.1. Differences in the allocation of costs among scenarios
The cost categories identified above have been allocated to different stakeholders under the three scenarios as set out in Table 5.1 below.

Consultation Report - Cost Benefit Analysis of Smart Metering and DLC
Assessment of Costs
NERA Economic Consulting
36
Table 5.1 Allocation of costs between scenarios
Distributor Retailer Market Operator
Scenario 1 Meters
Meter data & communications
management
Communications
Distributor systems
Retail Systems Market meter & data transactions management
Scenario 2 Distributor systems
Meters
Meter data & communications
management
Communications
Retail Systems
Market meter & data transactions management
Scenario 4 Distributor systems
Meters
Retail Systems
Market meter & data transactions management
Communications
Meter data & communications management
5.1.4.2. Differences in communications infrastructure between scenarios
A key difference between scenarios is the communications infrastructure that is needed to support the smart metering systems in each scenario.
Where the smart meter rollout is distributor-led (scenario 1), EMCa has assumed that in urban areas the communications infrastructure would be mesh-radio for a coverage of 97 per cent with GPRS infilling the remaining 3 per cent. In rural and remote areas the communications technology is assumed to be power line carrier (PLC).77
We note that during the course of this Phase 2 analysis concern has been expressed by some as to whether PLC is viable on rural networks in Australia. This concern is discussed further in EMCa’s transitional cost report.78 EMCa’s view is that there are adequate answers to the concerns raised and therefore that PLC should be considered a viable technology for rural Australia, for the purposes of this analysis. However EMCA has also considered a number
77 EMCa has also considered a sensitivity assuming only 80 per cent urban coverage for mesh radio with the remaining 20
per cent being GPRS. See section 5.9 EMCa Workstream 1Transitional Costs Consultation Report (February 2008). 78 EMCa Workstream 1Transitional Costs Consultation Report (February 2008), section 5.6.2.

Consultation Report - Cost Benefit Analysis of Smart Metering and DLC
Assessment of Costs
NERA Economic Consulting
37
of alternative technology assumptions, in the event that PLC was found not to be viable. Specifically EMCa has considered the following alternative communications assumptions for scenario 1:
Case 1c, 1d and 1e: A mesh radio solution with GPRS for in-fill (3 per cent) for urban customers, with GPRS for rural and remote (1c); 3G for rural and remote (1d); or Wimax for rural and remote (1e).
The results of the cost benefit analysis in this report for scenario 1 adopt EMCa’s base assumption that PLC is viable in Australia. However we have also conducted sensitivity analysis based on EMCa’s alternatives cases 1c, 1d and 1e and report of the results of those in chapters 7 to 14 as relevant.
For the retailer-led scenario (scenario 2), EMCa has adopted four alternative assumptions on communications infrastructure:
Case 2a: A mesh radio solution with GPRS for in-fill (20 per cent) for urban customers, with GPRS for rural non-remote and PSTN (dial-up) access for remote customers;
Case 2b: A GPRS solution for urban customers with GPRS for rural non-remote and PSTN (dial-up) access for remote customers;
Case 2c: A mesh radio solution for urban customers with GPRS for in-fill (3 percent) with PLC for rural and remote customers; and
Case 2d: As for case 2a but with 80 per cent mesh radio and 20 per cent GPRS.
EMCa’s base assumption is Case 2a and this is reflected in the cost estimates included in the cost benefit analysis in this report. However, we understand that there is uncertainty as to whether a mesh radio solution would be suitable under a retailer-led rollout, as it implies either a degree of co-operation between retailers or the involvement of a third-party communications provider able to obtain contractual certainty from the retailers sufficient to underwrite rolling out such a system. Therefore, EMCa has considered the alternative assumptions as sensitivities. The lifecycle communication cost estimates are higher under the GPRS solution (Case 2b) compared with Case 2a which use mesh radio but lower under Case 2c where PLC is used for rural and remote customers rather than a GPRS/PSTN combination, though this is unlikely to be feasible as it would require the distributor to provide and operate the infrastructure. Case 2d assumes a mesh radio rollout, but with retailers choosing to use GPRS to a greater extent, particularly where they do not have reasonable customer density, and this cost lies between case 2a and case 2b.
Finally, for scenario 4, where the rollout is undertaken by a centralised market operator, EMCa has assumed that there is a predominantly mesh radio solution for urban areas which is the same as for Case 2a (although the same alternative sensitivities are also applied). Because of the comprehensive customer coverage, a high proportion will be suitable for mesh radio (as with scenario 1).

Consultation Report - Cost Benefit Analysis of Smart Metering and DLC
Assessment of Costs
NERA Economic Consulting
38
5.1.4.3. Differences in non-communications infrastructure between scenarios
Different scenarios also imply differences in the non-communications infrastructure required to deliver the benefits associated with the smart meter rollout. These differences arise as a result of differences in the roles of the various parties under each of the scenarios, and therefore differences in the requirements for interfaces between these parties.
For example, under the distributor-led scenario (scenario 1), distributors are responsible for managing communications with the meters. As a result, distributor-initiated transactions (such as providing quality of supply information collected by the meter) can be communicated directly to distribution operations, rather than needing to go through the ‘transactions manager’ business-to-business (B2B) hub. In contrast, under the retailer-led scenarios (scenario 2 and scenario 4) there would be a need for additional communications interfaces to provide this information to the distributors.
A key difference among scenarios is the set of assumptions about the number of meter data management (MDM) systems and meter data warehouses that are needed.
In scenario 1, EMCa assumes that there is one MDM system per distributor (in their role as meter data aggregator (MDA)) at a cost of around $9 million to $12 million each, and one meter data warehouse per retailer at a cost of between $4 and $6 million each.
In scenario 2, there is broadly one MDM system for each retailer (due to their responsibility for the provision of MDA services) and a meter data warehouse for each distributor. Given that there is assumed to be a smaller number of retailers acting as MDAs than there are distributors, this therefore results in a reduction in the overall costs of these two systems taken together.
Under scenario 4, the costs are estimated to be lower again, as only two MDM systems are required (one for the NEM market operator and one for the WA IMO), with a meter data warehouse for each distributor. Although the costs of the MDM systems are assumed to be higher in this scenario ($22 million to $29 million), overall the costs of the MDM and data warehouses taken together are lower.
In addition, where there are expected differences in the types of benefits among scenarios different systems may be needed to realise these benefits. EMCa’s report has therefore considered the systems and infrastructure that are required to support the benefits expected from smart metering in relation to each scenario. As discussed in section 6.4, the business efficiency benefits are largely expected to be the same across all scenarios. The main difference in benefits among scenarios relates to the benefits for distributors in relation to outage detection that may accrue to a lesser extent in scenarios 2 and 4. However, the distributors would still need the same systems to realise these benefits, even where the magnitude of the benefits is reduced.
5.1.4.4. Differences in meter costs between scenarios
There is a difference in the unit costs for meters estimated by EMCa for each of the scenarios. This difference arises as a result of two factors:
1. differences in the assumed communications technology between scenarios; and

Consultation Report - Cost Benefit Analysis of Smart Metering and DLC
Assessment of Costs
NERA Economic Consulting
39
2. differences in the implications of communications churn and customer churn under the different scenarios.
The first factor affects the cost of meters compatible with that communications technology.
The second factor affects the assumption regarding the likely approach to integration of the communications modem within the meter for each of the scenarios.
Under scenario 1, EMCa has assumed that the smart meter has integrated communications. This means that in the event that communications systems change the entire meter would need to be replaced. EMCa has concluded that it would be unlikely that distributors would choose to churn the communications system over the period of the assessment, given that they would also have built the communications infrastructure. Therefore there is no churn in meters or communications included in EMCa’s cost estimates for scenario 1.
Under scenarios 2 and 4 retailers have the role of meter provider. EMCa has assumed that in this scenario meters would be installed with separate communications, rather than being integrated. This provides maximum interoperability between meters and communication modems, such that where a customer changed retailer they would be able to also change either the meter, the modem, both or neither. This, in turn, provides retailers with flexibility to offer meter upgrades to customers as part of their competitive strategy, or to retain the existing meter (having reached a commercial agreement with the previous retailer to utilise the meter) but change the communications modem in order to utilise the new retailer’s communications network. We note that retailers themselves may not have an incentive to install meters with separate communication modems, as providing such interoperability has implications for the extent of retail competition. As a result this may be an aspect of the rollout that would need to be mandated, if this rollout scenario were adopted.
In addition, EMCa has assumed that under scenarios 2 and 4 a refresh of the modems is likely during the period of the cost benefit assessment as retailers are likely to want to take advantage of developments in communications systems over the twenty year assessment period.79 Having a separate modem reduces the costs of this refresh as the meter itself does not need to be replaced.
The cost of a meter with a separate modem under scenarios 2 and 4 is estimated by EMCa to be around $20 to $45 higher80 than the cost of a meter with an integrated modem under Scenario 1.
In addition, the cost of meters may differ among scenarios according to the effective useful life of the meter. Some stakeholders argue that under scenario 2 meters are likely to churn more frequently than under scenario 1 because a retailer would want to replace the meter with its own meter when a customer switches retail supplier. An alternative view is that third party metering service providers would engage in separate arrangements with a number of 79 EMCa has assumed that retailers may see commercial advantages in relation to new communications technologies
which are not applicable to distributors and hence communications systems are more likely to be churned under scenarios 2 and 4 than under scenario 1.
80 For the predominantly mesh radio technology assumed for these scenarios. EMCa notes that for GPRS the range is lower – from $0 to $25.

Consultation Report - Cost Benefit Analysis of Smart Metering and DLC
Assessment of Costs
NERA Economic Consulting
40
retailers to minimise or avoid the costs arising from meter churn as customers switch retail supplier.
For the purposes of the cost analysis, EMCa has not included any difference among the scenarios in meter costs arising from churn. This is due in part to the uncertainty about any differences between scenarios for the effective useful life of the meter. In general, however, if a particular scenario led to increased meter churn, then the costs of the smart meters would likely be higher under that scenario compared to an alternative scenario with no or little meter churn.
5.1.4.5. Economies of scale
One of the potential differences among the scenarios is the scope for the achievement of economies of scale. In particular, EMCa has considered whether under a distributor-led scenario the scope for economies of scale in the purchasing of meters and their subsequent installation may be greater than under a retailer-led scenario as a result of the typically larger customer base for distributors compared to retailers.
EMCa has concluded that there are unlikely to be significant differences in the costs among scenarios as a result of economies of scale. The responses from meter vendors have indicated that costs per meter are unlikely to fall considerably for volumes above 250,000 units.81 The retailers supplying most Australian consumers are comfortably of this size.82 As a result, for a particular technology, EMCa estimates that there are no material differences in costs among the three smart metering scenarios. However, to the extent that different communications technologies are more suitable under different scenarios this has implications for the metering costs, as discussed above.
5.1.4.6. Impact on competition in the provision of metering and data services
As discussed in section 4.1, the smart meter rollout scenarios also differ as the result of assumed differences in the role of regulation versus competition in the price-discovery of metering and data services. This in turn raises the possibility of cost differences among scenarios arising from greater competitive pressures in those scenarios where there is greater scope for competition.
A key distinction between the distributor-led and retailer-led scenarios is the assumption about the extent of competition in the provision of meters and metering data management services. Under the distributor-led scenario we have been asked to assume that meters are owned by distributors and purchased through competitive tendering processes from meter providers.83 For the retailer-led scenario the retailer chooses whether to own meters, as in the distributor-led scenario, and purchase meters from meter providers or contract with meter providers to provide metering services, which is likely to include data management services. 81 EMCa Workstream 1Transitional Costs Consultation Report (February 2008), section 3.7. 82 ActewAGL and The Power and Water Corporation are below this size but are also integrated with the distribution
business in the Australian Capital Territory and the Northern Territory (respectively), resulting in the relative ability of retailers and distributors to exploit economies of scale in these jurisdictions being the same.
83 This distinction among the scenarios has been made for convenience. It would be possible to allow for competition in the provision of metering within a distributor-led rollout.
Consultation Report - Cost Benefit Analysis of Smart Metering and DLC
Assessment of Costs
NERA Economic Consulting
41
In the retailer-led scenario there is no presumption that the retailer would own the meters, however, it does assume the role of responsible person as provided in Chapter 7 of the NER.
In the distributor-led scenario, we were asked by the SMWG to assume that the distributor itself provides all of the communications and meter data infrastructure necessary to support smart meters. In the retailer-led scenario these services are assumed to be provided through a competitive market of meter data management providers.
We have not been asked to analyse in detail the feasibility of competition in the meter data management and meter provider markets. To do so would, in itself, be a significant exercise and would require an analysis of the number of existing and potential customer metering suppliers, the potential impediments within the market rules and any business practices that would need to be modified to implement competition in the provision of metering services to end-use customers. The costs of this would then need to be assessed against the benefits to determine whether competition in the provision of metering services was feasible. We are conscious, however, that implicit in any analysis of the costs and benefits of smart meters is an assumption about the degree to which competition may result in lower costs for the provision of meters and particularly metering communications and data management functions.
EMCa has not incorporated any differences in the costs of meters among scenarios as a result of the greater scope for competition in the provision of metering and data services in the retailer-led scenarios (scenarios 2 and 4).
5.2. Direct Load Control rollout (Scenario 3)
EMCa has also estimated the cost of a rollout of a non-smart meter DLC capability under scenario 3.
The elements of the cost estimates for scenario 3 are:
the cost of the demand response enabling device (DRED)84 that would need to be installed in the air-conditioners;
the installation costs where a DRED is retro-fitted into an existing air-conditioner;
the cost of installing a DRED in new air-conditioners;
the cost of the supporting back-end systems that distributors would require in order to be able to interact with the DREDs; and
the cost of the retailer back-end systems necessary to interface with the distributor in order to ‘call’ a DLC event.
In relation to the technology used to facilitate DLC, EMCa has made two separate assumptions. In New South Wales and Queensland EMCa has assumed that a DLC program
84 A DRED can also be fitted to devices where smart meters are installed utilising the smart metering communication
infrastructure. See discussion in section 16.2 in relation to functionality 15.

Consultation Report - Cost Benefit Analysis of Smart Metering and DLC
Assessment of Costs
NERA Economic Consulting
42
would be facilitated by the distributors’ existing ripple control networks in line with the current trials being conducted by distributors in these states. For all other jurisdictions EMCa has assumed that an alternative FM radio architecture would be used which reflects the approach that ETSA Utilities has taken in South Australia.
EMCa has estimated device costs for air-conditioners at between $80 to $100 per DRED device. Installation costs of retro-fitting a DRED in existing air-conditioners in these jurisdictions requires a specific home visit and is estimated at $80 to $180 per device, leading to a total installed cost per device of $160 to $280 per device. These installed device costs have been based on information provided to EMCa by distribution businesses currently involved in trials of DLC.
For new air-conditioners EMCa has assumed the DRED would be installed in all new air-conditioners at the customer’s site (rather than in the factory before sale). To the extent that this installation could be undertaken by the same person who is installing the air-conditioner (rather than requiring a separate home visit), EMCa has assumed that this would reduce the overall installation cost compared to that assumed for a retrofit to $40 to $90 per device. The total installed cost per device for new air-conditioners is therefore estimated to be $120 to $190.
EMCa has not been able to obtain an estimate of device costs for pool pumps. NERA has spoken to distributors currently involved in DLC trials involving pool pumps and understands that the installed costs of devices are likely to be comparable to or lower than the installed costs of air-conditioner devices (because access issues are likely to be less difficult for pool pumps). As a result, we have adopted EMCa’s estimate of the installed device costs for air-conditioners to also apply to devices for pool pumps. Similarly we have adopted EMCa’s estimate of operating costs for DLC of air-conditioners to also apply to pool pumps. We note that there is a high degree of uncertainty regarding this cost. However, the overall results of the cost benefit analysis for scenario 3 are not affected to a significant extent by the adoption of this cost assumption.

Consultation Report - Cost Benefit Analysis of Smart Metering and DLC
Assessment of Benefits
NERA Economic Consulting
43
6. Assessment of Benefits
This section provides a high level summary of the benefits expected to result from a smart meter rollout or a non-smart meter DLC rollout.
Specifically, we set out the different types of benefits (business efficiencies, service quality improvements and demand impacts) and discuss how these benefits may vary according to the rollout scenario adopted.
The detailed discussion of each of the benefits estimated is contained within the relevant workstream report. For network efficiencies this is the stream 2 report prepared by CRA, whilst for retail efficiencies it is the workstream 3 report prepared by KPMG.
6.1. Business Efficiencies/ Service Quality Improvements
A rollout of smart metering is expected to lead to a variety of business efficiency benefits for both distribution businesses and retail businesses. These business efficiency benefits would not accrue under a non-smart meter DLC rollout (i.e. scenario 3).
6.1.1. Distribution businesses
CRA has analysed the business efficiency benefits expected to accrue to distribution businesses and the party responsible for metering (which differs depending on the rollout scenario adopted).
6.1.1.1. Key business efficiency benefit categories
The key benefits (in quantitative terms) identified by CRA are:85
1. The avoided costs of routine manual meter reading;
2. The avoided cost of special reads (e.g. when customers move into or out of a premise);
3. The avoided costs of manual disconnections and reconnections;
4. Reductions in calls to faults and emergency lines; and
5. Avoided cost of customer complaints about voltage quality of supply.
These benefits flow from the routine daily remote reading, remote connect/disconnect, quality of supply recording and meter loss of supply detection and outage detection functionalities of smart meters. Taken together these five benefit categories account for 67 to
85 We note that the CRA’s Network Impact Consultation Report presents the avoided cost of meter replacement programs
as a network benefit category. We discuss this benefit separately in this report. As a result, the distribution efficiency benefit numbers discussed above exclude this component. They also exclude the benefit associated with the change in unserved energy (USE) which we have assigned to customers as discussed separately under 6.1.2.

Consultation Report - Cost Benefit Analysis of Smart Metering and DLC
Assessment of Benefits
NERA Economic Consulting
44
74 per cent of the total annual distribution business efficiencies identified (on a national basis).86
CRA assume that these benefits accrue in all jurisdictions. However, the magnitude of these benefits varies among jurisdictions according to differences in characteristics; for example, the number of special reads, or whether customers are usually disconnected on moving-out (which affects the benefits from remote connection/reconnection).
In addition, the ability of a distributor to obtain a particular benefit may also be affected by jurisdictional regulatory or legislative requirements. For example, in South Australia we understand that currently a representative of ETSA Utilities must be present when a property is reconnected which would result in remote reconnections still necessitating a site visit. Similar regulations also apply in Queensland. Particular jurisdictional differences are discussed in sections 7 through 14.
In relation to the degree of certainty associated with the benefit estimates for each of these key categories we note that CRA’s estimates of avoided costs of routine reading and the avoided cost of special reads are based to a large extent on information provided by the distributors, whilst the avoided costs of manual connections and disconnections are based on published regulated charges (for the low end benefit estimates).87 CRA therefore considers that these benefit categories have a relatively low degree of uncertainty (however, we discuss below a specific issue regarding the avoided costs of special reads).
The estimated benefits from the avoided costs of investigating customer complaints and the reduction in calls to fault and emergency lines have a higher degree of uncertainty. Evidence or estimates as to the likely change in customer complaints or calls to fault and emergency lines was not available from Australian distributors. The estimates used have been based on CRA’s own view of the reduction in costs that may be possible.88
There is a further issue worth noting in assessing the benefits from the avoided cost of special reads. The estimates provided by CRA for the avoided cost of special reads relates to activity-based costing information provided by distributors, or to distributors’ published charges. These cost estimates do not reflect the marginal cost of the service but are calculated on the basis of the total systems requirements to provide special reads (e.g. they incorporate the costs of the back-end systems and personnel that are also required). Marginal costs for a special read may be in the region of $4 per read, based on information we have been provided by one distributor. Basing the benefit on the avoided total cost rather than the avoided marginal cost is only appropriate if the cost estimates for back-end systems calculated by EMCa under the transitional cost workstream incorporates the costs of the back-end systems to support special reads, including non-systems costs (i.e. labour costs) that 86 For New South Wales and Queensland CRA has also estimated substantial benefits associated with the avoided capital
costs of replacing their ripple control systems at the end if their lives. These benefits are discussed separately and are not included within the calculation reported above.
87 Distributors have commented to CRA that their actual costs are in some cases substantially higher than their published charges for special reads and manual disconnections and reconnections. This is reflected in CRA’s high range estimates.
88 See discussion in CRA Workstream 2 Network Impact Consultation Report (February 2008), section 11.2 and section 12.2.

Consultation Report - Cost Benefit Analysis of Smart Metering and DLC
Assessment of Benefits
NERA Economic Consulting
45
would also be required to deliver the special reading functionality under smart metering. Some distributors have raised concerns with us that the benefits from avoided special reads are overestimated in the CRA report as a result of this issue.
We have discussed this issue with both CRA and EMCa and understand that their back-end system cost estimates do reflect the cost of continuing to support special reads and that they consider that it does provide the total costs that would be necessary to provide a special read.
6.1.1.2. Other business efficiency categories
In the cases of New South Wales and Queensland, the ability of smart meters to facilitate load management through a dedicated control circuit results in additional benefits because the existing ripple-control systems present in those jurisdictions would not require replacement. CRA has assumed that the existing systems in New South Wales will need to be replaced in 2011/12, whilst those in Queensland (which are newer) will need to be replaced around 2019/20. This results in a once-off capital benefit which, in NPV terms, represents a further 8 to 12 per cent on top of the NPV of the total annual business efficiency benefits calculated for New South Wales and 4 to 5 per cent for Queensland.
In addition to the benefits identified above, CRA has also quantified a range of other potential business efficiency benefits, applying across one or more jurisdictions. Details of these additional benefit categories are set out in CRA’s network workstream report. One significant remaining category is the estimate of the benefit from reduced post-storm restoration costs. At the ‘high’ end of CRA’s assumptions this accounts for a further 6 per cent of the total annual efficiency benefits (although it is only 2 per cent at the low end).
For benefits associated with the avoided cost of installing additional metering for customers installing own-generation facilities (typically PV cells), we note that the party that accrues these benefits will depend on the current charging arrangements. In some jurisdictions (South Australia, New South Wales, Queensland, Western Australia and the Northern Territory), customers that are installing PV cells are currently required to pay for the associated metering. Therefore, the avoided cost of import/export metering represents a consumer benefit in those jurisdictions. In other jurisdictions (Victoria, Tasmania and the Australian Capital Territory), it is the distributor that currently pays and so the avoided cost represents a distributor benefit.
Similarly in relation to the avoided cost of special reads and connections/disconnections, whether it is the distributor or the customer that benefits depends on who currently pays for these which vary by jurisdiction (and often also by distributor within a jurisdiction).
6.1.2. Customer service improvements
In relation to service quality improvements, CRA has calculated the reductions in unserved energy (USE) as a result of quicker detection of outages and quicker service restoration times. This benefit arises as a result of the meter loss of supply detection and outage detection functionality and represents a benefit to consumers. The magnitude of this benefit is relatively significant representing a further 3 to 9 per cent annual benefit in addition to the total national annual business efficiency benefits calculated.
Consultation Report - Cost Benefit Analysis of Smart Metering and DLC
Assessment of Benefits
NERA Economic Consulting
46
6.1.3. Retail efficiencies
KPMG has calculated the potential business efficiency benefit to retailers resulting from the smart metering rollout. These business efficiency benefits relate to:
a reduction in call-centre costs as a result of fewer high bill enquires;
a reduction in bad-debt and working capital requirements;89
a reduction in hedging costs, due to interval data leading to improved forecasting;90 and
other cost reductions, including costs for data validation and settlement and management time.
In relation to the reduction in call-centre costs KPMG has estimated that this benefit will accrue three years after a customer has had a smart meter installed. As discussed in section 5.1.3, KPMG has estimated an initial increase in retailers’ recurrent costs (including call centre costs) for the three years immediately following the year in which the customer receives a smart meter.
In total, KPMG has estimated a reduction in retailer business costs arising from the introduction of smart meters of between $3.70 and $7.40 per customer, of which between $1.80 and $3.60 is an overall economic benefit (as distinct from a transfer). This implies total cost savings of $98 million to $196 million in NPV terms for retailers. This benefit is between 4 to 6 per cent of the total estimated business efficiencies.
KPMG notes that there is considerable uncertainty regarding the quantification of some of these benefits, due to a lack of information.91
6.2. Avoided Metering Costs
The transitional cost estimates made by EMCa include the full costs of the meters and installation associated with a smart meter rollout. As a result, in estimating the net benefits of a smart meter rollout it is also necessary to take account of the costs that distributors would otherwise have had to incur to replace meters and install new meters over the period of the assessment. This represents an avoided cost associated with the smart meter rollout. Subtracting this avoided cost from the transitional metering cost estimated by EMCa yields an estimate of the incremental change in metering costs associated with rolling out smart meters.
89 Working capital is treated as a transfer in our analysis; bad debt is also treated as a transfer but with an associated
transaction cost saving (KPMG has estimated that the transfer element is $0.50 per customer whilst the transaction cost saving is $0.10 per customer).
90 KPMG has also calculated the expected reduction in hedging costs as a result of the changes in demand associated with TOU and CPP tariffs and DLC. These are included as part of the demand-response benefits rather than business efficiency benefits.
91 KPMG Retail Impact Consultation Report (February 2008), section 2.1

Consultation Report - Cost Benefit Analysis of Smart Metering and DLC
Assessment of Benefits
NERA Economic Consulting
47
As discussed in section 3.4, we have calculated the avoided metering cost on the basis of two counterfactuals. The first assumes a continuation of accumulation metering, whilst the second assumes the actual policy for new and replacement metering in each jurisdiction.
We note that avoided metering costs represent a significant proportion of the benefit associated with a smart meter rollout, representing between 39 and 44 per cent of the overall benefits estimated.
In estimating the benefit associated with avoided metering costs, CRA has considered the difference in meter and installation costs between smart meters and the counterfactual. In the case of future new and replacement meters CRA has estimated a higher installation cost in relation to the counterfactual compared with smart meters. This higher cost reflects longer installation times (as a result of a higher proportion of difficult installations), higher associated customer service costs and differences in the assumed mix of the meter type. The assumptions in relation to installation costs are set out in detail in CRA’s network benefits workstream report.92
6.3. Demand Response Benefits
The second stream of benefits associated with a smart meter rollout arises from the potential for smart meters to affect both the level and timing of customer demand. A non-smart meter rollout of DLC also has the potential to influence customer demand, and so scenario 3 also generates benefits from demand response.
Smart meters have the potential to influence customer demand via two mechanisms:
i. Through the introduction of time-varying tariffs; and/or
ii. Through the direct control of certain appliances in key periods, where smart meters incorporate a DLC functionality.
In our analysis a non-smart meter rollout of DLC capability has the potential to influence customer demand via the second of these mechanisms only; i.e. we assume that a non-smart meter DLC program will not include any time of day differences in electricity pricing.
Both time varying tariffs and DLC can lead to reductions in electricity consumption in peak periods. Time varying tariffs may lead to increases in consumption in off-peak periods.93 Total energy consumption by a participating customer may increase or decrease. Such changes in customer demand in turn lead to the following potential benefits:
i. Deferral of the need for peak network augmentation;
ii. Reduction in retailers’ hedging costs as a result of reductions in peak wholesale prices;
92 CRA Workstream 2 Network Impact Consultation Report (February 2008), Appendix G 93 For the purposes of our analysis in relation to demand response we have modelled direct load control as a reduction in
peak consumption with no subsequent change in off-peak consumption. This reflects advice that DLC does not affect the thermal comfort of customers, and therefore customers would be unlikely to respond through increasing off-peak consumption to off-set higher household temperatures resulting from the cycling of their air-conditioner.

Consultation Report - Cost Benefit Analysis of Smart Metering and DLC
Assessment of Benefits
NERA Economic Consulting
48
iii. Deferral of peak generating capacity and reductions in the level of USE; and
iv. Generation operating costs and carbon emissions, as the result of changes in the pattern of electricity market dispatch.
The first three of these benefits depends on the impact of a smart meter rollout or of a non-smart meter DLC rollout on the level of peak demand, either at times at which the network is constrained or at times of peak wholesale prices.94
The fourth category of benefits depends on the impact of a rollout on the timing of demand (i.e. whether demand is shifted from peak to off-peak periods, simply reduced in peak periods, or reduced in both peak and off-peak periods), which in turn impacts the pattern of electricity market dispatch. The impact on carbon emissions will depend critically on the impact of the change in demand on the pattern of generation between higher-carbon intensive generation sources (i.e. coal generators, which currently typically operate on the margin in off-peak periods) and lower-carbon intensive sources (i.e. gas generators, which are currently typically operate on the margin in peak times) and could either reflect a reduction in emissions (i.e. a benefit) or an increase in emissions (i.e. a cost). This is discussed further in Box 6.1.
94 Or localised peak demand, in the case of network deferral. Network augmentation can only be deferred where the
reduction in peak demand relieves an expected network constraint, which will occur at a sub-station level, rather than at an aggregate level. This is discussed further in CRA Workstream 2 Network Impact Consultation Report (February 2008).

Consultation Report - Cost Benefit Analysis of Smart Metering and DLC
Assessment of Benefits
NERA Economic Consulting
49
Box 6.1: Impact on Greenhouse Gas Emissions One of the MCE objectives against which alternative rollout scenarios are to be assessed is the promotion of greenhouse benefits.
The effect of a smart meter rollout on greenhouse gases will depend critically on the impact on demand, and in particular:
the extent to which the introduction of TOU and CPP tariffs shifts demand from peak to off-peak periods versus reducing overall consumption;
whether smart meters also result in an energy conservation impact; and
whether smart meters also enable DLC.
Peak and off-peak tariff periods are typically designed around times of high wholesale prices and high network utilisation. Currently in the NEM and the Western Australian Market, off-peak electricity generation is more carbon-intensive than peak generation. In off-peak periods the marginal plant is typically a higher-emitting coal generator whereas in peak periods the marginal plant is more likely to be a lower-emitting gas generator. A shift of demand from peak to off-peak periods may therefore result in an increase in overall emissions, as higher-emitting generation is being substituted for lower emitting generation. The actual outcome in terms of emissions will depend on the marginal plant that is operating in the peak and off-peak periods, which will differ between jurisdictions. As a result, whilst shifts in demand from peak to off-peak periods may result in deferral of the need for additional investment in peak generation or peak network capacity and/or a reduction in USE, they may also result in a higher level of carbon emissions. This is particularly true in the near-term. In the longer-term, the introduction of a carbon price is likely to discourage the use of carbon-intensive fuel and may encourage investment in cleaner forms of base-load generation depending on the cost of cleaner technologies relative to the carbon price. This issue is discussed further in CRA’s Stream 5 Market Report. From a carbon emissions perspective it is therefore important to consider the overall reductions in consumption that are achieved, as well as the shifts in consumption. Shifts in consumption in the absence of an overall conservation effect are unlikely to be effective in reducing emissions. This issue is recognised in a recent publication by the Total Environment Centre (TEC).95 Theoretically, it would be possible to define peak and off-peak tariff periods to target high and low emission periods, in order to maximise the reduction in carbon emissions that could be achieved. However, any assumption regarding the introduction of such tariffs would be highly speculative, given that tariffs are not currently structured in this way and that retailers are likely to have little commercial incentive to introduce such products. Any conservation effect engendered by smart meters would result in an unambiguous reduction in greenhouse emissions, as conservation reduces demand rather than shifting it. A direct conservation effect may result either from increased energy efficiency awareness as a result of the introduction of TOU tariffs and CPP, or may be facilitated by the inclusion of an interface with a HAN (functionality 16) within the smart meter specification which would allow for the provision of an IHD. The potential for an IHD to produce a demand conservation effect is discussed further in section 16.2.1. Similarly, the effect of DLC facilitated by smart meters (where either functionality 15 or 16 is incorporated in the smart meter specification) and of a non smart meter DLC rollout on greenhouse emissions is less ambiguous, as when DLC load is curtailed rather than being shifted. When a customer has their air conditioning cycled they are unlikely to run their air-conditioner for longer to ‘make-up’ for the interruption.96 We would therefore expect the effect on greenhouse emissions from DLC to be unambiguously positive.
95 Advanced Metering for Energy Supply in Australia, Energy Futures Australia, prepared for Total Environment Centre,
17 July 2007, p56-61. The potential for reductions in greenhouse gas emissions discussed in the TEC report are based on a view of a potential overall reduction in total energy use of between 4 and 10%.
96 This relies on the assumption that DLC does not impact the thermal comfort of program participants.

Consultation Report - Cost Benefit Analysis of Smart Metering and DLC
Assessment of Benefits
NERA Economic Consulting
50
In estimating the impact of a smart meter or DLC rollout on demand it is necessary to make assumptions on the following:
i. The tariffs that will be offered by retailers following the rollout of smart meters or a DLC alternative;
ii. The expected take-up rates for those tariffs; and
iii. The change in consumers’ demand profile in response to the tariffs offered.
The key assumptions that have been adopted in this analysis are set out in Box 6.2. The justification for these assumptions and the details of the relevant analysis are contained in the retail and consumer impact workstream reports prepared by KPMG and NERA, respectively.
Box 6.2: Demand Response Benefits – Key Assumptions Smart meters (residential customers)
Under the smart meter rollout scenarios, retailers are assumed to offer flat tariffs, TOU tariffs and TOU tariffs with a CPP element to residential customers. Take-up rates are assumed to be the same across jurisdictions and under each of scenarios 1,2 and 4:
flat tariff: take-up of 57.5 per cent;
TOU tariff: take-up of 35 per cent; and
TOU tariff with a CPP element: take-up of 7.5 per cent.
Note that these assumptions apply where smart meters are not assumed to have DLC capability (functionalities 15 and 16). Where smart meters are assumed to incorporate DLC capability the take-up rates become:
flat tariff: take-up of 55 per cent;
TOU tariff: take-up of 30 per cent;
TOU tariff with a CPP element: take-up of 7.5 per cent; and
DLC tariff with TOU: take-up of 7.5 per cent.
Residential consumers’ demand response was estimated based on elasticities drawn from the Californian State Pricing Pilot.97
A ‘high demand response’ case was also considered that included:
an increased take-up rate for the TOU tariff with a CPP element of 15 per cent; and
an additional 3 per cent demand conservation effect applied across the day for all customers on either TOU alone or a TOU tariff with a CPP element.
Smart meters (small commercial customers)
Retailers are assumed to offer flat tariffs and TOU tariffs to small commercial customers. Take-up rates are assumed to be the same across jurisdictions and under each of scenarios 1,2 and 4:
flat tariff: take-up of 60 per cent;
97 CRA, Impact Evaluation of the California Statewide Pricing Pilot, March 2005.

Consultation Report - Cost Benefit Analysis of Smart Metering and DLC
Assessment of Benefits
NERA Economic Consulting
51
TOU tariff: take-up of 40 per cent.
Small commercial customers’ own-price elasticity was estimated to be half of that of residential customers, whilst their cross price elasticity was assumed to be zero, based on evidence from a number of studies.98
No ‘high demand response case’ was considered for small commercial customers, as a result of their lower assumed responsiveness.
DLC (Scenario 3)
Under scenario 3, DLC tariff options are assumed to be offered to customers for their air-conditioners and pool pumps:
the take-up rate is assumed to be 10 per cent (as a proportion of the overall population);99
air-conditioners are assumed to be cycled at 50 per cent for up to 6 hours on up to 15 occasions during the year; and
customers are paid $75 a year to participate in the programme.
A ‘high demand response’ case was also considered that included an increased take-up rate of 20 per cent (as a proportion of the overall population). Source: NERA Stream 4 Report Section 3.2 and Section 5.1; KPMG Stream 3 Report Section 6 and Appendix A
Overall, reductions in peak demand of between 21.5 and 10.6 per cent were estimated for customers on CPP tariffs, across the jurisdictions. Customers on TOU tariffs were estimated to reduce their consumption by between 1 and 5.8 per cent in peak periods. However, these reductions reflect shifts in demand from peak to off-peak periods, rather than overall energy conservation.
When combined with the take-up rate assumptions the overall impact on system peak demand and overall consumption is relatively low, particularly for the base demand response case. As a result, the demand response benefits estimated are of a lower order of magnitude than the business efficiency benefits in all jurisdictions.
6.3.1. Network deferral
Network deferral is a significant driver of the overall demand-side benefits.
CRA has calculated the potential extent of network deferral on the basis of valuing each kVA of demand reduction (at between $130 to $165 per kVA, depending on the jurisdiction). CRA has then applied a 25 per cent reduction to this quantum to reflect its view of the uncertainty surrounding the extent of network deferral that may actually be expected to accrue.
98 See for instance ESC, Installing Meters for Electricity Customers – Costs and Benefits – Position Paper, November
2002, p 85 and ESCOSA, Assessment of Demand Management and Metering Strategy Options, August 2004, p.25. 99 The 10 per cent take-up rate is in relation to the overall population and translates into a higher take-up rate amongst
only those customers that are eligible for DLC (i.e., those customers with an air-conditioner), which depends on the assumed penetration of air-conditioners in each jurisdiction in a given year. For example for Queensland a 10 per cent take-up rate for the entire population is equivalent to a 12.5 per cent take-up rate amongst those with airconditioners whilst in Victoria it is equivalent to 14 per cent (assuming airconditioning penetration rates in 2016 in both cases).

Consultation Report - Cost Benefit Analysis of Smart Metering and DLC
Assessment of Benefits
NERA Economic Consulting
52
Network deferral uncertainty arises as a result of the localised nature of network constraints. For the smart meter rollout scenarios there is also uncertainty in relation to the mechanism by which network constraints become reflected in tariff signals, given that the structure of retail tariffs faced by customers is determined by retailers. This uncertainty is discussed further in Box 6.3.
CRA has also assumed that the value of a kVA of deferral is not realised until after a lag following the year it is first achieved. This reflects CRA’s view that the additional quantum of peak demand reduction is not large enough in any year to be utilised. In addition, for CPP and TOU tariffs distributors would need to observe the peak demand reduction achieved over a number of years in order to have sufficient comfort that it was ‘firm’ and would therefore allow network deferral. CRA’s assumption is for demand reductions to become useful following a three year lag. This further decreases the percentage of implied kVA reduction.
Taken together, these assumptions imply that 67 per cent of the total implied kVA reduction translates into a deferral of network augmentation. 100
CRA has applied this assumption to both demand reductions from CPP and TOU tariffs and demand reductions from DLC. In the case of DLC, the reduction in demand is controllable by the distributor, and does not rely on customer response as is the case with CPP. However, CRA notes that to achieve a deferral of network capacity augmentation, demand response (whether through DLC or CPP and TOU tariffs) needs to achieve a threshold level equal to at least one year’s load growth on the part of the system to be augmented. While every kVa of demand reduced by DLC can be considered firm because it can be dispatched by the distributor, it may still require some time to achieve the penetration level required to effect the deferral. Demand response from TOU tariffs and CPP, by contrast, is not firm. While the distributor may be able to send the price signal, it cannot guarantee the demand response will follow - that depends on customers’ decisions. The distributor may come to regard the response to its price signals as firm (most likely on the basis of a proportion of the overall connected load that receives the signal) after observing the effect of customers’ decisions over time. Therefore, in addition to meeting the threshold required for any particular deferral, price signals will need some time to demonstrate their repeatability in order for distributors to count on them with regard to network capacity planning. CRA has used a three-year delay of the demand response schedule to combine and simplify the impact of these considerations in assessing the network benefit of demand response from DLC and TOU tariffs and CPP.
100 Assuming a discount rate of 8 per cent.

Consultation Report - Cost Benefit Analysis of Smart Metering and DLC
Assessment of Benefits
NERA Economic Consulting
53
Box 6.3: Pass-through of Network Signals in Retail Tariffs In all jurisdictions customers below 160MWh currently receive a single bill from their retailer covering both retail charges and network charges. The distribution business charges the retailer, which then passes costs onto the end-use customer. However, in passing through network charges the retailer need not preserve the structure of charges levied by the distributor. In many cases retailers choose to bundle network tariffs with the retail component of the tariff, with the result that customers do not see the actual network tariffs they face.
There is therefore an issue as to how distributors’ network pricing signals, and in particular the ability for distributors to call CPP events, are practically reflected in retail tariffs.
The results presented in KPMG’s Phase 1 retailer impact report indicated that the majority of retailers would be unlikely to pass-through network pricing signals to end-use customers, due to concerns regarding the complexity of tariffs.101 Further discussions during Phase 2 of the analysis confirmed this view, but also highlighted that the more widespread the changes in distribution tariff structure the greater the risk to retailers from not passing through the price signals, and the more likely retailers would be to try to pass through network tariff structures.
In relation to CPP events, it may be possible for a distributor to pay a retailer to allow it to ‘call’ CPP events when required for network reasons. The distributor would fund this payment from the value to it of the network deferral achieved. However, in agreeing to this arrangement the retailer would need to consider its lost value from losing the ability to call a CPP event to avoid peak pool prices, given that it cannot be certain that the time at which a distributor would want to call a CPP event for network management reasons would coincide with peak wholesale energy prices. Retailers would only rationally give up their right to call a CPP event where they received compensation from distributors that at least matched the foregone value to retailers.
It has been suggested to us that a potential alternative to realise the benefits in relation to network augmentation would be to mandate via the NER that distribution network tariffs must have a TOU and/or CPP structure. However, the mandating of tariffs is likely to have unintended consequences, as distributors need not set ‘sensible’ tariff levels within the required structure where they did not wish to. This would also run counter to what has been a general move towards placing more responsibility on businesses for their own tariff structures, rather than forensic regulation.
To the extent that network signals are not passed through to final retail tariffs this would reduce the benefits associated with network deferral calculated for a smart meter rollout. This should be borne in mind in reviewing the results of the analysis presented in this report.
6.3.2. Market benefits (including greenhouse)
CRA has estimated the benefits associated with changes in the operation of the NEM as a result of customer demand response associated with a rollout of smart meters or a DLC alternative. These benefits include the deferral of peak generation investment, changes in USE, changes in generators’ operating costs and changes in greenhouse gas emissions.
In the base demand response case the greatest market benefits arise from the reduction in the level of USE.
101 KPMG, Workstream 3 Retail Impacts Consultation Report (February 2008), pg19.

Consultation Report - Cost Benefit Analysis of Smart Metering and DLC
Assessment of Benefits
NERA Economic Consulting
54
In the high demand response case, with higher uptake rate assumptions and an additional energy conservation effect,102 CRA has estimated a significant decrease in generation operating costs and also a significant reduction in the cost of greenhouse gas emissions in addition to reductions in USE.
CRA comments in its report that it is not clear how quickly and to what extent the generation investment community will explicitly take into account the projected impact of smart metering infrastructure on peak demand and energy consumption on its investment decisions.103 CRA has concluded that this uncertainty, coupled with the relatively modest impact on demand arising from a rollout of smart meters or of a DLC alternative, is such that generation investment decisions are likely to remain unaltered. As a result, the benefit associated with a deferral of additional peak generation investment has been assessed by CRA to be zero.
We note that CRA has adopted two approaches to valuing the change in generator operating costs: one based on underlying fuel costs and one based on ‘market offer costs’.104 The second approach recognises that generators in the NEM typically bid a small part of their capacity into the market at prices significantly above their operating costs. Due to the market-clearing price basis of the NEM when these prices are accepted they set the price for the whole electricity market in that period. The value of the change in generator offer costs from a rollout of smart meters is estimated by CRA to be greater than the value of the change in underlying fuel costs. The difference represents a wealth transfer between generators and retailers/customers.105 We have incorporated into our overall cost benefit analysis the change in operating costs calculated by CRA on the basis of underlying fuel costs. However, we note that the market operating cost benefit would increase if the market offer approach was adopted.
The expected carbon emission reductions resulting from CRA’s modelling analysis do not steadily increase over the study period.106 Emissions marginally increase in the base smart meter demand response case until 2010, whilst the level of emissions fluctuates in the other demand response cases. The level of emissions then falls steadily to 2019 in all cases.107 Emissions reductions continue to 2030 (though not to the level achieved in 2019).108 In scenario 3 (non-smart meter DLC), there is a similar fluctuating pattern of emissions reductions.
102 The additional conservation impact relates only to the smart meter rollout scenarios, as it is assumed to be arise as a
result of greater consumer awareness as a result of facing time-varying tariffs. 103 See the discussion in CRA Workstream 5 Market Impact Consultation Report (February 2008), section 4.2 104 See the discussion in CRA Workstream 5 Market Impact Consultation Report (February 2008), section 4.2 105 Although retailers may benefit from lower electricity prices initially, it is expected that retail competition will result in
this benefit ultimately being passed through to consumers. 106 CRA Workstream 5 Market Impact Consultation Report (February 2008), Section 4.3.2, Table 12. 107 With the exception of 2012 for the base case and 2011 for the retrofit DLC case 108 In the high demand response case, the reversal of steady increases in carbon emission reductions does not occur until
2030.

Consultation Report - Cost Benefit Analysis of Smart Metering and DLC
Assessment of Benefits
NERA Economic Consulting
55
We understand from CRA that in all of these cases the fluctuation in emissions reductions is the result of the fact that in the last 10 years of the study period the demand response made possible by smart meters (i.e. CPP and TOU) has flattened the load curve to the point where, even with the (rising) carbon price, coal generation increases (as a percentage of total send out) compared to gas. This is a reflection of the fact that new entrant efficient coal units can achieve a higher utilization and despite the carbon cost these are able to compete with gas generation based on the total cost of production
6.3.3. Retailer benefits
Changes in the level of peak demand are also associated with benefits to retailers as a result of the implied reduction in peak wholesale market costs, and the ability to use CPP products to avoid hedging costs. A typical retailer faces uncertainty about both the quantity of energy its customers will use in a given hour and the market price of energy in that hour. Retailers can manage the risk associated with this volume and price risk through hedging arrangements.
KPMG has estimated the value to retailers in avoiding hedging costs as a result of the impact of the rollout scenarios on peak demand, as estimated by NERA.109 The bulk of the reduction in hedging costs is treated as a transfer in our overall analysis (see section 3.7), with the exception of a 2 per cent reduction in transaction costs which reflects an overall reduction in costs.110
6.4. Impact of Scenarios on Benefits
Benefits have been estimated for each of the three smart meter scenarios as well as the non-smart meter DLC scenario.
For scenario 3, the only benefit categories that apply are the demand response benefits. That is, there are no business efficiency benefits or avoided metering costs associated with scenario 3.
The demand response benefits are larger under scenario 3 than under the smart metering scenarios because the rollout for scenario 3 is assumed to take place over three years rather than six years for smart meters.111 As a result, demand response benefits begin to be realised sooner for the DLC scenario than under the smart meter scenarios.
There is also a higher assumed uptake rate for DLC under scenario 3 where no other ‘energy smart’ tariffs are offered than has been assumed for CPP under the smart metering scenarios, where TOU tariffs are also available. Specifically, the uptake rates assumed for scenario 3 are 10 per cent rather than 7.5 per cent in the low demand case and 20 per cent rather than 15 per cent in the high demand case. Since CPP and DLC both act to reduce peak demand, 109 Retailer’s hedging costs may also change as a result of better forecasting, based on the availability of interval data.
This benefit is discussed under business efficiency benefits in section 6.1.3. 110 The 2% assumption has been provided by KPMG, see section 8.4.1 KPMG, Workstream 3 Retail Impacts Consultation
Report (February 2008). 111 For Victoria and Western Australia shorter rollout periods have been assumed for smart meters – see discussion in
section 4.2.1.

Consultation Report - Cost Benefit Analysis of Smart Metering and DLC
Assessment of Benefits
NERA Economic Consulting
56
leading to the potential for network deferral, the amount of network deferral will be higher under scenario 3 than under the smart meter scenarios (in the absence of smart metering functionality that enables DLC – see discussion in section 16.2).
6.4.1. Allocation of benefits
For the smart metering scenarios, the allocation of some of the benefits categories will change between scenarios, as is the case with costs. Specifically, business efficiency benefits associated with the role of meter provider are allocated to distributors under scenario 1 but retailers under scenarios 2 and 4. These benefit categories are summarised in Table 6.1 below.
Table 6.1 Benefits accruing to the meter provider
Functionality Benefit
2,9. Remote reading daily reading Avoided cost of routine reading
Avoided cost of special reads
11. Export/import metering Avoided cost of import/export metering
12. Remote connect/disconnect - Case B Avoided cost of prepayment metering
6.4.2. Business efficiency benefits
CRA has estimated that the business efficiency benefits are expected to be largely the same across all scenarios. The key exception is the benefits for distribution businesses associated with the reduction in calls to faults and emergencies, the reduced cost for post-storm restoration and the avoided cost of customer complaints about loss of supply that turn out not to be loss of supply. These benefits all arise as a result of the meter loss of supply detection functionality of smart meters.
CRA has assumed these to be benefits for distributors under scenario 1 that would not arise to the same extent under scenarios 2 and 4. CRA provide a number of rationales for this assumption. The first is that the effectiveness of outage detection depends on the architecture of the smart metering system, particularly in the case of mesh radio systems, as are assumed for urban customers under scenarios 2 and 4. Under scenario 1, the distributor would be able to determine the location of the data concentrators and ‘first hop’ meters, in order to optimise the collection of outage information. With the reduced densities that will occur with competitive MDA mesh radio systems, an MDA will have an incentive to locate concentrators and ‘first hop’ meters to maintain the integrity of the system, rather than picking up key points on the electrical system.
For rural areas, scenarios 2 and 4 assume that the communications technology is PSTN and that the meter would call the network management system (NMS) daily using a 1800 number so that the customer is not charged for the call. However, this means that the NMS cannot call the meter and obtain outage information for that meter.

Consultation Report - Cost Benefit Analysis of Smart Metering and DLC
Assessment of Benefits
NERA Economic Consulting
57
As a result of the above issues CRA has assumed that only 50 per cent of the benefit estimated from scenario 1 arising from meter loss of supply detection functionality would arise in scenarios 2 and 4.
In addition, CRA has assumed that the business efficiency benefits it has estimated in relation to the avoided cost of the replacement of ripple control systems in New South Wales and Queensland only apply where distributors are the party that conduct the rollout. As a result, this benefit is only applied under scenario 1 and not under scenarios 2 and 4.
6.4.3. Demand-related benefits
KPMG has assumed that the tariffs offered would be the same under each rollout scenario.112 Specifically, KPMG notes that it is difficult to envisage why a rollout scenario would have a significant impact on the retailer’s willingness to offer TOU or CPP tariffs. If smart meters provide functionalities that the retailers believe have value, they could be expected to utilise them regardless of who leads the rollout.
The assumed take-up rates are also not affected by the different rollout scenarios.
KPMG notes that one retailer suggested that a retailer-led rollout would lead to more innovation in product development generally. However, to the extent that more innovative products relate to the functionality of the smart meter KPMG would expect retailers to utilise those functionalities regardless of who leads the rollout.
As a result, there is no difference in the demand-related benefits across scenarios.
112 KPMG, Workstream 3 Retail Impacts Consultation Report (February 2008), section 9.2.1.

Consultation Report - Cost Benefit Analysis of Smart Metering and DLC
Queensland
NERA Economic Consulting
58
7. Queensland
This section discusses the results of the cost benefit analysis for Queensland. The detailed breakdown of the analysis by different stakeholders is presented in Appendix D.
7.1. Key Jurisdictional Characteristics
Total electricity demand in Queensland has risen around 2.7 per cent state-wide on average over recent years, but is projected to grow significantly.113 In Energex’s distribution area, recent growth in electricity demand has been in excess of 7 per cent per annum.114
Looking forward, total electricity demand is forecast to grow at an average rate of 3.5 per cent (6.1 per cent) per annum.115 Peak demand, occurring in summer, is forecast to grow at an average rate of 3.6 per cent (5.5 per cent) per annum.116 Peak load growth appears to be driven at least in part by a growth in the use of air-conditioners. Air-conditioner penetration in Queensland was estimated at 58 per cent in 2005117 and is forecast to continue to rise.
In order to meet this growth in demand, significant network investment has been approved by the Queensland Competition Authority (QCA) for both Ergon Energy and Energex as part of their most recent regulatory reviews for the four year period commencing 1 July 2005. In addition, Ergon has recently invested in upgrading its ripple control system. Trails for air-conditioning load control in targeted areas are planned and DLC tariffs will be offered to customers in those areas. Energex is also trialling DLC options as alternatives to meet peak demand growth.
Full retail competition was introduced in Queensland in July 2007. In anticipation of full retail contestability, the previously government-owned retailers were sold to the private sector in 2006, and are now owned by AGL and Origin.
The QCA currently maintains a Benchmark Retail Cost Index, used to set regulated (default) retail tariffs annually. Default tariffs are available to small customers choosing not to participate in the competitive retail market.
There is a relatively high proportion of sites in Queensland that are considered to represent ‘difficult installations’ due to the presence of asbestos meter boards and also meter space and
113 NEMMCO Statement of Opportunities 2007, Table 7, p7, based on estimated native energy demand for 2006/7. 114 ENERGEX Annual Network Management Plan – 2007/08 to 2011/12, 16th Aug 2007, Page 2 115 Demand growth forecasts for all jurisdictions excluding Northern Territory and Western Australia are defined as
NEMMCO annual native energy growth forecast for the ten year period commencing 1 July 2007. Percentage growth rates are provided for Medium and High (parentheses) economic growth scenarios, as defined by NEMMCO for the purposes of its Statement of Opportunities. Source: NEMMCO Statement of Opportunities 2007, Pages 3-31 to 3-33.
116 Peak Demand growth forecasts for all jurisdictions excluding Northern Territory and Western Australia are defined as NEMMCO native maximum demand (POE 10%) growth forecast for the ten year period commencing 2007/8 (summer peak) or 2007 (winter peak). Percentage growth rates are provided for Medium and High (parentheses) economic growth scenarios, as defined by NEMMCO for the purposes of its Statement of Opportunities. Source: NEMMCO Statement of Opportunities, Pages 3-35 to 3-39.
117 Energy Efficient Strategies, Status of Air-Conditioners in Australia – A report prepared for NAEEEC, January 2006.

Consultation Report - Cost Benefit Analysis of Smart Metering and DLC
Queensland
NERA Economic Consulting
59
wiring issues. It is also frequently necessary to reposition the main switch when replacing a meter, which increases installation costs.
Current safety regulations in Queensland may inhibit the realisation of some potential benefits from smart metering, in particular remote connect/disconnect, as a representative from the distributor needs to be present when a premise is connected.
7.2. Results of the Cost Benefit Analysis
Figure 7.1 below presents the costs and benefits for Queensland (in NPV terms) for Scenario 1, based on the estimates of costs and benefits made by the consultants in each of the relevant workstreams.118 The cost estimate shown includes both the transitional costs of the rollout and the on-going costs for retailers and distributors. The benefits shown distinguish between the avoided metering costs, the estimate of business efficiencies and the benefits flowing from the anticipated demand response.
Figure 7.1 NPV of Benefits and Costs ($m) – Queensland, Scenario 1
0
200
400
600
800
1,000
1,200
1,400
1,600
SMI Costs Avoided meter costs Business efficienciesand other benefits
Demand response
Given the uncertainty associated with the estimate of costs and benefits, in the majority of cases the consultants have provided a range for both costs and benefits. The figure shows both the lower and upper bound for each of the estimates.
Figure 7.2 summarises the costs and benefits in NPV terms for the non smart meter rollout of DLC (scenario 3).
118 For a description of how to read the figure, see the description of figure 2.1 in section 2.2.

Consultation Report - Cost Benefit Analysis of Smart Metering and DLC
Queensland
NERA Economic Consulting
60
Figure 7.2 NPV of Benefits and Costs ($m) – Queensland, Scenario 3
0
50
100
150
200
250
DLC Costs Demand response
The values underlying Figure 7.1 and Figure 7.2 are presented in Table 7.1 below. In addition, Table 7.1 presents the NPV of costs and benefits for the other smart meter rollout scenarios (i.e. Scenarios 2 and 4).
Table 7.1 NPV of Costs and Benefits ($m) – Queensland
QLD SMI costsAvoided meter
costs
Business efficiencies and other benefits
Demand response Net position
Scenario 1Distributor-led
Minimum Net Benefit (894) 365 592 49 112
Maximum Net Benefit (534) 566 778 170 980
Scenario 2Retailer-led
Minimum Net Benefit (1,273) 365 439 49 (420)
Maximum Net Benefit (779) 566 544 170 501
Scenario 3Non-smart meter DLC
Minimum Net Benefit (99) n/a n/a 127 28
Maximum Net Benefit (33) n/a n/a 234 201
Scenario 4Centralised communications
Minimum Net Benefit (1,210) 365 439 49 (358)
Maximum Net Benefit (666) 566 544 170 613

Consultation Report - Cost Benefit Analysis of Smart Metering and DLC
Queensland
NERA Economic Consulting
61
The breakdown of these overall figures by each of the major categories of costs and benefits is set out in Table 7.2.

Consultation Report - Cost Benefit Analysis of Smart Metering and DLC
Queensland
NERA Economic Consulting
62
Table 7.2 Breakdown of Costs and Benefits (NPV, $m) – Queensland

Consultation Report - Cost Benefit Analysis of Smart Metering and DLC
Queensland
NERA Economic Consulting
63
7.3. Discussion
7.3.1. Smart meter rollout scenarios
The results of the cost benefit analysis for Queensland show that a rollout of smart metering under the distributor-led scenario (scenario 1) has the highest NPV across all of the smart metering scenarios and is justified solely by the avoided meter costs and the resulting business efficiencies that are expected to accrue to distributors.
On the basis of the values in Table 7.1 the sum of the low estimates of the expected business efficiencies and avoided meter costs is 79 per cent above the low estimate of costs made by EMCa, and is 7 per cent above the high cost estimate. At the upper end, the business efficiency estimates and avoided meter costs are 50 per cent more than the high cost estimate. The vast majority of these business efficiency benefits are driven by the distribution network efficiencies estimated by CRA. In the case of Queensland, these network benefits comprise 90 to 98 per cent of the total business efficiency benefits.119
As noted in section 5, the key drivers of costs for each jurisdiction are the costs of metering and the costs of installation. Average meter costs per NMI for Queensland have been estimated by EMCa as between $145 and $201 per NMI.
In relation to installation costs, EMCa has estimated a range of $65 to $135 per NMI. The high end of this range represents the highest installation cost estimated for any jurisdiction, whilst the lowest range is only exceeded by the meter installation cost assumed in Tasmania. The installation cost estimates assumed for Queensland are impacted by a high proportion of ‘difficult’ installations, due to the presence of asbestos in meter boards and meter space and wiring issues. The numbers of installations that are practical for each installer in a day are also assumed to be lower in Queensland relative to other jurisdictions, as a result of customer density and access considerations. EMCa has also factored in an additional Queensland-specific materials and labour cost of repositioning the main switch which could otherwise ‘turn-off’ the smart meter.
As discussed in section 5.1.4.2, we have adopted EMCa’s base assumption (Case 1a) in relation to the communication costs, which assumes PLC technology in rural and remote areas. Adopting EMCa’s alternative cases for remote and rural areas (Cases 1c and 1e) does not significantly alter the net benefits calculated for Queensland.
The avoided meter cost is based on a counterfactual of accumulation meters. We have also considered an alternate counterfactual based on a continuation of current metering policy in Queensland, which is for the installation of an electronic manually read interval meter (type 5) for all new and replacement meters. We have assumed that these new and replacement meters continue to be read as accumulation meters. Adopting this alternate counterfactual increases the benefit associated with avoided meter costs by a further $43 million in the low case and $73 million in the high case.
119 The total business efficiency benefits reported in also include retail business efficiency benefits and the benefit to
customers from a reduction in USE.

Consultation Report - Cost Benefit Analysis of Smart Metering and DLC
Queensland
NERA Economic Consulting
64
A breakdown of the network efficiency benefits calculated by CRA for Queensland is set out in Figure 7.3
Figure 7.3 Annual Network Efficiency Benefits ($m) – Queensland, Scenario 1
Source: CRA Workstream 2 Report
The key components of the network efficiency benefits calculated by CRA for Queensland are the expected reduction in the cost of special reads (estimated by CRA at $20.5 million annually) and the avoided cost of routine reading (estimated by CRA at $12.8 million annually). Together, these two categories account for between 42 and 51 per cent of the total network business efficiency benefits estimated for Queensland.
CRA has also estimated an $8.3 million per annum benefit related to a reduction in the calls to faults and emergency lines as a result of improved outage detection. On a per NMI basis this represents a significantly higher benefit per NMI than for all other jurisdictions. Queensland has a high number of calls to faults and emergencies lines and a high proportion that are handled by operators (65 per cent compared to 25 per cent in Victoria). CRA considers that what appears to be driving the high call numbers is the relatively high frequency of outages experienced in Queensland due to storms. As noted in our general discussion in section 6, there is a higher level of uncertainty surrounding the estimation of this benefit and it is driven by CRA’s assumption of a 50 per cent reduction in calls (for both the high and the low estimates).
In addition, CRA has included a benefit from the avoided cost of investment in ripple control systems in Queensland, which they have otherwise assumed to be necessary sometime in the second half of the assessment period.120 This results in both an annual cost saving of $9 to
120 The assumption we have adopted in the analysis, on advice from CRA, is that this investment would otherwise be
undertaken in 2019/20.
Q LD-High
$20.5m
$12.8m
$12.2m
$8.3m
$25.2m
Avoided cost of specialreads
Avoided costs ofroutine reading
Ripple Control SystemReplacement Init iative
Reduction in calls tofaults and emergencieslines
Remainder
Q LD-Low
$20.5m
$12.8m$8.9m
$8.3m
$15.5m
Avoided cost of specialreads
Avoided costs ofroutine reading
Ripple Control SystemReplacement Init iative
Reduction in calls tofaults and emergencieslines
Remainder

Consultation Report - Cost Benefit Analysis of Smart Metering and DLC
Queensland
NERA Economic Consulting
65
$12 million from not needing to operate the existing systems plus a once-off saving of between $58 and $84 million from not replacing the system once it has reached the end of its life. Taken together, these benefits represent 15 to 18 per cent of the total network business efficiency benefit estimated for Queensland. We note that concerns have been raised with us regarding the inclusion of the avoided cost of ripple control as a benefit for Queensland, particularly in relation to Ergon Energy’s system which has only recently been installed.
We also note that in Queensland there are currently regulations that require a site visit from the distributor for all reconnections. As a result, the full benefit of the avoided cost of disconnections and reconnections would not be realised in the absence of a change to this regulatory requirement. In estimating the benefit associated with avoided connections and reconnections, CRA has assumed that this requirement would be changed in order to realise these benefits. If it was not changed, the benefit would fall to half that estimated by CRA, as a site visit would only be avoided for disconnections and not also for reconnections. However, this benefit is of a relatively low order of magnitude (CRA has estimated at between $2.9 and $3.6 million per annum).
Similarly, CRA’s estimate of the avoided cost of import/export metering may also be overstated for Queensland, as we understand that Energex currently conducts a site visit where PV cells are installed, which it is likely to continue doing even where there is no need to replace the meter. However, the magnitude of these benefits is low (estimated by CRA as $1.3 million in the low case and $3.9 million in the high case) and we have been advised by CRA that the site visit component of these avoided costs is in the region 7 to 8 per cent.121
Removing the benefit CRA has estimated in relation to load control and taking only 50 per cent of the benefits associated with both remote disconnect/reconnect the reduction in the calls to faults and emergency lines reduces the distribution benefits by between $136 million and $173 million in NPV terms. With this reduction the rollout of smart meters under Scenario 1 is still justified on the basis of business benefits and avoided meter costs for Queensland if the lower cost estimate is assumed (with the lower end of the benefit estimate still remaining 52 per cent above the low end of the costs) but becomes marginal if the high cost estimate is assumed (with the low end business efficiency benefits being 9 per cent below the high cost estimate).
In relation to demand-response benefits, these are significantly lower for Queensland than the estimate of the business efficiency benefits. In the low end case, NERA as part of the customer impact analysis has estimated that residential customers on CPP tariffs may reduce their demand in Queensland by 18.6 per cent in a critical peak period in summer whilst customers on TOU tariffs would reduce their load by 4.6 per cent in a peak period in summer. However, much of this demand reduction is the result of a shifting of load rather than overall energy conservation. Overall, NERA has estimated a 0.77 per cent reduction in peak demand in Queensland and a marginal 0.03 per cent reduction in overall annual consumption. In the high demand scenario (which includes higher uptake rates for TOU and CPP as well as a 3 per cent conservation impact) these reductions increase to a 1.31 per cent reduction in peak demand and a 0.4 per cent reduction in overall annual consumption.
121 CRA Workstream 2 Network Impact Consultation Report (February 2008), section 6.2

Consultation Report - Cost Benefit Analysis of Smart Metering and DLC
Queensland
NERA Economic Consulting
66
As a result, the demand response benefits estimated for Queensland by CRA are relatively modest. In the low demand response case they are dominated by network deferral and reductions in USE, with a smaller contribution from generation operating cost. In the high demand response case all three of these benefit categories increase and greenhouse gas emission reductions also become significant, largely arising as a result of the increased conservation effect. We note that we have taken CRA’s estimate of the benefit associated with generation operating costs rather than their assessment of the benefit associated with reductions in generation offer costs, which would further increase the market benefit estimate.122
In relation to the assumed benefit associated with network deferral, we note that given the recent regulatory approval by the QCA for network investment by Energex and Ergon to meet expected demand growth, the extent of this benefit may be over-stated for the early years of the assessment period. In general, distributors could be expected to try to utilise the demand-response benefits of smart metering in order to defer the need for network capital expenditure and thereby obtain a financial benefit from reducing their expenditure below levels built-in to regulated network charges. However, given the rollout timeframe assumed for smart metering, there appears to be little scope for smart metering to defer investment planned for the current regulatory period.
Reducing the network deferral benefits in the earlier years of the analysis below those assumed by CRA would reduce the market benefits calculated for Queensland. However, given that business efficiency benefits more than cover the estimated cost of a smart meter rollout under scenario 1 (even adjusting CRA’s benefit estimates as discussed above) then a reduction in the market benefits would not alter the conclusions that can be drawn from the analysis.
The results presented here also do not include the expected costs and benefits of including an interface to a HAN (functionality 16). We note that where the HAN capability is incorporated into the smart metering system and where DLC capability and IHD are provided as a result, the expected demand-response benefits would be greater than estimated in our base analysis leading to higher market benefits. In the case of the IHD, this additional demand response is dependent on a resultant enhanced responsiveness to TOU tariffs and CPP, which is uncertain. Our analysis indicates that including the HAN would increase the net benefit estimated for Queensland for scenario 1 by at least $31 million and possibly by as much as $175 million.
The levels of net benefits of Scenarios 2 and 4 for Queensland are both lower than for Scenario 1. This primarily reflects the higher cost estimates under these scenarios. As discussed in section 5, this is driven by the higher costs assumed by EMCa for the communications required by these scenarios. The costs per meter are also assumed to be higher under Scenarios 2 and 4 as they allow for a separate plug-in modem to facilitate customer churn. The level of distributor business efficiency benefits is also lower under Scenarios 2 and 4, primarily as a result of the exclusion of a proportion of the benefits associated with improved outage detection. Demand-response benefits remain unchanged between all smart metering scenarios. 122 See discussion in section 6.3.

Consultation Report - Cost Benefit Analysis of Smart Metering and DLC
Queensland
NERA Economic Consulting
67
7.3.2. Scenario 3: Non-smart Meter DLC rollout
For the non smart meter rollout scenario for Queensland, it is assumed that DLC is facilitated via the existing ripple control systems.
As discussed in section 6, there are no business efficiency benefits associated with Scenario 3, as this scenario relates only to a rollout of DLC capability.
The demand benefits are higher under Scenario 3 than for the smart meter rollout scenarios, as a result of faster rollout times and greater uptake assumptions. The costs of a DLC rollout are also lower than they are for the smart meter scenarios.
Overall, Scenario 3 is positive in NPV terms for Queensland. The magnitude of the positive NPV is lower than for a smart meter rollout under Scenario 1, i.e. $28 to $201 million as compared to $112 to $980 million. However, the estimated costs are also of a lower order of magnitude. In relation to the ratio of benefits to costs, Scenario 3 has a ratio of 709 per cent in the upper case and 128 per cent in the lower case. For Scenario 1, benefits outweigh costs by 169 per cent in the upper case 188 per cent in the lower case.
7.4. Summary
The results of the cost benefit analysis for Queensland indicate that a rollout of smart metering under the distributor-led scenario (Scenario 1) has the highest NPV across all of the smart metering scenarios and is justified solely by the avoided metering costs and resulting business efficiencies that are expected to accrue to distributors. Demand response benefits are significantly lower than business efficiency benefits.
The NPV of the net benefits under a smart metering rollout is also significantly greater than the NPV of the net benefit of a non-smart meter SLC rollout (Scenario 3). In relation to the ratio of benefits to costs, Scenario 3 has a slightly higher ratio than Scenario 1.
A decision to rollout smart meters in Queensland, therefore, appears to be dependent on a view as to the reasonableness of the estimates presented in relation to the distribution efficiency benefits and the reasonableness of the estimated transitional costs (and in particular meter and installation costs).

Consultation Report - Cost Benefit Analysis of Smart Metering and DLC
New South Wales
NERA Economic Consulting
68
8. New South Wales
This section discusses the results of the cost benefit analysis for New South Wales. The detailed breakdown of the analysis by different stakeholders is presented in Appendix D.
An important caveat in discussing the New South Wales results in relation to demand response is that the base year assumed for modelling purposes is the 2007 financial year, in which New South Wales was winter peaking. The NEMMCO Statement of Opportunities (SOO) projections show New South Wales moving to a summer peaking load profile. In addition, given the growth of air-conditioning load in the state (discussed below), there appears to be a general expectation amongst stakeholders that New South Wales will predominately be summer peaking over the timeframe of this analysis. This is borne out by the current efforts of the New South Wales distribution businesses to control air-conditioning load. To the extent that this is the case, the demand response estimates for New South Wales (and therefore the estimate of market benefits, including greenhouse, and network deferral benefits) would be greater than those shown in our base case, as the elasticity of demand applied by NERA in the consumer impact analysis to CPP and peak TOU periods is higher for summer than for winter. We have addressed this issue by also modelling demand response on the basis of proxies for the response that may be expected if New South Wales was summer peaking. This is discussed further in section 8.3 below. The results in the following section are reported for both the winter-peaking and summer-peaking demand-response cases.
8.1. Key Jurisdictional Characteristics
Total electricity demand for New South Wales is forecast to grow at an average rate of 1.8 per cent (2.7 per cent) per annum.123 Peak summer electricity demand is also growing at an average rate of 2.6 per cent (2.9 per cent) per annum, largely driven by the increases in residential air-conditioning.124
Air-conditioner penetration in New South Wales was estimated at 54 per cent in 2005125 and is forecast to continue to rise. The State has historically been winter peaking, however, as noted above, the growth in air-conditioner load means that in future it is expected to become summer peaking.126 All three of the New South Wales distribution businesses have been undertaking trials of interval metering and DLC technology in order to assess the potential for managing the growth in summer peak demand.
123 NEMMCO native maximum demand (POE 10 per cent growth forecast for the ten year period commencing 2007/8
(summer peak) or 2007 (winter peak). Percentage growth rates are provided for Medium and High (parentheses) economic growth scenarios, as defined by NEMMCO for the purposes of its Statement of Opportunities. Source: NEMMCO Statement of Opportunities, Pages 3-35 to 3-39. New South Wales projections of total electricity and peak demand include the Australian Capital Territory.
124 Peak Demand growth forecasts for all jurisdictions excluding Northern Territory and Western Australia are defined as NEMMCO native maximum demand (POE 10 per cent) growth forecast for the ten year period commencing 2007/8 (summer peak) or 2007 (winter peak). Percentage growth rates are provided for medium and high (parentheses) economic growth scenarios, as defined by NEMMCO for the purposes of its SOO. Source: NEMMCO Statement of Opportunities, Pages 3-35 to 3-39.
125 Source: Energy Efficient Strategies, Status of Air-Conditioners in Australia – A report prepared for NAEEEC, January 2006.
126 This is reflected in the 2007 publications of both the NEMMCO SOO and the TransGrid Annual Planning Report.

Consultation Report - Cost Benefit Analysis of Smart Metering and DLC
New South Wales
NERA Economic Consulting
69
Full retail competition was introduced in 2002. The incumbent retail businesses are currently government-owned, and are stapled to the distribution businesses (under ‘ring fencing’ arrangements). However, the recent Owen Inquiry has recommended that the retail functions be sold to the private sector.127 As a result, the New South Wales Government has recently announced that the retail functions of the government-owned retail and distribution businesses will move to private operators. The New South Wales Government will retain ownership of generation assets, however, they will be operated by the private sector under long-term lease arrangements. Distribution and transmission assets will also remain in public ownership.
In response to the same Inquiry, the Government also announced that it will maintain retail price regulation for small customers until 2013 or until the Government is satisfied that there is effective competition in the retail energy market.128
In New South Wales, there is a relatively high proportion of meter sites that are considered to represent ‘difficult installations’ due to the presence of asbestos meter boards and also meter space and wiring issues. This results in a higher estimate of meter installation costs compared with other jurisdictions (discussed in section 8.3).
8.2. Results of the Cost Benefit Analysis
Figure 8.1 below presents the costs and benefits for New South Wales (in NPV terms) for Scenario 1, based on the estimates of costs and benefits made by the consultants in each of the relevant workstreams.129 The cost estimate shown includes both the transitional costs of the rollout and the on-going costs for retailers and distributors. The benefits shown distinguish between the avoided metering costs, the estimate of business efficiencies and the benefits flowing from the anticipated demand response.
127 Owen, D, Electricity Supply, 11 September 2007, page 1-14. 128 Premier of New South Wales News Release, 10 December 2007. 129 For a description of how to read the figure, see the description of figure 2.1 in section 2.2.

Consultation Report - Cost Benefit Analysis of Smart Metering and DLC
New South Wales
NERA Economic Consulting
70
Figure 8.1 NPV of Benefits and Costs ($m) – New South Wales, Scenario 1
0
500
1,000
1,500
2,000
2,500
SMI Costs Avoided metercosts
Businessefficiencies andother benefits
Demand response(winter peak)
Demand response(summer peak)
Given the uncertainty associated with the estimate of costs and benefits, in the majority of cases the consultants have provided a range for both costs and benefits. The figure shows both the lower and upper bound for each of the estimates.
Figure 8.2 summarises the costs and benefits in NPV terms for the non smart meter rollout of DLC (Scenario 3).
Figure 8.2 NPV of Benefits and Costs ($m) – New South Wales, Scenario 3
0
100
200
300
400
500
600
DLC Costs Demand response (winterpeak)
Demand response(summer peak)
The values underlying Figure 8.1and Figure 8.2 are presented in Table 8.1 below. In addition, Table 8.1 presents the NPV of costs and benefits for the other smart meter rollout scenarios (i.e. Scenarios 2 and 4).

Consultation Report - Cost Benefit Analysis of Smart Metering and DLC
New South Wales
NERA Economic Consulting
71
Table 8.1 NPV of Costs and Benefits ($m) – New South Wales
NSW SMI costsAvoided meter
costs
Business efficiencies and other benefits
Demand response
(winter peak)
Demand response (summer peak)
Net Position (winter peak)
Net Position (summer peak)
Scenario 1Distributor-led
Minimum Net Benefit (1,274) 552 807 128 163 212 248
Maximum Net Benefit (841) 882 1,055 283 352 1,378 1,447
Scenario 2Retailer-led
Minimum Net Benefit (1,715) 552 624 128 163 (411) (375)
Maximum Net Benefit (939) 882 792 283 352 1,018 1,087
Scenario 3Non-smart meter DLC
Minimum Net Benefit (115) n/a n/a 114 286 (1) 171
Maximum Net Benefit (38) n/a n/a 202 508 164 470
Scenario 4Centralised communications
Minimum Net Benefit (1,602) 552 624 128 163 (299) (263)
Maximum Net Benefit (1,030) 882 792 283 352 926 996
The breakdown of these overall figures by each of the major categories of costs and benefits is set out in Table 8.2, for the base New South Wales winter peaking assumption. A breakdown of the overall figures for the summer peaking assumption is set out in Appendix D.

Consultation Report - Cost Benefit Analysis of Smart Metering and DLC
New South Wales
NERA Economic Consulting
72
Table 8.2 Breakdown of Costs and Benefits (NPV,$m) – New South Wales (winter
peaking load)
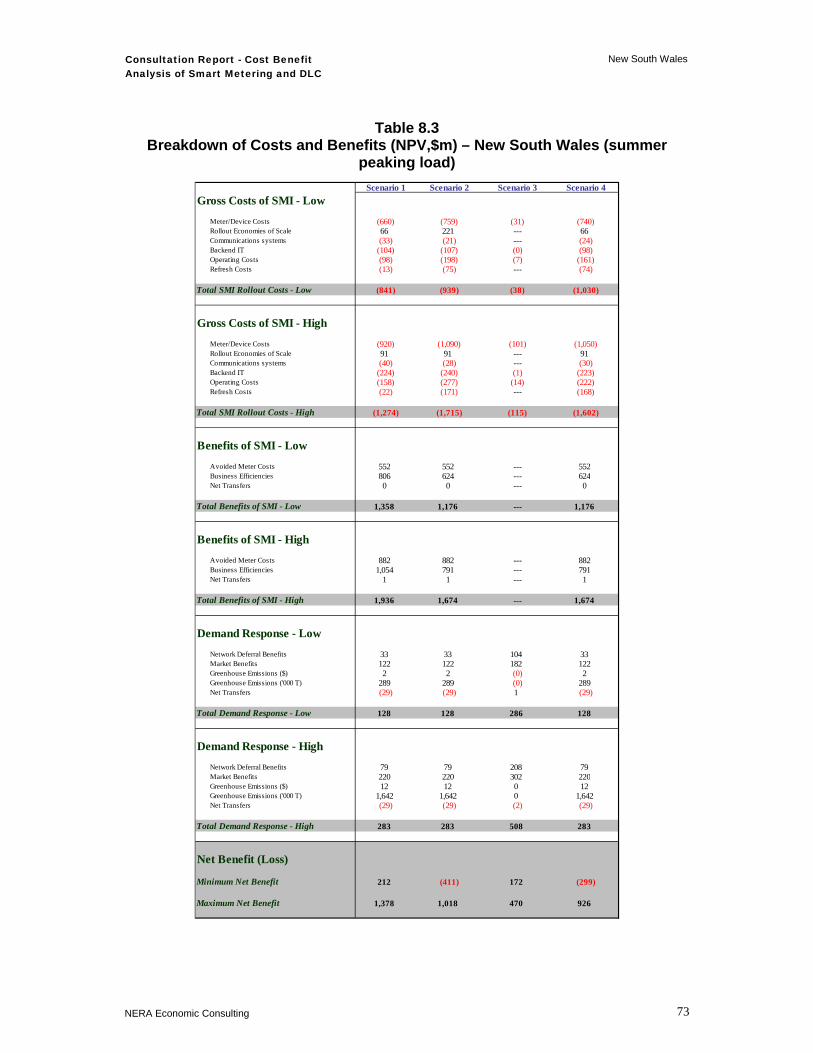
Consultation Report - Cost Benefit Analysis of Smart Metering and DLC
New South Wales
NERA Economic Consulting
73
Table 8.3 Breakdown of Costs and Benefits (NPV,$m) – New South Wales (summer
peaking load) Scenario 1 Scenario 2 Scenario 3 Scenario 4
Gross Costs of SMI - Low
Meter/Device Costs (660) (759) (31) (740)Rollout Economies of Scale 66 221 --- 66Communications systems (33) (21) --- (24)Backend IT (104) (107) (0) (98)Operating Costs (98) (198) (7) (161)Refresh Costs (13) (75) --- (74)
Total SMI Rollout Costs - Low (841) (939) (38) (1,030)
Gross Costs of SMI - High
Meter/Device Costs (920) (1,090) (101) (1,050)Rollout Economies of Scale 91 91 --- 91Communications systems (40) (28) --- (30)Backend IT (224) (240) (1) (223)Operating Costs (158) (277) (14) (222)Refresh Costs (22) (171) --- (168)
Total SMI Rollout Costs - High (1,274) (1,715) (115) (1,602)
Benefits of SMI - Low
Avoided Meter Costs 552 552 --- 552Business Efficiencies 806 624 --- 624Net Transfers 0 0 --- 0
Total Benefits of SMI - Low 1,358 1,176 --- 1,176
Benefits of SMI - HighAvoided Meter Costs 882 882 --- 882Business Efficiencies 1,054 791 --- 791Net Transfers 1 1 --- 1
Total Benefits of SMI - High 1,936 1,674 --- 1,674
Demand Response - Low
Network Deferral Benefits 33 33 104 33Market Benefits 122 122 182 122Greenhouse Emissions ($) 2 2 (0) 2Greenhouse Emissions ('000 T) 289 289 (0) 289Net Transfers (29) (29) 1 (29)
Total Demand Response - Low 128 128 286 128
Demand Response - High
Network Deferral Benefits 79 79 208 79Market Benefits 220 220 302 220Greenhouse Emissions ($) 12 12 0 12Greenhouse Emissions ('000 T) 1,642 1,642 0 1,642Net Transfers (29) (29) (2) (29)
Total Demand Response - High 283 283 508 283
Net Benefit (Loss)
Minimum Net Benefit 212 (411) 172 (299)
Maximum Net Benefit 1,378 1,018 470 926

Consultation Report - Cost Benefit Analysis of Smart Metering and DLC
New South Wales
NERA Economic Consulting
74
8.3. Discussion
8.3.1. Smart meter rollout scenarios
The results of the cost benefit analysis for New South Wales show that a rollout of smart metering under the distributor-led scenario (Scenario 1) has the highest NPV across all of the smart metering scenarios and is justified solely by the avoided metering costs and the resulting business efficiencies that are expected to accrue to distributors.
On the basis of the values in Table 8.1 the sum of the low estimates of the expected business efficiencies and avoided meter costs is 61 per cent above the low estimate of costs made by EMCa, and is 7 per cent above the high cost estimate. At the upper end, the business efficiency estimates and avoided meter costs are 52 per cent more than the high cost estimate. The vast majority of these business efficiency benefits are driven by the distribution network efficiencies estimated by CRA. In the case of New South Wales, these network benefits comprise 91 to 99 per cent of the total business efficiency benefits.130
As noted in Section 5, the key drivers of costs for each jurisdiction are the costs of metering and the costs of installation. Average meter costs per NMI for New South Wales have been estimated by EMCa as between $149 and $184 per NMI. In relation to installation costs, EMCa has estimated a range of $51 to $83 per NMI. The installation cost estimates assumed for New South Wales are impacted by a high proportion of ‘difficult’ installations, due to presence of asbestos in meter boards and meter space and wiring issues.
As discussed in section 5.1.4.2, we have adopted EMCa’s base assumption (Case 1a) in relation to the communication costs, which assumes PLC technology in rural and remote areas. Adopting EMCa’s alternative cases for remote and rural areas (Cases 1c and 1e) does not significantly alter the net benefits calculated for NSW.
The avoided meter costs are based on a counterfactual of a continued use of accumulation meters. We have also considered an alternate counterfactual based on a continuation of current metering policy in New South Wales, which is for the continuing rollout of an electronic manually-read interval meter (type 5) for all new and replacement meters. We have assumed that these new and replacement meters continue to be read as accumulation meters.131 Adopting this alternate counterfactual increases the benefits from avoided meter costs by between $98 and $170 million. As a result, it does not alter the relative outcomes of the cost benefit analysis.
A breakdown of the network efficiency benefits calculated by CRA for New South Wales are set out in Figure 8.3.
130 The total business efficiency benefits reported in Table 8.1 also include retail business efficiency benefits and the
benefit to customers from a reduction in USE. 131 We note that EnergyAustralia is currently reading these meters as interval meters and that their customers with these
meters face TOU tariffs. This may overstate the potential demand response in New South Wales, to the extent that some customers already face TOU prices. However, we consider that any overstatement of the demand response as a result of this factor would be outweighed by the winter-peaking assumption adopted for New South Wales and the exclusion of the HAN from the figures presented in the main analysis. Both of these factors are discussed further in this section.

Consultation Report - Cost Benefit Analysis of Smart Metering and DLC
New South Wales
NERA Economic Consulting
75
Figure 8.3 Annual Network Efficiency Benefits ($m) – New South Wales, Scenario 1
Source: CRA Workstream 2 Report
The key components of the network efficiency benefits calculated by CRA for New South Wales are the expected reduction in the cost of special reads (estimated by CRA at nearly $25 million annually) and the avoided cost of routine reading (estimated by CRA at nearly $30 million annually). Together these two categories account for 60 per cent of the low end estimate of the total network business efficiency benefits estimated for New South Wales and nearly 52 per cent of the high end estimate.
CRA has also estimated a $7 to $10 million per annum benefit in relation to the avoided cost of connections and reconnections.
In addition, CRA has included a benefit from the avoided cost of investment in ripple control systems in New South Wales, which they have otherwise assumed to be necessary sometime in the first half of the assessment period.132 This results in both an annual cost saving of $10 million from not needing to operate the existing systems plus a once-off saving of between $92 and $148 million from not replacing the system once it has reached the end of its life. Taken together, this benefit represents 17 to 18 per cent of the total network business efficiency benefit estimated for the state.
In relation to demand-response benefits, these are significantly lower for New South Wales than the estimates of the business efficiency benefits. In the low end case, NERA estimates in the consumer impact analysis that residential customers on CPP tariffs may reduce their demand in the New South Wales/Australian Capital Territory NEM region by 17.3 per cent in a critical peak period in summer, whilst customers on TOU tariffs would reduce their load by 5.2 per cent in a peak period in summer. However, much of this demand reduction is the result of a shifting of load rather than overall energy conservation. Overall, NERA has 132 The assumption we have adopted in the analysis, on advice from CRA, is that this investment would be necessary in
2011/12.
NSW-Low
$29.7m
$24.8m
$10.0m
$7.0m
$19.7m
Avoided costs ofroutine reading
Avoided cost of specialreads
Ripple Control SystemReplacement Init iative
Avoided cost of manualdisconnections &reconnections.
Remainder
NSW-High
$29.7m
$24.8m$10.3m
$10.0m
$30.2m
Avoided costs of routinereading
Avoided cost of specialreads
Avoided cost of manualdisconnections &reconnections. Ripple Control SystemReplacement Init iative
Remainder

Consultation Report - Cost Benefit Analysis of Smart Metering and DLC
New South Wales
NERA Economic Consulting
76
estimated a 0.26 per cent reduction in peak demand in New South Wales and a marginal 0.02 per cent reduction in overall annual consumption. In the high demand scenario (which includes higher uptake rates for TOU and CPP as well as a 3 per cent conservation impact), these reductions increase to a 0.62 per cent reduction in peak demand and a 0.24 per cent reduction in overall consumption over the year.
As a result, the demand response benefits estimated for New South Wales are relatively modest. In the low demand response case, they are dominated by network deferral and reductions in USE, with a smaller contribution from generation operating cost. In the high demand response case all three of these benefit categories increase and greenhouse gas emission reductions also become significant, largely arising as a result of the increased conservation effect. We note that we have taken CRA’s estimate of the benefit associated with generation operating costs rather than their assessment of the benefit associated with reductions in generation offer costs, which would further increase the market benefit estimate.133
There are two important caveats in relation to the demand response benefits estimated for New South Wales. The first is that the demand response benefit has been estimated for the New South Wales/Australian Capital Territory NEM region, in the absence of a New South Wales only region. As a result, the estimates of demand reduction will be greater than those which could be achieved in New South Wales alone, although not significantly, given the relative size of Australian Capital Territory load compared with New South Wales load. In any event, we expect this impact to be outweighed by the impact of the second caveat, which is that the base year assumed for modelling purposes was 2006/07, in which New South Wales was winter peaking. As discussed in the introduction to this section, the NEMMCO SOO projections for New South Wales show New South Wales moving to summer peaking and there appears to be a general expectation amongst stakeholders that New South Wales will be predominately summer peaking over the timeframe of this analysis. If New South Wales becomes summer-peaking, the potential demand response can be expected to increase as a result of both a higher elasticity of demand estimated for CPP and peak TOU periods that occur in summer rather than winter and also as a result of a greater response from DLC, which is assumed in NERA’s demand model only to be utilised on peak days where the temperature is above 30 degrees Celsius.134
We have undertaken a sensitivity test in order to assess the potential impact on the results of the cost benefit analysis from adopting an assumption of New South Wales becoming summer peaking. This analysis is reported in the NERA Workstream 4 report (Customer Impact).135 The results presented in Table 8.1 reflect both the base assumption (based on 2006/07 demand) and the sensitivity analysis reflecting a summer peaking assumption. The results indicate that the demand response benefit increases under the summer peaking assumption, by between 24-27 per cent. However the relative outcomes of the cost benefit analysis are unchanged.
133 See discussion in section 6.3. 134 See NERA, Workstream 4 Consumer Impacts Consultation Report (February 2008), Section 5.1 and Section 6.2. 135 NERA, Workstream 4 Consumer Impacts Consultation Report (February 2008), Appendix B Box B2.

Consultation Report - Cost Benefit Analysis of Smart Metering and DLC
New South Wales
NERA Economic Consulting
77
The results presented here also do not include the expected costs and benefits of including an interface to a HAN (functionality 16). We note that where the HAN capability is incorporated into the smart metering system and where DLC capability and IHD are provided as a result, the expected demand-response benefits would be greater than estimated in our base analysis, leading to higher market benefits. In the case of the IHD this additional demand response is dependent on a resultant enhanced responsiveness to TOU tariffs and CPP, which is uncertain. Our analysis indicates that including the HAN would increase the net benefit estimated for New South Wales for scenario 1 by at least $5 million and possibly by as much as $58 million (under the winter peaking assumption) and by between $94 million and $197 million under the summer-peaking assumption.
The levels of net benefits of Scenarios 2 and 4 for New South Wales are both lower than for Scenario 1, and become negative if the highest cost estimate is compared to the lowest benefit estimate. This primarily reflects the higher cost estimates under these scenarios. As discussed in section 5 this is driven by the higher costs assumed by EMCa for the communications required by these scenarios. The costs per meter are also assumed to be higher under Scenarios 2 and 4 as they allow for a separate plug-in modem to facilitate customer churn.
The level of distributor business efficiency benefits is also lower under Scenarios 2 and 4, primarily as a result of the exclusion of a proportion of the benefits associated with improved outage detection. Demand-response benefits remain unchanged between all smart metering scenarios.
8.3.2. Scenario 3: Non-smart Meter DLC rollout
For the non smart meter rollout scenario for New South Wales, it is assumed that DLC is facilitated via the existing ripple control systems.
As discussed in section 6, there are no business efficiency benefits associated with Scenario 3 as this scenario relates only to a rollout of DLC capability.
For New South Wales the demand response benefits are estimated to be lower under Scenario 3 than for the smart meter rollout scenarios, in the base case analysis which adopts a winter-peaking assumption. Since DLC is impacting air-conditioning load, it only has an impact in the summer. As a result, winter peaks are not affected. If winter peaks are assumed to drive the need for network augmentation there is zero network augmentation deferral benefit assumed under Scenario 3. This is in contrast to the smart metering scenarios which assume CPP and TOU tariffs which apply in the winter as well as in the summer.136
As discussed above, we consider that it is likely that DLC would lead to network deferral in New South Wales, as New South Wales is likely to become a summer peaking state, which is assumed to be driving the need for network augmentation. The sensitivity which we have conducted in relation to New South Wales becoming summer peaking indicates a much higher demand response. In particular, the demand response that it achieved with DLC under Scenario 3 is greater than that achieved under the smart metering scenarios (where those
136 Although as noted above the elasticities applied are higher for summer than for winter periods.

Consultation Report - Cost Benefit Analysis of Smart Metering and DLC
New South Wales
NERA Economic Consulting
78
scenarios do not also include the interface with a HAN and therefore do not provide a DLC capability).
Overall, Scenario 3 is positive in NPV terms for New South Wales (winter peaking load) if the low cost estimate is assumed, under both the low and high demand response benefits. However, under the high cost and the low benefit estimate this scenario becomes marginally negative. The NPV is positive even under the high cost estimate if we assume a summer peaking load in New South Wales, primarily due to a substantial increase in network deferral benefits.
8.4. Summary
The results of the cost benefit analysis for New South Wales show that a rollout of smart metering under the distributor led scenario (Scenario 1) has the highest NPV across all of the smart metering scenarios and is justified on the basis of the avoided metering costs and the resulting business efficiencies that are expected to accrue to distributors.
The NPV of the net benefits under a smart metering rollout is also an order of magnitude greater than the NPV of the net benefit of a non-smart meter DLC rollout (Scenario 3).
A decision to rollout smart meters in New South Wales, therefore, appears to be dependent on a view as to the reasonableness of the estimates presented in relation to the distribution efficiency benefits and transitional costs (in particular meter and installation costs).

Consultation Report - Cost Benefit Analysis of Smart Metering and DLC
Australian Capital Territory
NERA Economic Consulting
79
9. Australian Capital Territory
This section discusses the results of the cost benefit analysis for the Australian Capital Territory. The detailed breakdown of the analysis by different stakeholders is presented in Appendix D.
Given that the NEM has a single region for New South Wales and the Australian Capital Territory, we have been unable to separately estimate the market benefits for the Australian Capital Territory (e.g. network deferral, change in USE, generation dispatch costs and greenhouse emissions). However, we discuss the likely magnitude of these benefits in the case of the Australian Capital Territory below.
9.1. Key Jurisdictional Characteristics
The distribution network in the Australian Capital Territory was built to service a significantly greater population than the current population of Canberra, and was also designed to meet peak winter heating load, which is now serviced by gas. As a result there is currently spare capacity in the network and the Australian Capital Territory does not have the same network peak concerns as other jurisdictions.
Full retail competition was introduced in 2003. The incumbent retailer is part of the vertically integrated company ActewAGL. Default regulated tariffs are maintained by the Independent Competition and Regulatory Commission (ICRC), with the period for which default tariffs continue to be available extended on a year by year basis.137
9.2. Results of the Cost Benefit Analysis
Figure 9.1 below presents the costs and benefits for the Australian Capital Territory (in NPV terms) for Scenario 1, based on the estimates of costs and benefits made by the consultants in each of the relevant workstreams. 138 The cost estimate shown includes both the transitional costs of the rollout and the on-going costs for retailers and distributors. The benefits shown distinguish between the avoided metering costs and the estimate of business efficiencies only.
137 ICRC Draft Decision on Retail Prices for Non-contestable Electricity Customers 2007, page 1. The ICRC notes in its
Decision that it has recommended the removal of default tariffs in the past on the basis that they are no longer required, however the Government has extended the application of default tariffs (at time of writing) until mid-2008. At this time, the Australian Energy Retailer (AER) will take responsibility of retail market regulation.
138 For a description of how to read the figure, see the description of figure 2.1 in section 2.2.

Consultation Report - Cost Benefit Analysis of Smart Metering and DLC
Australian Capital Territory
NERA Economic Consulting
80
Figure 9.1 NPV of Benefits and Costs ($m) – Australian Capital Territory, Scenario 1
0
10
20
30
40
50
60
70
SMI Costs Avoided meter costs Business efficiencies and otherbenefits
Given the uncertainty associated with the estimate of costs and benefits, in the majority of cases the consultants have provided a range for both costs and benefits. The figure shows both the lower and upper bound for each of the estimates.
The values underlying Figure 9.1 are presented in Table 9.1 below. In addition, Table 9.1 presents the NPV of costs and benefits for the other smart meter rollout scenarios (i.e. Scenarios 2 and 4).
Table 9.1 NPV of Costs and Benefits ($m) – Australian Capital Territory
ACT SMI costsAvoided meter
costs
Business efficiencies and other benefits
Demand response Net position
Scenario 1Distributor-led
Minimum Net Benefit (58) 23 24 n/a (12)
Maximum Net Benefit (36) 33 28 n/a 25
Scenario 2Retailer-led
Minimum Net Benefit (75) 23 22 n/a (31)
Maximum Net Benefit (46) 33 26 n/a 14
Scenario 3Non-smart meter DLC
Minimum Net Benefit n/a n/a n/a n/a n/a
Maximum Net Benefit n/a n/a n/a n/a n/a
Scenario 4Centralised communications
Minimum Net Benefit (69) 23 22 n/a (24)
Maximum Net Benefit (42) 33 26 n/a 17

Consultation Report - Cost Benefit Analysis of Smart Metering and DLC
Australian Capital Territory
NERA Economic Consulting
81
The breakdown of these overall figures by each of the major categories of costs and benefits is set out in Table 9.2.
Table 9.2 Breakdown of Costs and Benefits (NPV,$m) – Australian Capital Territory
Scenario 1 Scenario 2 Scenario 4Gross Costs of SMI - Low
Meter/Device Costs (28) (33) (32)Rollout Economies of Scale 2 2 2Communications systems (1) (1) (1)Backend IT (6) (6) (5)Operating Costs (3) (5) (3)Refresh Costs (1) (4) (4)
Total SMI Rollout Costs - Low (36) (46) (42)
Gross Costs of SMI - High
Meter/Device Costs (38) (44) (42)Rollout Economies of Scale 3 3 3Communications systems (1) (1) (1)Backend IT (12) (13) (12)Operating Costs (9) (11) (8)Refresh Costs (2) (9) (9)
Total SMI Rollout Costs - High (58) (75) (69)
Benefits of SMI - LowAvoided Meter Costs 23 23 23Business Efficiencies 24 22 22Net Transfers 0 (0) 0
Total Benefits of SMI - Low 46 45 45
Benefits of SMI - High
Avoided Meter Costs 33 33 33Business Efficiencies 28 26 26Net Transfers 0 0 0
Total Benefits of SMI - High 62 60 60
Net Benefit (Loss)
Minimum Net Benefit (12) (31) (24)
Maximum Net Benefit 25 14 17

Consultation Report - Cost Benefit Analysis of Smart Metering and DLC
Australian Capital Territory
NERA Economic Consulting
82
9.3. Discussion
9.3.1. Smart meter rollout scenarios
The results of the cost benefit analysis for the Australian Capital Territory show that whether a rollout of smart metering has a positive or negative NPV under Scenario 1 depends critically on whether the low or high cost estimates are assumed. Under the low cost estimate, the low end of the estimated benefits is 31 per cent above the low cost estimate. However, taking the high cost estimate results in benefits falling 19 per cent short of costs at the low end. The high benefits are 5 per cent above the high cost estimate. For Scenarios 2 and 4 the net benefits estimated are lower than for Scenario 1.
For all scenarios, the benefits estimated relate solely to avoided meter costs and business efficiency benefits. As noted above, we have not been able to estimate the market benefits that would accrue in the Australian Capital Territory, as it does not have a distinct NEM region. However, on the basis of the results for the other jurisdictions we do not consider that these benefits would be of an order of magnitude that would influence the relative outcomes. In addition, is seems likely that network deferral benefits would not arise in the Australian Capital Territory as the result of the rollout of smart metering (see below).
In common with all other jurisdictions, the vast majority of the business efficiency benefits are driven by the distribution network efficiencies estimated by CRA.139
As noted in Section 5, the key drivers of costs for each jurisdiction are the costs of metering and the costs of installation. Average meter costs per NMI for the Australian Capital Territory have been estimated by EMCa as between $146 and $181 per NMI. In relation to installation costs EMCa has estimated a range of $47 to $76 per NMI.
As discussed in section 5.1.4.2, we have adopted EMCa’s base assumption (Case 1a) in relation to the communication costs, which assumes PLC technology in rural and remote areas. Adopting EMCa’s alternative cases for remote and rural areas (Cases 1c and 1e) does not significantly alter the net benefits calculated for the Australian Capital Territory.
In relation to the avoided meter costs, the benefit is based on a counterfactual of accumulation meters. In the Australian Capital Territory, the current replacement policy is for the installation of an electromechanical accumulation meter for all new and replacement meters. As a result, there is no alternate metering base case.
A breakdown of the network efficiency benefits calculated by CRA for the Australian Capital Territory are set out in Figure 9.2
139 The total business efficiency benefits reported in Table 9.1 also include retail business efficiency benefits and the
benefit to customers from a reduction in USE.

Consultation Report - Cost Benefit Analysis of Smart Metering and DLC
Australian Capital Territory
NERA Economic Consulting
83
Figure 9.2 Annual Network Efficiency Benefits ($m) – Australian Capital Territory,
Scenario 1
Source: CRA Workstream 2 Report
The expected reduction in the cost of special reads for the Australian Capital Territory is estimated by CRA at $1.1 million annually and the avoided cost of routine reading is estimated at $1.4 million.
Together, these two categories account for between 63 and 68 per cent of the total network business efficiency estimated.
In relation to the potential benefits from network deferral, we understand that the current network was built to service a significantly greater population than the current population of Canberra, and was also designed to meet peak winter heating load, which is now serviced by gas. As a result, augmentation of the network to meet increasing peaks is not likely in the Australian Capital Territory over the timeframe of the study. This implies that there would be no benefits associated with the deferral of investment to meet peak network demand.
The levels of net benefits of Scenarios 2 and 4 for the Australian Capital Territory are both lower than for Scenario 1. This primarily reflects the higher cost estimates under these scenarios. As discussed in section 5, this is driven by the higher costs assumed by EMCa for the communications required by these scenarios. The costs per meter are also assumed to be higher under Scenarios 2 and 4 as they allow for a separate plug-in modem to facilitate customer churn. The level of distributor business efficiency benefits is also lower under Scenarios 2 and 4, primarily as a result of the exclusion of benefits associated with improved outage detection.
9.3.2. Scenario 3: Non-smart Meter DLC rollout
It has not been possible to estimate the net benefit of a non smart meter DLC capability for the Australian Capital Territory. Given that the Australian Capital Territory does not have a
ACT-Low
$1.4m$1.1m
$0.2m
$0.2m$0.8m
Avoided costs ofroutine reading
Avoided cost of specialreads
Reduction in calls tofaults and emergencieslines
Avoided cost of manualdisconnections &reconnections.
Remainder
ACT-High
$1.4m$1.1m
$0.3m
$0.2m$1.0m
Avoided costs ofroutine reading
Avoided cost of specialreads
Avoided costs ofinstalling import /export metering
Reduction in calls tofaults and emergencieslines
Remainder

Consultation Report - Cost Benefit Analysis of Smart Metering and DLC
Australian Capital Territory
NERA Economic Consulting
84
separate NEM region, we have not been able to estimate the impact on the Australian Capital Territory’s load profile of a DLC rollout.
As discussed above, we note that there are unlikely to be network deferral benefits for the Australian Capital Territory, given the current excess capacity in the network. Given that this is the major category of demand-response benefits identified for other jurisdictions, this implies that there would be unlikely to be a net positive benefit associated with a DLC rollout for the Australian Capital Territory.
9.4. Summary
The results of the cost benefit analysis for the Australian Capital Territory show that whether a rollout of smart metering has a positive net benefit depends on whether the upper or lower bounds of the estimates of costs and distributor efficiency benefits are taken. Specifically, either costs need to be at the lower bound or benefits need to be at the higher bound in order to justify a smart meter rollout. As is the case with all of the other jurisdictions, Scenario 1 has the highest net benefit (or lowest net cost) of all the smart meter rollout scenarios.
In contrast to other jurisdictions, a smart meter rollout is not justified in the Australian Capital Territory on the basis of business efficiency benefits alone, at the low end of the range of benefit estimates.
There are unlikely to be network deferral benefits arising from the rollout of smart meters in the Australian Capital Territory, given the current capacity of the network. Although we have not been able to estimate other demand-response benefits, we expect that these would be modest, on the basis of our analysis for other jurisdictions.

Consultation Report - Cost Benefit Analysis of Smart Metering and DLC
Victoria
NERA Economic Consulting
85
10. Victoria
This section discusses the results of the cost benefit analysis for Victoria. The detailed breakdown of the analysis by different stakeholders is presented in Appendix D.
The results presented here also do not include the expected costs and benefits of the incremental smart meter functionalities 15 and 16. We note that where the HAN capability is incorporated into the smart metering system (incremental functionality 16) and where DLC capability and IHD are provided as a result, the expected demand-response benefits would be greater than estimated in our base analysis, leading to higher market benefits. In the case of the IHD, this additional demand response is dependent on a resultant enhanced responsiveness to TOU tariffs and CPP. Similarly, if the DLC functionality (functionality 15) is incorporated into the smart metering specification, then this would also enhance the expected demand-response and increase the market benefits.
10.1. Key Jurisdictional Characteristics
In contrast to other jurisdictions, Victoria is currently not facing significant network capacity constraints that require substantial network investments in the future. Total electricity demand is forecast to grow at an average rate of 1.4 per cent (2.8 per cent) per annum. 140 Peak demand, occurring in summer, is forecast to grow at an average rate of 1.8 per cent (2.9 per cent) per annum.141
The Victorian government has mandated a rollout of smart meters beginning at the start of 2009 and being completed by the end of 2013. This timeframe is shorter than that assumed for the other jurisdictions. The ESC in Victoria is about to begin a review of the costs to be included in metering charges associated with the smart meter rollout.
Full retail competition was introduced in Victoria in January 2001 and retail competition is the most vigorous out of all of the Australian jurisdictions. The AEMC has published its First Final Report of its review of the effectiveness of retail competition in Victoria, the first in a series of reviews to be conducted as part of its review of the effectiveness of retail gas and electricity markets across all jurisdictions (except Western Australia). The Commission’s finding is that retail competition in Victoria is effective.142
Within its First Final Report, the AEMC noted that it will consider a timetable for the removal of regulation of ‘safety net’ retail tariffs. At present, the Victorian government retains reserve powers to set default tariffs for customers consuming less than 160MWh per
140 Demand growth forecasts for all jurisdictions excluding Northern Territory and Western Australia are defined as
NEMMCO annual native energy growth forecast for the ten year period commencing 1 July 2007. Percentage growth rates are provided for medium and high (parentheses) economic growth scenarios, as defined by NEMMCO for the purposes of its Statement of Opportunities. Source: NEMMCO Statement of Opportunities 2007, Pages 3-31 to 3-33.
141 Peak Demand growth forecasts for all jurisdictions excluding Northern Territory and Western Australia are defined as NEMMCO native maximum demand (POE 10 per cent) growth forecast for the ten year period commencing 2007/8 (summer peak) or 2007 (winter peak). Percentage growth rates are provided for Medium and High (parentheses) economic growth scenarios, as defined by NEMMCO for the purposes of its Statement of Opportunities. Source: NEMMCO Statement of Opportunities, Pages 3-35 to 3-39.
142 AEMC (2007), Review of the Effectiveness of Retail Competition in Victoria – First Final Report, Page viii

Consultation Report - Cost Benefit Analysis of Smart Metering and DLC
Victoria
NERA Economic Consulting
86
year. ‘Safety net’ retail prices in Victoria have, since 2003, been the subject of an agreement between the Victorian government and the three local retailers. Any timetable for the removal of safety net tariffs would need to be determined by the Victorian government.
10.2. Results of the Cost Benefit Analysis
Figure 10.1 below presents the costs and benefits for Victoria (in NPV terms) for Scenario 1, based on the estimates of costs and benefits made by the consultants in each of the relevant workstreams.143 The cost estimate shown includes both the transitional costs of the rollout and the on-going costs for retailers and distributors. The benefits shown distinguish between the avoided metering costs, the estimate of business efficiencies and the benefits flowing from the anticipated demand response.
Figure 10.1 NPV of Benefits and Costs ($m) – Victoria, Scenario 1
0
200
400
600
800
1,000
1,200
1,400
1,600
SMI Costs Avoided meter costs Business efficienciesand other benefits
Demand response
Given the uncertainty associated with the estimate of costs and benefits, in the majority of cases the consultants have provided a range for both costs and benefits. The figure shows both the lower and upper bound for each of the estimates.
Figure 10.2 summarises the costs and benefits in NPV terms for the non smart meter rollout of DLC (Scenario 3).
143 For a description of how to read the figure, see the description of figure 2.1 in section 2.2.

Consultation Report - Cost Benefit Analysis of Smart Metering and DLC
Victoria
NERA Economic Consulting
87
Figure 10.2 NPV of Benefits and Costs ($m) – Victoria, Scenario 3
0
20
40
60
80
100
120
140
160
DLC Costs Demand response
The values underlying Figure 10.1 and Figure 10.2 are presented in Table 10.1 below. In addition, Table 10.1 presents the NPV of costs and benefits for the other smart meter rollout scenarios (i.e.Scenarios 2 and 4).144
Table 10.1 NPV of Costs and Benefits ($m) – Victoria
VIC SMI costsAvoided meter
costs
Business efficiencies and other benefits
Demand response Net position
Scenario 1Distributor-led
Minimum Net Benefit (1,090) 375 584 31 (101)
Maximum Net Benefit (673) 492 760 111 690
Scenario 2Retailer-led
Minimum Net Benefit (1,500) 375 554 31 (540)
Maximum Net Benefit (931) 492 703 111 375
Scenario 3Non-smart meter DLC
Minimum Net Benefit (71) n/a n/a 76 5
Maximum Net Benefit (25) n/a n/a 140 116
Scenario 4Centralised communications
Minimum Net Benefit (1,389) 375 554 31 (429)
Maximum Net Benefit (811) 492 703 111 495
144 For Scenario 2 the cost estimates are based on EMCa’s Case 2a.

Consultation Report - Cost Benefit Analysis of Smart Metering and DLC
Victoria
NERA Economic Consulting
88
The breakdown of these overall figures by each of the major categories of costs and benefits is set out in Table 10.2.

Consultation Report - Cost Benefit Analysis of Smart Metering and DLC
Victoria
NERA Economic Consulting
89
Table 10.2 Breakdown of Costs and Benefits (NPV,$m) – Victoria

Consultation Report - Cost Benefit Analysis of Smart Metering and DLC
Victoria
NERA Economic Consulting
90
10.3. Discussion
10.3.1. Smart meter rollout scenarios
The results of the cost benefit analysis for Victoria show that a rollout of smart metering under the distributor-led scenario (Scenario 1) has a positive NPV if the low cost estimate is assumed. In this case, the rollout would be justified solely on the basis of avoided meter costs and business efficiency benefits alone. However, if the high cost estimate is assumed then the rollout only becomes justified if the higher benefit estimate is also assumed or if the alternative counterfactual is assumed.
On the basis of the values in Table 10.1, the sum of the low estimates of the expected business efficiencies and avoided meter costs is 42 per cent above the low estimate of costs made by EMCa, but 12 per cent below the high cost estimate. At the upper end, the business efficiency estimates and avoided meter costs are 15 per cent above the high cost estimate. Adding in the lower demand response benefits to the low expected business efficiencies and avoided meter costs means that the overall NPV of benefits for Victoria are still 9 per cent below the high cost estimate.
As for all other jurisdictions, the vast majority of the business efficiency benefits are driven by the distribution network efficiencies estimated by CRA. In the case of Victoria, these network benefits comprise 92 to 99 per cent of the total business efficiency benefits.145
As noted in Section 5, the key drivers of costs for each jurisdiction are the costs of metering and the costs of installation. Average meter costs per NMI for Victoria have been estimated by EMCa as between $138 and $192 per NMI. In relation to installation costs EMCa has estimated a range of $45 to $82 per NMI.
We are aware that the cost of smart metering infrastructure estimated by the Victorian distributors for the purpose of assessing the costs to pass through to customers by the ESC is above the cost estimated by EMCa. EMCa notes in its report that it has taken account of information provided by Victorian distributors, to the extent possible given its limitations in scope and comparability.146 Nevertheless EMCa comments that it appears that the aggregate costs as assessed by the Victorian distributors that provided information to EMCa are ‘somewhat higher’ than EMCa’s assessment.147 EMCa comments that there is a difference between the balance of probability on which it has formed judgements for the purposes of the cost benefit analysis and the level of certainty that is reasonably sought by a commercial entity seeking regulatory cost recovery for a large investment. At this stage there are uncertainties, particularly in regard to communications technologies suitable for rural areas and these will be best resolved through implementation of some kind (whether by further trialling or through a prototype-scale rollout). EMCa is comfortable with the assumptions that it has taken for the purposes of this cost benefit analysis.
145 The total business efficiency benefits reported in Table 10.1 also include retail business efficiency benefits and the
benefit to customers from a reduction in USE. 146 EMCa Workstream 1Transitional Costs Consultation Report (February 2008), section 14.6 147 EMCa Workstream 1Transitional Costs Consultation Report (February 2008), section 14.6.1
Consultation Report - Cost Benefit Analysis of Smart Metering and DLC
Victoria
NERA Economic Consulting
91
As discussed in section 5.1.4.2, we have adopted EMCa’s base assumption (Case 1a) in relation to the communication costs, which assumes PLC technology in rural and remote areas. Adopting EMCa’s alternative cases for remote and rural areas (Cases 1c and 1e) reduces the lower bound of the net benefit calculated for Victoria, but does not significantly alter the relative outcomes calculated for Victoria.
The avoided meter costs reported in the tables above relate to a counterfactual assumption of accumulation metering. We have also considered an alternative counterfactual. We note that in Victoria, the government has already taken a decision to mandate the rollout of smart meters to all households.148 This decision was an extension of the earlier decision to rollout manually read interval meters. The current policy for new and replacement meters in Victoria is therefore the installation of smart meters. However, if this were adopted as the alternate counterfactual for the purposes of the cost benefit analysis, it would result in a rollout of smart meters being assessed against a counterfactual which also assumed smart meters, i.e. there would be additional costs associated with the assumed rollout but the benefits of a rollout would already be included in the counterfactual against which the rollout was assessed.
In order to assess a smart meter rollout in Victoria on a more meaningful basis we have adopted as the alternate counterfactual a new and replacement metering policy for Victoria, which is the installation of an electronic manually read interval meter (type 5) for all new and replacement meters. That is, we have assumed that, absent the decision that has been taken in Victoria to rollout smart meters, Victoria would have been likely to have adopted a similar policy for new and replacement meters as that in Queensland and New South Wales. We have also assumed that these new and replacement meters continue to be read as accumulation meters.
Adopting this alternate counterfactual increases the NPV of the benefits by between $112 and $151 million. Consequently, adopting the alternative counterfactual leads to a positive net benefit in the lower bound of scenario 1, rather than the negative net benefit reported in Table 10.1. The alternative counterfactual does not otherwise alter the relative outcomes of the cost benefit analysis.
Table 10.3 and Figure 10.3 show the breakdown of costs and benefits on the basis of the alternative counterfactual new and replacement metering policy in Victoria.
148 Victoria has agreed on the functionalities to be included in the smart metering rollout, and the associated performance
and service levels. An interface with a Home Area Network is one of the functionalities included in the specification for Victoria. See Department of Primary Industries, (2007), Advanced Metering Infrastructure - Minimum AMI Functionality Specification (Victoria), Release 1.0, October.

Consultation Report - Cost Benefit Analysis of Smart Metering and DLC
Victoria
NERA Economic Consulting
92
Table 10.3 NPV of Benefits and Costs Using Alternative Counterfactual ($m) – Victoria,
Scenario 1
VIC SMI costsAvoided meter
costs
Business efficiencies and other benefits
Demand response Net position
Scenario 1Distributor-led
Minimum Net Benefit (1,090) 487 584 31 12
Maximum Net Benefit (673) 643 760 111 841
Figure 10.3 NPV of Benefits and Costs Using Alternative Counterfactual ($m) – Victoria,
Scenario 1
0
200
400
600
800
1,000
1,200
1,400
1,600
SMI Costs Avoided meter costs Business efficienciesand other benefits
Demand response
A breakdown of the network efficiency benefits calculated by CRA for Victoria are set out in Figure 10.4.
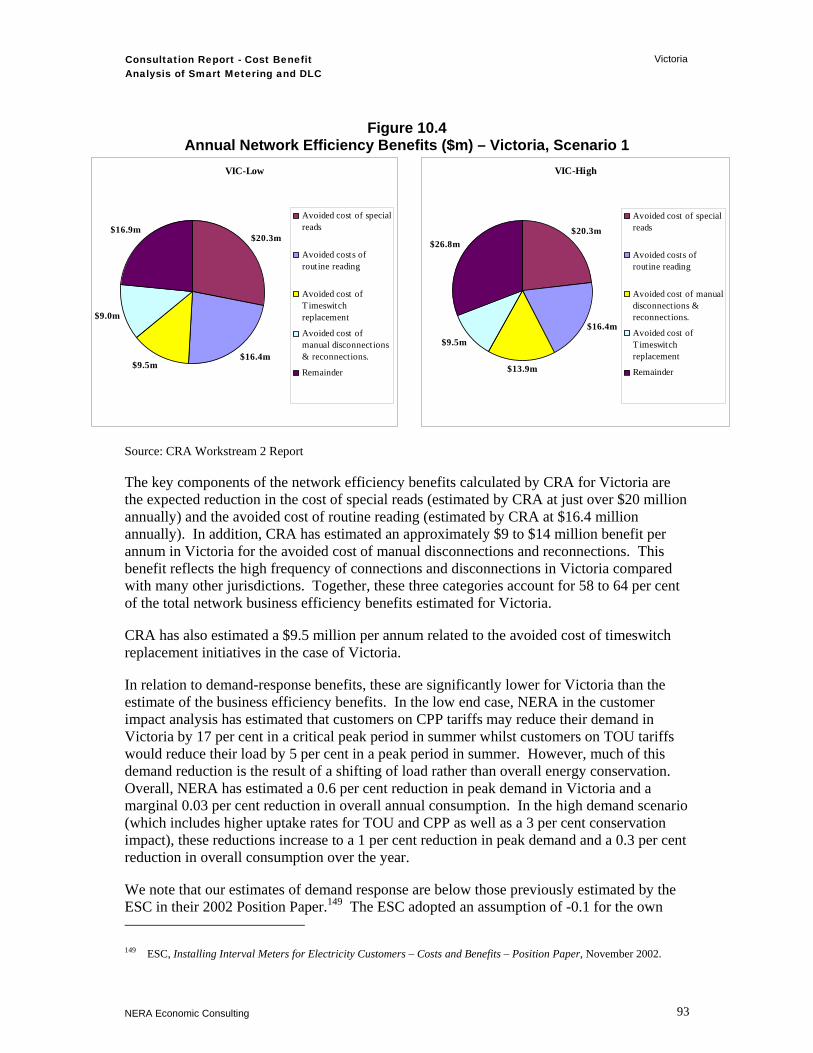
Consultation Report - Cost Benefit Analysis of Smart Metering and DLC
Victoria
NERA Economic Consulting
93
Figure 10.4 Annual Network Efficiency Benefits ($m) – Victoria, Scenario 1
Source: CRA Workstream 2 Report
The key components of the network efficiency benefits calculated by CRA for Victoria are the expected reduction in the cost of special reads (estimated by CRA at just over $20 million annually) and the avoided cost of routine reading (estimated by CRA at $16.4 million annually). In addition, CRA has estimated an approximately $9 to $14 million benefit per annum in Victoria for the avoided cost of manual disconnections and reconnections. This benefit reflects the high frequency of connections and disconnections in Victoria compared with many other jurisdictions. Together, these three categories account for 58 to 64 per cent of the total network business efficiency benefits estimated for Victoria.
CRA has also estimated a $9.5 million per annum related to the avoided cost of timeswitch replacement initiatives in the case of Victoria.
In relation to demand-response benefits, these are significantly lower for Victoria than the estimate of the business efficiency benefits. In the low end case, NERA in the customer impact analysis has estimated that customers on CPP tariffs may reduce their demand in Victoria by 17 per cent in a critical peak period in summer whilst customers on TOU tariffs would reduce their load by 5 per cent in a peak period in summer. However, much of this demand reduction is the result of a shifting of load rather than overall energy conservation. Overall, NERA has estimated a 0.6 per cent reduction in peak demand in Victoria and a marginal 0.03 per cent reduction in overall annual consumption. In the high demand scenario (which includes higher uptake rates for TOU and CPP as well as a 3 per cent conservation impact), these reductions increase to a 1 per cent reduction in peak demand and a 0.3 per cent reduction in overall consumption over the year.
We note that our estimates of demand response are below those previously estimated by the ESC in their 2002 Position Paper.149 The ESC adopted an assumption of -0.1 for the own 149 ESC, Installing Interval Meters for Electricity Customers – Costs and Benefits – Position Paper, November 2002.
VIC-Low
$20.3m
$16.4m$9.5m
$9.0m
$16.9mAvoided cost of specialreads
Avoided costs ofroutine reading
Avoided cost ofT imeswitchreplacement
Avoided cost ofmanual disconnections& reconnections.
Remainder
VIC-High
$20.3m
$16.4m
$13.9m
$9.5m
$26.8m
Avoided cost of specialreads
Avoided costs ofroutine reading
Avoided cost of manualdisconnections &reconnections.
Avoided cost ofTimeswitchreplacement
Remainder

Consultation Report - Cost Benefit Analysis of Smart Metering and DLC
Victoria
NERA Economic Consulting
94
price elasticity for residential consumers facing TOU tariffs, based on a review of a number of studies conducted in the United States of America. In contrast, NERA has adopted a cross price elasticity estimates for residential consumers of -0.076 and an own price elasticity of -0.041, based on the results of the Statewide Pricing Pilot (SPP) in California, which we consider to be the most comprehensive study in relation to the demand impacts of TOU tariffs and CPP.150 A 2005 study by CRA and Impaq Consulting for the Victorian Department of Infrastructure adopted the same values from the SPP and estimated that peak demand amongst residential consumers could fall by up to 10 per cent assuming a 100 per cent uptake of TOU tariffs. This contrasts with our results that overall demand from residential customers in Victoria may fall by 1 per cent, as a result of the lower uptake assumptions adopted in our analysis.151
As a result, the demand response benefits estimated for Victoria are relatively modest. In the low demand response case, they are dominated by network deferral and reductions in USE, with a smaller contribution from generation operating cost. In the high demand response case, all three of these benefit categories increase and greenhouse gas emission reductions also become significant, largely arising as a result of the increased conservation effect. We note that we have taken CRA’s estimate of the benefit associated with generation operating costs rather than their assessment of the benefit associated with reductions in generation offer costs, which would further increase the market benefit estimate.152
The results presented here also do not include the expected costs and benefits of including an interface to a HAN (functionality 16). We note that where the HAN capability is incorporated into the smart metering system and where DLC capability and IHD are provided as a result, the expected demand-response benefits would be greater than estimated in our base analysis, leading to higher market benefits. In the case of the IHD, this additional demand response is dependent on a resultant enhanced responsiveness to TOU tariffs and CPP, which is uncertain. Our analysis indicates that including the HAN would, in the lower bound for Scenario 1, decrease the net benefit estimated for Victoria by $4 million but, in the upper bound may increase the net benefit by $59 million.
The levels of net benefits of Scenarios 2 and 4 for Victoria are both lower than for Scenario 1. This primarily reflects the higher cost estimates under these scenarios. As discussed in section 5, this is driven by the higher costs assumed by EMCa for the communications required by these scenarios. The costs per meter are also assumed to be higher under Scenarios 2 and 4 as they allow for a separate plug-in modem to facilitate customer churn.
The level of distributor business efficiency benefits is also lower under Scenarios 2 and 4, primarily as a result of the exclusion of a proportion of the benefits associated with improved
150 CRA, Impact Evaluation of the Califorian Statewide Pricing Pilot, March 2005. The elasticities reported above are for
critical peak days in summer, the elasticities applying to non-peak days and to winter periods are lower. See NERA, Workstream 4 Consumer Impacts Consultation Report (February 2008), Section 5.1 for a full discussion in relation to the elasticities used and Appendix A.1.1 for a description of previous estimates made for Victoria.
151 Note that for residential customers in Victoria facing CPP prices NERA has estimated that peak demand may reduce by 17 per cent in a critical peak period in summer whilst customers on TOU tariffs may reduce their load by 5 per cent in a peak period in summer. See NERA, Workstream 4 Consumer Impacts Consultation Report (February 2008), Appendix B.5.
152 See discussion in section 6.3.2

Consultation Report - Cost Benefit Analysis of Smart Metering and DLC
Victoria
NERA Economic Consulting
95
outage detection. Demand-response benefits remain unchanged between all smart metering scenarios.
10.3.2. Scenario 3: Non-smart Meter DLC rollout
For the non smart meter rollout scenario for Victoria, it is assumed that DLC is facilitated via FM radio signals.
As discussed in section 6, there are no business efficiency benefits associated with Scenario 3, as this scenario relates only to a rollout of DLC capability.
The demand benefits are higher under Scenario 3 than for the smart meter rollout scenarios, as a result of faster rollout times and greater uptake assumptions. The costs of a DLC rollout are also lower than they are for the smart meter scenarios.
Overall, Scenario 3 is positive in NPV terms for Victoria. The magnitude of the positive NPV is lower than the positive NPV case for a smart meter rollout under Scenario 1, i.e. $116 million as compared to $690 million. However, as discussed in the previous section, the minimum net benefit outcome for a smart meter rollout for Victoria has a negative NPV of $101 million.
The estimated costs are also of a lower order of magnitude for Scenario 3 compared to Scenario 1. In relation to the ratio of benefits to costs, Scenario 3 has a ratio of 560 per cent in the maximum net benefit case. For Scenario 1, the ratio is 203 per cent in the maximum net benefit case.
10.4. Summary
The results of the cost benefit analysis for Victoria show that whether a rollout of smart metering under the distributor led scenario (Scenario 1) has a positive or negative NPV depends on whether the high or low cost estimate is assumed and the counterfactual adopted for new and replacement meters in the absence of a smart meter rollout.
If the (potentially more meaningful) current policy meter counterfactual is assumed then Scenario 1 would be justified on either the low or high cost estimates.
Assuming an accumulation counterfactual, under the low cost estimate, a distributor-led rollout of smart metering is justified even under the low estimate of business efficiency benefits. However, under the high cost estimate then the high estimate of business efficiency benefits is required to make the rollout positive.
Under the low cost estimates the NPV of the net benefits under a smart metering rollout is also significantly greater than the NPV of the net benefit of a non-smart meter DLC rollout (Scenario 3). However, the NPV of non-smart meter DLC rollout is estimated to be positive under both the low and high estimate of costs, while the smart metering rollout is negative if estimated costs are high. In relation to the ratio of costs to benefits, Scenario 3 also has a higher ratio than does Scenario 1.
In the case of Victoria it therefore appears important to ensure that the costs of the rollout are kept as close to the low end of the range as possible and that effort is focused on ensuring that

Consultation Report - Cost Benefit Analysis of Smart Metering and DLC
Victoria
NERA Economic Consulting
96
the full estimate of distributor business efficiencies is realised together with demand response benefits. We note that the inclusion of an interface with a HAN may increase the net benefit compared to that reported in Table 10.1. However this would be dependent on achieving either a high take-up rate for DLC via the HAN capability or a conservation impact from the provision of IHDs.

Consultation Report - Cost Benefit Analysis of Smart Metering and DLC
South Australia
NERA Economic Consulting
97
11. South Australia
This section discusses the results of the cost benefit analysis for South Australia. The detailed breakdown of the analysis by different stakeholders is presented in Appendix D.
11.1. Key Jurisdictional Characteristics
Electricity demand grew by approximately 5 per cent in South Australia during 2006/7.153 However, growth was lower in the preceding year and is forecast to grow at an average rate of 1.4 per cent (4.5 per cent) per annum in the future.154
Peak load growth has been variable, averaging around 5 per cent per annum in recent years.155 Looking forward, peak demand, occurring in summer, is forecast to grow at an average rate of 2.1 per cent (4.9 per cent) per annum.156
South Australia has suffered from significant summer maximum demand network constraints that have, in recent years, led to forced outages in isolated areas. Peak load growth is being driven in South Australia at least in part by a growth in the use of air-conditioners. Air-conditioner penetration in South Australia was estimated at 85 per cent in 2005157 and is forecast to continue to rise. There has also been a shift from evaporative to refrigerative air-conditioning.
The network constraint problems in South Australia are being addressed via additional network investment. In the price determination for the regulatory period 1 July 2005 to 30 June 2010, The Essential Services Commission of South Australia (ESCOSA) made allowance for additional capital expenditure to assist in meeting forecast growth in peak demand. It also made allowance for a number of state-based demand management and contingent supply initiatives.158 In particular, ETSA Utilities has been trialling DLC of air-conditioners using FM radio frequency.
South Australia has particularly peaky summer load. In addition, peak demand days may occur over 4 consecutive days. This may limit the effectiveness of tariff-based demand response initiatives, as customers experience response fatigue.
153 NEMMCO Statement of Opportunities, Table 16 South Australian Scheduled Energy Projections. 154 Demand growth forecasts for all jurisdictions excluding Northern Territory and Western Australia are defined as
NEMMCO annual native energy growth forecast for the ten year period commencing 1 July 2007. Percentage growth rates are provided for Medium and High (parentheses) economic growth scenarios, as defined by NEMMCO for the purposes of its Statement of Opportunities. Source: NEMMCO Statement of Opportunities 2007, Pages 3-31 to 3-33.
155 NEMMCO Statement of Opportunities, Table 14 South Australian Summer Scheduled Maximum Demand Projections. 156 Peak Demand growth forecasts for all jurisdictions excluding Northern Territory and Western Australia are defined as
NEMMCO native maximum demand (POE 10 per cent) growth forecast for the ten year period commencing 2007/8 (summer peak) or 2007 (winter peak). Percentage growth rates are provided for Medium and High (parentheses) economic growth scenarios, as defined by NEMMCO for the purposes of its Statement of Opportunities. Source: NEMMCO Statement of Opportunities, Pages 3-35 to 3-39.
157 Energy Efficient Strategies, Status of Air-Conditioners in Australia – A report prepared for NAEEEC, January 2006. 158 ESCOSA (2005), 2005 - 2010 Electricity Distribution Price Determination Part A – Statement of Reasons.

Consultation Report - Cost Benefit Analysis of Smart Metering and DLC
South Australia
NERA Economic Consulting
98
In 2000, the previously government-owned retailer was sold to the private sector, and is now owned by AGL. Full retail competition was introduced in South Australia on 1 January 2003. Default retail tariffs have been legislated for customers consuming less than 160MWh per year and are available should they choose not to enter a market contract. Indications are that the development of competition in the South Australian retail energy market is proceeding well.159 No timetable has been set as yet for the removal of transitional default tariff regulatory arrangements.160
In South Australia there is a relatively low proportion of sites that are considered to be ‘difficult installations’ due to the presence of asbestos meter boards as well as meter space and wiring issues.
Current safety regulations in South Australia may inhibit the realisation of some potential benefits from smart metering, in particular remote connect/disconnect, as a representative from ETSA Utilities needs to be present when a premise is connected.
11.2. Results of the Cost Benefit Analysis
Figure 11.1 below presents the costs and benefits for South Australia (in NPV terms) for Scenario 1, based on the estimates of costs and benefits made by the consultants in each of the relevant workstreams.161 The cost estimate shown includes both the transitional costs of the rollout and the on-going costs for retailers and distributors. The benefits shown distinguish between the avoided metering costs, the estimate of business efficiencies and the benefits flowing from the anticipated demand response.
159 NERA Economic Consulting (2007), Review of the Effectiveness of Energy Retail Market Competition in South
Australia: Phase 2 Report for ESCOSA, Page i. 160 The AEMC is scheduled to undertake a separate review of the effectiveness of retail competition in South Australia in
2008. Similar to Victoria, it is possible that the AEMC will recommend the removal of default tariffs following the outcome of that review.
161 For a description of how to read the figure, see the description of figure 2.1 in section 2.2.

Consultation Report - Cost Benefit Analysis of Smart Metering and DLC
South Australia
NERA Economic Consulting
99
Figure 11.1 NPV of Benefits and Costs ($m) – South Australia, Scenario 1
0
50
100
150
200
250
300
350
400
450
SMI Costs Avoided meter costs Business efficienciesand other benefits
Demand response
Given the uncertainty associated with the estimates of costs and benefits in the majority of cases the consultants have provided a range for both costs and benefits. The figure shows both the lower and upper bound for each of the estimates.
Figure 11.2 summarises the costs and benefits in NPV terms for the non smart meter rollout of DLC (Scenario 3).
Figure 11.2 NPV of Benefits and Costs ($m) – South Australia, Scenario 3
0
10
20
30
40
50
60
70
80
90
DLC Costs Demand response
The values underlying Figure 11.1 and Figure 11.2 are presented in Table 11.1 below. In addition, Table 11.1 presents the NPV of costs and benefits for the other smart meter rollout scenarios (i.e. Scenarios 2 and 4).

Consultation Report - Cost Benefit Analysis of Smart Metering and DLC
South Australia
NERA Economic Consulting
100
Table 11.1 NPV of Costs and Benefits ($m) – South Australia
SA SMI costsAvoided meter
costs
Business efficiencies and other benefits
Demand response Net position
Scenario 1Distributor-led
Minimum Net Benefit (307) 83 134 17 (74)
Maximum Net Benefit (188) 134 166 88 200
Scenario 2Retailer-led
Minimum Net Benefit (444) 83 127 17 (217)
Maximum Net Benefit (274) 134 152 88 99
Scenario 3Non-smart meter DLC
Minimum Net Benefit (41) n/a n/a 41 (0)
Maximum Net Benefit (14) n/a n/a 81 66
Scenario 4Centralised communications
Minimum Net Benefit (413) 83 127 17 (186)
Maximum Net Benefit (236) 134 152 88 138
The breakdown of these overall figures by each of the major categories of costs and benefits is set out in Table 11.2.
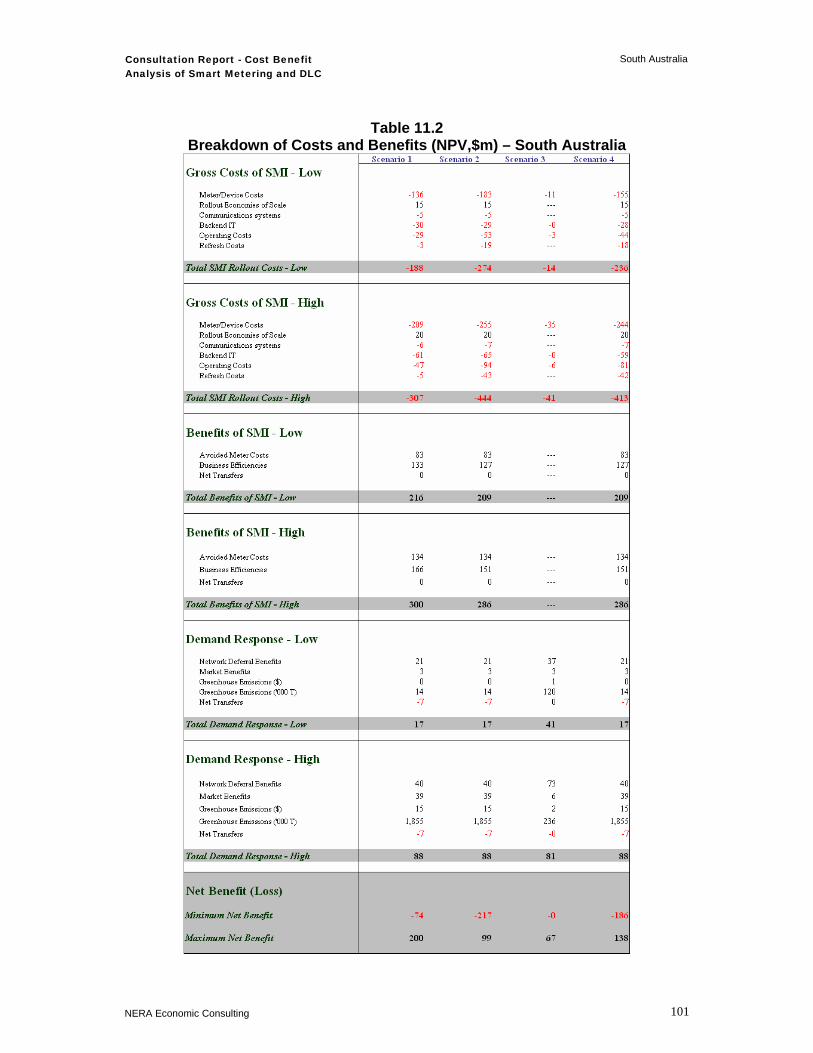
Consultation Report - Cost Benefit Analysis of Smart Metering and DLC
South Australia
NERA Economic Consulting
101
Table 11.2 Breakdown of Costs and Benefits (NPV,$m) – South Australia

Consultation Report - Cost Benefit Analysis of Smart Metering and DLC
South Australia
NERA Economic Consulting
102
In South Australia, consumers typically pay for the cost of additional import/export metering where they install PV cells. As a result, the avoided cost represents a consumer benefit. However, we note that it has been included as part of overall business efficiencies in the above table.
11.3. Discussion
11.3.1. Smart meter rollout scenarios
The results of the cost benefit analysis for South Australia show that a smart meter rollout under Scenario 1 is estimated to have a positive net benefit at the upper end and a negative net benefit at the lower end. Under the lower cost estimate, the avoided metering costs and the distributor business efficiency benefits alone would justify a smart meter rollout. However, under the high cost estimate, even the higher estimates of avoided metering costs and distributor business efficiency benefits are not large enough for the rollout to be net positive. Demand response benefits could make up part of this shortfall in the high case.
On the basis of the values in Table 11.1, the sum of the low estimates of the expected business efficiencies and avoided meter costs is 15 per cent above the low estimate of costs made by EMCa, but 30 per cent below the high cost estimate. Once demand response benefits are added, then the total expected benefits are 24 per cent below the higher cost estimate. On the basis of the high benefit estimates, the distributor business efficiency estimates and avoided meter costs are 2 per cent lower than the high cost estimate.
In common with all of the other jurisdictions, the vast majority of the business efficiency benefits are driven by the distribution network efficiencies estimated by CRA.162
As noted in section 5, the key drivers of costs for each jurisdiction are the costs of metering and the costs of installation. Average meter costs per NMI for South Australia have been estimated by EMCa as between $141 and $195 per NMI. EMCa has also estimated installation costs in a range of $40 to $74 per NMI. The low end of this range represents the lowest installation cost estimated for any jurisdiction. The low installation costs relative to other jurisdictions are driven by a lower proportion of difficult installations.
As discussed in section 5.1.4.2, we have adopted EMCa’s base assumption (Case 1a) in relation to the communication costs, which assumes PLC technology in rural and remote areas. Adopting EMCa’s alternative cases for remote and rural areas (Cases 1c and 1e) reduces the lower bound of the net benefit calculated for South Australia, but does not significantly alter the relative outcomes.
The avoided meter cost estimates are based on a counterfactual of accumulation meters. In South Australia, the current replacement policy is the installation of electromechanical accumulation meters for all new and replacement meters. As a result, there is no alternate metering base case for South Australia.
162 The total business efficiency benefits reported in Table 11.1 also include retail business efficiency benefits and the
benefit to customers from a reduction in USE.

Consultation Report - Cost Benefit Analysis of Smart Metering and DLC
South Australia
NERA Economic Consulting
103
A breakdown of the network efficiency benefits calculated by CRA for South Australia are set out in Figure 7.3
Figure 11.3 Annual Network Efficiency Benefits ($m) – South Australia, Scenario 1
Source: CRA Workstream 2 Report
The key components of the network efficiency benefits calculated by CRA for South Australia are the avoided cost of manual disconnections and reconnections ($3.7 million per annum) and the avoided cost of routine reading ($4.2 million per annum). The avoided cost of special reads is estimated by CRA at $1 million annually, which, on a per NMI basis, is the lowest benefit estimated for any of the jurisdictions for this category. Together, these three categories account for 42 to 47 per cent of the total network business efficiency benefits estimated for South Australia.
We note that in South Australia, as in Queensland, there are currently regulations that require a site visit from the distributor for all reconnections. As a result, the full benefit of the avoided cost of disconnections and reconnections would not be realised in the absence of a change to this regulatory requirement. In estimating the benefit associated with avoided connections and reconnections, CRA has assumed that this requirement would be changed in order to realise these benefits. This benefit is therefore reflected in the net benefit results in this report. If the requirement was not changed, the benefit would fall to half of that estimated by CRA, as a site visit would be avoided for disconnections but not for reconnections. In the case of South Australia, this would reduce the NPV of business efficiency benefits by $13 million in NPV terms compared with those reported in Table 11.2. However, even with this reduction the rollout of smart meters under Scenario 1 would still be justified on the basis of business benefits alone for South Australia under the low cost scenario, with the lower end of the benefit estimate still remaining 18 per cent above the low end of the costs.
CRA notes in its report that per customer benefits are lower in South Australia than the national average, mainly due to much lower costs for special reads (15% of the national
SA-Low
$4.2m
$3.7m
$3.0m
$1.9m
$6.2m
Avoided costs ofroutine reading
Avoided cost of manualdisconnections &reconnections.
Avoided cost ofinstalling prepaymentmetering for customers
Avoided cost ofexisting DB QoSmonitoring schemes
Remainder
SA-High
$4.2m
$3.7m
$3.0m$2.1m
$8.4m
Avoided costs ofroutine reading
Avoided cost of manualdisconnections &reconnections.
Avoided cost ofinstalling prepaymentmetering for customers
Avoided cost ofexisting DB QoSmonitoring schemes
Remainder

Consultation Report - Cost Benefit Analysis of Smart Metering and DLC
South Australia
NERA Economic Consulting
104
average driven by lower property churn, and much lower reading costs), lower costs for routine meter reading and less reduction in cost of calls to faults and emergencies lines.163
Demand response benefits for South Australia are an order of magnitude lower than the estimate of the business efficiency benefits. In the low end case, NERA estimate in the consumer impact assessment that residential customers on CPP tariffs may reduce their demand in South Australia by 14.5 per cent in a critical peak period in summer, whilst customers on TOU tariffs would reduce their load by 2.8 per cent in a peak period in summer.164 However, much of this demand reduction is the result of a shifting of load rather than overall energy conservation. Overall, NERA has estimated a 0.96 per cent reduction in peak demand in South Australia and a marginal 0.04 per cent reduction in overall annual consumption. In the high demand scenario (which includes higher uptake rates for TOU and CPP as well as a 3 per cent conservation impact), these reductions increase to a 1.8 per cent reduction in peak demand and a 0.45 per cent reduction in overall consumption over the year.
As a result, the demand response benefits estimated for South Australia are relatively modest. In the low demand response case, they are dominated by network deferral and reductions in USE, with a smaller contribution from generation operating cost. In the high demand response case, all three of these benefits categories increase and greenhouse gas emission reductions also become significant, largely due to the increased conservation effect. We note that we have taken CRA’s estimate of the benefit associated with generation operating costs rather than their assessment of the benefit associated with reductions in generation offer costs, which would further increase the market benefit estimate.165
In the case of South Australia, there is concern regarding the extent of potential customer fatigue associated with consecutive critical peak events. South Australia has experienced four or more consecutive critical peak days in 2001, 2002 and 2004.166 In 2002, there were six critical peak days in succession from 16 to 21 December.
The Statewide Pricing Pilot in California examined the impact of consecutive CPP days and concluded that there was little evidence of demand fatigue where CPP events occurred on two consecutive days.167 However, it appears plausible that where CPP events occurred over 4 consecutive days customers would find it difficult to sustain the demand response they managed to achieve on the first day. In the case of DLC, the demand response may still be achievable on the third and fourth day to the extent that customers do not experience an increase in ambient temperature as a result of the cycling of air-conditioners.
163 CRA Workstream 2 Network Impact Consultation Report (February 2008), section 5. 164 NERA, Workstream 4 Consumer Impacts Consultation Report (February 2008). 165 See discussion in section 6.3. 166 Based on the definition of critical peak period adopted by NERA in the customer impact analysis (workstream 4),
which is the 12 days on which load is the highest during any year. 167 Evidence from the Statewide Pricing Pilot in relation to consecutive critical price days found that the elasticity of
substitution on the second day was larger in absolute terms than the first critical peak day and that the reduction in peak demand on the second critical peak day was not statistically different from the first critical peak day average response. CRA, Impact Evaluation of the California Statewide Pricing Pilot, March 2005, p. 66

Consultation Report - Cost Benefit Analysis of Smart Metering and DLC
South Australia
NERA Economic Consulting
105
Given the four day peaks experienced in South Australia, we note that the demand response estimates may over-state the actual achievable demand reduction. This means that the network deferral benefit estimated by CRA may overstate the magnitude of achievable deferred network investment. Given that demand response benefit is an important element in justifying a smart meter rollout in South Australia (unlike in Queensland or New South Wales), the uncertainty surrounding the extent of achievable demand response in South Australia raises uncertainty as to the whether a smart meter rollout would have a positive net benefit. If the network deferral benefit were half of that estimated by CRA as a result of the difficulty of sustaining a demand response over four consecutive peak days, the estimated demand response benefit would decrease by between $10 million and $20 million. However, assuming the lower end of the cost estimates, this still results in a positive net benefit for Scenario 1, all other things remaining equal.168
The results presented here also do not include the expected costs and benefits of including an interface to a HAN (functionality 16). We note that where the HAN capability is incorporated into the smart metering system and where DLC capability and IHD are provided as a result, the expected demand-response benefits would be greater than estimated in our base analysis, leading to higher market benefits. In the case of the IHD, this additional demand response is dependent on a resultant enhanced responsiveness to TOU tariffs and CPP, which is uncertain. Our analysis indicates that including the HAN would increase the net benefit estimated for South Australia for scenario 1 by at least $7 million and possibly by as much as $57 million. If the upper end of this range were to be achieved, this would result in a positive net benefit even if the higher SMI rollout costs were assumed for scenario 1, all other things remaining equal. However we note that this higher response assumes an additional conservation impact from the provision of IHDs to customers, which is highly uncertain. It also ignores the possibility of customer fatigue in relation to consecutive CPP days which, as discussed above, may lower the achievable demand response.
The levels of net benefits of Scenarios 2 and 4 for South Australia are both lower than for scenario 1. This primarily reflects the higher cost estimates under these scenarios. As discussed in section 5, this is driven by the higher costs assumed by EMCa for the communications required by these scenarios. The costs per meter are also assumed to be higher under Scenarios 2 and 4 as they allow for a separate plug-in modem to facilitated customer churn. The level of distributor business efficiency benefits is also lower under Scenarios 2 and 4, primarily as a result of the exclusion of a proportion of the benefits associated with improved outage detection. Demand response benefits remain unchanged between all smart metering scenarios.
Table 11.3 summarises the results of the sensitivity testing discussed above.
168 The maximum net benefit in South Australia remains positive under Scenario 1 even if both network deferral benefits
and avoided costs of disconnections and reconnections are reduced by 50 per cent.
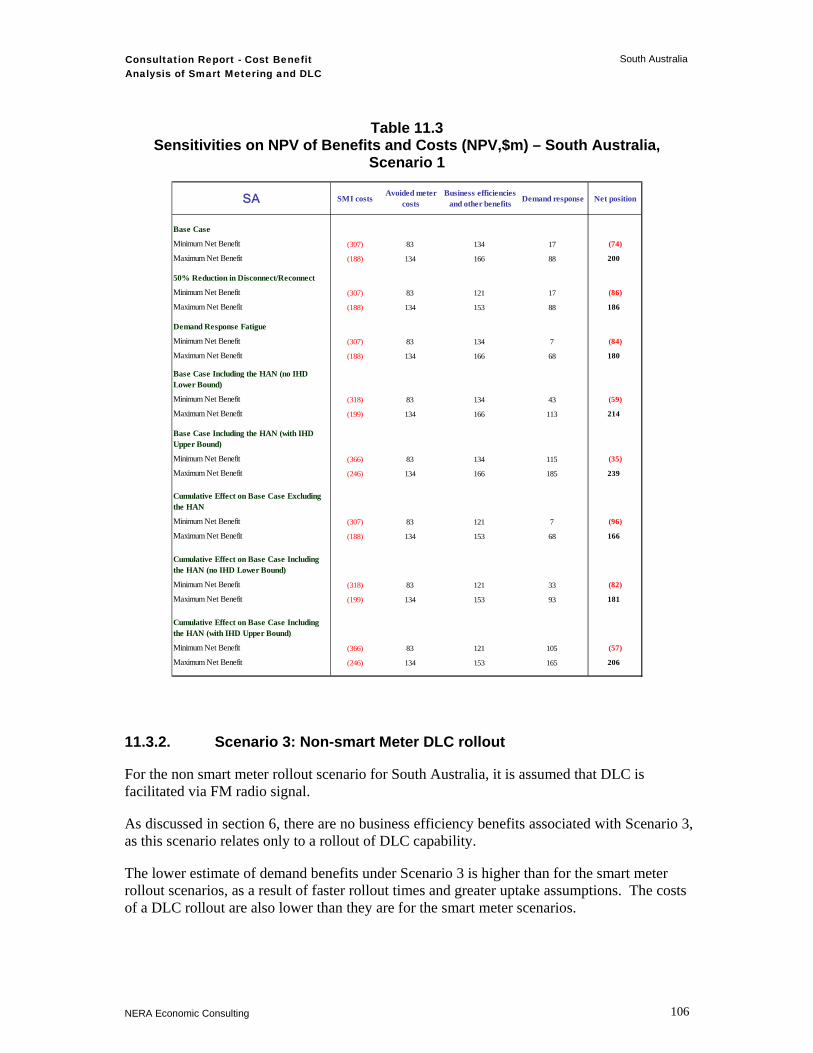
Consultation Report - Cost Benefit Analysis of Smart Metering and DLC
South Australia
NERA Economic Consulting
106
Table 11.3 Sensitivities on NPV of Benefits and Costs (NPV,$m) – South Australia,
Scenario 1
SA SMI costsAvoided meter
costsBusiness efficiencies
and other benefits Demand response Net position
Base Case
Minimum Net Benefit (307) 83 134 17 (74)
Maximum Net Benefit (188) 134 166 88 200
50% Reduction in Disconnect/Reconnect
Minimum Net Benefit (307) 83 121 17 (86)
Maximum Net Benefit (188) 134 153 88 186
Demand Response Fatigue
Minimum Net Benefit (307) 83 134 7 (84)
Maximum Net Benefit (188) 134 166 68 180
Base Case Including the HAN (no IHD Lower Bound)
Minimum Net Benefit (318) 83 134 43 (59)
Maximum Net Benefit (199) 134 166 113 214
Base Case Including the HAN (with IHD Upper Bound)
Minimum Net Benefit (366) 83 134 115 (35)
Maximum Net Benefit (246) 134 166 185 239
Cumulative Effect on Base Case Excluding the HAN
Minimum Net Benefit (307) 83 121 7 (96)
Maximum Net Benefit (188) 134 153 68 166
Cumulative Effect on Base Case Including the HAN (no IHD Lower Bound)
Minimum Net Benefit (318) 83 121 33 (82)
Maximum Net Benefit (199) 134 153 93 181
Cumulative Effect on Base Case Including the HAN (with IHD Upper Bound)
Minimum Net Benefit (366) 83 121 105 (57)
Maximum Net Benefit (246) 134 153 165 206
11.3.2. Scenario 3: Non-smart Meter DLC rollout
For the non smart meter rollout scenario for South Australia, it is assumed that DLC is facilitated via FM radio signal.
As discussed in section 6, there are no business efficiency benefits associated with Scenario 3, as this scenario relates only to a rollout of DLC capability.
The lower estimate of demand benefits under Scenario 3 is higher than for the smart meter rollout scenarios, as a result of faster rollout times and greater uptake assumptions. The costs of a DLC rollout are also lower than they are for the smart meter scenarios.

Consultation Report - Cost Benefit Analysis of Smart Metering and DLC
South Australia
NERA Economic Consulting
107
Overall, Scenario 3 is positive in NPV terms for South Australia, if the maximum demand response is assumed. The magnitude of the positive NPV is lower than for a smart meter rollout under Scenario 1, i.e. $66 million as compared to $200 million. However, the estimated costs are also of a lower order of magnitude. In relation to the ratio of benefits to costs, Scenario 3 has a ratio of 579 per cent in the upper case. For Scenario 1, the ratio of benefits to costs is 206 per cent in the upper case.
NERA’s assumptions on the extent of load that may be subject to DLC under Scenario 3 are based on an estimate of participation by consumers with pool pumps and air-conditioners above 1.9kW. We note that in South Australia ETSA Utilities is currently only trialling larger air-conditioning units (above 4kW). In addition, ETSA Utilities is not currently trialling DLC of pool pumps, due to health regulations that require pool pumps to be switched on when a person is in a pool. However, in other jurisdictions (i.e. New South Wales and Queensland), pool pumps have been incorporated within DLC trials. As a result, the extent of load that could participate in a DLC program as estimated by NERA may exceed that which ETSA Utilities may actually target, based on its approach in its current DLC trials. The estimated costs will also be above those that may actually be incurred by ETSA, as a result of the greater number of air-conditioners assumed to participate in the program, and inclusion of pool pumps.
In addition, as discussed above, the four day peaks experienced in South Australia raise additional uncertainty as to the extent of demand response benefits for South Australia compared to other jurisdictions. However, this may be less of an issue with the DLC of air-conditioning than it is for demand response facilitated via customer response to tariffs.
11.4. Summary
The results of the cost benefit analysis for South Australia show that for a rollout of smart metering under the distributor-led scenario (Scenario 1) to have a net positive benefit, it is necessary to have costs at the low end of the range estimated. Demand response benefits may assist in meeting any shortfall but would not result in a rollout becoming net positive if costs were at the high end of the range estimated, even taking into account the additional demand response that may be achievable with the inclusion of an interface to the HAN.
The NPV of the net benefits under a smart metering rollout is also an order of magnitude greater than the NPV of the net benefit of a non-smart meter DLC rollout (Scenario 3), i.e. $200 million compared with $66 million. However, in relation to the ratio of benefits to costs, Scenario 3 has a much higher ratio than does Scenario 1.
A decision on whether or not to rollout smart meters in South Australia therefore appears to be dependent both on a view as to the reasonableness of the estimates presented in relation to the distribution efficiency benefits and the meter and installation costs, and also on the likelihood of the estimated demand response benefits. As discussed above, the consecutive peak days experienced in South Australia may increase the uncertainty associated with achieving a sustained demand response, particularly via TOU and CPP tariffs.
In addition, to the extent that a DLC rollout may be more effective in reducing peak demand (as a result of the avoidance of customer fatigue on consecutive peak days), Scenario 3 may provide a more appropriate and cost effective strategy for South Australia.

Consultation Report - Cost Benefit Analysis of Smart Metering and DLC
Tasmania
NERA Economic Consulting
108
12. Tasmania
This section discusses the results of the cost benefit analysis for Tasmania. The detailed breakdown of the analysis by different stakeholders is presented in Appendix D.
All of the results presented in this section and at Appendix D are based on a counterfactual of accumulation meters.
12.1. Key Jurisdictional Characteristics
Tasmania’s load is characterised by maximum demand occurring in winter, driven by heating load. Load growth has been relatively low compared to other jurisdictions, in part because there has not been the large air-conditioner load growth observed elsewhere. Air-conditioner penetration in Tasmania was estimated at just 20 per cent in 2005.169 Despite this, average consumption is relatively high, reflecting electric heating costs.
Looking forward, total electricity demand is forecast to grow at an average rate of 1.5 per cent (2.2 per cent) per annum.170 Peak winter demand is forecast to grow at an average rate of 1.5 per cent (2.5 per cent) per annum.171
Almost all households in Tasmania have two meters. One is for ordinary load and the other is for hot water and off-peak demand. These are all charged at a lower rate. To encourage households to move away from wood heating, reverse-cycle air-conditioning (generally around 3.5kW) is connected to this separate circuit.
Tasmania also has a significant number of prepayment meters, around 45,000 in total which is roughly 20 per cent of small customers. Customers on these meters face TOU tariffs.
The Office of the Tasmanian Energy Regulator (OTTER) is currently undertaking a review of the timing for the introduction of Full Retail Competition (FRC) to residential customers, with FRC planned to commence in July 2010, subject to a public benefits test.172 Otherwise, Aurora Energy is the only electricity supplier for small customers and its retail tariffs are regulated by OTTER.
169 Source: Energy Efficient Strategies, Status of Air-Conditioners in Australia – A report prepared for NAEEEC, January
2006. 170 Demand growth forecasts for all jurisdictions excluding Northern Territory and Western Australia are defined as
NEMMCO annual native energy growth forecast for the ten year period commencing 1 July 2007. Percentage growth rates are provided for Medium and High (parentheses) economic growth scenarios, as defined by NEMMCO for the purposes of its Statement of Opportunities. Source: NEMMCO Statement of Opportunities 2007, Pages 3-31 to 3-33.
171 Peak Demand growth forecasts for all jurisdictions excluding Northern Territory and Western Australia are defined as NEMMCO native maximum demand (POE 10%) growth forecast for the ten year period commencing 2007/8 (summer peak) or 2007 (winter peak). Percentage growth rates are provided for Medium and High (parentheses) economic growth scenarios, as defined by NEMMCO for the purposes of its Statement of Opportunities. Source: NEMMCO Statement of Opportunities, Pages 3-35 to 3-39.
172 Source: AER Report, State of the Energy Market 2007, Page 178.

Consultation Report - Cost Benefit Analysis of Smart Metering and DLC
Tasmania
NERA Economic Consulting
109
12.2. Results of the Cost Benefit Analysis
Figure 12.1 below presents the costs and benefits for Tasmania (in NPV terms) for Scenario 1, based on the estimates of costs and benefits made by the consultants in each of the relevant workstreams.173 The cost estimate shown includes both the transitional costs of the rollout and the on-going costs for retailers and distributors. The benefits shown distinguish between the avoided metering costs, the estimate of business efficiencies and the benefits flowing from the anticipated demand response.
Figure 12.1 NPV of Benefits and Costs ($m) – Tasmania, Scenario 1
0
20
40
60
80
100
120
140
160
180
200
SMI Costs Avoided meter costs Business efficienciesand other benefits
Demand response
Given the uncertainty associated with the estimate of costs and benefits, in the majority of cases the consultants have provided a range for both costs and benefits. The figure shows both the lower and upper bound for each of the estimates. The values underlying Figure 12.1 are presented in Table 12.1 below. In addition Table 12.1 presents the NPV of costs and benefits for the other smart meter rollout scenarios (i.e. Scenarios 2 and 4).
173 For a description of how to read the figure, see the description of figure 2.1 in section 2.2.

Consultation Report - Cost Benefit Analysis of Smart Metering and DLC
Tasmania
NERA Economic Consulting
110
Table 12.1 NPV of Costs and Benefits ($m) – Tasmania
TAS SMI costsAvoided meter
costs
Business efficiencies and other benefits
Demand response Net position
Scenario 1Distributor-led
Minimum Net Benefit (152) 58 49 (2) (48)
Maximum Net Benefit (86) 97 75 (1) 84
Scenario 2Retailer-led
Minimum Net Benefit (191) 58 45 (2) (91)
Maximum Net Benefit (117) 97 65 (1) 43
Scenario 3Non-smart meter DLC
Minimum Net Benefit n/a n/a n/a n/a n/a
Maximum Net Benefit n/a n/a n/a n/a n/a
Scenario 4Centralised communications
Minimum Net Benefit (202) 58 45 (2) (102)
Maximum Net Benefit (105) 97 65 (1) 56
The breakdown of these overall figures by each of the major categories of costs and benefits is set out in Table 12.2.

Consultation Report - Cost Benefit Analysis of Smart Metering and DLC
Tasmania
NERA Economic Consulting
111
Table 12.2 Breakdown of Costs and Benefits (NPV,$m) – Tasmania
Scenario 1 Scenario 2 Scenario 4Gross Costs of SMI - Low
Meter/Device Costs (56) (70) (63)Rollout Economies of Scale 0 0 0Communications systems (4) (2) (2)Backend IT (13) (14) (12)Operating Costs (12) (25) (21)Refresh Costs (1) (6) (6)
Total SMI Rollout Costs - Low (86) (117) (105)
Gross Costs of SMI - High
Meter/Device Costs (95) (113) (113)Rollout Economies of Scale (3) (3) (1)Communications systems (5) (4) (6)Backend IT (27) (30) (47)Operating Costs (20) (28) (22)Refresh Costs (2) (15) (14)
Total SMI Rollout Costs - High (152) (191) (202)
Benefits of SMI - Low
Avoided Meter Costs 58 58 58Business Efficiencies 49 45 45Net Transfers 0 0 0
Total Benefits of SMI - Low 107 103 103
Benefits of SMI - High
Avoided Meter Costs 97 97 97Business Efficiencies 75 65 65Net Transfers 0 0 0
Total Benefits of SMI - High 172 162 162
Demand Response - Low
Network Deferral Benefits 0 0 0Market Benefits 0 0 0Greenhouse Emissions ($) 0 0 0Greenhouse Emissions ('000 T) 11 11 11Net Transfers (3) (3) (3)
Total Demand Response - Low (2) (2) (2)
Demand Response - High
Network Deferral Benefits 0 0 0Market Benefits 1 1 1Greenhouse Emissions ($) 0 0 0Greenhouse Emissions ('000 T) 26 26 26Net Transfers (3) (3) (3)
Total Demand Response - High (1) (1) (1)
Net Benefit (Loss)
Minimum Net Benefit (48) (91) (102)
Maximum Net Benefit 84 43 56

Consultation Report - Cost Benefit Analysis of Smart Metering and DLC
Tasmania
NERA Economic Consulting
112
12.3. Discussion
12.3.1. Smart meter rollout scenarios
The results of the cost benefit analysis for Tasmania show that a rollout of smart metering under the distributor-led scenario (Scenario 1) has a positive NPV if the low cost estimate is assumed. In this case, the rollout would be justified on the basis of avoided meter costs and business efficiency benefits alone. However, if the high cost estimate is assumed, then the rollout only becomes justified if the higher benefit estimate is also assumed (and then only marginally) and has a negative net benefit if the low benefit estimate is assumed.
On the basis of the values in Table 12.1, the sum of the low estimates of the expected business efficiencies and avoided meter costs is 24 per cent above the low estimate of costs made by EMCa but 30 per cent below the high cost estimate. At the upper end, the business efficiency estimates and avoided meter costs are 13 per cent above the high cost estimate.
The vast majority of the business efficiency benefits are driven by the distribution network efficiencies estimated by CRA.174
As noted in Section 5, the key drivers of costs for each jurisdiction are the costs of metering and the costs of installation. Average meter costs per NMI for Tasmania have been estimated by EMCa as between $156 and $254 per NMI. In relation to installation costs EMCa has estimated a range of $74 to $129 per NMI. Installation costs for Tasmania are at the upper end of the per NMI installation costs assumed for all jurisdictions, driven by a lower number if assumed installations achievable per day (based on customer density and access considerations).
As discussed in section 5.1.4.2, we have adopted EMCa’s base assumption (Case 1a) in relation to the communication costs, which assumes PLC technology in rural and remote areas. Adopting EMCa’s alternative cases for remote and rural areas (Cases 1c and 1e) does not alter the relative outcomes for Tasmania.
The avoided meter cost for Tasmania is based on a counterfactual of accumulation meters. We have also considered an alternate counterfactual based on a continuation of current metering policy in Tasmania, which is for the continuing rollout of an electronic manually-read interval meter (type 5) for all new and replacement meters. We have assumed that these new and replacement meters continue to be read as accumulation meters. Adopting this alternate counterfactual increases the benefits from avoided meter costs by between $15 and $26 million. As a result, it does not alter the relative outcomes of the cost benefit analysis.
A breakdown of the network efficiency benefits calculated by CRA for Tasmania are set out in Figure 11.3.
174 The total business efficiency benefits reported in Table 12.1 also include retail business efficiency benefits and the
benefit to customers from a reduction in USE.

Consultation Report - Cost Benefit Analysis of Smart Metering and DLC
Tasmania
NERA Economic Consulting
113
Figure 12.2 Annual Network Efficiency Benefits ($m) – Tasmania, Scenario 1
Source: CRA Workstream 2 Report The key components of the network efficiency benefits calculated by CRA for Tasmania are the expected reduction in the cost of special reads (estimated by CRA at $0.5 million annually), the avoided cost of routine reading (estimated by CRA at $2.3 million annually) and the avoided cost of manual disconnections and reconnections (estimated by CRA at $1.2 million). Together, these three categories account for 67 per cent of the low end of the total network business efficiency benefits estimated for Tasmania and 50 per cent of the high end.
Demand response benefits are estimated to be minimal in Tasmania. Demand in Tasmania is winter-peaking and there is currently sufficient excess network capacity in winter. Air-conditioning penetration is also much lower in Tasmania than in other jurisdictions. As a result, all CPP events are called in winter and do not affect summer peak load. In the low end case NERA estimates the customer impact analysis that residential customers on CPP tariffs would reduce their load by 6.0 per cent in winter whilst customers on TOU tariffs would reduce their load by 1.4 per cent in a peak period in summer and 1.1 per cent in winter. Consistent with other jurisdictions, much of this demand reduction is the result of a shifting of load rather than overall energy conservation. Overall, NERA has estimated a 0.34 per cent reduction in peak demand in Tasmania and a marginal 0.02 per cent reduction in overall annual consumption. In the high demand scenario (which includes higher uptake rates for TOU and CPP as well as a 3 per cent conservation impact), these reductions increase to a 0.89 per cent reduction in peak demand and a 0.38 per cent reduction in overall consumption over the year.
In addition, as noted in section 3.3.1, given that customers in Tasmania who are on prepayment meters already face TOU tariffs, the demand response estimated for Tasmania may be overstated, since much of the response may already be embedded in customers current responses to these tariffs.
The very low demand response estimated for Tasmania means that the associated benefits estimated by CRA are minimal. As a result, the customer surplus values associated with the
TAS-Low
$2.3m
$1.2m$0.5m
$0.5m
$1.5m
Avoided costs of routinereading
Avoided cost of manualdisconnections &reconnections.
Avoided cost of specialreads
Avoided cost of existingDB QoS monitoringschemes
Remainder
TAS-High
$2.3m
$1.6m
$1.2m
$0.7m
$2.2m
Avoided costs ofroutine reading
Avoided cost ofexisting DB QoSmonitoring schemes
Avoided cost of manualdisconnections &reconnections.
Reduced cost for poststorm supplyrestoration
Remainder

Consultation Report - Cost Benefit Analysis of Smart Metering and DLC
Tasmania
NERA Economic Consulting
114
changes in tariffs customers face outweigh the other demand response benefits for Tasmania. As a result, overall demand-response benefits are estimated to be negative, as customers face higher tariffs at peak times but do not change their load significantly in response to this price signal. In addition, we note that the relative prevalence of prepayment meters in Tasmania, and the TOU tariffs that customers on those meters already face, are likely to mean that the demand response benefits are lower than those NERA has estimated.
The results presented here also do not include the expected costs and benefits of including an interface to a HAN (functionality 16). Given Tasmania’s winter-peaking load characteristics there would be no impact on demand from incorporation of DLC capability within the smart meter functionality. However there would be an additional cost incurred at the meter. Our analysis indicates that including the HAN would decrease the net benefit estimated for Tasmania for scenario 1 by between $3 and $10 million.
The levels of net benefits of Scenarios 2 and 4 for Tasmania are both lower than for Scenario 1. This primarily reflects the higher cost estimates under these scenarios. As discussed in section 4, this is driven by the higher costs assumed by EMCa for the communications required by these scenarios. The costs per meter are also assumed to be higher under Scenarios 2 and 4 as they allow for a separate plug-in modem to facilitated customer churn.
The level of distributor business efficiency benefits is also lower under Scenarios 2 and 4, primarily as a result of the exclusion of benefits associated with improved outage detection. Demand response benefits remain unchanged between all smart metering scenarios.
12.3.2. Scenario 3: Non-smart Meter DLC rollout
Given its winter peaking profile Scenario 3 is not applicable for Tasmania.
12.4. Summary
The results of the cost benefit analysis for Tasmania show that a rollout of smart metering under the distributor-led scenario (Scenario 1) would only be justified if the cost estimate was anticipated to be at the low end of the range or the distributor business efficiency benefits were expected to be at the high end of the range.
A decision to rollout smart meters in Tasmania therefore, appears to be dependent on a view as to the reasonableness of the estimates presented in relation to the distribution efficiency benefits and the reasonableness of the cost estimates (particularly meter and installation costs).
There are no demand response benefits for Tasmania.

Consultation Report - Cost Benefit Analysis of Smart Metering and DLC
Western Australia
NERA Economic Consulting
115
13. Western Australia
This section discusses the results of the cost benefit analysis for Western Australia. The analysis has only been conducted for small residential and business customers connected to the SWIS.175 The detailed breakdown of the analysis by different stakeholders is presented in Appendix D.
13.1. Key Jurisdictional Characteristics
Total electricity demand is forecast to grow at an average rate of 2.2 per cent (3.5 per cent) per annum,176 while peak demand, occurring in summer, is forecast to grow at an average rate of 3.3 per cent per annum.177 Air-conditioner penetration in Western Australia was estimated at 70 per cent in 2005178 and is forecast to continue to rise.
Western Power is in the process of exploring, and has already committed to, a large number of distribution network augmentation projects to meet forecast load growth.179
Full retail competition is yet to be introduced in Western Australia. The Office of Energy in Western Australia is, however, currently undertaking a review of the electricity retail market, and specifically assessing the costs and benefits of implementing FRC. This review is also assessing electricity tariff arrangements, and the costs and benefits of a rollout of smart meters. The Review is expected to finalise recommendations to the Minister by March 2008.
An implication of a lack of retail competition is that any tariff changes (for example the introduction of TOU tariffs or CPP) associated with a rollout of smart metering would need to be agreed and implemented through the price setting framework and would presumably be applied to all customers. This is contrary to the approach we have adopted to modelling the likely demand response benefits associated with the introduction of smart metering, as we have assumed that only a proportion of customers would elect to shift to TOU tariffs and/or CPP. If TOU tariffs or CPP were introduced to all customers, then the associated demand response benefits would likely be significantly higher than those reported here.
Western Power has indicated that there will be a need to replace approximately 300,000 meters (almost one third of the total meter stock) over the next few years due to accuracy problems. As a result, the assumed rollout profile for smart meters in Western Australia is
175 ‘Small customers’ are defined for Western Australia as customers with consumption below 160 MWh per year, see
section 3.1. 176 Forecast growth in total demand for Western Australia is defined as average growth in sent-out energy for the South
West Interconnected System (SWIS) over the forecasting period of 2007/8 to 20016/17. Percentage growth rates are shown for medium and high (parentheses) economic growth scenarios. Source: Independent Market Operator (IMO) Statement of Opportunities (SOO) 2007, Page 24.
177 Forecast growth in peak demand for Western Australia is defined as average maximum demand growth (POE 10 per cent) for the SWIS over the forecasting period of 20070/8 to 20016/17, assuming expected economic growth as defined by IMO within the SOO. Source: Independent Market Operator (IMO) Statement of Opportunities 2007, Appendix 4 Page v.
178 Energy Efficient Strategies, Status of Air-Conditioners in Australia – A report prepared for NAEEEC, January 2006. 179 Western Power 2007 Transmission and Distribution Annual Planning Report, Page 51.

Consultation Report - Cost Benefit Analysis of Smart Metering and DLC
Western Australia
NERA Economic Consulting
116
more accelerated than for the other jurisdictions180 and is assumed to be completed by the end of 2014. We note that that the final numbers and the exact timing of this meter replacement program is subject to finalisation by Western Power. We also understand that Western Power may not have access to sufficient resources (e.g. meter technicians) to allow smart meters to be rolled out in the SWIS by the end of 2014.
There is a relatively low proportion of sites in Western Australia that are considered to represent ‘difficult installations’ due to the presence of asbestos meter boards and also meter space and wiring issues.
13.2. Results of the Cost Benefit Analysis
Figure 13.1 below presents the costs and benefits for Western Australia (in NPV terms) for Scenario 1, based on the estimates of costs and benefits made by the consultants in each of the relevant workstreams.181 The cost estimates shown include both the transitional costs of the rollout and the on-going costs for retailers and distributors. The benefits shown distinguish between the avoided metering costs, the estimate of business efficiencies and the benefits flowing from the anticipated demand response.
Figure 13.1 NPV of Benefits and Costs ($m) – Western Australia, Scenario 1
0
100
200
300
400
500
600
700
800
900
1,000
SMI Costs Avoided meter costs Business efficienciesand other benefits
Demand response
Given the uncertainty associated with the estimate of costs and benefits, in the majority of cases the consultants have provided a range for both costs and benefits. The figure shows both the lower and upper bound for each of the estimates.
Figure 13.2 summarises the costs and benefits in NPV terms for the non smart meter rollout of DLC (Scenario 3).
180 With the exception of Victoria. 181 For a description of how to read the figure, see the description of figure 2.1 in section 2.2.
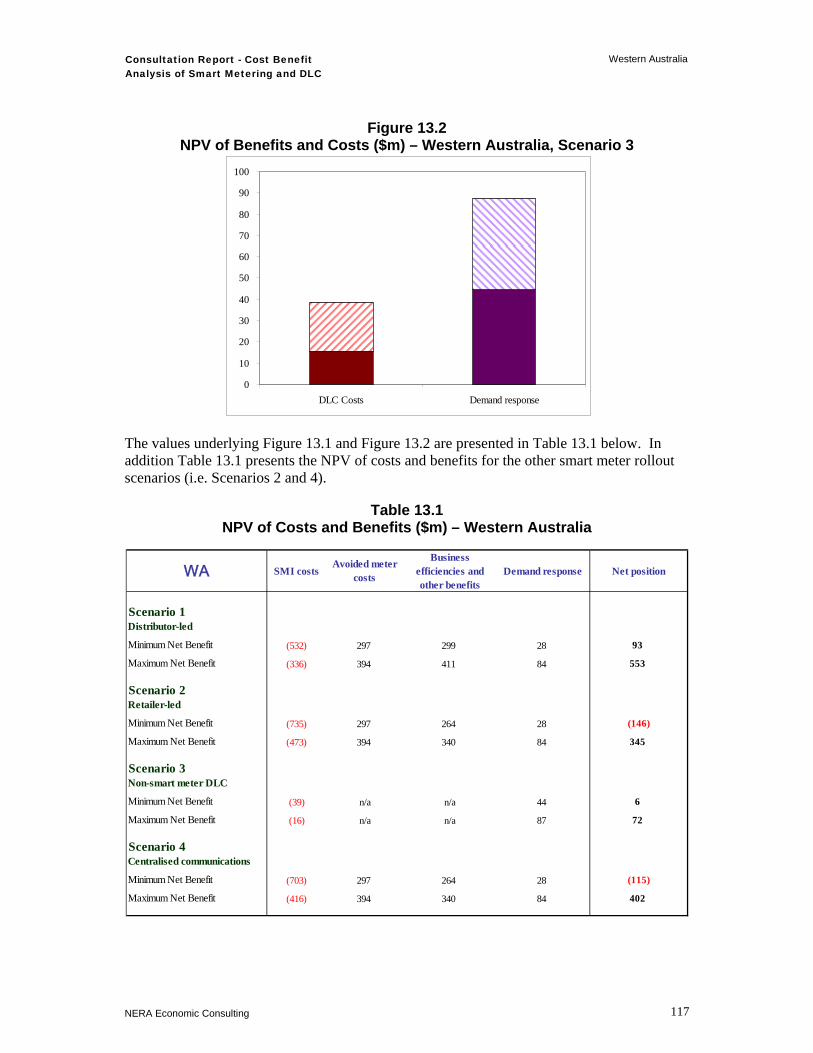
Consultation Report - Cost Benefit Analysis of Smart Metering and DLC
Western Australia
NERA Economic Consulting
117
Figure 13.2 NPV of Benefits and Costs ($m) – Western Australia, Scenario 3
0
10
20
30
40
50
60
70
80
90
100
DLC Costs Demand response
The values underlying Figure 13.1 and Figure 13.2 are presented in Table 13.1 below. In addition Table 13.1 presents the NPV of costs and benefits for the other smart meter rollout scenarios (i.e. Scenarios 2 and 4).
Table 13.1 NPV of Costs and Benefits ($m) – Western Australia
WA SMI costsAvoided meter
costs
Business efficiencies and other benefits
Demand response Net position
Scenario 1Distributor-led
Minimum Net Benefit (532) 297 299 28 93
Maximum Net Benefit (336) 394 411 84 553
Scenario 2Retailer-led
Minimum Net Benefit (735) 297 264 28 (146)
Maximum Net Benefit (473) 394 340 84 345
Scenario 3Non-smart meter DLC
Minimum Net Benefit (39) n/a n/a 44 6
Maximum Net Benefit (16) n/a n/a 87 72
Scenario 4Centralised communications
Minimum Net Benefit (703) 297 264 28 (115)
Maximum Net Benefit (416) 394 340 84 402

Consultation Report - Cost Benefit Analysis of Smart Metering and DLC
Western Australia
NERA Economic Consulting
118
The breakdown of these overall figures by each of the major categories of costs and benefits is set out in Table 13.2.

Consultation Report - Cost Benefit Analysis of Smart Metering and DLC
Western Australia
NERA Economic Consulting
119
Table 13.2 Breakdown of Costs and Benefits (NPV,$m) – Western Australia

Consultation Report - Cost Benefit Analysis of Smart Metering and DLC
Western Australia
NERA Economic Consulting
120
In Western Australia, consumers typically pay for the cost of additional import/export metering where they install PV cells. As a result, the avoided cost represents a consumer benefit. However, we note that it has been included as part of overall business efficiencies in the above table.
13.3. Discussion
13.3.1. Smart meter rollout scenarios
The results of the cost benefit analysis for Western Australia show that a rollout of smart metering under the distributor-led scenario (Scenario 1) has the highest NPV across all of the smart metering scenarios and is justified solely by the avoided meter costs and business efficiencies that are expected to accrue to distributors.
On the basis of the values in Table 13.1, the sum of the low estimates of the expected business efficiencies and avoided meter costs is 77 per cent higher than the low estimate of costs made by EMCa and is 12 per cent above the high cost estimate. At the upper end, the business efficiency estimates and avoided meter costs are more than 51 per cent more than the high cost estimate. The vast majority of the business efficiency benefits are driven by the distribution network efficiencies estimated by CRA. In the case of Western Australia, these network benefits comprise 84 to 96 per cent of the total business efficiency benefits.182
As noted in Section 5, the key drivers of costs for each jurisdiction are the costs of metering and the costs of installation. Average meter costs per NMI for Western Australia have been estimated by EMCa as between $171 and $233 per NMI. This estimate, which is higher than for other jurisdictions, is driven by the higher proportion of three-phase meters in Western Australia.
EMCa has estimated installation costs range from $49 to $91 per NMI. These estimates are low relative to other jurisdictions, particularly at the low end of the range and reflect a lower assumed proportion of ‘difficult installations’ and higher rates of installation achievable per installer per day, on the basis of customer density and access considerations.
As discussed in section 5.1.4.2, we have adopted EMCa’s base assumption (Case 1a) in relation to the communication costs, which assumes PLC technology in rural and remote areas. Adopting EMCa’s alternative cases for remote and rural areas (Cases 1c and 1e) does not alter the relative outcomes for Western Australia.
The estimate of avoided meter costs presented in Table 13.1 is based on a counterfactual of accumulation meters. We have also considered an alternate counterfactual based on a continuation of current metering policy in Western Australia, which is for the installation of an electronic manually read interval meter (type 5) for all new and replacement meters. We have assumed that these new and replacement meters continue to be read as accumulation meters.
182 The total business efficiency benefits reported in Table 13.1 also include retail business efficiency benefits and the
benefit to customers from a reduction in USE.

Consultation Report - Cost Benefit Analysis of Smart Metering and DLC
Western Australia
NERA Economic Consulting
121
It should be noted that both the counterfactual and the alternate counterfactual assume that smart meters would avoid the costs of the current accelerated replacement program for three phase meters. The cost of the accelerated replacement of three phase meters is between 32 and 36 per cent of the total estimated avoided meter costs in Western Australia.183
Adoption of the counterfactual increases the benefit from avoided meter costs for Western Australia by between $72 and $120 million. Given that in scenario 1 the net benefit in both the upper and lower bound is positive, adopting this alternative counterfactual reinforces the outcomes shown in Table 13.1.
A breakdown of the network efficiency benefits calculated by CRA for Western Australia is set out in Figure 13.3.
Figure 13.3 Annual Network Efficiency Benefits ($m) – Western Australia, Scenario 1
Source: CRA Workstream 2 Report The key components of the network efficiency benefits calculated by CRA for Western Australia are the expected reduction in the cost of special reads (estimated by CRA at just over $11 million annually) and the avoided cost of routine reading (estimated by CRA at $6 million annually). Together, these two categories account for 56 per cent of the low estimate of the total network business efficiency benefits estimated for Western Australia and 46 per cent of the high end.
CRA has also estimated benefits of $4.4 million per annum related to a reduction in the calls to faults and emergency lines as a result of improved outage detection and up to $4 million
183 We note that the installation costs assumed for the accelerated replacement program reflect the ‘WA at scale’
installation cost estimates, as reported CRA Workstream 2 Network Impact Consultation Report (February 2008), Appendix D. The ‘WA at scale’ installation costs are the CRA assessment of typical at scale meter installation costs across the jurisdictions (adjusted for unique features of WA) and are consistent with meter installation vendor information. Installation cost information provided by WA is considered to cover a subset of the installation cost categories listed above and hence was not directly comparable to the assessed total installation costs.
WA-Low
$11.3m
$6.0m$4.4m
$3.2m
$6.2m
Avoided cost of specialreads
Avoided costs ofroutine reading
Reduction in calls tofaults and emergencieslines
Avoided cost ofexisting DB QoSmonitoring schemes
Remainder
WA-High
$11.3m
$6.0m
$4.4m
$4.0m
$11.6m
Avoided cost of specialreads
Avoided costs ofroutine reading
Reduction in calls tofaults and emergencieslines
Reduced cost for poststorm supplyrestoration
Remainder

Consultation Report - Cost Benefit Analysis of Smart Metering and DLC
Western Australia
NERA Economic Consulting
122
benefit per annum in relation to the avoided cost of investigating customer complaints involving voltage quality of supply. As noted in our general discussion in section 5, there is a higher level of uncertainty surrounding the estimation of these benefits, as they are essentially driven in the first instance by CRA’s assumption of a 50 per cent reduction in calls and in the second by CRA’s assumption of a 50 per cent reduction in costs. However, if only 50 per cent of each of these benefit items was included in the analysis, this would not change the significant net positive benefits calculated for Western Australia. Overall benefits would be reduced by between $25 and $39 million, in NPV terms.
A significant benefit item for Western Australia is the avoided cost of replacement meters, given that Western Power is currently planning to replace almost a third of its total meter stock due to accuracy problems.
In relation to demand response benefits these are an order of magnitude lower for Western Australia than the estimate of the business efficiency benefits. In the low end case NERA has estimated as part of the customer impact analysis that residential customers on CPP tariffs may reduce their demand in Western Australia by 21.5 per cent in a critical peak period in summer, whilst customers on TOU tariffs would reduce their load by 5.8 per cent in a peak period in summer. However, much of this demand reduction is the result of shifting load rather than overall energy conservation. Overall, NERA has estimated a 1.2 per cent reduction in peak demand in Western Australia and a marginal 0.01 per cent reduction in overall annual consumption. In the high demand scenario (which includes higher uptake rates for TOU and CPP as well as a 3 per cent conservation impact) these reductions increase to a 2.0 per cent reduction in peak demand and a 0.4 per cent reduction in overall consumption over the year.184
As a result, the demand response benefits estimated for Western Australia are relatively modest. In the low demand response case they are dominated by network deferral and reductions in USE, with a smaller contribution from generation operating cost. In the high demand response case all three of these benefit categories increase and greenhouse gas emission reductions also become significant, largely arising as a result of the increased conservation effect. We note that we have taken CRA’s estimate of the benefit associated with generation operating costs rather than their assessment of the benefit associated with reductions in generation offer costs, which would further increase the market benefit estimate.185
We note that currently most customers in Western Australia face regulated retail tariffs.186 As a result there is the potential to revise regulated tariffs in order to reflect a TOU or CPP pricing structure and this would then imply that a greater proportion of customers would face these pricing structures compared with the take-up rates that we have assumed. As a result,
184 The estimated reductions in peak demand are based on an assumption that full retail contestability has been introduced
in Western Australia and customers are not forced to adopt TOU and/or CPP. In the event that all customers faced TOU and/or CPP then the likely demand response impacts are likely to be proportionately higher than those estimated here.
185 See discussion in section 6.3. 186 Synergy offers a voluntary SmartPower TOU product to residential customers in the SWIS. We understand that
currently the take-up rate for this TOU product is less than 2 per cent of all residential customers.

Consultation Report - Cost Benefit Analysis of Smart Metering and DLC
Western Australia
NERA Economic Consulting
123
we consider that the demand response benefits estimated for Western Australia are likely to be underestimated from those that may be achievable in practice.
The results presented here also do not include the expected costs and benefits of including an interface to a HAN (functionality 16). We note that where the HAN capability is incorporated into the smart metering system and where DLC capability and IHD are provided as a result, the expected demand-response benefits would be greater than estimated in our base analysis, leading to higher market benefits. In the case of the IHD this additional demand response is dependent on a resultant enhanced responsiveness to TOU tariffs and CPP, which is uncertain. Our analysis indicates that including the HAN would increase the net benefit estimated for Western Australia for scenario 1 by at least $5 million and possibly by as much as $73 million. This further reinforces the case for the rollout in Western Australia.
The levels of net benefits of Scenarios 2 and 4 for Western Australia are both lower than for Scenario 1. This primarily reflects the higher cost estimates under these scenarios. As discussed in section 4, this is driven by the higher costs assumed by EMCa for the communications required by these scenarios. The costs per meter are also assumed to be higher under Scenarios 2 and 4 as they allow for a separate plug-in modem to facilitate customer churn.
The level of distributor business efficiency benefits is also lower under Scenarios 2 and 4, primarily as a result of the exclusion of a proportion of the benefits associated with improved outage detection. Demand response benefits remain unchanged between all smart metering scenarios.
Although the net benefits are lower under Scenarios 2 and 4 for Western Australia, in contrast to all the other jurisdictions they remain positive in both the lower and upper case for both of these alternate rollout scenarios.
13.3.2. Scenario 3: Non-smart meter DLC rollout
For the non smart meter rollout scenario for Western Australia, it is assumed that DLC is facilitated via FM radio.
As discussed in section 6, there are no business efficiency benefits associated with Scenario 3, as this scenario relates only to a rollout of DLC capability.
The demand benefits are higher under Scenario 3 than for the smart meter rollout scenarios as a result of faster rollout times and greater uptake assumptions. The costs of a DLC rollout are also lower than they are for the smart meter scenarios.
Overall, Scenario 3 is positive in NPV terms for Western Australia. The magnitude of the positive NPV is lower than for a smart meter rollout under Scenario 1, i.e. $6 to $72 million as compared to $93 to $553 million. However, the estimated costs are also of a lower order of magnitude. In relation to the ratio of benefits to costs Scenario 3 has a ratio of 543 per cent in the upper case and 113 per cent in the lower case. For Scenario 1, the ratio between benefits and costs is 117 per cent in the lower case and 265 per cent in the upper case.

Consultation Report - Cost Benefit Analysis of Smart Metering and DLC
Western Australia
NERA Economic Consulting
124
13.4. Summary
The results of the cost benefit analysis for Western Australia show that a rollout of smart metering under the distributor-led scenario (Scenario 1) has the highest NPV across all of the smart metering scenarios and is justified solely by the resulting business efficiencies that are expected to accrue to distributors.
The NPV of the net benefits under a smart metering rollout is also an order of magnitude greater than the NPV of the net benefit of a non-smart meter DLC rollout (Scenario 3). In relation to the ratio of costs to benefits, Scenario 3 has a higher ratio than does Scenario 1 in the lower case but a lower ratio in the upper case.
A decision to rollout smart meters in Western Australia, therefore, appears to be dependent on a view as to the reasonableness of the estimates presented in relation to the distribution efficiency benefits, the avoided meter costs and transitional costs (particularly for meter and installation costs). However, the extent of the net benefit estimated for Western Australia suggests that the overall conclusion that a rollout of smart meters is expected to be positive is likely to remain robust in response to changes in these assumptions.

Consultation Report - Cost Benefit Analysis of Smart Metering and DLC
Northern Territory
NERA Economic Consulting
125
14. Northern Territory
This section discusses the results of the cost benefit analysis for the Northern Territory. The analysis for the Northern Territory relates to small residential and commercial customers connected to the Darwin-Katherine grid only.187 The detailed breakdown of the analysis by different stakeholders is presented in Appendix D.
14.1. Key Jurisdictional Characteristics
The load duration curve for the Northern Territory is relatively flat, given the climatic conditions which necessitate the use of air-conditioning over most of the day. Air-conditioner penetration in the Northern Territory was estimated at 92 per cent in 2005.188 There is also less seasonal variation in demand relative to other jurisdictions.
Total electricity demand is forecast to grow by 7.1 per cent during 2007/08 from the prior period, and at an average rate of 1.6 per cent per cent per annum in following years.189 Peak demand is forecast to grow by 6.6 per cent during 2007/08 from the prior period, and at an average rate of 2.5 per cent per annum in following years.190
There is no wholesale electricity market in the Northern Territory and currently a single retailer operating in the market.191 Electricity is provided by the Power and Water Corporation, which is vertically integrated. The network is regulated by the Northern Territory Utilities Commission. Full retail contestability is scheduled to be introduced in April 2010.192
14.2. Results of the Cost Benefit Analysis
Figure 14.1 below presents the costs and benefits for the Northern Territory (in NPV terms) for Scenario 1, based on the estimates of costs and benefits made by the consultants in each of the relevant workstreams.193 The cost estimate shown includes both the transitional costs of the rollout and the on-going costs for retailers and distributors. The benefits shown distinguish between the avoided metering costs, the estimate of business efficiencies and the benefits flowing from the anticipated demand response.
187 ‘Small customers’ in the case of the Northern Territory are defined as those with an annual consumption below
750Mwh/year, see section 3.1. 188 Energy Efficient Strategies, Status of Air-Conditioners in Australia – A report prepared for NAEEEC, January 2006. 189 Power and Water Corporation 2006-7 Statement of Corporate Intent, Page 9. Note that 2007/8 growth forecasts include
an ‘organic demand’ component of 1.6% and 2.5% per annum for total and peak demand respectively, plus specific demand attributable to large users. Forecasts beyond 2007/8 do not include an allowance for specific user demand due to the difficulty in predicting these changes in demand.
190 Ibid. 191 Large customers are currently contestable, however there is no small customer retail competition. 192 AER Report, State of the Energy Market 2007, Page 178. 193 For a description of how to read the figure, see the description of figure 2.1 in section 2.2.

Consultation Report - Cost Benefit Analysis of Smart Metering and DLC
Northern Territory
NERA Economic Consulting
126
Figure 14.1 NPV of Benefits and Costs ($m) – Northern Territory, Scenario 1
0
5
10
15
20
25
30
35
40
45
50
SMI Costs Avoided meter costs Business efficienciesand other benefits
Demand response
Given the uncertainty associated with the estimate of costs and benefits, in the majority of cases the consultants have provided a range for both costs and benefits. The figure shows both the lower and upper bound for each of the estimates.
Figure 14.2 summarises the costs and benefits in NPV terms for the non smart meter rollout of DLC (Scenario 3).
Figure 14.2 NPV of Benefits and Costs ($m) – Northern Territory, Scenario 3
0.0
0.5
1.0
1.5
2.0
2.5
3.0
3.5
DLC Costs Demand response
The values underlying Figure 14.1 and Figure 14.2 are presented in Table 14.1 below. In addition, Table 14.1 presents the NPV of costs and benefits for the other smart meter rollout scenarios (i.e. Scenarios 2 and 4).

Consultation Report - Cost Benefit Analysis of Smart Metering and DLC
Northern Territory
NERA Economic Consulting
127
Table 14.1 NPV of Costs and Benefits ($m) – Northern Territory
NT SMI costsAvoided meter
costs
Business efficiencies and other benefits
Demand response Net position
Scenario 1Distributor-led
Minimum Net Benefit (35) 5 27 (0) (3)
Maximum Net Benefit (22) 8 33 4 23
Scenario 2Retailer-led
Minimum Net Benefit (45) 5 26 (0) (14)
Maximum Net Benefit (28) 8 31 4 15
Scenario 3Non-smart meter DLC
Minimum Net Benefit (3) n/a n/a 0 (3)
Maximum Net Benefit (2) n/a n/a 1 (1)
Scenario 4Centralised communications
Minimum Net Benefit (42) 5 26 (0) (11)
Maximum Net Benefit (26) 8 31 4 17
The breakdown of these overall figures by each of the major categories of costs and benefits is set out in Table 14.2.

Consultation Report - Cost Benefit Analysis of Smart Metering and DLC
Northern Territory
NERA Economic Consulting
128
Table 14.2 Breakdown of Costs and Benefits (NPV,$m) – Northern Territory

Consultation Report - Cost Benefit Analysis of Smart Metering and DLC
Northern Territory
NERA Economic Consulting
129
In the Northern Territory, consumers typically pay for the cost of additional import/export metering where they install PV cells. As a result, the avoided cost represents a consumer benefit. However, we note that it has been included as part of overall business efficiencies in the above table.
14.3. Discussion
14.3.1. Smart meter rollout scenarios
The results of the cost benefit analysis for the Northern Territory show that a rollout of smart metering under the distributor-led scenario (Scenario 1) has a positive NPV if the low cost estimate is assumed. In this case, the rollout would be justified on the basis of avoided meter costs and distributor business efficiency benefits alone, although the magnitude of the benefit is modest compared with that for other jurisdictions (at between $10 and $18 million in NPV terms). If the high cost estimate is assumed then the rollout only becomes justified if the higher benefit estimate is also assumed and has a marginal negative net benefit if the low benefit estimate is assumed.
On the basis of the values in Table 14.1, the sum of the low estimates of the expected business efficiencies and avoided meter costs is 45 per cent above the low estimate of costs made by EMCa, but 10 per cent below the high cost estimate. At the upper end, the business efficiency estimates and avoided meter costs are 16 per cent above the high cost estimate.
The avoided meter costs are based on a counterfactual of accumulation meters. In the Northern Territory, the current replacement policy is for the installation of electromechanical accumulation meters for all new and replacement meters. As a result, there is no alternate metering base case for the Northern Territory.
The vast majority of these business efficiency benefits are driven by the distribution network efficiencies estimated by CRA.194
As noted in section 5, the key drivers of costs for each jurisdiction are the costs of metering and the costs of installation. Average meter costs per NMI for the Northern Territory have been estimated by EMCa as between $108 and $148 per NMI. The low end of this range represents the lowest meter costs per NMI for any jurisdiction and reflects the extensive usage of single phase meters in the Northern Territory without controlled load.
In relation to installation costs, EMCa has estimated a range of $51 to $85 per NMI. This reflects a lower estimate of the number of installations that can be achieved per installer per day in the Northern Territory than in some other jurisdictions, based on customer density and access considerations.
As discussed in section 5.1.4.2, we have adopted EMCa’s base assumption (Case 1a) in relation to the communication costs, which assumes PLC technology in rural and remote areas. Adopting EMCa’s alternative cases for remote and rural areas (Cases 1c and 1e) does not alter the outcomes for the Northern Territory. 194 The total business efficiency benefits reported in Table 14.1 also include retail business efficiency benefits and the
benefit to customers from a reduction in USE.

Consultation Report - Cost Benefit Analysis of Smart Metering and DLC
Northern Territory
NERA Economic Consulting
130
A breakdown of the network efficiency benefits calculated by CRA for the Northern Territory is set out in Figure 7.3
Figure 14.3 Annual Network Efficiency Benefits ($m) – Northern Territory, Scenario 1
Source: CRA Workstream 2 Report
The key components of the network efficiency benefits calculated by CRA for the Northern Territory are the avoided cost of manual disconnections and reconnections (estimated by CRA at $0.8 to $1.0 million annually) and the expected reduction in the cost of special reads (estimated by CRA at $0.7 million annually). Together, these two categories account for close to just over 50 per cent of the total network business efficiency benefits estimated for the Northern Territory.
The avoided cost of routine reading is estimated by CRA to be relatively low in the Northern Territory ($0.5 million annually).
In relation to demand-response benefits, these are of a very low order of magnitude for the Northern Territory. In the low end case, NERA has estimated that residential customers on CPP tariffs may reduce their demand in the Northern Territory by 10.6 per cent in a critical peak period in summer, whilst customers on TOU tariffs would reduce their load by 1.0 per cent in a peak period in summer. However, much of this demand reduction is the result of a shifting of load rather than overall energy conservation. Overall, NERA has estimated a 0.19 per cent reduction in peak demand in the Northern Territory with no change in overall annual consumption. In the high demand scenario (which includes higher uptake rates for TOU and CPP as well as a 3 per cent conservation impact), these reductions increase to a 0.49 per cent reduction in peak demand and a 0.21 per cent reduction in overall consumption over the year.
The very low demand response estimated for the Northern Territory means that the demand response benefits estimated by CRA are minimal. As a result, the consumer surplus values associated with the changes in tariffs outweigh other demand response benefits for the Northern Territory. As a result, overall demand response benefits are estimated to be
NT-Low
$0.8m
$0.7m$0.5m
$0.4m
$0.6m
Avoided cost of manualdisconnections &reconnections.
Avoided cost of specialreads
Avoided costs ofroutine reading
Avoided cost ofinstalling prepaymentmetering for customers
Remainder
NT-High
$0.7m
$1.0m
$0.5m
$0.4m
$0.8m
Avoided cost of manualdisconnections &reconnections.
Avoided cost of specialreads
Avoided costs ofroutine reading
Avoided cost ofinstalling prepaymentmetering for customers
Remainder

Consultation Report - Cost Benefit Analysis of Smart Metering and DLC
Northern Territory
NERA Economic Consulting
131
negative in the low case, as customers face higher tariffs at peak times but do not change their load significantly in response to this price signal.
We also note that the load duration curve for the Northern Territory is relatively flat given the climatic conditions which necessitate the use of air-conditioning over most of the day. As a result, the need for network augmentation is likely to be driven by general increases in average load rather than ‘needle peaks,’ which are more amenable to being addressed via demand response. CRA has therefore assessed that the network deferral benefit in the Northern Territory is likely to be zero.
The results presented here also do not include the expected costs and benefits of including an interface to a HAN (functionality 16). Given the Northern Territories’ climatic conditions and the flat load profile there is likely to be only a very low impact on demand from incorporation of DLC capability within the smart meter functionality. However there would be an additional cost incurred at the meter. Our analysis indicates that including the HAN may decrease the net benefit estimated for the Northern Territory for scenario 1 by between $1million in the lower bound, or may increase it by $3 million in the upper bound.
The levels of net benefits of Scenarios 2 and 4 for the Northern Territory are both lower than for Scenario 1. This primarily reflects the higher cost estimates under these scenarios. As discussed in section 4, this is driven by the higher costs assumed by EMCa for the communications required by these scenarios. The costs per meter are also assumed to be higher under Scenarios 2 and 4 as they allow for a separate plug-in modem to facilitated customer churn. The level of distributor business efficiency benefits is also lower under Scenarios 2 and 4, primarily as a result of the exclusion of a proportion of the benefits associated with improved outage detection. Demand response benefits remain unchanged between all smart metering scenarios.
14.3.2. Scenario 3: Non-smart meter DLC rollout
For the non smart meter rollout scenario for the Northern Territory it is assumed that DLC is facilitated via FM radio.
As discussed in section 6, there are no business efficiency benefits associated with Scenario 3, as this scenario relates only to a rollout of DLC capability.
The demand response benefits estimated under Scenario 3 remain very low for the Northern Territory, reflecting the absence of network deferral benefits. In addition, we note that the very humid climatic conditions prevalent in the Northern Territory raise additional uncertainty as to the extent to which air-conditioners can be practically cycled and for how long. As a result, we would urge caution in interpreting the results of the analysis for Scenario 3 in the case of the Northern Territory.
Scenario 3 is negative in NPV terms for the Northern Territory in both the high and low case. The magnitude of the negative NPV is between -$1 and -$3 million in the high and low case respectively.

Consultation Report - Cost Benefit Analysis of Smart Metering and DLC
Northern Territory
NERA Economic Consulting
132
14.4. Summary
The results of the cost benefit analysis for the Northern Territory show that a rollout of smart metering may be justified under the distributor-led scenario (Scenario 1) as a result of the business efficiencies that are expected to accrue to distributors, provided that either the low cost estimate is achieved or else the high business efficiency benefit is included.
Demand response benefits are estimated to be marginal for the Northern Territory, given the flat load curve. In particular, network deferral benefits are expected to be zero. In addition, the ability to cycle air-conditioning in the humid conditions of the Northern Territory means that the demand response benefits estimated for Scenario 3 need not be achievable in practice.
A decision to rollout smart meters in the Northern Territory, therefore, appears to be dependent on a view as to the reasonableness of the estimates in relation to the distribution efficiency benefits achievable and the transitional costs (particularly the meter and installation costs).

Consultation Report - Cost Benefit Analysis of Smart Metering and DLC
National Assessment
NERA Economic Consulting
133
15. National Assessment
This section summarises the results for each of the jurisdictions before providing a discussion at an aggregate national level of the breakdown of costs and benefits between different stakeholders and the differences in costs and benefits between urban, rural and remote areas.
15.1. Summary of Jurisdictional Analysis
The following tables summarise by jurisdiction the results of the cost benefit analysis, both in total net benefit terms and also expressed as the net benefit per NMI. The additional costs and benefits associated with the inclusion of an interface with the HAN are not included in these tables.
Table 15.1 and Table 15.2 summarises the results per jurisdiction for the accumulation meter counterfactual, in relation to both total NPV and NPV per NMI. The results in total NPV terms are also illustrated in Figure 15.1.
Table 15.1 Summary of Results by Jurisdiction – Accumulation Meter Counterfactual
Excluding HAN, Net Benefit (NPV, $m)
QLD NSW ACT VIC SA TAS WA NT Nationwide
Scenario 1Distributor-led
Minimum Net Benefit 112 212 (12) (101) (74) (48) 93 (3) 179
Maximum Net Benefit 980 1,378 25 690 200 84 553 23 3,934
Scenario 2Retailer-led
Minimum Net Benefit (420) (411) (31) (540) (217) (91) (146) (14) (1,870)
Maximum Net Benefit 501 1,018 14 375 99 43 345 15 2,410
Scenario 3Non-smart meter DLC
Minimum Net Benefit 28 (1) n/a 5 (0) n/a 6 (3) 34
Maximum Net Benefit 201 164 n/a 116 66 n/a 72 (1) 618
Scenario 4Centralised communications
Minimum Net Benefit (358) (299) (24) (429) (186) (102) (115) (11) (1,524)
Maximum Net Benefit 613 926 17 495 138 56 402 17 2,664

Consultation Report - Cost Benefit Analysis of Smart Metering and DLC
National Assessment
NERA Economic Consulting
134
Table 15.2 Summary of Results by Jurisdiction – Accumulation Meter Counterfactual
Excluding HAN, Net Benefit per NMI (NPV, $)
QLD NSW ACT VIC SA TAS WA NT Nationwide
Scenario 1Distributor-led
Minimum Net Benefit 61 67 (81) (41) (93) (184) 100 (57) 19
Maximum Net Benefit 532 437 174 284 251 324 600 377 409
Scenario 2Retailer-led
Minimum Net Benefit (228) (131) (209) (222) (273) (350) (159) (234) (195)
Maximum Net Benefit 272 323 96 154 124 167 374 246 251
Scenario 3Non-smart meter DLC
Minimum Net Benefit 15 (0) n/a 2 (0) n/a 6 (48) 4
Maximum Net Benefit 109 52 n/a 47 84 n/a 78 (16) 64
Scenario 4Centralised communications
Minimum Net Benefit (194) (95) (166) (176) (234) (392) (125) (180) (159)
Maximum Net Benefit 333 294 118 204 173 214 436 276 277
Figure 15.1 Summary of Results by Jurisdiction – Accumulation Meter Counterfactual,
Excluding HAN, Net Benefit ($m), Scenario 1
-500
0
500
1,000
1,500
2,000
QLD NSW ACT VIC SA TAS WA NT
NPV
$m

Consultation Report - Cost Benefit Analysis of Smart Metering and DLC
National Assessment
NERA Economic Consulting
135
Table 15.3, Table 15.4 and Figure 15.2 present similar summaries, but against the counterfactual of a continuation of current metering policy in each jurisdiction. As discussed in the preceding chapters covering the individual jurisdictional results, the adoption of the alternative counterfactual increases the net benefit in Queensland, NSW and Tasmania, but does not alter the overall outcomes of the cost benefit analysis. However, for Victoria the adoption of the alternative counterfactual of new and replacement metering being interval meters increases the net benefit such that the lower bound for Victoria also becomes positive.
Table 15.3 Summary of Results by Jurisdiction – Current Metering Policy Counterfactual
Net Benefit (NPV, $m)
QLD NSW ACT VIC SA TAS WA NT Nationwide
Scenario 1 Distributor-led Minimum Net Benefit 155 308 -12 12 -74 -32 165 -3 518 Maximum Net Benefit 1,053 1,548 25 841 200 110 676 23 4,476
Scenario 2 Retailer-led Minimum Net Benefit -377 -315 -31 -428 -217 -75 -74 -14 -1,531 Maximum Net Benefit 574 1,188 14 525 99 69 467 15 2,952
Scenario 3 Non-smart meter DLC Minimum Net Benefit 28 -1 n/a 5 -0 n/a 6 -3 34 Maximum Net Benefit 201 164 n/a 116 66 n/a 72 -1 618
Scenario 4 Centralised communications Minimum Net Benefit -315 -202 -24 -317 -186 -86 -43 -11 -1,184 Maximum Net Benefit 686 1,097 17 646 138 81 524 17 3,207

Consultation Report - Cost Benefit Analysis of Smart Metering and DLC
National Assessment
NERA Economic Consulting
136
Table 15.4 Summary of Results by Jurisdiction – Current Metering Policy Counterfactual
Net Benefit per NMI (NPV, $)
QLD NSW ACT VIC SA TAS WA NT Nationwide
Scenario 1 Distributor-led Minimum Net Benefit 84 98 -81 5 -93 -125 179 -57 54 Maximum Net Benefit 572 491 174 345 251 422 733 377 446
Scenario 2 Retailer-led Minimum Net Benefit -205 -100 -209 -176 -273 -290 -80 -234 159 Maximum Net Benefit 312 377 96 216 124 266 507 246 307
Scenario 3 Non-smart meter DLC Minimum Net Benefit 15 -0 n/a 2 -0 n/a 6 -48 4 Maximum Net Benefit 109 52 n/a 47 84 n/a 78 -16 64
Scenario 4 Centralised communications Minimum Net Benefit -171 -64 -166 -130 -234 -333 -46 -180 -123 Maximum Net Benefit 373 348 118 265 173 313 569 276 334

Consultation Report - Cost Benefit Analysis of Smart Metering and DLC
National Assessment
NERA Economic Consulting
137
Figure 15.2 Summary of Results by Jurisdiction – Current Metering Policy Counterfactual
Excluding HAN, Net Benefit ($m), Scenario 1
-200
0
200
400
600
800
1,000
1,200
1,400
1,600
1,800
QLD NSW ACT VIC SA TAS WA NT
NPV
$m
15.2. Stakeholder Analysis
Table 15.5 sets out the breakdown of the national cost benefit analysis in relation to the different stakeholders: network businesses, retailers, consumers and market operators.
In particular, the table sets out in NPV terms the values estimated for the total costs of the four rollout scenarios for each stakeholder (broken down by key cost category) and the total benefits for each stakeholder (distinguishing between avoided meter costs, business efficiency benefits, demand response benefits and net transfers). In each case, the estimates are shown for both the low range estimates and the high range estimates.

Consultation Report - Cost Benefit Analysis of Smart Metering and DLC
National Assessment
NERA Economic Consulting
138
Table 15.5 Stakeholder Breakdown – National (NPV, $m)
Scenario 1 Scenario 2 Scenario 3 Scenario 4Gross Costs of SMI - Low
Networks (2,544) (319) (126) (321)Retailer (135) (3,230) (1) (2,546)Market (37) (37) (1) (465)Nationwide (2,717) (3,587) (128) (3,332)
Gross Costs of SMI - HighNetworks (4,084) (556) (366) (554)Retailer (204) (5,367) (2) (4,315)Market (55) (55) (2) (762)Nationwide (4,343) (5,978) (369) (5,631)
Benefits of SMI - LowNetworks 4,235 3,857 --- 3,857Retailer 118 118 --- 118Consumers (66) (102) --- (102)Market (16) (16) --- (16)Nationwide 4,272 3,857 --- 3,857
Benefits of SMI - HighNetworks 5,583 5,061 --- 5,061Retailer 358 358 --- 358Consumers 126 (6) --- (6)Market (155) (155) --- (155)Nationwide 5,913 5,258 --- 5,258
Demand Response - LowNetworks 101 101 (6) 101Retailer 21 21 123 21Consumers 116 116 289 116Market 12 12 (4) 12Nationwide 250 250 403 250
Demand Response - HighNetworks 237 237 (191) 237Retailer 56 56 221 56Consumers 197 197 758 197Market 248 248 (43) 248Nationwide 738 738 746 738
Net Benefit (Loss)
Minimum Net Benefit
Networks 252 3,402 (371) 3,404Retailer (64) (5,227) 122 (4,175)Consumers 50 14 289 14Market (59) (59) (5) (766)Nationwide 179 (1,870) 34 (1,524)
Maximum Net Benefit
Networks 3,275 4,979 (317) 4,977Retailer 279 (2,816) 220 (2,132)Consumers 324 191 758 191Market 55 55 (44) (372)Nationwide 3,934 2,410 618 2,664
Table 15.5 presents the stakeholder breakdown on an aggregate basis across Australia. The stakeholder breakdown by jurisdiction is given in Appendix D.

Consultation Report - Cost Benefit Analysis of Smart Metering and DLC
National Assessment
NERA Economic Consulting
139
From the above table it is apparent that no rollout scenario is always net positive to all stakeholders and that there may be winners and losers amongst stakeholders depending on the scenario and the actual level of costs and benefits achieved.195
It is important to note that the breakdown of costs and benefits by stakeholder group reflects the ‘first pass’ on each group as a result of a rollout. We would expect over time that many of the benefits from a rollout of smart metering or a DLC alternative would eventually be passed through to consumers, either via regulation of the distribution businesses and retailers (in jurisdictions where there is no retail competition) or via competition (for jurisdictions where there is retail competition). Similarly, many of the costs of a rollout will also eventually be borne by customers, as they become reflected in network prices and retail costs. This is discussed further in section 3.5.
The avoided cost of import/export metering where customers install a PV cell has been included in the table as a business efficiency benefit for distributors. However, as noted in section 6.1.1.2, a number of jurisdictions the costs of import/export metering are currently borne by customers rather than distributors and the avoided cost would therefore represent a benefit to customers rather than to distributors. However, the size of this benefit relative to the other business efficiency benefits is such that the reallocation of this benefit would not materially alter the overall picture presented in Table 15.5.
The justification for a mandatory rollout of smart meters, rather than allowing smart meters to be introduced as a business initiative, is that the costs and benefits of a rollout will accrue over a number of stakeholders. The inability of any one stakeholder to capture all of the benefits may therefore mean that there is no positive business case for any individual stakeholder to undertake a smart meter rollout. Mandating a rollout addresses this issue.
The summary of the net benefits of each stakeholder group presented in Table 15.5 indicates that the size of the business efficiency benefits estimated by CRA compared with the costs of a smart meter rollout estimated by EMCa are such that distributors would realise a net benefit considered as an individual stakeholder group under a distributor-led rollout of smart meters (i.e. Scenario 1) in their own right. That is, the above rationale for mandating a rollout on the expectation of the split of benefits between stakeholder groups does not hold on the basis of the estimates presented in this report.
However, we note that this result does not obviate the need for a rollout mandate in the case of a distributor-led rollout, with a common minimum functional specification. Although there appears to be a strong positive business case for the distribution businesses to rollout smart meters, it is predicated on the distributors retaining the efficiency benefits that are achieved as a result of a smart meter rollout. In practice, this will not be the case, as the distribution businesses are subject to price regulation and regulators will seek to pass-through to consumers the benefits of the efficiency gains achieved by the distribution businesses in the form of lower network charges going forward. This results in a disconnect between the
195 We note that the significant negative net benefit shown against networks in the demand response for Scenario 3 reflects
the $75 annual payment assumed to be made by distributors to customers to participate in a DLC programme. For the majority of jurisdictions the value to the distributors from network deferral outweighs this benefit. However, for New South Wales (winter peaking assumption) there is no network deferral and so overall the distributors are making a payment for DLC which they do not benefit from.
Consultation Report - Cost Benefit Analysis of Smart Metering and DLC
National Assessment
NERA Economic Consulting
140
costs that the distributor would face in rolling out smart meters (i.e. the transitional costs) and the resulting business efficiency benefits that the distributor could be expected to retain, which will only reflect a proportion of the benefits estimated by CRA as the regulator can be expected to pass those benefits through to consumers at the time of the next regulatory review. As a result, it would still remain necessary to mandate a rollout of smart meters, as no one stakeholder group has a positive business case to undertake such a rollout as a commercial exercise. The alternative to a mandate would be to modify the existing regulatory arrangements to address the underlying issue regarding incentives for distributors to undertake investments to reduce costs, where those investments have longer-term pay back periods. However we note that changes to the regulatory framework intended to address this issue are likely to be complex and have wide-ranging implications.
The disconnect between the costs incurred by distributors and the benefits they can be expected to retain from the resulting efficiency gains (and therefore the distributors’ incentives to ensure that those gains are realised) has important implications for the future regulation of distribution businesses. This is discussed further in our conclusions in section 18.3.2.
15.3. Urban, Rural and Remote Assessment
Figure 15.3 and Table 15.6 present the breakdown of the national cost benefit analysis for urban and rural/remote areas for the three smart meter rollout scenarios.
The basis for the breakdown between urban, rural and remote areas was discussed in section 3.5. It should be noted that the cost benefit analysis is only concerned with small customers who are connected to the main grid and therefore rural and remote customers who are not connected to the main grid are excluded from the analysis. This is particularly relevant for Western Australia (where rural and remote customers reflect those connected to the SWIS only) and Northern Territory (where rural and remote customers reflect those connected to the Darwin-Katherine grid only).
In particular, the figure and table set out in NPV terms the values estimated for the total costs of the three smart meter rollout scenarios (broken down by key cost category) and the total benefits (distinguishing between avoided meter costs and business efficiency benefits). In each case the estimates are shown for both the low range estimates and the high range estimates and distinguish between costs/benefits in urban areas and costs/benefits in rural and remote areas.
Figure 15.4 and Table 15.7 present the same breakdown on a per NMI basis.
For the demand response benefits we have not been able to separate the benefit estimate into urban and rural/remote areas, given that system load profile data is only available for each jurisdiction on an aggregate basis. Our assessment therefore addresses only the difference in net benefits between urban and rural/remote areas from business efficiency benefits and avoided metering costs. However, given that the vast majority of the benefits estimated on a national basis are from these two categories, the assessment in this section provides a representative picture of the relative differences in the net benefit of alternative smart meter rollouts in urban, rural and remote areas.

Consultation Report - Cost Benefit Analysis of Smart Metering and DLC
National Assessment
NERA Economic Consulting
141
Given that demand response benefits are not included, we have not incorporated Scenario 3 in this aspect of the assessment.
Figure 15.3 Urban and Rural/Remote Breakdown (Sm) – National Total NPV
Rural/Remote
0500
1,0001,5002,0002,5003,0003,5004,0004,500
SMI costs Avoided meter costs Business efficiencies andother benefits
Urban
0500
1,0001,5002,0002,5003,0003,5004,0004,500
SMI costs Avoided meter costs Business efficiencies andother benefits

Consultation Report - Cost Benefit Analysis of Smart Metering and DLC
National Assessment
NERA Economic Consulting
142
Figure 15.4 Urban and Rural/Remote Breakdown (Sm) – National NPV per NMI
Rural/Remote
0
200
400
600
800
1000
1200
SMI costs Avoided meter costs Business efficiencies andother benefits
Urban
0
200
400
600
800
1000
1200
SMI costs Avoided meter costs Business efficiencies andother benefits

Consultation Report - Cost Benefit Analysis of Smart Metering and DLC
National Assessment
NERA Economic Consulting
143
Table 15.6 Urban and Rural/Remote Breakdown ($m) – National, Total NPV
Scenario 1 Scenario 2 Scenario 4Gross Costs of SMI - Low
UrbanMeter/Device Costs (1,668) (1,946) (1,885)Rollout Economies of Scale 125 125 125Communications systems (53) (43) (53)Backend IT (307) (317) (293)Operating Costs (289) (384) (269)Refresh Costs (33) (194) (190)
Rural/RemoteMeter/Device Costs (404) (650) (443)Rollout Economies of Scale 55 209 55Communications systems (45) (24) (24)Backend IT (50) (50) (48)Operating Costs (45) (278) (274)Refresh Costs (4) (33) (33)
Total SMI Rollout Costs - LowUrban (2,224) (2,760) (2,565)Rural/Remote (493) (827) (767)Nationwide (2,717) (3,587) (3,332)
Gross Costs of SMI - HighUrban
Meter/Device Costs (2,475) (2,894) (2,747)Rollout Economies of Scale 129 129 129Communications systems (43) (35) (43)Backend IT (658) (715) (670)Operating Costs (473) (626) (454)Refresh Costs (57) (444) (437)
Rural/RemoteMeter/Device Costs (566) (744) (748)Rollout Economies of Scale 58 58 61Communications systems (75) (61) (73)Backend IT (103) (105) (115)Operating Costs (74) (465) (460)Refresh Costs (7) (75) (75)
Total SMI Rollout Costs - HighUrban (3,576) (4,586) (4,221)Rural/Remote (766) (1,392) (1,410)Nationwide (4,343) (5,978) (5,631)
Benefits of SMI - LowUrban
Avoided Meter Costs 1,257 1,257 1,257Business Efficiencies 1,836 1,525 1,525Net Transfers 0 0 0
Rural/RemoteAvoided Meter Costs 499 499 499Business Efficiencies 680 575 575Net Transfers 0 (0) 0
Total Benefits of SMI - LowUrban 3,093 2,783 2,783Rural/Remote 1,178 1,074 1,074Nationwide 4,272 3,857 3,857

Consultation Report - Cost Benefit Analysis of Smart Metering and DLC
National Assessment
NERA Economic Consulting
144
Benefits of SMI - HighUrban
Avoided Meter Costs 1,873 1,873 1,873Business Efficiencies 2,417 1,937 1,937Net Transfers 3 3 3
Rural/RemoteAvoided Meter Costs 732 733 733Business Efficiencies 887 712 712Net Transfers 0 0 0
Total Benefits of SMI - HighUrban 4,292 3,813 3,813Rural/Remote 1,620 1,446 1,446Nationwide 5,913 5,258 5,258
Net Benefit (Loss) Excluding Demand Response
Minimum Net Benefit
Urban (483) (1,803) (1,438)Rural/Remote 412 (318) (336)
Maximum Net Benefit
Urban 2,068 1,053 1,248Rural/Remote 1,127 619 678
Demand Response - LowNationwide 250 250 250
Demand Response - HighNationwide 738 738 738
Net Benefit (Loss) Including Demand Response
Minimum Net BenefitNationwide 179 (1,870) (1,524)
Maximum Net BenefitNationwide 3,934 2,410 2,664

Consultation Report - Cost Benefit Analysis of Smart Metering and DLC
National Assessment
NERA Economic Consulting
145
Table 15.7 Urban and Rural/Remote Breakdown ($) - National, NPV per NMI
Scenario 1 Scenario 2 Scenario 4Gross Costs of SMI - Low
UrbanMeter/Device Costs (202) (236) (229)Rollout Economies of Scale 15 15 15Communications systems (6) (5) (6)Backend IT (37) (38) (36)Operating Costs (35) (47) (33)Refresh Costs (4) (24) (23)
Rural/RemoteMeter/Device Costs (294) (474) (322)Rollout Economies of Scale 40 152 40Communications systems (33) (18) (18)Backend IT (36) (36) (35)Operating Costs (33) (202) (200)Refresh Costs (3) (24) (24)
Total SMI Rollout Costs - LowUrban (270) (335) (311)Rural/Remote (359) (602) (559)
Gross Costs of SMI - HighUrban
Meter/Device Costs (300) (351) (333)Rollout Economies of Scale 16 16 16Communications systems (5) (4) (5)Backend IT (80) (87) (81)Operating Costs (57) (76) (55)Refresh Costs (7) (54) (53)
Rural/RemoteMeter/Device Costs (412) (542) (544)Rollout Economies of Scale 42 42 44Communications systems (55) (44) (53)Backend IT (75) (77) (84)Operating Costs (54) (338) (335)Refresh Costs (5) (55) (54)
Total SMI Rollout Costs - HighUrban (434) (557) (512)Rural/Remote (558) (1,014) (1,026)
Benefits of SMI - LowUrban
Avoided Meter Costs 153 153 153Business Efficiencies 223 185 185Net Transfers 0 0 0
Rural/RemoteAvoided Meter Costs 363 363 363Business Efficiencies 495 419 419Net Transfers 0 (0) 0
Total Benefits of SMI - LowUrban 375 338 338Rural/Remote 858 782 782

Consultation Report - Cost Benefit Analysis of Smart Metering and DLC
National Assessment
NERA Economic Consulting
146
Benefits of SMI - HighUrban
Avoided Meter Costs 227 227 227Business Efficiencies 293 235 235Net Transfers 0 0 0
Rural/RemoteAvoided Meter Costs 533 534 534Business Efficiencies 646 519 519Net Transfers 0 0 0
Total Benefits of SMI - HighUrban 521 463 463Rural/Remote 1,180 1,053 1,053
Net Benefit (Loss)
Minimum Net Benefit
Urban (59) (219) (175)Rural/Remote 300 (232) (244)
Maximum Net Benefit
Urban 251 128 151Rural/Remote 821 451 494
15.3.1. Differences in costs between urban, rural and remote areas
Table 15.6 shows that the total meter costs for urban areas are significantly higher than those in rural and remote areas, on a national basis.
On a per NMI basis, meter costs are higher in rural and remote areas compared to urban areas. This reflects the higher per unit meter costs for meters compatible with the communications technology assumed for rural/remote areas compared to that assumed for urban areas. EMCa estimates that the national weighted average costs for meters with integrated communications is between $136 and $190 for meters compatible with the mesh radio network assumed for urban areas, but rises to $168 to $184 for meters compatible with PLC, which the assumed communications for customers in rural and remote areas under Scenario 1.196 Under Scenarios 2 and 4, the difference is even more pronounced. EMCa has assumed for these scenarios that the meters used would have separate communications (see discussion in section 5.1.4.4). The national weighted average cost for this type of meter is between $164 and $234 for meters compatible with mesh radio (i.e. the majority of urban meters) and $209 to $320 for meters compatible with GPRS (i.e. the majority of rural/remote customers).
In relation to installation costs, EMCa notes in its transitional cost workstream report that whether a meter is installed in an urban situation or a rural or remote situation has a significant impact on the installation cost.197 In urban environments installers can walk down the streets attending each house quite easily. In rural and remote areas, many installers may need to travel in a vehicle some distance between meter installations. This extra travelling time and vehicle use increases the average costs for rural and remote installations. EMCa’s 196 See EMCa Workstream 1Transitional Costs Consultation Report (February 2008), sections 3.4 and 3.5. 197 See EMCa Workstream 1Transitional Costs Consultation Report (February 2008), section 4.5.

Consultation Report - Cost Benefit Analysis of Smart Metering and DLC
National Assessment
NERA Economic Consulting
147
estimates result in an average of a 25 per cent extra cost for installations in rural areas compared with urban areas and an extra 200 per cent for remote areas compared to urban areas.
Although both the meters themselves and installation costs are estimated to be more expensive on a per NMI basis for rural and remote customers, the greater number of urban versus rural and remote customers means that on a total cost basis the NPV of meter costs for urban areas is greater than the NPV of meter costs for rural and remote areas.
In relation to communications costs, there are differences in the communications technology assumed by EMCa in relation to customers in urban, rural and remote areas, under each of the smart meter rollout scenarios. These differences are summarised in Table 15.8.
Table 15.8 Communications Technologies Assumed
Scenario Urban Rural Remote
Scenario 1 Mesh radio (97%)
GPRS (3% fill-in)
PLC PLC
Scenario 2a Mesh radio (80%)
GPRS (20% fill-in)
GPRS PSTN
Scenario 2b GPRS GPRS PSTN
Scenario 2c Mesh radio (97%)
GPRS (3% fill-in)
PLC PLC
Scenario 4a Mesh radio (97%)
GPRS (3% fill-in)
GPRS PSTN
Source: EMCa Transitional Cost Phase 2 Workstream Report, section 5.9
The different communications technology assumptions have different cost implications between urban, rural and remote areas, both in relation to transitional infrastructure costs and ongoing operational costs for data flows. In particular, the PLC technology assumed under Scenario 1 for rural and remote areas is less costly than the GPRS and PSTN combination assumed under Scenarios 2a and 4a. EMCa notes that the PLC option may not be available under Scenario 2a because of the tight integration required with the distributor’s network. However, they have also considered a sensitivity in which PLC is utilised for rural and remote areas. The figures presented in Table 15.6 are based on the communications costs estimated by EMCa under Scenario 2a.
We note that during the course of this Phase 2 analysis concern has been expressed by some as to whether PLC is viable on rural networks in Australia. This concern is discussed further in EMCa’s transitional cost report.198 EMCa’s view is that there are adequate answers to the concerns raised such that PLC can be considered a viable technology for Australia.
198 EMCa Workstream 1Transitional Costs Consultation Report (February 2008), section 5.6.2.

Consultation Report - Cost Benefit Analysis of Smart Metering and DLC
National Assessment
NERA Economic Consulting
148
Although on a per NMI basis communications costs are higher in rural and remote areas compared to urban areas, in the aggregate, the greater number of customers in urban areas means that the total communications costs are higher in urban areas.
15.3.2. Differences in benefits between urban, rural and remote areas
In relation to business efficiency benefits, CRA has identified the breakdown of benefits between urban, rural and remote areas. NERA has converted the total CRA figures to identify the differences in benefits on a per NMI basis between the areas. We discuss the five largest benefit categories below.
CRA estimates that the value of routine reads per annum is $53.3 million for urban areas, $12.5 million for rural areas and $7.4 million for remote areas.199 On a per NMI basis, this implies avoided costs of $6.45 per NMI for urban areas, $11.64 per NMI for rural areas and $26.99 per NMI for remote areas. The avoided costs for routine reads are higher per customer for rural and remote areas.
CRA estimates that the value of avoided costs for special reads per annum is $57.9 million for urban areas, $13.4 million for rural areas and $8.8 million for remote areas.200 The relative frequency of special reads is the same in both urban and rural areas. On a per NMI basis, this implies avoided costs of $7.01 per NMI for urban areas, $12.51 per NMI for rural areas and $32.24 per NMI for remote areas. The avoided costs for special reads are higher per customer for rural and remote areas.
CRA estimates that the value of avoided costs for connections and disconnections per annum is $19.1 million for urban areas, $4.3 million for rural areas and $2.8 million for remote areas (lower bound estimates).201 The relative frequency of remote connections and disconnections is lower in urban areas than in rural areas in the lower bound (1 per cent compared to 4 per cent) but higher in the upper bound (29 per cent versus 18 per cent). On a per NMI basis, this implies avoided costs of $2.31 per NMI for urban areas, $4.03 per NMI for rural areas and $10.25 per NMI for remote areas. The avoided costs for connections and disconnections are higher per customer for rural and remote areas.
CRA estimates that the value of avoided costs from reductions in calls to faults and emergency lines per annum is $14.8 million for urban areas, $3.5 million for rural areas and $2.4 million for remote areas.202 On a per NMI basis, this implies avoided costs of $1.79 per NMI for urban areas, $3.26 per NMI for rural areas and $8.83 per NMI for remote areas. The avoided costs for a reduction in calls are higher per customer for rural and remote areas.
Finally, CRA estimates that the avoided costs of investigating customer complaints about voltage-related quality of supply per annum (in the lower bound) is $14 million for urban areas, $4 million for rural areas and $3 million for remote areas.203 On a per NMI basis, this 199 See CRA Workstream 2 Network Impact Consultation Report (February 2008), Table 13. 200 See CRA Workstream 2 Network Impact Consultation Report (February 2008), Table 18. 201 See CRA Workstream 2 Network Impact Consultation Report (February 2008), Table 29. 202 See CRA Workstream 2 Network Impact Consultation Report (February 2008), Table 41. 203 See CRA Workstream 2 Network Impact Consultation Report (February 2008), Table 35.

Consultation Report - Cost Benefit Analysis of Smart Metering and DLC
National Assessment
NERA Economic Consulting
149
implies avoided costs of $1.72 per NMI for urban areas, $3.09 per NMI for rural areas and $8.28 per NMI for remote areas. The avoided costs are higher per customer for rural and remote areas.
Overall, total business efficiency benefits on a per NMI basis are estimated to be greater for rural and remote customers compared to urban customers ($495 per NMI for rural/remote customers versus $222 per NMI for urban customers in the low benefits case and ($646 per NMI for rural/remote customers versus $293 per NMI for urban customers in the high benefits case). However, given the lower proportion of rural and remote customers overall the total business efficiency benefits are greater for urban customers in NPV terms than they are for rural and remote customers.
15.3.3. Overall impact on net benefit in urban, rural and remote areas
On the basis of the foregoing analysis, it is clear that both costs per NMI and business efficiency benefits per NMI are greater for customers in rural and remote areas than for urban customers.
In relative terms, the higher benefit per NMI in rural and remote areas exceeds the increase in costs per NMI for these customers, on the basis of the estimates provided by EMCa and CRA.
As a result, the net benefit per NMI is greater for customers in rural and remote areas than it is for customers in urban areas. Table 15.7 indicates that the net benefit per NMI in NPV terms ranges from $300 to $821 per NMI under Scenario 1 for customers in rural and remote areas compared to -$59 to $251 per NMI for customers in urban areas. On an aggregate basis, the net benefit in NPV terms is between $412 to $1,127 million for Scenario 1 for rural and remote areas compared to -$483 to $2,068 million for customers in urban areas, excluding the impact of any demand response.
These figures highlight that the total net benefit for a smart meter rollout reflects differences between urban and rural/remote areas. For some jurisdictions, a rollout of smart meters in urban areas is shown as having a negative net benefit, on the basis of the allocation of benefits between urban, rural and remote reflected in the estimates. Our analysis indicates that the jurisdictions in which this is the case (and which are driving the overall national results in this area) are Victoria, South Australia, Tasmania.
15.4. Consumer assessment
The implications for households of smart metering or direct load control programs will vary according to the specific household’s characteristics. The implications of smart metering for vulnerable consumers may therefore be of particular concern. The introduction of smart metering will potentially affect consumers by:
providing an opportunity to benefit from lower bills because of opportunities provided by new tariff product offerings;
initial increases in tariffs as the costs of the initial smart metering rollout are passed through to consumers;
improvements in the service provided to customers.

Consultation Report - Cost Benefit Analysis of Smart Metering and DLC
National Assessment
NERA Economic Consulting
150
Over time, business cost savings resulting from the introduction of smart metering would be expected to be passed through to customers in the form of lower network tariffs, through the regulatory price setting framework. The allocation of benefits from smart metering presented in this report to distributors and retailers do not recognise that many of the cost savings associated with smart metering will be ultimately passed through to customers in the form of lower prices than would have otherwise been the case in the absence of the smart metering rollout.
To assess the jurisdictional consumer impact resulting from a mandatory rollout of smart metering, NERA undertook a bill impact assessment for each jurisdiction, drawing on information on average customer consumption and tariffs. The impact assessment uses NERA’s model of consumer electricity demand changes associated with the introduction of TOU tariffs and critical peak pricing, based on jurisdictional load curves and existing prices.204 The results are only indicative of the possible bill impact that would result from the introduction of TOU tariffs and critical peak pricing, since the actual impact will be affected by tariff levels and structures implemented by electricity retailers following the introduction of smart metering.
In general, our analysis indicates that households with a relatively low proportion of total consumption during peak periods (for example households where occupants work during the day), are likely to be better off after the introduction of TOU tariffs, without necessarily needing to change current electricity usage behaviour. This highlights the fact that under flat tariff arrangements these households are currently cross-subsidising households who use a greater proportion of electricity during peak periods.
The results indicate that for a household using average consumption, and also matching the state load profile, there are likely to be bill reductions arising from changing between an existing flat tariff product to a TOU or critical peak pricing product. The results indicate that for TOU tariffs, bill reductions would be in the order of between 1 and 4 per cent. Bill reductions increase for a combined TOU and critical peak pricing bill product. Direct load control programs, because of an assumed annual payment of $75 for participation in the program deliver the greatest benefits, although these would only be for those customers who qualify by owning a controllable air-conditioner. The full results of this assessment by jurisdiction and tariff product are reproduced below.
204 Detailed consumer impact results can be found in NERA, Workstream 4 Consumer Impacts Consultation Report
(February 2008), section 8.

Consultation Report - Cost Benefit Analysis of Smart Metering and DLC
National Assessment
NERA Economic Consulting
151
Table 15.9 Summary of Jurisdictional Bill Impacts – Average Consumption Customer
Change in electricity demand (%) State and tariff205 Peak Off-peak Total
Total bill change (%)
New South Wales TOU -3.9 0.8 -0.3 -1.2 CPP + TOU -4.1 1.0 -0.2 -2.0 DLC + TOU -4.5 0.4 -0.7 -8.5 Australian Capital Territory TOU -3.8 0.7 -0.2 -3.8 CPP + TOU -4.1 0.9 -0.1 -5.3 Victoria TOU -3.5 1.3 -0.4 -1.5 CPP + TOU -4.1 1.7 -0.3 -3.7 DLC + TOU -5.2 1.2 -1.0 -10.4 South Australia TOU -2.6 2.2 -0.3 -1.3 CPP + TOU -3.0 3.0 -0.1 -4.1 DLC + TOU -3.0 2.6 -0.3 -7.8 Tasmania TOU -1.6 0.5 -0.2 -0.5 CPP + TOU -1.7 0.7 -0.2 -1.1 Queensland TOU -3.6 2.0 -0.3 -1.7 CPP + TOU -4.0 2.6 -0.2 -4.3 DLC + TOU -4.0 2.3 -0.3 -8.4 Western Australia TOU -3.4 0.8 -0.1 -0.8 CPP + TOU -4.3 0.9 -0.2 -2.4 DLC + TOU -4.4 1.1 -0.1 -9.8 Northern Territory TOU -0.7 0.8 0.0 -0.1 CPP + TOU -0.9 1.2 0.0 -0.7 DLC + TOU -1.7 0.8 -0.6 -6.1
Whether a vulnerable consumer is worse or better off from the introduction of time of use tariffs and/or critical peak prices will depend on their individual circumstances, and whether these tariff products are voluntarily applied. Assuming that households would only change to a new tariff product offering if they believe they will be better off, suggests that no household will be worse off.206 Over time, as costs change and the benefits of smart metering are passed through to customers, households remaining on flat tariffs may become faced with higher tariffs. This highlights the importance of providing adequate information to customers about the likely bill changes from new tariff product offerings, to allow them to make appropriate decisions about the tariff products they should use. One approach may be to consider requiring the inclusion on the bill of the savings (or increases) that results from TOU tariffs
205 Three tariff options were provided by KPMG for assessment, being: time of use tariff; critical peak pricing and time of
use; and direct load control with time of use tariff. 206 However, evidence from the UK suggests that consumers may make tariff product choices where they are actually
worse off – see Waddams, C., (2007), "Deregulating Residential Electricity Markets: What's on Offer?", CUAC Expert Forum on Electricity Pricing Forum Papers, Melbourne, 16 August, page 13.

Consultation Report - Cost Benefit Analysis of Smart Metering and DLC
National Assessment
NERA Economic Consulting
152
or critical peak pricing compared against flat tariff arrangements, assuming the same consumption.
We also note that the relatively low benefits associated with demand response (compared to business efficiencies) from a smart meter rollout means that providing for vulnerable customers to be excluded from TOU and CPP tariffs (where they wish to be) would not materially impact the overall cost benefit results.
The NERA consumer impact analysis identifies a number of consumer issues that should be further considered as part of the policy framework for a national rollout of smart metering. These are:207
the underlying regulatory framework for the introduction of smart metering should consider how hardship policies and other consumer protections and assistance programs should be modified to ensure that existing protections are not eroded;
new mechanisms for ensuring that households facing financial stress are identified and provided with information on assistance available, prior to utilising remote disconnection functionalities;
designing education programs about the introduction of smart metering and associated innovative tariff products, to ensure that demand responses are maximised;
providing an opportunity for households to readily shift between tariff products, if they discover that they are actually financially worse off from the new tariff product offering;
the need to consider the relationship between network businesses (offering time of use network tariffs and/or critical peak pricing) and the customer, given that most customers only receive a bill from a retailer and the retailer will not have an obligation to pass these new tariff structures onto customers. Alternatively an incentive mechanism could be designed to ensure that time of use tariffs and/or critical peak prices are transparently conveyed by retailers to customers; and
ensuring that there is sufficient notice of critical peak events, to provide the opportunity for a household to respond appropriately to the pricing signals presented.
207 Page 113, Consumer impact report.

Consultation Report - Cost Benefit Analysis of Smart Metering and DLC
Minimum National Functionality
NERA Economic Consulting
153
16. Minimum National Functionality
Phase 1 of our analysis focused on a consideration of a number of functions of smart metering to determine the incremental costs and benefits of each function. This in turn was the basis for making a number of recommendations for a proposed minimum national functionality for smart meters.
At its meeting on 13 December 2007, the MCE agreed to establish a minimum functionality for smart meters in the National Electricity Rules, in line with the recommendations made as part of Phase 1 of our study, and following the consideration of submissions on Phase 1. Our final recommendations in relation to the national minimum functionality as presented in this Phase 2 report are consistent with the MCE’s decision.
It is apparent having considered the submissions that there may be some confusion as to what was being specified as part of a mandated national minimum functionality. For clarity, we were asked to recommend functional capabilities of a smart meter that should be included in a national minimum functionality for smart meters. This is distinct from specifying minimum performance levels or service requirements among network businesses, retailers, NEMMCO or customers. We would envisage that once a minimum smart metering functional capability had been determined, a subsequent task would include the development of performance levels or service requirements arising from the functional capabilities.
In addition, it is important to acknowledge that the functional specification is for a national minimum functionality. This in no way prevents individual businesses from including additional functionalities in the smart meters that they may rollout, on the basis of individual business cases.208 The purpose of specifying a national minimum functionality was to address concerns about differences in functional specifications between jurisdictions, and to address market failures arising from the functional capability benefits accruing to other elements of the electricity supply chain.
In the remainder of this chapter we reconsider those functions that we recommended for inclusion in the national minimum functionality as part of our Phase 1 analysis, in light of submissions received. We also outline our reconsideration of issues in relation to those functions that were placed in the uncertain category, including functions 15, 16, 23 and 24. We note that the MCE has indicated that it is considering further specific requirements for the home area network to support in-home displays and appliance control. Our conclusions in relation to functionality 15 and 16 will assist the MCE to determine whether additional functionalities should be included in the national minimum functionality.
We conclude by outlining our proposed final national minimum smart metering functionality.
In Phase 1 we recommended that a number of functions not be included in the national minimum functionality.209 In general submissions were supportive of the recommendations 208 Any additional functionalities included above the national minimum should not impact on the operations of third parties
using the smart metering infrastructure. 209 These were: power factor measurement (single phase meters); provision of an in-home display; interface for
communications with gas and water meters; real-time service checking; separate standard base plate; and non-meter board installation.

Consultation Report - Cost Benefit Analysis of Smart Metering and DLC
Minimum National Functionality
NERA Economic Consulting
154
in relation to functions not included in the national minimum functionality.210 For this reason our Phase 1 recommendations on functions not to include in the national minimum functionality remains unchanged.
16.1. Review of the Phase 1 Functionality Recommendations
In Phase 1 of our review we recommended that the following functions be included in a national minimum functional specification for a smart meter.211
Table 16.1 Draft Recommendations from Phase 1 of Functionalities to be Included in a
Minimum National Functionality
No. Functionality
Energy measurement
9 Daily Remote Reading
10 Power factor measurement (three phase meters only)
11 Import/export metering
Switching and load management
12 Remote connect/disconnect (Case B)
13 Supply capacity control
14 Load management at meters through a dedicated control circuit (Case C)
Supply and service monitoring
19 Quality of supply and other event recording
20 Meter loss of supply and detection
Upgradeability and configurability
25 Remote configuration
26 Remote software upgrades
29 Plug and play device commissioning
This recommendation followed considerable analysis of the incremental costs and benefits associated with the provision of each function as part of a smart metering rollout. In general, many submissions were supportive of the inclusion of these additional functions within the smart metering functional specification. We examine and respond to submissions in the remainder of this section for each function.
210 Origin Energy highlight that there may remain merit in the use of smart metering to remotely collect gas and water
meter data. However not including this function in the national minimum functionality would not prevent this from occurring, particularly if the interface to a HAN is also included in the national minimum functionality.
211 Detailed costs and benefits for each function can be found in Chapter 9, NERA Phase 1 Overview Report.

Consultation Report - Cost Benefit Analysis of Smart Metering and DLC
Minimum National Functionality
NERA Economic Consulting
155
16.1.1. Energy measurement
Functionality 9: Remote reading (daily)
Remote reading of customer usage is a fundamental capability of the smart meters being considered in our analysis. As has been discussed in section 5.1 there are considerable potential benefits to distributors associated with avoiding the costs associated with managing and collecting customer usage data through periodic visits to customer premises to record meter data.
One of the additional functions that we were asked to evaluate in Phase 1 was the provision of half-hourly customer electricity usage information on a daily basis. We envisaged that this would involve the downloading of data from the meters during the day and over night, such that customers would be able to access the previous day’s electricity usage information. The performance level that we were asked to assume was that all data were available from 4am on the following day.
As the core functionality included the weekly reading of meters, we examined the costs and benefits associated with collecting this information on a more frequent basis and making it available to customers. The additional benefits arose from the enhanced demand response associated with the provision of electricity usage information on a more frequent basis. For this benefit to arise we further assumed that the businesses invested in online systems to make the data available to customers. This additional demand response was expected to lead to benefits in terms of network investment deferrals and associated hedging benefits. However, given the uncertainty of this benefit, we included a lower bound of zero.
In Phase 1, our results indicated that the daily reading functionality ranged from a loss of $4.51 per meter to a benefit of $15.88 per meter. EMCa and Impaq Consulting advised that while the incremental cost of providing daily remote reading capabilities was zero, the design and set up of back-end systems for a smart metering system would differ leading to increased costs if daily remote reading were subsequently included in the performance specifications.
A number of submissions expressed concerns about the daily read performance level.212 The concerns include whether the assumed costs are sufficiently small, compared to the incremental back-end systems to provide this information to customers.213 Energex and Ergon Energy both indicated that they thought the additional demand response was likely to be negligible. This is consistent with our lower bound demand response benefit of zero. We would recommend that the performance levels be considered further by a technical working group to determine a performance level that is both feasible and delivers the desired daily remote meter reading capability.
In a joint submission, the Consumer Utilities Advocacy Centre (CUAC), St Vincent de Paul Society and Alternative Technology Association (ATA), expressed concern that there is no guarantee that consumers will receive the information with sufficient certainty to modify their behaviour. 214 In Phase 1 we assumed that the information was transmitted via a customer
212 See Phase 1 submissions from Synergy, Ergon Energy, Energex and Distribution Control Systems Inc. 213 Page 7, Synergy Phase 1 Submission. 214 Consumer Utilities Advocacy Centre, St Vincent de Paul Society, & Alternative Technology Association, (2007),
Submission to the Cost Benefit Analysis of Smart Metering and Direct Load Control, Phase 1.

Consultation Report - Cost Benefit Analysis of Smart Metering and DLC
Minimum National Functionality
NERA Economic Consulting
156
website, where a customer would be able to log in and access their most recent electricity usage data. The costs that we used as part of Phase 1 included the costs associated with developing this assumed customer interaction website.
The joint CUAC, St Vincent de Paul and ATA submission highlight an important issue in relation to the daily remote reading capability. For it to deliver benefits distributors must be required to provide the customer information to households. This should be considered as part of the performance requirements associated with the smart metering rollout.
A number of submissions generally expressed support for the inclusion of daily remote reading in the national minimum functional specification.215 Some of the benefits identified by Origin Energy included:216
Improvements in the relevance of electricity consumption data to customers by allowing them to examine their consumption from the previous day;
Improvements in the process for delivery of final bills, reductions in bad debt exposure for retailers and improves cash flow; and
Lowering the technical risks arising from the potential for customer data to be lost due to failure of a collector with weekly reading.
A critical assumption underlying our final recommendation is that the cost of including this functionality in the meter is practically zero. To the extent that this is subsequently proven to not be the case, it would warrant a re-examination of its inclusion in the national minimum functionality. Network and retail businesses should be given the flexibility to choose whether to invest in the back-end systems based on an individual business case. This means that the cost implications of future performance requirements associated with the provision of daily remote reading information should be separately considered in the future.
Final Recommendation: We recommend that the national minimum functionality provide the capability of a meter to support daily remote reading. Further, we recommend that the specific performance requirements for daily remote reading capabilities be determined through a technical working group established for the purpose of deciding upon the performance capabilities of this and the other functionalities included in the National Minimum Functionality.
Functionality 10: Power factor measurement (three phase meters only)
Power factor measurement enables half-hour reactive interval energy measurement and recording.
In Phase 1 we concluded that there were little or no benefits associated with mandating power factor measurement in single-phase meters, in light of the cost associated with including power factor measurement in all meters. For three-phase meters however, our understanding is that all meter manufacturers currently automatically include power factor measurement in three-phase smart metering products, such that its inclusion would have no impact on the cost
215 See Phase 1 submissions from Origin, AGL, Country Energy and Integral Energy. 216 Page 5, Origin Energy Phase 1 Submission.

Consultation Report - Cost Benefit Analysis of Smart Metering and DLC
Minimum National Functionality
NERA Economic Consulting
157
of a three-phase smart meter. In light of this, we recommended that power factor measurement only be included for three-phase meters. However we also note that, if three-phase meters automatically come with power factor measurement then the practical impact of mandating its inclusion is zero.
Distributed Control Systems Inc, queried the need for including power factor measurement in all three phase meters, in light of the likely considerable costs associated with collecting and storing this data.217 Our reason for including this functionality was an understanding from EMCa that all three phase smart meters would have this function automatically included. We have not assumed that distributors would collect all of the associated power factor information on a frequent basis.
ETSA Utilities highlight that power factor problems are such an insignificant issue in South Australia that it does not warrant the inclusion in the national minimum functionality, even for three-phase meters. This suggests that, in their view, the benefits associated with its inclusion in the national minimum functionality are expected to be small.
In reviewing the submissions received for Phase 1 we have decided to continue to recommend its inclusion in the national minimum functionality. While in some jurisdictions the benefits may be low, in light of the fact that it is usually included in three-phase smart meters at no additional cost, it should be included in the national minimum functionality. As with other recommendations, if this assumption is proven to be incorrect, then it would be appropriate to examine whether it is included on an ad-hoc basis according to individual business needs. Similarly, this recommendation does not prevent a business decision to include power factor measurement in single-phase meters based on specific business needs.
Final Recommendation: We recommend that for single phase meters, power factor measurement not be included in the minimum national functionality. We further recommend that power factor measurement be included in the minimum national functionality for three phase meters.
Functionality 11: Import/export metering
Import/export metering enables energy flows both into and out of a customer’s premises to be recorded on a half hourly basis where the customer has installed local generation capability (such as photovoltaic (PV) cells).
The main benefit associated with the inclusion of import/export metering was the avoided cost of fitting an additional meter when a customer chooses to install PV cells. In Phase 1, in light of the relatively small cost of including this functionality in the meter, these avoided costs for a relatively low take up of installed PV cells (an additional 5 per cent over 20 years218) were sufficient to outweigh the costs. If PV cell installation were to increase by more than the assumed 5 per cent over 20 years, the avoided costs would be considerably
217 Distributed Control Systems Inc. (2007), Submission to the Cost Benefit Analysis of Smart Metering and Direct Load
Control, Phase 1. 218 This take-up rate assumption for PV cells has been made by CRA, see CRA Workstream 2 Network Impact
Consultation Report (February 2008), section 6.2

Consultation Report - Cost Benefit Analysis of Smart Metering and DLC
Minimum National Functionality
NERA Economic Consulting
158
higher. On this basis, we recommended in Phase 1 that import/export metering be included in the minimum national functionality.
In general, there was wide support for the inclusion of import/export metering in the national minimum functionality.219
A number of submissions however provided additional information on how the benefits may be affected by local regulatory requirements. For example, ETSA Utilities highlighted that in South Australia an ETSA Utilities representative is required to be present at any PV cell connection. This would mean that in South Australia the avoided costs associated with not having to visit the premises and install a new meter are likely to be lower (equal to just the avoided cost of the meter, excluding site visit costs). This suggests that in order to ensure that the benefits associated with import/export metering are fully realised there is a need to review the existing regulation that an ETSA Utilities representative is present at any PV cell connection. Given the national approach to a smart metering specification, and the fact that other jurisdictions do not have this regulatory requirement, a review of the rationale for such local regulations appears more appropriate than excluding this functionality from the national minimum specification.
Similarly, for Energex and Ergon Energy in Queensland, a site visit is also required to inspect the connection to the network when a PV cell is installed. This will also impact on the potential benefits associated with this functionality in Queensland.
CUAC, St Vincent de Paul and ATA also query whether the import/export functionality allows for only net as compared with gross recording of energy flows into and out of the network. It is our understanding that the import/export functionality would provide net metering capabilities (unless two element smart meters are installed).
Given the considerable benefits associated with avoiding the costs of installing an additional meter upon the installation of PV cells, and the likely growth in PV cell installation in Australia in the future, our final recommendation is to include import/export metering in the national minimum functionality. For those states where current safety regulations require a site visit upon the installation of PV cells, there may be merit in reviewing safety processes in other jurisdictions to determine whether similar approaches could be adopted to maximise the benefits resulting from the inclusion of this capability in the meter.
Final Recommendation: We recommend that import/export data recording be included in the minimum national functionality.
16.1.2. Switching and load management
Functionality 12: Remote connect/disconnect
The remote connect/disconnect functionality allows the power to a customer’s premise to be connected or disconnected either locally or remotely. In Phase 1 we were asked to consider two alternative performance levels – Case A and Case B – which related to the speed with which the majority of connections/reconnections can be achieved. 219 See submissions from AGL, Country Energy, Integral Energy and the Public Interest Advocacy Centre.

Consultation Report - Cost Benefit Analysis of Smart Metering and DLC
Minimum National Functionality
NERA Economic Consulting
159
In Phase 1 the benefits were found to outweigh the costs for all scenarios and cases, apart from a lower bound loss for Case B and Scenarios 2 and 4. Despite this, we believed that it was appropriate to include this functionality in the national minimum meter specification, and that performance Case B could also be justified.
Submissions were generally supportive of the inclusion of the remote connect/disconnect functionality in the national minimum functionality specification. Both Energex and Ergon Energy highlighted that in Queensland safety regulations require a network business representative to be present at all reconnections for safety reasons. In light of this they queried the extent of costs that could be avoided from this functionality in Queensland.220
NEMMCO’s submission highlights what it believes to be the required business processes associated with this functionality, indicating that it will be necessary to work through the detailed costs associated with providing these processes. They include:221
“Initiation of each transaction by relevant parties, with advice to affected parties of that initiation.
Managing checks and balances between parties (e.g. interactions with other business processes; clarification of electricity safety; special consumer protection matters; etc.), possibly with objection mechanisms that allow affected parties to inhibit the transaction for valid, defined reasons.
Invoking the business process transaction and notifying affected parties at appropriate stages of the process.
Updating status information in relevant standing data tables.
Collecting any confirmation data and finalising standing data updates and notifications.”
The Consumer Action Law Centre identified a concern about the need to strengthen the regulatory arrangements surrounding the remote connect/disconnect functionality to ensure that appropriate hardship arrangements are maintained. In principle we agree that for both this, and other functionalities associated with smart metering, it will be necessary to develop appropriate hardship policies to ensure that social obligations to the community are maintained.
Having considered the submissions we believe that there remains merit in including this functionality in the National Minimum Functionality. It will be important in those states where there are safety regulations requiring a site visit from the relevant network business on a reconnection that this process be re-examined in light of the rollout of smart meters to determine whether alternative approaches can be allowed without compromising safety concerns. In addition, we believe that there is merit in a review of existing hardship policies to ensure that adequate protections are in place to manage circumstances where a household 220 Pages 5-6, Energex Phase 1 Submission, and page 8, Ergon Energy Phase 1 Submission. 221 Page 3, NEMMCO (2007), Submission to the Cost Benefit Analysis of Smart Metering and Direct Load Control, Phase
1.

Consultation Report - Cost Benefit Analysis of Smart Metering and DLC
Minimum National Functionality
NERA Economic Consulting
160
is unable to pay its bill, in light of the potential for retail business to instigate a remote disconnection under this capability.
Final Recommendation: We recommend that a remote connect/disconnect functionality be included within the minimum national functionality. In addition, we recommend that as part of the introduction of smart metering existing hardship policies be reviewed, particularly in relation to the application of remote connect/disconnections, in consultation with stakeholders.
Functionality 13: Supply capacity control
Supply capacity control allows retailers and/or distributors to limit power to individual customers. This functionality requires the smart meter to already have a remote connect/disconnect functionality (Functionality 12).
In Phase 1 we found that the cost of providing supply capacity control in the meter was zero, with the main costs associated with providing the capability to limit supply capacity being associated with MDCM and meter transactions management. While we were unable to quantify benefits associated with this function, a number of qualitative benefits were identified including assistance during network outages by providing an emergency supply capacity limit or the development of supply limited products to customers. We considered these benefits to be sufficient to outweigh the costs, particularly as they would only be incurred if the retailers/distributors believed that there were benefits to them from enabling this capability.
AGL, Country Energy, TRU Energy, Integral Energy and Energex all indicated support for this function in their Phase 1 submissions. However, the Australian Council of Social Service (ACOSS) highlighted that further work would be needed to consider the implications for low income households if this functionality were used to limit supply to a household due to bill non-payment. This is, therefore, an important consideration for revisions to hardship policies that will need to be developed in light of a smart metering rollout.
On this basis we continue to recommend the inclusion of supply capacity control in the National Minimum Functionality.
Final Recommendation: We recommend that supply capacity control be included as part of a Minimum National Functionality for a smart meter.
Functionality 14: Load management at meters through dedicated control circuit
Load management at meters through a dedicated control circuit is the existing arrangement for load control of electric storage water heating and space heating systems. Smart meters could incorporate additional functionality to allow for the more flexible use of these existing systems (rather than simply emulating the existing arrangements, as has been assumed in the core functionality).
Two performance levels have been assessed for this functionality. The first (Case B) is the capability to set turn on and turn off times remotely. The second performance level (Case C) also includes the ability to turn on and off controlled load remotely in less than one minute.

Consultation Report - Cost Benefit Analysis of Smart Metering and DLC
Minimum National Functionality
NERA Economic Consulting
161
As part of Phase 1 we recommended the inclusion of this functionality in the minimum national functionality specification, in light of the possible need for Case C performance level to support existing load control systems, particularly in Queensland and New South Wales.
However, since the Phase 1 report, it is now clear that performance levels will be determined as part of a subsequent exercise, through a technical working group. Given that load management at meters was also included in the core functionality, it is automatically included in the minimum national functionality to support existing load management systems. The appropriate performance level will need to be determined in consultation with distributors in each jurisdiction.
Final Recommendation: We recommend that load control at meters with a dedicated control circuit be included in the national minimum functionality and that appropriate performance levels are determined in consultation with distributors in each jurisdiction, through a technical working group.
16.1.3. Supply and service monitoring
Functionality 19: Quality of supply and other event recording
The ability for smart metering infrastructure to record quality of supply and other events allows distribution businesses to better monitor the quality of supply performance, and to detect and react to non-compliance with service standards more quickly.
Phase 1 determined that the cost of providing this capability was predominately incurred within a distributor’s business systems. EMCa indicated that the costs at the meter or communications system were zero. The benefits estimated by the network workstream suggested that there were potential avoided costs arising from no longer needing to collect data for customer quality of supply queries, reduced distributor call centre activity and the avoided cost of manually investigating supply quality events. Given that the uncertainty as to costs was in the back-end systems, we recommended in Phase 1 that this function be included in the minimum national functionality.
In general submissions were supportive of the inclusion of this functionality within the national minimum functionality specification.222 ETSA Utilities however highlighted that this function may not produce the benefits indicated by CRA stating:223
Manual polylogger tracking of load and voltage over time would still be required to analyse voltage levels and phase imbalance before undertaking remedial works.
ETSA Utilities also raise concerns that this functionality may highlight voltage problems in other areas of the network that are currently unknown, thereby resulting in significant cost increases associated with resolving these newly identified voltage problems.
Having considered the submissions we still believe that there is merit in including this function within the national minimum functionality. 222 See Phase 1 submissions from AGL, Country Energy, and Integral Energy. 223 Page 3, ETSA (2007) Submission to the Cost Benefit Analysis of Smart Metering and Direct Load Control, Phase 1.

Consultation Report - Cost Benefit Analysis of Smart Metering and DLC
Minimum National Functionality
NERA Economic Consulting
162
Final Recommendation: We recommend that quality of supply and other event monitoring be included as part of a minimum national functionality.
Functionality 20: Meter loss of supply detection
Meter loss of supply detection and outage detection allows a loss of supply to a customer’s meter to be detected by regular communications with the meters at a customer’s premise (e.g. using a regular service ‘ping’).
In Phase 1 the network workstream identified significant benefits associated with this functionality. These included the likely reduction in calls to distributor fault and emergency lines, the avoided costs of site visits to check supply and the avoided distributor cost of rectifying nested network outages following storms. These benefits were found to outweigh the costs associated with providing this function. EMCa indicated that there were zero costs associated with providing this capability in the meter. The costs therefore associated with this function were the result of distributor and retailer system costs, where the benefits to each business would need to outweigh those costs. On this basis, we recommended in Phase 1 that meter loss of supply detection be included in the national minimum functionality.
As part of Phase 2 there have been a number of submissions questioning the likely value of the benefits associated with the provision of this function. These include:
in many Australian distribution networks, automatic outage detection already occurs at a transformer level, integrated with automated customer messaging systems, such that the incremental benefits from outage detection at a customer’s premise are likely to be lower than estimated in Phase 1;224 and
there may be technical problems associated with distinguishing between the unreliability of some communications systems, particularly in rural/remote areas, and a system outage.225
In general however, there was support for this functionality from submissions.226
Having considered the submissions and noting that there are no costs associated with the provision of this capability in the meter, we have decided to continue to recommend the inclusion of this function in the national minimum functionality. Where distributors and retailers decide that there are business benefits associated with its use, then it becomes a question for each business to decide whether to use this function.
Final Recommendation: We recommend that meter loss of supply detection be included in the national minimum functionality.
224 Personal communication, Ross Blundell, Energex. 225 Landis + Gyr, (2007), Submission to the Cost Benefit Analysis of Smart Metering and Direct Load Control, Phase 1. 226 See Phase 1 submissions from AGL, Country Energy and Integral Energy.

Consultation Report - Cost Benefit Analysis of Smart Metering and DLC
Minimum National Functionality
NERA Economic Consulting
163
16.1.4. Upgradeability and configurability
Functionality 25: Remote reconfiguration
Remote reconfiguration allows the smart meter settings to be changed remotely. This results in a benefit in relation to the avoided cost of distributor site visits to change settings.
In Phase 1 we found that these avoided costs were likely to be significant compared to the costs associated with providing this functionality. On this basis it was recommended for inclusion in the minimum national functionality.
All submissions that commented on remote reconfiguration supported its inclusions. In the absence of any disagreement, we therefore continue to recommend its inclusion in the national minimum functionality.
Final Recommendation: We recommend that remote reconfiguration be included as part of the minimum national functionality.
Functionality 26: Remote software upgrades
The ability to allow remote software upgrades reduces the cost that would be associated with manually upgrading the software installed in the meter over the meter’s life. It is expected that software upgrades would be needed in the early days of a smart meter rollout to fix various software bugs or fine tune the operation of the functionalities.
In Phase 1 we found that there were significant benefits associated with the inclusion of this function, compared with its costs in the meter. On this basis we recommended that it be included in the national minimum functionality.
All submissions that commented on remote software upgrades supported its inclusions. In the absence of any disagreement we therefore continue to recommend its inclusion in the national minimum functionality.
Final Recommendation: We recommend that remote software upgrades be included in the minimum national functionality.
Functionality 29: Plug and play device commissioning
Plug and play device commissioning of meters allows the meters to be activated and registered on the system remotely once they are installed, avoiding the costs of manual registration.
In Phase 1 the network workstream estimated benefits from the inclusion of this functionality associated with the reduction in installation time that would be expected. These benefits were found to outweigh the costs.
All submissions that commented on plug and play device commissioning supported its inclusions. In the absence of any disagreement, we therefore continue to recommend its inclusion in the national minimum functionality.

Consultation Report - Cost Benefit Analysis of Smart Metering and DLC
Minimum National Functionality
NERA Economic Consulting
164
Final Recommendation: We recommend that plug and play device commissioning be included in the minimum national functionality.
16.2. Additional functionalities requiring further consideration and analysis
There were a number of functions in Phase 1 where it was decided that there was sufficient uncertainty surrounding the costs and benefits to justify further analysis prior to finalising a recommendation as to its inclusion in the national minimum functionality. The results of this additional analysis are discussed below.
16.2.1. Functionality Enabling Direct Load Control via the Smart Meter Infrastructure and Facilitation of a Connection with an IHD
Two of the functionalities that we concluded in Phase 1 which required further analysis due to the uncertainty as to their costs and benefits were functionalities 15 and 16. These functionalities have been considered in more detail in Phase 2 of this study.
Functionalities 15 and 16 have the potential to provide direct load control benefits similar to the infrastructure associated with scenario 3, but within a smart metering infrastructure. In relation to functionality 16, this capability is provided via an interconnection with a HAN and three alternative cases were identified in Phase 1: 16A, 16B and 16C. These cases relate to alternative performance measures associated with the DLC functionality and also alternative means of achieving a DLC capability via a HAN.
Functionality 16 also has the added feature of allowing for the connection of an IHD, which has the potential to enhance a customer’s demand response through the real time provision of information on a household’s electricity consumption or extent of greenhouse gas emissions. This potential is available in all three cases (16A, 16B and 16C).
Given that functionalities 15 and 16 both provide DLC capability via a smart metering infrastructure they can be considered as alternatives to each other and we would expect to recommend only one for inclusion in the minimum national functionality. As a result we consider both of these functionalities together in this section before presenting our recommendation.
In relation to functionality 16, we have considered the costs and benefits of this functionality both assuming that it is used to provide DLC capability only, and also assuming that customers are provided with an IHD, which has the potential to lead to a further demand response. As the discussion later in this section clarifies, there is considerable uncertainty surrounding the impact on demand that may result from the provision of IHDs to consumers and the results from trials both in Australia and internationally are mixed. In the lower bound there may be no impact on demand, meaning that the provision of IHDs would result in additional costs but no additional demand benefits. As a result, we consider that it is worth assessing the net benefit associated with functionality 16 both without IHDs and with IHDs.
It should be noted that the analysis of the incremental net benefits presented in this section relate to the additional benefits compared with a distributor-led smart meter rollout (i.e. Scenario 1).

Consultation Report - Cost Benefit Analysis of Smart Metering and DLC
Minimum National Functionality
NERA Economic Consulting
165
Functionality 15: Interface to other load control devices
Functionality 15 relates to the provision of an interface with other load control devices. To distinguish it from functionality 16, this functionality has been further defined such that the interface would be directly with the SMI communications network, not via the meter.
The results of our incremental analysis of the additional net benefit that may be realised from adding functionality 15 to the minimum national functionality is set out in the following tables.
Table 16.2 NPV of Costs and Benefits ($m) - Functionality 15, National
Functionality CostsDemand
Response Net Position
Functionality 15Minimum Net Benefit (84) 169 85
Maximum Net Benefit (29) 169 140
Table 16.3 NPV of Costs and Benefits ($m) - Functionality 15, Jurisdictional Breakdown
FunctionalityNSW (winter
peak)NSW (summer
peak) VIC QLD SA WA NT TASNationwide (winter
peark NSW)Nationwide (summer
peark NSW)
Functionality 15Minimum Net Benefit 17 71 13 34 11 11 (1) n/a 85 138
Maximum Net Benefit 34 87 24 49 17 17 (0) n/a 140 194
Note: Given that the Australian Capital Territory does not have a separate NEM region we have been unable to separately estimate the demand impact for the Australian Capital Territory of a DLC capability
Figure 16.1 NPV of Benefits and Costs ($m) - Functionality 15, National
0
20
40
60
80
100
120
140
160
180
DLC Costs Demand response
Note: there is no upper bound shown in the figure in relation to demand response as we do not consider a higher take-up rate to be achievable for functionality 15.

Consultation Report - Cost Benefit Analysis of Smart Metering and DLC
Minimum National Functionality
NERA Economic Consulting
166
The key features in relation to functionality 15 are:
costs required at the meter in order to facilitate this functionality;
the interface does require a device to be installed on air-conditioners and pool pumps, in order to allow them to be remotely cycled by the smart metering system. This device needs to be able to operate on the basis of whatever SMI communications technology and protocols are in place for a particular premises, and these may be largely proprietary systems;
we have assumed that this device is installed only in new and replacement air-conditioners and pool pumps for those household that choose to take-up a DLC tariff from 2009 and that there is no retrofitting of this capability in existing air-conditioners and pool pumps;227
EMCa has estimated the costs of the device for air-conditioners at between $40 and $80 per device, plus a further $40 to $80 per device for installation. EMCa has assumed that devices that reflect the state (or area) specific standards would be installed in new air-conditioners at the customer’s site (rather than in the factory before sale), and that this installation could be undertaken by the same person who installs the air-conditioner rather than requiring a separate home visit. As a result total installed costs per device are estimated at between $80 and $160;
As discussed in section 5.2, we have adopted the same device and installation costs for pool pumps as for airconditioners, in the absence of better information; and228
we have assumed a 7.5 per cent uptake rate for DLC under this functionality.
A key distinction between this approach to providing DLC capabilities compared to the alternatives under functionality 16 or scenario 3, is the problem arising from different proprietary communications systems in each distributor region. The air conditioning devices will need to be capable of communicating with the SMI communications network in the customers’ area. Communications networks will inevitably differ in different parts of the country and may involve different and proprietary communications protocols, which would therefore need to be inherent in the devices. This represents a significant issue that would need to be addressed. It also represents a potential barrier to customer take-up of DLC products, given that a customer would need to ensure that the appliance they purchased was suitable for the DLC system operated in their distribution region. As a consequence, we have not estimated a ‘high take-up rate’ for functionality 15 but have assumed that the 7.5 per cent take-up rate assumption is itself aggressive. We note that current work by Standards Australia on DRED standards would address this technical hurdle by allowing different DLC communications modules to be inserted into an air-conditioner after manufacture (eg, at the point of installation).
The benefits arising from this functionality depend upon the impact the associated DLC program would have on electricity demand and the resulting: 227 Scenarios 1, 2 and 4 have been defined by the SMWG as excluding any DLC retrofitting, in order to distinguish them
from Scenario 3 which does include retrofitting. 228 We note that the overall results of the cost benefit analysis are not affected to a significant extent by the adoption of this
cost assumption.

Consultation Report - Cost Benefit Analysis of Smart Metering and DLC
Minimum National Functionality
NERA Economic Consulting
167
market benefits, including reductions in generation operating costs;
greenhouse gas emission reductions;
network deferral benefits; and
consumer benefits, from lower electricity usage.
NERA’s customer impact analysis has considered the likely impact on demand resulting from functionality 15 and the associated consumer benefits from lower electricity usage leading to lower electricity bills.229 CRA has then quantified the impact of this demand change in relation to market impacts (including greenhouse)230 and network deferral.231
The analysis of the incremental costs and benefits from functionality 15 shown in Table 16.2 indicates an overall positive net benefit at both the upper and lower bound, on a national basis. This picture is reflected in the net benefits calculated for the majority of jurisdictions set out in Table 16.3.232 The net benefit for the Northern Territory is shown as being negative, as DLC is not expected to lead to network deferral in the Northern Territory, due to its relatively flat load curve.233 There is no impact from this functionality in Tasmania, as a result of there being no times at which DLC would be likely to be called in Tasmania due to the winter peaking nature of load.
Functionality 16: Interface to home area network using open standard
Functionality 16 involves the inclusion in a smart meter of an in-home communications device (eg, Zigbee) to allow it to interface with in-home devices (including IHDs). This would allow consumers to establish a HAN that would communicate between any in-home device and display (including computers or air-conditioners) and their electricity meters.
Functionality 16 may impact on the net benefits flowing from a smart meter rollout in two ways:
1. by providing a DLC capability (similar to functionality 15 and scenario 3); and
2. by allowing for consumers to be provided with an IHD which may further enhance their demand response.
As part of Phase 1, functionality 16 was subdivided into three cases (A, B and C), each of which involves different combinations of performance standards and in-home devices. In Phase 1, functionality 16 Cases A and B were considered to have the same costs and benefits
229 NERA Worksteam 4 Consumer Impacts Consultation Report (February 2008), Appendix C3. 230 CRA Workstream 5 Market Impact Consultation Report (February 2008), section 4.3.3 231 CRA Workstream 2 Network Impact Consultation Report (February 2008), section 14. 232 We note that the net benefits shown for New South Wales reflect the winter peaking assumption in our base demand
analysis and would increase under an assumption of New South Wales becoming summer peaking. 233 See discussion in section 14.3.1.

Consultation Report - Cost Benefit Analysis of Smart Metering and DLC
Minimum National Functionality
NERA Economic Consulting
168
and so were considered together. As a result our analysis, we only distinguish between 16AB and 16C.
The results of our incremental analysis of the additional net benefit that may be realised from adding functionality 16AB or 16C to the minimum national functionality is set out in the following tables. As noted at the beginning of this section we have considered separately the incremental net benefit associated with utilising the DLC capabilities of functionality 16 only and the incremental net benefit with utilising both the DLC capability and also providing an IHD.
Table 16.4 NPV of Costs and Benefits ($m) - Functionality 16, National234
Functionality CostsDemand
Response Net Position
Functionality 16A,B without an IHD
Minimum Net Benefit (202) 169 (33)
Maximum Net Benefit (125) 709 584
Functionality 16A,B with an IHD
Minimum Net Benefit (746) 169 (578)
Maximum Net Benefit (530) 770 240
Functionality 16C without an IHDMinimum Net Benefit (211) 250 39
Maximum Net Benefit (129) 709 581
Functionality 16C with an IHDMinimum Net Benefit (755) 250 (505)
Maximum Net Benefit (533) 925 392
234 It should be noted that the results shown in the upper bound for 16AB and 16C without an IHD are indicative only,
based on the available demand response modelling results. They are indicative of the greater demand benefits that are likely to flow from an increased take-up rate for DLC.

Consultation Report - Cost Benefit Analysis of Smart Metering and DLC
Minimum National Functionality
NERA Economic Consulting
169
Table 16.5 NPV of Costs and Benefits ($m) - Functionality 16, Jurisdictional Breakdown235
FunctionalityNSW (winter
peak)NSW (summer
peak) VIC QLD SA WA NT TASNationwide (winter
peark NSW)Nationwide (summer
peark NSW)
Functionality 16A,B without an IHD
Minimum Net Benefit (22) 32 (17) 11 2 (2) (1) (4) (33) 20
Maximum Net Benefit 162 468 110 208 34 73 (0) (3) 584 890
Functionality 16A,B with an IHD
Minimum Net Benefit (196) (143) (157) (98) (38) (68) (6) (14) (578) (524)
Maximum Net Benefit 27 90 27 124 41 29 2 (10) 240 303
Functionality 16C without an IHDMinimum Net Benefit 5 94 (4) 31 7 5 (1) (4) 39 128
Maximum Net Benefit 161 467 109 208 34 73 (0) (3) 581 886
Functionality 16C with an IHDMinimum Net Benefit (169) (80) (144) (78) (33) (61) (6) (14) (505) (416)
Maximum Net Benefit 58 197 59 176 57 49 3 (10) 392 531
Note: Given that the Australian Capital Territory does not have a separate NEM region we have been unable to separately estimate the demand impact of a DLC capability.
Figure 16.2 NPV of Benefits and Costs ($m) - Functionality 16C with an IHD, National
0
100
200
300
400
500
600
700
800
900
1,000
DLC Costs Demand response
Assumptions relating to DLC capability
The key assumptions underpinning the incremental analysis for functionality 16AB for the provision of a DLC capability only are as follows:
there is a cost at the meter of incorporating the interface with a HAN. EMCa has estimated this cost at between $10 and $12 per meter;
inclusion of an interface with a HAN at the meter avoids the need to also include an optical port in the meter. The avoided cost of an optical port has been estimated by CRA to be between $1.00 and $1.50 per meter;
235 See previous footnote on interpreting the maximum net benefit figures for 16AB and 16C without an IHD.

Consultation Report - Cost Benefit Analysis of Smart Metering and DLC
Minimum National Functionality
NERA Economic Consulting
170
as a result the overall net additional cost at the meter of incorporating functionality 16 is assumed to lie in the range of $8.5 to $11 per meter;
an open system in-home communications device (eg, Zigbee) would be incorporated in air-conditioners and pool pumps in order to enable them to be remotely cycled within the HAN;
as with functionality 15, the device is assumed to be included in all new and replacement air-conditioners and pool pumps for program participants, and there is no retrofitting of this capability;
EMCa has estimated the costs of this device to be between $20 and $50 per device plus an installation cost of between $40 and $80 per device. EMCa has again assumed that the device would be installed in new air-conditioners at the customers’ premises, at the time the air-conditioner was installed. This results in a total installed cost per device of between $60 and $130 per device; 236
for Phase 2, we have considered a low and high take-up rate for household participation in a DLC program, being 7.5 per cent and 15 per cent of households with an air-conditioner. Since the DLC device is an open-system the difficulty of ensuring compatability with proprietary systems in different areas is avoided and therefore we consider that a higher take-up rate for DLC may be more realistic for this functionality than for functionality 15; and
the back-end systems costs and on-going operational costs estimated by EMCa for functionality 16 without an IHD are the same as those estimated for functionality 15.
As a result of the above assumptions, the estimated demand impact associated with the DLC capability only from functionality 16AB is the same as for functionality 15 for the lower bound, but higher than functionality 15 for the upper bound. The cost of achieving this demand impact is however higher for functionality 16AB than for 15. Although the installed device costs are lower for functionality 16AB, there is an additional cost at the meter for all customers that is not incurred under functionality 15.
Functionality 16C involves the HAN capability interacting with a smart thermostat rather than an open system in-home communications device (eg, Zigbee). This again allows both a DLC capability and the provision of IHDs.
The key features of 16C for the provision of a DLC capability are:
the additional net cost per meter is the same as for functionality 16AB and is between $8.50 and $11 per meter;
the back-end systems costs and on-going operational costs estimated by EMCa for functionality 16 without an IHD are the same as those estimated for functionality 15;
236 We also examined the impact of assuming that these devices are installed in all new and replacement air-conditioners at
the point of manufacture (which results in a lower overall installed device cost). However, given the proportion of households participating, it is still most cost effective to install these devices only for those households participating in the program.

Consultation Report - Cost Benefit Analysis of Smart Metering and DLC
Minimum National Functionality
NERA Economic Consulting
171
the cost of a smart thermostat has been estimated by EMCa to be in the range of $50 to $100; 237
there are no additional installation costs associated with smart thermostats. Overall the installed device costs for 16C are below those assumed for 15 and 16AB;
EMCa has assumed that smart thermostats are capable of interacting with both new air-conditioners and existing air-conditioners. Since there would be no additional costs associated with extending the DLC capability to existing air-conditioners we have therefore assumed that for 16C both new and replacement and existing air-conditioners could participate in the DLC program. This increases the potential amount of MW that could be placed under DLC and therefore the potential demand impact compared with functionality 16AB and functionality 15; and
the costs of the smart thermostats are only incurred for those customers who sign up to a DLC program.
As a result of the above assumptions, the potential demand response available from a DLC capability underpinned by smart thermostats (ie, functionality 16C) is greater than for functionalities 16AB and 15, since it can be applied to both new and existing air-conditioners. The device costs are also estimated to be lower for functionality 16C.
NERA’s customer impact analysis has considered the likely impact on demand as a result of functionality 16AB and the resulting consumer benefits from lower electricity usage leading to lower electricity bills.238 CRA has then quantified the impact of this demand change in relation to market impacts (including greenhouse)239 and network deferral.240
The results in Table 16.4 indicate that on a national basis the inclusion of functionality 16 in the national minimum functionality for a smart meter rollout would result in a positive net benefit in the lower bound in relation to DLC capability only,241 where that capability was provided by a smart thermostat (ie, case 16C). An increase in the take-up rate above 7.5 per cent would result in further demand benefits, increasing the overall net benefit associated with this functionality.
Where the DLC capability is provided by an open-system in-home communications device (16AB), the minimum net benefit is shown to be negative, on a national basis. The lower bound of the benefits estimate is below the higher bound of the costs estimate for 16AB. For 16AB to have a positive net benefit it would be necessary to either achieve a higher take-up rate (leading to greater demand benefits) or to achieve the lower bound of the cost estimates. We note that the lower bound of the benefits is above the lower bound of the costs estimate (by 35 per cent). We also note that the results presented in Table 16.4 are based on the base case demand assumptions for New South Wales. Adopting a summer peaking demand 237 EMCa Workstream 1Transitional Costs Consultation Report (February 2008), Section 15.2.3 238 NERA Workstream 4 Consumer Impacts Consultation Report (February 2008), Appendix C3. 239 CRA Workstream 5 Market Impact Consultation Report (February 2008), section 4. 240 CRA Workstream 5 Market Impact Consultation Report (February 2008), section 14. 241 ie, this discussion relates to the results reported in Table 16.3 for 16AB without an IHD and 16C without an IHD.

Consultation Report - Cost Benefit Analysis of Smart Metering and DLC
Minimum National Functionality
NERA Economic Consulting
172
assumption for New South Wales would increase the demand response benefits. Our sensitivity analysis indicates that this would result in an overall net positive benefit even in the lower bound for 16AB without the IHD.
The national results mask some differences in the net benefit results in each jurisdiction. The individual jurisdictional results are set out in Table 16.5. The results indicate that for Tasmania and the Northern Territory the inclusion of functionality 16 in the national minimum functionality would result in a negative net benefit in the lower bound, even in the case of 16C. This reflects the fact that functionality 16 increases the cost at the meter for all customers and in these jurisdictions the benefits resulting from a DLC capability are not sufficient to offset these costs. In the Northern Territory this is a result of the flat load profile, which means that the network deferral benefits have been assumed by CRA to be zero. For Tasmania, NERA’s demand analysis indicates that there would not in practice be periods in which DLC would be utilised, due to that jurisdiction’s winter peaking load.
Additional Impact From Provision of an IHD
Functionality 16AB and functionality 16C would also facilitate the provision of an IHD by retailers. An IHD has the potential to enhance customer demand responses, both via increasing the responsiveness of customers to TOU tariffs and CPP, and by engendering an additional conservation effect through greater customer awareness of energy use. However, there is a great deal of uncertainty regarding the extent of this additional demand impact.
In particular it is difficult to isolate the incremental impact of IHDs on demand. In order to separate out the impact of the IHD it is necessary to compare demand responses between customers that face TOU and/or CPP prices but do not have an IHD with those that face the same tariffs but were provided with an IHD. A number of the studies we have reviewed involving in-home displays do not allow that distinction to be drawn. Some caution must therefore be exercised when interpreting the results of these studies since findings that changes in tariffs result in changes in customer behaviour in trials which involve IHDs do not equate to findings that the provision of the IHD is the cause of that change in behaviour.
The Consumer Impact report prepared by NERA for workstream 4 contains a comprehensive summary of information available from a range of studies and trials, both in Australia and overseas.242 This summary indicates that the evidence of the impact of IHD on customer demand is very mixed.
Preliminary findings from the trials conducted by EnergyAustralia and Integral in Australia had indicated no statistically significant difference in behaviour in relation to CPP days from customers with an IHD and customers without. We understand that more recent results from the trials being conducted by Integral have found a significant difference in behaviour, with customers in the trial reducing their peak demand in CPP periods by around 5 per cent greater than customers without an IHD. We note, however, that these results are still preliminary.
In relation to the potential for an IHD to result in increased conservation, IHDs have the potential to increase customers’ awareness of their energy consumption. The awareness may
242 NERA, Workstream 4 Consumer Impacts Consultation Report (February 2008), see section 7.1 and Appendix A.

Consultation Report - Cost Benefit Analysis of Smart Metering and DLC
Minimum National Functionality
NERA Economic Consulting
173
both be in terms of the cost of that consumption, and also in relation to greenhouse gas emissions. In-home displays generally have the capability to display this information.243 Any general energy conservation effect may be expected to be higher the more customers look at their in-home display. That is, where an in-home display also provides other information, which customers may access frequently (such as weather updates), their awareness of their energy consumption may be higher.
However, the effect of an in-home display needs to be assessed in terms of the enhanced ability to provide this information to customers, compared with other channels (eg, provision of information via a customer’s bill).
The trials conducted by Country Energy, in which customers were given a smart meter, indicated that on-going education was important notwithstanding the fact that consumers had in-home displays.244 This may suggest that any general demand response associated with the provision of an in-home display may not be maintained in the longer run, in the absence of continuing customer education.
In the United Kingdom Sarah Darby published a report in 2006 that reviewed the results of a number of studies relating to the effectiveness of feedback on energy consumption.245 One of the key findings of this review was that studies examining direct feedback through either a meter or a display monitor had observed savings of between 5 to 15 per cent. However, the report also cautioned against the difficulties in comparing studies, given the considerable differences in sample size (only 3 in one case), duration of the study and additional interventions in some cases such as insulation or the provision of financial incentives to save.
A further trial was undertaken by Hydro One in the Canadian province of Ontario between July 2004 and September 2005 involving 435 participants that were provided with in-home displays that measured their electrical consumption in real time and displayed electricity consumption in both kWh and in monetary terms. 246 A control group was established and the participants in this trial were not provided with any additional educational material on electricity conservation. Participants were also not subject to time varying tariffs or CPP. According to Hydro One, participants in the trial were able to achieve aggregate reductions in consumption of 6.5 per cent.247 For customers without electric heating the reduction was 5.1 per cent. Since tariffs were unchanged in this trial the conservation effect represents a shift in the participants’ demand curves.
Although the results of this trial indicate substantive conservation benefits it is unclear whether these same levels of conservation could be achieved in Australia given the 243 The exception is displays which only have ‘three light’ capabilities. 244 Smart metering & Customer trials, A retailer perspective, ERAA Retail Energy Market Briefing, 30 July 2007, slide 10. 245 S. Darby, The Effectiveness of Feedback on Energy Consumption – A review for DEFRA of the Literature on Metering,
Billing and Direct Displays, April 2006. 246 Hydro One Brampton Networks Inc., Conservation and Demand Management Plan, Annual Report to December 31
2005, p.7-8. 247 We note that figures of 7 to 10 per cent conservation have been quoted in other reports in relation to the Hydro One trial.
The Hydro One Annual Report actually says that an overall average reduction of 7 to 10 per cent ‘is feasible’ if customers were to be provided with energy conservation ‘tips’ in addition to an IHD. This was not a feature of the trial, and therefore is only a speculative figure.

Consultation Report - Cost Benefit Analysis of Smart Metering and DLC
Minimum National Functionality
NERA Economic Consulting
174
differences in both the climatic conditions and the greater reliance on central heating in Ontario.
Given the above we have assessed two indicative cases for the additional demand response that may be associated with the provision of an IHD:
A zero additional demand response, consistent with the preliminary findings of the EnergyAustralia trials. This assumption has been adopted in our base demand case; and
An additional 4 per cent demand reduction, consistent with the most recent findings of the Integral Energy trials. This assumption has been adopted in the high demand response case, and is in addition to the 3 per cent additional conservation impact that has also been included in that case.
Again, NERA’s customer impact analysis has considered the likely impact on overall system demand as a result of including an IHD.248 CRA has then quantified the impact of this demand change in relation to market impacts (including greenhouse)249 and network deferral.250
In relation to IHDs the other key assumptions for our incremental analysis are:
EMCa has estimated the cost of IHDs at $100 per device;251
an IHD would only be provided to customers where a retailer chose to rollout IHDs. We have assumed for Phase 2 that IHDs would only be provided to customers that take-up TOU tariffs, CPP or DLC. This leads to an assumption that 45 per cent of customers would have an IHD in the lower bound and 60 per cent in the upper bound;252 and
EMCa has estimated higher costs for these categories for functionality 16AB and 16C where there is an IHD compared to without an IHD, due to the additional back-end costs associated with providing messaging services to IHDs.
Table 16.4 and Table 16.5 present the results of the incremental analysis for functionality 16 including an IHD.
In the lower bound, given that we have assumed a zero demand response, the inclusion of an IHD results in an increased cost, with no increase in benefits. As a result, the inclusion of 16C with an IHD yields in a negative net benefit.
In the upper bound, we have assumed an additional 7 per cent conservation impact resulting from the provision of IHDs to those customers on TOU tariffs, CPP and DLC. The national 248 NERA, Workstream 4 Consumer Impacts Consultation Report (February 2008), Appendix C3. 249 CRA Workstream 5 Market Impact Consultation Report (February 2008), section 4. 250 CRA Workstream 2 Network Impact Consultation Report (February 2008), section 14. 251 EMCa Workstream 1Transitional Costs Consultation Report (February 2008), Section 15.2.3. 252 The exception is Tasmania where the demand modelling indicates that there are no events which meet the criteria for
DLC. As a result the take-up rates for Tasmania relate only the proportion of customers on TOU and CPP tariffs which are 37.5 per cent in the lower bound and 45 per cent in the upper bound.

Consultation Report - Cost Benefit Analysis of Smart Metering and DLC
Minimum National Functionality
NERA Economic Consulting
175
results indicate that assuming this additional demand response the overall net benefit would be positive.
Whether or not the net benefit would be greater in the upper bound as a result of including the IHD compared with utilising only the DLC capability of functionality 16 cannot be determined from our results. The available demand response and market modelling results do not allow us to directly estimate the upper bound of demand response benefits that would result from a 15 per cent take-up rate for DLC but no IHD for functionality 16 and we have needed to proxy this result. Whilst we consider that this proxy is sufficiently robust to draw a conclusion that an uptake rate above 7.5 per cent would be likely to lead to a positive net benefit overall for 16AB we do not consider that it is robust enough to allow a comparison of the absolute results reported for the upper bound of functionality 16 without an IHD and functionality 16 with an IHD.
Discussion
A summary comparison of the key assumptions between functionalities 15 and 16 is provided in Table 16.6 below. We have also included a summary of the assumptions for scenario 3, for comparison purposes.

Consultation Report - Cost Benefit Analysis of Smart Metering and DLC
Minimum National Functionality
NERA Economic Consulting 176
Table 16.6 Assumptions for Functionalities 15, 16 and Scenario 3
Lower bound Upper bound Lower bound Upper bound Lower bound Upper bound Lower bound Upper bound Lower bound Upper bound Lower bound Upper bound
Meter cost ($/meter) - - 8.5 11 8.5 11 8.5 11 8.5 11 - -Air conditioner device ($/device) 40 80 20 50 20 50 50 100 50 100 80 100Installation ($/device) 40 80 40 80 40 80 - - - - 40/80* 90/180*Included in: New New New New New New New and Retrofit New and Retrofit New and Retrofit New and Retrofit New and Retrofit New and RetrofitIHD cost ($) - - - - 100 100 - - 100 100 - -DLC participation rate 7.5% 7.5% 7.5% 15% 7.5% 15% 7.5% 15% 7.5% 15% 10% 20%Proportion of households with an IHD** - - - - 45% 60% 45% 60% 45% 60% - -Conservation effect 0% 3% 0% 3% 0% 7% 0% 3% 0% 7% - -Distributor and Market Operator costs ($M)*** (7.09) (10.70) (7.09) (10.70) (16.48) (24.79) (7.09) (10.70) (16.48) (24.79) (28.26) (50.30)Retailer costs ($M) (5.04) (7.56) (5.04) (7.56) (30.24) (45.36) (5.04) (7.56) (30.24) (45.36) (1.00) (1.67)
* new/retrofit** Except Tasmania: 37.5% (lower) and 45% (upper)*** All costs shown in Net Present Value terms
Assumption Scenario 3Functionality 15 Functionality 16A+B (no IHD) Functionality 16A+B (with IHD) Functionality 16C (with IHD)Functionality 16C (no IHD)

Consultation Report - Cost Benefit Analysis of Smart Metering and DLC
Minimum National Functionality
NERA Economic Consulting 177
Many submissions commented on whether an interface to a home area network, to support an in home display, should be incorporated in the national minimum functionality. The key arguments for its inclusion were:253
IHDs facilitate customer responsiveness to TOU pricing and critical peak pricing and were a more direct information source compared with alternatives such as customer information provided via a website;
IHDs facilitate retailer competition;
while the benefits are uncertain at this time, the costs of including the functionality at a subsequent time would be prohibitive, suggesting that its inclusion as an option was appropriate; and
IHDs enable the introduction of TOU pricing to customers, through improving awareness and understanding of the new tariff products.
The Consumer Action Law Centre raised privacy concerns about the use of the IHD by retailers for advertising purposes.254 Country Energy also highlighted that:255
While IHDs appear to be useful in providing customers with a readily visible mechanism to understand their usage, there is little evidence to suggest that similar responses may not be possible by providing an internet portal for accessing data.
As part of the focus groups conducted for the NERA consumer impact analysis participants were asked about their reactions to in-home displays. In general participants thought that an IHD would be valuable in assisting with managing electricity use, including shifting between peak and off-peak periods, and overall household electricity conservation. High income participants once prompted however indicated that the novelty of an in-home display was likely to wear off pretty quickly and one would need to be particularly interested in electricity usage for a sustained effect to result.
To provide a limited indication of the value of an in-home display to a household, participants were asked whether they would be willing to pay $100 for the IHD. Participants in the more energy conscious states of Queensland and regional Victoria tended to be more willing to purchase a display at that price. In general, however, only those participants who felt that they would seriously monitor electricity usage to get their money back on the purchase indicated that they would be willing to purchase an IHD for $100.
16.2.1.1. Summary
Table 16.7 below summarises the results of the incremental analysis on a national basis of functionalities 15 and 16.
253 See Phase 1 submissions from ACOSS, PIAC, Griffith University Centre for Credit and Consumer Law, Total
Environment Centre, Synergy, Origin Energy, AGL, PRI, TRUEnergy, Western Power, and AEEMA. 254 Page 3, Consumer Action Law Centre Phase 1 Submission. 255 Page 5, Country Energy Phase 1 Submission.

Consultation Report - Cost Benefit Analysis of Smart Metering and DLC
Minimum National Functionality
NERA Economic Consulting 178
Table 16.7 NPV of Costs and Benefits ($m) - Functionalities 15, 16AB and 16C, National256
Functionality NSW VIC QLD SA WA NT TAS Nationwide
Functionality 15Minimum Net Benefit 17 13 34 11 11 (1) n/a 85
Maximum Net Benefit 34 24 49 17 17 (0) n/a 140
Functionality 16A,B without an IHD
Minimum Net Benefit (22) (17) 11 2 (2) (1) (4) (33)
Maximum Net Benefit 162 110 208 34 73 (0) (3) 584
Functionality 16A,B with an IHD
Minimum Net Benefit (196) (157) (98) (38) (68) (6) (14) (578)
Maximum Net Benefit 27 27 124 41 29 2 (10) 240
Functionality 16C without an IHDMinimum Net Benefit 5 (4) 31 7 5 (1) (4) 39
Maximum Net Benefit 161 109 208 34 73 (0) (3) 581
Functionality 16C with an IHDMinimum Net Benefit (169) (144) (78) (33) (61) (6) (14) (505)
Maximum Net Benefit 58 59 176 57 49 3 (10) 392
We note that the results reported above suggest that the inclusion of functionality 16 would have positive net benefits, even in the lower bound, where it involved a DLC capability underpinned by smart thermostats (ie, 16C) and where it did not also involve provision of an IHD. In the upper bound functionality 16 is expected to have a positive net benefit, both where it involves DLC capability only and where it involves provision of an IHD. Our results do not allow us to determine whether the extent of net benefits in the upper bound are greater where an IHD is provided or not.
We note that the decision as to whether to include functionality 16 in the national minimum functionality relates only to whether the meters that are rolled out include an interface with a HAN. How that interface is ultimately used will be determined by the commercial considerations of both retailers and distributors. That is, whether the interface is used to provide DLC capability and, if so, whether that is provided via a smart thermostat or via an open-system in-home communications device but will be determined in a subsequent business decision rather than as part of the minimum national functionality. Similarly, whether consumers are provided with IHDs will depend on businesses’ consideration of whether they expect to achieve an enhanced demand response or could realise other benefits from an IHD.
We also note that there are jurisdictional differences in relation to the net benefits that may be expected as a result of the inclusion of functionality 16 in the minimum national functionality. For some jurisdictions (Tasmania and the Northern Territory) the net benefit of functionality 16C without an IHD have been estimated to be negative. However, we have been asked to
256 It should be noted that the results shown in the upper bound for 16AB and 16C without an IHD are indicative only,
based on the available demand response modelling results. They are indicative of the greater demand benefits that are likely to flow from an increased take-up rate for DLC.

Consultation Report - Cost Benefit Analysis of Smart Metering and DLC
Minimum National Functionality
NERA Economic Consulting 179
make recommendations in relation to a national functionality. As a result we have considered the overall national net benefit in forming our recommendations in this area.
Given that inclusion of functionality 16 has a positive net benefit nationally in the lower bound estimate for at least one potential combination reported in Table 16.7, as well as the potential upside from realising additional benefits on the demand side, we recommend that functionality 16 should be included within the minimum national functionality.
Functionality 16 is preferred over functionality 15 because the relative ease of DLC program participation where all air-conditioners are compatible with an open HAN standard would be expected to result in higher participation rates under functionality 16 compared with functionality 15. As a result we consider that there is greater upside potential in relation to the demand response achieved as a result of functionality 16.
We note that in order to maximise the benefits from the inclusion of an interface to a HAN:
further work should be undertaken to understand the type and sources of information that are most likely to encourage reductions in overall household electricity consumption;
widespread marketing should be undertaken to encourage energy efficiency, and promote electricity monitoring via IHD; and
that regulatory barriers to DLC compared with network augmentations (for example through the current application of the two limbs of the regulatory test) should be examined to ensure that network businesses make use of DLC capabilities where it is a cost effective alternative to network augmentation.
Final Recommendation: We recommend that an interface to a home area network (functionality 16) is included as part of the national minimum functionality and that:
further work be undertaken to identify the type and sources of information that best promote energy efficiency and the introduction of TOU and critical peak pricing;
widespread marketing to encourage energy efficiency is undertaken to improve DLC participation and conservation benefits in association with a smart metering rollout;
further trials are undertaken to identify how to improve participation rates in DLC programs, and encourage the use of IHDs to lower household energy consumption; and
any regulatory barriers to the use of DLC by network businesses be examined.
16.2.2. Functionality 21: Customer supply monitoring
Customer supply monitoring is intended to enable the meter to send an alarm if it detected (i) reverse polarity at a customer’s connection; (ii) degradation of the customer’s neutral; or (iii) degradation of the customer’s earth connection (from switchboard to earth).
While in Phase 1 it was estimated that this functionality had the potential to deliver significant net benefits there were doubts as to its feasibility as a meter function. At this time

Consultation Report - Cost Benefit Analysis of Smart Metering and DLC
Minimum National Functionality
NERA Economic Consulting 180
this function is not proven and would therefore likely need considerable field testing before its inclusion as part of a national metering rollout. However in light of the uncertainty as to its current feasibility, we placed this functionality into a category with a number of other additional functions that were considered to be uncertain and asked for submissions.
Unfortunately, there were no submissions that provided additional information on the feasibility of providing this functionality in the national minimum functionality. In light of this, we are unable to recommend its inclusion in the national minimum functionality.
Final Recommendation: We recommend that customer supply monitoring not be included in the national minimum functionality.
16.2.3. Standards and interoperability
As highlighted in the Phase 1 Overview Report communications is a key ingredient in smart metering systems. The diagram below shows the various communications links and interfaces in a generic smart metering system. It is noted that for some smart metering communications technologies there are no data concentrators required – for example point to point GPRS. In this case the Wide Area Network (WAN) extends from the MDA back-end systems through to the meter. When data concentrators are used the WAN is from the data concentrator to the MDA back-end systems. The local area network (LAN) connects between the data concentrator and the meter. Figure 16.3 below shows a schematic of this system.
Figure 16.3 Smart metering system communications chain
MDA backend
systems
Point-to-point(to
concentrator)comms
To metercomms
CommsModule
Home areanetwork(HAN)
In-homeDevices
HAN LAN WAN
123
Meter DataConcentrator
Interface
MSATSB2B
45
At either end of the smart metering system communications chain the communications links (and interfaces) are standardised:
1. The interface to MSATS/B2B systems is an open standard – aseXML; and
5. Assuming that functionality number 16 is adopted, the home area network (HAN) that connects the meter to in home devices could be an open standard, such as Zigbee.
For many smart metering systems the WAN (no. 2 in Figure 16.3) is partially standardised as TCP/IP and is typically used for the lower layers of the protocol. However in many smart metering systems the application layer for the WAN is proprietary.
The issue concerning interoperability then pertains to the LAN (no. 3 in Figure 16.3) the interface shown as No. 4 in the above figure, and the application layer for 2. It is noted that

Consultation Report - Cost Benefit Analysis of Smart Metering and DLC
Minimum National Functionality
NERA Economic Consulting 181
the meter and communications module at a customer’s premises are often combined into one unit, hence the interface may be within that combined unit and may not be externally accessible.
In relation to this there are three options for the protocols and interfaces for links 2, 3 and 4 above:
allowing the use of vendors proprietary protocols;
mandating the use of an existing international open protocol; or
mandating the development and use of a new Australian open protocol.
The approach adopted has the potential to affect competition in the provision of meters and other components of the smart metering system and thereby affect the costs of meters and those other components. In addition, standards and interoperability impacts on the feasibility of competition in meter data management, as a lack of interoperability requires MDAs to negotiate arrangements with proprietary meter providers for the provision of data management services. Proprietary protocols may also limit the range of vendors of smart metering system components because the purchaser may be locked into only using the components provided by one vendor. Competition is therefore potentially restricted both in the MDA market and the meter provider market.
The implications for the costs of the smart metering rollout are not clear. Whilst competition for the market should lead to the costs of the initial rollout being efficient, the lack of interoperability may affect the timing of these costs as providers discount meters as part of the rollout to gain a monopoly status for the provision of subsequent components in later years. Whether this results in the meter costs being inefficient is open to some conjecture.
Open protocols and interfaces, in contrast, allow all manufacturers to provide smart metering systems components to the same standards. Some smart metering systems components may become interchangeable, creating an environment for competition for the supply of those components and also facilitates competition for MDA services.
There are two main open international communications protocol standards that are applicable to smart metering. These are ANSI c12.22 in North America and DLMS-COSEM in Europe. We understand that these protocols may not be entirely suitable for direct application to a smart meter rollout in Australia due to not supporting all the functionalities that may be adopted.
ANSI c12.22.
ANSI c12.22 defines a meter-to-communications interface (interface 4 in the above figure) and an application layer protocol. It requires that meters use ANSI c12.19 data tables and it provides an application layer to read or write data to those tables. ANSI c12.22 is not a standard yet but ANSI has advised Impaq Consulting that it is likely to be released in the next few months. It is noted that this standard does not attempt to standardise all layers of a protocol used for the LAN or WAN. Hence this does not provide a means for interchangeability of smart metering hardware. It does however allow for the commands and instructions to be interpreted by complying smart metering systems in the same way.

Consultation Report - Cost Benefit Analysis of Smart Metering and DLC
Minimum National Functionality
NERA Economic Consulting 182
DLMS-COSEM
DLMS-COSEM, or Device Language Messaging Specification (DLMS) – Companion Standard for Electricity Metering (COSEM), is specified in the IEC 62056 & 61334 series of standards. DLMS-COSEM specifies an application layer and interface requirements.
In addition to concerns regarding the feasibility of adopting these existing open protocols to a smart meter rollout in Australia, they may not increase potential competition in the provision of meters and meter data management system. This is because if ANSI c12.22 was adopted, then European metering manufacturers may not be prepared to convert their products to meet this standard for supply in Australia. Similarly if DLMS-COSEM were adopted in Australia, then North American manufacturers might not be prepared to convert their products for supply in Australia. In any event, both of these protocols are still maturing in the European and North American markets and there are only limited meters that currently support these protocols. These protocols are however, rapidly maturing driven in part by large contracts for smart meters. It seems therefore that choosing one or the other may limit competition in the supply of smart metering systems for Australia at this time. As NEMMCO highlights the opposite may be true as aligning standards might also improve competition in meter provision.257 The effect of standards on meter competition may not therefore be clear cut.
An alternative to adopting an existing protocol would be to develop a uniquely Australian protocol. This could be based upon an existing protocol with modifications to accommodate the needs of a smart meter rollout in Australia. An Australian protocol standard would require all smart metering systems vendors to convert their products to the Australian standard. Given the size of the Australian market relative to Europe and North America, the costs of adopting the standard may outweigh the benefits from competing in the Australian market. This may reduce the number of possible competitors for meter provision in Australia. In addition, developing an Australian open protocol standard would likely take some time, thereby delaying the rollout with its associated benefits.
A further alternative approach to those discussed above would be to adopt an existing proprietary protocol and use that as the basis of an Australian standard. This approach has the advantage of avoiding the costs associated with developing a protocol from scratch but will still require most metering manufacturers to convert existing protocols to a new standard.
Finally, as noted above, rather than adopt an existing open protocol or develop a new Australian standard, it may be possible to use contractual approaches to require a proprietary smart metering systems vendor to provide genuine second sources of components of the system (eg, meters) as a condition of the procurement contract for a proprietary smart metering system. In some overseas jurisdictions this approach appears to have been successfully applied for smart meter rollouts. This might facilitate sufficient competition for meter provision to resolve the concerns with monopoly power of the proprietary smart metering systems provider.
257 Page 4, NEMMCO, (2007), Submission to the Cost Benefit Analysis of Smart Metering and Direct Load Control, Phase
1.

Consultation Report - Cost Benefit Analysis of Smart Metering and DLC
Minimum National Functionality
NERA Economic Consulting 183
In Phase 1 we invited views as to the appropriateness, advantages and disadvantages of the various options outlined above. In general there was widespread support for the need for interoperability as part of the smart metering rollout.258 NEMMCO in particular suggested that:259
Rather than diminish the focus on data communication standards, it would be more appropriate to note the complexity of the issue and identify the analysis required before a decision can be made about infrastructure that is key to the long-term interests of the industry and consumers. Advice from technical experts who have a detailed understanding of communication systems and standards is required before a conclusion can be drawn about the application of metering data communication standards in Australia. A possible source of advice is the work in Europe and the USA. Analysis of that work by local data communications experts with the assistance of experts from those development projects, may be appropriate.
In our view, the potential benefits from further pursuing interoperability may outweigh the likely costs. These benefits result from the associated competition for meter component provision in subsequent years such that no single meter provider is able to inappropriately exert monopoly power in the provision of subsequent replacement meters. In our view, it is critical that the party responsible for the smart metering rollout is faced with competition both for the supply of meters as part of the initial rollout and when smart meters will need to be replaced in the future. Back-end IT and communications systems therefore must be initially designed with interoperability in mind.
Having considered the options outlined above, we believe that:
it would not be appropriate to simply adopt an existing open standard, as outlined above. This is because it would limit the number of metering manufacturers with access to the Australian market, thereby reducing competition in meter provision;
further consideration should be given to the development within the Australian market of interoperability of meters with communications systems. In the first instance, metering manufacturers should only be entitled to participate in the provision of meters for the smart meter rollout if they can demonstrate interoperability with a range of communications infrastructures that may be used as part of the rollout. While this may have implications for the timing of the national rollout in our view its potential benefits may outweigh any costs associated with a delay in the rollout. In any event, it should not prevent the trial work that will be a necessary precursor to a full rollout in each jurisdiction, from occurring; and
an individual contractual approach may have merit in the context of a single jurisdiction, but this approach is not likely to be appropriate for a national rollout. The costs associated with the negotiation of contracts by each distributor with smart metering vendors to provide genuine second source options (eg for meters) are likely to be significant. However, this may be an appropriate interim measure as alternative
258 See submissions from Origin Energy, NEMMCO, Country Energy, Integral Energy, and Energex. 259 Page 4, NEMMCO, (2007), Submission to the Cost Benefit Analysis of Smart Metering and Direct Load Control, Phase
1.

Consultation Report - Cost Benefit Analysis of Smart Metering and DLC
Minimum National Functionality
NERA Economic Consulting 184
approaches to interoperability are developed. Contractual approaches could potentially be a condition of participation in the mandated national smart metering rollout.
Having examined the issue of standards and interoperability, we believe that it is an important issue that requires further consideration prior to a national mandated rollout of smart metering. There is however some uncertainty as to whether the lack of interoperability results in a material risk that the cost of subsequent meter provision will be inefficient. In our view there is merit in considering this issue further to ensure that the rollout does not subsequently lead to higher meter costs due to the foreclosure of competition in meter provision due to a lack of interoperability.
To progress this issue further, we recommend that the SMWG appoint a national expert group with representatives from each jurisdiction to:
determine the materiality of the risks of higher meter costs associated with a lack of interoperability in meter provision; and
if the risks are material, develop a least cost approach to managing the risks associated with a lack of interoperability.
Functionalities 23 and 24 examine the issue of interoperability for meters/devices at the application layer, and hardware component interoperability respectively. Functionality 23 can therefore be interpreted as mandating the use of an open application layer protocol for smart metering systems. Functionality 24 provides for the mandating of an open standards interface between the communications module and the meter.
Functionality 23: Interoperability for meters/devices at application layer
As part of our consideration of functionalities to be included in a meter we have been asked to consider the mandatory requirement that meters/devices be interoperable at the application layer, as part of the National Minimum Functionality.
As outlined above, there remains a number of outstanding questions that would need to be resolved, to determine how interoperability could be achieved. It is our view that these should be considered further, and that simply mandating interoperability at the application layer would not be sufficient.
For this reason we are recommending that a technical working group be established to develop and implement a work plan to ensure that the benefits resulting from interoperability (i.e. from purchasers not being locked-in to a single vendor for future meters), is achieved. This would allow purchasers to maintain competition in meter provision, irrespective of the communications system ultimate adopted.
Final recommendation: We recommend that functionality 23, the mandatory requirement that meters/devices be interoperable at the application layer, not be formally specified in the national minimum functionality specification. However, in light of the critical importance of interoperability for ensuring competition in meter supply in the future, we recommend that a technical working group be established to develop and implement a work plan to progress interoperability as a basis for a future smart metering rollout in Australia.

Consultation Report - Cost Benefit Analysis of Smart Metering and DLC
Minimum National Functionality
NERA Economic Consulting 185
Functionality 24: Hardware component interoperability
Interoperability of the hardware components of a smart metering system ensures that the system is not solely reliant on the hardware products of a single vendor. As EMCa highlight universally-accepted hardware interoperability standards are not yet available, however it:260
is becoming widely accepted that the modems and associated communications protocols of more than one vendor may be offered built into, and tested in, the meters of other vendors.
As part of Phase 1 we were asked to consider whether hardware component interoperability should be a mandatory requirement of the smart metering national minimum functionality. As for functionality 23, we believe that there is significant merit in ensuring that any smart metering infrastructure system does not lock-in to a single vendor, and maintains the scope for competition in hardware components in the future. The best approach to achieving this outcome will need to be developed as part of the implementation phase for a smart metering rollout. We do not believe that this is best achieved via a requirement within the minimum national meter functionality specification for all hardware components to be interoperable.
Final recommendation: We recommend that hardware component interoperability not be included as part of the national minimum functionality specification. However, it is critically important that a rollout of smart metering infrastructure does not lock-in to one vendor. How this risk is managed as part of a smart metering infrastructure rollout should be determined as part of the implementation phase of the rollout.
16.3. Final Recommended National Minimum Smart Meter Functionality
Having reviewed the estimates of costs and benefits developed as part of Phase 1, and considered the submissions received, we have developed a list of functions for inclusion in a minimum national meter specification. The final list of functions is provided in Table 16.8 below.
260 EMCa Workstream 1Transitional Costs Consultation Report (February 2008), section 15.3.3.

Consultation Report - Cost Benefit Analysis of Smart Metering and DLC
Minimum National Functionality
NERA Economic Consulting 186
Table 16.8 Final Functionalities Recommended for Inclusion in a Minimum National Meter
Specification
No. Functionality
Core functions
1 Half-hourly consumption measurement and recording
2 Remote reading
3 Local reading – hand-held device
4 Local reading – visual display on meter
5 Communication and data security
6 Tamper detection
7 Remote time clock synchronisation
8 &14 Load management at meters through a dedicated controlled circuit
Energy measurement
9 Daily remote reading
10 Power factor measurement (three phase meters only)
11 Import/export metering
Switching and load management
12 Remote connect/disconnect
13 Supply capacity control
Facilitation of Customer Interaction
16 Interface with a Home Area Network
Supply and service monitoring
19 Quality of supply and other event recording
20 Meter loss of supply and detection
Upgradeability and configurability
25 Remote configuration
26 Remote software upgrades
29 Plug and play device commissioning
The final recommended list of functions for inclusion in the minimum national meter functionality specification is the same as that developed in Phase 1, plus the inclusion of an interface with a HAN (functionality 16). In order to maximise the potential benefits of the inclusion of the interface with a HAN we recommend that:
further work be undertaken to identify the type and sources of information that best promote energy efficiency and the introduction of TOU and critical peak pricing;
widespread marketing to encourage energy efficiency is undertaken, to improve DLC participation and conservation benefits in association with a smart metering rollout;

Consultation Report - Cost Benefit Analysis of Smart Metering and DLC
Minimum National Functionality
NERA Economic Consulting 187
further trials are undertaken to identify how to improve participation rates in DLC programs, and encourage the use of IHDs to lower household energy consumption; and
any regulatory barriers to the use of DLC by network businesses be examined.
In relation to standards and interoperability we recommend that the MCE appoint a national expert group with representatives from each jurisdiction to develop and progress an interoperability accreditation framework for the assessment of metering manufacturers. This would require metering manufacturers to satisfy interoperability requirements as a pre-requirement to participation in the provision of meters for the national smart metering rollout.

Consultation Report - Cost Benefit Analysis of Smart Metering and DLC
Assessment of Rollout Scenarios Against the MCE Required Objectives
NERA Economic Consulting 188
17. Assessment of Rollout Scenarios Against the MCE Required Objectives
17.1. Objectives Applying to the Rollout
The Terms of Reference for the cost benefit analysis set out a list of objectives against which the different scenarios for the rollout of smart meters must be assessed:261
1. Reducing demand for peak power, with consequential infrastructure savings (eg network augmentation and generation);
2. Driving efficiency and innovation in electricity business operations, including improving price signals for efficient investment and contracting;
3. Promoting the long-term interest of electricity consumers with regard to the price, quality, security and reliability of electricity;
4. Promoting competition in electricity retail markets;
5. Enabling consumers (including residential, business, low- and high-volume users) to make informed choices and better manage their energy use and greenhouse gas emissions;
6. Manage distributional price impacts for vulnerable customers;
7. Promoting energy efficiency and greenhouse benefits; and
8. Providing a potential platform for other demand side response measures and avoiding discrimination against technologies, including alternative energy technologies.
17.2. Assessment
Table 17.1 presents NERA’s assessment of the relative ranking of each of the rollout scenarios in relation to the objectives set out by the MCE. This assessment has been carried out on a national basis. The rankings for some objectives may differ for particular jurisdictions and we note these in the discussion below.
For each objective we have ranked how well each of the scenarios meets that objective, compared to the alternative scenarios. A ‘1’ indicates that that scenario meets the objective better than all other scenarios. A ‘2’ indicates that the scenario is ranked second, and so on. Where a scenario does not have an impact on meeting a particular objective this is indicated in the table by a dash (‘-‘).
We note at the outset that for many of the objectives each of the smart meter rollout scenarios (ie, scenarios 1, 2 and 4) are ranked equally. This is consistent with the findings of the analysis that the benefits are not expected to be materially different between the scenarios.
261 TOR attachment D.

Consultation Report - Cost Benefit Analysis of Smart Metering and DLC
Assessment of Rollout Scenarios Against the MCE Required Objectives
NERA Economic Consulting 189
The table also indicates how well overall each of the objectives is achieved by each of the rollout scenarios. The dark shaded cells in the table indicate where the particular rollout scenario is expected to have a significant impact in relation to the corresponding objective. The lighted shaded cells indicate where the particular rollout scenario is expected to have only a moderate impact in relation to the corresponding objective. Finally, where cells are not shaded a scenario has either has no impact or a negligible impact on meeting a particular objective.
Table 17.1 Assessment of Rollout Scenarios Against MCE Required Objectives: Relative Ranking of Scenarios (Excluding Functionalities 15 and 16)
MCE Objectives
Scenario 1 Distributor-led
smart meter rollout
Scenario 2 Retailer-led smart meter
rollout
Scenario 3 Non smart meter DLC
rollout
Scenario 4 Retailer-led smart meter rollout with
centralised communications
Reducing peak demand1 2 2 1 2
Efficiency and innovation in electricity business operations 1 2 - 2
Promoting the long-term interests of electricity consumers 1 2 3 2
Promoting retail competition 1 1 - 1
Enabling consumers to better manage energy use and greenhouse gas emissions
1 1 - 1
Managing distributional price impacts for vulnerable customers 2 2 1 2
Promoting energy efficiency and greenhouse benefits 1 1 2 1
Providing a platform for other demand side response measures and avoiding discrimination against technologies
1 1 2 1
1 Note that the smart meter scenarios would be ranked ahead of the non-smart meter DLC rollout where an interface with a HAN is included in the smart meter specification.
In relation to the ability of the scenarios to achieve reductions in peak demand we note that a DLC rollout (Scenario 3) is expected to result in greater reductions in peak demand than a smart meter rollout, where smart meters do not also incorporate a DLC functionality (ie, functionalities 15 or 16). This is because the extent of peak demand reduction that is estimated to be achievable via DLC is greater than that estimated to be achievable via CPP and TOU tariffs. However we note that this result is partly driven by the higher assumed uptake assumption for DLC under scenario 3 than for CPP under the smart metering scenarios.

Consultation Report - Cost Benefit Analysis of Smart Metering and DLC
Assessment of Rollout Scenarios Against the MCE Required Objectives
NERA Economic Consulting 190
Whilst we think that a higher uptake assumption is reasonable, given that customers may be more attracted to DLC as a product than to CPP, and due to the absence of alternative tariffs under scenario 3, we note that there is necessarily considerable uncertainty regarding uptake rates under all scenarios. There is no difference expected in the extent of peak demand reduction between the alternative smart meter rollout scenarios and hence we have given each of these scenarios an equal ranking.
Where smart meters do incorporate a DLC functionality (ie, functionality 15 or 16) then NERA has estimated that the smart meter scenarios would result in greater reductions in peak demand than the non-smart meter DLC scenario, as a result of the combined impact of DLC and CPP under the smart meter scenarios. In this case the smart meter scenarios would be ranked ahead of the DLC rollout scenario. Again, there is no difference expected in the extent of peak demand reduction between the alternative smart meter rollout scenarios.
We note that the extent to which reductions in demand are expected to lead to network infrastructure savings depends on the particular jurisdiction. In Tasmania and the Australian Capital Territory there is currently sufficient network capacity and therefore there are not expected to be benefits from network deferral. 262 In the Northern Territory load is relatively flat and therefore any reductions in peak demand are also not expected to lead to significant scope for network deferral.
The second MCE objective is driving efficiency and innovation in electricity business operations, including improving price signals for efficient investment and contracting.
The results of CRA’s analysis of potential distribution business efficiencies shows that these are greatest for Scenario 1 (the distributor-led rollout) and are likely to be lower in Scenarios 2 and 4. KPMG’s analysis of potential retailer efficiency benefits indicates that these are unlikely to vary between scenarios and that the scope for retailers to offer more innovative products is dependent on the functionality of the smart meter rather than the party undertaking the rollout. There is no impact from a non-smart meter DLC rollout on business efficiency.
The introduction of time-varying prices for electricity (i.e. TOU tariffs and CPP) provides a better signal as to the relative value of electricity at different times of the day. As a result such tariffs provide improved price signals for investment. The analysis undertaken by KPMG indicates that TOU tariffs and CPP are equally likely to be introduced under any of the smart meter rollout scenarios, i.e. the choice of rollout strategy does not affect the likelihood of retailers choosing to market such time-varying products. A non-smart meter DLC rollout strategy does not support the introduction of time differentiated tariffs for electricity and has no impact on this objective.
As a result of the above we have ranked Scenario 1 the highest in relation to the achievement of business efficiencies and improved price signals for efficiency investment, followed by Scenarios 2 and 4 which are ranked equally. The non smart meter DLC rollout (Scenario 3) does not have any impact on business efficiencies nor does it support the introduction of time
262 See individual chapters for each jurisdiction in this report for a fuller discussion.
Consultation Report - Cost Benefit Analysis of Smart Metering and DLC
Assessment of Rollout Scenarios Against the MCE Required Objectives
NERA Economic Consulting 191
differentiated tariffs for electricity. As a result it is ranked as having no impact on the objective.
The results of the cost benefit analysis, and in particular CRA’s assessment of the potential business efficiencies for distributors, indicates that a smart meter rollout may be expected to have a significant impact on distributors’ business efficiencies. As a result we consider that the MCE’s objective of driving efficiency in business operations is likely to be significantly achieved by a smart meter rollout. This result holds across all of the jurisdictions.
The third objective is promoting the long-term interest of electricity consumers with regard to the price, quality, security and reliability of electricity. The greater is the expected level of business efficiencies that are achieved as a result of the smart meter rollout the lower will be the expected prices that consumers will face in future, as these efficiency benefits can be expected to be passed through in prices as a result of both regulation (for network businesses and retail businesses in jurisdictions where there is no retail competition) and competitive pressures (for retail businesses in jurisdictions where there is retail competition). We note that the interpretation of the long term interest of consumers being related to improvements in efficiency is consistent with that applied by the AEMC in assessing Rule change proposals. As a result the ranking of scenarios in relation to this objective is equal to the ranking under the previous objective, which was the driving of business efficiency gains.
We also note that the wholesale market modelling conducted by CRA indicates that the smart metering rollout scenarios are expected to result in both a marginally lower average spot price and a lower super peak price263 than Scenario 3. This is true in the low demand response case for both the base case and where the smart metering specification incorporates a DLC capability. Under the high demand response assumptions it is also true, although the expected difference in wholesale prices between scenarios is lower. There is no difference between the spot price impacts between the three smart meter functionalities.
As a caveat we note that ensuring that a smart meter rollout results in the promotion of the long-term interest of all classes of electricity consumers has implications for some of the current customer protection provisions in each jurisdiction. This is discussed further in our conclusions in section 18.
Consistent with the analysis of the previous objective, the extent of distribution business efficiencies estimated by CRA to result from a smart meter rollout, and the consequent flow-through of these benefits to customers as a result of competitive forces and (where these are absent) regulation, means that the smart meter rollout scenarios may be expected to have a significant impact in terms of promoting the long term interests of electricity consumers. Again we consider that this result holds across jurisdictions. However we note that the means by which retail business efficiencies are passed through to customers will vary depending on whether there is effective retail competition in a jurisdiction (eg, Victoria) or whether retail competition is still developing (eg, Queensland) or where retail prices remain fully regulated (eg, Western Australia). The achievement of this objective is also linked to the fourth
263 CRA has calculated the ‘super peak price’ on the basis of the average price over the top 480 hours (5 per cent) of
demand in a year.

Consultation Report - Cost Benefit Analysis of Smart Metering and DLC
Assessment of Rollout Scenarios Against the MCE Required Objectives
NERA Economic Consulting 192
objective (impact on retail competition), as an increase in retail competition will result in retail business efficiencies being passed through to customers more effectively.
The fourth MCE objective is promoting competition in electricity retail markets. A means by which scenarios may differ in relation to the impact on the development of retail competition would be differences in the ability of retailers to offer innovative products and to differentiate themselves from their competitors, as a result of a smart meter rollout. For example, retailers may choose to offer new tariff offerings, such as TOU tariffs and CPP or may provide IHDs and customised content (where functionality 16 is included as part of a smart meter rollout). However, as discussed above, KPMG has concluded that the scope for retailers to offer more innovative products is dependent on the functionality of the smart meter rather than the party undertaking the rollout.264
Under Scenarios 2 and 4 retailers would act as meter providers and would own the meters. This gives rise to two alternative views as to the impact on retail competition. The first is that ownership of the meter by a retailer would act as a barrier to alternative retailers, as the meter would need to be changed where a customer wished to change retailer. Against this is a view that, in practice, retailers would come to a commercial agreement that would allow customers to change retailers without needing to change the meter, although in this case we note that the price at which an incumbent retailer may be willing to ‘sell’ the meter may be related to the new installation cost, and may therefore continue to act as a barrier to entry in terms of the costs faced by a competitive retailer. Under this alternate view, retailers would in fact have a greater sphere over which to compete, as under Scenarios 2 and 4 they would be competing over metering as well as the other aspects of retailing. This both increases the range of costs over which they compete and would also potentially allow retailers to choose to differentiate themselves in relation to the types of meters offered. An additional aspect of the expected impact on retail competition between scenarios therefore also relates to the potential for competition in metering. Whether to facilitate competition in metering is a separate policy issue which can be expected to have implications for the smart meter rollout.
Given the above, we have ranked all of the smart metering scenarios equally in relation to the impact on retail competition. The non smart meter DLC scenario is not expected to have an impact on retail competition. We note that this objective is not relevant for those jurisdictions that do not as yet have retail competition (Western Australia, Northern Territory and Tasmania). Overall we consider that a smart meter rollout would only have a moderate impact on the development of retail competition.
The fifth and seventh objectives relate to energy efficiency and greenhouse gas benefits. In relation to which scenarios better enable customers to make informed choices and better manage their energy use and greenhouse gas emissions. Under the smart meter rollout scenarios it is likely that this objective would be facilitated where retailers introduced TOU tariffs and CPP. Under these scenarios retailers may choose to provide customers with more information in relation to their energy usage, such as the breakdown in their usage per day and a comparison with past usage. This information could be provided via customers’ bills or, where the smart metering functionality includes an interface with a HAN (functionality 16) via an IHD. To the extent that retailers do not decide to provide such additional usage 264 KPMG, Workstream 3 Retail Impacts Consultation Report (February 2008), section 5.

Consultation Report - Cost Benefit Analysis of Smart Metering and DLC
Assessment of Rollout Scenarios Against the MCE Required Objectives
NERA Economic Consulting 193
information to customers, it would be possible to design policies requiring its provision. Given KPMG’s assessment that retailers are equally likely to offer TOU tariffs and CPP, or to utilise an interface with a HAN in order to offer IHDs, we have ranked Scenarios 1, 2 and 4 equally in relation to this objective. Under the non-smart meter DLC rollout the absence of interval meter data means that time differentiated tariffs and a breakdown of usage information could not be provided. As a result Scenario 3 does not have an impact in relation to this objective.
Overall we consider that the provision of TOU tariffs and CPP is likely to have a significant impact on the ability of consumers to make informed choices and better manage their energy use. Whether this also translates into better management by consumers of their greenhouse gas emissions would depend on whether retailers provide information to customers on their level of emissions (eg, via an IHD) or offer tariffs that are targeted at reducing greenhouse gas emissions.
In relation to the actual promotion of energy efficiency and greenhouse benefits we note that the reduction in greenhouse gas emissions has been estimated by CRA to be the greatest under the smart metering scenarios compared to the DLC only scenario. As a result we have ranked Scenarios 1, 2 and 4 above Scenario 3 for this objective. As discussed in Box 6.1 the impact of the introduction of TOU tariffs or CPP under a smart meter rollout on the level of greenhouse gas emissions is highly dependent on the marginal generation plant affected by the resulting changes in demand and the extent of demand that is expected to be shifted versus overall demand reduction. Based on the demand elasticities adopted by NERA, in the base demand response case most of the impact of TOU tariffs and CPP is a shift in demand from peak to off-peak periods (rather than a reduction in overall demand). CRA’s market analysis indicates that based on these demand change the overall level of greenhouse gas emissions is expected to fall.
In relation to energy efficiency, for the smart meter scenarios there is an ‘upside’ in relation to possible additional potential for energy conservation, triggered by greater customer awareness triggered by facing time varying tariffs. Where smart meters also incorporate an interface with a HAN (functionality 16) a further conservation effect may also be engendered via the provision of an IHD.265 This potential is not available in Scenario 3.
Overall, CRA has estimated only modest reductions in greenhouse gas emissions as a result of a rollout of smart meters (or a DLC alternative), based on the small reduction in overall demand estimated by NERA.266 As a result we consider that a rollout of smart meters (or a DLC alternative) will only have a moderate impact on the MCE objective in relation to promoting energy efficiency and greenhouse benefits.
The sixth MCE objective relates to managing the distributional price impacts for vulnerable customers. Distributional price impacts are likely to arise where consumers face time differentiated tariffs, as a result of a smart meter rollout. These impacts have been
265 We note that whether IHDs result in a greater responsiveness of customer demand is subject to a high degree of
uncertainty, as discussed in section 16.2 and NERA, Workstream 4 Consumer Impacts Consultation Report (February 2008).
266 CRA Workstream 5 Market Impact Consultation Report (February 2008), Section 4.2.

Consultation Report - Cost Benefit Analysis of Smart Metering and DLC
Assessment of Rollout Scenarios Against the MCE Required Objectives
NERA Economic Consulting 194
discussed in NERA’s Workstream 4 report (Consumer Impact), together with recommendations for managing these impacts in relation to vulnerable consumers.
Our consumer impact analysis has been undertaken assuming that the adoption of TOU tariffs and CPP by a consumer is voluntary. KPMG has therefore developed assumptions as to the likely take-up rates of these tariff products in each jurisdiction. For those jurisdictions where there is currently no retail competition for small end-use customers the new tariff products would need to be compulsorily imposed on all customers. In this circumstance, the implications for vulnerable customers would differ considerably from those considered in this cost benefit analysis.
We recommend that any rollout of smart meters be accompanied by measures to address distributional price impacts for vulnerable customers (as discussed in our conclusions, section 18.5). The same concerns do not arise with a DLC rollout as consumers do not face different prices as a result of a DLC rollout. As a result we have ranked Scenario 3 ahead of Scenarios 1, 2 and 4 in relation to this objective.
We note that this objective highlights the importance of ensuring that adequate consumer protection provisions are in place if a decision is taken to undertake a national smart meter rollout. Without these consumer protection provisions a smart meter rollout would lessen rather than improve distributional price impacts.
The final MCE objective relates to the ability of the alternative rollout scenarios to provide a platform for other demand side responses and to avoid discrimination against alternative energy technologies. A smart metering rollout would provide a platform for DLC programs either where the meters include an interface to a HAN (ie, functionality 16) or alternatively via the installation of DLC devices that interface with the smart meter communications infrastructure (functionality 15; note that in this case there is no additional functionality incorporated into the smart meter itself and therefore this functionality could be rolled out at any point in the future). In the case of Scenario 3 the ability to provide a platform for DLC is a feature of the rollout itself.
A smart metering rollout can also reduce barriers to PV generation and other micro-generation as a result of the inclusion of the import/export functionality which removes the cost to customers of installing additional metering equipment where they wish to install a PV cell or other micro-generator. However we note that the cost of installing an additional meter is small relative to the cost of the PV cell itself, so that the extent to which this currently acts as a barrier to the adoption of this technology is likely to be limited.
We have ranked the smart meter rollout scenarios above the DLC scenario in relation to this objective, as a result of the import/export functionality of smart meters. However, as noted above this difference may in reality be relatively minor.
We note that an important feature of the rollout in all scenarios would be ensuring that the regulatory environment provides incentives for and does not inhibit the adoption by distributors and retailers of demand side responses, where these are efficient alternatives. This is discussed further as part of our conclusions in section 18.

Consultation Report - Cost Benefit Analysis of Smart Metering and DLC
Conclusions and Recommendations
NERA Economic Consulting 195
18. Conclusions and Recommendations
At its meeting in April 2007, the COAG committed to a national mandated rollout of smart meters, where the benefits outweighed the costs, and referred the assessment of costs and benefits to the MCE.267 This report presents the results of a detailed study into the costs and benefits of a national mandatory rollout of smart metering to inform the MCE as to where benefits are expected to outweigh the costs.
The purpose of this study was to undertake a comprehensive analysis of the costs and benefits of a smart metering rollout and determine how the costs and benefits vary by jurisdiction, between urban, rural and remote areas, and between different stakeholders – retailers, distributors, NEM participants and consumers. In addition, the implications for greenhouse gas emissions were to be considered.
The depth and breadth of analysis required has made this study a challenging task.
In this chapter we outline our conclusions following the analysis. Specifically we discuss the risks and uncertainties, conclusions in relation to the jurisdictional analyses, conclusions on scenarios, the potential for additional benefits that have not been quantified in this study, conclusions on consumer impacts and implications for greenhouse gas emissions. Finally we outline considerations in relation to transitional arrangements and set out what we believe to be the next steps following this study.
18.1. Risks and Uncertainties Arising from the Results
We believe that the results presented in this study represent the best currently available information, drawing as it does upon data provided by network and retail businesses and the results of trials of smart metering and direct load control, both in Australia and overseas.
That said, however, there are considerable limitations associated with the information used that bring into question the conclusions that can be drawn from the quantitative results presented. Specifically:
no smart meter currently exists that meets the functional specification that we have been asked to examine, meaning that the actual costs of these meters could vary considerably from those used in the analysis;
we have only been able to draw a limited extent upon the preliminary cost work being undertaken as part of the Victorian rollout of advanced metering infrastructure, which would be expected to better inform the costs associated with back-end infrastructure;
the estimated network business efficiency benefits rely on assumptions surrounding the extent to which activity based costing for special readings and current charges for manual disconnections, when considered together with the transitional cost estimates, reflect the underlying costs that would be avoided with the provision of these services via smart metering; and
267 COAG (2007), Communiqué, 13 April.

Consultation Report - Cost Benefit Analysis of Smart Metering and DLC
Conclusions and Recommendations
NERA Economic Consulting 196
there is considerable uncertainty as to the likely benefits arising from network outage management.
In relation to the second of these uncertainties, EMCa notes that it has taken account of information provided by Victorian distributors, to the extent possible given its limitations in scope and comparability.268 Nevertheless EMCa notes that it appears that the aggregate costs as assessed by the Victorian distributors that provided information to EMCa are ‘somewhat higher’ than EMCa’s assessment.269 We understand that this difference in costs is greater than 5 per cent. As noted in section 2.2, a 5 per cent increase in costs (all other things remaining equal) would result in an overall negative net benefit in the lower bound for a smart meter rollout under Scenario 1.270
EMCa comments that there is a difference between the balance of probability on which it has formed judgements for the purposes of the cost benefit analysis and the level of certainty that is reasonably sought by a commercial entity seeking regulatory cost recovery for a large investment. At this stage there are uncertainties, particularly in regard to communications technologies suitable for rural areas, and these will be best resolved through implementation of some kind (whether by further trialling or through a prototype-scale rollout). EMCa is comfortable with the assumptions that it has taken for the purposes of this cost benefit analysis.
18.2. Conclusions on the Jurisdictional Analysis
As noted above, EMCa highlights that there remains uncertainties in relation to the overall costs associated with a smart meter rollout but that it is comfortable with the assumptions that it has taken for the purposes of this cost benefit analysis.271 The quantitative results presented in this Overview Report suggest that for many jurisdictions there may be net positive benefits resulting from a mandatory rollout of smart metering.
For the following jurisdictions, a smart meter rollout would have a positive net benefit, on the basis of avoided metering costs and distribution business efficiencies alone: Queensland, New South Wales and Western Australia. For these jurisdictions the net benefit of a smart meter rollout remains positive even if costs are at the upper end of the estimated range and business efficiency benefits at the lower end of the range. Any demand response benefits arising in these jurisdictions would represent additional benefits.
In Western Australia the need to replace approximately a third of the current meter stock due to a fault is a key component of the positive net benefit. Substantial distribution business efficiencies have also been estimated for Western Australia.
For Victoria and South Australia, whether a rollout of smart meters results in a positive net benefit is crucially dependent on being able to achieve a cost towards the low end of the 268 EMCa Workstream 1Transitional Costs Consultation Report (February 2008), section 14.6 269 EMCa Workstream 1Transitional Costs Consultation Report (February 2008), section 14.6.1 270 This result holds even where the incremental net benefit associated with the provision of an interface to the HAN is also
included. 271 EMCa Workstream 1Transitional Costs Consultation Report (February 2008), section 14.6.2
Consultation Report - Cost Benefit Analysis of Smart Metering and DLC
Conclusions and Recommendations
NERA Economic Consulting 197
range estimated and business efficiency benefits at the upper end of the range estimated. In these jurisdictions demand response benefits would need to be more aggressively pursued (through the introduction of TOU tariffs and/or CPP, or direct load control programs) in order to make-up any shortfall between benefits and costs on business efficiency grounds only.
Given the uncertainties associated with the likely demand response, we would recommend that for South Australia a decision about a smart metering rollout be further informed through undertaking specific jurisdictional trials of CPP/TOU and DLC. This will assist with informing whether the demand response benefits we have estimated are realistic in the individual jurisdictional circumstances. In the case of Victoria, which is committed to a smart meter rollout, we would suggest that similar trials are undertaken in order to maximise the potential scope for demand-side response benefits.
For some jurisdictions the business efficiency benefits are insufficient to justify a smart metering rollout. Where these jurisdictions are seeking to manage maximum demand growth there may be merit in considering a non-smart metering DLC approach, particularly given how quickly it can be implemented, and the firmness of the associated load control. In this instance, we would also recommend that a jurisdiction conduct specific trials to determine the likely participation rates associated with implementing a non-smart metering DLC program. We also note that reducing peak demand (with consequential infrastructure savings) is only one of the MCE objectives for a rollout, and that a non smart meter DLC rollout is ranked below smart meter alternatives in relation to other objectives (see section 17).
For the Australian Capital Territory, Tasmania and the Northern Territory our results indicate again that the justification for a smart meter rollout is highly dependent on whether the bottom range of the cost estimates can be achieved, together with the upper end of the business efficiency benefits. However in these jurisdictions we do not consider that there are likely to be significant demand response benefits. As a result there is not the same scope for potential ‘upside’ through demand response as there is in Victoria and South Australia.
These results suggest that a national mandatory smart metering rollout may not be justified in all jurisdictions. We have therefore considered the implications for smart meters being rollout in some but not all jurisdictions. This is particularly relevant for jurisdictions operating in the NEM (eg, Tasmania and the Australian Capital Territory).
The main implications of not rolling out smart metering across the NEM are:
there will still be a requirement to settle the wholesale market on the basis of net system load profiles, rather than actual information; and
retailers operating across jurisdictions may require different business processes for managing customer switching and services provided through smart metering, such as special reads. This is likely to increase the costs associated with managing a smart metering rollout.
18.3. Conclusions on the Smart Metering Scenarios
An important part of our analysis was considering the costs and benefits of smart meters with respect to three different approaches of rolling them out. These were a distributor-led (Scenario 1), retailer-led (Scenario 2) and centralised communications (Scenario 4).

Consultation Report - Cost Benefit Analysis of Smart Metering and DLC
Conclusions and Recommendations
NERA Economic Consulting 198
The results indicate that in general the costs and benefits vary between the scenarios according to:
differences in the underlying infrastructure requirements, which increase the overall back-end systems costs in the case of Scenarios 2 and 4 compared with Scenario 1;
the assumed communications infrastructure assumptions developed by EMCa, which increases the overall communications costs (including data handling costs) for Scenarios 2 and 4; and
a reduction in the distributor business efficiency benefits associated with the outage detection functionality of smart meters for Scenarios 2 and 4.
As noted in section 2.5, the rollout strategy adopted may differ from any of the four strategies considered in this study and is ultimately the decision of the MCE as it considers the results of our study.
18.3.1. Requirement for a mandate
The justification for a mandatory rollout of smart meters rather than allowing smart meters to be introduced as a business initiative is that the costs and benefits of a rollout will accrue over a number of stakeholders. The inability of any one stakeholder to capture all of the benefits may therefore mean that there is no positive business case for any individual stakeholder to undertake a smart meter rollout. Mandating a rollout addresses this issue.
The results of the stakeholder analysis in section 15.2 highlights that the size of the business efficiency benefits estimated by CRA compared with the costs of a smart meter rollout estimated by EMCa are such that distributors would realise a net benefit considered as an individual stakeholder group under a distributor-led rollout of smart meters (i.e. Scenario 1) in their own right. That is, the above rationale for mandating a rollout on the expectation of the split of benefits between stakeholder groups does not hold on the basis of the estimates presented in this report.
However, we note that this result does not obviate the need for a mandate in the case of a distribution-led rollout. Although there appears to be a strong positive business case for the distribution businesses to rollout smart meters this is predicated on the distributors retaining the efficiency benefits that are achieved as a result of a smart meter rollout. In practice this will not be the case as the distribution businesses are subject to price regulation and regulators will seek to pass-through to consumers the benefits of the efficiency gains achieved by the distribution businesses in the form of lower network charges going forward. This results in a disconnect between the costs that the distributor would face in rolling out smart meters (i.e. the transitional costs) and the resulting business efficiency benefits that the distributor could be expected to retain, which will only reflect a proportion of the benefits estimated by CRA as the regulator can be expected to pass those benefits through to consumers at the time of the next regulatory review. As a result it would still remain necessary to mandate a rollout of smart meters, as no one stakeholder group has a positive business case to undertake such a rollout as a commercial exercise.
The alternative to a mandate would be to modify the existing regulatory arrangements to address the underlying issue regarding incentives for distributors to undertake investments to

Consultation Report - Cost Benefit Analysis of Smart Metering and DLC
Conclusions and Recommendations
NERA Economic Consulting 199
reduce costs, where those investments have longer-term payback periods. However we note that changes to the regulatory framework intended to address this issue are likely to be complex and have wide-ranging implications.
In addition, we note that the cost benefit analysis presented in this report reflects only the ‘first round’ impact of costs and benefits. As discussed in section 3.5, in the longer term both the costs of the smart meter rollout (or DLC alternative), and many of the benefits, can be expected to flow through to consumers, regardless of the rollout scenario. This ‘second round impact’ can be expected to occur as a result of both competition (where present) and the regulatory price setting process. Specifically, tariffs in the longer term can be expected to reflect a passing through of the net costs and benefits of the rollout.
18.3.2. Incentives for delivering smart meters at least cost
In our view, the relevant question is how to best ensure that a smart metering rollout is achieved at least cost, and delivers the business efficiency benefits that have been assumed in our analysis.
It is therefore relevant to consider the incentives for least cost delivery within each of the scenarios. The distributor-led scenario relies on the economic regulatory framework to provide the incentives for least cost delivery of smart metering infrastructure. In the absence of alternatives this may be the best approach as it ensures that there is independent review of these costs through the regulatory process. There are also incentives inherent in the process for distributors to seek cost efficiencies even once the initial rollout costs have been approved by the regulator, since these efficiencies can be retained by the distributor during the regulatory period and may not be passed on in full to customers at the time of the next review (i,e,, where there is an efficiency carryover mechanism in place).272
The retailer-led scenario relies on competition between retailers to provide incentives for efficiency in the rollout. Critical to the effectiveness of this approach is therefore the presence of effective competition in the electricity retail market in each jurisdiction. For those jurisdictions that are yet to implement full retail competition, a retailer-led scenario would therefore not be possible. For the remaining jurisdictions, the AEMC is undertaking a review of the effectiveness of retail competition and has recently indicated that competition is effective in Victoria. The effectiveness of competition in other jurisdictions has not yet been assessed.
In the absence of competition providing the incentive for least cost delivery of the smart metering infrastructure under the retailer-led approach, the default is for retailers to have the costs included through regulated prices. This means that even under the retailer-led scenario, the incentive for least cost delivery is likely to be a regulatory review process.
Finally, under the centralised communications scenario the incentive for least cost delivery of the smart metering infrastructure is dependent on the institutional approach adopted to create the entity responsible for the centralised communications infrastructure. One possible 272 Although distributors may be permitted to keep a proportion of the gains in the following regulatory period (via an
‘efficiency carryover mechanism’), ultimately all efficiency gains can be expected to be passed through to consumers via the regulatory process.

Consultation Report - Cost Benefit Analysis of Smart Metering and DLC
Conclusions and Recommendations
NERA Economic Consulting 200
approach would be to put out to tender the provision of this infrastructure, which means that competition for this provision provides the incentive for least cost delivery. Alternatively, a new agency could be established, which conceivably would have charges determined through a regulatory process, similar to the distributor-led or retailer-led scenarios.
In light of each scenario being likely to require a regulatory process to provide incentives for least cost delivery of the smart metering infrastructure, for at least some jurisdictions (i.e. where these is no effective retail competition under Scenarios 2 and 4) or in some areas within a jurisdiction (i.e. rural/remote under Scenarios 2 and 4), it is relevant to consider whether there are alternatives to this approach. In our view, if there are viable alternative approaches then these should be considered because there is a limited information basis for a regulator to benchmark the efficient costs for rolling out a smart metering system, such that the risks associated with under- or over-estimating these costs are considerable.
One approach that we believe should be considered in greater depth is allowing competition for the right to provide smart metering infrastructure systems as part of a mandatory smart metering rollout. This could be achieved through the tendering out of franchises (providing exclusivity for a period of up to 15 years) for the delivery of smart metering services to distributors/retailers within a jurisdictional or distributor specific area. So long as there is a sufficient number of potential bidders for each franchise this would create competitive pressures to provide smart metering infrastructure at least cost and additionally ensure that the services provided met with distributor/retailer requirements as specified in the tender requirements.
A distinct advantage of this approach over the other rollout scenario options is that it removes the need for a regulator to review decisions surrounding technical infrastructure assumptions as the requirements could be specified in terms of capabilities and performance requirements. The detailed infrastructure assumptions would then be the responsibility of the tender participants as they sought to deliver the system capability requirements at least cost.
In many instances, such an approach would be expected to result in the local distributor being the most competitive provider. However, if there are alternative and more cost effective approaches, then this may not always be the case. Importantly, it provides the opportunity for the smart metering provider market to reveal whether there are innovative ways of providing the capabilities required from the smart metering system.
While there may be a number of advantages with the incentives associated with a franchising approach, it critically relies on competition for the supply of smart metering infrastructure. To the extent that competition does not arise (particularly in rural areas), this may not be an effective method of delivering smart metering infrastructure. There may also be technical or other system management problems resulting from the smart metering infrastructure being designed outside of the associated distributor. All of these issues would need to be considered before this, or any approach is adopted.
We therefore recommend that the MCE examine the incentives associated with alternative rollout approaches to ensure that the anticipated costs and benefits of the smart metering rollout are realised.

Consultation Report - Cost Benefit Analysis of Smart Metering and DLC
Conclusions and Recommendations
NERA Economic Consulting 201
In light of uncertainty as to the depth of the likely market for smart metering system providers, distributors should be required to provide a bid to deliver the infrastructure, which could then be benchmarked against other distributor bids, in the absence of direct competition to do the smart metering rollout in a particular area.
18.3.3. Incentives to ensure smart metering benefits are realised
In addition to the incentives for least cost delivery of the smart metering infrastructure it is also relevant to consider the incentives associated with the realisation of the associated benefits.
The extent of business efficiencies assumed (on average 16 to 21 per cent of current distribution operating costs) and their role in underpinning the justification for a smart meter rollout means that it will be critically important to ensure that there are incentives for businesses to deliver on these efficiencies.
Under an economic regulation incentive framework incentives are created for the achievement of business cost efficiencies through the retention of revenues in excess of that required to meet the costs of delivering services. This process would be expected to therefore drive businesses to realise the business cost savings that would result from the smart metering rollout. However, there are likely to be important implications in relation to the details of the regulatory framework, including the application of any efficiency carryover mechanisms in order to enhance incentives on distributors to realise the potential efficiencies associated with smart meters. In the absence of this, the regulator may consider the appropriateness of calculating the revenue requirements on the basis of its expectations as to the business cost savings that should have been obtained.
For those jurisdictions where smart metering is justified on the basis of the demand response benefits, however, it is relevant to consider the underlying incentives for network businesses to implement TOU tariffs or CPP to achieve these demand response benefits. In addition, it is necessary to consider whether retailers would pass through these tariff structures to customers to give customers the required pricing signals.
In relation to the incentives on network businesses NERA has recently completed a review for the MCE considering the incentives within the rules for distribution regulation for investing in demand side response and distributed generation. Many of these incentive issues are discussed and highlighted in the associated review report.273 We expect that this will ensure that TOU and CPP tariffs are offered where they are considered to be most cost effective.
There is likely to be a need, however, to consider the most appropriate approach to ensuring that where a network business offers a TOU or CPP pricing structure, the resultant price structure is passed through to customers by retailers. Options range from sharing the benefits associated with the cost savings between retailers and distributors to requirements on retailers for the direct pass through of network charges.
273 NERA (2007), Network Incentives for Demand Side Response and Distributed Generation, Part One: Distribution
Rules, April.

Consultation Report - Cost Benefit Analysis of Smart Metering and DLC
Conclusions and Recommendations
NERA Economic Consulting 202
18.3.4. Urban, rural and regional analysis
The cost benefit assessment has also considered the relative costs and benefits of a smart meter rollout among urban, rural and remote areas.
Costs per NMI are higher for customers in rural and remote areas compared to those in urban areas. In particular, communications costs on a per NMI basis are higher as a result of the differences in communications technologies assumed by EMCa between rural and remote areas and urban areas. Meter costs are also higher, reflecting both the higher cost of meters compatible with the communications technology assumed for rural/remote areas and also higher installation costs as a result of increased travelling time and vehicle use.
The per NMI business efficiency benefits have also been estimated by CRA to be greater for customers in rural and remote areas than for urban customers. In particular, the avoided costs of routine reads, special reads, connections/disconnections, reduced calls to faults and emergency lines and customer complaints are all estimated by CRA to be greater on a per NMI basis for rural/remote areas compared to urban areas.
In relative terms, the higher benefit per NMI in rural and remote areas exceeds the increase in costs per NMI for these customers, on the basis of the estimates provided by EMCa and CRA. As a result, the net benefit per NMI is greater for customers in rural and remote areas than it is for customers in urban areas. This implies that the benefits of a smart meter rollout will be greatest where customers in rural and remote areas are also included, rather than limiting a rollout to urban areas only. However we note that this is dependent on the viability of PLC communications technology for rural and remote areas. EMCa notes in its report that it considers that there are adequate answers to the concerns raised in relation to PLC such that it can be considered a viable technology for Australia.274
18.4. Conclusions on Non-Smart Metering DLC Scenario
In addition to the smart metering scenarios, we have considered a non-smart metering direct load control scenario.
The results indicate that:
nationally, direct load control can deliver net benefits of between $34 million and $618 million;
in Queensland a non-smart meter DLC rollout is estimated to provide positive net benefits in both the upper and lower end of the ranges considered;
in New South Wales a non-smart meter rollout has a positive net benefit in the upper bound and a marginal net cost in the lower bound. However, this reflects the winter peaking assumption in New South Wales, which results in DLC not leading to any network deferral. Under the summer peaking sensitivity a non-smart meter DLC rollout is estimated to provide positive net benefits in both the upper and lower bounds;
274 EMCa Workstream 1Transitional Costs Consultation Report (February 2008), Section 5.6.2.

Consultation Report - Cost Benefit Analysis of Smart Metering and DLC
Conclusions and Recommendations
NERA Economic Consulting 203
for Victoria, South Australia and Western Australia a non-smart meter DLC rollout is estimated to provide positive net benefits in the upper end of the ranges considered and to have either a zero or only marginal net benefit in the lower end of the range; and
for the Northern Territory, the Australian Capital Territory and Tasmania a DLC rollout is not expected to result in a positive net benefit, as result of the particular characteristics of load in these jurisdictions and the limited scope for network deferral.
Whether this approach should be adopted in a given jurisdiction will therefore depend on:
the need to manage maximum demand in the near future, such that the time delay associated with a smart metering rollout may lead to significant network deferral benefits not being realised; and
the justification for a smart metering rollout in the jurisdiction, i.e. if smart metering is justified on business efficiency grounds, then DLC is likely to be most effectively delivered via the smart metering infrastructure.
18.5. Qualitative Benefits
We note that the results of the cost benefit analysis presented in this report reflect only those costs and benefits that the consultant teams have been able to quantify.
CRA notes in its network impact report that there are a number of additional benefits that have not been quantified in this study, due mainly to a lack of information.275 These benefits include:
Reduction in cost of load research
Reduction in technical losses
Reduction in the cost of network planning and operation
Avoided costs of validation and exception management for routine and special; meter reading
Reduction in end of line monitoring
Reduction in the cost of recording and reporting minutes off supply to regulators
CRA estimate that if these benefits could be quantified they could increase the overall benefits of smart metering by 10 per cent to 20 per cent.
In addition NERA’s Consumer Impact report notes that the rollout of smart meters has the potential to enhance the level of customer service through such things as faster fault resolution, avoided cost of service call-outs and improved management of the security and
275 CRA Workstream 2 Network Impact Consultation Report (February 2008), section 15.

Consultation Report - Cost Benefit Analysis of Smart Metering and DLC
Conclusions and Recommendations
NERA Economic Consulting 204
reliability of the network.276 The quantitative effects of these potential improvements in customer service are not easily discernable and therefore NERA’s the consideration of the consumer benefits of these functionalities has been of a qualitative nature and is not reflected in the quantitative net benefit results reported in this report.
18.6. Conclusions on the Consumer Impacts
In considering the likely consumer impacts resulting from a smart metering rollout it is necessary to draw a distinction between the rollout of smart metering and the introduction of TOU and/or CPP.
The results outlined above indicate that for the majority of jurisdictions the avoided metering cost and business efficiency benefits alone may outweigh the costs of a smart meter rollout. For these jurisdictions, therefore, the consumer impacts are likely to be net positive over the 20 year period of our analysis. In practice, however, we would expect that average prices would rise initially to pay for the initial rollout with the benefits accruing over the remaining period as the business efficiency benefits are realised and passed through to customers.
Where TOU and/or CPP tariffs are introduced, a consumer will be better or worse off depending on:
the individual household load profile, which is affected by the appliance mix, usage of appliances within the home, and the time when the usage occurs;
total electricity consumption; and
the scope and motivation that the household has to change existing electricity use patterns, or conserve electricity.
Critically, we have assumed that where TOU and/or CPP tariffs are introduced, no consumer would be forced to move onto these tariffs. This would suggest that no consumer would switch to these tariffs if it would make them worse off. However, evidence from the United Kingdom indicates that some consumers would switch even though it would make them worse off.277 This could be because households had a different expectation about their load profile or ability to shift demand, compared to the reality once the customer had committed to the TOU and/or CPP tariff product.
In general, households with relatively flat load profiles would be expected to be better off under TOU and/or CPP tariffs, without a need to change consumption patterns. By analogy, households with relatively high consumption during peak periods would be expected to be worse off under TOU and/CPP tariffs, unless they are able to dramatically shift demand from peak to off-peak periods.
276 NERA, Workstream 4 Consumer Impacts Consultation Report (February 2008), section 9. 277 Waddams, C., (2007), "Deregulating Residential Electricity Markets: What's on Offer?", CUAC Expert Forum on
Electricity Pricing Forum Papers, Melbourne, 16 August, page 13.
Consultation Report - Cost Benefit Analysis of Smart Metering and DLC
Conclusions and Recommendations
NERA Economic Consulting 205
We highlight that in the NERA Consumer Impact report a number of consumer issues that should be taken into consideration as part of the policy framework for a future smart metering rollout.278 These include:
the underlying regulatory framework for the introduction of smart metering will need to consider how hardship policies and other consumer protections and assistance programs may need to be modified to ensure that existing protections are not eroded;
new mechanisms for ensuring that households facing financial stress are identified and provided with information on assistance available, prior to utilising remote disconnection functionalities;
designing education programs about the introduction of smart metering and associated innovative tariff products, to ensure that the potential for demand response is maximised. The focus group results suggest that for low income households providing oral information can sometimes be more effective than information provided in the form of leaflets or brochures. The costs of these customer education programs has not been included in the cost benefit analysis results in this report but would not be expected to materially affect the outcomes given that they would be a much lower order of magnitude than the other costs incorporated in the analysis;
providing an opportunity for households to readily shift between tariff products if they discover that they are actually financially worse off from the new tariff product offering;
the need to consider the relationship between network businesses (offering time of use network tariffs and/or critical peak pricing) and the customer given that most customers only receive a bill from a retailer and the retailer will not have an obligation to pass these new tariff structures onto customers. An alternative incentive mechanism could be designed to ensure that time of use tariffs and/or critical peak prices are transparently conveyed by retailers to customers; and
ensuring that there is sufficient notice of critical peak events, to provide the opportunity for a household to respond appropriately to the pricing signals presented.
18.7. Implications for Greenhouse Gas Emissions
As part of the analysis of the market impact resulting from smart metering and non-smart meter direct load control CRA considered the extent of achievable greenhouse gas emission benefits.
Shifts in the load profile resulting from TOU tariffs or critical peak pricing where peak load is reduced but off-peak load is increased will impact on greenhouse gas emissions. This impact, considered on its own, could result in either an increase or a decrease in emissions, depending on the type of generation plant that is the marginal generator during each period. CRA’s market modelling indicates that greenhouse gas emissions would decrease under a smart metering rollout on the basis of the shifts in consumption estimated by NERA.
278 See Chapter 10, NERA (2007), Cost Benefit Analysis of Smart Metering and Direct Load Control, Workstream 4,
Consumer Impacts Phase 2 Report, December.

Consultation Report - Cost Benefit Analysis of Smart Metering and DLC
Conclusions and Recommendations
NERA Economic Consulting 206
However, we note that if coal is the marginal generator for most off-peak periods, then, shifting electricity load from peak to off-peak periods could very well increase the resultant greenhouse gas emissions, depending on the exact pattern of load shifting.
Greenhouse gas emissions will unambiguously reduce due to a smart metering rollout, where smart meters lead to overall reductions in total energy use by households. The greenhouse benefits that CRA estimate are therefore significantly enhanced where the assumption is adopted that households will conserve electricity of approximately 3 per cent following a smart metering rollout.
For smart metering to result in the maximum potential reduction in greenhouse gas emissions, it is therefore critically necessary to ensure that households conserve electricity following the rollout. We recommend that any mandatory rollout of smart meters be accompanied by an education and information program targeting energy efficiency. For environmental benefit purposes there will need to be an ongoing information program to ensure that households maximise the use of smart metering information to better manage their electricity use. This is important as there is concern that following the initial rollout and response by households consumer interest in conservation may vary. We note that such information programs may also be effective in achieving improvements in energy efficiency in the absence of a smart meter rollout.
18.8. Transitional Regulatory, Legal and Technical Issues
The analysis that we have undertaken on the costs and benefits associated with smart metering and a non-smart meter direct load control has ignored the transitional regulatory and legal reforms that would be necessary for their introduction. This reflects the direction we received from the SMWG to consider the costs and benefits assuming that any current regulatory or legal barriers can be removed.
However, it is important to consider what regulatory and legal reforms are necessary, as part of a decision on whether to undertake a mandatory rollout of smart metering. In our view, transitional regulatory and legal issues that would need to be resolved include:
differences in electrical safety requirements between jurisdictions relating to remote connections and commissioning of PV cells;
how and whether to recover costs associated with the existing meter stock with remaining asset life;
the interaction of new tariff structures within existing retailer regulatory arrangements, including requirements for postage stamp pricing in some jurisdictions;
the interaction with developments in full retail contestability in Western Australia and Tasmania;
the implications for existing service standard requirements for distributors;
reforms to the NER to accommodate smart metering, including performance requirements;

Consultation Report - Cost Benefit Analysis of Smart Metering and DLC
Conclusions and Recommendations
NERA Economic Consulting 207
amendments to the NER to mandate the national minimum functional specification for smart metering; and
the approach to interoperability, which we recommend be resolved by a national expert group appointed by SMWG.
In addition to these regulatory and legal issues that will need to be resolved, there is also a need for further technical work in relation to:
the specific performance requirements for each functionality included within the national minimum functionality; and
the technical feasibility of communications infrastructures.
We recommend that following a decision about whether to proceed with a smart metering rollout, a detailed work plan is developed to progress these issues.

Consultation Report - Cost Benefit Analysis of Smart Metering and DLC
Appendix A
NERA Economic Consulting 208
Appendix A. Submissions Received in Response to the Phase 1 Overview Report
ACTEW AGL Retail AGL Energy Limited Australian Electrical and Electronic Manufacturers’ Association (AEEMA) Centre for Credit and Consumer Law (CCCL) Consumer Law Action Centre (CLAC) Consumer Utilities Advocacy Centre (CUAC), St Vincent de Paul and Alternative Technology Association (Joint submission) Country Energy Current Group LLC Distribution Control Systems Inc (DCSI) Eckermann & Associates Energex Limited Energy and Water Ombudsman of New South Wales Energy and Water Ombudsman of Victoria EnergyAustralia Energy Networks Association (ENA) Energy Supply Association of Australia (ESAA) Ergon Energy ETSA Utilities Integral Energy Landis + Gyr Metropolis/ Centurion National Electricity Market Management Company Limited (NEMMCO) Origin Energy Public Interest Advocacy Centre (PIAC) Polymeters Response International Limited (PRI) Telepathx Ltd Total Environment Centre Inc Tru Energy Australia Pty Ltd Western Australian Council of Social Service Inc (WACOSS) Western Power

Consultation Report - Cost Benefit Analysis of Smart Metering and DLC
Appendix B
NERA Economic Consulting 209
Appendix B. List of Stakeholders Consulted/RFIs sent as part of Phase 2
Australian Capital Territory Council of Social Services (ACTCOSS) ActewAGL AGL Energy Alinta AMP Aurora Energy Aust Council of Social Services (ACOSS) Australian Council of Social Services Australian Power and Gas Centre for Credit and Consumer Law Citipower Consumer Action Law Centre Consumer Utilities Advocacy Centre Consumer Utilities Advocacy Centre (CUAC) Country Energy DTECS Echelon Elster Energex Energy Australia Energy Efficient Strategies Energy Retailers Association of Australia Ergon Energy Essential Services Consumer Council Ethnic Communities Council ETSA Utilities General Electric Horizon Power Independent Market Operator (Western Australia) Integral Energy Intermoco Itron Jackgreen National Electricity Market Management Company NENL Optus Origin Energy Power and Water Corporation Powercor Public Interest Advocacy Centre Red Energy Simply Energy South Australia Council of Social Services (SACOSS)

Consultation Report - Cost Benefit Analysis of Smart Metering and DLC
Appendix B
NERA Economic Consulting 210
SP AusNet St Vincent de Paul Society Synergy Tasmania Council of Social Services (TasCOSS) Telstra Total Environment Centre TRUenergy United Energy Distribution Victoria Electricity Vodafone Wesley Uniting Care West Australia Council of Social Services (WACOSS) Western Power

Consultation Report - Cost Benefit Analysis of Smart Metering and DLC
Appendix C
NERA Economic Consulting 211
Appendix C. Summary of Cost Benefit Analysis for each Jurisdiction on a per NMI Basis
Appendix D. Results of the Cost Benefit Analysis for each Jurisdiction (NPV terms)

Consultation Report - Cost Benefit Analysis of Smart Metering and DLC
Appendix E
NERA Economic Consulting 212
Appendix E. NMI Breakdown by Jurisdiction
STATE REGION No NMIs PERCENTAGE NSW Urban 2,860,816 87%
Rural 349,975 11%
Remote 87,885 3%
Subtotal 3,298,676
Vic Urban 2,150,438 88%
Rural 245,859 10%
Remote 37,529 2%
Subtotal 2,433,827
Qld Urban 1,519,238 83%
Rural 247,073 13%
Remote 75,057 4%
Subtotal 1,841,368
SA Urban 675,063 85%
Rural 95,303 12%
Remote 23,826 3%
Subtotal 794,192
WA Urban 783,770 85%
Rural 101,430 11%
Remote 36,884 4%
Subtotal 922,083
Tas Urban 215,800 83%
Rural 31,200 12%
Remote 13,000 5%
Subtotal 260,000
NT Urban 57,949 95%
Rural 3,050 5%
Remote 1 0%
Subtotal 61,000
TOTAL Urban 8,263,074 86%
Rural 1,073,889 11%
Remote 274,182 3%
9,611,145

NERA Economic Consulting Darling Park Tower 3 201 Sussex Street Sydney NSW 2000 Tel: +61 2 8864 6500 Fax: +61 2 8864 6549 www.nera.com
NERA Australia Pty Ltd, ABN 34 092 959 665