cost comparisons of on-farm and community basins - case …
TRANSCRIPT

CRC FOR CATCHMENT HYDROLOGYCSIRO LAND AND WATER
MURRAY-DARLING BASIN COMMISSION
CRC FOR CATCHMENT HYDROLOGY REPORT 00/8CSIRO LAND AND WATER TECHNICAL REPORT 14/00
June 2000
ON-FARM AND COMMUNITY-SCALE SALT DISPOSAL BASINSON THE RIVERINE PLAIN
COST COMPARISONS OF ON-FARM ANDCOMMUNITY BASINS -CASE STUDIES OF THE MIA AND WAKOOL
Jai Singh and Evan Christen
FOREWORD
To limit salinity increases in the River Murray, there are pressures tominimise salt leaving irrigated catchments of the Murray-Darling Basin. Partof this strategy is to manage drainage water in the irrigation areas usingdisposal basins. Unfortunately, there are no existing guidelines for siting,design and management of such disposal basins. The CRC for CatchmentHydrology and CSIRO Land and Water, with support from the Murray-Darling Basin Commission, have embarked on a project with the overallobjective of producing such guidelines for the Riverine Plain of the MurrayBasin.
This report is one of several being produced in this project to support theguidelines. It deals with the costs of designing and managing basins, rangingfrom on-farm, for use by that single property, to community basins used byseveral properties. While costs for constructing community basins are lowerthan for on-farm basins, there are costs incurred in transporting drainagewater to the basin. The result is that the cheaper option will depend on anumber of site aspects, including whether land needs to be purchased for thecommunity basin. Cost is not the driving issue in the Land and WaterManagement Planning process for choosing widespread adoption of oneoption over the other.
Glen WalkerLeader, Salinity Program
iCSIRO Land and Water Technical Report 14/00
Summary
In the Riverine Plain, constructed disposal basins are used to hold salinesubsurface drainage water. These basins can be small on-farm basins, takingdrainage water from individual farms, or larger community basins takingdrainage water from a group of farms.
There is a perception that larger community basins are more economicalthan smaller on-farm basins due to economies of scale in construction.However, with community basins there is usually a large cost associated withthe transport of the saline drainage water from the farms to the basin. Thesiting of the basin, drainage volume and hence pipe size and operational costswill affect the attractiveness of community basins.
This report has two sections; the first analyses and compares the cost andhence the financial viability of a group of grapevine enterprises with severalon-farm basins against the option of a single community basin. The secondsection uses the Wakool basin as an example of a community basin that isthen compared with an equivalent area of multiple smaller basins.
The aggregate cost estimates showed that the construction cost of acommunity basin was 21-36% lower than the equivalent on-farm basins.However, the drainage water transportation cost added 24-34% to the totalcost. Thus overall, the community basin cost ranged between 12% less and11% more than for on-farm basins depending upon the scenario.
Community basins were found to cost less under conditions of land tradingbetween farms, and where a smaller basin overall could be used. However,community basins were found to cost more where additional land had to bepurchased for their construction, where the drainage water transportationcost was high due to the location of the basin and where a larger basin thanthe equivalent on-farm basins was used.
Although these results are based on only two case studies (MIA and Wakool)it does appear that the overall cost differences between on-farm orcommunity basins are not great. Thus, there is not a great financialimperative to choose either on-farm or community basins. This findingallows decisions between on-farm or community basins to be mainly basedupon environmental and social considerations.
It was found that the cost of a community basin to individual farmers variedconsiderably. It was assumed that the individual farms had to pay their shareof the basin construction cost based upon their drained area, and had to meettheir own cost of drainage water transportation to the community basin. Insome circumstances, it was found that for a community basin an individualfarm had higher costs than for an on-farm basin, despite the overall cost of
iiiCSIRO Land and Water Technical Report 14/00

the community basin being lower. Thus a community basin may in overallterms be advantageous to a group of farms, whilst actually costing someindividuals more than an on-farm basin. These cost variations to individualfarms can be attributed to factors such as: basin size, distance between farmand community basin and cost of purchasing additional land for acommunity basin.
A method has been developed using critical pipe length, to assess at whatdistance from a community basin a particular farm may be financially betteroff with an on-farm basin. This method was developed in recognition of thedrainage transportation cost being a major factor in determining thefinancial attractiveness of a community basin over an on-farm basin.
This overall trade off between drainage transportation and basin costs meansthat a community basin needs to be large enough to achieve a balancebetween the increasing drainage transportation cost, and decline in basinconstruction cost, to provide an overall benefit.
iv CRC for Catchment Hydrology Report 00/8

Table of Contents
Foreword i
Summary iii
1. Introduction 1
2. Objectives 3
3. Methodology 5
3.1 Locale of the Study 5
3.2 Development of Scenerios 6
3.3 Costs analysis 11
3.4 Financial Evaluation 11
3.5 Data Used 11
4. Results and Discussion 13
4.1 Total Costs of Disposal Basins 13
4.2 Individual Costs to Farms 13
4.3 Scenerio Comparisons 14
4.3.1 Land trade 14
4.3.2 Purchased land vs land trade 16
4.3.3 Spatial comparisons 18
4.3.4 Basin size 19
4.4 Critical Pipe Length 20
5. Tr a n s p o rt ation Cost and Basin Size - Wa kool Basin Case Study 23
6. Conclusions 27
7. References 29
Appendices 31
vCSIRO Land and Water Technical Report 14/00
vi
List of Tables
Table 1. Details of scenarios considered for communityand on-farm disposal basin comparison 7
Table 2. Variables considered for financial analysis ofcommunity basin 7
Table 3. Cost of on-farm and community basin under different scenarios 13
Table 4. Cost of on-farm and community basin to individual farmer 14
Table 5. Cost of on-farm and community basins with land trading within farm areas 15
Table 6. Financial profitability of grapevines withon-farm and community basin under landtrading within farm area scenario 16
Table 7. Cost of on-farm and community basins underpurchased land and land trading scenarios 16
Table 8. Financial viability of grapevines with a community basin under purchased land and land trading scenarios 18
Table 9. Comparison of on-farm basin and community basin costs under scenario 3 and 5 (basin located at different sites) 18
Table 10. Financial viability of grapevines with a community basin sited at different locations 18
Table 11. Comparison of on-farm basin cost with different size of community basins 19
Table 12. Financial profitability of grapevines with different size of community basins 19
Table 13. Trade off between drainage water transportation and basin cost 20
Table 14. Scenarios for cost analysis of the Wakool disposal basin 23
Table 15. Total cost of a basin under all scenarios ($’000) 24
Table 16. Basin construction cost and drainage transportation cost 25
Table 17. Break up of cost components with basin size 25
Table A1.Variables considered for financial analysysof community basin 31
Table A2.Variables included in different scenerios 32
CRC for Catchment Hydrology Report 00/8

vii
List of Figures
Figure 1. Case study area and existing multiple on-farms basin in Ballingal area of the MIA 5
Figure 2. Community basin under scenario 1 and 2 8
Figure 3. Community basin under scenario 3,4,6 and 7 9
Figure 4. Community basin under scenario 5 10
Figure 5. On-farm vs community basin (land trade within farm areas) 15
Figure 6. On-farm vs community basin(purchased land and land trade) 17
Figure 7. Relationship between drainage transportation cost and pipe lengths for a community basin under collective land trade 21
CSIRO Land and Water Technical Report 14/00

viii
Acknowledgments
This research is part of a collaborative project between CSIRO Land andWater and the CRC for Catchment Hydrology, partially funded by theStrategic Investigation and Education Program of the Murray Darling BasinCommission (Project I7034 Managing Disposal Basins for Salt StorageWithin Irrigation Areas). We gratefully acknowledge Mr J. Madden, CSIROLand and Water, for his comprehensive review of the report.
CRC for Catchment Hydrology Report 00/8
Introduction
1CSIRO Land and Water Technical Report 14/00
1. Introduction
Downstream impacts of saline drainage water from irrigation areas have ledto increasing pressure to manage drainage water within irrigation areas. Anoption for doing this, which has gained some acceptance, is the use ofdisposal basins where the drainage water is disposed and evaporated. Thesedisposal basins may be at a farm scale, such as those used with tile drainagein perennial horticulture in the Murrumbidgee Irrigation Area (MIA). Thesebasins tend to be less than 10ha and take water from single farms that have atile drainage system.
An alternative option has been to develop community scale disposal basins,to take water from groups of farms. At present this type of basin is usuallyassociated with groundwater pumping schemes, such as at Girgarre in theShepparton Irrigation Region which is a 30ha basin and larger regional scaledisposal basins, and the Wakool Disposal Basin which is 2000ha. Thesebasins cover a number of farms and are much larger than on farm basins.With these schemes the drainage system, being groundwater pumps, usuallycovers more than one farm, with little possibility of linking the drainagevolume and costs to a particular enterprise or water management.
For any particular drainage scheme there is, at the design stage, theopportunity to explore at what scale the disposal basin or basins should be.In the case of Wakool, one very large basin was chosen; however it wouldhave been technically feasible to have a number of smaller basins at keylocations, or even one disposal basin per groundwater pump. These issuesfrom a financial viewpoint have not been explored. Intuitively, larger basinsshould be more economical to construct than smaller basins due toeconomies of scale. However, with larger basins a network of pipes is requiredto deliver the water from the farms/pumps to the basin. It is only if the costsavings in construction are greater than the drainage transportation costs thata larger basin will be more attractive than several smaller basins.
Thus, this report seeks to explore this balance between size of basin andtransportation costs. Whether a small basin is on-farm, or a larger basin isshared by two or several farms and hence deemed a community basin, is moreto do with ownership and cost sharing than any physical attribute. Thisanalysis compares the financial viability of farms that use either on-farm (selfowned) basins or combine together with other farms to share a basin. Thecosts and viability of basins will vary according to siting, design, landtrade/purchase, size and pipe length required to transport saline drainagewater from the farm to the community basin.

Objectives
3CSIRO Land and Water Technical Report 14/00
2. Objectives
The objectives of this study were to:
1. Document the cost of a community basin under various scenariospertaining to land trade, land ownership, cost distribution, siting, designand size of basin
2. Compare the cost differences between on-farm and community basinsunder different scenarios
3. Compare the financial profitability of grapevines with on-farm orcommunity disposal basins
4. Analyse the trade off between increased drainage transportation cost andconstruction cost savings with a community basin.

Methodology
5
3. Methodology
The analysis was carried out on a subcatchment in the Ballingal area of theMIA, Figure 1. In the subcatchment were four viticulture farms (Farms 2, 3,7 and 5); each had an existing on-farm disposal basin of 3.2-4.9ha,representing 5-11% of the farm area. The total area of the four farms was276ha, served by approximately 17ha of on-farm basins, representing anaverage 6% of the drained area. All the farms had tile drainage.
Figure 1.Case study area in MIA,existing multiple on-farm basins
CSIRO Land and Water Technical Report 14/00
3.1Locale of the Study

COST COMPARISONS - CASE STUDIES OF THE MIA AND WA KO O L
6 CRC for Catchment Hydrology Report 00/8
For comparison with the existing status quo of the individual on-farm basins,a number of scenarios were developed to determine the impact of variationsin physical and financial parameters on the cost and financial attractivenessof a community basin. These scenarios assume that the existing landholderscould have co-operated, or a development plan for the area could have beendeveloped, before the current evaporation basins were built.
The parameters investigated were:
a) The trade of land between farms with existing on-farm basins to build acommunity basin. This requires that the farm or farms where thecommunity basin is located are compensated with extra land from thefarms that are to use that community basin. This helps to equalise thecost burden of lost production on the farm or farms where thecommunity basin is located.
b) The purchase of land outside the existing farms for the community basin.This is where extra land is purchased outside the boundaries of the farmsthat had existing on-farm basins. This provides the farms overall withextra land as they do not have on-farm basins and they do not have totrade land to compensate the farm owners where the community basin islocated. However, this scenario incurs extra cost in the land purchase.
c) The size of the community basin. The agglomeration of a group ofsmaller basins may result in a single basin that is either larger or smallerthan the sum of the area of the individual basins. It may be larger in thatthe disposal capacity is reduced, as the evaporation from open waterreduces with the size of the water body, or it may be smaller due to timingand amount of drainage across farms together with possible bettermanagement.
Extra land that becomes available due to amalgamation of on-farm basins orpurchase of land outside the existing area is assumed to have been part of thevineyard development. Details of the various scenarios are shown in Table 1.
3.2Development ofScenarios

Methodology
7
Table 1.Details of scenarios for comparison of community and on farm disposal basins
Scenarios Basin site and land ownership Basin size (ha) % of drained area Cost distribution*
1 Single land trade between original farms 17 6 Original basin area
2 Multiple land trade between original farms 17 6 Original basin area
3 Purchased land at A (Farm 6) 17 6 Original basin area
4 Purchased land at A (Farm 6) 17 6 Farm area
5 Purchased land at B (Farm 1) 17 6 Original basin area
6 Purchased land at A (Farm 6) 21 7.5 Farm area
7 Purchased land at A (Farm 6) 14 5 Farm area
*the cost distribution of a community basin to individual farms can be on the basis of the original on-farmbasin area or on the basis of the farm area
CSIRO Land and Water Technical Report 14/00
From the scenarios described above, four groups were developed (Table 2) toform the basis of cost and financial comparisons between on-farm andcommunity basins.
Table 2. Scenario comparison
Variables Scenario groups
Single and multiple land trade Scenario 1 and 2
Purchased land and land trade Scenario 3 and 2
Varying community basin area Scenario 4, 6 and 7
Purchased land at site A and site B Scenario 3 and 5
Scenarios 1 and 2 amalgamate the existing multiple on-farm basins to asingle site in the form of a community basin (see Figure 2). Scenario 1 useda single land trade where Farm 5 purchased land for the community basinfrom Farm 7. In Scenario 2, there was a multiple land trade where Farms 2,3 and 7 each sold a fraction of land, proportionate to farm area, to Farm 5for the community basin.

COST COMPARISONS - CAS E STUDIE S OF THE MIA AND WA KO O L
8 CRC for Catchment Hydrology Report 00/8
Figure 2. Community basin under Scenarios 1 and 2
Scenarios 2 and 3 permit a comparison between a community basin,accommodated via a land trade in the existing farms, versus a basin sited onland purchased outside the existing area (Figure 3).
Scenarios 4, 6 and 7 are used to compare community basin cost and financialviability when varying basin area (Figure 3). Community basins may besomewhat larger than the equivalent area of on-farm basins due to reducedleakage; thus a 7.5% community basin area was included. However, it maybe argued that due to better management a smaller community basin wouldresult, thus a 5% basin area was also included.
3211 m
m
1805 mm
Farm
6
Pasture
(47ha)
Farm 7Grapes(46ha)
1:12200
Farm 1Rice+pasture(52ha)
Farm 2Grapes(95ha)
Farm
4
Citrus
(45ha)
Main drai
n
Farm
5
Grapes
(50ha)
Supply
Farm 3Grapes(85ha)
Drain
Drain

Methodology
9
Figure 3.Community basin under Scenarios 3,4,6 and 7
CSIRO Land and Water Technical Report 14/00

COST COMPARISONS - CASE STUDIES OF THE MIA AND WA KO O L
10 CRC for Catchment Hydrology Report 00/8
Scenarios 3 and 5 are used to compare the effect of drainage transportationcosts with a community basin at different sites, Figure 4.
Figure 4.Community basin under Scenario 5
Drainage transportation is a major component of the total cost of acommunity disposal basin, the drainage water being conveyed by a networkof pipes. The size of pipe and corresponding pump capacity is a function ofdrainage discharge rate, gradient, pressure head and pipe length. Thesefactors affect the total cost of transporting drainage water from the farm tothe disposal basin.
In these analyses, a number of assumptions with regard to location and sizeof disposal basin were made, to compare cost and financial viability ofgrapevines with a community basin to on-farm basin under differentscenarios. Details of the variables for each scenario are given in Appendix 1.In calculating the cost under various scenarios it was assumed that the designdrainage rate for the whole project area was 2.5mm/day.

Methodology
11
Detailed estimates of costs were mainly obtained from Singh and Christen(1999). Costs were also determined by consulting various agencies such assurveyors, consultants, engineering suppliers and the electricity supplyauthority. The costs are based on 1999 dollar values.
The financial evaluation of grapevines with multiple on-farm or a singlecommunity disposal basin was carried out using a Cash Flow Budgetconstructed for a 25 year period. Total yearly benefits (in terms of returnsfrom grapevine yields obtained using different basin areas) and costs werediscounted at a rate of 8%. Financial viability of grapevines was expressed asNet Present Value (NPV), Benefit Cost Ratio (BCR) and Break Even Time(BET). Details of analysis and methods used are presented in Singh andChristen (2000).
The trade off between drainage transportation cost and basin size wasdetermined by working out the critical pipe length that equalises the cost of acommunity basin with the equivalent on-farm disposal basin. Annual costsof on-farm and community basins were worked out considering a 30 yearbasin design life.
Average grape prices were taken from Wine Grape Marketing Board (1997).Costs of vineyard development, including the cost of machinery andequipment, land preparation, trellising, vine establishment and maintenance,irrigation system installation, operational cost, chemicals, harvesting and tiledrainage were obtained from Moll and Christen (1996).
The cost of siting, design and construction of disposal basins were obtainedfrom Singh and Christen (1999). A land value of $2000/ha was used as thepurchase price.
In estimating the cost of a community basin, no consideration was given toadditional land required for creating a buffer around the disposal basin.
This analysis did not include the costing of any environmental or socialconsequences in regard to the use of community or on-farm basins.
CSIRO Land and Water Technical Report 14/00
3.3Costs Analysis
3.4Financial Evaluation
3.5Data Used

Results and Discussion
13
4. Results and Discussion
The construction cost of a community basin (6% of drained area) withouttransportation costs was lower than for the equivalent area of on-farm basinsby 21-36%. When the community basin area was increased to 7.5% toaccommodate a possible reduced disposal capacity, it still cost about 6% lessthan the on-farms basins, Table 3. A smaller community basin area (5%) cost33% less than on-farm basins.
The transportation cost added 24-34% to the total cost. Thus, overall for thesame basin area, the community basin cost either about 12% less or 13%more than the equivalent on-farm basins. The cost reduction resulted whenthe community basin was sited centrally as in Figure 2. The costs were greaterwhen the community basin was sited on purchased land away from theexisting farms (Figures 3 and 4).
There was considerable variation in cost to individual farms when using acommunity basin, Table 4. Some farms incurred higher costs when using acommunity basin compared to an on-farm basin, even when the total costsof a community basin were lower. For example, the community basin cost toFarm 5 was higher than the on-farm basin cost in Scenarios 1 and 2, whilst
CSIRO Land and Water Technical Report 14/00
4.1Total Costs of
Disposal Basins
Table 3. Cost of on-farm and community basins
Construction Transportation Total
1 229,736 147,161 55,407 202,568 -11.8
2 229,736 147,161 55,407 202,568 -11.8
3 229,736 181,960 71,171 253,131 +10.2
4 229,736 181,959 71,171 253,130 +10.2
5 229,736 181,960 77,892 259,852 +13.1
6 229,736 214,958 71,171 286,129 +24.5
7 229,736 152,571 71,171 223,742 -2.6
Scenario
Basin Cost ($)
% difference betweencommunity and on-
farm basin
On-farm basinstotal cost
(6% of drained area)
Community basin
4.2Individual costs to
Farms

COST COMPARISONS - CASE STUDIES OF T HE MIA AND WA KO O L
14 CRC for Catchment Hydrology Report 00/8
it was lower in Scenarios 3 and 4. Similarly, the community basin cost toFarms 2 and 3 was considerably higher than the on-farm basin cost inScenario 7; however, the overall cost of the community basin was lower thanfor on-farm basins. These variations in community basin costs to individualfarms were mainly due to variations in drainage transportation costs. ForFarm 7, a community basin was cost effective in 6 out of 7 scenarios. Thiswas due to a reduction in basin size in Scenarios 4, 6 and 7 and due toeconomies of scale in all other cases.
From these results, it is clear that there are several factors combining toincrease or decrease the cost to individual farms. These individual factors, orfactors in combination, are distance between farm and community basin,basin size and the trade off between increased production on additional landavailable when purchasing land for the community basin, and the cost of theland.
This section combines the cost differences between on-farm and communitybasins with the financial gains or losses in grape production using an on -farm or community basin.
4.3.1 Land trade
The total cost of a community basin to all farms was approximately 12% lessthan the on-farm basin cost under conditions of a land trade (Table 4). A landtrade constrains the position of the basin to within the area of the existingfarms; the chosen community basin position was the most central of all the
Table 4.Cost of on-farm and community basin to individual farms ($) (Cells shaded grey indicate wherethe costs of a community basin are less than the cost of an on-farm basin)
Basin type Scenario Farm 2 Farm 3 Farm 5 Farm 7
On-farm Status quo 65,370 62,090 43,810 58,466
Community Basin 1 61,874 42,373 52,379 45,942
2 60,888 41,534 52,114 48,032
3 92,823 61,609 40,344 58,355
4 104,268 73,891 38,870 36,101
5 76,053 63,325 61,963 58,511
6 115,602 84,109 44,715 41,703
7 94,141 64,894 33,423 31,284
4.3Scenario comparison

Results and Discussion
15
scenarios. Thus, the effectiveness of a community basin in thesecircumstances is probably a combination of a central position and land trade.However, the effects on individual farms were quite variable (Table 5 andFigure 5). The total cost to Farm 3 was considerably lower (about 33%)whilst the total cost of a community basin to Farm 5 was 19% higher thanthe corresponding on-farm basin cost. Differences between constructioncosts of basins showed that the benefits due to economies of scale, rangedfrom 31-42%. The proportion of drainage transportation cost ranged fromas low as 10% for Farm 3 and 7 to as high as 54% for Farm 5.
CSIRO Land and Water Technical Report 14/00
Table 5.Cost of community basin with land trade within the original farm area as a % of on-farm basin cost
Basin type Scenario Farm 2 Farm 3 Farm 7 Farm 5 Total
On-farm Status quo $65,370 $62,090 $58,466 $43,810 $229,736
Community basin 1 - Single land trade 95% 68% 79% 120% 88%
Community basin 2 - Collective land trade 93% 67% 82% 119% 88%
0
50000
100000
150000
200000
250000
Basin
co
st ($
)
Farm 2 Farm 3 Farm 7 Farm 5 All farms
On-farm Scenario 1 Scenario 2
Figure 5.On-farm vs Communiy basin (land trade within farm areas)

COST COMPARISONS - CASE STUDIES OF THE MIA AND WA KO O L
16 CRC for Catchment Hydrology Report 00/8
The results of the financial analyses of grapevines under single and collectiveland trade (Table 6) indicated that there were only marginal (insignificant)changes in farm financial viability between using on-farm basins or acommunity basin.
4.3.2 Purchased land vs land trade
A cost comparison between Scenarios 2 and 3 is presented in Table 7 andFigure 6. The results show that land value has a significant impact on basincost. In Scenario 3, the total cost of a community basin to different farmsvaried from 8% less to 42% more as a result of purchasing additional landand transportation costs.
Table 6. Financial profitability of grapevines under land trade scenarios
Items On-farm Community basin
Single land trade Collective land trade
Benefit-Cost Ratio 1.63 1.63 1.64
Net Present Value ($’000s) 2,369 2,387 2,384
Net Cash Flow ($/ha) 5,998 6,015 6,024
Table 7.Cost of community basin with land trade or land purchase as a % of on-farm basin cost
Basin type Scenario Farm 2 Farm 3 Farm 7 Farm 5 Total
On-farm Status quo $65,370 $62,090 $58,466 $43,810 $229,736
Community basin 3 - Purchased land at Site A 142% 99% 100% 92% 110%
Community basin 2 - Collective land trade 93% 67% 82% 119% 88%

Results and Discussion
17
The drainage transportation cost to Farms 2 and 3 increased by 34 and 19%,respectively, when locating a community basin in Farm 6. Whilst the cost toFarm 5 decreased by 42 percent (mainly due to decrease in transportationcost), the cost to Farm 7 remained unaffected. The overall effect ofpurchasing additional land has increased the total cost (all farms) of acommunity basin by 22%, of which the drainage transportation costconstituted 7%.
The implications of these results are that there is a direct effect of purchasingadditional land for a community basin on the cost incurred to each farm.However, there is additional benefit to the farms due to extra land available,equal to the land purchased for the community basin. The trade off betweenthese depends on the cost of the new land purchased and its developmentcost.
CSIRO Land and Water Technical Report 14/00
0
50000
100000
150000
200000
250000
300000
Farm 2 Farm 3 Farm 7 Farm 5 All farms
Basin
cost ($
)On-farm
Scenario 3
Scenario 2
Figure 6.On-farm vs community basin (purchased land and land trade)
- Purchased land
- Land trade

COST COMPARISONS - CASE STUDIES OF THE MIA AND WA KO O L
18 CRC for Catchment Hydrology Report 00/8
Table 8 shows the effect of a community basin on the financial viability ofgrapevines with land purchase. The results show that there are again onlyminor effects on farm viability between on-farm or community basins.
4.3.3 Spatial comparisons
The extent of variability in community basin costs due to siting differencesare given in Table 9. The cost of community basin was about 9% higher onaverage for Scenario 3 (site A), and about 14% higher on average for Scenario5 (site B). This marginal cost difference was attributed to differences indrainage transportation cost.
The financial profitability of grapes having a community basin again changedonly marginally compared to on-farm basins, Table 10.
Table 8. Financial viability of grapevines under purchased land and land trade scenarios
Items On-farm Community basin
Purchased land Collective land trade
Benefit-Cost Ratio 1.63 1.66 1.64
Net Present Value ($’000s) 2,369 2,597 2,384
Net Cash Flow ($/ha) 5,998 6,107 6,024
Table 9.Comparison of on-farm basin cost with community basin sited at different locations
Basin type Scenario Farm 2 Farm 3 Farm 7 Farm 5 Total
On-farm Status quo $65,370 $62,090 $58,466 $43,810 $229,736
Community basin 3 - Purchased land at Site A 142% 99% 100% 92% 110%
Community basin 5 - Purchased land at Site B 116% 102% 100% 141% 113%
Table 10.Financial profitability of a community basin sited at different locations
Items On-farm Community basin
Purchased land Site A Purchased land Site B
Benefit-Cost Ratio 1.63 1.66 1.66
Net Present Value ($’000s) 2,369 2,594 2,595
Net Cash Flow ($/ha) 5,998 6,107 6,103
Results and Discussion
19
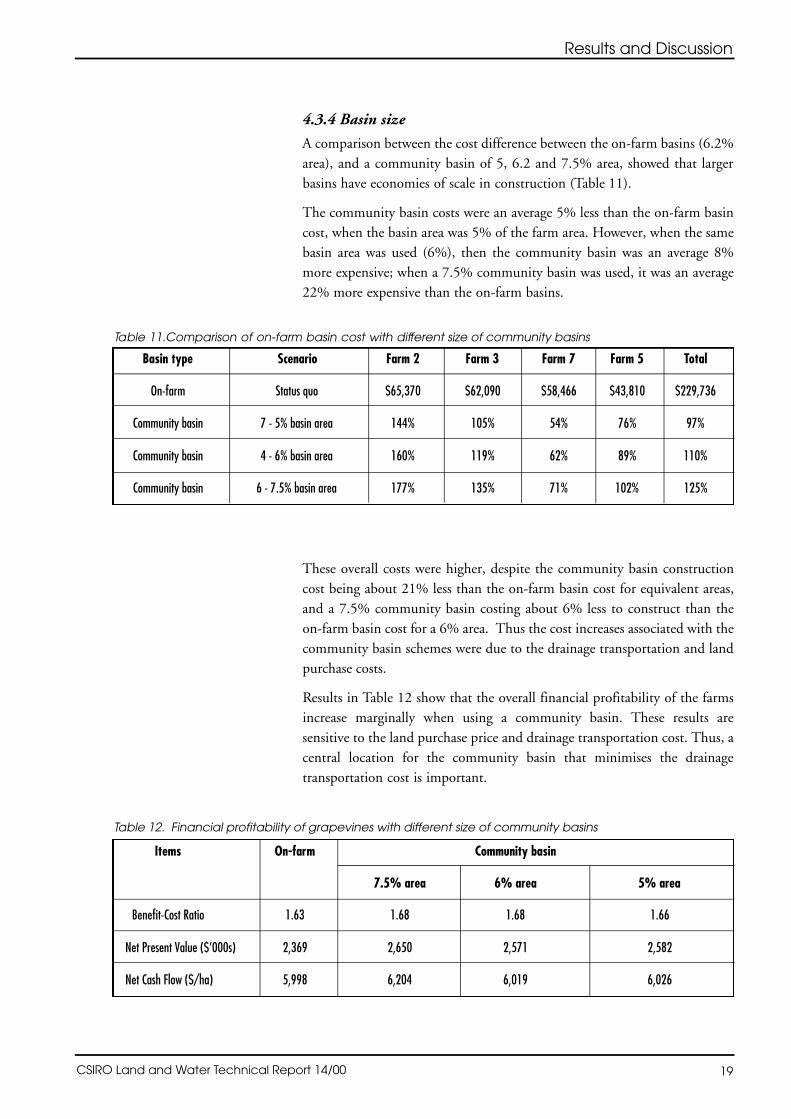
4.3.4 Basin size
A comparison between the cost difference between the on-farm basins (6.2%area), and a community basin of 5, 6.2 and 7.5% area, showed that largerbasins have economies of scale in construction (Table 11).
The community basin costs were an average 5% less than the on-farm basincost, when the basin area was 5% of the farm area. However, when the samebasin area was used (6%), then the community basin was an average 8%more expensive; when a 7.5% community basin was used, it was an average22% more expensive than the on-farm basins.
These overall costs were higher, despite the community basin constructioncost being about 21% less than the on-farm basin cost for equivalent areas,and a 7.5% community basin costing about 6% less to construct than theon-farm basin cost for a 6% area. Thus the cost increases associated with thecommunity basin schemes were due to the drainage transportation and landpurchase costs.
Results in Table 12 show that the overall financial profitability of the farmsincrease marginally when using a community basin. These results aresensitive to the land purchase price and drainage transportation cost. Thus, acentral location for the community basin that minimises the drainagetransportation cost is important.
CSIRO Land and Water Technical Report 14/00
Table 11.Comparison of on-farm basin cost with different size of community basins
Basin type Scenario Farm 2 Farm 3 Farm 7 Farm 5 Total
On-farm Status quo $65,370 $62,090 $58,466 $43,810 $229,736
Community basin 7 - 5% basin area 144% 105% 54% 76% 97%
Community basin 4 - 6% basin area 160% 119% 62% 89% 110%
Community basin 6 - 7.5% basin area 177% 135% 71% 102% 125%
Table 12. Financial profitability of grapevines with different size of community basins
Items On-farm Community basin
7.5% area 6% area 5% area
Benefit-Cost Ratio 1.63 1.68 1.68 1.66
Net Present Value ($’000s) 2,369 2,650 2,571 2,582
Net Cash Flow ($/ha) 5,998 6,204 6,019 6,026

COST COMPARISONS - CASE STUDIES OF THE MIA AND WA KO O L
20 CRC for Catchment Hydrology Report 00/8
Drainage transportation is a major component of the total cost of acommunity basin. The critical pipe length indicates how far away acommunity basin can be sited such that the community basin cost is equal tothe on-farm basin cost for any farm. Beyond this point, any increase in pipelength increases the cost of a community basin above that of an on-farmbasin. The critical pipe length provides a method of comparing the costs ofon-farm and community basins with regard to basin siting.
Algebraically critical pipe length (CPL) can be expressed as:
CPL = (Py - Px) / Pp
Where, CPL is the critical pipe length in metres
Py is the cost per ML of drainage per year of a community basin
Px is the cost per ML of drainage per year of an on-farm basin
Pp is the cost per ML of drainage per meter of pipe
The critical pipe length is an inverse function of the difference between thecommunity basin and on-farm basin construction cost. Table 13 showscritical pipe lengths for different scenarios.
4.4Critical Pipe Length
Table 13. Trade off between drainage water transportation and basin cost
Scenario Farm On farm basin Community basin Transport cost Critical pipe length (m)
2 2 46 32 0.02 700
(Land trade) 3 50 30 0.08 250
7 91 72 0.11 173
5 62 39 0.03 767
3 2 46 36 0.02 500
(Site A) 3 50 34 0.03 533
7 91 77 0.10 140
5 62 59 0.09 33
5 2 46 36 0.02 500
(Site B) 3 50 34 0.03 533
7 91 77 0.09 156
5 62 59 0.03 100
($/ML/Year) ($/ML/Year) ($/ML/Year)

Results and Discussion
21
In Scenario 2, where the cost of a community basin is relatively lower thanthe other cases, the critical pipe length allowable for each farm is greater dueto a larger cost difference between the community and on-farm basin.
Figure 9 gives the relationship between the price of pipe (dependent uponpipe diameter) and critical pipe length. Each curve represents the relationshipbetween drainage transportation cost and pipe length, i.e. where the cost ofa community basin is equal to the on-farm basin cost. The different curvesrepresent the cost of on-farm basin disposal to the individual farm.
CSIRO Land and Water Technical Report 14/00
0
250
500
750
1000
1250
1500
1750
2000
2250
2500
0.01 0.02 0.03 0.04 0.05 0.06 0.07 0.08 0.09 0.1 0.11 0.12
Drainage transportation cost ($/ML/m)
Pip
e length
(m
)
Farm 2 ($46/ha/year)
Farm 3 ($50/ha/year)
Farm 7 ($91/ha/year)
Farm 5 ($62/ha/year)
Figure 7.Relationship between drainage transportation cost and pipelengths for a community basin undercollective land trade
Transportation Cost and Basin Size - Wakool Basin Case Study
23CSIRO Land and Water Technical Report 14/00
5. Transportation Cost and Basin Size- Wakool Basin Case Study
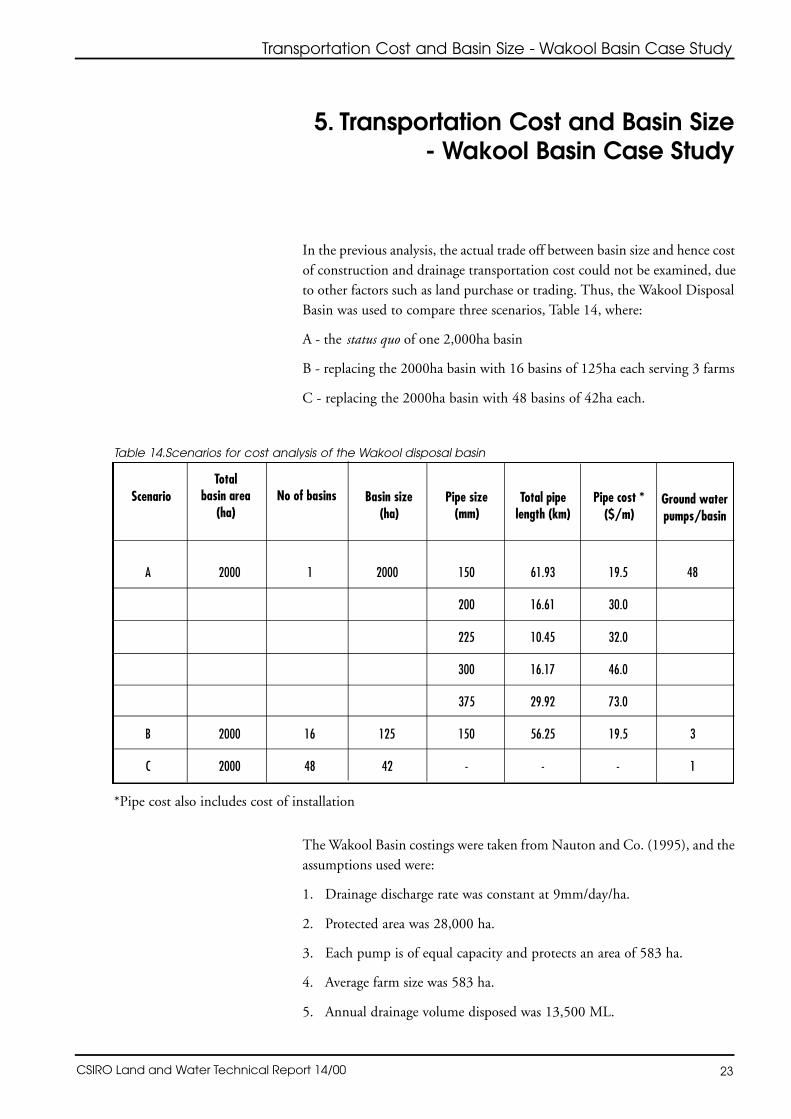
In the previous analysis, the actual trade off between basin size and hence costof construction and drainage transportation cost could not be examined, dueto other factors such as land purchase or trading. Thus, the Wakool DisposalBasin was used to compare three scenarios, Table 14, where:
A - the status quo of one 2,000ha basin
B - replacing the 2000ha basin with 16 basins of 125ha each serving 3 farms
C - replacing the 2000ha basin with 48 basins of 42ha each.
The Wakool Basin costings were taken from Nauton and Co. (1995), and theassumptions used were:
1. Drainage discharge rate was constant at 9mm/day/ha.
2. Protected area was 28,000 ha.
3. Each pump is of equal capacity and protects an area of 583 ha.
4. Average farm size was 583 ha.
5. Annual drainage volume disposed was 13,500 ML.
Table 14.Scenarios for cost analysis of the Wakool disposal basin
A 2000 1 2000 150 61.93 19.5 48
200 16.61 30.0
225 10.45 32.0
300 16.17 46.0
375 29.92 73.0
B 2000 16 125 150 56.25 19.5 3
C 2000 48 42 - - - 1
*Pipe cost also includes cost of installation
ScenarioTotal
basin area(ha)
No of basins Basin size(ha)
Total pipelength (km)
Pipe cost *($/m)
Ground waterpumps/basin
Pipe size(mm)

COST COMPARISONS - CASE STUDIES OF THE MIA AND WA KO O L
24 CRC for Catchment Hydrology Report 00/8
6. Geotechnical investigation cost of the 2,000 ha community basin is anextrapolated figure, based on the 20 and 200 ha basin costs in Singh andChristen (1999).
7. The square basin was divided into 100 cells of 20 ha.
8. Open drains were used to intercept lateral leakage.
9. Pump cost is a revised value from the initial 1975 estimates to 1997-98dollars.
10. In Scenario B, the basins are located equidistant from each pump.
11. No drainage transportation cost is involved in Scenario C.
12. Annual operation and maintenance cost value was set at 2% of the totalcapital cost.
13. Analysis was based on 30 year basin design life with a 7% discount rate.
Table 15 shows the relationship between the number and size of basins andcosts. The results show that the basin construction cost increases withincreasing basin numbers, and hence decrease in basin size; the drainagewater transportation cost increases with increase in basin size and hencereduced basin numbers.
This analysis also indicates the importance of achieving a balance betweensize and location of basins (Table 16). A comparison between Scenarios Aand B shows that the increase in construction cost was lower than the declinein transportation cost as the number of basins increased from 1 to 16, whichmakes Scenario B more attractive than Scenario A in terms of cost saving.However, as the number of basins increased from 16 to 48 in Scenario C, theincrease in construction cost was larger than the decline in transportationcost, which makes Scenario C more expensive.
Table 15. Total cost of a basin under all scenarios ($,000s)
Costs Scenario A Scenario B Scenario C
Basin construction 13,122 15,922 18,539
Drainage water transportation 4968 1097 0
Ground water pumping 1791 1791 1791
Total cost 19,881 18,810 20,330
Net Present Cost 23,143 21,896 23,666
Net Present Cost/ha 11,572 10,948 11,832
Transportation Cost and Basin Size - Wakool Basin Case Study
25
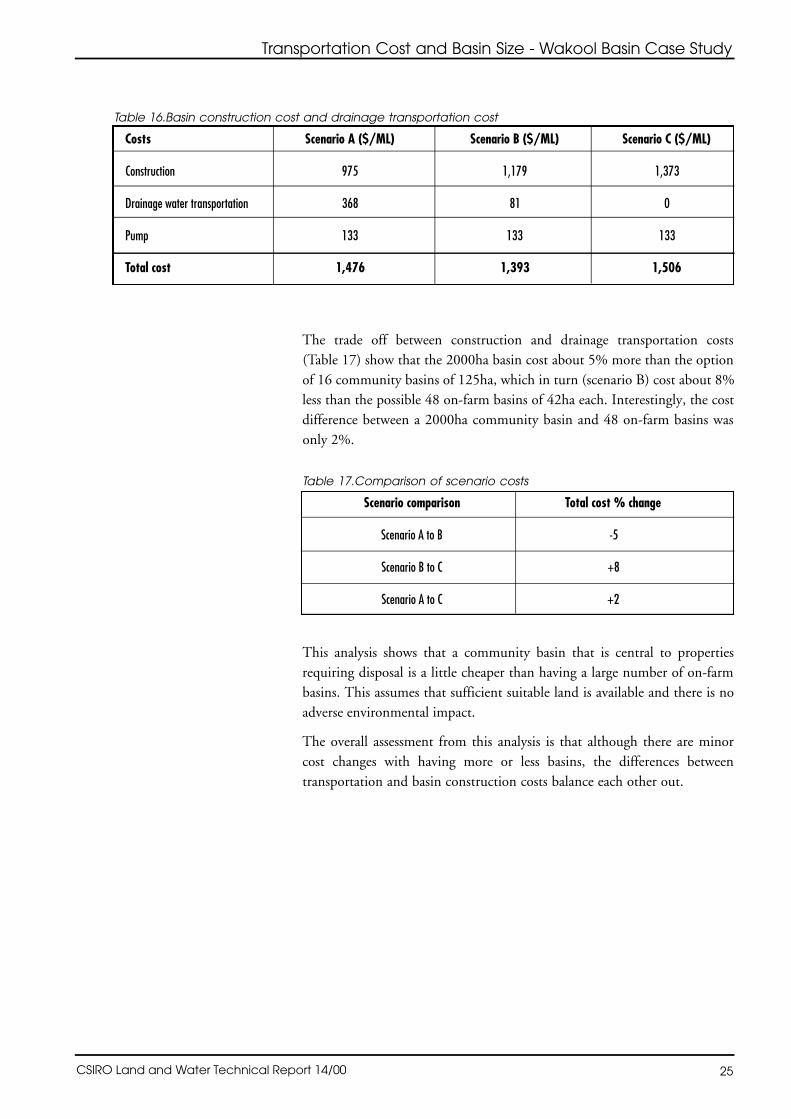
The trade off between construction and drainage transportation costs (Table 17) show that the 2000ha basin cost about 5% more than the optionof 16 community basins of 125ha, which in turn (scenario B) cost about 8%less than the possible 48 on-farm basins of 42ha each. Interestingly, the costdifference between a 2000ha community basin and 48 on-farm basins wasonly 2%.
Table 17.Comparison of scenario costs
Scenario comparison Total cost % change
Scenario A to B -5
Scenario B to C +8
Scenario A to C +2
This analysis shows that a community basin that is central to propertiesrequiring disposal is a little cheaper than having a large number of on-farmbasins. This assumes that sufficient suitable land is available and there is noadverse environmental impact.
The overall assessment from this analysis is that although there are minorcost changes with having more or less basins, the differences betweentransportation and basin construction costs balance each other out.
CSIRO Land and Water Technical Report 14/00
Table 16.Basin construction cost and drainage transportation cost
Costs Scenario A ($/ML) Scenario B ($/ML) Scenario C ($/ML)
Construction 975 1,179 1,373
Drainage water transportation 368 81 0
Pump 133 133 133
Total cost 1,476 1,393 1,506

6. Conclusions
These analyses were conducted for a case study area in the MIA with on-farmbasins and tile drainage, and for the Wakool scheme with groundwaterpumping. Thus, these conclusions should be regarded as those from a verylimited set of studies.
Community basins have lower construction costs than those of an equivalentarea of on-farm basins; however a community basin may need to be largerthan the sum of the on-farm basin areas due to decreased disposal capacity.
Drainage water needs to be transported to a community basin, usuallythrough a pipe network. This drainage transportation cost is large and,depending upon the siting of the community basin, may outweigh the costsavings in basin construction, making the overall scheme more expensivethan having on-farm basins.
Financial gains to farms from using a community basin on purchased landare likely to be from the reduction in basin construction cost (due toeconomies of scale) and increase in crop production due to the additionalland available. However, this is provided cheap land is available nearbywithout significant developmental costs.
The cost of disposal to a community basin to individual farms in a drainagescheme can vary considerably. In some cases the cost to an individual farm ofusing a community basin is greater than the cost of an on-farm basin, evenwhen the overall community basin scheme is cheaper. This may lead toinequity, and raises the need for careful consideration of cost sharing options.
Ideally a community basin should be designed, sited and managed such thatall farms share the costs and benefits equally. This is unlikely to ever be thecase. There are three main sets of costs associated with a community basin:basin construction, pipeline construction and operation/maintenance.Allocation of the basin construction cost is probably most fairly distributedon the basis of the area of each farm served by subsurface drainage. Thepipeline construction cost to transport the saline drainage water to thecommunity basin could be allocated on the actual cost to each farm, in whichcase farms further away from the basin will pay more than farms close to thebasin. This has the advantage that it may somewhat compensate those closestto the basin for any real or perceived disadvantages to having a basin locatedclose by. It may also help overcome objections from local landholders whentrying to determine the site for a community basin. However, those furtheraway may feel disadvantaged by this method of cost allocation, in which casethe total cost for the pipeline construction cost could be distributed on the
Conclusions
27CSIRO Land and Water Technical Report 14/00

COST COMPARISONS - CASE STUDIES OF THE MIA AND WA KO O L
28 CRC for Catchment Hydrology Report 00/8
basis of the drained area on each farm. The operation and maintenance costof a community basin should ideally be distributed on the basis of individualdrainage volumes. This will encourage careful water management tominimise drainage volumes from each farm. Measuring the actual watervolumes may be impractical in some cases, such as those where groundwaterpumps serve more than one farm. In this case, it may be possible to allocatedrainage volumes on the basis of water balance estimates for each individualfarm. All the suggested charging methods above assume a similar level ofservice at each farm; this may not be the case. With groundwater pumpingthe level of service may vary markedly, in which case charges may be leviedon the basis of the level of watertable drawdown on each farm.
The results of the financial analyses for individual farms under all thedifferent scenarios indicated that there are only marginal differences in farmviability using community or on-farm basins. This result will probably varyregionally depending upon the drainage system and crops. However, it doesindicate that financial considerations may not be the key consideration whenchoosing between on-farm or community basins. Social and environmentalconsiderations may be much more important.
The critical pipe length provides a potential method for determining at whatdistance from a community basin a farm is better off using an on-farm basin.
The trade off between drainage transportation cost and basin size indicatesthat a community basin should be large enough to achieve a balance betweenincreasing drainage transportation cost and reduced basin construction cost.

References
29
7. References
1. Moll, J. and Christen, E. (1996). Financial evaluation of options formanaging tile drainage water to meet environmental constraints. CSIRODivision of Water Resources, Griffith (NSW). Technical Memorandum96.20.
2. Nauton, D. and Co. (1995). Wakool land and water management planeconomic survey. Terms of reference 3 and 4: Evaluation of WakoolTullakool subsurface drainage scheme. Final Report.
3. Singh J. and Christen, E.W. (1999). Minimising the cost of basins:siting, design and construction factors. CSIRO Land and Water, Griffith(NSW). Technical Report 12/99 and CRC for Catchment HydrologyReport 00/5.
4. Singh J. and Christen, E.W. (2000). Effects of basins on the financialviability of subsurface drainage for grapevines and citrus in the MIA.CRC for Catchment Hydrology Report 00/4 and CSIRO Land andWater Technical Report 13/00.
5. Wine Grape Marketing Board (1997). Annual Report, Wine GrapesMarketing Board, Griffith.
CSIRO Land and Water Technical Report 14/00

Appendix 1
31
Appendix 1
CSIRO Land and Water Technical Report 14/00
Table A1. Variables considered for financial analysis of community basin

COST COMPARISONS - CASE STUDIES OF THE MIA AND WA KO O L
32 CRC for Catchment Hydrology Report 00/8
Table A2. Variables included in different scenarios (Scenarios are grouped as dicussed in the report).
Variables Community Basin Scenario 1 Community Basin Scenario 2
Variables Community Basin Scenario 3 Community Basin Scenario 5

Appendix 1
33CSIRO Land and Water Technical Report 14/00
Variables Community Basin Scenario Community Basin Scenario Community Basin Scenario4 6 7
Variables Cont...