cost-effective early childhood development programs: a
TRANSCRIPT
Cost-Effective Early Childhood Development Programs:
A Synthesis of Evidence in the First Decade of Life
Arthur J. Reynolds, Judy A. Temple, and Barry A. White
University of Minnesota
Running head: ECD programs
Abstract
In recent years, greater attention has been given to promoting child well-being throughout the entire
period of early childhood. We summarize evidence on the effects and cost-effectiveness of early
childhood development programs from birth to age 10. Findings from17 estimates of 16 programs
were emphasized. Birth to age 3 interventions including nutritional education and home visitation
show family, health and social benefits ranging from $1 to $5 per dollar invested. Participation in
preschool programs for 3 and 4-year olds has been found to have relatively large and enduring effects
on child well-being. Across many studies, economic returns range from $2 per dollar invested to
over $10 per dollar invested with an average of $6. In kindergarten and the early school-age years,
programs that combine services across ages can enhance well-being. The Child-Parent Center
preschool to third grade program shows a return of $6 to $9 per dollar invested above and beyond
lesser intervention. Class size reductions beginning in kindergarten and social skills training show
evidence of positive effects with economic returns of $2 to $3 per dollar invested. Reading Recovery
and class size reductions after kindergarten show low cost-effectiveness. The causal mechanisms and
key principles for promoting enduring effects are described as well as future directions for cost-
effectiveness studies.
ECD programs 3
The positive effects of early childhood development (ECD) programs on well-being have
been documented in hundreds of studies and reviews since the 1960s (Karoly et al., 2005; Reynolds,
Wang, & Walberg, 2003; Zigler, Gilliam, & Jones, 2006). Advances in scientific knowledge have
contributed not only to the establishment of early childhood programs but have helped spur recent
expansion of programs and services in states and localities (Barnett et al., 2007; Gormley, 2007;
Reynolds & Temple, 2008; Zigler et al., 2006). Increased attention to the early years of life also has
sparked greater interest in the transition to school and the experiences in the early grades that can
reinforce preschool gains and strengthen school achievement (Bogard & Takanishi, 2005; Reynolds
et al., 2003). The creation of early childhood systems and practices that enhance the continuity of
development over the first decade of life is increasingly viewed as fundamental to shaping children’s
well-being.
Scope of Review
In this synthesis, evidence is presented on the effectiveness and cost-effectiveness of early
childhood development programs for the outcomes of school readiness, school achievement and
performance, and long-term life-course development. The primary focus is on birth to age 3,
preschool or prekindergarten programs for 3- and 4-year-olds and early school-age programs
including preschool to-third grade programs (PK-3) and practices. Three major questions are
addressed:
1. What are the effects and economic benefits of ECD programs implemented in the first
decade of children’s life?
2. Is there consistent evidence of comparatively greater economic benefits by age or
intervention approach?
3. Which elements and principles of effectiveness are key to long-term effects?
We define ECD broadly to include the first decade of life, including prenatal and infancy,
early education and preschool, kindergarten, and early school-age programs. Although findings on
achievement and other short-term outcomes are reported, we emphasize the results of cost-benefit
analysis (CBA). There are three reasons for the focus on CBA.
ECD programs 4
First, economic benefits relative to costs are the most relevant indicator for policy
development. The value of public investments can be judged, at least in part, on efficiency
(Heckman, 2000). This is especially true in a time of scarce resources for educational and social
programs. Second, in the economic-benefit approach, program effects on multiple outcomes can be
converted into the metric of dollars and cents (Levin & McEwan, 2001). Other metrics such as
standard deviation units or percent change cannot be used to assess cumulative effects, and they do
not account for costs to achieve benefits.
Finally, CBAs emphasize longer-term effects of programs and practices. A focus on
immediate and shorter-term effects, while an important first step, is not the ultimate program goal.
Longer-term effects are a major focus of early childhood programs. A major question for social
policy is whether short-term effects translate into long-term effects of adaptive life skills and
behavior.
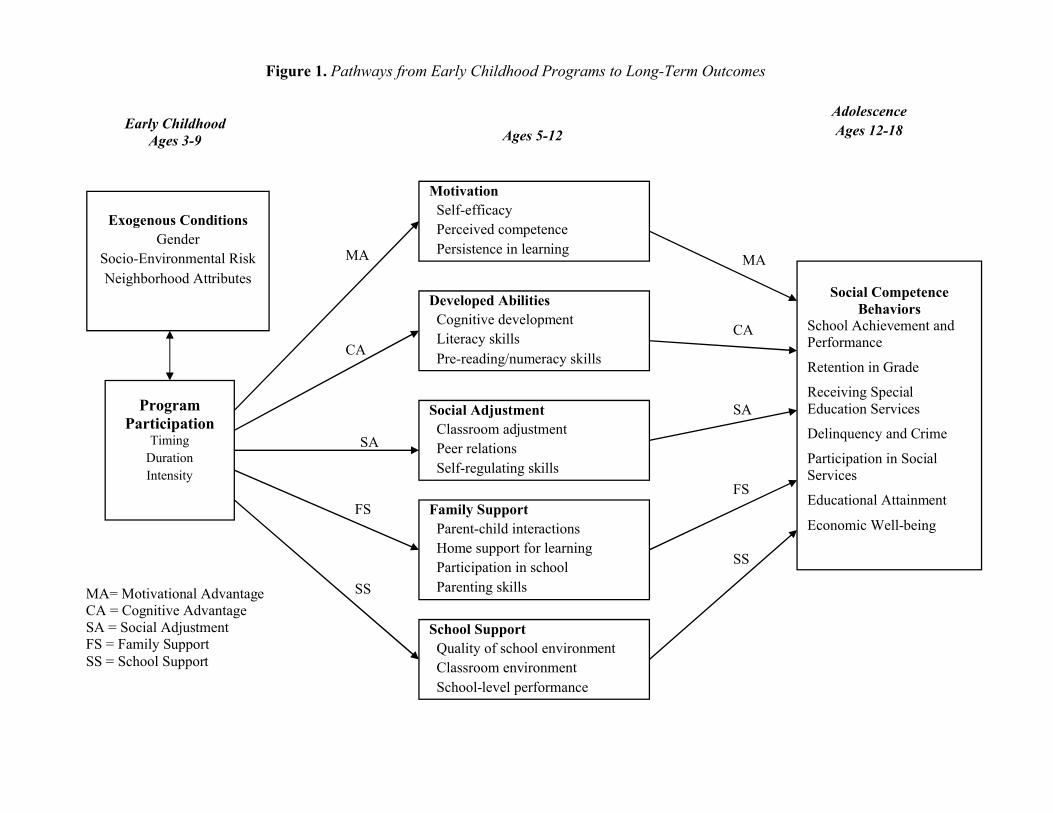
How Early Childhood Development Programs Influence Outcomes
Considerable research has documented that ECD programs impact later well-being through at
least one of five processes or pathways (Reynolds, 2000; Reynolds et al., in press; Reynolds, Ou &
Topitzes, 2004; Schweinhart et al., 1993). These can be viewed as the “active” ingredients of impacts
on child development. They have been conceptualized from the beginning of research on early
learning programs as primary mechanisms (Bronfenbrenner, 1975; Zigler & Berman, 1983). As
shown by the five-hypothesis model in Figure 1, the cognitive advantage pathway, which indicates
that the longer-term effects of ECD programs are due primarily to the enhancement of cognitive
skills, including literacy, school readiness, language and numeracy.
__________________
Insert Figure 1 here
__________________
The family support pathway indicates that impacts on child outcomes derive from greater
parental investments in children’s development, such as greater parent involvement in education,
increased parenting skills, and greater resource supports for parents.
ECD programs 5
The school support pathway suggests that longer-term effects would occur to the degree that
post-program school experiences reinforce learning gains. Enrollment in higher-quality schools and
schools with positive learning environments would strengthen or maintain learning gains while
enrollment in schools lower in quality would neutralize earlier learning gains.
The social adjustment and motivational advantage hypotheses indicate that noncognitive
skills can be the mechanism of effects of ECD programs, such as increased classroom and peer social
skills, positive teacher-child relationships, achievement motivation, and school commitment. The
greater the magnitude of effect of program experiences on a particular pathway or multiple pathways,
the more likely that enduring effects would occur.
Notably, programs that provide comprehensive services would be expected to impact several
of the pathways simultaneously. This is one explanation for why comprehensive programs have been
found to be more likely to have longer-term effects. This principle as well as intensity and dosage are
consistent with ecological (Bronfenbrenner, 1989; Bronfenbrenner & Morris, 1998) and human
capital (Becker, 1964; Heckman, 2003) theories of development and learning.
Cumulative Evidence of Effects
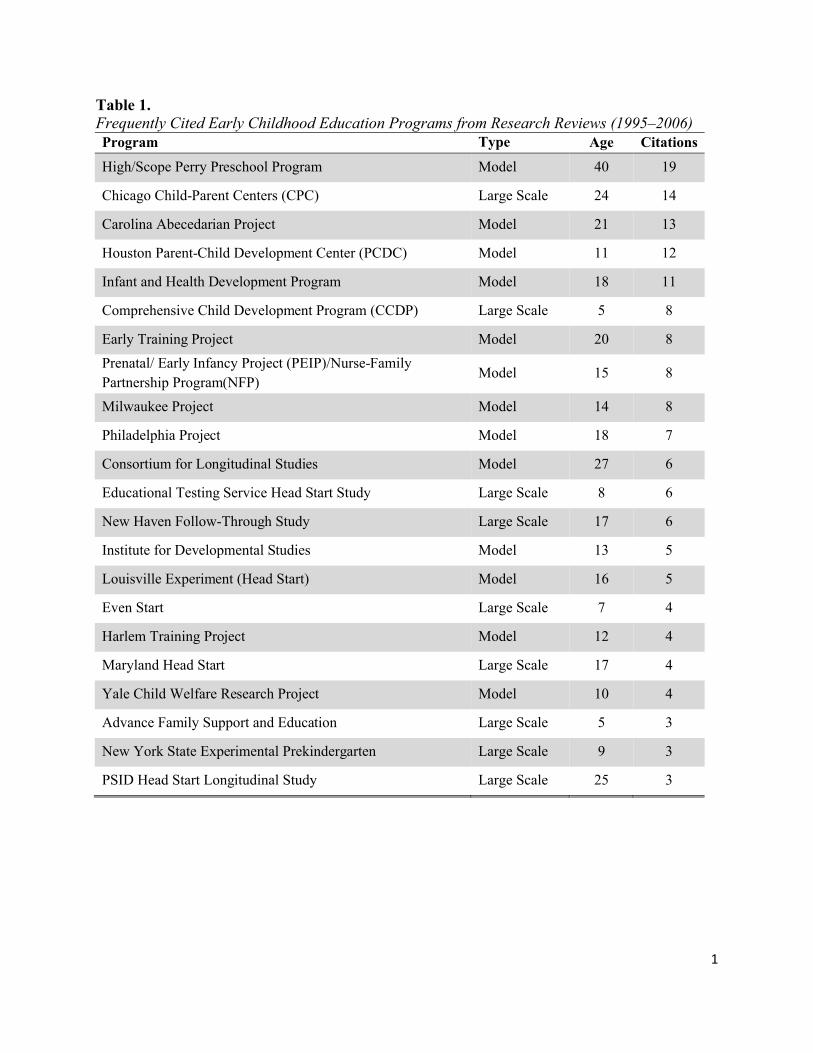
Given the size of the knowledge base, the effects of ECD programs are summarized through
findings from 19 reviews of impacts published in the past decade (1995-2006; Reynolds & Temple,
2008). These reviews were selected as among the most thorough in assessing short- and longer-term
effects of both model and large-scale programs. Table 1 shows the most frequently cited programs
demonstrating beneficial effects along with the last age of follow-up. Two major conclusions are
evident. First, many programs have assessed long-term effects into adulthood. Three quarters of the
reviews reported effects at 5 or more years after the end of participation. This is rare for social
programs and indicates that impacts on life course development and economic benefits can be
accurately assessed. Second, the accumulated evidence includes both model programs, developed for
research demonstration, and large-scale programs, developed for routine implementation by schools
and other institutions. Consequently, the generalizability of the evidence for policy recommendations
is much stronger today than a decade ago.
ECD programs 6
________________
Insert Table 1 here
________________
What are the main findings of the reviews? Of the hundreds of studies synthesized (see also
Karoly et al., 2005; Gormley, 2007; Zigler et al., 2006), there is substantial evidence that ECD
programs for mostly children at risk, positively impact cognitive skills, school achievement, social
and emotional development as well as educational attainment, employment, and later social behavior.
The average effect size on cognitive skills at or near school entry was 0.42 standard deviations (sd),
which is roughly equivalent to one-half of a year of growth associated with participation. Average
effects were also statistically and practically significant for social and emotional development (.24
sd), school achievement (.35 sd), delinquency and crime (-.22 sd), grade retention (-.21 sd), special
education (-.46 sd), school completion (.27 sd), and employment and earnings (0.37 sd). Because a
number of these significant outcomes can be translated to dollar terms, CBA is well-suited for
analyzing the net benefits to society of these programs.
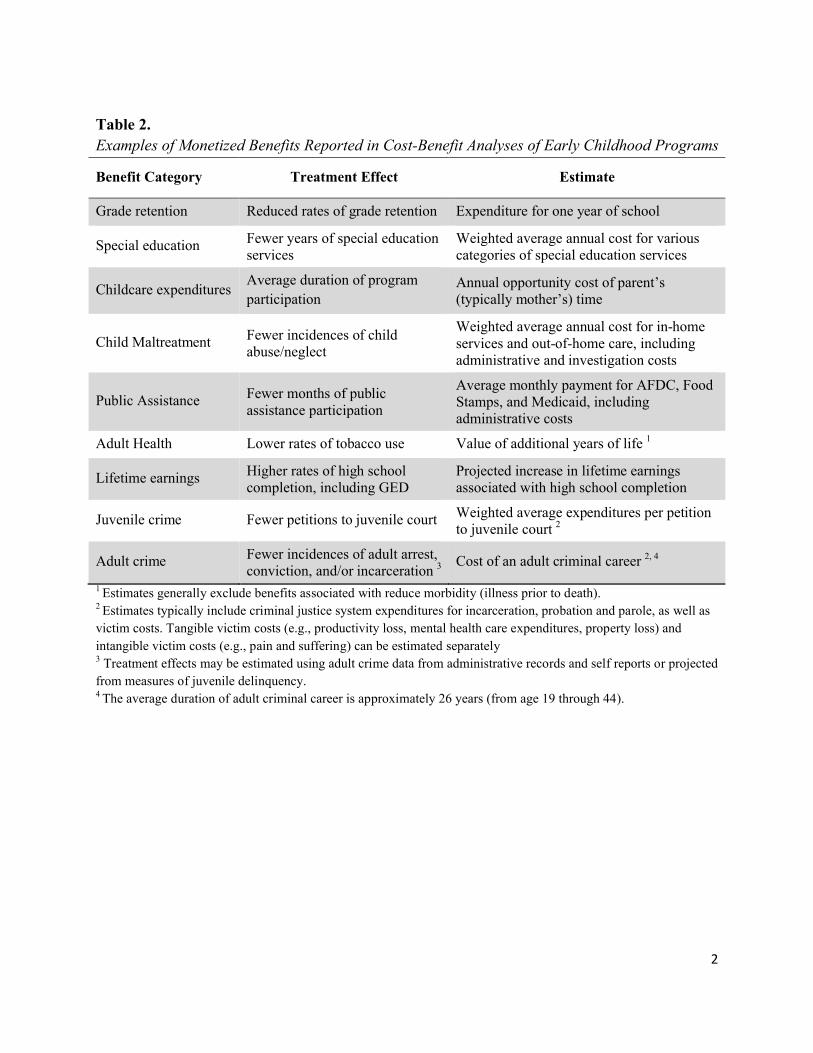
Cost-Benefit Analysis in ECD Programs
CBA is an economic approach for estimating the value of alternative programs and policies
relative to costs. Levin and McEwan (2001) define CBA as the “evaluation of alternatives according
to their costs and benefits when each is measured in monetary terms” (p. 11). Program and
intervention investments can be ranked according to their effectiveness per dollar of expenditure.
The most frequently used outcome measures in CBA and their data sources are shown in Table 2.
________________
Insert Table 2 here
________________
CBA is a major departure from traditional measures of effect size, such as the d statistic and
percentage change metrics, which take into account only program effects while ignoring their costs.
Growth in economic analysis of ECD programs is due to the identified long-term effects in many
studies, and to attention to translating evidence for public policy decisions (Duncan & Magnuson,
2007; Temple & Reynolds, 2007). To illustrate estimation, relative to the control group, participants
ECD programs 7
in the Child-Parent Center (CPC) preschool program spent an average of 0.7 fewer years in special
education from kindergarten to high school. The effect size is .29 standard deviations. This translates
to an average savings in special education of $5,317 per program participant (2007 dollars), which
was calculated by multiplying the program effect of 0.7 years by the average annual cost per child for
special education services above and beyond regular instruction for the school district in which they
were enrolled. and discounting the cost to age 3 by 3% annually (Reynolds et al., 2002).
The major advantage of CBA is that benefits for multiple outcomes can be summarized in
dollar terms, either the net return (benefits minus costs) or return per dollar invested (benefits divided
by costs). However, the ability to conduct a CBA depends on whether or not it is possible to reflect
program benefits in dollar terms. Researchers have a long tradition of estimating the benefits of
increased graduation rates and reductions in crime (Karoly et al., 1998). Often program budgets
contribute information used to create estimates of the benefits of reductions in services such as
special education or child welfare. It is more difficult to monetize the benefits of higher test scores or
problem behaviors because relatively few studies link test scores or behavior to the more monetizable
outcomes of higher future incomes or fewer crimes. When program outcomes cannot be easily
converted to monetary terms, cost-effectiveness analysis is recommended (see Levin & McEwan,
2001).
Evidence on Economic Benefits for Programs in Children’s First Decade
At a minimum, the economic return should equal the amount invested in the program--a
return of at least one dollar per dollar invested. Although not all program impacts can be translated to
economic benefits and many criteria of program “worth” should be considered, CBA findings are an
important metric of efficiency of investment.
Cost-benefit analyses illustrate the distribution of the benefits across different segments of
society. Benefits to participants are returned to the child and parent attending the program but do not
directly benefit others in society. These benefits include increased earnings capacity in adulthood
projected from educational attainment as well as the benefit to parents from the provision of part-day
care for children. Benefits to the general public include averted expenditures of remedial education
and social welfare spending by governments, reduced tangible expenditures to crime victims as a
ECD programs 8
result of lower rates of crime, and increased tax revenues to state and federal governments as a result
of higher earnings capacity. Benefits to society at large include the sum of benefits to program
participants and to the general public. While societal benefits frequently are emphasized, benefits to
the general public (not including the program participants) often are used to justify government
investment.
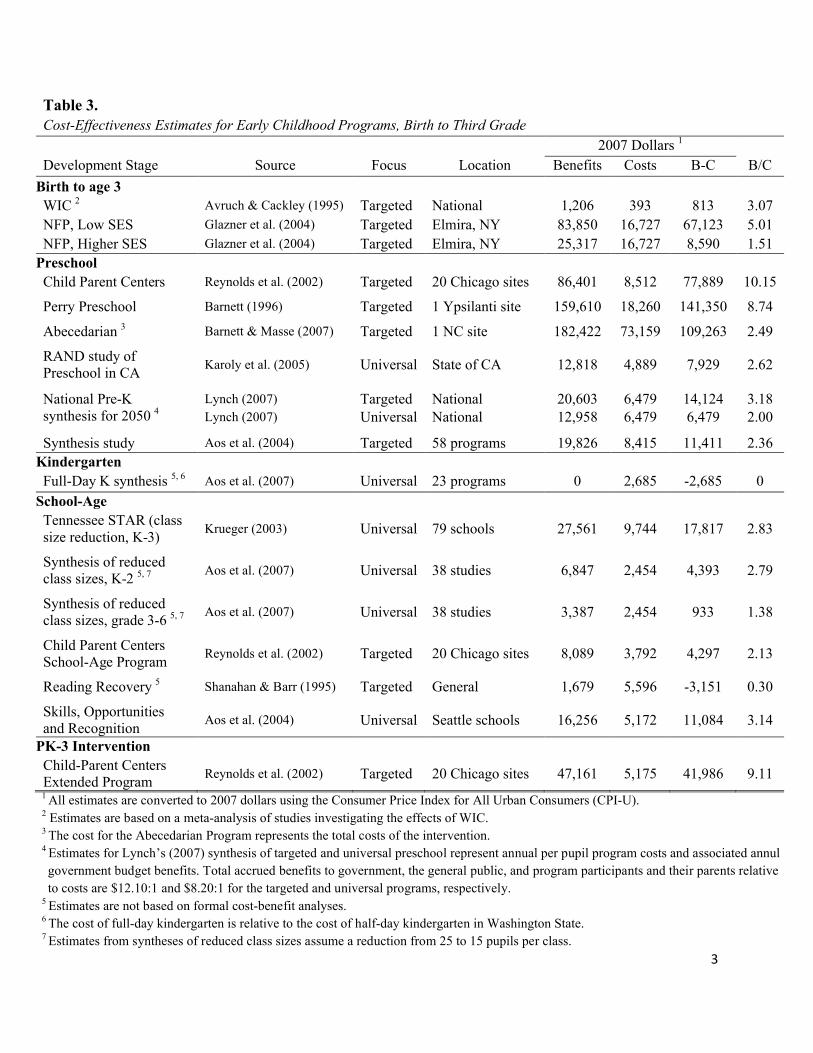
Below we summarize the societal benefits of programs that have conducted economic
analyses by age of program entry. 17 CBA estimates of 16 programs are included. For programs in
which there are multiple studies, the most representative and comprehensive estimates from a single
study are reported. Typically, these are from the research team of the program study. Table 3
provides a summary of the major findings.
_________________
Insert Table 3 here
_________________
Prenatal and Infant Programs
Home visitation, health, and child care programs in the earliest years of life are associated
with positive child development and parenting behaviors but few long-term behavioral effects have
been demonstrated (Reynolds, Mathieson, & Topitzes, 2009; Sweet & Applebaum, 2004). CBA
estimates are available for two prenatal and home visitation programs in the first three years. The
Special Supplemental Nutrition Program for Women, Infants, and Children (WIC) provides nutrition
education, referrals to social services, and a variety of food supplements to low-income families. A
meta-analysis of 15 studies in different states by Avruch and Cackley (1995) found that WIC
participation was associated with a 25% reduction in the rate of low birth-weight births, which
significantly reduced hospital costs paid by insurers in the first year of life. The economic return in
savings was estimated to be $3.07 per dollar invested. Devaney (in press) provides a broader review
of evidence on WIC, and suggests this return may be an upper bound.
The Nurse-Family Partnership (Olds et al., 1993) is an intensive nurse home visitation
program for young mothers having their first child. For the high-risk sample (unmarried and low-
income mothers having their first child), Glazner et al. (2004) found that participation from prenatal
ECD programs 9
development to age 2 was associated with lower rates of criminal behavior for both mothers and
target children, lower rates of substantiated child maltreatment, higher earnings capacity for the
mothers, and increased tax revenues projected into adulthood. The estimated economic return was
$5.01 for every dollar invested. For the lower-risk sample, the economic return was $1.51 per dollar
invested (See Karoly et al., 1998, 2005, for additional analyses yielding similar returns of $5.01 and
$1.10, respectively). Although no CBAs have been conducted for infant and child care programs with
extensive longitudinal data, including Syracuse Family Development Research Program, Houston
Parent-Child Development Center, and Infant Health and Development Program, the pattern of
findings are suggestive of lower economic returns than NFP (see Aos et al., 2004; Karoly et al.,
2005).
Center-based Preschool Programs
Although short- and longer-term effects have been documented for a large number of
programs for 3- and 4-year-olds (Gormley, 2007; Karoly et al., 2005), three studies have investigated
comprehensively life course impacts and economic returns into adulthood with strong research
designs and low attrition. The Child-Parent Centers (CPC), Carolina Abecedarian Project (ABC), and
the High/Scope Perry Preschool (PPP) all provided high quality educational enrichment to children at
risk in group settings characterized by small class sizes, a focus on language and cognitive skills, and
well-qualified and compensated teachers. ABC was the most intensive and lengthy, providing full-
day, year round care for five years (Campbell & Ramey, 1995; Campbell et al., 2002). PPP provided
the most established and organized curriculum, which followed the Piagetian principle of child-
initiated learning (Schweinhart et al., 1993). CPC provides the most comprehensive services by
implementing an intensive parent involvement component, outreach services, and attention to health
and nutrition (Reynolds, 2000; Reynolds et al., 2002). It also is the only program that became
established in public schools and is still in existence. The major long-term findings of the studies
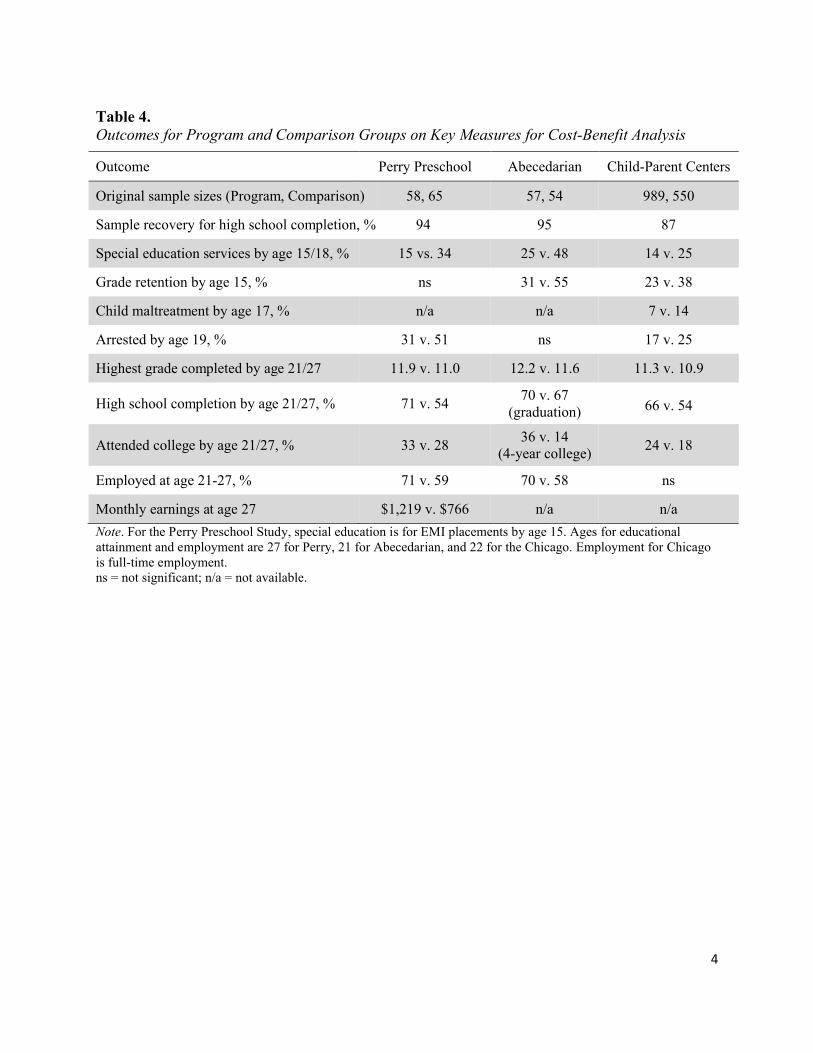
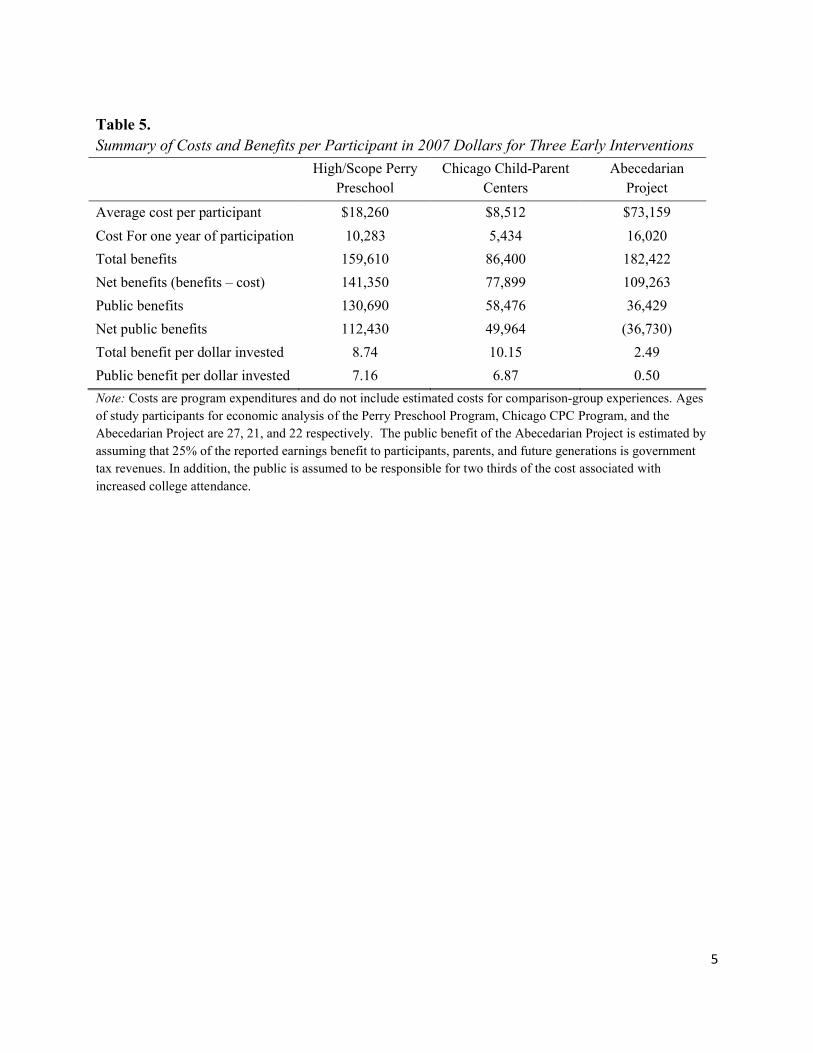
generating economic benefits are shown in Table 4 (see also Reynolds & Temple, 2008).
_______________________
Insert Tables 4 and 5 here
_______________________
ECD programs 10
As shown in Table 5, all three programs showed substantial economic returns into adulthood
through government savings in education, justice system, and health expenditures and in increased
economic well-being (Masse & Barnett, 2002; Reynolds et al., 2002; Schweinhart et al., 1993).
Although the costs are significantly different from each other, the returns of each program far
exceeded the initial investment. As a ratio of benefits to costs, all three programs showed a large
return on investment based on data collected into adulthood. The CPC program showed the highest
benefit-cost ratio at $10.15, in part reflecting its relatively lower costs. The lower costs are primarily
a result of a higher child to staff ratio in the classroom (8.5 to 1 versus less than 6 to 1 for PPP and
ABC).That a routinely implemented school-based program demonstrates positive returns indicates
that wide-scale programs can be cost-effective. PPP showed the highest net present value per child
(benefits minus costs) of $141,350 (see Belfield et al., 2006 and Schweinhart et al., 2005 for age 40
findings).
The consistent findings of the economic analyses of the PPP, CPC, and ABC, despite their
differences in approaches, are encouraging for the generalization of preschool effects. Nevertheless,
the participants of the three programs were almost exclusively low-income, African American
children. While there is no comparable evidence from studies of middle income families or from
more diverse samples, research on the short term effects of state-funded preschool programs, which
include more diverse samples by socioeconomic status and race/ethnicity, find positive impacts. For
example, effects sizes on school readiness (average of reading and math scores) of state
prekindergarten programs for 4-year-olds implemented from 2002 to 2006 in New Mexico,
Arkansas, New Jersey, and Oklahoma ranged from .26 to .58. These are statistically and
educationally meaningful (for details, see Reynolds & Temple, 2008).
Cost-Benefit Analyses from Policy Simulations
To estimate the economic benefits of high-quality but routinely implemented preschool
programs, several researchers have conducted cost-benefit simulations that either (1) modify
assumptions of existing cost-benefit analyses from longitudinal analyses of model programs such as
CPC or Perry programs or (2) make projections of benefits from predicted changes in educational
attainment, income, or criminal behavior using information from other studies that have shown
ECD programs 11
correlations between these adult outcomes and the observed short-term outcomes such as
achievement scores. These analyses indicate that more widely implemented preschool programs for
3- and 4-year olds would be likely to yield benefits that significantly exceed costs (also see Reynolds
& Temple, 2008).
Synthesizing short- and long-term data from 58 evaluation studies published from 1967 to
2003, Aos et al. (2004) estimated an economic return of $2.36 return per dollar invested for
preschool programs for low-income 3- and 4-year-olds. Karoly and Bigelow (2005) estimated
economic benefits of $2.62 per dollar invested (range of $2 to 4 dollars) for universal access to one
year of preschool education at age 4 in California.
A broader national analysis by Lynch (2007) used modified estimates from the cost-benefit
analysis of the CPC program (Reynolds et al., 2002) to generalize across states and in the country at
large. It was estimated that by the year 2050, a high quality targeted preschool program for 3- and 4-
year-olds would cost $6,479 (2007 dollars) per child and provide a return per tax dollar invested of
$3.18 in government budget savings alone. For a universal access program, the return per tax dollar
invested was estimated at $2.00 for government budget savings. Considering all societal benefits, the
long-range annual benefit per tax dollar invested was estimated at $12.10 for a targeted program and
$8.20 for a universal access program.
Full-Day Kindergarten
The effects of full-day kindergarten (FDK) compared to half-day kindergarten are well
documented. Many studies have examined achievement gains at the end of kindergarten and in the
early school grades. Aos et al. (2007) synthesized the results of 23 studies of FDK for academic
achievement. The studies included only those that were well documented and controlled. The average
effect size of FDK on achievement at the end of kindergarten was .18 standard deviations for all
children and .17 for economically disadvantaged children. This is equivalent to a 2-month
achievement gain.
This relatively small advantage largely disappeared by first grade and did not re-emerge later.
The average effect size was .01 at the end of first grade, .048 at second to third grade, and .00 at
fourth and fifth grade. Additional studies support this pattern (see Reynolds & Temple, 2008).

ECD programs 12
Although no formal cost-effectiveness studies have been done, the lack of long-term achievement
gains would be expected to yield a benefit-cost ratio close to zero.
Class Size Reductions
In the most extensive study of class size reduction, Project STAR in Tennessee
experimentally investigated the impact of enrollment in class sizes limited to 13 to 17 students from
kindergarten to third grade relative to enrollment in class sizes of 22 to 26 students with and without
teacher aides. A total of over 6,300 kindergarten students in 79 schools were included. Although one
or more years in small classes was associated with higher achievement in the short-term, longer-term
effects by eighth grade were found only for students with three or four years of reduced class sizes
(Finn et al., 2001). The three-year group had median effect sizes of .17 standard deviations in grades
4 to 8. The four-year group had median effects sizes of .25. Relative to control groups, only low-
income students with 3 or 4 years of small classes had higher rates of high school graduation (Finn et
al., 2005). Based on Krueger (2003), Project STAR was found to have an economic return of $2.83
per dollar invested in the program. The source of this benefit is an increase of 0.2 standard
deviations in test scores, which is associated with a 1.6% increase in adult earnings.
These findings are consistent with a synthesis of 38 studies of small classes (Aos et al.,
2007). Reducing class sizes in kindergarten through second grade was more cost-effective than
reducing class sizes in third through sixth grades, middle school, or in high school. A reduction from
25 to 15 students in kindergarten, for example, was found to increase achievement by .19 standard
deviations. Based on higher test scores, Aos et al. estimated that the economic return of small classes
in kindergarten through second grade was $2.79 per dollar invested and $1.38 for small classes in
third through sixth grades.
Additional evidence on small class sizes comes from the school-age program of the Child-
Parent Centers, of which the main program element was a reduction in class sizes from 35 to 1 to 25
to 2 (teacher and aide) during grades 1 to 3. The school age program also included instructional
resources to promote reading and math achievement and family support activities under the direction
of a program coordinator. The economic return for two years of school-age intervention was $2.13
per dollar invested (Reynolds et al., 2002).

ECD programs 13
Other School-Age Programs and Practices
Given their implications for cost-effectiveness, two additional ECD programs are covered.
The Skills, Opportunities and Recognition (SOAR) Program, formerly the Seattle Social
Development Project, is designed to promote social and emotional skills (Hawkins et al., 1999).
Starting in grade 1 and continuing to grade 6, the supplemental classroom-based program includes
cooperative, developmentally-appropriate teaching practices and optional parent education classes.
Six years after the end of the program, participants had greater attachment to school, higher
achievement test scores, and lower rates of delinquency, and lower rates of alcohol misuse. The
economic return was $3.14 per dollar invested.
Reading Recovery, an instructional tutoring program for first-grade students who are having
difficulty learning to read, provides 30 minutes of one-on-one daily instruction with a teacher outside
of the regular school class. Students in the bottom 20% in reading performance are enrolled in the
program. In more than 30 studies that have been conducted of Reading Recovery (D’Agostino &
Murphy, 2004), findings are generally consistent that the program increases participants reading
performance and helps close the gap with more typically performing students but the benefit is
reduced substantially by fourth grade. Although formal cost-benefit analyses have not been reported,
Shanahan and Barr (1995) estimated that the program would, at best, be expected to return about
30% (or $0.30 per dollar invested) of its costs through reductions in special education placement as a
consequence of the short-term achievement effects.
Preschool-to-Third Grade Programs
A key rationale for transition programs and practices in the early school-age years is that
elementary schools play an important role in sustaining the benefits of early childhood programs, and
a continuation of programs into the primary grades will promote successful transitions. Preschool-to-
third grade (PK-3) programs are the most comprehensive approaches for enhancing transitions and
promoting positive child development. Four extended early childhood programs have shown
evidence of positive effects on school achievement and child well-being above and beyond that of
preschool participation. These are the Head Start/Follow Through Program, National Head
Start/Public School Transition Demonstration Project, Abecedarian Project, and the Child-Parent
ECD programs 14
Center extended intervention program.
Only the CPC extended intervention program has been the subject of cost-benefit analysis.
Compared to participation in less extensive CPC services (0 to 3 years of intervention), the CPC
extended program returned $9.11per dollar invested through reduced remedial education and child
maltreatment, lower juvenile arrest for violence, and higher levels of educational attainment.
Exclusive of intangible crime victim savings, the return was $6.11 per dollar invested.
The school-age program alone demonstrated a return of $2.12 per dollar invested primarily
through participants requiring fewer remedial education services (Reynolds et al., 2002). The return
per dollar invested was $1.66 without intangible crime victim savings. The main components of the
school-age services were reduced class sizes, family services, and instructional support to
classrooms.
Summary of Benefits and Costs
In summary, findings show that most of the ECD investments are associated with positive
economic returns. This is illustrated in Figure 2 as the economic return per dollar invested for the
reviewed programs as a function of the age of entry into intervention. Age 0 corresponds with
prenatal development (WIC and NFP). Preschool programs for 3- and 4-year-olds have had the most
research, and generally show the highest returns from both cohort studies and economic simulations.
The variability of contexts, service systems, and curriculum philosophy strengthens this evidence.
Ratios ranged from $2 dollars per dollar invested to over $10 dollars per dollar invested. The
average return was $6 per dollar invested. Programs beginning prenatally or in early infancy ranged
from $1 to $5 returned per dollar invested and an average of $3 per dollar invested. Early school-age
programs varied substantially, with small classes and social skills training showing the highest
returns at $2 to $3 per dollar invested. The returns of small classes were highest for low-income
children enrolling for 3 or 4 years (Finn et al., 2005). Neither Reading Recovery or full-day
kindergarten have findings suggestive of cost-effectiveness. As further shown in Figure 2, the pattern
of findings based on net program benefits (benefits minus costs) is similar: preschool programs for 3-
and 4-year-olds show the largest benefits.
ECD programs 15
_________________
Insert Figure 2 here
_________________
A number of qualifications to these findings are notable. Relatively few studies of economic
benefits have been conducted , especially using program cohort studies. Consequently, the CBA
ratios do not necessarily define the benefits of particular intervention types (e.g., home visitation,
prenatal nutrition). Returns would be expected to vary by the quality of program implementation and
intensity of services as well as population characteristics.
Second, the assumptions and approaches to economic analyses varied considerably across
studies. This was especially true for length of assessments, scope of measured outcomes, and the
balance of projected versus actual benefits. Findings from WIC, for example, were based only on
medical savings in the first year of life linked to lower rates of low birth-weight births. Benefit
estimates for class size reductions, social skills training, and preschool policy simulations relied
almost exclusively on projections from shorter-term outcomes.
A third qualification is that the possible benefits of combining programs such as PK-3,
prenatal to preschool, and preschool and small classes in the early grades have not been fully
investigated. These and other synergies warrant further effectiveness and cost-effectiveness studies.
Interventions across ages should be viewed as complementary.
Finally, cost-effectiveness or CBA is one of many criteria for prioritizing programs for public
investment. Social importance, program cost, feasibility, and capacity for sustainability also are
important to consider in policy making.
Key Principles of Effectiveness of ECD Programs
Findings summarized in this review indicate that greater investments in high-quality ECD
programs can lead to positive long-term effects and economic returns. Since relatively large
percentages of children do not enroll in center based preschool programs (Barnett et al., 2007), and
the quality of services that many receive is not high, the cross-age programs we assessed provide
effective models to be used in the design of coordinated early childhood systems. As shown in
Figure 1, attention to the causal mechanisms of change also can strengthen program effectiveness.

ECD programs 16
The accumulated research suggests five major principles that can enhance the effectiveness of early
childhood development programs and to increase economic returns. These principles are consistent
with others in early childhood (Ramey & Ramey, 1998) and the broader prevention field (Durlak,
1997; Nation et al., 2003).
The first principle is that a coordinated system is in place no later than preschool and
continues to the early school grades. Implementation within a single administrative system in
partnerships with communities can promote stability in children’s learning environment which can
provide smooth transitions from preschool to kindergarten and from kindergarten to the early grades.
The three major preschool programs we reviewed were either housed in elementary schools or
provided continuity of services between preschool and formal schooling. This is a “first decade”
strategy of promoting child development. Today, most preschool programs are not integrated within
public schools and children usually change schools more than once by the early grades. The CPC
program, for example, was established in the third largest school system in the nation. Findings from
the cost-benefit analysis of a complete cohort of participants gives a good indication of the size of
effects that could be possible in public schools.
A second major principle of effective ECD programs is that the teaching staff should be
trained and compensated well, preferably with earned bachelor’s degrees, certification in early
childhood, and competitive salaries. It is no coincidence that most programs with high returns
followed this principle. Being located in public schools, the Perry and CPC programs were
implemented by teachers with at least bachelor’s degrees and appropriate certification in early
childhood. They were paid on the public school salary scale. NFP home visitors were public health
nurses. In the Abecedarian program, teachers were compensated at levels that were highly
competitive with public schools. In most other early education programs, from child care to Head
Start, staff do not have this level of education, training, and compensation, and turnover is
significantly higher.
Third, educational content should be responsive to children’s learning needs but special
emphasis should be given to cognitive and school readiness skills through a structured but diverse set
of learning activities. All of the cost-effective programs reviewed emphasized multiple domains of
ECD programs 17
child development within responsive and nurturing learning environments. Child to staff ratios of
less than 9 to 1 in center-based preschool help as well. Class size reductions were more beneficial if
they were large and continued for 3 or more years. The curriculum appeared to less important since
programs varied widely in approaches. Extrapolating these findings, early childhood and other social
programs are more likely to have enduring effects if they provide services that are intensive and are
dedicated to the enhancement of educational and social skills.
A fourth principle of effectiveness is that comprehensive family services should be provided
to meet the different needs of children. As child development programs, infant, preschool,
kindergarten, and school-age services must be tailored to family circumstances and provide
opportunities for positive learning experiences in school and at home. Those with special needs or
who are most at risk benefit from intensive and comprehensive services. Each of the cost-effective
programs provided family services. WIC and NFP provided prenatal nutrition and education.
Abecedarian provided medical and nutritional services. SOAR had family and instructional
activities. In the CPC program, parent involvement is more intensive. Each center has a parent
resource room run by a certified teacher and provides school-community outreach.
Finally, greater commitment to research on effectiveness and cost-effectiveness is needed.
Even today, cost-benefit analyses are rarely conducted. This state of affairs limits full consideration
of the effects of alternative programs. Paramount in conducting cost-benefit analyses is the
availability of longitudinal cohort studies that prospectively assess a wide variety of program benefits
using multiple sources of data. Only 4 of the studies we reviewed had these attributes and they are
most likely to accurately assess the total impact of participation. In addition, more studies are needed
that address differential effects across a range of child, family, and program attributes. This will
require larger sample sizes than those of most previous studies. Although less comprehensive than
cohort studies, research syntheses and economic simulations provide complementary evidence that
can strengthen generalizability of findings. The dissemination of cost-effective interventions also will
advance as registries of effective programs include costs and benefits as inclusion criteria. Most
registries treat such evidence as supplemental to study design and traditional effectiveness data
(Kellam & Langevin, 2003). Efficiency is a major goal to which all programs should subscribe.
ECD programs 18
References
Aos, S., Lieb, R., Mayfield, J., Miller, M. & Pennucci, A. (2004). Benefits and costs of
prevention and early intervention programs for youth: Technical appendix. Olympia, WA:
Washington State Institute for Public Policy.
Aos, S., Miller, M., & Mayfield, J. (2007). Benefits and costs of K-12 education policies:
Evidence-based effects of class size reductions and full-day kindergarten. Olympia, WA:
Washington State Institute for Public Policy.
Avruch, S., & Cackley, A. P. (1995). Savings achieved by giving WIC benefits to women
prenatally. Public Health Reports, 110, 27-34.
Barnett, W. S., Hustedt, J. T. et al. (2007). The 2006 State Preschool Yearbook. New Brunswick, NJ:
National Institute of Early Education Research.
Barnett, S. W. (1996). Lives in the balance: Age-27 benefit-cost analysis of the High/Scope
Perry Preschool Program. Ypsilanti, MI: The High/Scope Press.
Boardman, A. E., Greenberg, D. H., Vining, A. R., & Weimer, D. L. (2006). Cost-benefit
analysis: Concepts and practice. 3rd ed. Upper Saddle River, NJ: Pearson Education, Inc.
Bogard, K., & Takanishi, R. (2005). PK-3: An aligned and coordinated approach to education for
children 3 to 8 years old. Social Policy Report, XIX, No. III. Washington: Society for
Research in Child Development.
Becker, G. S. (1964). Human capital. New York: Columbia University Press.
Belfield, C. R., Nores, M., Barnett, S., & Schweinhart, L. (2006). The High/Scope Perry
Preschool program: Cost-benefit analysis using data from the age-40 follow-up. The
Journal of Human Resources 41, 162-190.
Bronfenbrenner, U. (1975). Is early intervention effective? In M. Guttentag & E. Struening
(Eds.), Handbook of evaluation research (Vol 2., pps 519-603). Beverly Hills, CA: Sage.
Bronfenbrenner, U. (1989). Ecological systems theory. Annals of Child Development, 6, 187-249
ECD programs 19
Bronfenbrenner, U., & Morris, P. (1998). Ecological processes of development. In W. Damon
(Ed.) Handbook of Child Psychology: Theoretical issues (Vol. 1, pp. 993-1028). New
York, NY: Wiley.
Campbell, F. A., & Ramey, C. T. (1995). Cognitive and school outcomes for high risk African-
American students at middle adolescence: Positive effects of early intervention.
American Educational Research Journal 32, 743-772.
Campbell, F. A., Ramey, C. T., Pungello, E. P., Sparling, J., & Miller-Johnson, S. (2002). Early
childhood education: Young adult outcomes from the Abecedarian Project. Applied
Developmental Science, 6(1), 42-57.
Currie, J. (2001). Early childhood education programs. Journal of Economic Perspectives 15,
213-238.
D’Agostino, J. V., & Murphy, J. A. (2004). A meta-analysis of Reading Recovery in United
States schools. Educational Evaluation and Policy Analysis 26, 23-38.
Devaney, B. (In press). WIC turns 35: Effectiveness and future directions. In A. Reynolds et al.,
(Eds), Human capital in early childhood development. New York: Cambridge University
Press.
Durlak, J. (1997). Successful prevention programs for children and adolescents.
New York: Plenum Press.
Duncan, G., & Magnuson, K. (2007). Penny wise and effect size foolish. Child Development
Perspectives, 1, 46-51.
Finn, J. D., Gerber, S. B., & Boyd-Zaharias, J. (2005). Small classes in the early grades:
Academic achievement and graduation from high school. Journal of Educational Psychology
97, 214-223.
Gormley, W. T. (2007). Early childhood care and education: Lessons and puzzles. Journal of Policy
Analysis and Management, 26(3), 633-671.
Glazner, J., Bondy, J., Luckey, D., & Olds, D. (2004). Effects of the Nurse Family
Partnership on government expenditures for vulnerable first-time mothers and their children
in Elmira, New York, Memphis, Tennessee, and Denver, Colorado. Washington, DC.:
ECD programs 20
Administration for Children and Families, U.S. Department of Health and Human Services.
Hawkins, J. D., Catalano, R. F., Kosterman, R., Abbott, R., Hill, K. G. (1999). Preventing adolescent
health-risk behaviors by strengthening protection during childhood. Archives of Pediatrics
and Adolescent Medicine, 153, 226-234.
Heckman, J. (2000). Policies to foster human capital. Research in Economics, 54, 3-56.
Heckman, J. (2003). Human capital policy. In J. Heckman & A. Krueger (Eds.), Inequality in
America: What role for human capital policy? Cambridge: MIT Press.
Hummel-Rossi, B., & Ashdown, J. (2002). The state of cost-benefit and cost-effectiveness
analyses in education. Review of Educational Research 72, 1-30.
Karoly, L. A., Kilburn, M. R., & Cannon, J. S. (2005). Early childhood intervention: Proven results,
future promise. Santa Monica, CA: RAND.
Karoly, L. A., Greenwood, P. W., Everingham, S. M. S., Hoube, J., Kilburn, M. R., Rydell, C.
P., et al. (1998). Investing in our children: What we know and don't know about the costs and
benefits of early childhood interventions. Santa Monica, CA: RAND Corporation.
Karoly, L. A., & Bigelow, J. H. (2005). The economics of investing in universal preschool
education in California. Santa Monica, CA: RAND Corporation.
Kellam, S. G., & Langevin, D. J. (2003). A framework for understanding evidence in prevention
research and programs. Prevention Science, 3, 137-153.
Krueger, A. B. (2003). Economic consideration and class size. The Economic Journal 113, F34-
F63.
Levin, H. M., & McEwan, P. J. (2001). Cost-effectiveness analysis: Methods and applications.
2nd ed. Thousand Oaks, CA: Sage Publications.
Lynch, R. G. (2007). Enriching children, enriching the nation: Public investment in high-quality
prekindergarten. Washington, DC. Economic Policy Institute.
Lynch, R. G. (2004). Exceptional returns: Economic, fiscal, and social benefits of investing in
early childhood development. Washington, DC: Economic Policy Institute.
Masse, L. N., & Barnett, W. S. (2002). A benefit cost analysis of the Abecedarian early
childhood intervention. New Brunswick, NJ: National Institute for Early Education Research.
ECD programs 21
Nation, M. et al. (2003). What works in prevention: Principles of effective prevention programs.
American Psychologist, 58, 449-456.
Olds, D. L., Henderson, C. R., Phelps, C., Kitzman, H., & Hanks, C. (1993). Effects of prenatal
and infancy nurse home visitation on government spending. Medical Care 31, 155-174.
Ramey, C. T., & Ramey, S. L. (1998). Early intervention and early experience. American
Psychologist,53, 109-120.
Reynolds, A. J. (2000) Success in early intervention: The Chicago Child-Parent Centers.
Lincoln, NE: University of Nebraska Press.
Reynolds, A. J., Mathieson, L., C., & Topitzes, J. W. (2009). Do early childhood interventions
prevention child maltreatment? A review of research. Child Maltreatment.
Reynolds, A. J., Englund, M., Schweinhart, L. J., Campbell, F. A., & Ou, S. (In press). Paths of
effects from preschool participation to educational attainment: A 3-study analysis. In A.
Reynolds et al., (Eds.) Human Capital in Early Childhood Development. New York:
Cambridge University Press.
Reynolds, A. J., Ou, S., & Topitzes, J. (2004). Paths of effects of early childhood intervention on
educational attainment and juvenile arrest: A confirmatory analysis of the Chicago Child-
Parent Centers. Child Development, 75, 1299-1328.
Reynolds, A. J., Temple, J. A., Robertson, D. L., & Mann, E. A. (2002). Age 21 cost-
benefit analysis of the title I Chicago Child-Parent centers. Educational Evaluation and
Policy Analysis 24, 267-303.
Reynolds, A. J., & Temple, J. A. (2008). Cost-effective early childhood development programs from
preschool to third grade. Annual Review of Clinical Psychology, 4, 109-139.
Reynolds A. J., Wang, M. C., & Walberg, H. J. (Eds.). (2003). Early childhood programs for a
new century. Washington, DC: CWLA Press.
Schweinhart, L. J., Barnes, H. V., & Weikart, D. P. (1993) Significant benefits: The High-Scope
Perry Preschool study through age 27. Ypsilanti, MI: High/Scope Press.
Schweinhart, L. J., Montie, J., Xiang, Z., Barnett, S. W., Belfield, C. R., & Nores, M. (2005).
ECD programs 22
Lifetime effects: The High/Scope Perry Preschool study through age 40. Ypsilanti, MI:
High/Scope Press.
Sweet, M. A., Appelbaum, M. I. (2004). Is home visiting an effective strategy? A meta-
analytic review of home visiting programs for families with young children. Child
Development, 75, 1435-1456.
Shanahan, T., & Barr, R. (1995). Reading Recovery: An independent evaluation of the effects
of an early instructional intervention for at-risk learners. Reading Research Quarterly 30,
958-996.
Temple, J. A., & Reynolds, A. J. (2007). Benefits and costs of investment in preschool
education: Evidence from the Child-Parent Centers and related programs. Economics of
Education Review 26, 126-144.
Temple, J. A., Reynolds, A. J., & White, B. A. (2007). Age 21 cost-benefit analysis of the Title I
Chicago Child-Parent Centers: Technical Report. Minneapolis, MN: University of
Minnesota. Available at: http://cehd.umn.edu/icd/cls/Publication.htm.
Zigler, E., & Berman, W. (1983). Discerning the future of early childhood intervention. American
Psychologist, 38, 894-906.
Zigler, E. F., Gilliam, W. S., & Jones, S. (Eds.). (2006). A vision for universal preschool
education. Cambridge, MA: Cambridge University Press.
1
Table 1.Frequently Cited Early Childhood Education Programs from Research Reviews (1995–2006)Program Type Age Citations
High/Scope Perry Preschool Program Model 40 19
Chicago Child-Parent Centers (CPC) Large Scale 24 14
Carolina Abecedarian Project Model 21 13
Houston Parent-Child Development Center (PCDC) Model 11 12
Infant and Health Development Program Model 18 11
Comprehensive Child Development Program (CCDP) Large Scale 5 8
Early Training Project Model 20 8
Prenatal/ Early Infancy Project (PEIP)/Nurse-Family Partnership Program(NFP)
Model 15 8
Milwaukee Project Model 14 8
Philadelphia Project Model 18 7
Consortium for Longitudinal Studies Model 27 6
Educational Testing Service Head Start Study Large Scale 8 6
New Haven Follow-Through Study Large Scale 17 6
Institute for Developmental Studies Model 13 5
Louisville Experiment (Head Start) Model 16 5
Even Start Large Scale 7 4
Harlem Training Project Model 12 4
Maryland Head Start Large Scale 17 4
Yale Child Welfare Research Project Model 10 4
Advance Family Support and Education Large Scale 5 3
New York State Experimental Prekindergarten Large Scale 9 3
PSID Head Start Longitudinal Study Large Scale 25 3
2
Table 2.Examples of Monetized Benefits Reported in Cost-Benefit Analyses of Early Childhood Programs
Benefit Category Treatment Effect Estimate
Grade retention Reduced rates of grade retention Expenditure for one year of school
Special education Fewer years of special education services
Weighted average annual cost for various categories of special education services
Childcare expendituresAverage duration of program participation
Annual opportunity cost of parent’s (typically mother’s) time
Child Maltreatment Fewer incidences of child abuse/neglect
Weighted average annual cost for in-home services and out-of-home care, including administrative and investigation costs
Public Assistance Fewer months of public assistance participation
Average monthly payment for AFDC, Food Stamps, and Medicaid, including administrative costs
Adult Health Lower rates of tobacco use Value of additional years of life 1
Lifetime earnings Higher rates of high school completion, including GED
Projected increase in lifetime earnings associated with high school completion
Juvenile crime Fewer petitions to juvenile court Weighted average expenditures per petition to juvenile court 2
Adult crime Fewer incidences of adult arrest, conviction, and/or incarceration 3
Cost of an adult criminal career 2, 4
1 Estimates generally exclude benefits associated with reduce morbidity (illness prior to death).2 Estimates typically include criminal justice system expenditures for incarceration, probation and parole, as well as victim costs. Tangible victim costs (e.g., productivity loss, mental health care expenditures, property loss) and intangible victim costs (e.g., pain and suffering) can be estimated separately3 Treatment effects may be estimated using adult crime data from administrative records and self reports or projected from measures of juvenile delinquency.4 The average duration of adult criminal career is approximately 26 years (from age 19 through 44).
3
Table 3. Cost-Effectiveness Estimates for Early Childhood Programs, Birth to Third Grade
Development Stage Source Focus Location2007 Dollars 1
B/CBenefits Costs B-C
Birth to age 3WIC 2 Avruch & Cackley (1995) Targeted National 1,206 393 813 3.07NFP, Low SES Glazner et al. (2004) Targeted Elmira, NY 83,850 16,727 67,123 5.01NFP, Higher SES Glazner et al. (2004) Targeted Elmira, NY 25,317 16,727 8,590 1.51
PreschoolChild Parent Centers Reynolds et al. (2002) Targeted 20 Chicago sites 86,401 8,512 77,889 10.15
Perry Preschool Barnett (1996) Targeted 1 Ypsilanti site 159,610 18,260 141,350 8.74
Abecedarian 3 Barnett & Masse (2007) Targeted 1 NC site 182,422 73,159 109,263 2.49
RAND study of Preschool in CA
Karoly et al. (2005) Universal State of CA 12,818 4,889 7,929 2.62
National Pre-K synthesis for 2050 4
Lynch (2007) Targeted National 20,603 6,479 14,124 3.18Lynch (2007) Universal National 12,958 6,479 6,479 2.00
Synthesis study Aos et al. (2004) Targeted 58 programs 19,826 8,415 11,411 2.36KindergartenFull-Day K synthesis 5, 6 Aos et al. (2007) Universal 23 programs 0 2,685 -2,685 0
School-AgeTennessee STAR (class size reduction, K-3)
Krueger (2003) Universal 79 schools 27,561 9,744 17,817 2.83
Synthesis of reduced class sizes, K-2 5, 7 Aos et al. (2007) Universal 38 studies 6,847 2,454 4,393 2.79
Synthesis of reduced class sizes, grade 3-6 5, 7 Aos et al. (2007) Universal 38 studies 3,387 2,454 933 1.38
Child Parent Centers School-Age Program
Reynolds et al. (2002) Targeted 20 Chicago sites 8,089 3,792 4,297 2.13
Reading Recovery 5 Shanahan & Barr (1995) Targeted General 1,679 5,596 -3,151 0.30
Skills, Opportunities and Recognition
Aos et al. (2004) Universal Seattle schools 16,256 5,172 11,084 3.14
PK-3 InterventionChild-Parent Centers Extended Program
Reynolds et al. (2002) Targeted 20 Chicago sites 47,161 5,175 41,986 9.111 All estimates are converted to 2007 dollars using the Consumer Price Index for All Urban Consumers (CPI-U).2 Estimates are based on a meta-analysis of studies investigating the effects of WIC.3 The cost for the Abecedarian Program represents the total costs of the intervention. 4 Estimates for Lynch’s (2007) synthesis of targeted and universal preschool represent annual per pupil program costs and associated annul government budget benefits. Total accrued benefits to government, the general public, and program participants and their parents relative to costs are $12.10:1 and $8.20:1 for the targeted and universal programs, respectively.
5 Estimates are not based on formal cost-benefit analyses.6 The cost of full-day kindergarten is relative to the cost of half-day kindergarten in Washington State.7 Estimates from syntheses of reduced class sizes assume a reduction from 25 to 15 pupils per class.
4
Note. For the Perry Preschool Study, special education is for EMI placements by age 15. Ages for educational attainment and employment are 27 for Perry, 21 for Abecedarian, and 22 for the Chicago. Employment for Chicago is full-time employment.ns = not significant; n/a = not available.
Table 4.Outcomes for Program and Comparison Groups on Key Measures for Cost-Benefit Analysis
Outcome Perry Preschool Abecedarian Child-Parent Centers
Original sample sizes (Program, Comparison) 58, 65 57, 54 989, 550
Sample recovery for high school completion, % 94 95 87
Special education services by age 15/18, % 15 vs. 34 25 v. 48 14 v. 25
Grade retention by age 15, % ns 31 v. 55 23 v. 38
Child maltreatment by age 17, % n/a n/a 7 v. 14
Arrested by age 19, % 31 v. 51 ns 17 v. 25
Highest grade completed by age 21/27 11.9 v. 11.0 12.2 v. 11.6 11.3 v. 10.9
High school completion by age 21/27, % 71 v. 5470 v. 67
(graduation) 66 v. 54
Attended college by age 21/27, % 33 v. 2836 v. 14
(4-year college)24 v. 18
Employed at age 21-27, % 71 v. 59 70 v. 58 ns
Monthly earnings at age 27 $1,219 v. $766 n/a n/a
5
Table 5.Summary of Costs and Benefits per Participant in 2007 Dollars for Three Early Interventions
High/Scope Perry Preschool
Chicago Child-ParentCenters
Abecedarian Project
Average cost per participant $18,260 $8,512 $73,159
Cost For one year of participation 10,283 5,434 16,020
Total benefits 159,610 86,400 182,422
Net benefits (benefits – cost) 141,350 77,899 109,263
Public benefits 130,690 58,476 36,429
Net public benefits 112,430 49,964 (36,730)
Total benefit per dollar invested 8.74 10.15 2.49
Public benefit per dollar invested 7.16 6.87 0.50
Note: Costs are program expenditures and do not include estimated costs for comparison-group experiences. Ages of study participants for economic analysis of the Perry Preschool Program, Chicago CPC Program, and the Abecedarian Project are 27, 21, and 22 respectively. The public benefit of the Abecedarian Project is estimated by assuming that 25% of the reported earnings benefit to participants, parents, and future generations is government tax revenues. In addition, the public is assumed to be responsible for two thirds of the cost associated with increased college attendance.
Ages 5-12
MA
SS
FS
SA
CA
MA
SS
FSS
SA
CA
Figure 1. Pathways from Early Childhood Programs to Long-Term Outcomes
Early ChildhoodAges 3-9
Adolescence Ages 12-18
ProgramParticipation
TimingDurationIntensity
Social Competence Behaviors
School Achievement and Performance
Retention in Grade
Receiving Special Education Services
Delinquency and Crime
Participation in Social Services
Educational Attainment
Economic Well-being
MA= Motivational AdvantageCA = Cognitive AdvantageSA = Social AdjustmentFS = Family SupportSS = School Support
Exogenous ConditionsGender
Socio-Environmental RiskNeighborhood Attributes
Motivation Self-efficacy Perceived competence Persistence in learning
Developed Abilities Cognitive development Literacy skills Pre-reading/numeracy skills
Social Adjustment Classroom adjustment Peer relations Self-regulating skills
Family Support Parent-child interactions Home support for learning Participation in school Parenting skills
School Support Quality of school environment Classroom environment School-level performance
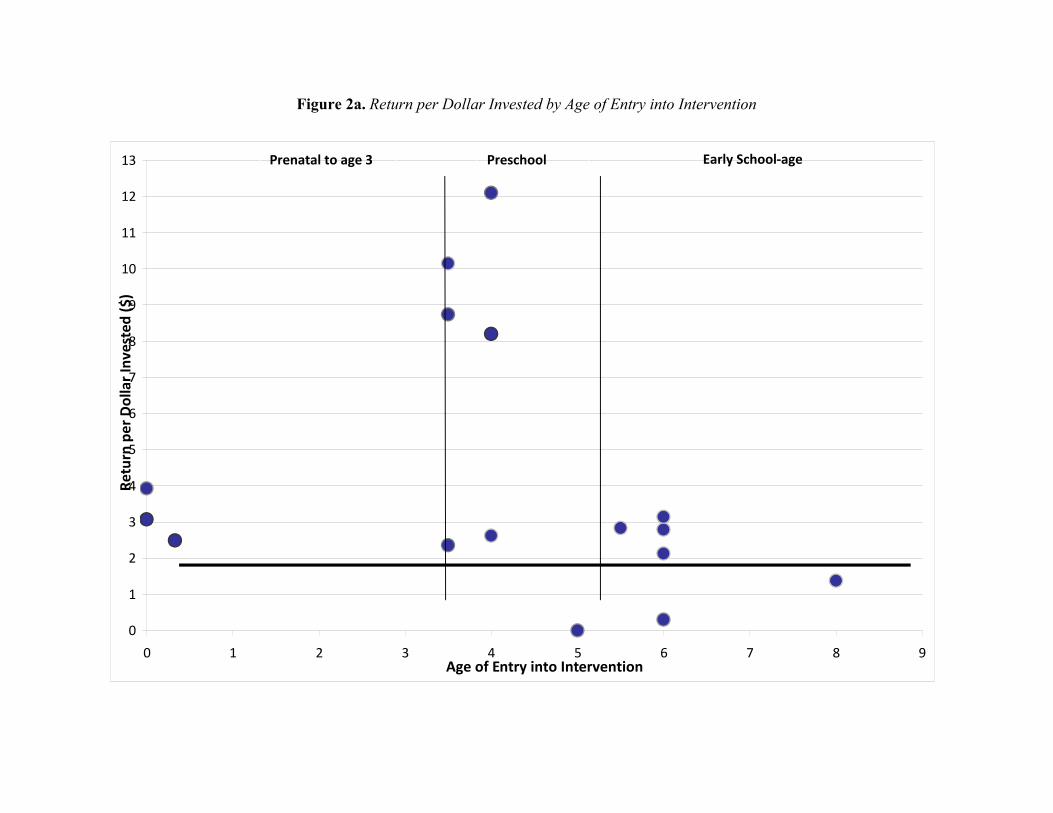
Figure 2a. Return per Dollar Invested by Age of Entry into Intervention
0
1
2
3
4
5
6
7
8
9
10
11
12
13
0 1 2 3 4 5 6 7 8 9Age of Entry into Intervention
Retu
rn p
er D
olla
r Inv
este
d ($
)
Prenatal to age 3 Preschool Early School-age

Figure 2b. Net Present Value (Benefits – Costs) Per Child by Age of Entry into Intervention
($10,000)
$0
$10,000
$20,000
$30,000
$40,000
$50,000
$60,000
$70,000
$80,000
$90,000
$100,000
$110,000
$120,000
$130,000
$140,000
$150,000
0 1 2 3 4 5 6 7 8 9
Age of Entry into Intervention
Net
Pre
sent
Val
ue
Prenatal to age 3 Preschool Early School-age