cost estimation briefing for large seawater reverse ...gwri-ic.technion.ac.il/pdf/ids/84.pdf121 cost...
TRANSCRIPT
� � �
� 121
Cost Estimation Briefing for Large
Seawater Reverse Osmosis Facilities in Spain
José Díaz-Caneja and Manuel Fariñas PRIDESA, Ramón Rubial nº 2, 48950 Erandio, Spain
Tel. +34 94 60 50 700; Fax + 34 94 46 76 406 Email: [email protected]
Abstract
The Spanish desalination market is currently one of the largest and most experienced ones for RO, due to the high water demand in the Mediterranean Coast of Spain, driven by the seasonal variations in population because of the tourism and the intensive agriculture. This reason, jointly with the water scarcity in the area, has obliged Spain to develop a large number of RO facilities, for supplying fresh water in this large part of the country. In addition, the Canary and Balearic Islands are also areas in which RO desalination has a very important role as a drinking water supply.
The purpose of this document is to show estimation for the cost of producing desalinated water in the Spanish market. It provides breakdown of the desalinated water cost in Spain, based on the data gathered form PRIDESA’s experience on several large size, new RO facilities, and specifically from 3 of the largest and latest RO plants tendered in the country.
Data has been collected from plants with a production flow between 65 and 170 MLD (14 to 37,5 MIGD), with different characteristics, as the raw water intake system, trains sizes, etc, that allows having three different case scenarios and an average result.
Finally, this result shows that the desalination costs, which in the near past have been considered as a solution only for very specific areas in which the availability of fresh water was reduced, nowadays can be considered as an alternative to the traditional sources, with the advantage of the reliability and independency from external factors. 1. Introduction
For over 30 years, Spain has been developing cost-effective and sustainable solutions using reverse osmosis desalination as one of its strategies for addressing the country’s
water resource challenges. Over that period, an industry has evolved, breeding companies that have accumulated a wealth of knowledge and experience in the research, design, construction, operation and maintenance of desalination plants. PRIDESA has been at the heart of this process, having pioneered a number of innovations and contributed to Spain becoming a world leader in reverse osmosis desalination. Just as the Middle East is acknowledged as leading the world in thermal desalination technology, Spain now holds the same status in the field of membrane desalination.
This maturity in the Spanish desal market has driven to have the possibility to achieve lower cost in the process that have made RO desalination a real alternative to the traditional water supply resources.
The required investment to build a desalination facility logically depends on its size, but not in a direct way. Even being modular, the specific investment for these facilities (required investment per m3/day production) decreases as the size of the plant increases, which means that the scale factor plays a relevant role in the investment calculations.

� � �
� 122
Nowadays, municipal plants size’s are continuously increasing due to the cost saving associated to large scale facilities, however, some relevant cost variations depend on the adopted options for any given plant size.
The options likely to generate such variations in relation to the standard cost are the following:
� Sea water Abstraction system
Due to the huge seawater volume required to operate large desalination plants, we must consider the adoption of surface water intakes instead of coastal abstraction boreholes, since the required number of these and the surface involved would be too large. Once decided, the surface water intake may be done in two different ways:
� Channel Intake � Underwater penstock
It is obvious that the investment required for either option differs greatly, the underwater penstock being usually the most expensive, especially when the sea bottom near the site is rocky or has strong undercurrents.
� Pre-treatment
Pre-treatment requirements may be more or less complex and, therefore, more or less costly, depending on water pollution. In general, we try to deal with the best possible quality water by choosing the best abstraction methods and location for each case. Having said this, there are some cases in which this situation is not possible, requiring more systems that are more sophisticated, which, logically, results in an increase of the cost of the mentioned pretreatment.
� Reverse Osmosis
Depending on raw water characteristics and product water requirements, the design of the RO process can vary substantially. In high salinity waters with high quality requirements, product water can require more than one RO pass with the associated cost increase.
Energy recovery devices have improved its efficiency, although the newest systems, while achieving better recovery figures, normally have a higher CAPEX cost, so the selected system must be evaluated depending on the O&M requirements, in order to achieve the lowest total (CAPEX + OPEX) cost.
� Polishing treatment
R. O. desalinated water is corrosive and poor in calcium and bicarbonate and it may not be directly suitable, neither for drinking nor for irrigations purposes, before conditioning.
When we want to use desalinated water for human consumption, we shall have to:
� Increase its calcium contents to make the water harder, giving it a better taste, reducing at the same time its corroding power.
� Increase its bicarbonate contents to render the water less corrosive while stabilizing its pH.
� Ensure disinfection (absence of all pathogen agents)
Calcium, as lime slurry, CO2 gas to react with the lime to form calcium bicarbonate and chlorine as sodium hypochlorite for disinfection, are added to all desalinated water that is going to be used for human supply.
� � �
� 123
When the water is to be used for irrigation, we shall only need to add calcium as lime slurry to it.
Although the polishing treatment is different for municipal or agricultural purposes, the required investment variation between both is not very significant, but its operation costs is, since the required CO2 dosage for human supply water is high and so is its cost.
� Product water external pumping
Once conditioned, desalinated water must be pumped out to the network. Seawater desalination plants are usually located as close as possible to the coast in order to minimize the environmental risks related to dealing with sea water and reject brine.
On the other hand, it is best to build desalination plants as close as possible to the point where the product water is going to be consumed in order to minimize the transfer infrastructure and, therefore, the required investment. However, this option is not always possible. Sometimes, locating a desalination plant near coastal cities with a harbour may mean working with highly polluted water, which is neither technically advisable nor economically profitable.
Of course, the longer the required transfer infrastructure is, the greater the investment will be and vice versa.
� Brine disposal
Brine reject from a desalination plant represents its most relevant environmental drawback when it cannot be adequately dispersed into the sea. Therefore, it is most important to make sure that the brine mixes rapidly with the remaining seawater to avoid all potential environmental risks.
There are different available techniques to dispel the brine into the sea which application depends on the type of coast where the plant is located (rocky, sandy, etc.), on the local sea movements and on the shape and slope of the sea bottom, etc.
Choosing one of the available dispelling techniques may represent a major investment variation factor.
� Electricity
Seawater desalination plants are intensive power consuming installations requiring the presence of a large electric line nearby.
If such infrastructure is not already available, it will have to be installed in order to bring the necessary power to the plant. In this case, the required investment will be severely affected as well.
� Civil works
The civil works involved in the construction of water desalination facilities is usually very conventional. The building housing the equipment and membranes is usually made of prefabricated concrete to reduce corrosion risks, since the handled fluids (sea water and reject brine) are extraordinarily aggressive.
Civil works variations (more detailed finishing, architecture, etc.) do not usually represent any relevant investment variations. However, any shore works related to the need to gain some land from the sea or to protect the site from waves beating, does represent a significant investment increase.

� � �
� 124
REFERENCIAL PROJECTS 1.1. Carboneras S.W.R.O. facility
Figure 1: Air view of Carboneras seawater desalination plant
Source: PRIDESA
Figure 2: Air view of Carboneras seawater desalination plant
Source: PRIDESA
� � �
� 125
Table 1: General features of Carboneras Sea Water Desalination Plant Source: PRIDESA
Desalinated water flow ........................................................ 120.000m3/day (42,9 hm3/year)
Abstraction type ................................................................... Open Abstraction means ......................................................... Sub-marine penstock (2 Uts) Number of lines .................................................................... 12 Uts. Flow per line ........................................................................ 10.000 m3/day Work conversion ................................................................. 45% Power recovery system......................................................... Pelton turbines Reject brine disposal system ................................................ Mixed with the nearby Power
Plant refrigeration water Site altitude........................................................................... + 10,00 m Desalinated water delivery altitude ...................................... + 65,00 m Installed power .................................................................... 30 MVA Specific power consumption ................................................ 4,08 kWh/m3 Electric power branching ..................................................... Substation next to Power Plant Award budget ...................................................................... 79,9 million €
(VAT included, April 2.000) Special features of this desalination facility are as follows:
� Open type seawater abstraction using two submarine penstocks. � Brine dispersion problem solved with the minimum cost by mixing the brine with the
refrigeration water from a nearby power station. � Electric power taken from a nearby sub-station close to the Power Plant, although a new
sub-station had to be built next to the desalination plant. � Pelton turbines reject power recovery.
� The absence of sufficient available flat land to build the desalination plant demanded huge mountainside excavations, as may be seen in figure 2.
The total plant cost, including absolutely every item (price revisions, modifications and final settlement), even costs not considered in the awarded budget as for example, works direction, Public Authorities cooperation, the land cost and environmental impact assessment , etc., rose to 105 million € (VAT included).
The investment cost per m3/day desalinated water was:
���������� ���
� �� �
or
������������� �� ���
� �� ��
SAN PEDRO DEL PINATAR S.W.R.O. FACILITY
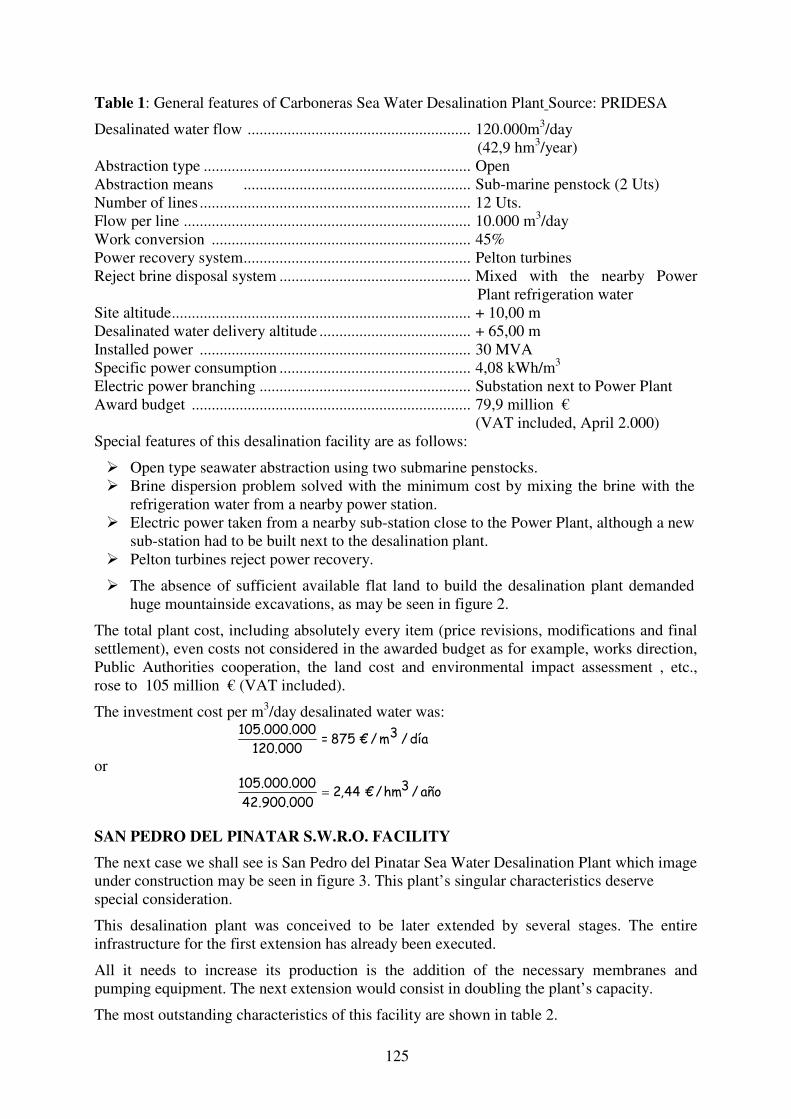
The next case we shall see is San Pedro del Pinatar Sea Water Desalination Plant which image under construction may be seen in figure 3. This plant’s singular characteristics deserve special consideration.
This desalination plant was conceived to be later extended by several stages. The entire infrastructure for the first extension has already been executed.
All it needs to increase its production is the addition of the necessary membranes and pumping equipment. The next extension would consist in doubling the plant’s capacity.
The most outstanding characteristics of this facility are shown in table 2.
� � �
� 126
Figure 3: Air view of San Pedro del Pinatar (Murcia) Desalination Plant site under
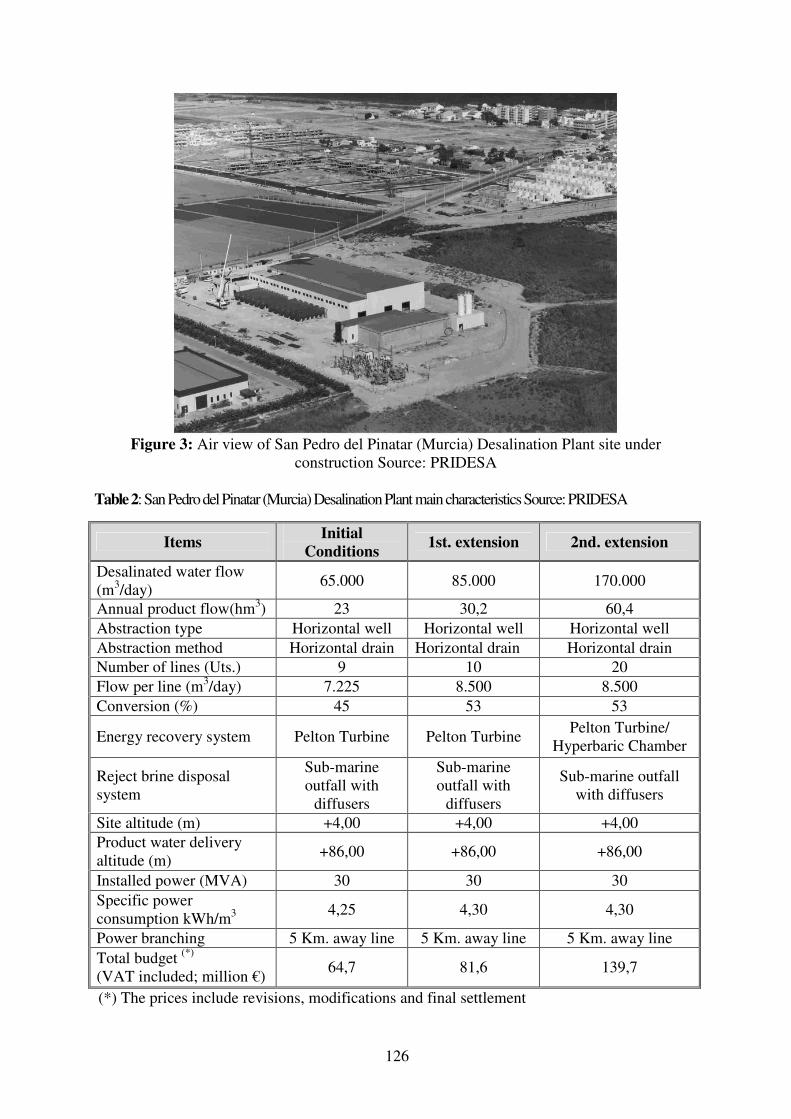
construction Source: PRIDESA Table 2: San Pedro del Pinatar (Murcia) Desalination Plant main characteristics Source: PRIDESA
(*) The prices include revisions, modifications and final settlement
Items Initial Conditions 1st. extension 2nd. extension
Desalinated water flow (m3/day) 65.000 85.000 170.000
Annual product flow(hm3) 23 30,2 60,4 Abstraction type Horizontal well Horizontal well Horizontal well Abstraction method Horizontal drain Horizontal drain Horizontal drain Number of lines (Uts.) 9 10 20 Flow per line (m3/day) 7.225 8.500 8.500 Conversion (%) 45 53 53
Energy recovery system Pelton Turbine Pelton Turbine Pelton Turbine/ Hyperbaric Chamber
Reject brine disposal system
Sub-marine outfall with
diffusers
Sub-marine outfall with
diffusers
Sub-marine outfall with diffusers
Site altitude (m) +4,00 +4,00 +4,00 Product water delivery altitude (m) +86,00 +86,00 +86,00
Installed power (MVA) 30 30 30 Specific power consumption kWh/m3 4,25 4,30 4,30
Power branching 5 Km. away line 5 Km. away line 5 Km. away line Total budget (*) (VAT included; million €) 64,7 81,6 139,7

� � �
� 127
This desalination plant is rather singular, both as regards its initial conditions and its first extension, which explains the high investment required for every m3/day of desalinated water produced by it.
The plant’s most outstanding features in its original conception (65.000 m3/day initial production) were:
� Seawater abstraction system based on a very new technique consisting in raw water abstraction through horizontal wells demanding a very limited available surface (100 x 15 m2).
� The seawater intake is located far away from the desalination plant (about 1,7 Km.). Its pipe runs along some urban areas where the street pavement had to be lifted. Directed horizontal drilling was used for part of its layout.
� The abstraction infrastructure (intake collector, boosting pipe, etc.) was dimensioned for a 170.000 m3/day future extension.
� Land purchase included the necessary space for a future extension. � A second stage with booster pumps will be added in subsequent extensions to increase
the plant’s conversion rate from 45 to 53%, as was planned from the beginning. � Power branching and a sub-station for a second extension are already installed and high
tension electric cables have been buried along 4 kms to comply with environmental regulations.
� Desalinated water is pumped from a tank within the plant to a second 65.000 m3 capacity, +86,00 elevation general tank 7,5 Km. away. Both tanks and the boosting pipe are included in the initial costs estimation.
� The environmental assessment declaration demanded that the reject brine disposal outflow should be located 5,1 Km away from the coast, using a sub-marine outfall, to preserve the valuable Posidonia Oceanica fields in the area (see fig. 4). This factor represented a significant cost increase.
Figure 4: Posidonia Oceanica view at el Mojón beach (San Pedro del Pinatar)
Source: PRIDESA Considering the singular requirements related to the preservation of the Posidonia, the proper procedure to calculate the investment required to produce each m3/day of desalinated water, would be to base the calculations on the final estimated capacity of the plant (170.000 m3/day), including all the necessary costs for a very complex facility. The investment repercussion per m3/day desalinated water would be:
�������� ������������� ��
� ������

� � �
� 128
Pridesa’s tender for a 140 MLD S.W.R.O. facility
Other desalination plant we shall consider is one of the latest large-scale projects tendered in Spain. This plant’s execution project is awaiting approval now. The most relevant features of one of the options for this desalination plant may be seen in table 3. Table 3: General characteristics of one of the solutions considered for Campo de Cartagena Sea Water Desalination Plant. Desalinated water flow ........................................................ 140.000 m3/day
(50 hm3/year) Abstraction type ................................................................... Open Abstraction means ................................................................ Sub-marine penstock (2 Uts.) Number of lines .................................................................... 7 Uts Flow per line ........................................................................ 20.000 m3/day Conversion .......................................................................... 45% Power recovery system ........................................................ hyperbaric chambers Reject brine disposal system ................................................ Sea outfall with diffusers Desalination site altitude ...................................................... + 35,00 m Treated Water delivery altitude............................................ + 35,00 m Installed power .................................................................... 25 MVA Specific power consumption ................................................ 3,13 kWh/m3 Electric power branching ..................................................... Underground high-tension line
coming from a sub-station (2 / 3 Km)
Award budget ...................................................................... 71,9 million € (VAT included, February 2.002)
This plant differs from the formers in that it does not have any outstanding characteristics demanding any significant additional investment, for which reason it may be considered as a standard plant for its capacity.
This plant’s only singularity is not related to the required investment, although it does affect the specific power demands, as we shall see. Incorporating the most up to date energy recovery system in the market -hyperbaric chambers-, serves to reduce the plant’s specific power consumption to the minimum possible.
The reason why this plant is cheaper than Carboneras although its production is higher and despite the fact that it was awarded later, is due to two main reasons:
� It does not incorporate any basic infrastructures for any future extensions.
� It has fewer, higher capacity production lines, which makes the costs cheaper.
The initial investment recovery per m3/day desalinated water would be:
añohmdíam3
/€44,1/3/€6,513000.140
000.900.71��
But this is only a tender price and tender prices often have a tendency to increase due to various possible complications related, either to environmental impact difficulties, problems with foundations or others, as well as layout modifications (access roads, pipes, etc.) and price revision increases. According to our experience with other works of similar characteristics,

� � �
� 129
although smaller, the maximum increase should be less than 1,3 times the tender budget (10% for final settlement and 10% for modifications, plus 10% for price revision). The maximum repercussion would be, therefore, as follows:
1,3 x 513,5 = 667,6 €/m3 day (111.000 Ptas/m3 day) = 1,87 €/m3 year
2. Cost Structure
Desalinated water cost structure is as follows:
Fix costs
Amortization Operation staff Power Connection Maintenance Miscellaneous
C O S T S
Variable costs
Chemicals Conservation and Maintenance Electric Power Consumption Membrane replacements
2.1. Fix costs
2.1.1. Investment & Amortization
Having in mind the previous data, required CAPEX for producing desalinated water can be summarized as follows: Table 4: Investment required for building a large seawater desalination plant (VAT included)
Source: PRIDESA
Required investment (Euros) Per m3/day Per m3/year
Cheapest 668 1,87 Average 740 2,06 Dearest 875 2,44
� Amortization calculations
In order to calculate the desalinated water cost per m3 in relation to the invested capital, we must compound the required investment at a given interest rate, during a period equal to the estimated life of the plant. The annual amortization rate would, therefore, be:
�����
�������
�
�
��
��
Where: I = Investment n = number of amortization years i = interest rate

� � �
� 130
The annual sum obtained is divided into the number of m3desalinated water produced during one year to obtain the amortization sum.
This calculation method implies that:
� The residual value of the plant will be zero at the end of the amortization period.
� The plant will produce the same number of m3-desalinated water every year (as an average).
� Amortization period
It was thought until recently that the technological evolution might render a desalination plant obsolete within a relatively short period, for which reason its amortization period should coincide with its expected technological life.
However, the case of Las Palmas III (36.000 m3/day originally) and Sureste de Gran Canaria (33.000 m3/day) seawater desalination plants have shown quite the contrary.
The first of the two was started in October 1.989, 15 years ago now, and it has been technologically updated without any difficulties nor any additional cost until now, since the investment required to implement all technological updating was financed with the economies generated in the production costs by the innovation itself, even leaving a surplus for other investments.
The same thing happened to Gran Canaria desalination plant, which has undergone three different technological innovations in its 10 year of existence, without increasing its water price, because all the required and additional works were financed with the savings accrued per m3 of desalinated water production as consequence of the introduction of the new technologies themselves.
Due to the high quality, corrosion resistant, materials used for sea water desalination plants construction (super-duplex type stainless steel, split chamber pumps, concrete buildings, etc.), it seems that the amortization period for these plants should be estimated as 25 years minimum.
If, as it seems to be, future technological innovations can only be related to certain improvements of the membranes that would result in reducing work pressure, considering longer amortization periods for sea water desalinations plants does not seem unrealistic.
In order to confirm the amortization rates variations in relation to the facilities estimated life for the purpose of comparing the obtained data with the river water transfer project costs in equal conditions, the amortization rate will be calculated for 15, 20, 25 and 30 years.
� Interest rates
When considering what interest rate we should apply, we must distinguish between the rates applied to the State and the rates applied to private firms.
For the State, it is reasonable to consider an interest rate that is equal to the interest applied to the 30 years bonds plus 0,25%.
In any case, in order to analyze the amortization sensitivity versus interest rate variations, we shall consider 3, 4, 5, 6 y 7% rates.
� Amortization costs
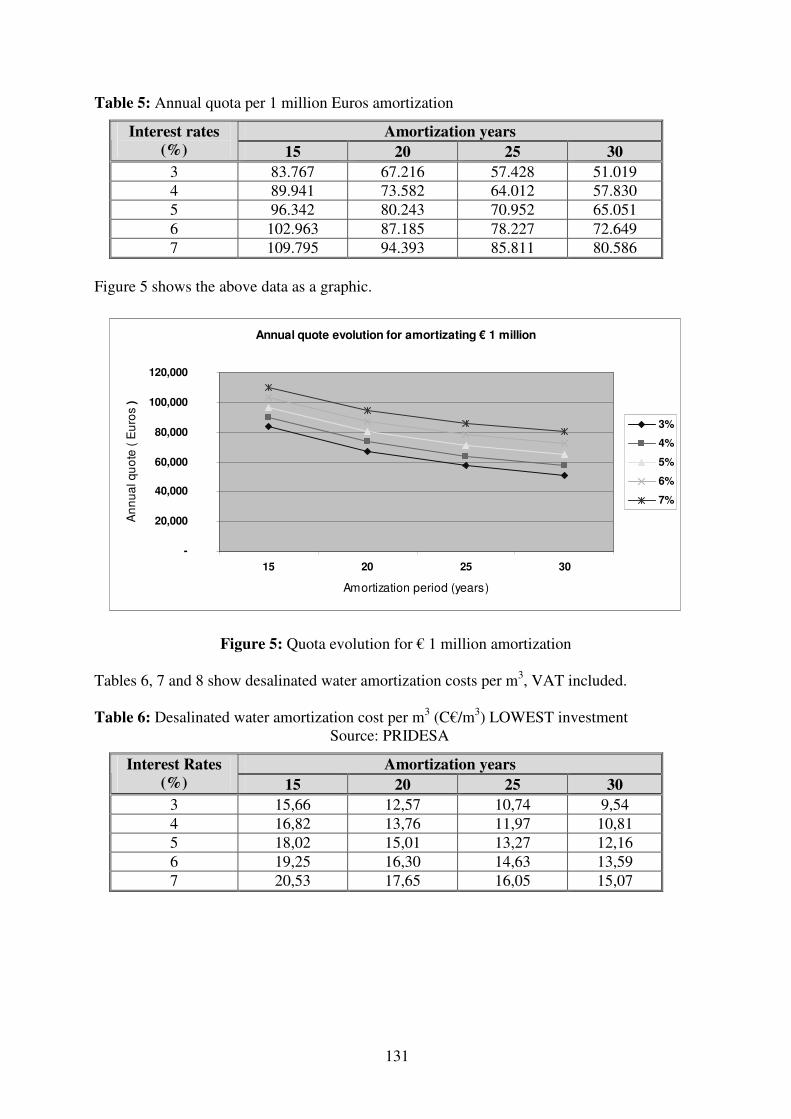
Considering the parameters given in the above paragraphs, table 5 shows the necessary annual contribution per 1 million Euros, according to different interest rates and different amortization times.
� � �
� 131
Table 5: Annual quota per 1 million Euros amortization
Amortization years Interest rates (%) 15 20 25 30
3 83.767 67.216 57.428 51.019 4 89.941 73.582 64.012 57.830 5 96.342 80.243 70.952 65.051 6 102.963 87.185 78.227 72.649 7 109.795 94.393 85.811 80.586
Figure 5 shows the above data as a graphic.
Annual quote evolution for amortizating € 1 million
-
20,000
40,000
60,000
80,000
100,000
120,000
15 20 25 30
Amortization period (years)
Ann
ual q
uote
( E
uros
)
3%
4%
5%
6%
7%
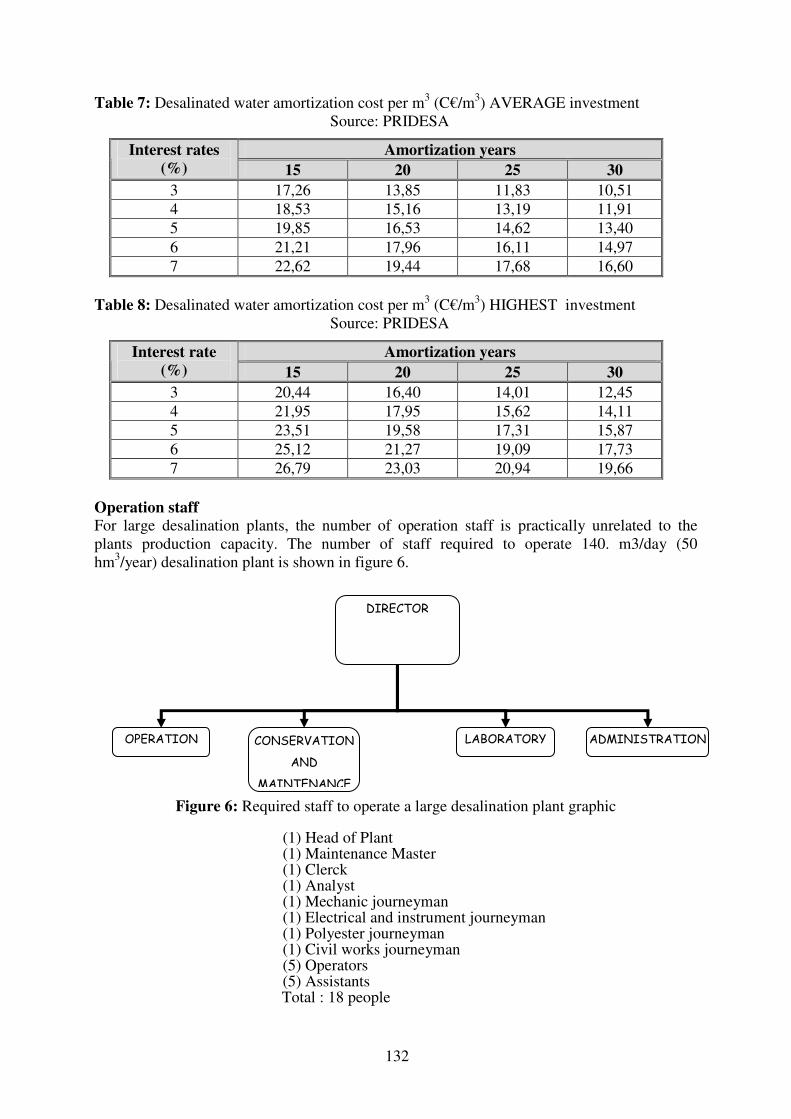
Figure 5: Quota evolution for € 1 million amortization Tables 6, 7 and 8 show desalinated water amortization costs per m3, VAT included.
Table 6: Desalinated water amortization cost per m3 (C€/m3) LOWEST investment
Source: PRIDESA
Amortization years Interest Rates (%) 15 20 25 30
3 15,66 12,57 10,74 9,54 4 16,82 13,76 11,97 10,81 5 18,02 15,01 13,27 12,16 6 19,25 16,30 14,63 13,59 7 20,53 17,65 16,05 15,07
� � �
� 132
� ���� ! � �
! "��# �! $� �! $% ��& # �! $�
# $� �
' # �$ �$# $���
(# )! �# ! �* � # � ' �$�% �# �! $�
Table 7: Desalinated water amortization cost per m3 (C€/m3) AVERAGE investment Source: PRIDESA
Amortization years Interest rates (%) 15 20 25 30
3 17,26 13,85 11,83 10,51 4 18,53 15,16 13,19 11,91 5 19,85 16,53 14,62 13,40 6 21,21 17,96 16,11 14,97 7 22,62 19,44 17,68 16,60
Table 8: Desalinated water amortization cost per m3 (C€/m3) HIGHEST investment
Source: PRIDESA
Amortization years Interest rate (%) 15 20 25 30
3 20,44 16,40 14,01 12,45 4 21,95 17,95 15,62 14,11 5 23,51 19,58 17,31 15,87 6 25,12 21,27 19,09 17,73 7 26,79 23,03 20,94 19,66
Operation staff For large desalination plants, the number of operation staff is practically unrelated to the plants production capacity. The number of staff required to operate 140. m3/day (50 hm3/year) desalination plant is shown in figure 6.
Figure 6: Required staff to operate a large desalination plant graphic
(1) Head of Plant (1) Maintenance Master (1) Clerck (1) Analyst (1) Mechanic journeyman (1) Electrical and instrument journeyman (1) Polyester journeyman (1) Civil works journeyman (5) Operators (5) Assistants
Total : 18 people

� � �
� 133
Office cleaning is usually entrusted to an external specialized firm. The average staff costs, including clearing operations, may be around 560.000 €/year. Considering an average 140.000 m3/day (50 hm3/year) production, the staff cost per m3 is:
���������+� ,�
� , ��+ �
2.1.2. Connection to grid cost
Water desalination plants operate on a full time basis, that is, 100% capacity every day of the year, except for the 7 to 15 days needed for general revision (transformers, pipes and pumps clearing and maintenance), once a year.
In these circumstances, the best option, in Spain, is to subscribe an electric power rate giving access to a six period basis supply.
Since the subscribed power depends on the desalination plant specific power consumption, its cost will depend on:
� The plant specific power consumption � Its branching tension.
Assuming that the desalination plant has an up to date design, and that the supply tension ranges between 36 and 72,5 kV (normal for this type of plants), we might choose the rate 6.2 which, according to 2004 prices, would represent an annual connection cost of 570.089,88 €, VAT not included.
The repercussion of this item in every m3-desalinated water, would be:
��������� � ��
� ��� ,� �
2.1.3. Fix maintenance costs
Certain maintenance operations must always be performed whether the desalination plant is in operation or not.
� Civil works maintenance (painting, slight damage fixing… etc.). � Gardening � Pipes and surrounding spaces checking � Machines painting � Transformation centre maintenance
The annual cost of these operations for a plant of the above capacity is around 144.000 €/year.
Its repercussion per m3-desalinated water would be:
�������� � ��
����,� �
2.1.4. Miscellaneous
Fix costs for miscellaneous items usually include the following:
� Work clothes. � Health and safety equipment (gloves, helmets, auriculars, glasses, etc.). � Office furniture, equipment and materials. � Telephone and ADSL bills, photocopy machine, etc. � Vehicles: 2 vans and fuel for transport to workshops � Vehicles maintenance

� � �
� 134
� Vehicles Insurance � Desalination plant insurance (all risk insurance for materials and machines damage) � Licenses, taxes and permits � Fungible laboratory materials
The most relevant of the above items in terms of cost is the insurance, including machinery damage. Its present cost for a 50 hm3/year plant is around 240.000 €/year.
This item’s repercussion per m3-desalinated water would be:
������� � ��
��� ,� �
2.2. Variable costs
2.2.1. Reagents cost
The chemicals normally used in desalination plants may be classified in various large groups:
� Pre-treatment chemicals for surface water catchments are shown in table 9.
Table 9: Pre-treatment reagentsSource: PRIDESA
Type Purpose
Approximate dosage
(g/m3 desalinated water)
Sulphuric acid (98%) pH Control 45 – 55 Sodium Hypochlorite (120 g Cl2/l)
Sea water disinfection 20 – 35
Ferric Chloride (40%) Coagulant 12,5 – 20 Polyelectrolyte Coagulation aid 1 – 2 Sodium bisulphite Oxidants Neutralization 10 – 20 Dispersant To prevent membrane fouling 1 - 4
The mentioned reagents and dosage may vary according to the water intake method and to raw water quality.
� The reagents used to condition desalinated water vary depending on the final water use, whether for drinking or for irrigation.
The least favourable scenario from the point of view of cost is when the water is going to be used for urban supply. The reagents required in this case are shown in table 10.
Table 10: Polishing treatment reagents (Urban supply water) Source: PRIDESA
Reagents Purpose
Approximate dosage
(g/m3 desalinated water)
Carbon dioxide CO2 Promotes product water re-
mineralization 35 - 60
Calcium hydroxide (98 %) pH correction and Langelier index control 45 - 70
Sodium hypochlorite (120 g Cl2/l)
supply water disinfection 5
� � �
� 135
Dosage varies according to temperature and depends on whether the water will be mixed with water of different precedence before distribution, or not.
� The chemicals used to clean the membranes and the cleaning frequency depends on the intake water quality.
The most commonly used reagents to deal with an open seawater intake system are: � Caustic soda � Dodecyl sodium sulphate � Sodium Laurilsulphate � Sodium triphosphate � Bi-sodium phosphate � Na4 EDTA � Peracetic acid
� The chemicals used to treat the effluent are: � Coagulant � Polyelectrolyte � Lime � Sulphuric acid
Dosage and frequency also depend on seawater quality, reagents demands increasing as the water quality gets worse and vice-versa.
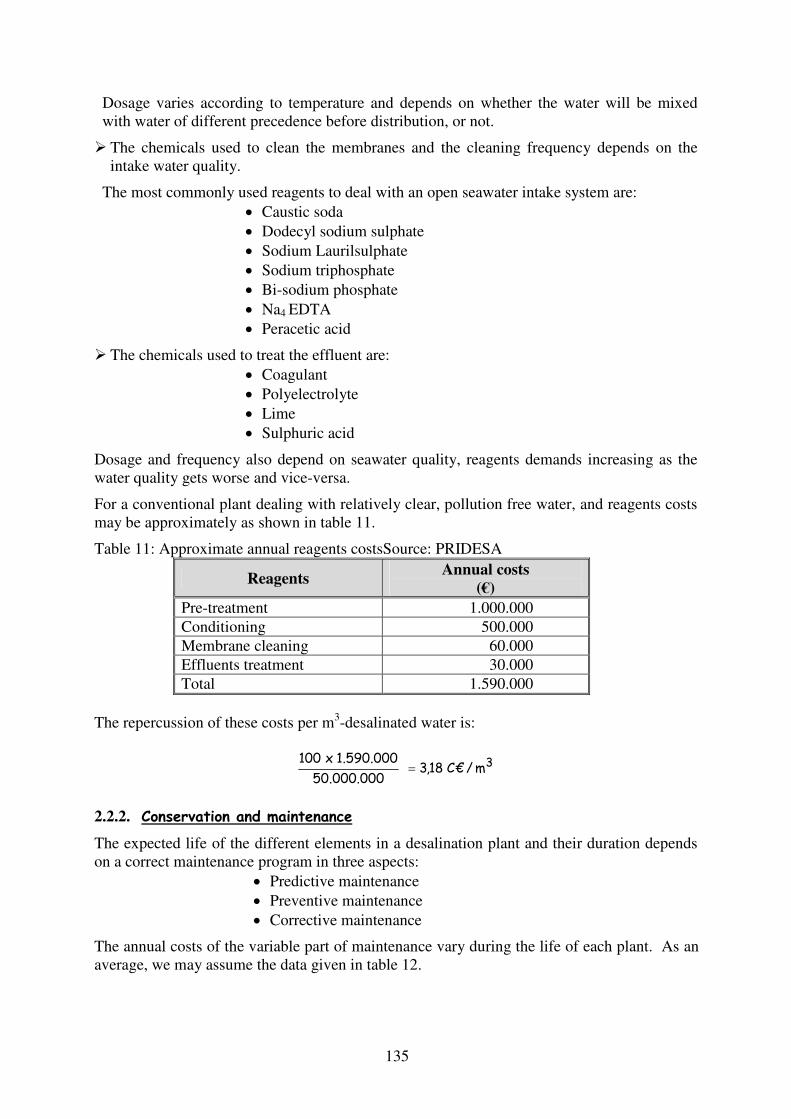
For a conventional plant dealing with relatively clear, pollution free water, and reagents costs may be approximately as shown in table 11.
Table 11: Approximate annual reagents costsSource: PRIDESA
Reagents Annual costs (€)
Pre-treatment 1.000.000 Conditioning 500.000 Membrane cleaning 60.000 Effluents treatment 30.000 Total 1.590.000
The repercussion of these costs per m3-desalinated water is:
�������� � ��
��� ��,� �
2.2.2. ��������������� ��������
The expected life of the different elements in a desalination plant and their duration depends on a correct maintenance program in three aspects:
� Predictive maintenance � Preventive maintenance � Corrective maintenance
The annual costs of the variable part of maintenance vary during the life of each plant. As an average, we may assume the data given in table 12.

� � �
� 136
Table 12: Annual maintenance costs. Applicable rate to the different items of equipment Source: PRIDESA
Item Applicable Rate Containers and tanks 0,8 Rotating mechanic equipment 4,3 Machinery drive mechanic equipment 1,5 Instrumentation 4,5 Pipes, valves and accessories 3,0 Centrifugal pumps 4,2 Electricity 4,3 Civil works 0,3
According to these data, the annual maintenance cost for a 50 hm3/year desalination plant would be around 1.100.000 €.
Its repercussion per m3-desalinated water would be:
������ �� � ��
�� ��,� �
2.2.3. Electric power
2.2.3.1. Specific power consumption
Each of the mentioned desalination plants specific power consumption is shown in table 13.
Table 13: Large desalination plants specific power consumption (kWh/m3) Source: PRIDESA
Plants Stages
Case 1 Case 2 Case 3 Abstraction and pre-treatment
0,63 0,57 0,45
Desalination (R.O.) 3,10 3,19 2,56
Leakage and miscellaneous 0,12 0,14 0,12
Total within the plant 3,85 3,90 3,13
External pumping 0,23 0,40 --
Total 4,08 4,30 3,13
As we can see, there are no absolute specific consumption coincidences, the reason being that consumption depends on the following:
� On production racks size
The larger the production lines and the global capacity of each plant, the lower its specific power consumption is. This is clearly seen when comparing 10.000 m3/day Carboneras’ racks plant with 7.225/8.500 m3/day desalination (R.O.) San Pedro del Pinatar plant.
� On sea water abstraction type
There may be significant differences within the open intake modality, depending on the abstraction type and head loss adopted.
� � �
� 137
� On the recovery system
The use of hyperbaric chambers reduces the plant’s specific power consumption in 0,4 – 0,5 kWh/m3 in relation to Pelton turbines. If we compare the data shown for case 3 (hyper-baric chambers for 20.000 m3/day per line) with Case 1 (Pelton turbines for 10.000 m3/day per line) we shall see that the combined effect of hyper-baric chambers with large scale production lines results in 0,54 kWh/m3 power savings.
� On raw water temperature fluctuations
The higher the seawater temperature is, the lower will be the work pressure and the specific power consumption.
� On location
When a desalination site is either very far from the intake point, or very elevated in relation to sea level, the specific power consumption will increase.
� On outwards pumping pressure
The pressure required for the pumps to boost desalinated water to the storage or distribution systems depends on altitude, on distance and on the size of pumps.
In order to calculate specific desalination power requirements, it seems clear that we should proceed in two steps:
� The first step will be to calculate the specific power consumption required to produce water.
� The second step will be to calculate the specific power required to transfer the product water to a point located at a given distance and at a given elevation in relation to sea level.
a) Specific power consumption within the plant
As we have seen in the three chosen examples, specific power consumption within a desalination plant ranges between 3,13 and 3,90 kWh/m3.
High pressure pumping equipment is already well tested for lines producing 10.000 m3/day using Pelton turbines.
According to Case 3, it seems conservative enough to suppose that, in the near future, the specific power consumption at the edge of the sea ( +5,00 m altitude) will be 3,13 kWh/m3.
b) Specific power required to transfer water to a different point
The additional power needed will depend on the delivery point location, altitude and distance.
From empirical studies, an approximate figure for the specific power consumption of transferring water to a point located 25 Km away and 50 m of altitude would be around 0,67 kWh/ m3
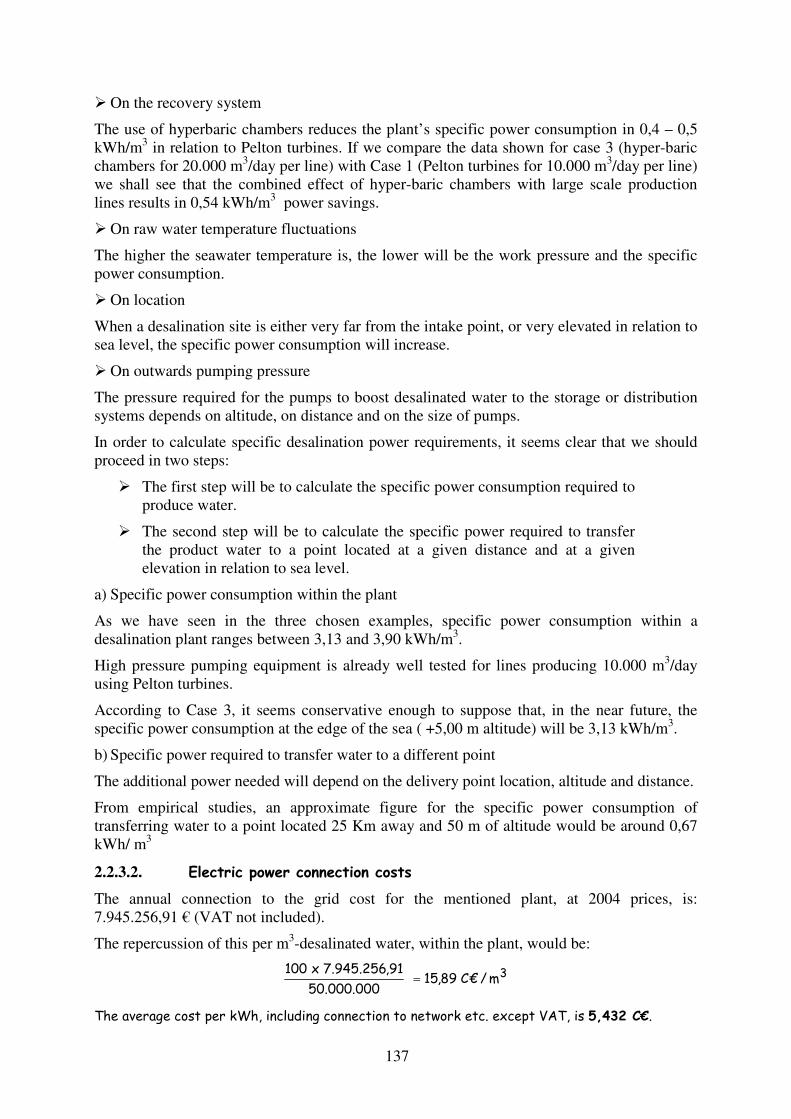
2.2.3.2. ���������� ����������������
The annual connection to the grid cost for the mentioned plant, at 2004 prices, is: 7.945.256,91 € (VAT not included).
The repercussion of this per m3-desalinated water, within the plant, would be:
��������� � ��
�����+�����,� �
�-��.-/�0-�1�23�4-/�56 �����178���0�1���-13����3���-39 �/5�-31��-,1-43�& # ���2����������

� � �
� 138
2.2.4. � � �������������� ��
Membranes replacement rate depends largely on raw water quality and on the efficiency of the applied pre-treatment.
When the raw water quality is poor and the applied pre-treatment does not improve it in a significant way, the membranes will need frequent washing, which will result in shortening their lives.
In general, we may say that for a properly operated open seawater intake plant, the annual membrane replacement rate will range between 10 and 15%, which represents an average 2,7 C€/m3.
3. TOTAL DESALINATED WATER COSTS PER m3
3.1. Without amortization
The cost per m3-desalinated water, within the plant, without amortization or VAT, is shown in table 14.
Table 14: Desalinated water cost per m3 within the plant, before amortization Source: PRIDESA
Costs Items Cost per m3 (C€)
Operation staff 1.12 Contracted power quote 1.14 Maintenance 0.29
Fix
Miscellaneous 0.48 Chemicals 3.18 Conservation and maintenance 2.20 Electric power 15.89
Variable
Membrane replacement 2.70 Total cost 27.00
3.2. Total
As was already said, the amortization sum will depend on the interest rate, on the amortization period and, of course, on the invested sum.
For an average investment sum, with a 25 years amortization period, at 4.0% interest rate, which seems reasonable when dealing with the State on a long term basis, the amortization sum would be 13,19 C€/m3, VAT included. (See Table 7)
Therefore, the total desalinated water cost per m3 within the plant, for 50 hm3/year, VAT included, would be:
13,19 + 1,07 x 27,00 = 42,08 C€/m3
If a private firm with a concession formula operates a plant, general expenses and industrial profit margins would increase the above sum. Considering this figure could be about 12% + 6% = 18%, the final cost (VAT included) would be:
(13,19 + 1,07 x (27,00 x 1,18) = 47,28 C€/m3
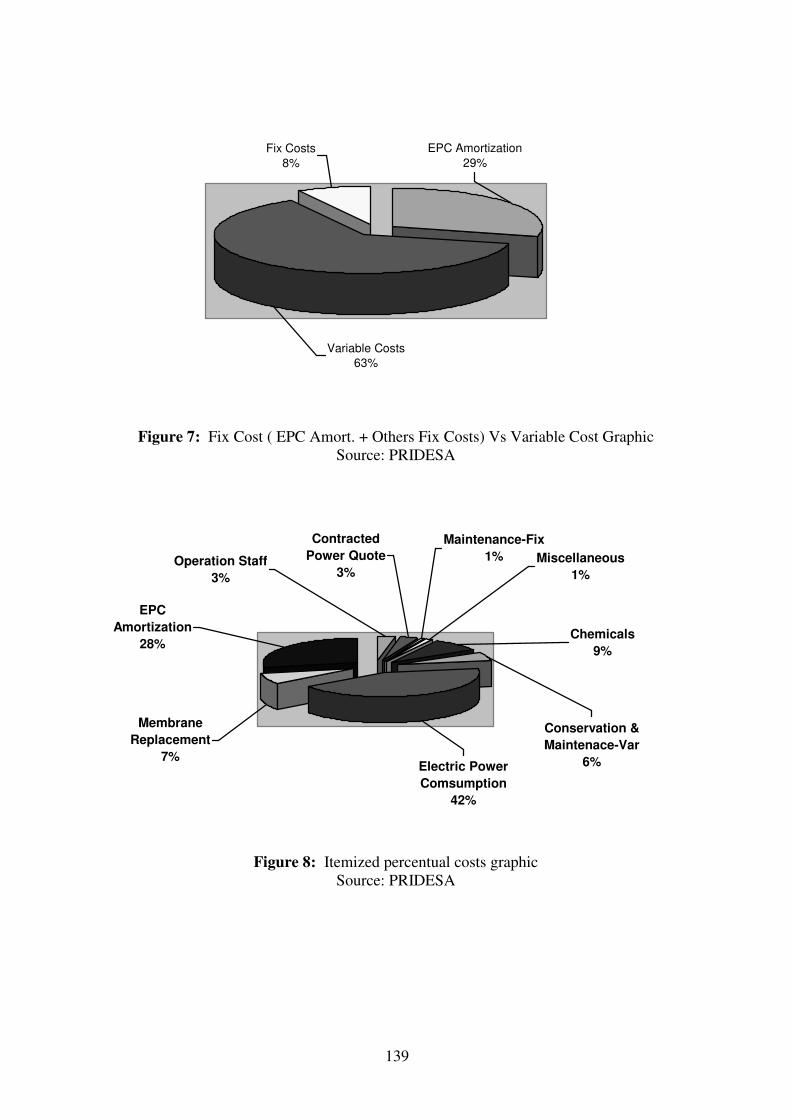
Figures 7 & 8 show the percentual cost for fix and variable and for each cost item:
� � �
� 139
EPC Amortization29%
Variable Costs63%
Fix Costs8%
Figure 7: Fix Cost ( EPC Amort. + Others Fix Costs) Vs Variable Cost Graphic Source: PRIDESA
Membrane Replacement
7%
EPC Amortization
28%
Operation Staff3%
Contracted Power Quote
3%
Maintenance-Fix1% Miscellaneous
1%
Chemicals9%
Conservation & Maintenace-Var
6%Electric Power Comsumption
42%
�
Figure 8: Itemized percentual costs graphic Source: PRIDESA

� � �
� 140
4. CONCLUSSIONS
Having in mind all the previous data, we can obtain the following conclusions:
� The new large scale RO desalination facilities to be designed in the near future, featuring pressure exchangers as energy recovery devices will produce desalinated water with an energy specific consumption of about 3,0-3,2 kWh / m3 (water at the desalinated water tank in the facility)
� Regarding the percentual split of costs, amortization plus energy is about 73% of the total cost, so these are the items to low for achieving significant reduction in the desalinated water cost.
� In Spain, energy costs could be lowered if a CCGT Power Plant would be exclusively dedicated to the RO facility power supply due to the constant rate at which it could run and the lower amortization period this implies, therefore energy costs would be lower
� Fewer and larger RO trains results in a lower initial investment and therefore in a reduction on its amortization
� Total cost of desalinated water, including every item, taxes, etc., is lower than € 0,50 per m3 (water at the desalinated water tank in the facility)
��