cost model and feasibility study. by
TRANSCRIPT

NOTICE: THIS MAI tiAL MAY BEPROTECTED BY COPYRIGHT LAW
(TITLE 17 U.S. CODE)
SOLAR PONDS FOR ELECTRIC POWER GENERATION:
COST MODEL AND FEASIBILITY STUDY.
BY
PHILIPPE LUCIEN DINTRANS
B.S., Swarthmore CollegetMechanical Engineering, 1983)
B.A., Swarthmore College(Economics and Public Policy, 19o3)
Submitted in Partial k ulfiilmentof the Requirements for the
Degree of
XASTER OF SCIENCE
at the
MAS SACHUTSETTS INSTITUTE OF TBECHNOLCGY
@ Massacnhusetts Institute of Technology
The author hereby reats M.I.T. permission to reproduce and todistribute copies of this thesis document in whole or in part.
Signature of Author
Departmed of Civil Engineering,September 1, 1964.
1'
Certified by
Professor D.H. MarksThesis Supervisor
Accepted by
Professor Franccis MorelChairman, Civil Engineering Dept. Committee
__ •
I

2
SOLAR PONDS FOR ELECTRIC POWER GENERATION:
COST MODEL AND •EASIBILITY STUDY.
BY
PHILIPPE LUCIEN DINIRANS
Submitted in Partial Fulfillmentof the hequirements for the
Degree of
MASTER OF SCIENCE
ABSTRACT
This research stuay exanines tre construction and
'easibility of solar ponds for electric power eneration. The
obn ective of tais tesis is to snow tnat ene tign cose ofr
soLar opona electric power facilities as well as the Z'inancial
and regulatory environment of tne electric uuility i•nustry
provides little or no incentive to invest in =nis ruel conserving
technology
A cost model is presented ti explore tee different cost
staucture that solar ponds may nave and to examine whicn
structure and construction scenario would ennance tniis effectiveness
in the eyes of the electric utility industry.
To quantify these costs, a 50 MW case study is developed
to snow that the primary drawback of solar ponds is their cost.
This is followed by an evaluation of the regulatory and
financial environment of the utilities to determine their
influence on solar pona investment.
Thesis Supervisor: Dr. David H. IarksProfessor of Civil zngineering
F[1
ACKNOTEDGXEMENTS
Special tnanks are given to Professor David H. Marks,
who fully supported this research study with his experience,
comments and encouragement.
The cooperation of Mr Micnaei J. Markow was fully
appreciated in structuring the cost mooel and tne construction
analysis. The researcn on the cost model and construction
analysis was sponsored by the Electric Power Reseacn Insticute
for a state-of-the-art study conducted at ..I.T. on salt
gradient solar ponas.
I also ~rcan- ~-y parents for their love and support.
Fhilipeo a. intrans
[:
Biographical Note
The author of this thesis was raised in France, Senegal,
.ebanon and in New York where he graduated from the Lycee
Francais de New York. He received his undergraduate education
at Swarthmore College and graduated with a Bachelor of Science
in m.echanical Engineering and a Bachelor of Arts in Economics
with the Concentration in Public Policy.
The undergraduate thesis in Mechanical Engineering was
entitled "Design and Testing of a Recreational Hovercraft".
ihe hovercraft attained a speed of 25mpn and demonstrated the
use of a bag-type skirt to increase lift and stability. The
author was named rinalist for the Scott Leadership Award at
Swar t hore.
__

5
TABLE OP CONTENTS.
1.- Introduction 10-14
2.- Keview of solar pond construction and technology *.. 15.342.1.- Technical review 152.2.- Literature review *<.........O............. 19
2.2.1.- Israeli experience ...................... 19S2..2.- united States............................. 22
2.2.2.1.- University of New Mexico ............. 232.2.22.2- 0' to State University ................ 252.2.2.3.- Argonne National Laboratory........... 262.2.2.4.- riamisourg .... 0...................... 26e.2.2.5.- Tennessee Valley Autnority ........... 27
3.- ConstLuctiun cost analysis ...... -*.,,*.*...**..** 35733.1.- Approach *.**O O*.000000000000•. *.000000..0 *33.2.- uost structure and comparison of existing ... 37
ponds3.2.1.o-- _arthwor4 ................................ ae
S". - ".3. "i•0s. •.. .... •• • •. •0.. ... ••... •.... •. ,
3.2.,..- ciscellaneous costs ..............3.3.- Categorization uo proposea ponds .............3.•.- Consrruction scenarios........... .... .. ....... 0 00000003.5.- Projection of construction costs .............
'I . .xcavation ........... ,........... *3.5.2.- Cite preparation ..- ".. ... 0a0 0 a.. .0, 0603.5. 3.- -ar tiwork costs ..
3.5.4.- .ite conditions and economies of scale....3. 5.- redging costs .3.5.6.- Salt 0....... 0...... ...............0.........3.5.7.- Land• - .ooo..ooo.o...o..oooeoo........e.. 0.
3*5.6.- Liner ............... 593.5.9.- Liner instaliation ....................... 613.5.10.- Liner material costs .................... 6,3.5.11.- Aiscellaneous costs ..................... 60
3.6.- Construction cost summary................ .... 673.7.- Projecti~u of maintenance costs .............. 693.b.- Construction schemes and their implication.... 71
for utilities
4.- Case study: 50 i{ solar pond .........0............. 74-1024. 1. Approacnh ..... 0.0 .00....*....0 . .0a00000a0. 7004.2.- Site description ..00-...0.......0...... ..0 70
4.2.1.- Bristol dry laKe . 754.2.2.- 'The Salton Sea ........................... 73
tr

4-.3.-- Construction features .............*..*06000000 81*4-3- 1.- Pond sizing O.
4.3.2.- Dike construction *.6......... . 364.3.3.- Sea floor sediments. ........... ...... .. , .4- 3.*4..- Dredging ....... 394. 3.5.- Liner... @.. @*...@. .......@....* ........ 39
4.4.- uost estimation or tne >0 mw solar pond ....... 914.4.1.- Total dike construction costs. . ,,,,*. , 914.4.2.- Dredging costs ................. ......
.4.-4.- Liscellaneous costs .............................. 94-5-- Conclusion ................................... 99
5.- The climate for utility investment in solar ponas ....103-123S5.1.- Approacn ................................... 3
5.2.- lectric utility rate regulation .............. 05.3.- Impact of solar systems on electric utilities.. 37S.4.- Effect of rates on solar system economics......1105.5.- Rate structures and solar system design........5.6.- Electric rate iiscrimination law .............. 1 5p.7.- dlectric utility rate miraking and the National.. n 1
Sne ry Act.
•i •5. .- utilit-- financial conaiLion .................... 2
- .- GConclusion " .2- 25
7.- bibLiograpny
r.
r[;R_

INDEX OF FIGURES
Figure 1.1 Schematic diagram of solar pond2.1 Structure, salinity and temperature profile
of a typical solar pond2.2 Arrangement of a Rankine cycle2.3 University of New Mexico pond2.4 TVA pond3.1 Cost breakdown of existing pon s3.2 Factors in the selection of & solar pond system3.3 Projected unit excavation ccts3-4 Histogram of projected unit excavation costs3.5 Pond area v.s. excavation costs for dike construction3.6 Excavation volume-Dike construction and basin
leveling3.7 Salt deposits in the US3.6 Liner installation3.9 Liner costs as a funetion of pond size3.10 Projected costs3.11 Unit costs, case comparison4.1 Layout of 5 •d pond at Bryst61 lake4.2 Jike cross section4-3 Soutneastern California.4 Saiton Sea
4.5 Salton Sea 5 MW pond4.6 600 I.i facility at the Salton Sea4.7 Layout of the 50 1M: pond at the Salton Sea4.3 Dike cross section4.9 Region to be deedged at the Salton-Sea-
- - -- - -- I -L- *-·I_ ~ _ ~ _

INDEX OF TABLES
Table 2.1 Design criteria and specifications of theTVA pond
2.2 Breakdown of pond costs2.3 Solar ponds in operation and proposed3.1 Projects reviewed for construction costs3.2 Construction cost breakdown for existing ponds33.3 Pond liners used4.1 Cost breakdown of 5 Mw pond4.2 Cost breakdown of 5 • jpond4.3 Cost breakdown of 600 Kd pond4.4 uonstruction cost estimate for the 50 :.
base case4.5 Busbar cost of electricity for the base case
•"
a
I-rrzr
%:
I.
?I
L.
I
--

Je dedie cette these a mes parents pourleur amour et support.
I also dedicate tnis thesis to Annie forher love and frienship.
..'

10
CHAPTER 1
INTRODUCTION
For many years, a major factor in the long term price
stability of electrical energy has been the low cost or
oiL. Low prices were enjoyed until the dramatic oil embargo
of 1973. This single event, the changing proportion of
fuel cost in electrical power productivn induced a .ajor sairt
in the planning of the electric utility industry.
The expansion -lans of these utilities had included
investments in oil based plants because o-" their -ease of
operations and load flexibiiity compared to zoal and nuclear
generating facilities. But as 1973 came to an -end nuclear
and coal power plants began to dominate tne new planning
scnedules.
Historically, technological inncvation in tne electric
utility industry has been characterized by economies or scale
involving the generating facilities and the transmission
networks. These effects were ti diminish as nuclear and
coal power plants approached the gigawatt range.
Several promising technological approaches have started
Fi

11
to emerge to reduce the high cost of fossil fuel and in
some cases to eventually reduce the need for conventional
coal and nuclear baseload.
These new promising technologies for electric powergeneration can be categorized as follows: wind, solar thermal
electric, and photovoltaics. One of the most promising of
these new technologies is salt gradient solar ponas. xcept
ror solar ponds, solar thermal electric , wind and
photovoltaics nave one common characteristic :intermittency.
Their energy output is variabie and depends on solar radiation
ani wind speed. They also do not possess any storage
capability eliminating their use as a baseload energy-source .
Tne great advantage of salt gradient solar ponds is
tneir unique ability to store thermal energy in tne bottom
layers of thn brine. This attribute is useful fnr process
heating and power production by eliminating the intermittency
factor.
The purpose of this thesis is to show that the high
cost of solar pond electric power facilities as well as the
financial regulatory environment of the electric utility
industry provides little or no incentive to invest in these
fuel conserving technologies.

12
To develop and illustrate this hypothesis, a cost
model ana a feasibility study are presented. Solar ponas
are horizontal surface collectors using the absorption of
solar radiation at the bottom of a 3 or 4. meter deep body
Sof water to generate low temperature heat. The low
temperature from these ponds may be used to provide heat
for buildings, for crop drying, for salt production or for
distillation. xiectrical power generation using solar ponds
coupled to low temperature aank.ine cycles ('igure .1) has
Sbeen acco-plished in Israel and has been stuAied for various
sites in the United States. A brier engineering .escription
of solar ponds is presented in Chapter 2 along witF a review
of existing solar pons in Israel and the , nited s:ates.
In oraer to cCnduc, this stuay on the feasibility oi-
solar ponds, a new r;et.u. for construction analys-s of
these facilities is presented in Cnapter 3 to explore .he
difierent cost structure that these facilities .-a-- have
and to examine whicn structure and cvnstruction scenario
would enhance their cost effectiveness in Wne eyes of the
electric utility industry. Tne approacn taken is innovative
and can be used Uo predict costs for a wide range of
capital intenoive land intensive Lacilities.
To quantify these costs, a proposed 50 M:i solar pond
F-.. site in Southern California is used as a base case in Chapter

CONDENSER
\ \
\
\LOW SALT CONTENT CCOL(LIGHTER LAYER FLOATS ON T
S " '. $HIGH SALT CONTENT HOT WA
.. '.' (HEAVIER LAYER' SINKS TO 8L
" e
* *' * * * .* .* * .'*6 .* * :* V ** V**: * : * ** * **. : * *, ** D * ARK HEA? ABiiSOfRBING. OOTTOM' :0 % *6 4. 0 0 4 1 1 % 11 t
V ** '* ' **
Figure 1.1 : Schemat~l diagram ot' solar pond. (source Adams)
RATOR

4. At this point, we discovered that the major adverse
effects of solar ponds were limited to the high cost of these
facilities. These costs snow that solar ponds are not
competitive with conventional energy sources.
To evaluate the overali climate for electric utility
invest.nent in solar ponds, a range of complex and often
controversial issues such as the impact of solar systems
on electric utilities, toe financial con4ition of the
utilities, and the effect of the Public Ut7~ities .-eguia3ory
.c; (WFURfA) are presented to determine rteir oositive or
negative consequence on tne utility in-estme;..
The final analysis of this thesis topic Aonciudes ,
assuming the technical feasibility of solar ponds, that tne
najor barrier to such highly capital intensive investments
is the predominantly high cost of these facilities coupled
with the uncertain financial and re-jalatory environment of
tne electric utility industry.
_ __ __ _ _ ~ ~_ IL ___ _I

15CHAPTER 2
,REVIEW OF SOLAR POND CONSTRUCTION AND TECHNOLOGY
2.1.-Technical review.
To understand the issues involved in evaluating the
economic feasibility of salt gradient solar ponds for the
purpose of electric power generation, a brief technical and
historical review of solar pond development is presented.
Salt gradient ponds or lakes which exhibit an increase
in temperature with depth have existed in nature for a long
time. If the salt concentration is sufficiently steep and the
surface of the pond is protected from mixing induced by the
wind, then the solar radiation can raise the temperature of
the main body of water well above the ambient temperature.
A solar pond is a body of liquid, usually orine, which
collects the energy from the sun and stores it as heat. The
brine, about three meters deep is introduced into the pond
and maintained in such a way as to establish a salt gradient
of increasing concentration with depth to suppress natural
convection. The bottom layer of the brine collects and
retains solar energy as heat. This heat gradient serves as
the source of energy for generating eiect-ic power in a vapor
cycle unit similar to a conventional steam power plant. The
structure, salinity, and temperature profiles for a typical
solar pond are shown in Figure 2.1.

CONCENTRAT
BRINE 23%
0.2 - 0.5 meters
0.75 - 1.5 meters
1.0 - 3.0 meters
20%
SALINTTY
PROFILE
:igure .1:
TEMPERATURE
PROFILE
structure, Salinity and Temperature Profiles:or a ..ypical Zoiar pond (Adas .i-, 9).
ucz
GZ
BCZ
6% 20 0 C 850 C
__
1_III__II1IIIIIIIIII~ --·~-~-··---·-----Y~I ______ ·_ _ -
-- --
I--
-- -- -- - --
,, m ,,,..m w

17The state-of-the-art solution is to use a vapor as the
working fluid in the turbine of a Rankine cycle. The closed
cycle unit operates as a simple Rankine cycle engine. The
arrangements are shown in Figure 2.2 . The evaporator uses
heat transferred from the hot brine to produce vapor to
generate power in the turbine and is discharged at the
condenser, it is then condensed by. heat transferred from the
cooling water. the cooling water could come from the cool
upper convective layer of the solar pond, from a separate
cooling pond which could also serve as the evaporation pond
or from a conventional source of cooling water. The
condensate is then raised in pressure by the feed pump and
returned to the evaporator to complete the cyclic process
(Carmichael, MIT 1984).
The energy budget for a solar pond depends on four
primary factors:
- Penetration and absorption of short wave solar
energy.
- Diffusion of heat to the gradient zone from the
bottom convective zone.
- Ground heat loss from the bottom from the bottom of
the pond and
- Heat extraction.

T(t~t XTV 'Ta~U•a_ oTu'~V -
aTOR'~ a~tpu~~.TO 4uGuaGuJJV -doa : -'i an•Tr
I
I ..O.LVlOd VA3
II •j 10.LEIO d vA3
__
I
19
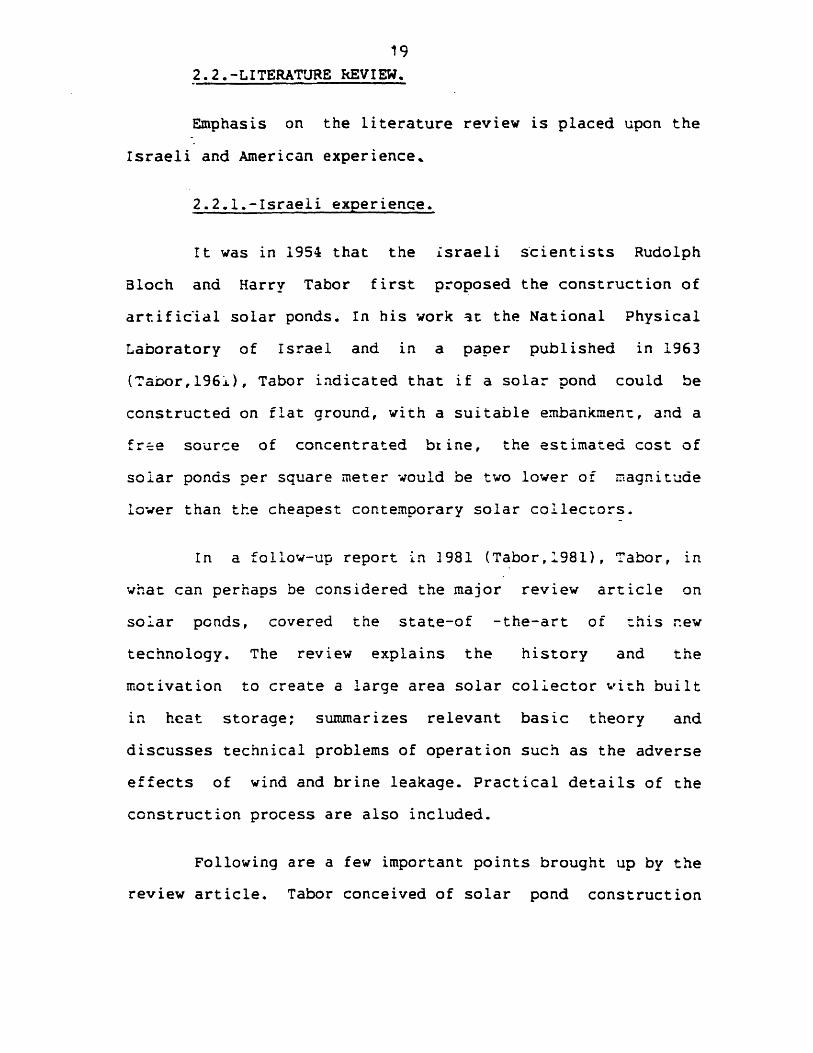
2.2.-LITERATURE REVIEW.
Emphasis on the literature review is placed upon the
Israeli and American experience.
2.2.1.-Israeii experience.
It was in 1954 that the israeli scientists Rudolph
Bloch and Harry Tabor first proposed the construction of
artificial solar ponds. In his work at the National Physical
Laboratory of Israel and in a paper published in 1963
(TaDor,1961), Tabor indicated that if a solar pond could be
constructed on flat ground, with a suitable embankment, and a
free source of concentrated brine, the estimated cost of
solar ponds per square meter would be two lower of magnitude
lower than the cheapest contemporary solar collectors.
In a follow-up report in 1981 (Tabor,1981), Tabor, in
what can perhaps be considered the major review article on
solar ponds, covered the state-of -the-art of :his new
technology. The review explains the history and the
motivation to create a large area solar collector with built
in heat storage; summarizes relevant basic theory and
discusses technical problems of operation such as the adverse
effects of wind and brine leakage. Practical details of the
construction process are also included.
Following are a few important points brought up by the
review article. Tabor conceived of solar pond construction

20
as leveling a site area and building a retaining wall around
the perimeter. This would lead as Tabor points out, to a
considerable difference between the upper surface area and
the lower surface area and to a large increase in the area of
linirg needed vis-a-vis the active area for small ponds. This
effect is small for large ponds. The article recommends a
slope of 1 in 3 for the-embankments. Furthermore loss of
collected heat can occur either by the leaking of the brine
from the bottom of the pond, or by conduction of heat into
the ground. To ensure no leakage earthliners and synthetic
liners are examined, the latter being strongly recommended.
The cost according to Tabor is tolerable assuming that
there are many areas where salt is locally available. Also,
in large installations, solid salt may be imported to get the
project going but concentrated salt will then be produced on
the site Lnrough evaporation. Ponds discussed in the article
include Yavne and Ein Bokek in Israel, the Aspendale 1964
Australian solar pond project ( which had poor efficiency
results compared to Israeli ponds), and some US ponds: the
Ohio State pond, the University of New Mexico pond, and the
Miamisburg pond.
Tabnr's discussion of costs is of particular interest
to our study. The So"mat Company (Tabor,1981) calculated that
it could build ponds in most areas for $13 per square meter.
Small ponds are considerably more expensive per unit area
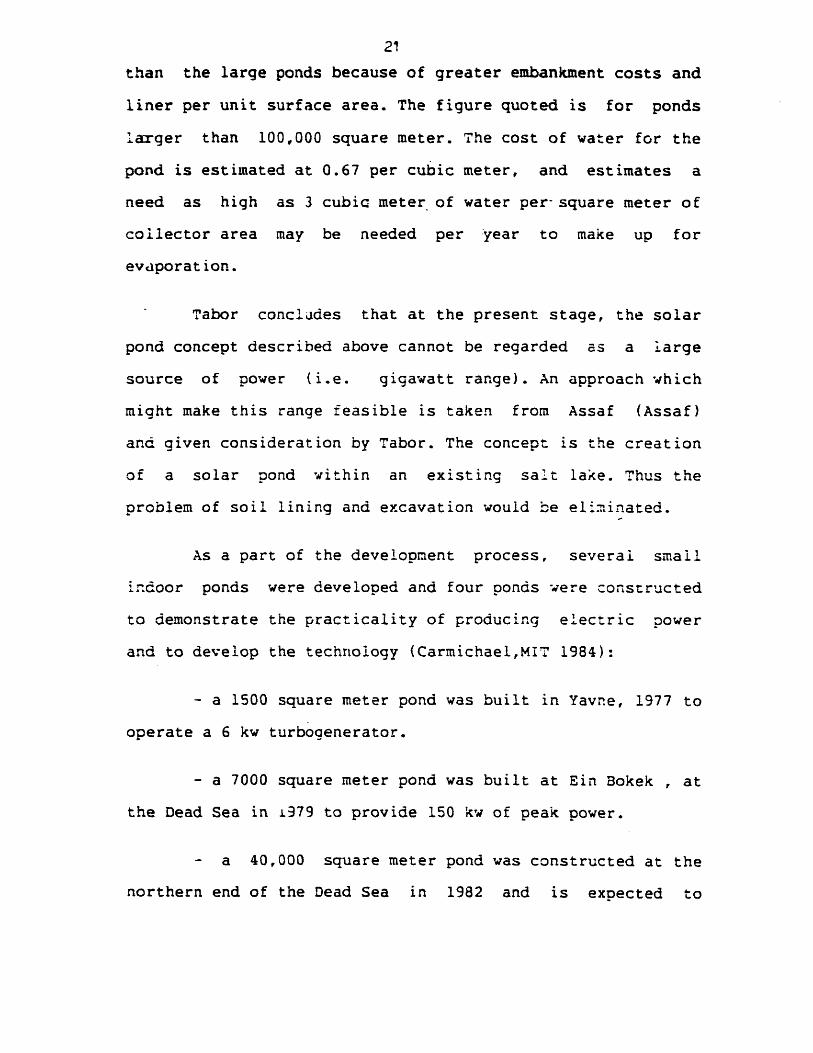
21
than the large ponds because of greater embankment costs and
liner per unit surface area. The figure quoted is for ponds
larger than 100,000 square meter. The cost of water for the
pond is estimated at 0.67 per cubic meter, and estimates a
need as high as 3 cubic meter of water per-square meter of
collector area may be needed per year to make up for
evaporation.
Tabor concludes that at the present stage, the solar
pond concept described above cannot be regarded as a iarge
source of power (i.e. gigawatt range). An approach which
might make this range feasible is taken from Assaf (Assaf)
and given consideration by Tabor. The concept is the creation
of a solar pond within an existing salt lake. Thus the
problem of soil lining and excavation would be eliminated.
As a part of the development process, several small
indoor ponds were developed and four ponds were constructed
to demonstrate the practicality of producing electric power
and to develop the technology (Carmichael,MIT 1984):
- a 1500 square meter pond was built in Yavne, 1977 to
operate a 6 kw turbogenerator.
- a 7000 square meter pond was built at Ein Bokek , at
the Dead Sea in 1979 to provide 150 kw of peak power.
- a 40,000 square meter pond was constructed at the
northern end of the Dead Sea in 1982 and is expected to
I _
22
provide the energy for a 2.5 MW turbine operating as a
peaking unit.
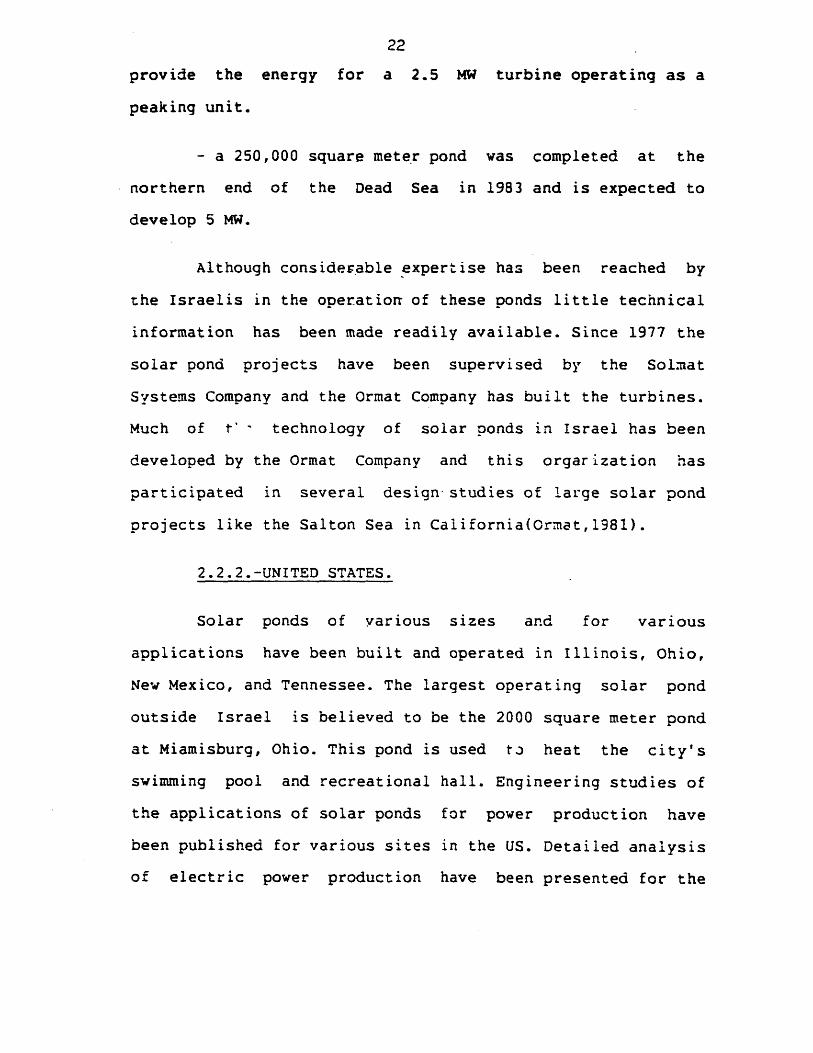
- a 250,000 square meter pond was completed at the
northern end of the Dead Sea in 1983 and is expected to
develop 5 MW.
Although considerable expertise has been reached by
the Israelis in the operatior of these ponds little technical
information has been made readily available. Since 1977 the
solar pond projects have been supervised by the Solmat
Systems Company and the Ormat Company has built the turbines.
Much of t' - technology of solar ponds in Israel has been
developed by the Ormat Company and this orgarization has
participated in several design studies of large solar pond
projects like the Salton Sea in California(Ormat,1981).
2.2.2.-UNITED STATES.
Solar ponds of various sizes and for various
applications have been built and operated in Illinois, Ohio,
New Mexico, and Tennessee. The largest operating solar pond
outside Israel is believed to be the 2000 square meter pond
at Miamisburg, Ohio. This pond is used tJ heat the city's
swimming pool and recreational hall. Engineering studies of
the applications of solar ponds for power production have
been published for various sites in the US. Detailed analysis
of electric power production have been presented for the
23
Truscott Brine Lake in Texas, the Great Salt Lake in Utah and
the Salton Sea in California.
2.2.2.1.- University of New Mexico.
F.Zagrando and H.Bryant of the Department of Physics
and Astronomy of the University of New Mexico (Zagrando and
Bryant,1977) provide.-us with a thorough description of their
solar pond. The report reviews the resarch done to establish
operational parameters as well as cost, material and
performance criteria to be used for the design and
construction of the ponds.
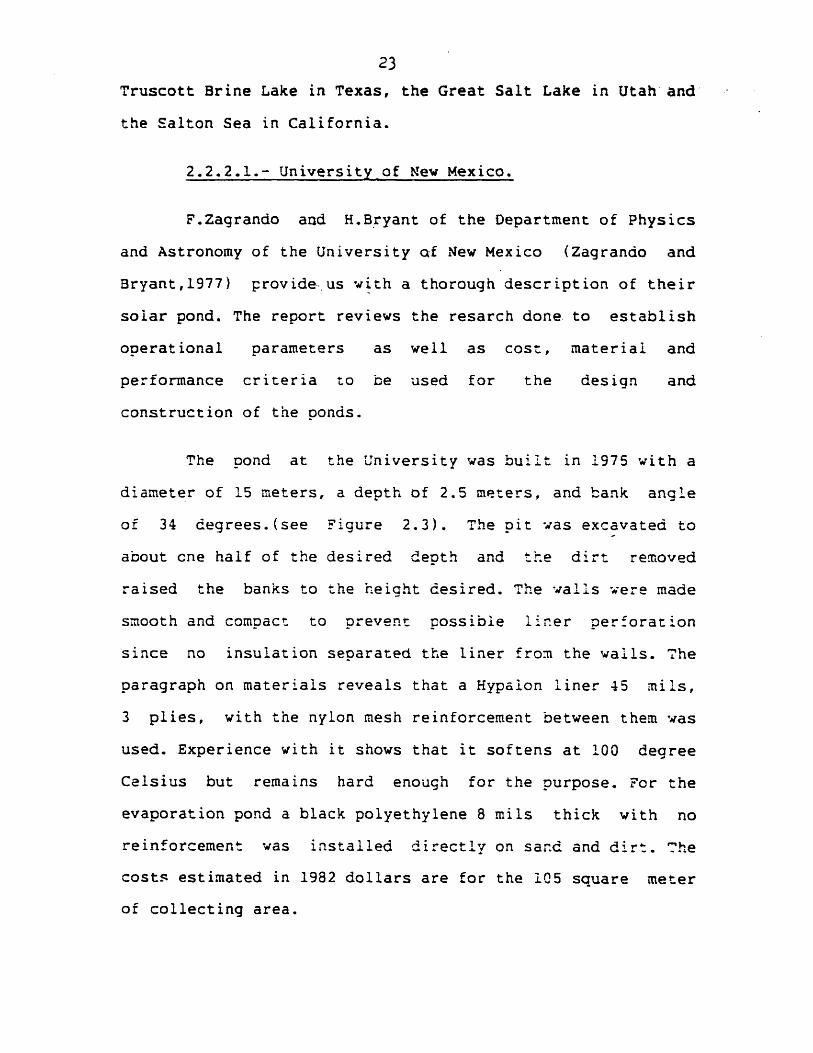
The pond at the University was built in 1975 with a
diameter of 15 meters, a depth of 2.5 meters, and bank angle
of 34 degrees.(see Figure 2.3). The pit was excavated to
about cne half of the desired depth and the dirt removed
raised the banks to the height desired. The walls were made
smooth and compact to prevent possible liner perforation
since no insulation seoarated the liner from the walls. The
paragraph on materials reveals that a Hypalon liner 45 mils,
3 plies, with the nylon mesh reinforcement between them was
used. Experience with it shows that it softens at 100 degree
Celsius but remains hard enough for the purpose. For the
evaporation pond a black polyethylene 8 mils thick with no
reinforcement was installed directly on sand and dirt. The
costs estimated in 1982 dollars are for the 105 square meter
of collecting area.
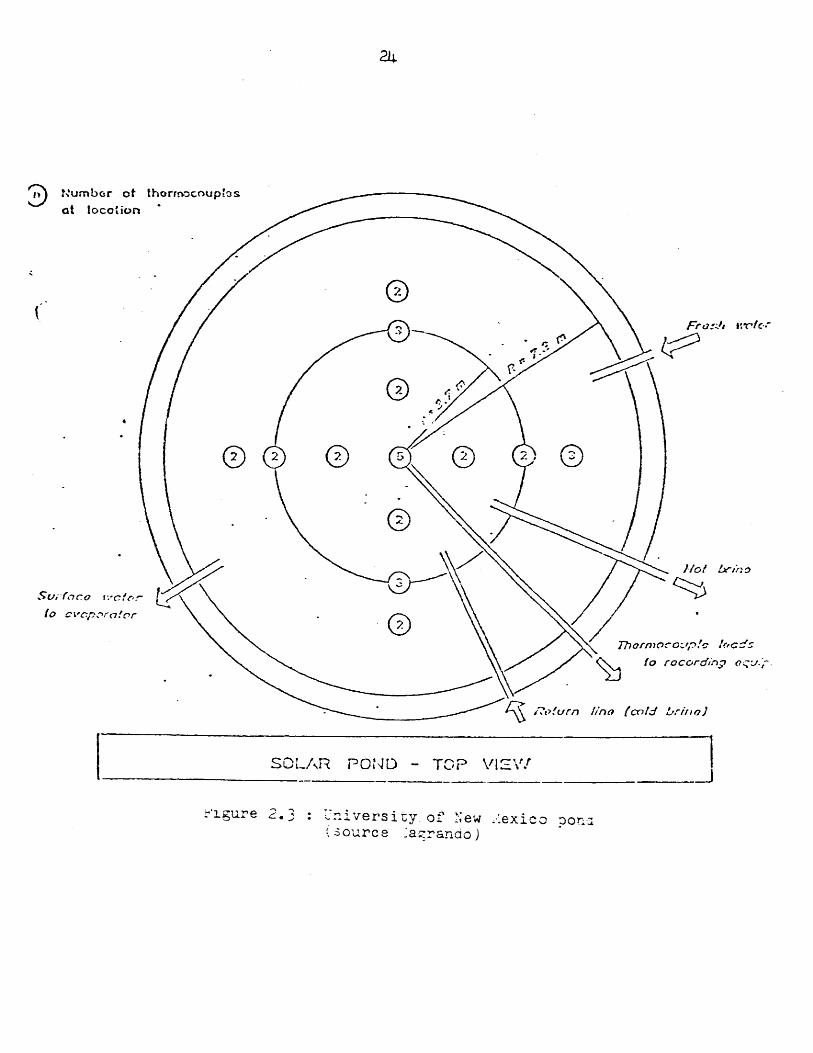
24
SIumoor orat IocoHion
Suwfaco r:*cf&:
o c"'vcpo'rcor
Freo:h .svfer
Io// Lein
"ocord;•n equ.t*
1i1rno]
SOLAR POND - TOP Vi\'l
gure 2.3 : Tniversity of ;ew :exic con-rA(source aerando)
-----~~ - II ~s"-~ --LC I I -- I
--
fl .. . · · ·

25
1. Excavation $1,341
2. Hand Labor 596
3. Liner 2,235
4. Salt 40 tons 2,086
Total $6,258
or 59.6 dollars per square meter.
2.2.2.2.-Ohio State University.
A solar pond of 200 square meter and a depth of 2.5 m
depth was built in 1975 at the Ohio State University
(Nielsen,1980). The pond was planned to be an economic
prototype pond for space heating and was designed according
to Ohio State Physicist Carl Nielsen for minimum cost
compatible with reliability. The pond has a square
configuration and is lined by an 0.8 am thi4k nylon
reinforced black chlorinated polyethylene. The banks are
above the level of the surrounding field. The specified
dimensions of the pit were 12 m across the bottom, a 45
degree bank angle and 18 m at the top of the bank giving a 3
m depth to contain 2.5 m of water. The cost to duplicate the
pond as described is as follows:
1. Salt 60 tons$3,744
2. Liner 3,725
3. Other 3,874
Total $11,175
or 55.8 dollars per square meter.

26
Maintenance costs were not included in the estimate '
except for $50 per year for salt replacement.
2.2.2.3.-.Argonne National Laboratory.
The construction and first year's operational results
of the Argonne National Laboratory Research pond are
discussed in (Hu-ll,1982). The 1000 square meter pond was
completed in 1980. The pond is 43m x 25m at the top with
sides tapered at 45 degrees to a depth of 4.27 meters.
Excavation dirt was used to build a berm above the original
ground level and the clay soil was compacted enough to be
stable at a 45 degree slope. The liner used is XR5,
manufactured by Shelter Rite ( a division of the Seaman
Corporation) and was loosely fitted on the soil to provide
allowance for ground movement without stressing the liner. A
cost of $80 per square meter for the pond is provided but no
cost breakdown for the different components was available.
2.2.2.4.- Miamisburg.
During 1977, the city of Miamisburg, Ohio started
construction of what was at the time the largest solar pond
in the United States. The pond developed as part of the
Miamis~brg Community Park Development Project was designed to
heat an outdoor swimming pool in the summer and to heat a
recreational building in the winter.
The pond has a collecting area of 2000 square meter
27and is 54.5 m long and 36.4 m wide. The sides are tapered at
an angle of 45 degree to a depth of about 3 meters. L.J.
Wittenberg from the Monsanto Research Corporation (Wittenberg
and Etter,1982) not only addresses the construction costs of
the facility but also the -maintenance costs. These
maintenance costs will be reviewed in a later chapter. The
cost of the Miamisburg pond amounted to $76,972 in 1982
dollars. The breakdown of costs is:
i. Salt 1100 tons $23,974
2. Excavation 12,100
3. Liner 27,830
4. Miscellaneous 14,278
These costs amount to a unit cost of S38.2 dollars oer
square meter. The liner and the salt represent :he largest
capital investment. The liner used is a 0.7 mm thick,
chemically resistant polymer coated polyester fabric. The
fabric was supplied in sections that were welded during
installation in the pond excavation.
2.2.2.5.- Tennessee Valley Authority (TVA).
The largest pond in the United States is the Tennessee
Valley Authority pond near Chatanooga; approximately one mile
north of the Tennessee River Chickamonga dam. The 400 square
meter pond was constructed in 1981 and 1982 to demonstrate
the technical and the economical feasibility of the
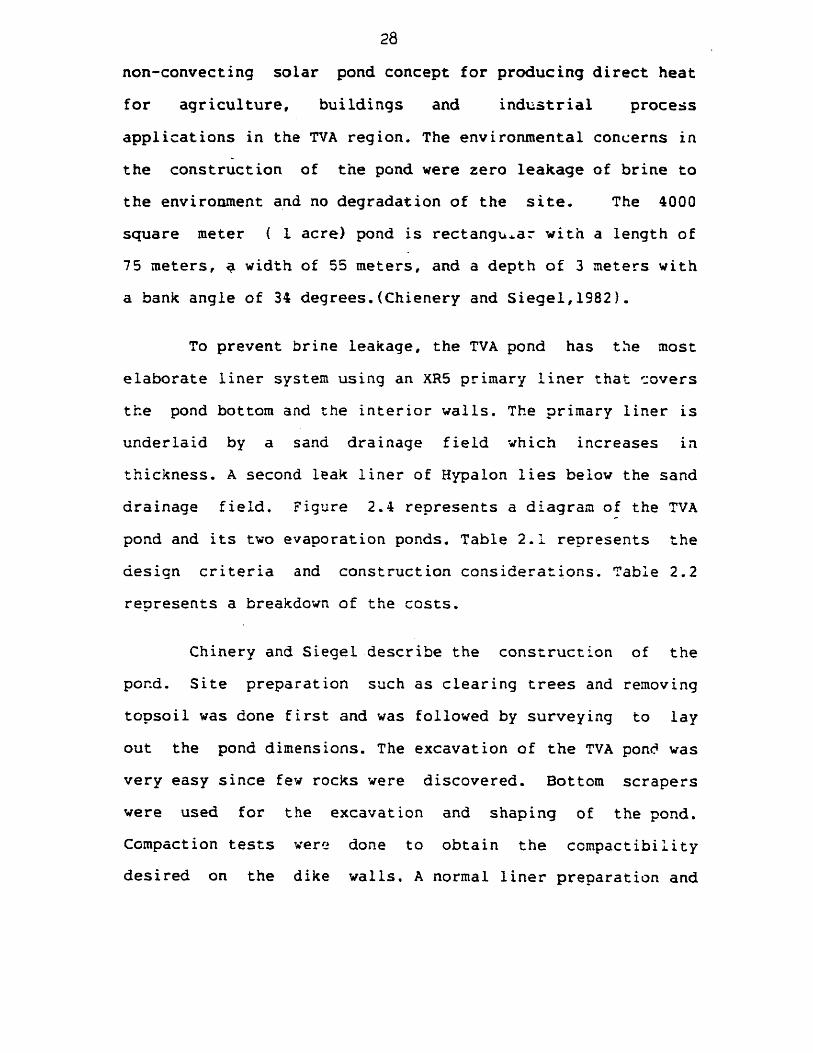
28
non-convecting solar pond concept for producing direct heat
for agriculture, buildings and industrial process
applications in the TVA region. The environmental concerns in
the construction of the pond were zero leakage of brine to
the environment and no degradation of the site. The 4000
square meter ( I acre) pond is rectangular with a length of
75 meters, a width of 55 meters, and a depth of 3 meters with
a bank angle of 34 degrees.(Chienery and Siegel,1982).
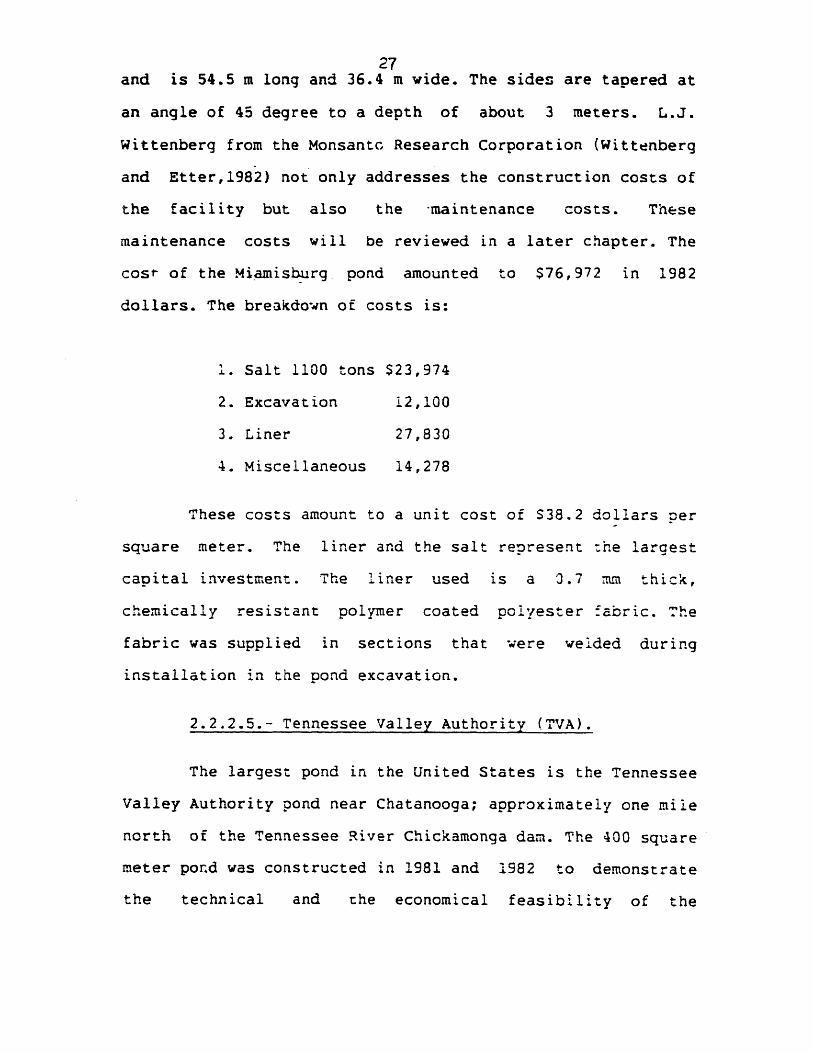
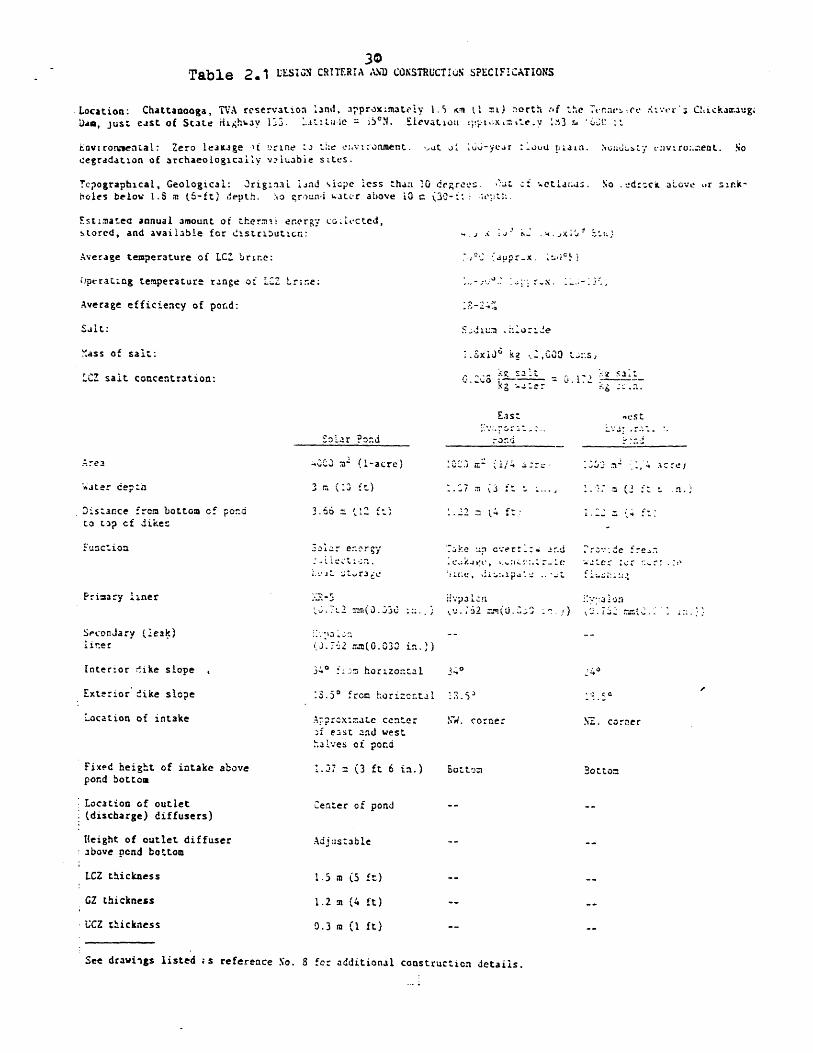
To prevent brine leakage, the TVA pond has the most
elaborate liner system using an XR5 primary liner that covers
the pond bottom and the interior walls. The primary liner is
underlaid by a sand drainage field which increases in
thickness. A second leak liner of Hypalon lies below the sand
drainage field. Figure 2.4 represents a diagram of the TVA
pond and its two evaporation ponds. Table 2.1 represents the
design criteria and construction considerations. Table 2.2
represents a breakdown of the costs.
Chinery and Siegel describe the construction of the
pond. Site preparation such as clearing trees and removing
topsoil was done first and was followed by surveying to lay
out the pond dimensions. The excavation of the TVA pond was
very easy since few rocks were discovered. Bottom scrapers
were used for the excavation and shaping of the pond.
Compaction tests were done to obtain the compactibility
desired on the dike walls. A normal liner preparation and

29
FENCE, RA P
DIKE E'
SOLAR POND
256'x 181'x 10'
EQUIPMENT ANDINSTRUMENTATI'N
Z L\LG / zMP -/ ! :·
- · ~T7- A 3 T* _ __ __ _ ._-t-
NEST .ASTEVAPORATION EVAP ORAT
1 ACRE SALT GRADIENT POND
Figure 24 ': VA pond
_ __ __ -I--·I^-9-··-P ~---·- 111~1 - ·~- --- ·
30Table 2.1 LESIGN CRITERIA .'i) coNSTRUCTIuS SPECIFICATIONS
Location: Chattanooga, TVA rcservatro n land, ipprox.matelv 1.5 v!' q i 70-orth ,Ie 2w Thrar--ce g C:ckJwJaugD)dim, just e st of State HiLchuav u . .. itiUfle i5CN. 1evatiou x, te. v :3 rs. '3!:
Enovironzsen al: Zero leaLjge 1i !ýrxren. :3 '-:e ev.r:nment. ,,t *JI *uU-Wixyr :-ou .tl-iaia. --: ,ro.enLt. Socegradation of archaeologicallv v~iuabei Sites.
?cpographical, Geological: 3rig.aai l n6j %icpe 'ess hai: 20 !G degrees- j L ft t I a 1.,15 So - i-c.v- ;?cOLatov ri r.k-kloles below 1. 8 (6-ftj *eptO. ýo zr;un'i ArA w. above ir c .30-::
Fst?:atec annual amount of th'ermii energ-y cGc.ICtCd,stored, and availahle for distributicn:
Average temperature of LCZ brir.e: . - .duprx. ;AiH
Operating temperature range oi rire; -
Average efficiency of pond:
SJit:
:ass of salt:
L.'C salt concentration: :at
Water ce;n
Dis:acce from bottom of pondto t•Lp f diikes
Function
Primary liner
SeconJary fleak)±i.er
Interior :ike slope
Exterior dike slope
Location of intake
Fixed height of intake abovepond bottom
Location of outlet(discharge) diffusers)
Height of outlet diffuserabove ncpond bottom
LCZ tthickness
GZ thickness
UCZ thickness
See drawings listed ;s reference No.
So .r ?o::d
m (1J !-acre!
I~; L 271(.j3 i.'i.J :.J (0 30 r
340 hor~zon-al
:S. 50fron ~:oizor. crt
An:-CX:aL C rentereast and west
.alves ci pond
.7m(3 ft 6 in.)
E3S:
X4corne:
.. cSt
* . - .r.-.
* . .. 0 i.. . . .
YE;". corner
Bottom,
Center of pond
Adj ustable
1.5 m (5 ft)
1.2 m (4 ft)
0.3 m (1 ft)
8 for additional constructicn details.

Actua_ Elipenriditures
Design and detaiied Enginecring S .,17..Drfti ngEngineering ProcurementConstruction SupervisionProject Cost Estimating 73.99Construction Labor -.. s.2Travel .
'.ajor Equipment S7,4. 2Clearing.xcavat ion ,
Gravel RoadSL;rveyvTestzngTher,-Eoorir.gs- .-:and Blanket -,'.Fine Grading :or l-rpalonSterIlizat t*:nderdrains 1""oblizaton L. .... .livpalon .iaderiLner 2:yalJon Evap:craticn ond Li.er -..:-5 8130 Liner .Bonding
Electrical -5,3 -.cncre r2. .7e
Freight 3M~isceiianeous (Fence) -3,46.Zssalt _,, gO
Grand Total S375,249.1 2
'able 2.2.: Breakdown of pond costs%A
ý1
_ ~ _ _L __I_ _ _ _ _ ~ ~ _ _

32installation procedure was followed and will be described
later. The seams were bonded on site and thoroughly checked
resulting in the discovery of many leaks that had to be
repaired before the job could go on.
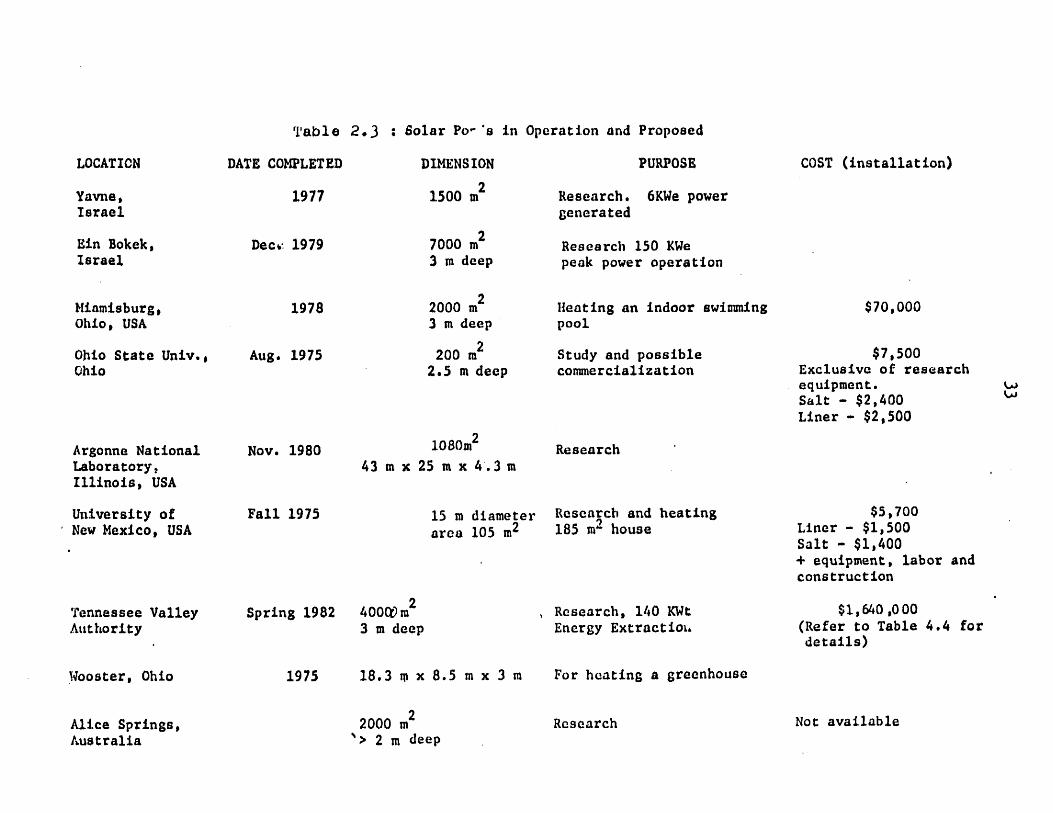
Table 2.3 summarizes the solar ponds in operation and
the sites under consideration.
lTable 2.3 : Solar Po 's in Operation and Proposed
LOCATION
Yavne,Israel
Ein Bokek,Israel
Miamisburg,Ohio, USA
Ohio State Univ.,Ohio
DATE COMPLETED
1977
Deck 1979
1978
Aug. 1975
DIMENSION
1500 m2
7000 mi2
3 m deep
2000 m3 m deep
200 m22.5 m deep
PURPOSE COST (installation)
Research. 6KWe powergenerated
Research 150 KWepeak power operation
Heating an indoor swimmingpool
Study and possiblecommercialization
$70,000
$7,500Exclusive of researchequipment.Salt - $2,400Liner - $2,500
Argonne NationalLaboratory,Illinois, USA
University ofNew Mexico, USA
Tennessee ValleyAuthority
Wooster, Ohio
Alice Springs,Australia
Nov. 1980
Fall 1975
Spring 1982
1975
1080m2
43 mx 25 mx 4.3 m
15 m diameterarea 105 m2
4000Cm 2
3 m deep
18.3 m x 8.5 m x 3 m
2000 m2
%> 2 m deep
Research
Researcb and heating185 m2 house
Research, 140 KWtEnergy Extractioi.
$5,700Liner- $1,500Salt - $1,400+ equipment, laborconstruction
and
$1,640,000(Refer to Table 4.4 fordetails)
For heating a greenhouse
Research Not available
I .

T'able 2.3 : Continued
PROPOSED PONDS
LOCATION DATE COMPLETED
Salton Sea,California
Salton Sea,California
Truscott BrineLake, Texas
DIMENSION
1 km2
5 m deep
12 modules(50 MWe each)106 km2
80000 m2
PURPOSE
5 ~We Demonstration pond
Energy generation600 MWe + salinityreduction of lake
To supply energy forRed River chloridecontrol project1.9 MWe at 15% plantcapacity factor
COST (installation)
$25*10 - 30*106
$1.1*109
$5*106
New Dead Sea 10 acrePond I
New Dead Sea
Pond II
Fall 1982 60 acre
5 MWe peaking(few hours/week)Research
5 MWe peakingResearch

35CHAPTER 3
CONSTRUCTION COST ANALYSIS
3.1.- Approach.
The approach used to arrive at our findings was
twofold: first we identified the cost structure of current
solar pond technology. This structure was developed through
the review of the literature done in the preceding chapter to
identify the major cost components of solar ponds as well as
their respective percentages of total construction
expenditures. Data from bid abstracts for several classes of
heavy construction projects were then used to establish cost
curves, to investigate likely variations in costs, and to
determine whether economies of scale exist in solar pond
construction. Data gained from conversations with material
suppliers are also presented for the calculation of
construction costs.
The projects for which data was available were
reviewed and are listed in Table 3.1. These ponds have a
collecting area ranging from 105 to 4000 square meters.
Except for the Miamisburg pond which heats a swimming pool,
they can all be classified as research oriented ponds. As we
have seen from the review the only project for which
relevant, well documented detailed construction cost data are
available is the Tennessee Valley Authority pond. The other
_

Table 3.1: Solar Pond P ~•jects Reviewed for Construction CostsTable 3.1: _~-~-~_;~~t c~w' _ ot
NameDate of Operation
TVA 1982
Miamisburg 1978
Argonne Lab 1980
Ohio State 1975
N.N.M. 1975
Collecting Area(m2)
4000
2000
1080
200
105
Shape
rectangular
rectangular
rectangular
square
circular
DLmensions(m)
75 x 55
36.4 x 54.5
43 x 25
14.25 x 14.25
Diameter: 15 m
Depth(m)
3
BankAngle
34*45*
4.3
2.5
2.5
45*
34"

37projects give only aggregate or summary statistics; few
details on cost itemization or construction procedures. For
the Argonne National Laboratory pond, only total construction
costs appear in the literature; no further breakdowns have
been published. No data could be found on the ponds being
built in Hawaii, or the pond at SUNY in Buffalo.
3.2.-Cost structure and compari3on of existing ponds.
The costs to construct a solar pond are influenced by
several factors:
- The site location, land costs and regional
construction cost factors;
- The facility scheme (i.e., whether the pond is
located in an existing body of water, or is a man made pond;
- The area and the depth of the pond required (for
power generation, evaporation, emergency storage);
- Soil properties (relat- to both excavation and
permeability);
- Availability and cost of salt;
- Lining requirements (influenced by both soil
properties noted above and environmental and construction
regulations); and
- Other facility requirements for security, safety,
_ _

monitoring and so forth.
The major cost categories of pond construction were
given as follows: land, excavation, liner, salt, and
miscellaneous costs. We have conformed to this structure as
much as possible. In tabulating the data all costs were in
1982 dollars and have represented the fully installed or as
built cost of each item including the labor, equipment and
material costs.
3.2.1.- Earthwork.
The earthwork costs include the excavation, haul,
compaction, fine grading, and sterilization of native soil or
borrow and range from 10% to 20% of total pond construction
as shown in Table 3.2. The costs may vary for several
reasons, including economies of scale, difference in local
site conditions, and variations in local construction rates.
More will be said about earthwork in the next section.
3.2.2.- Salt.
The cost of salt reoresents about 20% to 33% of the
total solar pond construction; costs per square meter range
from $11.75 to $20.00. (All costs per square meter in this
report are based upon the nominal area of the pond surface
during operation.). Since the expense of salt is determined
mostly by the need to transport it from mine to site, the
difference in cost must be partially accounted for by the
I - I -

'I'IuConstruction Cost Breakdowns for Existing Solar Ponds.3bl -? : -
Salt
$ -m 2
Excavation
_ - $/m__2
Liner
$/m2 7
Miscellaneous
/m2
Total Cost
Square MeterZ Cost
68,000 17 21 34,645 8.6 10.8 150,425 37 (for 47 66,789 16.7 21 $319,8592 liners)18.5 perliner
S/m2 80
Miamiaburg 23,974 11.75 30 12,100 6 15.8 27,830 14 36 14,278 7.2 18.6 $76,972
$/m2 38.2
Ohio State 3744 18.78 33 3,725 18.62 33 3,874 19.37 34 $11,175
$/m2 55.88
19.8 33 1,341 1.275 21 2,235 21.3 596 5.7 9.5 $6,258
$/m2 59.6U.N.M. 2086
40distances to the nearest salt supplies and by slight
differences in salt concentrations.
3.2.3.- Liners.
The liner costs consist of the sand blanket,
underdrains, liner and underliner. These costs vary from
about $14.00 to $21.00 per square meter and represent 35% to
47% of the total cost. The difference in cost is best
explained by the thickness and quantity of liners used.
Although economies of scale exist in liner installation, the
larger ponds may need more refined and elaborate systems for
environmental protection, and unit costs will rise. The use
of an underliner and a sand blanket underneath the liner at
TVA is a prime example of the growing importance of liner
protection and increasing share of costs.
3.2.4.- Miscellaneous costs.
Testing, supervision, travel, borings and fences are
included in the miscellaneous category. These costs will grow
as pond size increases, and more extensive testing will be
required. A more elaborate fence and a security system might
be needed to prevent accidents and keep away vandals and
animals out.
The composition of construction costs for the several
ponds reviewed is shown graphically in Figure 3.1.

E
4,
UP0C:
04-
1000 2000 3000 4000A~. L ~re a of rona, m
1'igure't 3.1. : C;os~, or'•l(towrn of (:xil t.rig pondsc
~---
I ý _I
42
3.3.- Categorization of proposed ponds.
The pond projects reviewed gave us a preliminary
indication of the components required for construction and
their relative costs. However these costs cannot be reliably
extrapolated to ponds of much larger dimensions (e.g. -ULEE+6
square meters or more) for the following reasons:
- Existing ponds were intended for research and
experimentation. Larger ponds, intended as demonstration
projects, or as production power plants, must be build to
withstand natural or man made hazards and to meet public
safety and environmental standards, engineering or building
code provisions, and efficient operational requirements.
- An increase in pond size may :n itself require
additional facilities (e.g., wind and hurricane protection,
more stringent security, more elkborate monitoring systems),
which would alter the cost structure.
- Larger ponds may present economies of scale or
diseconomies of scale, thereby altering the cost structure
already observed. Also, the unit costs of some items may
change over time due to the increased scale of protection and
progress along the learning curve.
As a result, we found it useful to distinguish among
different orders of magnitude of solar pon facility size as
follows:
C __
43
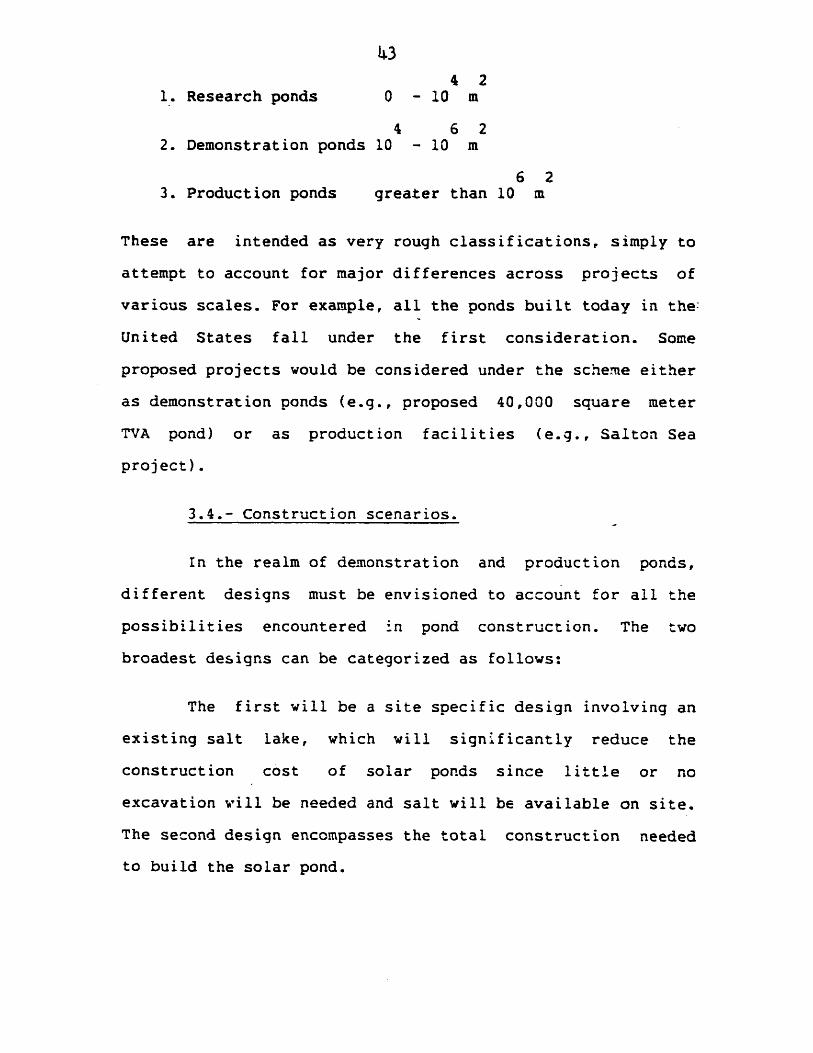
4 21. Research ponds 0 - 10 m
4 6 22. Demonstration ponds 10 - 10 m
6 23. Production ponds greater than 10 m
These are intended as very rough classifications, simply to
attempt to account for major differences across projects of
various scales. For example, all the ponds built today in the:
United States fall under the first consideration. Some
proposed projects would be considered under the scheme either
as demonstration ponds (e.g., proposed 40,000 square meter
TVA pond) or as production facilities (e.g., Salton Sea
project).
3.4.- Construction scenarios.
In the realm of demonstration and production ponds,
different designs must be envisioned to account for all the
possibilities encountered in pond construction. The two
broadest designs can be categorized as follows:
The first will be a site specific design involving an
existing salt lake, which will significantly reduce the
construction cost of solar ponds since little or no
excavation will be needed and salt will be available on site.
The second design encompasses the total construction needed
to build the solar pond.
Figure 3.2 details the different solar pond
coonstruction alternatives. Once the location of the site is
accepted, the following cost consideration occur. Materials
on site can be used if they are suitable otherwise they will
have to be imported from other locations. When it comes to
dike construction, if we us~ =an mrey , Pi-tinq salt lake,
the excavation cost will be minimal compared to the
construction of dikes at the perimeter of a man made pond. If
the construction of the pond is the alternative, a
distinction between using the earth available on site for the
dike and the use of a boorow pit must be made.
The use of the liner is an important aspect of the
pond construction since it represents a high percentage of
the total pond investment. Three possibilities exist:
- In case of an already existing salt lake, no liner
may need to be used rendering land preparation very limited
and reducing by a high percentage the cost of the facility.
- The second alternative is the use of a clay liner.
These liners will require a lot of testing and preparation to
obtain the required clay compactibility to ensure minimal
land penetration, but should be less costly than the third
alternative.
- The synthetic liners require a great deal of
preparation and installation but offer a much higher

Figure 3. 2 . Factors in the Selection of a Solar Pond System
_ _~ I--·-----------------· -- -- --

L6permeability than clay liners.
Another aspect in pond construction is the
availability of salt. The cheapest solution is the
availability of brine near by. In the case of an already
existing salt lake, an evaporation pond and a maintenance
pond will be necessary to ensure the operation of the pond ,
and will increase the cost of the pond. Finally, the most
expensive solution will be the importation of salt from a
mine requiring the need for a maintenance pond. In any case,
for the last two alternatives some dike and liner
construction will have to be considered.
Water if not available on site will have to be
imported. Choices will also have to be made concerning the
piping and between an open or closed cycle power plaht.
3.5.- Projection of construction costs.
Because of the absence of any historical guidance for
estimating costs of large pond facilities, the projection of
cost trends were based not only upon the data on existing
ponds described earlier but also other sources primarily cost
data from heavy construction projects employing related
techniques or material. and interviews with suppliers of
liners.
3.5.1.- Excavation.
I -
.47Solar ponds are cut-and-fill excavations and their
shape will most certainly be dictated by the topography of
the site where they are located. The excavated soil is graded
into embankments that add to the height of the walls. From a
civil engineering viewpoint, earthdam technology is directly
applicable (Fynn and Short). The wall slopes must be
compacted and pitched to avoid slumping. The soil must be
compacted in order to form a firm base for the liner, to
support pressure from the fluid and resist wave action on the
pond surface. The slope ratio, soil type, degree of
compaction needed, and proximity of the water table will vary
with location and influence the design phase. It is important
to realize that the pond should not be located in a
watercourse, a lakebed, or other depression where flooding
could occur. Any pond adjacent to such depressions should be
located above the highest possible water levels.
3.5.2.- Site preparation.
The soil should be compacted in a similar way to that
of the soils used for road construction. The sidewalls and
the slopes away from the sidewalls should all be well
compacted to avoid later movement and subsidence and ensure a
correct liner installation. The base of the pond needs proper
preparation to remove all rocks and any debris (Personal
communication with Hypalon manufacturer). This entails
raking, compacting and rolling the pond slopes after grading.

48
Soil compaction should run 90 to 95% Proctor and should
retain stability wet and dry (Ibid). If roots are present and
vegetation has been growing, a so-il sterilizer should be used
to preventany such growth. A layer of sand may be used to
smooth out a rough surfaced or rocky substrate bottom.
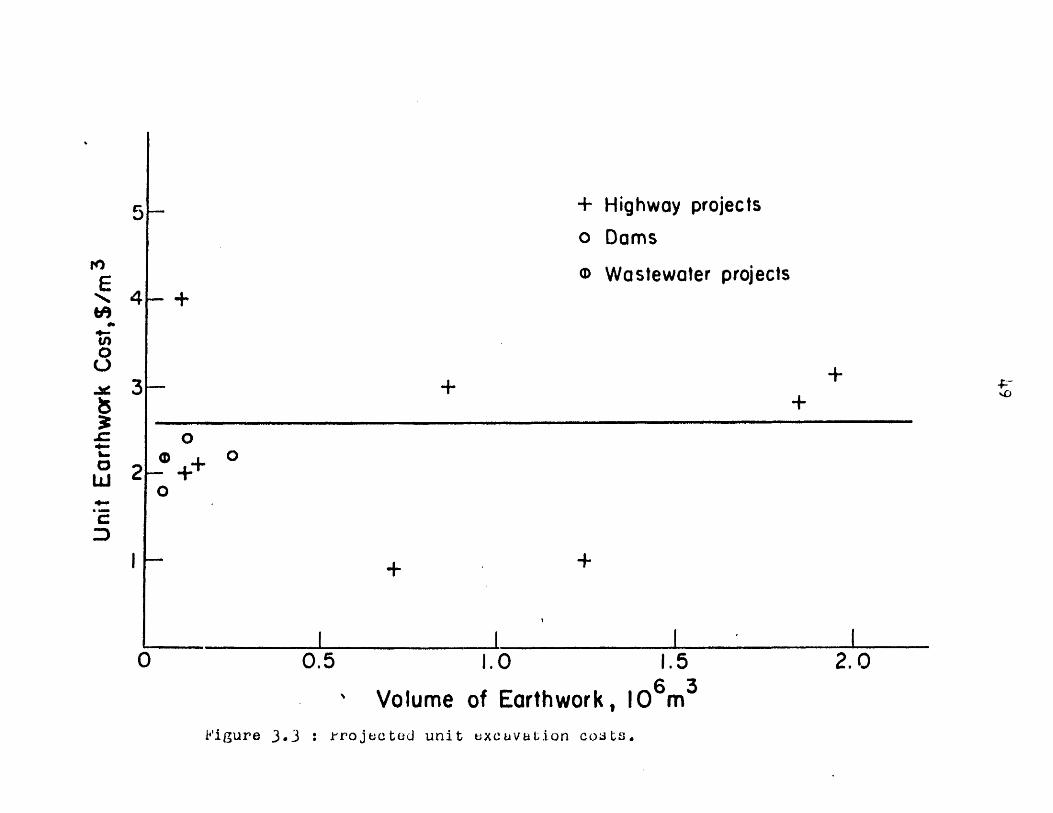
3.5.3.- Earthwork costs.
Using 1983 bid data for highways, dams and waste water
excavations, an average excavation cost of about $2.60 per
cubic meter was obtained and shown in Figure 3.3 . These bids
were taken from 1983 Engineering News Record bid abstracts
(ENR, 1983 issues). The winning bid was consistently used and
no apparent trend in the scatter of data points shown in
Figure 3.4 appeared.
Fowever, these costs vary from about $1.00 to
3.00-4.00 per cubic meter depending upon the difficulty of
the soil to be excavated, the construction technology used,
and bidding practices which may bias the observed data. One
might expect that for favorable soil and construction
conditions, earthwork costs would be about $1.00-1.50 per
cubic meter; approximately this value has been estimated by
Ormat for the Salton Sea project (Ormat, Feasibility Study).
Considering the diversity in soil conditions throughout the
country, some variation in earthwork costs should therefore
be expected. Furthermore, in building and protecting the
dikes to contain a solar pond, additional features are
+ Highwayo Dams
0 Wastewater
Volume of Earthwork
1.563
10 mFigure 3.3 : rrojected unit uxcuvation costs.
E
Ut
C)0
,4--
4e-,
:3
3
projects
projects
O0 0.5 1.0 2.0I -
+)
I -
I

LiL
0
C)
0
LUJ
IL
C'igure 3.4 : (iv'sCu,'t u;i oLf L'o,) j A: ttj uiuit, uxcavtLion costs

-1
required such as riprap, access roads, excavation cut-offs,
etc. The addtional cost of these construction items has been
estimated at from $1.00 to $2.25 per cubic meter of dike
construction (Ormat, Feasibility Study). Economies of scale
with respect to the pond size may be expected-in certain
conditions. These situations are dependent upon site
conditions as described in the next paragrapn.
3.5.4.- Site conditions and economies of scale.
As seen in Figure 3.3 tnere is no apparent engineering
or construction basis for identifying economies of scale
since the unit cost of the earthwork remains constant over a
wide range of earthwork volume. However, since dike
ccnstruction is proportional to the oerimeter of the pond,
wh.ie the power output is proportional to the pond-area, we
may expect economies of scale in earthwork costs due to these
geometric arguments.
In general, the unit cost of dike construction would
be expected to decrease with the square root of the pond
area. This premise is shown by the following equations and
leads to the curve in Figure 3.5 for the dike section shown.
Assume a dike cross sectional area Ac
For a pond with collecting area A and perinet ? , the
volume of earthwork needed is:
V = A l P (1)c p
~CI _ _·_ I I~ ~~ ~~_ _---·II·L_--__·-1~IY ----~--- C- - -

S /m = f [A-'/2
E
- 0cJ
c:0OUC0
0
I'
S104 106 i08Area of Pond (A), m2
rigure 3.L.. : Pond area v.s, excavat;ion costAs fuoL dike construction
A I I

53
The cost of earthwork per cubic meter is C= $2.60/m3
The total cost of earthwork is thus:
TC = V C = A -P C (2)c p
The cost per unit collecting area is:
UC = A * P * C / A (3)c p p
Assuming a solar pond to be square with a side of length S,
the perimeter of the pond can be denoted by:
P = 4 ::-S2and the area A as S 2
pEquation (3) becomes:
U-C = t 14 " C / S (4)
The following graphs show these calculations for the
particular dike cross section shown. As the cross sectional
area of the dikes increases, the unit cost of excavation
inereases for each respective pond area. The large dike cross
sectional area has a top width of 10 meters making it
possible for the construction of a monitoring road on with
small trucks can check and repair the pond.
Although the unit cost of dike construction would be
expected to decrease with he square root of the area, some

54earthwork will also be expended to level the basin of the
pond, grade it, remove rocks and other debris and so forth;
and these costs vary in proportion with the area of the pond.
To make these calculations we have assumed different depths:
d for leveling.
For small ponds, it is likely that the .earthwork
attributable to leveling will be less than or equal to the
earthwork needed for dike construction as shown in Figure 3.6
In these cases the two eart-h,-ork volumes balance, or some
gravel must be imported from a borrow pit to complete dike
construction . The point where earthwork volumes are equal is
when the leveling volume equals the excavation volume.
For a square pond,
s d = A 4 S '6)
The leveling depth equals,
d= A 4 / S = A :S 4 /(7)S c c (7)
As the sides S increase and assuming that the cross
sectional area of dikes is constant as collecting area
increases, it is likely that for even very small depth of
leveling (i.e., for small values of d in Figure 3.6 ),
earthwork requirements to level the basii: area may exceed the
volume of earthwork needed for dike construction.
The implications of this conclusion are that site
~_C__

I 5 10
Area of Pond, 10 m2
liigure 3.6 : xcava~tion VOur1me - aricro (eo, L.Luc Uion and basin kveling
E
o0
#6..04.-O
Eo
20
I
56
specific characteristics become increasingly important for
large ponds regarding excavation and presumed economies of
scale may not always hold. Therefore from the point of view
of earthwork, the most economical site is a wet or dry site
where little or no dredging is required.
3.5.5.- Dredging costs.
In wet sites, it may be necessary to dredge sediments
at the bottom of the existing lake, either to provide the
depth required for a solar pond or to remove soil which might
later contaminate the pond and reduce water clarity. The
dredging is done from a dredge which is a floating machine
for loading and hauling materials from beneath the surface of
the water or from beneath the existing water table in water
bearing materials.
The costing practice is the cubic yard bank
measurement also called cubic yard apparent volume (Church,
Excavation Handbook). The unit costs of dredging vary with
the type of soil being removed and the method of dredging
used; therefore, they are site specific and can exhibit a
range of values depending on local conditions.
This point is illustrated by the variation in unit
costs of dredging cited by Ormat, ranging from $0.80 per
cubic yard for unconsolidated sediments to $1.50 per cubic
yard for clayey loam. These costs are in general agreement
_ _ ____~
57with an estimate of $1.05 per cubic yard (in 1978 dollars)
calculated from the Excavation Handbook. Updating these costs
to 1983, and converting cubic yards to cubic meters, result
in a unit dredging cost of about $1.20-$2.20 per cubic meter
(based on Ormat) or $1.80 per cubic meter based on the heavy
construction data.
3.5.6.- Salt.
Various types of salt can be used in solar ponds. The
most common being (NaCI) Sodium Chloride. If salt is
purchased, it is recommended that Sodium Chloride be used
with a purity of 99% (Fynn and Short).
The characteristics of salt used in a solar pond
should include low cost, ease of transportation to the site,
and availability in an amenable form. Salt costs were
estimated from existing ponds and delivered costs from
suppliers to $17 per square meter. These costs will fluctuate
depending upon the transportation requirements.
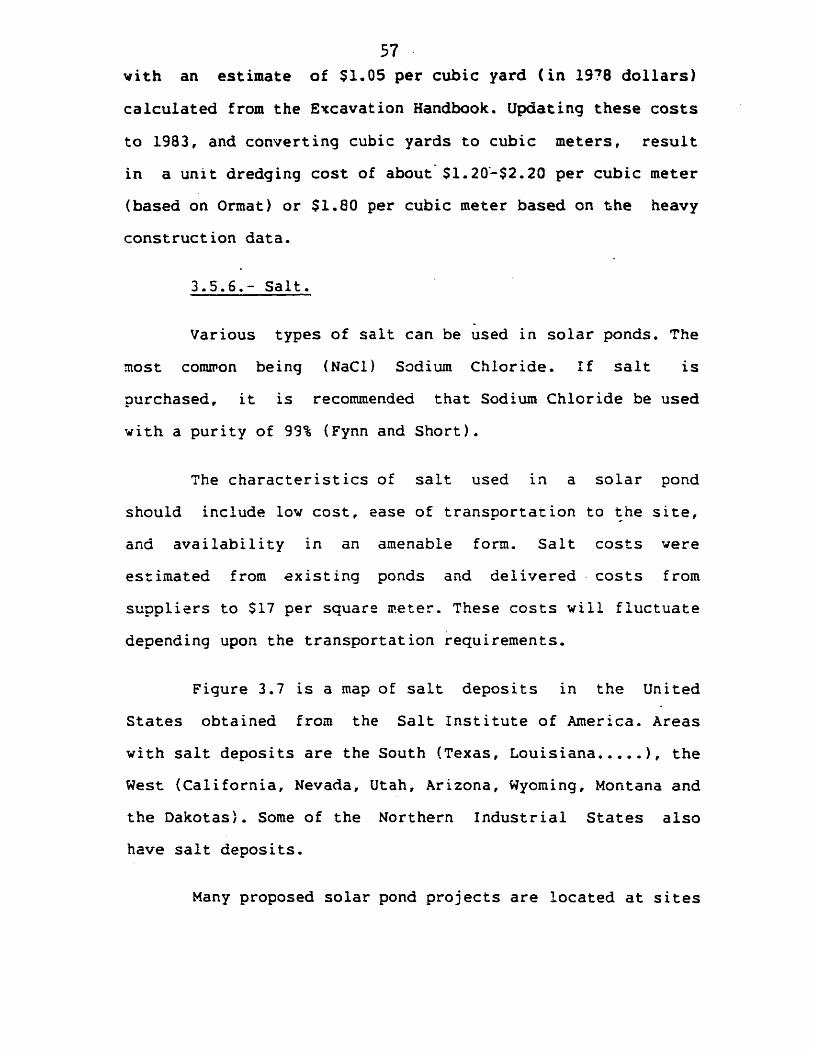
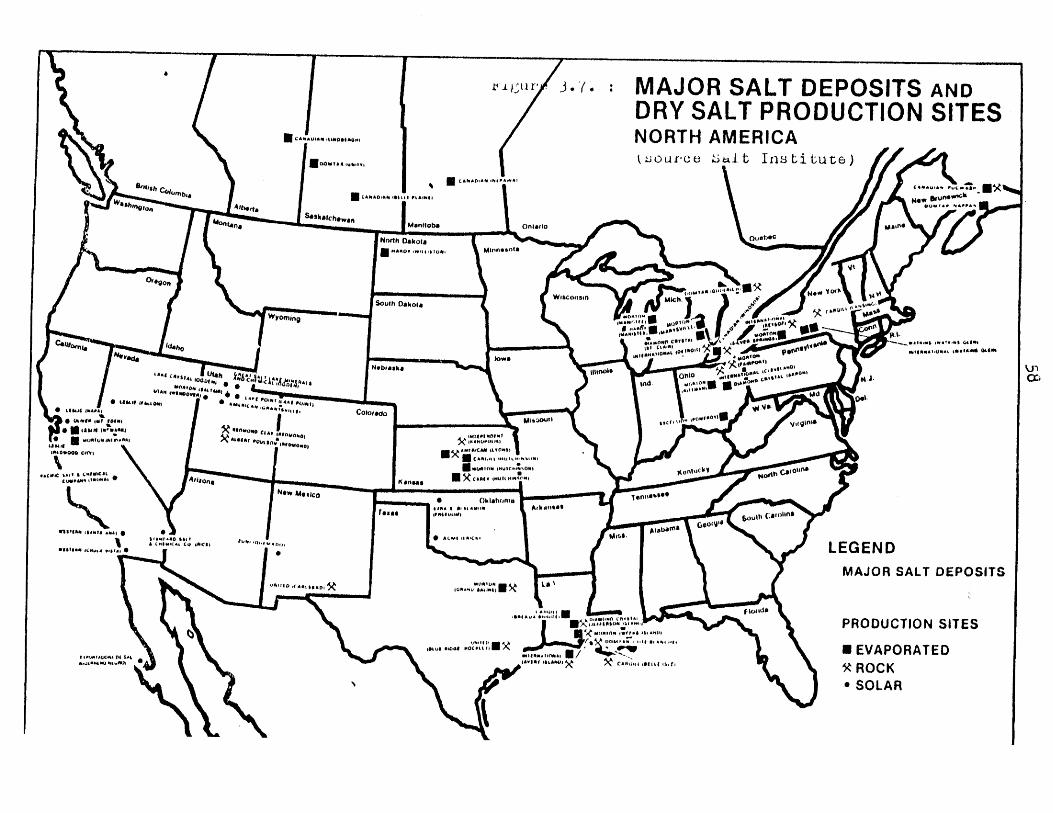
Figure 3.7 is a map of salt deposits in the United
States obtained from the Salt Institute of America. Areas
with salt deposits are the South (Texas, Louisiana.....), the
West (California, Nevada, Utah, Arizona, Wyoming, Montana and
the Dakotas). Some of the Northern Industrial States also
have salt deposits.
Many proposed solar pond projects are located at sites
I _
.-" l 7. : -, MAJOR SALT DEPOSITS ANDDRY SALT PRODUCTION SITES
S.................. NORTH AMERICA............. (0- O-U. · t- I nst itute)
;"6**causssessame ushe 400 Brunsecasha gln~Ltora I I4tt~lert noowr ** *****
"to~nt S'skatchewS Mlntloba Ontaflo anI%* f
North Dakota L enc;luc~N•OI' 44,olr,·Xyc
Wlrcnntn ;J~k sh. AA H·nWicosi mkw 4ýo, MinstSo uth D ako taW n a s rk
Wyoning ql ,, I"
Cety"ar Ao S4%t car Is boo'.s wr.a aO; fl Cr IA,! _0 %,,, .6,/.0.-ýWAW S OWl 1- Q4,1l*0lt .•#i
Idaho ow ' n o f 160ý1 x "oM aa eeess<sese sc sws 4
s 01001
CA gvet Alto%
IAa Ncbuas willois 0*16 ski 1 6, o ** ont., Nesus I ,C oa lArlY Ant Ind.ourt MctO ovMoviol i~pPo~ftfMd Of
,ll#,tlll•:~0 ri,•4 t (•,'*• -I
N s s wa a e o e a narou o -e' kil )s snewsUeesa coess * ~ Arizone~ , Kansas~r y(ouc (o%
*•Mac Ok lah•,ma eno*'slrllll CooI At I i ll Atllltl1xX ~ ~ ~ ~ e ''"Oo ArmanIUsL0I ~gn
............... ,a• s';"'" ...... ' .......... ,, LEG EN D4066.c. .. :m s nLlkig~~~MJO SALT& DEPOSITS N1010,1
e : .. . PRODUCTION SITESisunf Pwoes Ix menoft CWo~wft ski r-gvlkl A r PL, A. 0.0906
4juld a Ie t nea44ecarv) I '<'t. t ....... ".... ...
100 --'n" "i" •i EVAPORATEDC
SA • (HUI("'.00SOLARW1161144 icrur 41m 1· r,4 % I rrl Y' 4'.·1 LEGENDMAJOR SALT DEPOSITSI1II()* LRII·IPRODUCTION SITES
"N"lt I0 ( 'Mug Otatflo 8114N~f Al 0EVAPORATED
2.4mluf .0 w- AV111114LArA$.1 degI If 1, f ROCK\ 1 · SOLAR
59where salt is readily available from existing bodies of
water; in terms of construction, this situation should be the
most economical way of obtaining salt.
3.5.7.- Land.
Although some data are available on residential land
costs and in specific areas of the country, no nationwide
sotrce of data on costs of land in rural or non-inhabited
areas (where large ponds are likely to be built) could be
identified. The reports reviewed for both existing and
proposed ponds did not include land as a cost item.
Therefore, land costs have been excluded from the estimates
prepared below.
3.5.8.- Liner.
The liquid in the solar pond must be contained
properly to prevent heat loss to the ground and leakage to
the ground water. If this containment is not absolute, the
salt solution will be lost and pollute the ground water.
Furthermore, these losses will seriously reduce the thermal
efficiency of the pond (Tabor, Zagrando).
The two types of liners used for seepage prevention
are membrane liners and soil liners. Membrane liners are
manmade materials that have a low permeability (less than
10EE-9 cm per second) and are relatively easily installed.
These liners can resist chemicals and ultraviolet radiations.
__

60
Soil liners are much more likely to let water and salt leak
into the soil beneath the pond. Many of the soil lining
materials- should not be used for salt gradient solar ponds.
This conclusion reached by the Burke Rubber Company,
manufacturer of Hypalon, states that compacted soils,
swelling clays like bentonite, and native clays are not
impermeable to high temperature saturated salt brine
soluticn. The advantage of a soil liner is usually its price
compared to the price of a synthetic liner. But, in order to
use soil liners, their permeability will have to be reduced
dramatically (Burke, Fynn and Short). More research has to be
done, and at present the state-of-the-art dictates the use of
synthetic liners for manmade ponds.
Salt gradient solar ponds present special problems in
liner design that are not often encountered :ogether:
- The liner must be resistant to salt brine and be
heat resistant;
- The serviceability of the liner must be from
temperatures below 0 to temperatures well above 100 degree
celsius;
- The liner must be reliable and easily repairable.
Thus proper selection of the impermeable liner is essential
to the widespread use of salt gradient solar ponds.
Synthetic liners have been used in such applications
I __

bi
as containment reservoirs for potable water supplies,
temporary storage of brine from underground salt domes, waste
treatment or containment of various products. The industry
leader is E.I. Dupont which is the main supplier of raw
materials for the liners.
The membrane liners that have been used most
successfully to date for solar ponds in the United States are
Hypalon ®-by Burke Rubber Company and 9R-5 t by Shelter Rite.
Other liners include HDPE 1-'a density polyethylene), CPE
(chlorinated polyethylene), EDPM (ethylene
propylenedienomonomer ).
Table 3.3 shows the liners that have been used for
solar pond construction in North America.
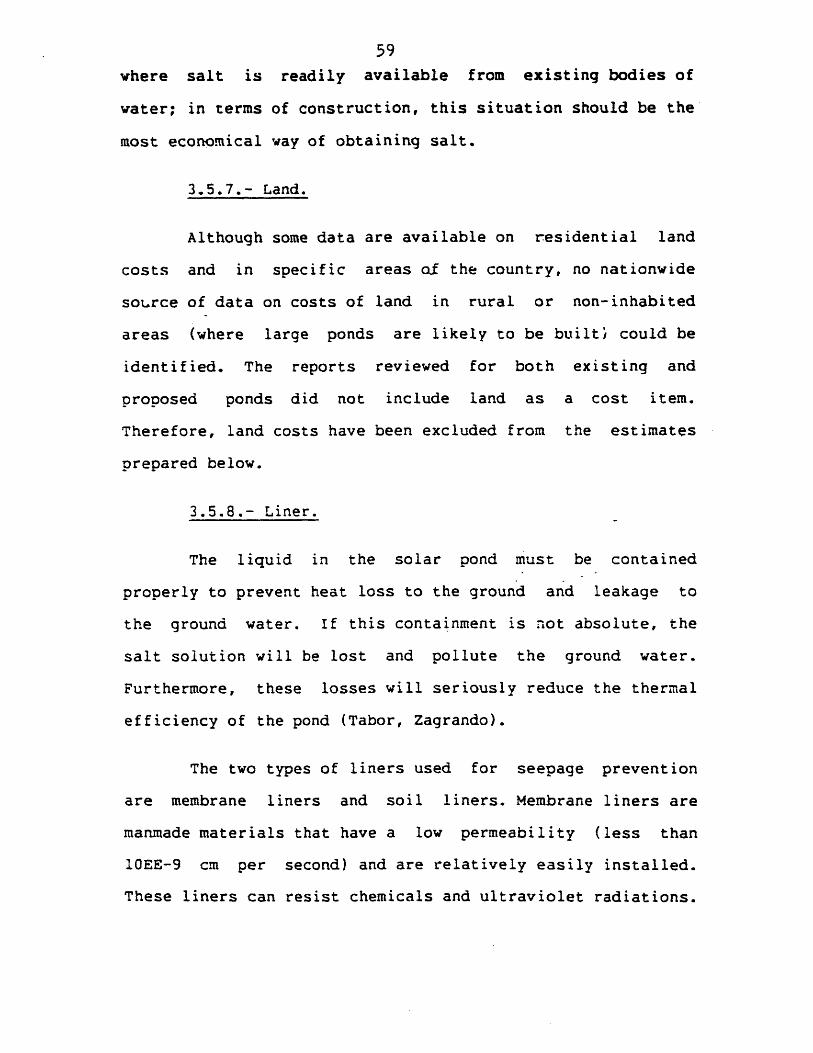
3.5.9.- Liner installation.
The liner is usually anchored at the perimeter in an
anchor trench at the top of the berm. The trench must be dug
around the perimeter of the pond and is usually one foot wide
by two feet deep. Dirt from the trench excavation will be
used to backfill once the liner has been tucked in the
trench. This is illustrated in Figure 3.8 .
The liner panels are generally accordion folded and
rolled on a core. They are then packaged and identified for
proper placement around the pit. The manufacturers recommend
that the panels remain covered and protected from direct

62
Table 3.3: Fond liners used (primary liners)
Location
Ohio State University
University of New Mexico
Xiamiis burg
-.Zi3 State University
.racane
Date
1 975
1975
1978
1960
1 9.0
Liner
CFE
-ypalo.
.,T ,
LINER0.4 ,, 0.2 m
- - - .--- . . .. ..
TRENCH
,i•u,. 3.,. : LINER INSTALLATION

64
sunlight until they are ready for spreading. Only the panels
for the day's field seaming should be spread each morning and
sand bagged until the seaming is completed.
The lining materials differ in temperatures needed to
have the proper sealing. It is often necessary- to use hot air
guns or other sources of heat to make a proper field joint.
Usually, the bonding solution develops a bond quite rapidly
but full strength is not attained until all the solvent
diffuses through the membrane i•to the atmosphere. This may
taKe a week but sufficient strength is generally obtained in
half an hour to continue on. Covering the base of the liners
at all times with just a few inches of water is recommended
once the liner seaming is complete since this will stabilize
the liner and hold it in place especially in the case of high
winds (Burke Company).
3.5.10.- Liner material costs.
The liner costs were obtained through communications
with liner suppliers (Burke Company, Shelter Rite). These
costs are for liners placed in a reasonable straight forward
rectangular area with evenly sloped sides. The costs include
installations and freight and assume a reasonable traveling
distance.
As was discussed above, the liners are prefabricated
as panels in the factory and are bounded on the site. Hypalon

\.f
IV (IV-
Area of Pond, m2
Vigure 3.9 : Linuir cosLS Lji; I I'LlLctLion of solar pond Jizj
j
o0
0)C*

6bb
is cheaper but thinner and less resistant to rupture than
XR-5. With the thin geotextile fabric generally added to
protect againt punctures, abrasions and gas venting, the two
liners have an equivalent cost of $10.00 per square meter for
a 50,000 square meter pond. Economies of scale will reduce
the costs to $9.50 for a 100,000 square meter pond and to
$9.00 per square meter for one million square meters as shown
in Figure 3.9
Liner costs represent an ..portant percentage of the
total pond investment. Every effort should be made to develop
cheaper materials or construct a pond in a specific site
where no liner would be needed. In such event, the cost
savings of using a clay liner with a high permeability rate
could substanciai.
3.5.11.- Miscellaneous costs.
The miscellaneous cost category include fence,
detection systems, road and any other component deemed
necessary for the construction and operation of the pond.
For security reasons, it is considered advisable to
provide fencing immediately surrounding the pond. The fence
will keep vandals out and prevent accidents.
Many states require a leak detection system to monitor
the lining integrity. The options of an underliner electrical
resistivity grid, a probe or other leak detection system or
I ___ ___ _____I____IIY·l_~lPUI·--·-·ICI1_·*- - -C- - ------
67alarm should be given consideration during the design phase.
I.n the TVA pond for example, a leak detection system was
installed in the drainage field (Cninery and Siegel). The
system consisted of a 10 x 10 grid of bare copper conductor
insulated at crossover junctions. The brine leakage to the
ground should be detected and found by measuring a drop in
the electrical resistance of two adjacent conductors. Gypsum
block moisture sensors and linear vertical thermocouple
arrays were also installed in the sand drainage field.
These miscellaneous costs are hard to estimate since
they are site specific. Ormat, the company that made a
feasibility study of the Saiton Sea estimated for both the 5
Mw and the 600 Mw plant that the miscellaneous costs ranged
from 10 to 13% of the construction cost items discussed above
(earthwork, dredging, salt, liner). Therefore for purpose of
this study, a value of 12% of the construction costs
described above has been assumed to cover miscellaneous
costs.
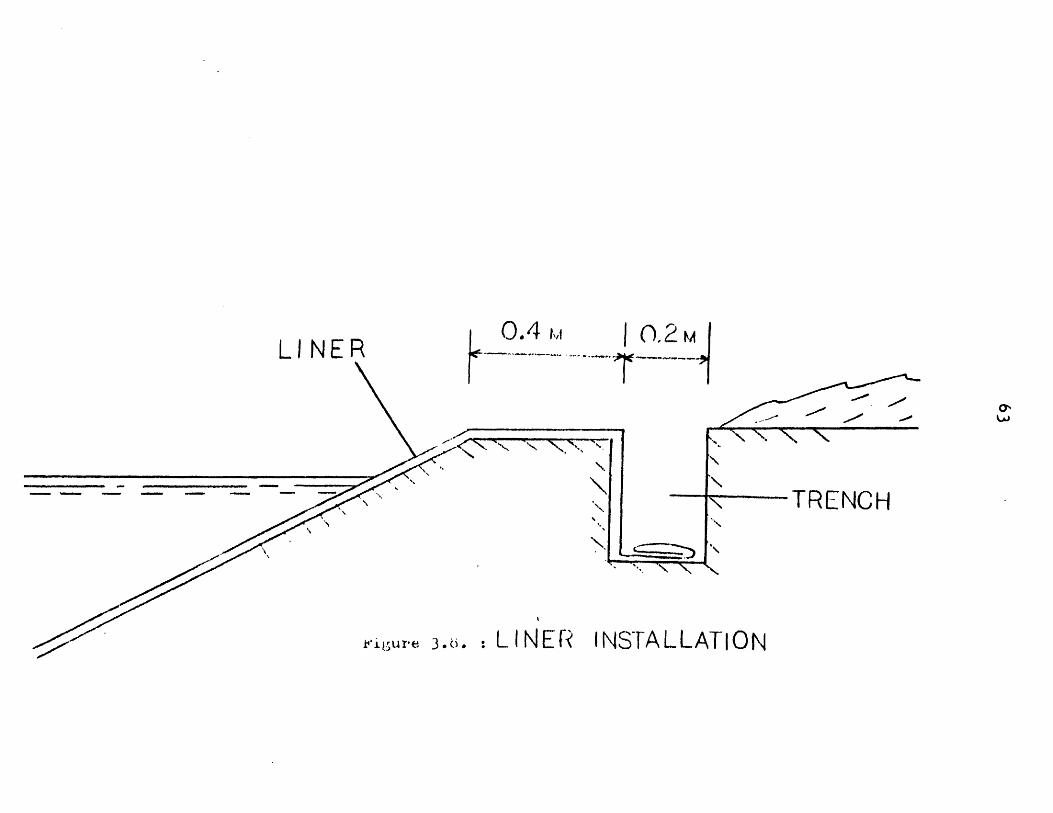
3.6.- Construction cost summary.
Figure 3.10 illustrates the variation in construction
costs per square meter of pond collecting area, and shows the
economies of scale in liner cinstruction and in dike
construction if no leveling is required. For purposes of
illustration, the range in dike construction costs from $2.55
to $4.85 per cubic meter is shown. These estimates include
·I _ _
Salt
a-
104 106 108 ApArea of Pond in m
1"itjuivu 3.10[v) j(• C L., i cu•.;l,
S /m
2
2

69
both earthwork costs of $1.55-$2.60 per cubic meter and then
dike related costs of $1.00 to $2.25 per cubic meter. Unit
costs of dredging are not shown.
3.7.- Projection of maintenance costs.
Although solar ponds are highly capital intensive
facilities, maintenance costs are a non negligible factor in
addressing their overall feasibility. The maintenance costs
are recurrent costs that the utility will have to assume
every year to maintain the efficient operation of the
constructed facility.
The most detailed operation and cost breakdown for an
existing pond is provided by L.J. Wittenberg and M.J. Harris
on the Miamisburg pond. The main aspects are listed here
along with our cost estimates.
- Salt losses: We consider only the salt losses due to
to the continuous upward diffusion during the pond operation
in the bottom convective zone. These losses are estimated to
be about 2.5% of the salt in the pond each year. This
percentage may vary with location but not significantly. This
loss amounts to $0.40 per square meter of collecting area. In
this category of salt losses we do not consider large losses
that would happen should the liner fail since these losses
would not be tolerable for environmental reasons.
- Chemicals: The clarity of the pond is extremely
70important to maintain the thermal efficiency of the pond. In
the Miamisburg pond, for example, copper sulfate was used to
prevent algae growth. A solution of concentrated hydrochloric
acid had to be used a few times during the year to maintain
the copper sulfate in solution.
The reports on existing or proposed solar .ponds
generally furnish very limited data on oterition and
maintenance: and even for existing ponds, the costs shown are
estimates, not firm figures tased on actual operating
maintenance.
The Jet Propulsion Laboratory of the California
Institute of Technology estimated a value of $2.50 per cubic
meter for their study. This value was considered highly
conservative by their estimators in light of US experience
with research ponds. No further presentation of their
calculation was given (Lir et al., volume 2).
For the Miamisburg pond, the operation and maintenance
costs were estimated from the cost of chemicals used for
algae control. Also 2% per year of salt (20 ton/year x
$30/ton equals $600 per year) diffuses to the surface and is
not recovered. Therefore the cost of maintenance is $0.35 per
square meter per year (Wittenberg and Harris).
The Ormat study came up with a value of $0.51 per
square meter based on experience of the company on the
C ___~
Israeli solar ponds. This cost assumes that there is no
specific consumable cost associated with the water and the
brine. The chemicals used for water treatment include
chlorine and other anti-scaling and corrosion additives.
Since the value of $0.35 per square meter per year was
estimated for a research pond much smaller than a prototype
facility for power generation and since this research pond ,
lacking an evaporation pond, required the purchase of
replacement salt, the value of 50.51 per square meter per
year estimated by Ormat was judged to be the best available
estimate of annual maintenance costs. Updating these costs to
1983 dollars results in a projected maintenance cost of $0.57
per square meter per year.
3.8.- Construction schemes and their impDication for
utilities.
As we have shown in this chapter, the cost of solar
ponds is most often determined by site specific
considerations. For the electric utility it is important to
know which factors will be most likely to enhance or impede
the decision to invest in these facilities. For purposes of
this thesis, four cases have been selected to show the cost
sensitivity of solar ponds to these scenarios. Case 1
represents a project built at an existing "ideal site" (e.g.,
a salt lake) where salt would be plentiful and no liner would
be required. Case 2 represents a project similar to Case 1,
72
with the exception that an ouside supply of salt is required.
Case 3 denotes a project where salt is assumed to be
available, but a synthetic liner would be required. Case 4
represents construction of a manmade pond with minimal
earthwork required to level the basin but requiring both an
outside source of salt and a synthetic liner. Using the data
presented earlier, the unit costs of solar pond construction
for each of these four cases are shown in Figure 3.11 . The
influence of both the local site conditions (and availability
of resources), and economies of scale with respect to the
pond area are evident.
This case comparison on a unit cost.basis presents
some preliminary evidence of the high capital cost of solar
ponds. For preliminary studies, it would seem that by just
looking at the civil engineering construction of these ponds,
cases 2,3,4 will be prohibitively expensive for the
development of solar ponds. This implies that this
"non-intermittent" solar thermal electric technology will be
attractive from an electric utility investment point of view
only in very site specific cases where the actual
construction of these ponds will be reduced to a minimum.

Case 4
-X
-x -
--.X-
• X--- X.•.X-......."0ýX--- X-___X-__X-X--.X.XX-X Cose 3
&mmO". - 0 0 .Case 2
ft-so .-7fC ase I
104 106 108
Area of pond in m2
Figure 3.11 : Unit cotss, euse comparison
vs-
030
20
10
S/m 2
74CHAPTER 4
CASE STUDY: 50 MW SOLAR POND
4.1.-Approach
The cost estimation performed in chapter 3 detailed
the unit costs of the different pond construction scenarios.
To quantify the total cost of a solar pond facility, we chose
a proposed favorable site as a case study. The case study
examines the construction of a 50 MW solar pond facility for
electric power generation at the Saiton Sea location in
Southern California. As we will see, the Salton Sea site
cannot be compared to the ideal site that we defined in
chapter 3, but it represents one of the most favorable sites
to be found in the United States.This section also serves the
purpose of a literature review for the feasibility studies
conducted on the proposed California sites.
The case study is based to some degree on the data and
project configurations developed by Ormat for the California
Energy Commission and the Southern California Edison Company
(Ormat, vol 1,2, 1981). In the feasibility study done by
Ormat, the environmental benefits, the design
characteristics, the schedule and estimated costs of a 5 Mw
pond are presented as well as the physiochemical and
climatological conditions of the Salton Sea.
The cost and ultimate expansion of the Salton Sea's
I I _
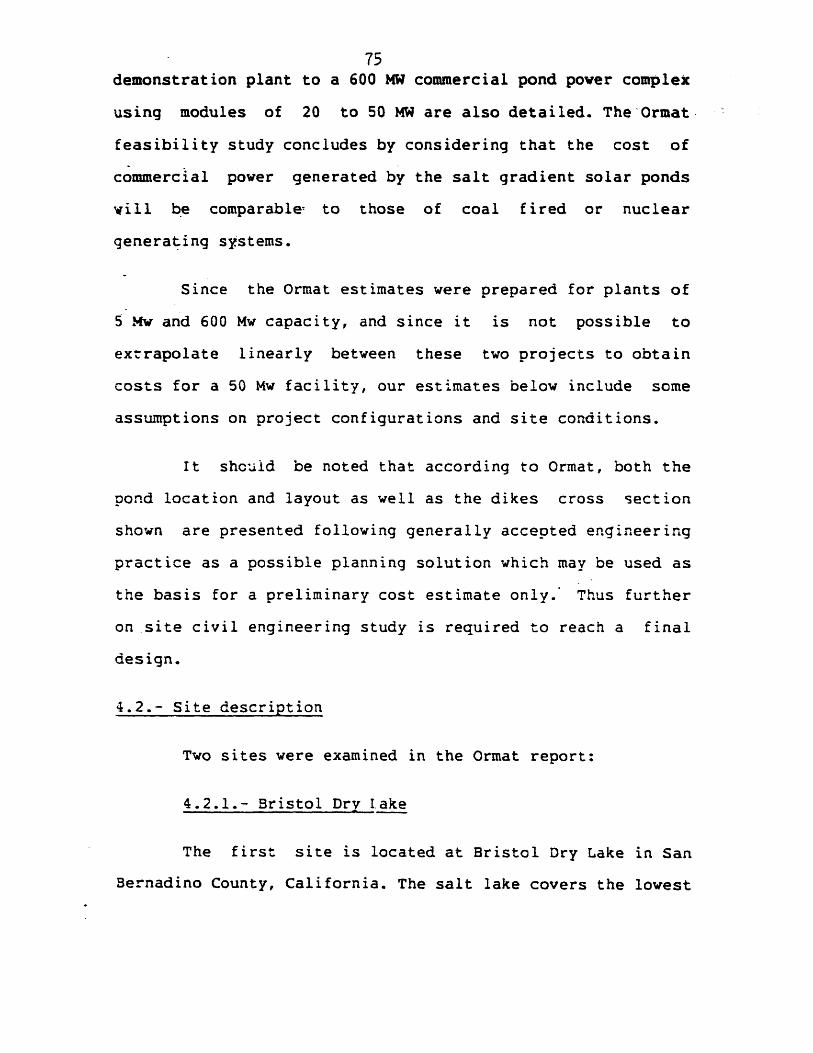
75demonstration plant to a 600 MW commercial pond power complex
using modules of 20 to 50 MW are also detailed. The Ormat.
feasibility study concludes by considering that the cost of
commercial power generated by the salt gradient solar ponds
will be comparable- to those of coal fired or nuclear
generating systems.
Since the Ormat estimates were prepared for plants of
5 Mw and 600 Mw capacity, and since it is not possible to
extrapolate linearly between these two projects to obtain
costs for a 50 Mw facility, our estimates below include some
assumptions on project configurations and site conditions.
It shculd be noted that according to Ormat, both the
pond location and layout as well as the dikes cross section
shown are presented following generally accepted engineering
practice as a possible planning solution which may be used as
the basis for a preliminary cost estimate only. Thus further
on site civil engineering study is required to reach a final
design.
4.2.- Site description
Two sites were examined in the Ormat report:
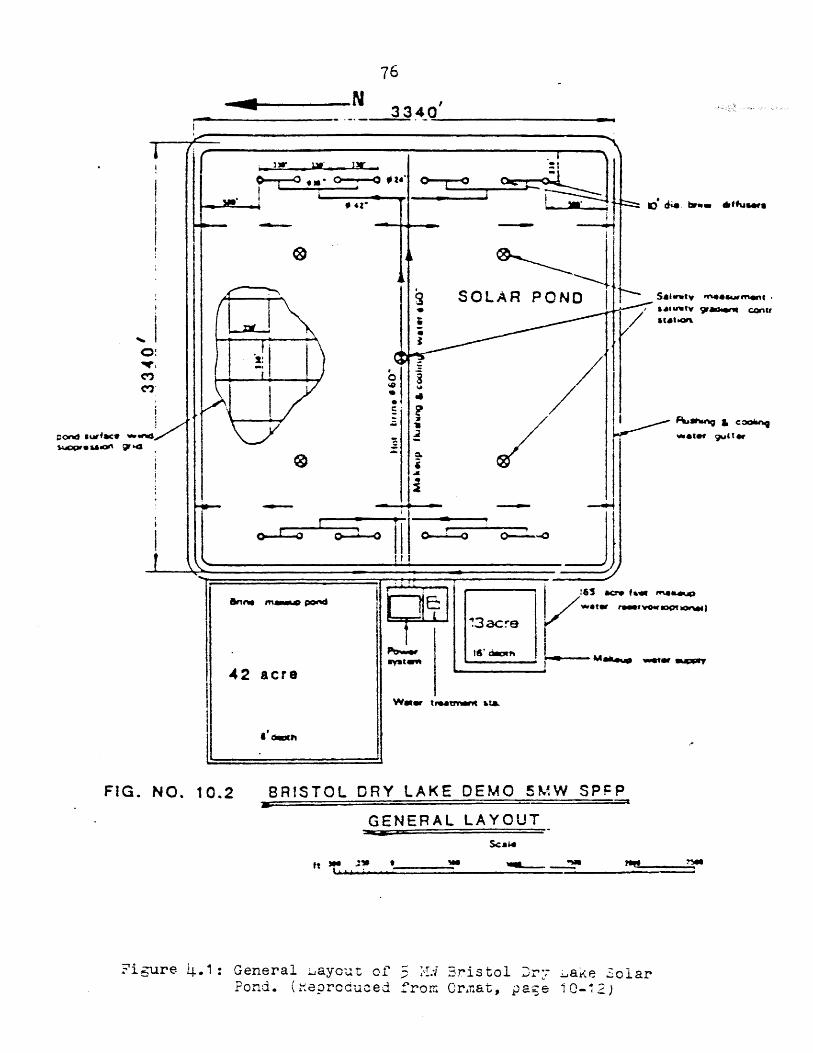
4.2.1.- Bristol Dry lake
The first site is located at Bristol Dry Lake in San
Bernadino County, California. The salt lake covers the lowest
76
-3 N 3344
FIG. NO. 10.2 BRISTOL DRY LAKE DEMO
GENERAL LAYOUTScawi
3" *___________
Figure L.1: General Layout of 5 :• Bristol Dr~ ,ake SolarPond. (1eproduced from Criat, page i0-12)
Cond surfaceriOml•o g
4. br"w dotfusws
tv b la huww Cntr
st•rg & c~hnrwoter qwtter
s worudl
awaserN DOC46sumy
5mlW SPFP
----" -------- ~-~ ~~--~I c- '-" --- --
---
a) SYNTHETIC WE,
COMPACTED LOCAL CLAY
ATHER - PROOF LINER
SYNTHETIC LINER
NATIVE UI
NATIVE C
2PPER SOIL 11
LAY
ACTFJ CLAY
e" " W W9
b) COMPACTED NATIVE CLAY LINER
COMPACTEO L
NATIVE UPPER
NATIVE CLAY
;LAY LINER
MPACTED FILL
LIGHT RIPRAP
/ - I - - ' , # I I -.
..
...
'..
.
c) BENTONITE SLURRY TRENCH-
All depressions are BENTONITE SLURRY TRENCHcut and c,
LIGHT RIPRAP
.. 1~, -- '- .
; AL-, - .-- .- -
I II - I-
FIG. 10.3 BRISTOL DRY LAKE DEMO 5MW
TYPICAL DESIGN FEATURES
ON PERIMETER CUTOFF CONCEPT
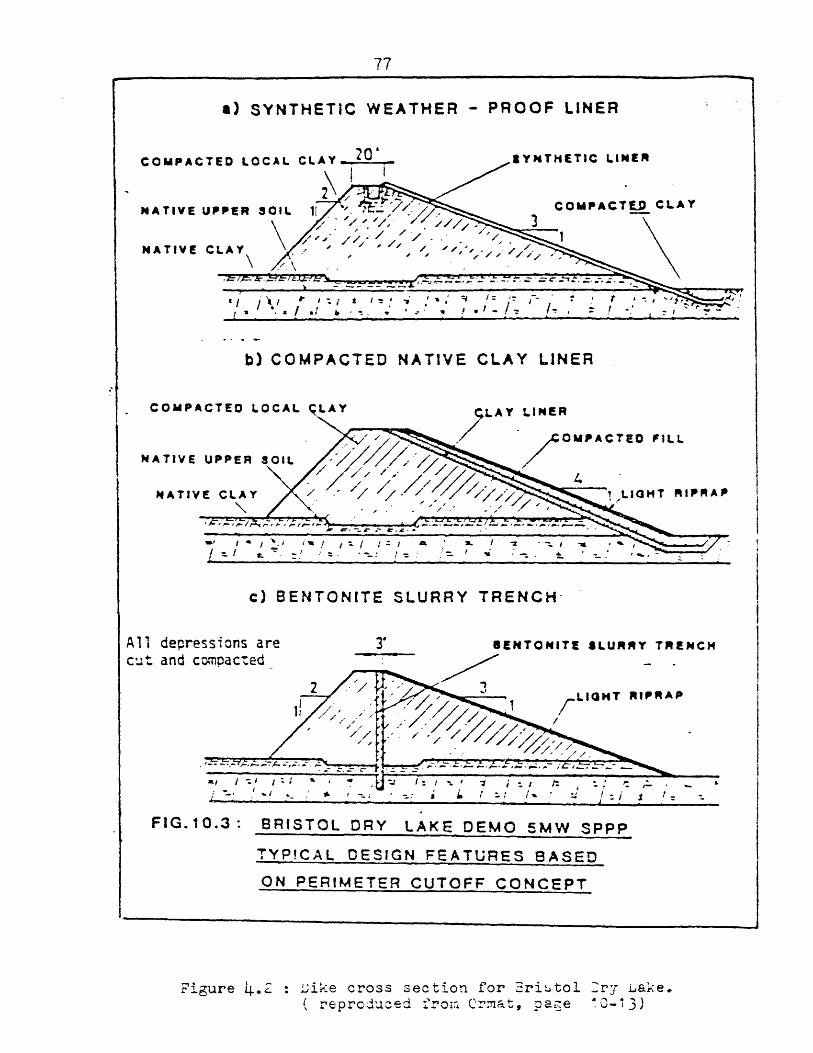
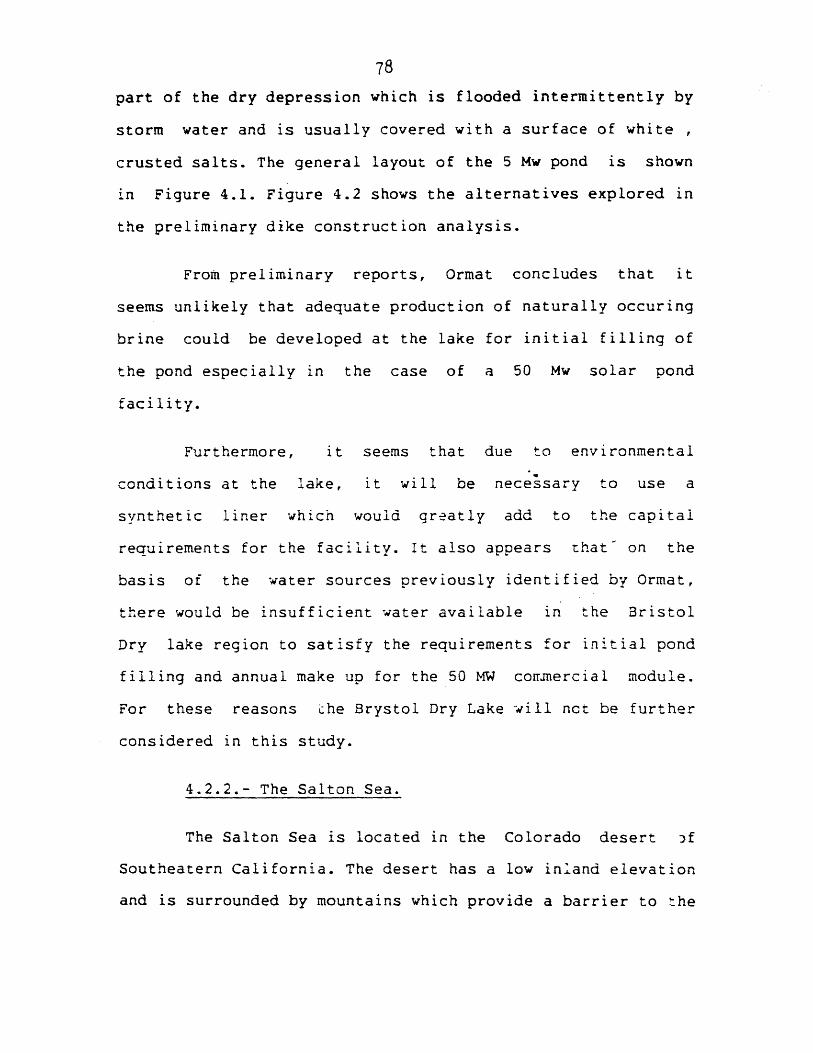
Figure 4.2 : -ike cross section for Eristol .ry Lake.( repr'cduZed froi Crm~at, paie ..- 13)
SPPP
BASED
-- F;rL·~i;4
// ///
- -~-
.-• .- -, - 4 j- -• _ _.-" ...
II
I
IL IJ III I-- L--'-
SPPP
_ _-- I- - --- ---- ---------------- ·--- - ---- i ------.--.~111"~~11-~-~I--~~
00. . , .- _ r- ' , C •: . - .,
78
part of the dry depression which is flooded intermittently by
storm water and is usually covered with a surface of white ,
crusted salts. The general layout of the 5 Mw pond is shown
in Figure 4.1. Figure 4.2 shows the alternatives explored in
the preliminary dike construction analysis.
From preliminary reports, Ormat concludes that it
seems unlikely that adequate production of naturally occuring
brine could be developed at the lake for initial filling of
the pond especially in the case of a 50 Mw solar pond
facility.
Furthermore, it seems that due to environmental
conditions at the lake, it will be necessary to use a
synthetic liner which would greatly add to the capital
requirements for the facility. It also appears that- on the
basis of the water sources previously identified by Ormat,
there would be insufficient water available in the Bristol
Dry lake region to satisfy the requirements for initial pond
filling and annual make up for the 50 MW coimmercial module.
For these reasons che Brystol Dry Lake will not be further
considered in this study.
4.2.2.- The Salton Sea.
The Salton Sea is located in the Colorado desert 3f
Southeatern California. The desert has a low inland elevation
and is surrounded by mountains which provide a barrier to the
_ ___~_

AA oa
0 10 wa
Figure L.3 : Southes;tern Californiareproduced from ur:r.a, pace 2-1V)
~l*rn·
-- -- - -- · -- ---- -----------·--· ~ ---- --- -- ------ -
hRIlOIY

J'l
(8
t' 1) (D
.IO r*C"l C
! 0 C)fU) (D :1Ut) ;-
L·,)~5 ~ZI ..jl 3
'*J
P.4)1*
" %&#. 0- r .% "4 it vi I ,
LAP( i 4916 0 1gP 1 4.0
· I·*lf -·d· (ad)· ( * 14tue
*q* * .4 .&-4ft*
I I1
4,-C
YUI
LI
I*H Ama olpt
O Aa'ef* 0 tl 0a # &,OI--- -UG Oabi- 0" a...- a .et
kolh ft A*o*.*e **eg a *a
I I, ? )
Inclp Utill I* Ig ,Ial(
PRt. (f?- i ll r
ll SAI(L riasis( ils pean
PI'C PtI SNt At UtS( ANDhisAt u•liaN OUt (l(jIpbt .
lo I ts
so**R - c ,
L"-
i·····

81
Pacific Coast. The general location of the lake is shown in
figure 4.3 while figure 4.4 provides a more detailed
geographical description of the site.
The lowest point of the desert is the lowest point of
the Salton Sea at 278 ft below sea level. The surrounding
mountains reach several thousand feet. The Salton Sea covers
an area of 360 square miles. I':s maximum length is 36 miles
and its width varies from 9 to 15 miles.
The selected location for this base case study is the
Salton Sea.
.3.-Construction features.
The construction of the solar pond at the selected
location includes:
- construction of dikes.
- dredging the layer of floor sediments and leveling
it to obtain the required depth.
- protecting the dike slopes with boulders and riprap
and constructing roads over them.
Several issues must be considered during the design
phase before construction is given the go-ahead. They are the
following:
- cost of construction on shore verses off shore.

S4LIi~ntV qradente 1m*.re station.
I s" $f**ee f*** *o*wvs
/ w-vet ***** ve
EVAPORATION
ONDOBRINW MArXE UP POND
RVAPORA
S- IETTLING POND
" POWIN STATION
TEIR TREATMENT STAT;O
.3
N NAVAL BASE
DEMO SPPP
w1Uid 2¶8 @ 1000 !300
-nC 4.q :e ra y I7 tv o uSolar CorI. (Repro-cued
:IrN' 3alt~r~ S;
SVA A P
POND
rw•
- -i -i i I I I dl i -
POND
--- -
~__-----~--------L

\, 800 MW SPPP COMMERCIAL PLANT LAYOUT AT SALTON SEA
FIG. 19-1
Cluster 3r
/^
'N
UiCluster
265 P** Irr to* Fluae•sl
and UMke tipr &I Cl0str I--- Walr Trealoent
,Fre SIalto Sea / PIant (typ.- '
n', C)
- P\
(I
u POWEA STATION PODct 50 a,*Cos, foeur 601W voile (1Iv)
t1 2 31ۥ*,"rr--I1
'OUNC
, MILl
so 4231
. I ,. . .
)
I I

- area availability.
- compatibility of brine production with existing
floor sediments and the cost of removing the top floor
material if this proves to be incompatible.
- problems associated with dike construction in the
sea for both evaporation and solar pond.
These aspects were considered in the Ormat report for
the construction of the 5 Mw demonstration pond (figure 4.5 )
and the ultimate expansion to a commercial facility of 600 Mw
made up of twelve 50 Mw volumes.(see figure 4.6). The Ormat
report should be considered for an in-depth treatment of
these aspects.
As was indicated before, the calculation of'our base
case 50 Mw estimate is based to a certain decree on Ormat for
the technical data and some unit cost estimates but most
calculations for the quantities and construction
configurations had to be extrapolated after justified
assumptions were made from the cost breakdowns available.
4.3.1.- Pond sizing.
We generally followed the sequence of construction
needed to build the 600 Mw commercial facility to site and
size our 50 Mw pond. Pond number I was used to base our cost
estimates (see figure 4.5). The rest of cluster 1 (i.e.,
- --- 113--·11 ~ I-- I

85
3962.4 m Ir
2514.6 m
1223 m
LAYOUT OF 50 MW POND
SALTON
Figure 4.7 : Layouz of 50 M;U pond forSaltcn Sea.
FOR
SEA
the
- --
I --
17

d6
ponds 2,3,4) would only be needed for the initial brine
production (see figure 4.6) . They were not considered to be
the required size for the steady state brine make up pond.
The brine make up pond size was estimated from the 50
Mw Bristol dry lake facility assuming that sizing
characteristics for the two Southern California sites are
closely related.
Figure 4.7 shows the layout of the 50 MW pond for the
Salton Sea. The solar pond has an area of 8.9 million square
meters which translates into a pond perimeter of 12,250
meters. The brine make up pond has an area of 1.5 million
square meters and an assumed depth of 1 meter.
It is useful to relate the area of our 50 Mw pond to
the 5Mw and 600 Mw facility. The following ratios will be
used in our cost estimates:
Area 50MW= 8.9 * Area of 5 Mw.
Area 600MW= 12 * Area of 50 Mw.
4.3.2.- Dike construction.
For the 50 Mw pond, it is intended by Ormat that the
impoundment dike be constructed and designed using as many
materials as are available on site. Due to the relatively
large quantity of embankment material required for
constuction, the subsea floor material should be used
_ ___ ____.

_11_~1~ __
_ IIII
_
Cr

88whenever practicable.
Due to the absence of a complete geotechnical review
of the area of the pond, it is impossible at the present time
to assess this approach with certainty although this would
clearly reduce transportation cost of borrow materials to
erect the dikes.
Dike cross-sectional design is based upon the Ormat
report. The dike is made of dredged fill and sandy loam and
has a slope of 1 in 3. The bottom width is 51.72m with a top
width of 6 m. The dike is protected by heavy riprap on the
Salton Sea side to protect it from wind effects and wave
action as is shown in Figure 4.8 . On the pond side, a
synthetic liner or a light riprap are used to prevent seepage
of the higher concentration brine into the Salton SeA. A road
was also placed on top of the berm for ease of maintenance.
4.3.3.- Sea floor sediments.
The bottom top soil consists mainly of sea floor
sediments. The sediment is a chemically reduced dark gray to
black in color. It contains a heavy organic material and its
consistency is like heavy grease. The observed thickness of
the soft sediment ranges from less than 0.30 m to as high as
5 m.
This material will contaminate the bottom zone of the
solar pond and brine turbidity will reduce the efficiency of

89
the pond. these sediments have to be dredged from the floor
area for the solar pond.
4.3.4.- Dredging.
A solar pond net depth of 5 meters is needed to
provide the annual baseload service at the nominal power
output. Figure 4.6 shows the 600 Mw commercial plant layout
of the Salton Sea while figure 4.9 shows the region within
the 600 Mw plant to be dredged to provide the requisite solar
pond depth.
The maximum depth of material to be dredged is
approximately 3.35 meters with an average dredging depth of
about 1.5 meter. The dredged material can be placed in the
deeper portion of the impoundment to reduce earthwork haul
distance while maintaining depth requirements overall.
4.3.5.- Liner.
Riprap is essential for a dike embankment constructed
from dredged material. According to Ormat, this can be either
a quarry run riprap or graded ston riprap placed over a
crushed stone bedding material. The bedding material should
provide adequate freeboard above the expected wave level plus
a maximum wave height.
Protection of the interior slopes is less critical due
to the effectiveness of the solar pond wind and wave
__

REGIO)N TO 81 DR.IDGED FOR 600 MW COMMERCIAL PLANTAT SALTON SEA
727o
'2 -- -A M =.
P ,ure ' .- : R-egio . - be dred~c,, a: the cal-,n Sea.(throducee from Or7a-, pa.z e 19-12)
_II~ _ _ ~ ~CII ~I ~ ~L I · _~II~~
91
suppression netting. Use of a synthetic liner is recommended
by Ormat.
4.4.- Cost Estimation of the 50 Mw solar pond
No estimate was available for a 50 MW plant and no
extrapolations could easily be made from the 5 MW and 600 MW
pond cost breakdowns provided by Ormat since the correlation
between these facilities is not linear. Furthermore the
quantities computed are for illustration only and may not
conform to the final quantitie.s and cost at the Salton Sea.
The estimates below include some assumptions on project
configuration and site conditions. These assumptions will be
detailed below.
A plan view of the facility was given in figure 4.7
It assumes a solar pond collecting area of 8.9 million square
meters, with a brine make up pond of 1 m depth.having an area
of 1.5 million square meters. In estimating construction
quantities, the dike cross section showed in figure 4.8 was
assumed as typical.
These cost estimates are specific to the Salton Sea
location according to our estimates and to Ormat. They do not
have the general nature of our estimates in Chapter 3.
Inflation was treated in accordance to a Heavy Excavation
Handbook index and was taken at 6% per year.
4.4.1.- Total Dike Construction Costs.
I

92
The dike construction costs include the following
items as described under account number 102 of tables 4.1 and
4.2 :
- dike construction;
- excavation cut-off;
- slurry trench compaction;
- gravel riprap;
- heavy riprap and;
- crushed rock road.
The volume of earthwork needed to construct the dike
is equal to the cross sectional area of the dike times the
perimeter of the pond.
volume= (220.7) * ( 12,248.7)= 2.7 million cubic
meters.
From Table 4.3, the 600 Mw cost for dike construction
is $199.4 millions. Reducing by a factor of 12 to the 50 Mw
range gives a cost of $16.61 millions.
From Table 4.1, the 5 Mw cost is $1.44 millions.
Increasing by a factor of 8.9 to the 50 Mw range, the cost is
$12.816 millions.
The price ranges given in 1981 dollars per cubic yard
_1_1_ _ I -C_ ~ _ I IC _CIII~ _I _ _ __11_111_11_11_1_111__1__1_____1____1_1

93
TABLE A - SALTON MAVAL 8ASE 5 i CE(~NST1RATI3M SPPP - SCLAU PCOl SYSTEMBREAKOnA OF COST ELEK(IT$ (US $)
CostAcc.
102
103
h I F
1.3001 'X0) 0 jr
-- Itm
Geotechnical survey
bathimetry sOPt409n
Surveying tAic. aerial
Se. ecploretton progrur
Sub-Total
Solar pond constructioa
dredging soe floor
Orwdqw of clayey loam&#,d levllng
Gravel toe
01kes construction
Excavatton cut off
SlVrry trenC% camoctlon
Placumrt of filter
gravel rJPraP (12")
iprao . heavy (Ia')Crushd rock road (12')
Inner slop protection
Sub-Total
Acre
Acre
Job
CY
CT
CT
CYSF
CT
CT
CT
SF
CT
CY
Job
each
Job
Unit
Job
Job
Each
38M0000
I.
Iost
70
20
130.000
.80
1.50
10- 15
0.90 -1.22.502.00
2CS
LS-z6.60
1.20
.5-4.50
350,0
7,000
53,000
8,000160.000
Amount
70,000
20,000
$ 220.000
1 290.400
1,500,000
.. 000 .- 900 co001.,80m000 - 1,4•0,000
ICS,500
740.000
800,000
35,.000
112.500 - 187,50052 C000
6.765,400 - 71.500.400
1.500.X0 - 4. 50,C00050.000
200 000
2,3^,000 - 5.236,000
110,000112,000
80,000
160 ,00
752,000
Table 4.1 : Cost Ereakdc:.n of -he 5 MW pona at the3alt-on Sea. (Ormat, xnpenrix 3-2)
40,00015,000
7,500
270.000
Constrmction of arvaora.tion C* ft
£Ecavation, ditks fouo-
datlon (strippnqg)
Comacted borrow fill
,oterial
Pipinq
Putnq station incl.Installatlon
Sub-Total
Brtne circulatlion sys.Pipi ng
Diffusers
Valves 4 FIttingSuaort I Anchorlng
P.Inteq station
Sub-Total
__
1
1,613,000
1.000.000
60.000
1200,3000
t Z,23042.2000370,M00
Unit Quantl ty
--
·~------------~ ~_~ _~ _ _
m

ItemCostAcc.
NolIS
Cn-site instrumen-
tationMeteoroloqical st.atlon
utst "asurem nt,
Sub-Tota l
Tar•.e 4.2 Cost Brec:dowa n foSalton Sea. (Orna
r the 5 MW pondA, -pzen*-i 3-- ".ooe •v , ' -[•" 9 . +
ja:ntity
107
109
UlNt
Cooling systen (once
thru)
Constructioa of tater
Inlet & outlet
PNs.inq station itc.
Instal l4tliPipinq
Valvts & fittings
Sub-Tota I
Watar flushing system
Pipngq
ilffusers
Valves & Fittings
Pu•fnq stationr
Sub-Tot I
Water treat•At plant
Gradient control
system nci. control
tt, Rnettling, ancho-
ring. pso A6 piping
Sub-Tota 1
Instrment.ation i
Controls
ln-pond instrw•n-
tation
Teaxerature orrbes,
measureuent system
(gradient)
Soil temp. ansyuremet
systemFlowe-ter & instru-
mntation
Salinity meesureentTransoarency
Insolatlon
UnitCost
300,000
170,00070,00020,000
60,00020,000
10.000
50.000
Job
Ea.
Job
Job
Unit
Unitt
Unit
Systa
Unt t
Ea.
Ea.
Ea.
Ea.
Ea.
Ea.
Ea.
a..
1.000
1.500
3. 0w
1,0001.2001,C000
25,.000
momnt
120,000
70,.C020 S"00
510.000
60.000
20,000
10.000
140,000
1,000,.0
650,000
10.000
5,00
6.C00015,000
5,000
5. 000
25.000
72. 000_.,--•t,Cy0
- ·
-- IA-
~~_~ _~_ _ ...~--~I ---~-- -·-- -------------c~ll~l~~11----Lllll
653.000
1

TABLE 16.1
PIELINIlKAR COST ESTMIMTE FMR 060 SPPP
COST COST (1.Q.W 0 00 1)ACCOUNT FTlI (OCT06ER 1980 PtICE LEVEL)40.
100 Solar Pond SySt
101 Ceotechaical Survy102 0r"•dg ta103 011e Constructtan (Including solar pods, evaporation 199.4*
ponds and tine mate-ue ponds)
104 Irintn Circulatio System Z8.810 Pond Surface Flushing and Cooling 68.4
106 Water Tream t Plant 36
101 Gradliet Contrl System 710.2108 Imtr Utatita and Control 1.2109 Pamer Station Yard Develop• t 2.4
110 Engineering and Oesign 30.4IIl Manqagmwt. Stervwisto and Administratton 20.2
Sub Tota I
200 Power 6eneratinq Unit
201 Plant U-Ipme - 11
2OZ r.ostrntion Material 14S203 Construction and Installatiao 60204 Engineering and Design 17205 eanagment, Sup•orston and Atlnistration 7
Sub Total 540
TOTAL S1.09
Includes the cost of lnpouw ont dike construction for this 50 square tile re•Qon. $108.4 million.
Table 4.3 : Cost Breakdown for the 600 MW pond atthe Salton Sea. (Ormta-, page 16-5)
201 Plant vanl~e 311
in the same tables are from $0.90 to $1.20. Adjusting for
inflation and converting to cubic meters, the range becomes
$1.30 to $1.75 with a mean of $1.55 per cubic meter. The
other components of dike construction were discussed above.
Totaling these items, a differential of $1.00 to $2.25 is
found.
The total dike construction cost is obtained by adding
the unit dike construction cost to the differential found for
the other dike construction items. The total unit dike
construction costs used for the purpose of this case study
range from $2.55 to $4.85 per cubic meter.
The total dike construction costs range from $6.885
millions to $13.035 millions.
4.4.2.- Dredging costs.
As is indicated by Ormat, the averace quantity to be
dredged is 1.5 meters. From figure 4.9, we assume that on
half of the area of the pond is to be dredged due to its
location.
Our independent calculation indicates that the volume
to be dredged is equal to one half the area of the pond times
the average depth.
Volume = 8.9 millions square meter * 0.5 * 1.5 meters
6.675 million cubic meters.
_~~II-~^---- : -- ·--- e - --------- ------ P--""~ ~ ---------------- ·~---·1~-·111~·-·---·--·

97The Ormat report on the 5 Mw pond separates dredging
costs between the dredging of sea floor sediments and the
dredging of the clayey loam. This distinction is not made
for the 600 Mw pond where only a total dredging cost of $100
millions is given. Taking a weighed cost of dredging to be
$1.05 per c.y. ( obtained from Table 4.1), the dredging
volume of the 50 Mw pond when deduced from the 600 Mw plant
can be obtained as follows:
($100 millions/S1.05 cy)*(.765 c.m./c.y)/12 modules =
6.07 million cubic meter.
From the 5 Mw facility, the volume is:
($1+$1.6 millions)*(.765 c.m/c.y)*8.9= 17.8 million
cubic meters.
If we assume that the dredging volume of the sea
sediments is 6.675 million cubic meters, then by direct line
interpolation, the volume of clay dredging amounts to $8.75
million cubic meters.
From the Excavation handbook, taking inflation at 6%
for 4 years with correction for cubic meters, a dredging cost
of $1.80 per cubic meter was obtained.
From Table 4.1, the following cost range was obtained:
$1.18-$2.20 . So, for sediment dredging, the cost range was
assumed to be $1.20-$1.80 . For clay dredging, the cost was
__I

assumed to te $2.20
The overall dredging costs can now be calculated and
are as follows:
- sediments: $8.010- $12.015 millions.
- clay: $19.250 millions.
4.4.3.- Liner costs.
Synthetic liner costs were applied to the construction
of the solar pond for environmental reasons. Only the
interior side of the dike is covered and not the whole area
of the pond plus the interior sides of the dikes as is
recommended by liner suppliers for truly effective seepage
protection. The required width of the liner is therefore 24.1
meters and the total surface area of the liner is equal to
the required width times the perimeter of the pond.
This area is equal to 0.295 millions square meters and
appears to be conservative compared to the estimates prepared
by Ormat.
The unit cost of the liner was obtained from suppliers
a:nd for such a surface area, is estimated $9.5
4.4.4.- Miscellaneous costs.
Estimates by Ormat for both the 5 Mw plant and the 600
Mw extension give miscellaneous costs of about 10 to 13 % of
- 1 - I-

Q99
the construction cost items discussed above ( earthwork,
dredging, liner).
For purposes of this case, a value of 12 % of the
construction costs has been assumed to cover miscellaneous
costs.
4.5.- Conclusion
The construction estimates are tabulized in-Table 4.4.
The total costs of the facility ranges from $41.382 millions
to $52.823 millions.
The cost components of the 50 Mw plant are as follows:
- Dike construction 13.0% - 31.6% .
- Sediments dredging 15.1% - 29.0% .
- Clay dredging 36.4% - 46.5% .
- Liner costs 5.3% - 6.7% .
Tabic 4.4 and the above breakdown indicate zhat probably the
most expensive additional costs, when compared with this 50
Mw base case, are at sites where salt has to be provided and
where synthetic liners are an absolute neccessity not only to
prevent seepage along the sides of the dikes but also on the
bottom of the pond. On the other hand, the costs can be
reduced at sites where no dredging is required.
The predicted energy costs are presented in Table .-5
(Carmichael, MIT 1984). It has been assumed that dense brine
_ __
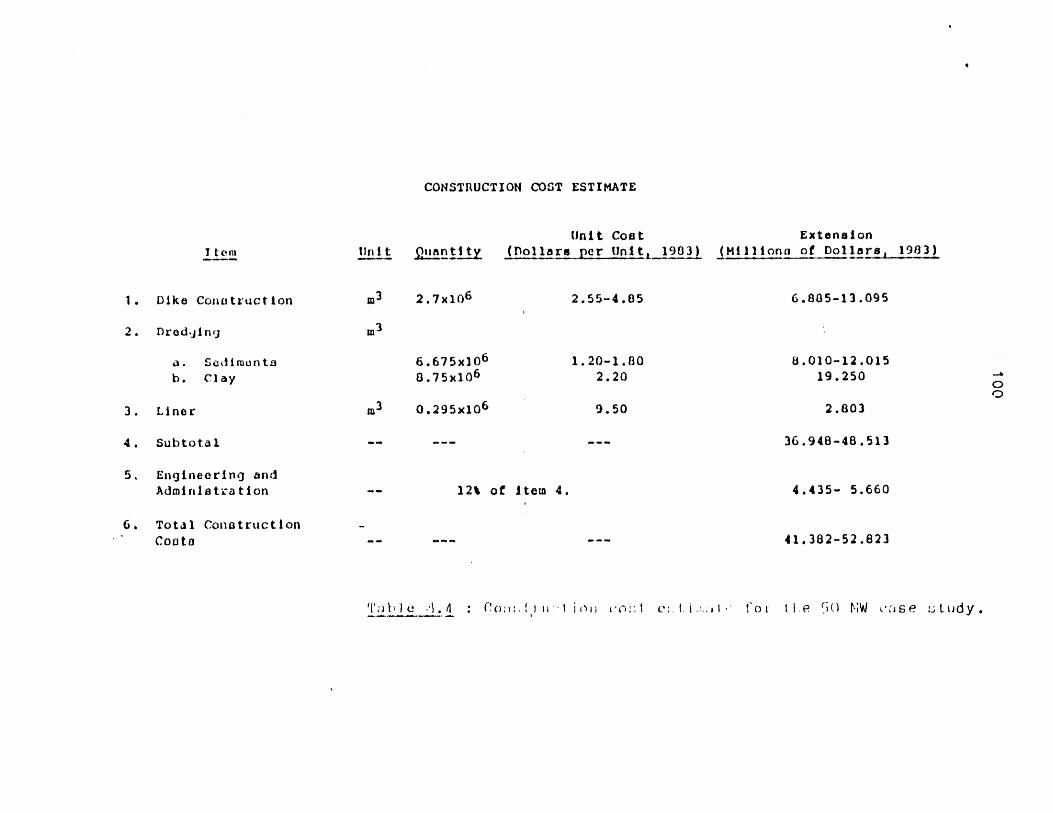
CONSTRUCTION COST ESTIMATE
I tenm
1. Dike Construction
Unit 21nt 6i tY
m3 2.7x10⁶
Unit Coat(Dollars per Unit,
2.55-4.85
Extension1983) (Milliona of Dollars , 1933)
6.885-13.095
2. Dredging
a. Sedimentsb. Clay
6.675x10 6
0.75x1061.20-1.80
2.208.010-12.015
19.250
3. Liner m3 0.295x10 6
4. Subtotal
5. Engineering andAdministration
6. Total ConstructionCoots
12% of item 4.
36.948-48.513
4.435- 5.660
41.382-52.823
t l.e P;50 NW c',se u tudy.
9.50 2.803
' T,1; 1 le .'1 4 : ("o" m 0; t 1'1 i, i()I co•-,• t tI i I:lI I, l o l

101
is available at the site, so that evaporation ponds are not
required. The installed cost of the pond includes the pond
construction costs and the power plant construction costs.
The predicted value of the levelized busbar cost of energy is
148 mills/kwh. A figure which is similar to predictions for
other renewable energy sources but not competitive with the
conventional energy sources commonly used to produce baseload
electricity. It would thus seem that the primary drawback 'f
solar ponds is their high energy cost coupled with the
remaining technical uncertainties usually encountered with a
new technology.
_1 __

102
'1able 4.5. :
BUSBAR COST OF ELECTRICITY FOR THE BASE CASE
(source Carmichael, IT 199'L)
Installed Cost (1983 Dollars)
Pond
Power Plant
Total.
Power level
Unit Capital Cost
Capacity Factor
(Average Value First 10 Years)
Operation and Maintenince Cost
Pond ($.57/square meter)
Power Plant (6%)
Levelized (1983 Dollars):
O&M
Capital
Busbar Cost
Levelized Cost Factors:
(Source: EPRI (5))Debt 50%
Preferred Stock 15%
Common Stock 35%
Total Annual Return'
(Current Dollars) 12.5%
Period First 10 yeas
$63.2 million
$58.0 million
$121.2 million
40 MW (Net)3030 $/kW
56%
$5.1 million/year
$3.5 million/year
43.6 mills/kWh
104.4 mills/kwh
148.0 mills/kWh
Inflation Rate
Federal and State Tax Rate
Investment Tax Credit
Tax Recovery
Book Life
rs Levelized Carrying Charge
8.5%
50.0%
10.0%
10 years
30 years
16.9%
___ I _ I I _~ ____ I__C_____ 1·-----1~-·1~··--- -----sl~-·1111111111111~ ----- ~
103CHAPTER 5
THE CLIMATE FOR UTILITY INVESTMENT IN SOLAR PONDS
5.1.- Approach.
The preceding chapters have shown that salt gradient
solar ponds are highly capital intensive facilities whose
energy cost will compare at best to that of other renewable
energy sources. The advantage of non-intermittent energy
production of solar ponds vis-a-vis other renewable energy
sources will be hard to exploit for baseload production due
to these high costs.
The purpose of this chapter is to show that, although
the unattractiveness of solar ponds for electric power
generation is primarily due to their cost, the present
climate of the electric utility is very negative for
investment in new and risky technologies. Even if the cost of
these facilities was more favorable for investment, the
institutional regulation in light of the Public Utilities
Regulatory Policies Act (PURPA) and the financial condition
of the utilities motivate them to assume a passive role in
the development of new renewable technologies.
In evaluating incentives for investment into the solar
ponds, it is important to consider the overall context which
includes the following aspects:

104
- Regulatory environment for electric utilities;
- Utility perception of risk:
- The financial condition of the utility industry.
Before examining the Public Utilities Regulatory
Policies Act, we will review the issues that made its
enactment necessary such as electric utility rate regulation,
the impact of solar systems on electric utilities, and the
effects of rates on solar system economics. PURPA is
extensively discussed concentrating on its effect on utility
investment in new technologies. We then examine the financial
condition of the electric utilities and see how the high risk
associated with solar ponds distorts the capital budgeting
decision.
5.2.- Electric utility rate regulation.
Electric utility rate making is regulated by the
states and by the federal governmnent and receives the
greatest attention in terms of public utility regulation. The
reason why rates are regulated is because electric utilities
are "natural monopolies" which cannot operate economically
unless they enjoy a monopoly. Rate regulation is thus a
substitute for competition in protecting utility customers.
In 1942, in the case of the Federal Public Commission
v.s. Natural Gas Pipeline Company (315 U.S. 575 1942) , the

105
Supreme Court postulated a two step rate making process:
- adjust the utility's revenue level to the demands of
a fair return. This means that the rate should generate
enough revenue not only to cover operating expenses but also
the capital costs.
- adjust the rate schedule to recover the necessary
revenue while maintaining fairness.
Thus a desirable rate schedule should:
- obtain the revenue requirements;
- distribute the revenue requirements fairly among all
customers.
- discourage waste and promote efficient use of energy
kBonbright, 1961).
The Federal Energy Regulatory Commission was
established on October 1, 1977 under the Department of Energy
Organization Act, taking over the responsabilities of the
Federal Power Commission for electric utility regulation. Its
function is to set rates according to the desirable rates
schedule.
The federal government regulates the rates of
interstate suppliers of electric power while the states
regulate the retail utility rates. The power to regulate can

106be exercised by the legislature or it can be delegated to a
commission as was determined in 1933 in the case opposing the
city of Seymour to the Texas Electric Service Company (66F.
2nd 814,816, 1933). The ratemaking function is legislative so
it is not within the power of the courts to prescribe rates
but as directed by the cases of CoLorado Interstate Gas v.s.
FPC, they determine whether the rates are just and
reasonable. In general, Public Utility Commission are
composed of from one to seven commissionners and have staffs
of lawyers, engineers, rate analysts, and economists.
Statutes generally define the regulatory authority of the
Public Utility Commissions and provide guidelines under which
they function.
Public Utility Commission juridiction does not extend
to interstate sales of electric energy for resale and
jurisdiction over municipal utilities vary from state to
state. For example in the states of New York and Wisconsin
they have that authority while in Colorado they do not
(Anderson, 1976).
Public Utility status and public utility commission
jurisdiction are very significant issues for an operator of a
wind, photovoltaic, or solar pond energy conversion system
able to supply excess electricity to a utility. Being subject
to licensing, franchises, site regulations, and certification
for public convenience and necessity may make operation as a
I I _

107
self generator impractical (Dean and Miller, 1977).
Public utility commission rate regulation may,
however, be beneficial in that rates are generally required
to be just and reasonable. Moreover, a public utility
commission may be needed to compel electric utilities to
purchase the solar pond energy or vind user's excess power.
In Hawaii, firms which produce or furnish power
primarily from non fossil fuel sources for internal use but
sell excess energy to local utilities have been exempted from
public utility commission regulation and jurisdiction. Thus
utilities would have to buy the excess power produced by
solar ponds at rates to be set by the PUC, if necessary.
5.3.- impact of solar systems on electric utilities.
There are several problems associated with utilities
and solar energy technology such as solar ponds. Two areas
identified as research priorities are determining the impact
of solar erergy systems on electric utilities and identifying
the impact of solar energy systems on electric utilities and
identifying the impact of various utility rate structures on
the commercialization of solar energy. Several studies are
currently underway or have been completed including research,
development, and demonstration projects. Although none of
these studies considered solar ponds, similarities can be
drawn.
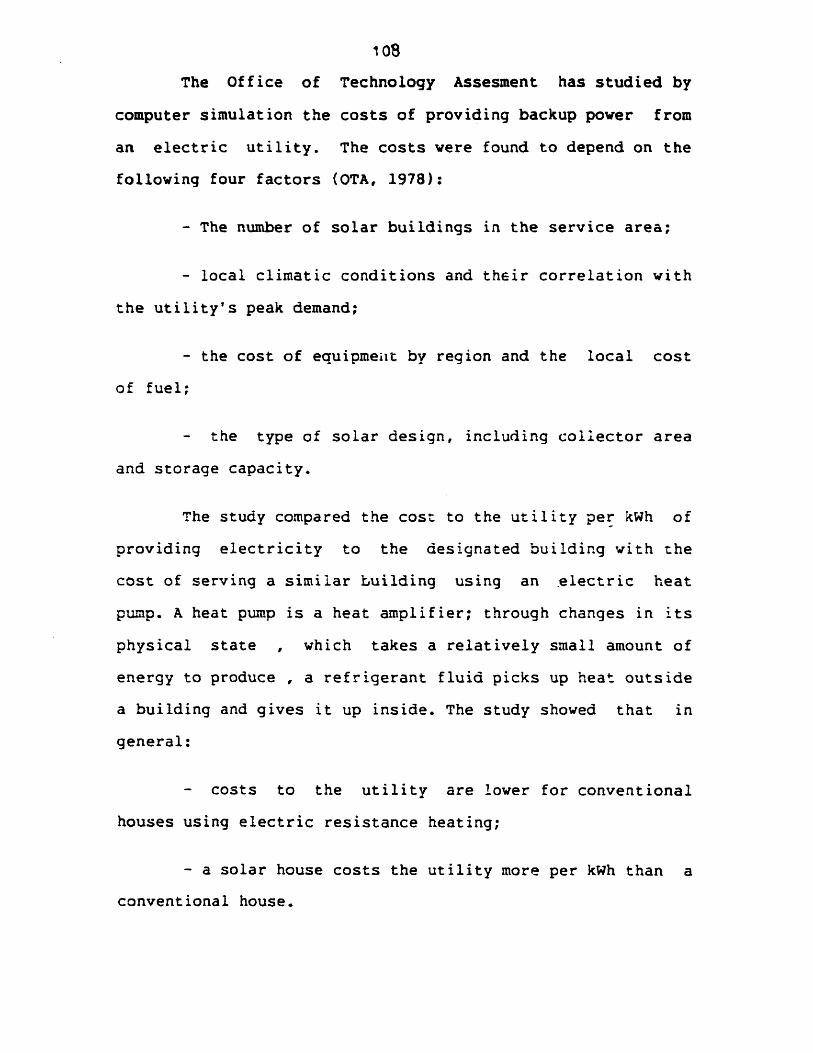
108
The Office of Technology Assesment has studied by
computer simulation the costs of providing backup power from
an electric utility. The costs were found to depend on the
following four factors (OTA, 1978):
- The number of solar buildings in the service area;
- local climatic conditions and their correlation with
the utility's peak demand;
- the cost of equipmeiit by region and the local cost
of fuel;
- the type of solar design, including collector area
and storage capacity.
The study compared the cost to the utility per kWh of
providing electricity to the designated building with the
cost of serving a similar building using an electric heat
pump. A heat pump is a heat amplifier; through changes in its
physical state , which takes a relatively small amount of
energy to produce , a refrigerant fluid picks up heat outside
a building and gives it up inside. The study showed that in
general:
- costs to the utility are lower for conventional
houses using electric resistance heating;
- a solar house costs the utility more per kWh than a
conventional house.
C _I

109
It was also found that the utility's costs of
supplying electricity to an all electric house with storage
capacity for heating water and cooling are nearly 50% less
than the costs of service to a similar house without storage
capacity.
The .nature of the conflict between solar applications
and the utilities was addressed by the Energy Policy Project
of the National Conference of State Legislatures. The
conflict stems from two basic sources:
- reduction in net electric sales: any energy source
which is utilized to displace electric sales exerts an
adverse impact by reducing the utility's energy market share.
- reduction in load factor: to the extent utility
pricing structures do not accurately reflect utility
operating costs, lost sales may affect revenues differently
than costs (Jones, 1978).
One computer simulation study showed that if solar
devices become widespread, the electric utilities will suffer
from two major effects:
- they will reduce electric utility revenues during
periods when solar energy is being used and;
- they will either increase or decrease the electric
utility's peak demand requirements depending upon the type of
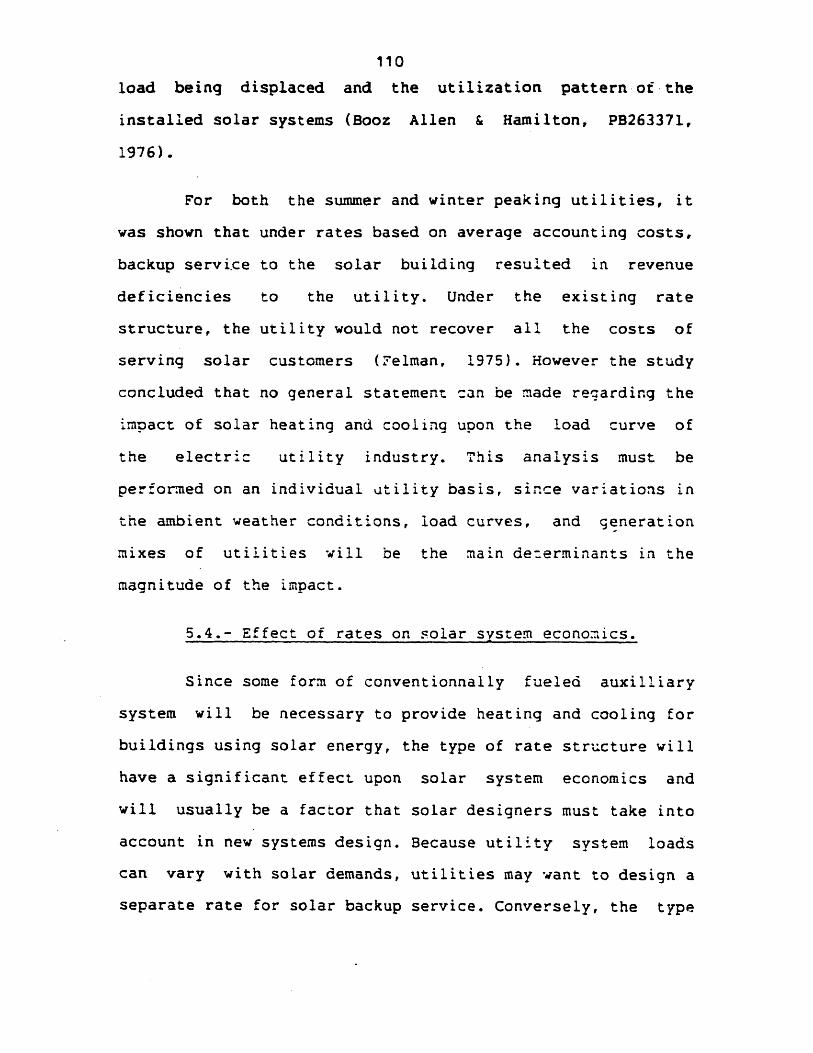
110
load being displaced and the utilization pattern of the
installed solar systems (Booz Allen & Hamilton, PB263371,
1976).
For both the summer and winter peaking utilities, it
was shown that under rates based on average accounting costs,
backup servi.ce to the solar building resulted in revenue
deficiencies to the utility. Under the existing rate
structure, the utility would not recover all the costs of
serving solar customers (Felman. 1975). However the study
concluded that no general statement can be made regarding the
impact of solar heating and cooling upon the load curve of
the electric utility industry. This analysis must be
performed on an individual atility basis, since variations in
the ambient weather conditions, load curves, and generation
mixes of utilities will be the main de:erminants in the
magnitude of the impact.
5.4.- Effect of rates on solar system economics.
Since some form of conventionnally fueled auxilliary
system will be necessary to provide heating and cooling for
buildings using solar energy, the type of rate structure will
have a significant effect upon solar system economics and
will usually be a factor that solar designers must take into
account in new systems design. Because utility system loads
can vary with solar demands, utilities may want to design a
separate rate for solar backup service. Conversely, the type
I
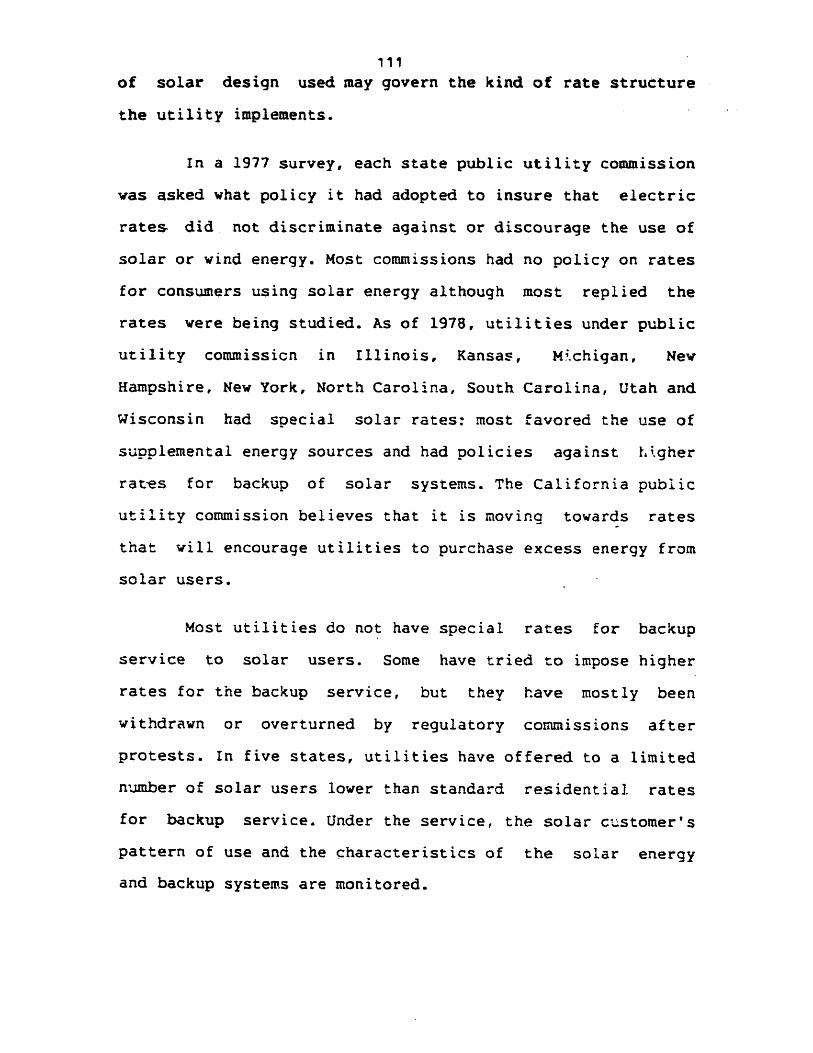
111of solar design used may govern the kind of rate structure
the utility implements.
In a 1977 survey, each state public utility commission
was asked what policy it had adopted to insure that electric
rates did not discriminate against or discourage the use of
solar or wind energy. Most commissions had no policy on rates
for consumers using solar energy although most replied the
rates were being studied. As of 1978, utilities under public
utility commission in Illinois, Kansas, Michigan, New
Hampshire, New York, North Carolina, South Carolina, Utah and
Wisconsin had special solar rates: most favored the use of
supplemental energy sources and had policies against higher
rates for backup of solar systems. The California public
utility commission believes that it is moving towards rates
that will encourage utilities to purchase excess energy from
solar users.
Most utilities do not have special rates for backup
service to solar users. Some have tried to impose higher
rates for the backup service, but they have mostly been
withdrawn or overturned by regulatory commissions after
protests. In five states, utilities have offered to a limited
number of solar users lower than standard residential rates
for backup service. Under the service, the solar customer's
pattern of use and the characteristics of the solar energy
and backup systems are monitored.
_·

112
In October 1975, the Colorado public utility
commission allowed the public service company of Colorado to
put into effect a mandatory demand/energy rate for electric
heating and for backup service. This rate would have made
solar backup service more expensive for most solar customers
than service under the general residential rate. The rate was
designed in part to bring revenues to cover what the company
claimed were extra costs of providing auxilliary electric
service to solar equipped facilities. After protests and
hearings, the commission changed the rate to make it
optional.
Another solar backup rate which was rescinded after
protests was the special service deposit in Columbia,
Missouri. The electric utility, in september 1977, looking
towards higher rates for solar beackup, instituted a
reauirement that customers taking backup service deposit
$200, in addition to the regular service deposit. The extra
deposit was to be applied to the bill should a higher rate be
adopted for standby service to solar equipped facilities.
Providing auxilliary service to customers using solar
ponds, or wind generated power involves issues in addition to
rates for backup services. The load factor of a small power
producer will not be high because the systems are expected to
result in a minimal auxilliary energy use, with intermittent
demand. The concerns of the small power include whether an
____ __

113electric utility is required to purchase excess electric
energy and, if so, the rate at which the utility purchases
the power.
A 1975 George Washington University study found that
most utilities prohibit reverse power flows back into the
utility grid (Mayo, 1977). Because this practice is contrary
to the national goal of conservation of depletable energy
ressources, public utility commissions and legislature are
beginning to fight that utility policy. The Energy Task
Force, an organization which rehabilitated a tenement in New
York City installed a solar system for the building's
lighting (Finch, 1977). The Consolidated Edison Co. which
supplies electricity in the city was unwilling to allow
reverse flow from the windmill back to the utility. Ats
concerns were the windmill's effect on the utility
transformers and computerized controls and possible hazards
to line workers. The New York commission ordered Con Ed to
buy excess power from the wind machine. The rate adopted
contains an energy charge and a minimum monthly charge. The
commission refused to let Con Ed include an indemnification
clause which provided that "each customer shall agree in
writing to hold the company harmless and indemnify it for any
damages or injuries in any way resulting from the
installation or operation of this equipment." If it had been
approved, windmill operators would probably have needed
liability insurance which would have been another cost

disincentive to windmill operations.
5.5.- Rates structures and solar system design.
Utility rate structures for backup service are likely
to exert a strong influence on solar system design and
commercialization. One study examined the potential impacts
of four different rate schedules on utilities and solar
commercialization. The inversion or flattening of traditional
block rate structures would increase energy cost savings
realized by solar users and thereby provide a marginal
incentive for solar energy use. The financial effect of rate
inversion on the utility was incapable of precise measurement
but would depend heavily on the utility's individual
characteristics.
Under time of day (TOD) rates, solar facilities could
be designed optimally for the benefit of both the solar user
and the electric utility by providing offpeak storage
capacity. The economic impact of TOD rates upon the utility
would depend upon its individual operating characteristics
and the administrative and metering costs associated with
this rate structure.
Another study found that the type of rate structure
imposed by an electric utility for auxilliary service
significantly affects the most cost effective design of the
solar system. The effect is a financial barrier to the
__ I_
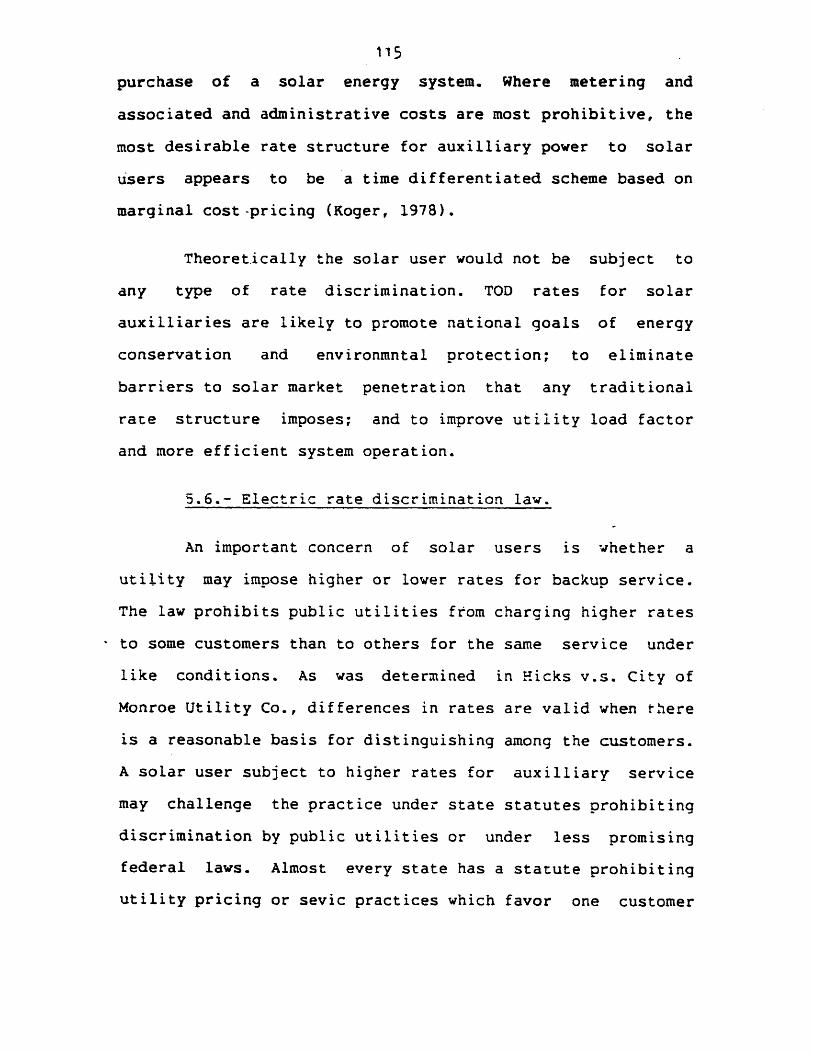
115
purchase of a solar energy system. Where metering and
associated and administrative costs are most prohibitive, the
most desirable rate structure for auxilliary power to solar
users appears to be a time differentiated scheme based on
marginal cost-pricing (Koger, 1978).
Theoretically the solar user would not be subject to
any type of rate discrimination. TOD rates for solar
auxilliaries are likely to promote national goals of energy
conservation and environmntal protection; to eliminate
barriers to solar market penetration that any traditional
rate structure imposes; and to improve utility load factor
and more efficient system operation.
5.6.- Electric rate discrimination law.
An important concern of solar users is whether a
utility may impose higher or lower rates for backup service.
The law prohibits public utilities from charging higher rates
to some customers than to others for the same service under
like conditions. As was determined in Hicks v.s. City of
Monroe Utility Co., differences in rates are valid when there
is a reasonable basis for distinguishing among the customers.
A solar user subject to higher rates for auxilliary service
may challenge the practice under state statutes prohibiting
discrimination by public utilities or under less promising
federal laws. Almost every state has a statute prohibiting
utility pricing or sevic practices which favor one customer
_·
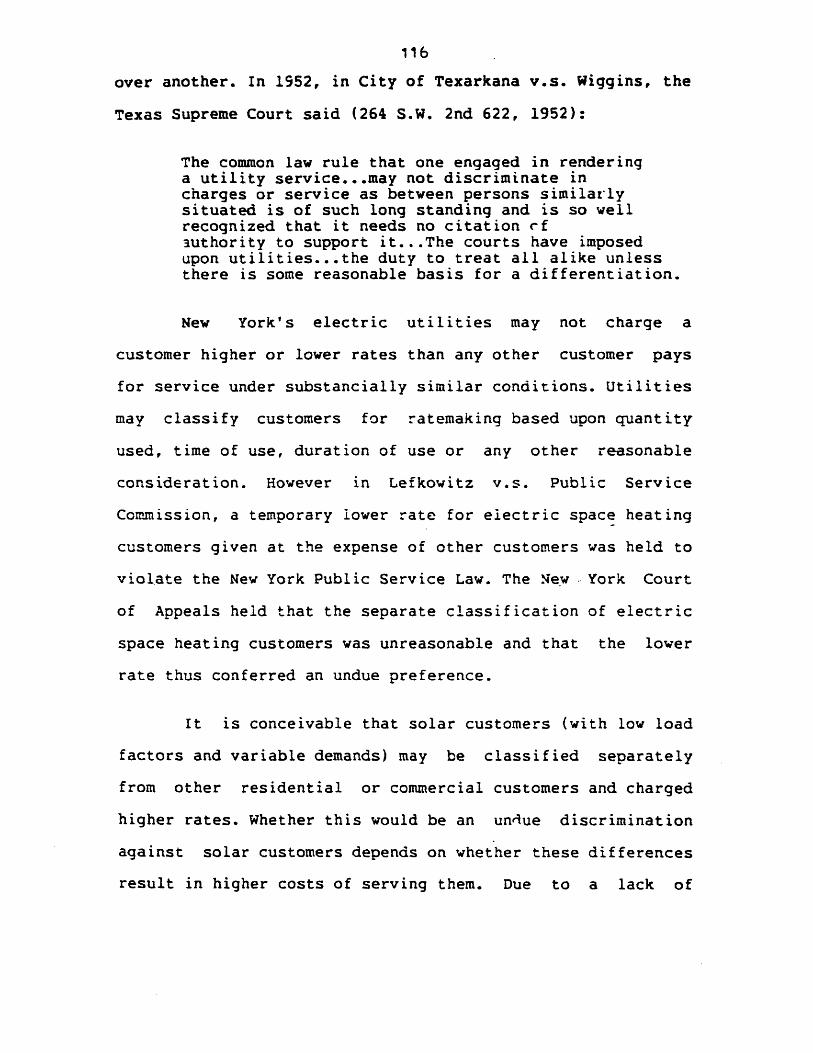
116
over another. In 1952, in City of Texarkana v.s. Wiggins, the
Texas Supreme Court said (264 S.W. 2nd 622, 1952):
The common law rule that one engaged in renderinga utility service...may not discriminate incharges or service as between persons similarlysituated is of such long standing and is so wellrecognized that it needs no citation cfauthority to support it...The courts have imposedupon utilities...the duty to treat all alike unlessthere is some reasonable basis for a differentiation.
New York's electric utilities may not charge a
customer higher or lower rates than any other customer pays
for service under substancially similar conditions. Utilities
may classify customers for ratemaking based upon quantity
used, time of use, duration of use or any other reasonable
consideration. However in Lefkowitz v.s. Public Service
Commission, a temporary lower rate for electric space heating
customers given at the expense of other customers was held to
violate the New York Public Service Law. The New -York Court
of Appeals held that the separate classification of electric
space heating customers was unreasonable and that the lower
rate thus conferred an undue preference.
It is conceivable that solar customers (with low load
factors and variable demands) may be classified separately
from other residential or commercial customers and charged
higher rates. Whether this would be an unaue discrimination
against solar customers depends on whether these differences
result in higher costs of serving them. Due to a lack of
_ _
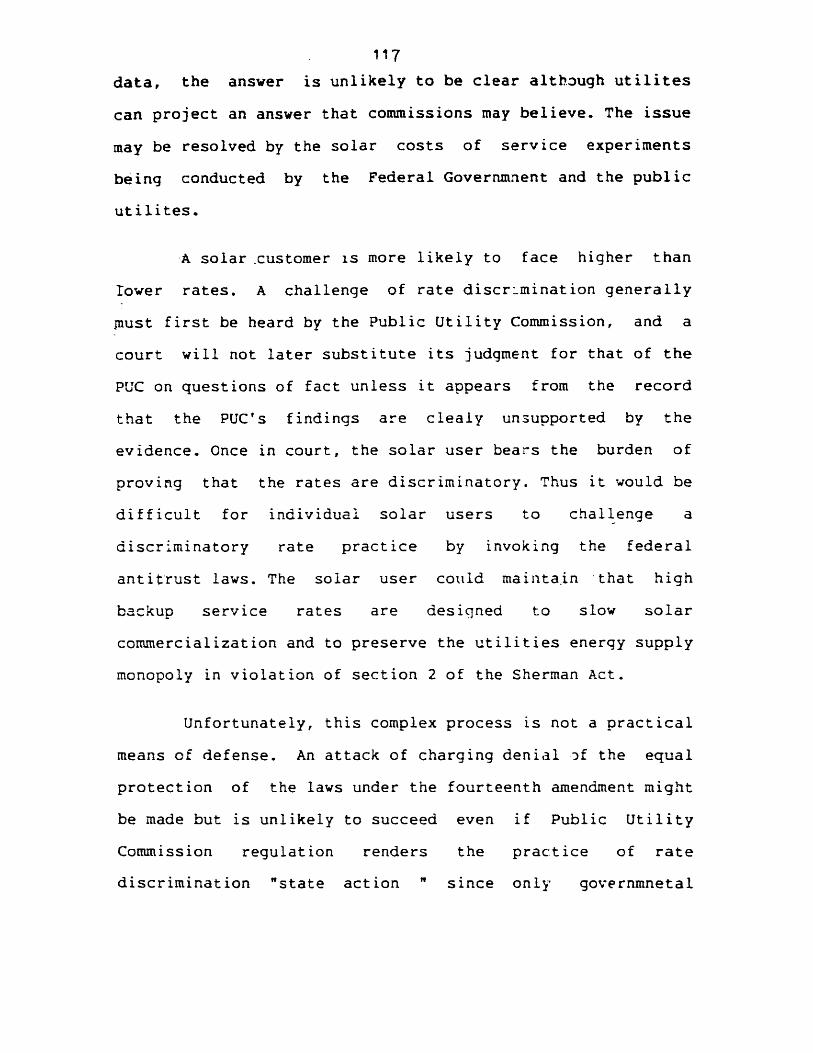
117
data, the answer is unlikely to be clear although utilites
can project an answer that commissions may believe. The issue
may be resolved by the solar costs of service experiments
being conducted by the Federal Governmnent and the public
utilites.
A solar customer is more likely to face higher than
lower rates. A challenge of rate discrumination generally
must first be heard by the Public Utility Commission, and a
court will not later substitute its judgment for that of the
PUC on questions of fact unless it appears from the record
that the PUC's findings are clealy unsupported by the
evidence. Once in court, the solar user bears the burden of
proving that the rates are discriminatory. Thus it would be
difficult for individual solar users to challenge a
discriminatory rate practice by invoking the federal
antitrust laws. The solar user could maintain that high
backup service rates are desiqned to slow solar
commercialization and to preserve the utilities energy supply
monopoly in violation of section 2 of the Sherman Act.
Unfortunately, this complex process is not a practical
means of defense. An attack of charging denial .f the equal
protection of the laws under the fourteenth amendment might
be made but is unlikely to succeed even if Public Utility
Commission regulation renders the practice of rate
discrimination "state action " since only governmnetal
-------- ____ _ I I-~,~~---~.I----· ----- --- - - -- - - ------------~I--~~~~

118
actions or private actions supported by the state are subject
to the fourteenth amendment. Success is unlikely because
there may be rational as was shown in Allied Chemical Corp.
v.s. Georgia Power Co., where the Supreme Court of Georgia
stated (330 Ned 1, 1975):
Because ratemaking is a legislative act, our testunder an equal protection analysis of this economicregulation matter is whether there was a rationalbasis for the differing rate treatment of thecomplaining industrial class vis-a-vis otherclasses, and the rate must be approved unless we findit to be without a rational basis.
5.7.- Electric utility rate making and the National
Energy Act.
Perhaps the most telling argument against utility
involvment in solar commercialization was that hinted by
President Carter during his Sun day address in 1979-'no
cartel controls the s-_n". President Carter obviously meant
that the United States would be less at the mercy of OPEC if
we moved to solar energy, but the implications of this
statement for possible use of utilty monopoly power over
solar energy was not lost by solar advocates. This sentiment,
plus the mandate in the Department of Energy Organization Act
to foster and assure competition in the supply of energy and
fuels has provided a formidable obstacle to utility
involvment in solar energy. Utilities are notoriously poor at
innovation, both in implementing new technologies and in
developing them. Until the advent of the Electric Power
_ ··_ __

119Reasearch Institute, the bulk of research and development and
process innovation in three electric utility industry was
done not by the industry itself, but by its major suppliers
such as General Electric and Westinghouse (Smith, 1978).
In defense of the utilities track record, it should be
recognized that regulatory barriers may hinder the innovation
process in utilities; many regulatory bodies have discouraged
innovation in their rulemaking by refusing to allow R&D to be
counted, either in the rate base or as an operating expense.
Nonetheless, utility involvement with solar technologies has
shown a dramatic increase. A survey of utilities conducted by
EPRI shows that in 1980, there were 236 utilities involved in
solar energy projects: an increase of 31% over the previous
year. Although solar heating and cooling projects still
represent the bulk of the utility solar projects, the survey
reveals that utilities are shifting their emphasis away from
passive to active solar systems. This increase represents the
growing perception among utility managers that active solar
systems can be used to reduce peak generating requirements,
particularly those of residential customers.
5.8.- PURPA.
The Public Utility Regulatory Policies Act of 1978,
one of five statutes that comprise the National Energy Act,
provides for the first time for national standards for public
utility rates and practices settling the controversies
120
presented in the preceding sections.
Title 1, the regulatory policies portion of the act,
is to encourage the conservation of electricity, the
efficient use of resources and facilities by electric
utilities, and equitable utility rates, all by means of rate
reform. Solar users are assured that consideration will be
given to standards potentially beneficial to them. Solar
consumers wishing to advocate a particular standard are
guaranteed a right to intervene in a reoulatory preceeding.
More important, the solar users, as a special interest group,
could qualify for reimbursement of legal expenses of a
regulatory preceeding if the tests are met.
Title 2 will affect service to and rates from electric
producing solar devices. Utilities will have to sell
electricity to nonutility small power producers and
cogeneratcrs and buy excess electricity from them at
reasonable rates, under rules to be set by the Federal Energy
Regulatory Commission. Sell back rates paid by the utility
should not exceed the incremental cost to the utility of
alternative energy; that is the cost at which the utility
would generate the electricity or buy it from another source.
Solar users who produce electricity are assured that
utilities can no longer refuse to purchase excess energy from
them and are assured fair backup and sellback rates.
The act was enacted to encourage the small scale

121
production of electric power using renewable energy sources.
The act attempts to remove the following barriers for small
power producers:
- the possibility that utilities would not buy the
electricity generated by small power producers and pay a
price for it. that would make small power production
profitable;
- the possibility that utilities would charge
discriminatory rates for bacxup power.
To be qualified a small power producer, a facility
must generate less than 80 Mw and be located at the same
site. Fifty percent of the total energy input of the facility
must be through renewable energy and no more than fifty
percent of the equity interest in the facility can be held by
an electric utility.
As a result of PURPA, the utilities are required to
purchase all electric energy made available to them. PURPA
requires that the rates be just and reasonable. The
provisions of PURPA provide incentives that offer a unique
investment opportunity for small power producers because
PURPA guarantees the small power producers a market for the
power they can produce and guarantees a price standard at the
avoided cost to the utility that is very favorable.
Unfortunately as a result of PURPA, the electric

122utilities are motivated to assume a passive role in renevabl
resources development. The utilities are required to purchase
the power generated by solar ponds by others and are not
given the incentive to invest in their own.
5.9.- Utility financial condition.
In approaching a new technology investment like solar
ponds, an electric utility takes a long view approach
consistent with its ability to finance a project over a long
time. This enables the utility to adopt project with long
lead times. To do this with a feeling of confidence requires
a stable economic and financial environmnent and the ability
to project future conditions within reasonable limits.
The utility industry is very risk averse which is
natural for an industry whose investments are being
constantly regulated and for an industry whose performance is
measured more by the reliability of its dividend payments and
the dependability of its service.
Utilities now have little incentive to invest solar
ponds for the following residents:
- the effects of inflation on the cost of operation
and on construction expenditures.
- the supply and high cost of capital.
and other delays affecting
_ __
licensing the

123
construction of new facilities.
We have just seen that solar ponds impose riks that
must be carefully considered in making an investment
decision. One of factors in the future of solar ponds
investment is the financial condition of the electric
utilities. For the last decade the financial condition has
deteriorated.
The rapidly escalating costs of debt, together with
the massive amount of debt sold by the utilities to meet load
growth forecasts; while inflation, regulatory lag, and
politics have combined to hold back rate increases and
earnings growth making utility stocks very unattractive.
In this kind of climate , it is difficult for
utilities to raise capital for any kind of major investment,
let alone technologies like solar ponds considered-risky.

124
CHAPTER 6
CONCLUSION
'he preceding analysis of this thesis topic on utility
investment in solar ponds has shown that the major barrier to
solar ponds is the nigh cost of these facilities coupled
with the uncertain financial regulatory environment of
the electric utility industry. The energy cost of 140 mills/kwh
does not compare favorably with the 50 mills/kwh figure
generally taken as the avoided cust of energy generated
by conventional coal 9and oil burning power plants.
The current policies th
party power producers to inve
exempting electric utilities
disincentive to tne electric
wnen tne industry .s in a state
iat give incentives to :ird
ýst in solar donds, while
, constitute a definite
utility industry especially
of general financial distress.
On the solar ponds themselves, additional research
is needed to obtain better cost estimates to reduce
uncertainty and risk and to improve the feasioilitv and
adaptability at various sites throughout the United States
concentrating on new construction technology to reduce
technical costs and to meet the envirornmental requirements

125
of large 3cale solar ponds.
The framewcrk presented to analyse the cost of mnese
ponds can be adapted to other facilities such as wastewater
reservoirs, storage reservoirs in the oil and gas inaus.ry,
and most land intensive reservoir construction facilities.
'Tche section on site conditions and economies of scale provides
a new approaca in estimating the size, dept•,ana costin.n of
solar ponds and reservoirs. It shows tnat these facilities
are nignly site specific cases where the actuai constructicn
of tnese ponds will nave to be reduced to a Minimur to
minimize the costs.
it seems that at the present time,ut-li y interest
in solar ponds will be limited to agreements where a utility
could operate a small power production facility that it did
not own and still have the facility qualify for the
incentives provided under PURPA.
This is illustrated by the recent agreement between
urmat of Israel and Southern California Edison Co. to build
a 46 1nW solar pond ai Danby Lake. The agreement calls
for SCE to buy the power from the solar pond at tne avoided
cosiu. This agreement results in the first large scale pond
to be built in the US and will be the true testing ground
for large scale solar pond technology.
1 - -
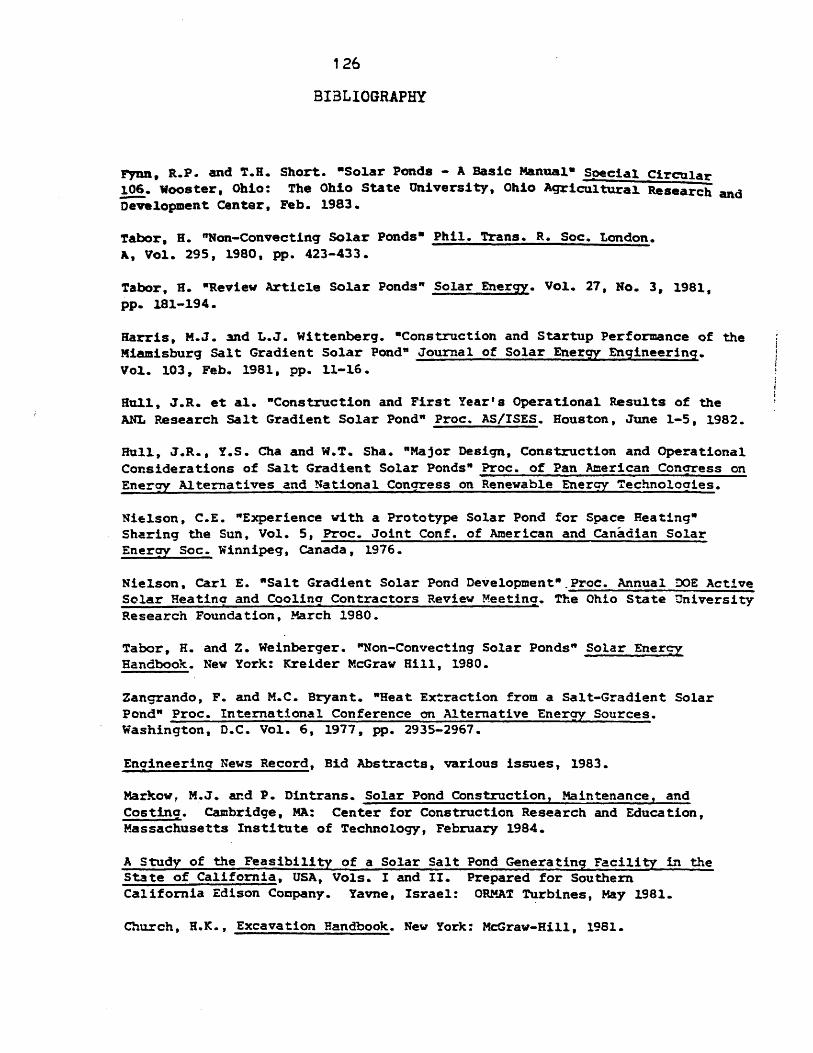
126
BIBLIOGRAPHY
Fynn, R.P. and T.H. Short. "Solar Ponds - A Basic Manual" Soecial Circulari06. Wooster, Ohio: The Ohio State University, Ohio Agricultural Research andDevelopment Center, Feb. 1983.
Tabor, H. "Non-Convecting Solar Ponds" Phil. Trans. R. Soc. London.A, Vol. 295, 1980, pp. 423-433.
Tabor, H. "Review Article Solar Ponds" Solar Energy. Vol. 27, No. 3, 1981,pp. 181-194.
Harris, M.J. and L.J. Wittenberg. "Construction and Startup Performance of theMiamisburg Salt Gradient Solar Pond" Journal of Solar Energy Engineering.Vol. 103, Feb. 1981, pp. 11-16.
Hull, J.R. et al. "Construction and First Year's Operational Results of theANL Research Salt Gradient Solar Pond" Proc. AS/ISES. Houston, June 1-5, 1982.
Hull, J.R., Y.S. Cha and W.T. Sha. "Major Design, Construction and OperationalConsiderations of Salt Gradient Solar Ponds" Proc. of Pan American Conoress onEnergy Alternatives and National Congress on Renewable Energy Technoloagies.
Nielson, C.E. "Experience with a Prototype Solar Pond for Space Heating"Sharing the Sun, Vol. 5, Proc. Joint Conf. of American and Canadian SolarEnergy Soc. Winnipeg, Canada, 1976.
Nielson, Carl E. "Salt Gradient Solar Pond Development".Proc. Annual DOE ActiveSolar Heatina and Cooling Contractors Review Meetina. The Ohio State UniversityResearch Foundation, March 1980.
Tabor, H. and Z. Weinberger. "Non-Convecting Solar Ponds" Solar EnergyHandbook. New York: Kreider McGraw Hill, 1980.
Zangrando, F. and M.C. Bryant. "Heat Extraction from a Salt-Gradient SolarPond" Proc. International Conference on Alternative Eneray Sources.Washington, D.C. Vol. 6, 1977, pp. 2935-2967.
Engineering News Record, Bid Abstracts, various issues, 1983.
Markow, M.J. and P. Dintrans. Solar Pond Construction, Maintenance, andCosting. Cambridge, MA: Center for Construction Research and Education,Massachusetts Institute of Technology, February 1984.
A Study of the Feasibility of a Solar Salt Pond Generating Facility in theState of California, USA, Vols. I and II. Prepared for SouthernCalifornia Edison Company. Yavne, Israel: ORMAT Turbines, May 1981.
Church, H.K., Excavation Handbook. New York: McGraw-Hill, 1981.
I

1L7
Private Communication with Salt Institute, 206 N. Washington Street,Alexandria, VA 22314.
Private Communication, Burke Rubber Company.
Private Communication, Shelter Rite Company.
Jet Propulsion Laboratory. Regional Applicability and Potential of SaltGradient Solar Ponds in the United States, Volume II. Prepared for U.S.Department of Energy. DOE/JPL-1060-50, Vol. 2, March 1982.
California Energy Commission. A Study of the Feasibility of a Solar SaltPond Generating Facility in the State of California, USA. Final Report,Vols. I and II, May 1981.
'cnbright, J, Principles of -ublie "tility -ates, _olu.bieUniversity Press, N:Y, 1961
?ublic Utility Regulatory Policies Act of 197, ?ubliz ~95-617, November 1970.
jean & Miller, utilities at the eawn of a solar age, N...4review, 1977
Anderson , Bruce, The public utility and solar -energyinterface, ~vasn iD•A, jec 1976
Jones, Judicial determination of public utility rates, 3ostonu. Law review o73, 1974
Booz, Allen & Hamilton, The effectiveness of solar enerzyincentives at the state and local level, -iasn D.C. P?- 263371, Aarch 1976
Felman, S, Utility pricing & solar energy design, preparedfor NSF, grant APR 75 lb06
Koger, Regulatory restratnts on solar energy, Public UtilityFort. Jan 19, 1978
Mayo, L, Legal- Institutional implications of solar systems,prepared for the program or policy studies, deorgeWashington University, 1977, NSF
Finch, T, Wind ? Solar at East 11 St. Wind power digest,sum•mer 1977.
I