cost of manufacturing operations around the
TRANSCRIPT
kpmgcom
Manufacturing Institute
Cost of manufacturing operations around the globe
copy 2020 KPMG LLP a Delaware limited liability partnership and a member firm of the KPMG global organization of independent member firms
affiliated with KPMG International Limited a private English company limited by guarantee All rights reserved The KPMG name and logo are
trademarks used under license by the independent member firms of the KPMG global organization NDP08974-1A
Contents
This report is a result of a collaboration between KPMG and The Manufacturing Institute
Executive summary 1
Introduction 3
What are the ldquoCosts of Doing Businessrdquo 5
Developing the index 7
Results 8
Conclusions 15
Appendix A Data sources 17
Appendix B Review of other studies 27
Appendix C Shortlist of comparison countries 29
Appendix D Index methodology 32
Appendix E Real estate data sources in various cities 35
copy 2020 KPMG LLP a Delaware limited liability partnership and a member firm of the KPMG global organization of independent member firms
affiliated with KPMG International Limited a private English company limited by guarantee All rights reserved The KPMG name and logo are
trademarks used under license by the independent member firms of the KPMG global organization NDP08974-1A
GlossaryTerm Definition
Access to internet
Wi-Fi
The percentage of each countrys population that has used the internet within the last three
months
Airport connectivityThe International Air Transportation Authoritys (IATA) airport connectivity indicator which
measures the degree of integration of a country within the global air transport network
Burden of
government
regulation
The burden of government regulation as measured by business executives response to
the question ldquoIn your country how burdensome is it for companies to comply with public
administrationrsquos requirements (eg permits regulations reporting)rdquo
CoDBCost of Doing Business (CoDB) refers to the direct and indirect costs incurred by businesses
engaged in manufacturing operations
Corporate tax ratesStatutory corporate tax rates including federal and provincial tax rates but excluding tax
incentives for certain types of businesses
Corruption
perception index
A measure of experts and business peoples perceptions of corruption in the public sector
including both the frequency and magnitude of corrupt behaviors as well as the strength of
anticorruption measures
Days to start
business
The number of days it takes for a small- to medium-size limited liability company to start up and
formally operate in each economyrsquos largest business city as calculated by the World Bank
Electric power
losses ( of
output)
Measures the percentage of a countrys energy output that is lost in transmission and
distribution
Enforcing contracts
A measure of the time and cost for resolving a commercial dispute through a local first-instance
court and the quality of judicial processes index evaluating whether each economy has adopted
a series of good practices that promote quality and efficiency in the court system
Exposure to unsafe
drinking water The risk-weighted percentage of the population exposed to unsafe drinking water
Hourly
compensation
costs
The average price firms must pay for an hour of an employees labor including hourly pay for
time worked hourly direct benefits and hourly social insurance expenditures and labor-related
taxes
Interest ratesThe monetary policy-related interest rates reported by the IMF for each country Discount rates
were used where monetary-policy interest rates were not available from the IMF
Learning-adjusted
years of schooling
The expected years of schooling for all residents multiplied by the countrys relative scoring on
international tests such as PISA or TIMSS
Liner shipping
connectivity index
A measure of each countryrsquos connectivity to global shipping networks based on five components
of the maritime transport sector the number of ships their container-carrying capacity the
maximum vessel size the number of services and the number of companies that deploy
container ships in a countryrsquos ports
copy 2020 KPMG LLP a Delaware limited liability partnership and a member firm of the KPMG global organization of independent member firms
affiliated with KPMG International Limited a private English company limited by guarantee All rights reserved The KPMG name and logo are
trademarks used under license by the independent member firms of the KPMG global organization NDP08974-1A
Term Definition
Political riskMeasures the likelihood of a risk caused by political and assimilated events connected to cross-
border transactions with a risk horizon beyond one year
Primary costsCosts that directly affect a firms bottom line and can be easily expressed in dollars These cost
factors include expenses such as wages utilities real estate costs and taxes
Protecting minority
investors
A measure of the strength of minority shareholder protections against misuse of corporate
assets by directors for their personal gain as well as shareholder rights governance safeguards
and corporate transparency requirements that reduce the risk of abuse
Railroad qualityThe quality of railroads as measured by business executives response to the question ldquoIn your
country how efficient (ie frequency punctuality speed price) are train transport servicesrdquo
Real estate costs The average monthly rent per square foot for industrial properties in each country
Real value added
per employee
The net output of the manufacturing sector after adding up all outputs and subtracting
intermediate inputs divided by the number of workers employed by the manufacturing sector
(including part-time and self-employed employees)
Registering
property
A measure of the steps time and cost involved in registering a property assuming a
standardized case of an entrepreneur who wants to purchase land and a building that is already
registered and free of title dispute
Reliability of water
supply
The reliability of the water supply as measured by business executives response to the
question ldquoIn your country how reliable is the water supply (lack of interruptions and flow
fluctuations)rdquo
Road quality indexThe quality of roadways as measured by business executives response to the question ldquoIn your
country what is the quality (extensiveness and condition) of road infrastructurerdquo
Secondary costsFactors that impact overhead costs and the firmrsquos ability to operate efficiently The secondary
factors are typically related to the business environment or the ease of doing business
Skill set of
graduates
The skill set of graduates as measured by business executives response to the question ldquoIn
your country to what extent do graduating students from secondary education possess the
skills needed by businessesrdquo and ldquoIn your country to what extent do graduating students from
university possess the skills needed by businessesrdquo
MIThe Manufacturing Institute is the research and education partner of the National Association of
Manufacturers a trade group for manufacturers in the United States
Utility costsThe average price per kilowatt-hour (converted to USD) of electricity paid by all businesses and
households in each country excluding taxes and tariffs
5Cost of manufacturing operations
around the globe
copy 2020 KPMG LLP a Delaware limited liability partnership and a member firm of the KPMG global organization of independent member firms
affiliated with KPMG International Limited a private English company limited by guarantee All rights reserved The KPMG name and logo are
trademarks used under license by the independent member firms of the KPMG global organization NDP08974-1A
The competitiveness of the manufacturing sector in the
United States has been discussed extensively in the press
and economic literature in recent years This joint study
by KPMG and the Manufacturing Institute (MI) provides a
current assessment of how the US compares to its main
trading partners as a location for manufacturing
Specifically this study compares the primary and
secondary factors that impact the cost of operations (Cost
of Doing Business or CoDB) of a business conducting
manufacturing operations in the United States relative to
16 other countries that are leading manufacturing exporters
to the US These 17 economies together account for
about four-fifths of global value added in manufacturing
and thus a comparative analysis across countries provides
insight into how regional economic factors may affect the
global competitive landscape in manufacturing1
Our approach examines different cost factors including
costs that directly impact a firmrsquos bottom line (Primary
Costs) and costs that typically impact a firmrsquos operating
costs and profits more indirectly (Secondary Costs)
Executive summary
Some of our key findings consist of the following
mdash Secondary Cost Index performance is a strong predictor of overall CoDB Index rank For a given country
performing well on the Secondary Cost Index generally correlates with performing well on the CoDB Index rankings
ndash Manufacturers in the US face higher Primary Costs relative to other countries particularly labor costs This is
reflected in a Primary Cost score of 340 a score that is 157 percent higher than the average score of the
other manufacturing locations that are considered in this study and translates to a ranking of 14 out of a total
of 17 on the Primary Cost Index
ndash However strong performance on Secondary Costs for the US such as the quality of labor and superior
business conditions results in the US being ranked fifth on the overall CoDB Index
mdash Labor Quality is a differentiating factor for the US Examining the results from a labor market perspective it is
notable that the USrsquos strength in labor quality allows it to be a strong competitive contender Increasing the importance
(ie 25 to 70 in the Secondary Cost Index) of the quality of labor component improves the US ranking by one from
fifth to fourth place However there is significant competition from European countries in this regard The higher weight
on the quality of labor component also causes Ireland Germany and Switzerland to jump to the top five on the overall
CoDB Index ranking
mdash US tax reform has a material impact on US CoDB Index ranking As part of this analysis we also examined if the
recent US tax reform had a material impact on the relative standing of the United States In particular we compared
how the US would have ranked had we used the pre-reform corporate tax rate of 40 percent (combined federal and
state tax rate) instead of the post-tax-reform corporate rate of 27 percent The impact of the reform on the CoDB Index
ranking for the US is quite significant The ranking of the US on the CoDB Index improved from 11th to 5th
1World Bank Manufacturing Value Added Accessible at httpsdataworldbankorgindicatorNVINDMANFCD
copy 2020 KPMG LLP a Delaware limited liability partnership and a member firm of the KPMG global organization of independent member firms
affiliated with KPMG International Limited a private English company limited by guarantee All rights reserved The KPMG name and logo are
trademarks used under license by the independent member firms of the KPMG global organization NDP08974-1A
We collected data on 23 measures and then quantitatively
evaluated each country based on these measures to develop
an overall CoDB index (CoDB Index) to assess the economyrsquos
competitiveness as a manufacturing hub The components of
the CoDB Index in turn consist of an index of Primary Costs
(Primary Cost Index) that includes factors such as labor costs
real estate costs costs of financing (as measured by interest
rates) and utility costs as well as an index of Secondary Costs
(Secondary Cost Index) made up of 18 measures grouped
into four main areas quality of labor ease of doing business
infrastructure and risk
We note that this study and our conclusions are based
on certain CoDB factors that are commonly considered in
manufacturing facility location decisions and the results provide
a high-level perspective on the attributes of various countries
with respect to these factors However the location decision
is specific to each company and its consideration of additional
factors such as industry type of product supply chain access
to consumer markets and the companyrsquos overall business
strategy It is therefore important to recognize that an individual
location decision of a company may involve more factors and
considerations than we have evaluated in this analysis
Finally we note that while we have used the most recently
available data on the cost factors such data is available only
with a lag As such the rankings are based on the best historical
information available and as a consequence the impact of
recent trade disputes or the market disruptions from COVID-19
are not reflected in the results
254
263
265
267
269
269
274
277
277
283
284
300
326
333
346
349
420
Canada
Taiwan
South Korea
Malaysia
United States
United Kingdom
Germany
Switzerland
Ireland
France
China
Italy
Japan
Mexico
Vietnam
India
Brazil
CoDB Index Score by Country (1=best5=worst)
Source Cost of Manufacturing Operations Around the Globe KPMG LLP 2020
Cost of manufacturing operations
around the globe2
Where to locate a production facility is an important
strategic decision for a manufacturing company The
location decision can have a long-term impact on
performance The selection of a particular site (or country)
requires more than just an assessment of labor costs It
requires the consideration of multiple factors including
the cost of setting up the facility real estate costs energy
costs the quality of the labor force and infrastructure
the regulatory environment and intellectual property
protections
In 2011 MI published a cost of doing business study
(the MI Report)2 The MI Report compared the cost of
production in the United States and nine major trading
partners Canada China France Germany Japan South
Korea Mexico Taiwan and the United Kingdom The study
examined the ldquorawrdquo cost of production based on wage
costs relative to value added in manufacturing and a variety
of other ldquostructuralrdquo costs of doing business in each
country including corporate tax rates employee benefits
tort litigation regulatory compliance and energy The study
noted that unlike in previous years manufacturers in the
US faced lower ldquoraw costsrdquo (ie wage compensation
relative to total valued added in manufacturing) than its
trading partners Specifically raw costs faced by US
manufacturers were about 9 percent lower than the
trade-weighted average of its nine largest trading partners
However the study noted that this advantage was entirely
offset by the higher structural costs (ie corporate tax
rates employee benefit costs tort litigation regulatory
compliance and energy) with US manufacturing costs
(on a trade-weighted basis) being about 9 percent higher
than that of its nine largest trading partners
This study seeks to update the MI Report by
mdash Including more recent data
mdash Considering additional indicators of the cost of doing
business
mdash Expanding the comparison to seven additional
countries Brazil Ireland Italy India Malaysia
Switzerland and Vietnam
Introduction
2 The Manufacturing Institute and the Manufacturers Alliance for
Productivity and Innovation 2011 Report on the Structural Cost of
US Manufacturing 2011copy 2020 KPMG LLP a Delaware limited liability partnership and a member firm of the KPMG
global organization of independent member firms affiliated with KPMG International Limited a
private English company limited by guarantee All rights reserved The KPMG name and logo are
trademarks used under license by the independent member firms of the KPMG global organization
NDP08974-1A
copy 2020 KPMG LLP a Delaware limited liability partnership and the US member firm of the KPMG network of independent
member firms affiliated with KPMG International Cooperative (ldquoKPMG Internationalrdquo) a Swiss entity All rights reserved
The KPMG name and logo are registered trademarks or trademarks of KPMG International NDP089741-1A
Cost of manufacturing operations
around the globe
copy 2020 KPMG LLP a Delaware limited liability partnership and a member firm of the KPMG global organization of independent member firms
affiliated with KPMG International Limited a private English company limited by guarantee All rights reserved The KPMG name and logo are
trademarks used under license by the independent member firms of the KPMG global organization NDP08974-1A4
copy 2020 KPMG LLP a Delaware limited liability partnership and a member firm of the KPMG global organization of independent member firms
affiliated with KPMG International Limited a private English company limited by guarantee All rights reserved The KPMG name and logo are
trademarks used under license by the independent member firms of the KPMG global organization NDP08974-1A
What are the ldquoCosts of Doing Businessrdquo
Companies consider a variety of CoDB factors when
evaluating their international manufacturing location
decisions Our study considers the factors evaluated
by companies at the country level and seeks to
incorporate these into country-level rankings A countryrsquos
competitiveness is often judged by the cost of labor
and an often cited motivation for moving manufacturing
offshore (relative to higher-cost countries like the US) is
the desire to gain access to low labor costs and to lower
the cost of production Studies however have indicated
that a range of other factors go into the location selection
decision3 The leading factors identified in the literature
that contribute to the location decision are
1 Availability of skilled labor
2 Cost and productivity of labor
3 Availability of and proximity to transportation
infrastructure
4 Tax rates
5 Regulatory environment
6 Real estate costs
7 Availability and cost of power communications water
and other utilities
8 Access to and cost of capital
9 Transparency in government and business practices
and ease of doing business
10 Politically and economically stable environment with
ability to enforce legal and property rights
We compiled data on each of these factors directly or
through proxy measures over the 2012 to 2019 time
period for the 17 countries (see Appendix A for details)
The selection of specific categories of costs to compare
were guided by the surveys and studies we reviewed (see
Appendix A for details) We note here that data for every
cost element was not available for every country or not
available for a recent time period Thus the cost types
analyzed are those that could be obtained from public
sources spanning 2012ndash2019 but we use only the most
recent data in our analysis where available
Given the large number of indicators being considered
we categorized these decision factors into two groups
mdash Primary Costs ndash Those that can be measured in cost
terms (dollars or percentage in the case of cost of
capital and tax rates) These cost factors are more
readily assessed and include expenses such as wages
utilities real estate costs and taxes
mdash Secondary Costs ndash Factors that impact overhead
costs and the facilityrsquos ability to operate efficiently
The secondary factors are typically related to the
business environment or the ease of doing business
For instance it takes into consideration the level of
transparency in business and government processes
legal protection of property rights and regulatory
burden
For Primary Cost factors the specific measures we
included are
mdash Labor costs ndash Hourly labor rates (including benefits)
mdash Utility costs ndash Energy costs
mdash Real estate costs ndash Lease costs for industriallogistics
locations
mdash Cost of capital ndash Borrowing interest rates
mdash Corporate tax rates
For Secondary Cost factors tied to the business
environment and infrastructure we considered a range
of indicators reflecting the quality of labor ease of doing
business infrastructure and risk and protections Table 1
on the following page summarizes the measures and cost
types considered
a BL MacCarthy and W Atthirawong ldquoFactors affecting location decisions in international operations ndash a Delphi studyrdquo International Journal of
Operations amp Production Management 2003
b C Manning M Rodriguez and Chinmoy Ghosh ldquoDevising a Corporate Facility Location Strategy to Maximize Shareholder Wealthrdquo Journal of
Real Estate Research 1999
c F Karakaya and C Canel Underlying dimensions of Business Location Decisions Industrial Management amp Data Systems 1998
d S Turhan BC Ozbag and B Cetin ldquoFactors Affecting Location Decisions of Food Processing Plants Journal of Applied Sciences 2007
e M Plaziak and AI Symanska Role of Modern Factors in the Process of Choosing a Location of the Enterprise
3 For a discussion of these factors see for example
copy 2020 KPMG LLP a Delaware limited liability partnership and a member firm of the KPMG global organization of independent member firms
affiliated with KPMG International Limited a private English company limited by guarantee All rights reserved The KPMG name and logo are
trademarks used under license by the independent member firms of the KPMG global organization NDP08974-1A
Measure Cost type Subcategory
1 Hourly compensation costs Primary -
2 Real estate costs Primary -
3 Utility costs Primary -
4 Corporate tax rates Primary -
5 Interest rates Primary -
6 Learning-adjusted years of schooling Secondary Quality of labor
7 Skill set of graduates Secondary Quality of labor
8 Real value added per employee Secondary Quality of labor
9 Days to start business Secondary Ease of doing business
10 Burden of government regulation Secondary Ease of doing business
11 Registering property Secondary Ease of doing business
12 Road quality index Secondary Infrastructure
13 Railroad quality Secondary Infrastructure
14 Airport connectivity Secondary Infrastructure
15 Liner shipping connectivity index Secondary Infrastructure
16 Electric power losses ( of output) Secondary Infrastructure
17 Exposure to unsafe drinking water Secondary Infrastructure
18 Reliability of water supply Secondary Infrastructure
19 Access to internetWi-Fi Secondary Infrastructure
20 Political risk Secondary Risk and protections
21 Enforcing contracts Secondary Risk and protections
22 Protecting minority investors Secondary Risk and protections
23 Corruption perception index Secondary Risk and protections
Based on these indicators we first developed separate indices one for the Primary Costs and another for
Secondary Costs and then combined the two to produce the CoDB Index an overall competitiveness index
We adopted this approach to produce one common index by which to rank the countries with respect to
CoDB while retaining the ability to explore how the Primary and Secondary Costs influenced the overall rank
Appendix A provides details on the sources from which the data on these measures were gathered
Table 1 Primary and secondary measures by subcategory
6Cost of manufacturing operations
around the globe
copy 2020 KPMG LLP a Delaware limited liability partnership and a member firm of the KPMG global organization of independent member firms
affiliated with KPMG International Limited a private English company limited by guarantee All rights reserved The KPMG name and logo are
trademarks used under license by the independent member firms of the KPMG global organization NDP08974-1A
Developing the indexSince we are evaluating 23 factorsmdashsome that impact a
manufacturing company operations in a country directly and
others more indirectlymdashit is challenging to draw cross-country
inferences by evaluating each separate CoDB factor Instead
we created a composite index that would jointly reflect the
information provided by the various individual measures We
recognize that such an index will subsume a significant range
of information across all the identified measures To provide
transparency and to allow further exploration to identify the
set of factors driving a countryrsquos index level (and rank) we
developed two indicesmdashone for the Primary Cost factors and
another for the Secondary Cost factors Subsequently we
combined them to generate an overall index (CoDB Index)
to benchmark country performance This allowed us to
analyze the relative importance of each set of factors to each
countryrsquos overall index score
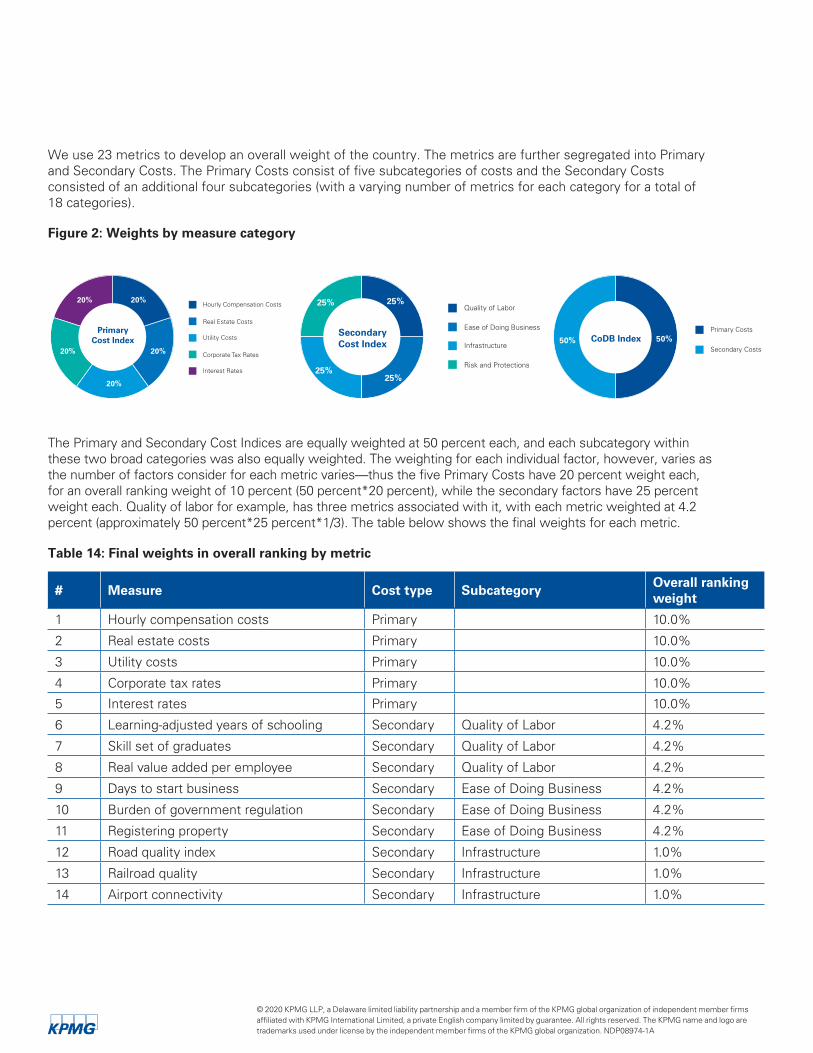
As with any index the weighting placed on each component
is a key consideration Most studies that examine CoDB
factors tend to weight the key factors equally4 It did
not appear that one or some of the five Secondary Cost
categories we consideredmdashquality of labor ease of doing
business infrastructure and riskmdashstood out in importance
relative to the others Accordingly the assumption of equal
weighting appeared to be reasonable for all factors (see
Appendix D for a specific breakdown of the weights)
With respect to the Primary Cost factors namely labor utility
real estate costs interest rates and tax rates we evaluated
the need to place higher weight on labor given its perceived
importance as a factor in location decisions Specifically
we reviewed data on the contribution of labor costs to
manufacturing Analysis performed by Morgan Stanley
on the contribution to total costs of various components
indicates that for the manufacturing sector labor costs
account for approximately 16 percent of total manufacturing
costs in the US (and as high as 30 percent of total costs for
certain sectors such as electronics and apparel and as low
as 6ndash7 percent for sectors such as motor vehicles where
capital costs are much more significant)5 The 16 percent
weight indicated by this analysis is similar in magnitude to
the 20 percent weight that we use for labor under an equal
weighting approach In the absence of any clear indication
that pointed to an alternate weighting choice we assigned
equal weighting to the five primary factors6
4 For example the Brookings Institutionrsquos report Global manufacturing scorecard How the US compares to 18 other nations accessible at
httpswwwbrookingseduresearchglobal-manufacturing-scorecard-how-the-us-compares-to-18-other-nations
5 Morgan Stanley Analyst Report as cited in ldquoThe Cost Of Manufacturing StuffrdquoBusiness Insider May 2013
6 We recognize that there are alternate index weighting choices that could be adopted and that an alternate set of weights would likely yield
a different ranking on the overall index To allow the interested reader to alter the weights to reflect their facts and circumstances and
to explore sensitivity of results to these changes we have developed a Tableau visualization tool in conjunction with this study This tool
provides the ability to emphasize or deemphasize various cost factors and to visualize the impact of the changes on the CoDB Index rank
In summary we utilized the following weights presented when calculating index values for each country
Index weights
20
20
20
20
20
PrimaryCost Index
Hourly Compensation Costs
Real Estate Costs
Utility Costs
Corporate Tax Rates
Interest Rates
SecondaryCost Index
Quality of Labor
Ease of Doing Business
Infrastructure
Risk and Protections
25
2525
25
Primary Costs
Secondary Costs
CoDB Index 5050
copy 2020 KPMG LLP a Delaware limited liability partnership and a member firm of the KPMG global organization of independent member firms
affiliated with KPMG International Limited a private English company limited by guarantee All rights reserved The KPMG name and logo are
trademarks used under license by the independent member firms of the KPMG global organization NDP08974-1A
Table 3 Country ranking ndash CoDB Index
Source Cost of Manufacturing Operations Around the Globe KPMG LLP 2020
The application of the indexing methodology resulted in a ranking of countries as summarized
in Table 3 (based on score from 1ndash5 with 1 being the best and 5 being the worst)
Canada Taiwan and South Korea ranked as the top three countries on the CoDB Index
which equally weights Primary Costs factors and Secondary Cost factors The United
States ranked fifth among the 17 countries The country with the lowest rank was Brazil
with Japan Mexico Vietnam and India ranking just above
To understand the overall CoDB rankings based on the Primary Cost Index and the
Secondary Cost Index Table 4 (Primary Costs) and Table 5 (Secondary Costs) summarize
the rankings across the two subcategories of factors For Primary Costs unsurprisingly
for the most part Malaysia China Mexico and Vietnam are all tied for top position (ie
most competitive)
Results
Countries Ranking CoDB Index Score by Country (1=best 5=worst)
Canada 1 254
Taiwan 2 263
South Korea 3 265
Malaysia 4 267
United States 5 269
United Kingdom 6 269
Germany 7 274
Switzerland 8 277
Ireland 9 277
France 10 283
China 11 284
Italy 12 300
Japan 13 326
Mexico 14 333
Vietnam 15 346
India 16 349
Brazil 17 420
8Cost of manufacturing operations
around the globe
copy 2020 KPMG LLP a Delaware limited liability partnership and a member firm of the KPMG global organization of independent member firms
affiliated with KPMG International Limited a private English company limited by guarantee All rights reserved The KPMG name and logo are
trademarks used under license by the independent member firms of the KPMG global organization NDP08974-1A
From a review of the Primary and the Secondary Cost Indices it becomes apparent there are
different reasons why countries rank where they do on the CoDB Index Consider the case of
Canada which scored highest on the CoDB Index The primary driver of this rank is the fact that
Canada scored very highly on the Secondary Cost Index while maintaining a middle rank on the
Primary Cost Index The United Statesrsquo overall 5th place ranking is primarily driven by its score
on the Secondary Cost Index since it ranks 14th on the Primary Cost Index
Table 4 Country ranking ndash Primary Cost Index
Source Cost of Manufacturing Operations Around the Globe KPMG LLP 2020
Countries Ranking CoDB Primary Score Index by Country (1=best 5=worst)
Malaysia 1 240
China 1 240
Mexico 1 240
Vietnam 1 240
India 5 260
Canada 6 280
Taiwan 6 280
Italy 6 280
South Korea 9 300
Ireland 9 300
France 9 300
Germany 12 320
United Kingdom 13 320
United States 14 340
Switzerland 14 340
Brazil 16 360
Japan 17 400
copy 2020 KPMG LLP a Delaware limited liability partnership and a member firm of the KPMG global organization of independent member firms
affiliated with KPMG International Limited a private English company limited by guarantee All rights reserved The KPMG name and logo are
trademarks used under license by the independent member firms of the KPMG global organization NDP08974-1A
Table 5 Country ranking ndash Secondary Cost Index
Source Cost of Manufacturing Operations Around the Globe KPMG LLP 2020
In contrast the ranks of Malaysia and Taiwan on the CoDB
Index result from high scores on the Primary Cost Index
For instance Taiwan ranks second on the CoDB Index
despite a ranking of seventh on the Secondary Cost Index
Interestingly Chinarsquos middling score of 11 on the CoDB
Index despite being part of a four-way tie for first on the
primary factors is caused by its poor performance (rank of
13th) on the Secondary Cost Index Chinarsquos low score on
Secondary Cost Index arises primarily from higher operating
risks Overall it appears that countries that do well on
primary factors do less well on the secondary factors and
vice versa The clear exception appears to be Brazil which
ranks poorly on both indices
Primary Costs are clearly important to location decisions
To examine how the overall CoDB ranking may change
under an alternate set of weights we recomputed the
results placing a a greater consideration on Primary Costs
That is we re-ran our analysis changing the weight of
the Primary Costs and Secondary Costs from equal or 50
percentndash50 percent weighting to 70 percentndash30 percent
in favor of Primary Costs As presented in Table 6 not
surprisingly this caused Chinarsquos ranking on the CoDB Index
to move up significantly from 11th to 3rd and the US
ranking to decline from 5th to 12th However Canada
Malaysia and South Korea retained their top-five CoDB
rankings despite this change
Countries Ranking CoDB Secondary Index Score by Country (1=best 5=worst)
United States 1 197
Switzerland 2 213
United Kingdom 3 219
Canada 4 227
Germany 5 228
South Korea 6 229
Taiwan 7 247
Japan 8 252
Ireland 9 254
France 10 265
Malaysia 11 293
Italy 12 321
China 13 328
Mexico 14 426
India 15 438
Vietnam 16 451
Brazil 17 481
10Cost of manufacturing operations
around the globe
copy 2020 KPMG LLP a Delaware limited liability partnership and a member firm of the KPMG global organization of independent member firms
affiliated with KPMG International Limited a private English company limited by guarantee All rights reserved The KPMG name and logo are
trademarks used under license by the independent member firms of the KPMG global organization NDP08974-1A
Table 7 US ranking with higher weight on labor quality
Source Cost of Manufacturing Operations Around the Globe
KPMG LLP 2020
CountriesOverall ranking
Primary Cost
ranking
Secondary Cost
ranking
Ireland 1 9 2
Canada 2 6 5
Germany 3 12 4
United States 4 14 1
Switzerland 5 14 3
South Korea 6 9 6
7 We increase the weight on quality of labor to 70 percent in the Secondary Cost Index and equally weight the other
three measures at 10 percent each
8 The US tax rates used here are after tax reform
Understanding the results
Primary Cost Index
Table 8 Selected country Primary Cost percentile rankings (sorted by Primary Cost Index)
Source Cost of Manufacturing Operations Around the Globe KPMG
LLP 2020
To understand these results better we further examined the
constituents of the Primary and Secondary Cost Indices
To further understand the drivers of our findings we
examined which factors cause East Asian countries such as
Vietnam Taiwan and Malaysia to rank highly on the Primary
Cost Index and the US to rank 14 Table 8 to follow presents
constituent ranks for countries that rank highly on the Primary
Cost IndexmdashVietnam Taiwan Malaysia India China and
Mexicomdashand for the United States Note that the table
shows percentile ranks that is to say a percentile rank of 5
represents top 15 percentile of costs The percentile ranking
of 1 indicates the best performing in the category and the
percentile ranking of 5 indicates the worst performing in the
category (see Appendix D for additional details) As Table
8 indicates the differences are most stark with respect to
hourly compensation costs between US and other countries
CountryHourly
compensation costs
Real estate costs
Utility costs
Corporate tax rates
Interest rates
Malaysia 2 1 3 2 4
China 2 2 1 3 4
Mexico 1 1 1 4 5
Vietnam 1 4 1 2 4
India 1 1 2 4 5
Taiwan 3 4 2 2 3
United States
5 3 3 3 3
In terms of real estate costs and cost of capital the
United States is relatively competitive compared to the
Southeast Asian nations Among these countries only
India Malaysia and China had lower average costs for
industrial property than the US while only Taiwan had
a lower interest rate The US compares less favorably
to the Southeast Asian nations on the measures of utility
costs and corporate tax rates8 The US is tied with
Malaysia for the highest electricity costs among these
countries significantly higher than the average rate paid
by Chinese electricity users In terms of corporate tax
rates among this group only India and Mexico have higher
statutory tax rates at 30 percent compared to 27 percent
for the US
From a labor market perspective the quality of labor
available in the US is a strong asset However increasing
the weight of the quality of labor measure reveals that
there is also significant competition from European
countries and Canada in this regard For example as
presented in Table 7 increasing the weight on the
quality of labor to 70 percent from 25 percent within
the Secondary Cost Index (but maintaining equal weight
between Primary and Secondary Costs) causes Ireland
Germany and Switzerland to rise to the top five most
competitive countries with the US and Canada rising and
falling by one rank respectively7
Table 6 Country ranking with higher weight on Primary Costs
Source Cost of Manufacturing Operations Around the Globe
KPMG LLP 2020
CountriesCoDB Index
ranking
Primary Cost Index
ranking
Secondary Cost Index
ranking
Malaysia 1 1 11
Canada 2 6 4
China 3 1 13
Taiwan 4 6 7
South Korea 5 9 6
Ireland 6 9 9
copy 2020 KPMG LLP a Delaware limited liability partnership and a member firm of the KPMG global organization of independent member firms
affiliated with KPMG International Limited a private English company limited by guarantee All rights reserved The KPMG name and logo are
trademarks used under license by the independent member firms of the KPMG global organization NDP08974-1A
Table 9 Industrialized country Primary Cost percentile rankings (sorted by Primary Cost Index)
Source Cost of Manufacturing Operations Around the Globe
KPMG LLP 2020
CountryHourly
compensation costs
Real estate costs
Utility costs
Corporate tax rates
Interest rates
Canada 3 3 2 3 3
South
Korea3 3 3 3 3
United
Kingdom3 5 4 1 3
United States
5 3 3 3 3
Japan 3 5 5 5 2
The impact of tax reform
As part of this analysis we also examined if tax reform
had a material impact on the relative standing of the
US In particular we examined how the US would
have ranked had we used the pre-tax-reform corporate
tax rate of 40 percent (combined federal and state
average) instead of the post-tax-reform combined rate
of 27 percent
It is worth noting here that our analysis of the tax
input is limited to the statutory corporate rate only
We recognize that many other factors contribute to the
overall tax burden in any given jurisdiction ndash including
but not limited to the methodology of cost recovery
deductibility of debt service and the taxation of cross
border flows of income Those other factors which vary
from jurisdiction to jurisdiction were outside the scope
of this report Still we believe that use of the statutory
rate alone provides valid directional information even if
not necessarily the entire picture
As presented in Table 10 the tax reform improved the
USrsquos ranking not only on the corporate tax measure
but also on the Primary Cost Index and the CoDB Index
With tax reform the US was considered a median tax
country Had the US corporate tax rate continued to be
40 percent it would have one of the highest corporate
tax rates in the comparison group of countries The tax
reform resulted in the US ranking on the Primary Cost
Index to improve two notches from being 16th to 14th
out of the 17 countries The impact on the CoDB Index
score is even more significant with the US ranking
increasing from 11th place (considering pre-reform tax
rates) to 5th (after tax reform)
Ranking of the industrialized countries
Table 9 provides a comparison to some of the industrialized
countries relative to the US The table shows percentile
ranks that is to say a percentile rank of 5 represents
the top 15th percentile of costs (worst performing
from competitiveness standpoint) while a percentile
rank of 1 slots into the best performing in the category
(see Appendix D for additional details) We note that
even compared to the industrialized countries US
labor costs are high Hourly rates in Canada United
Kingdom and Japan range between $23 per hour and
$30 per hour compared to $39 per hour in the US With
respect to corporate tax rates where tax reform lowered
rates significantly the US rates are lower than Japan
comparable to Canada but still higher than that imposed
by the United Kingdom
12Cost of manufacturing operations
around the globe
copy 2020 KPMG LLP a Delaware limited liability partnership and a member firm of the KPMG global organization of independent member firms
affiliated with KPMG International Limited a private English company limited by guarantee All rights reserved The KPMG name and logo are
trademarks used under license by the independent member firms of the KPMG global organization NDP08974-1A
Secondary Cost Index
With respect to Secondary Cost factors the US clearly is in a strong position As Table 11 below
indicates (the countries sorted by their respective rank on the Secondary Cost Index) the US
scores are among the top three on almost all of the metrics including quality of labor transport
infrastructure and ease of doing business The scores below represent weighted averages of
percentile ranks for each measure considered under the category A score of one (1) is best while
five (5) is worst (see Appendix D for additional details)
Source Cost of Manufacturing Operations Around the Globe KPMG LLP 2020
Table 11 Secondary Index Cost factor scores (sorted by Secondary Cost Index)
CountriesQuality of labor score
Ease of doing business score
Infrastructure score10
Infrastructure ndash Transport score
Infrastructure ndash Utility score
Risk and protections score
United States 167 200 222 200 267 200
Switzerland 167 167 244 300 233 275
United Kingdom 267 233 225 275 300 150
Canada 233 233 242 325 300 200
Germany 167 267 228 250 233 250
South Korea 233 333 150 150 200 200
Taiwan 300 233 278 300 233 175
Japan 233 300 225 175 200 250
Ireland 133 300 358 475 300 225
France 267 300 269 275 233 225
Malaysia 333 233 306 250 367 300
Italy 333 300 350 350 300 300
China 367 233 364 225 367 350
Mexico 433 400 444 400 433 425
India 500 433 442 325 500 375
Vietnam 467 433 431 425 467 475
Brazil 500 500 447 475 467 475
9 Infrastructure score is a combined score across transportation utility and internet Details are shown for transportation and utility
subcomponents while internet access is not shown in the table but is included the combined score Each of these three factors
(transport utility and internet) get an equal weight
CountriesCurrent CoDB index rank
Pre-tax-reform CoDB index rank
Change in rankings due to US tax reform
Canada 1 1 0
Taiwan 2 2 0
South Korea 3 4 +1
Malaysia 4 5 +1
United States 5 11 +6
United Kingdom 6 6 0
Source Cost of Manufacturing Operations Around the Globe KPMG LLP 2020
Table 10 Impact of the US tax reform
copy 2020 KPMG LLP a Delaware limited liability partnership and a member firm of the KPMG global organization of independent member firms
affiliated with KPMG International Limited a private English company limited by guarantee All rights reserved The KPMG name and logo are
trademarks used under license by the independent member firms of the KPMG global organization NDP08974-1A
Source Cost of Manufacturing Operations Around the Globe
KPMG LLP 2020
Table 12 Percentile ranks for cost and quality of labor
On all of the secondary factors considered including quality
of labor the United States ranks significantly better than
countries that offer lower labor costs such as Vietnam
China Mexico and India To put it differently the low ranking
of these countries on the Secondary Cost Index reflects
the weaker investment climatemdashfor example the poorer
connectivity from limited road rail and airline networks more
challenging business operating environments and lower
levels of transparency in government operation and reduced
legal protections available to businesses
The industrialized countries generally rank favorably and
similarly across secondary metrics falling for the most part
in the top half of the countries Among them however
the US clearly ranks better with respect to at least two
factors the quality of labor and ease of doing business
Thus relative to the other 16 countries considered the
US ranks best on the Secondary Cost components
Labor ndash Cost and quality
As noted earlier compensation cost is often the most cited
factor for locating manufacturing facilities in Asian countries
such as China Taiwan or Vietnam As the data confirm these
countries do offer among the lowest hourly compensation
costs for labor Further the hourly compensation costs in the
US are among the highest in the world
As Table 12 shows a different picture emerges when
productivity attributes are considered in addition to the
quality of labor For example countries with the most
favorable cost attributes are not always the ones with the
highest real value added per employee In fact Table 12
suggests a high degree of positive correlation between
costs and productivity
Thus it would appear that for manufacturing activities that
are more routine in nature and require less advanced skills
where the loss of productivity may be outweighed by lower
costs companies may consider locating their manufacturing
facilities in lower costs countries such as China Vietnam
or Taiwan however in higher-value-added manufacturing
where the process is more complex or automated and
requires highly skilled labor to manage the United States
may be considered more favorably as a location
CountriesHourly
compensation costs
RVA per employee
Vietnam 1 5
India 1 5
Mexico 1 4
China 2 4
Malaysia 2 4
Brazil 2 5
Taiwan 3 3
South Korea 3 3
Japan 3 3
United Kingdom 3 2
Canada 3 3
Italy 4 3
Ireland 4 1
France 4 2
United States 5 1
Germany 5 2
Switzerland 5 1
14Cost of manufacturing operations
around the globe
copy 2020 KPMG LLP a Delaware limited liability partnership and a member firm of the KPMG global organization of independent member firms
affiliated with KPMG International Limited a private English company limited by guarantee All rights reserved The KPMG name and logo are
trademarks used under license by the independent member firms of the KPMG global organization NDP08974-1A
ConclusionsOur results indicate that countries that placed better on
the Secondary Cost Index generally performed better on
the overall rankings Of the top five most competitive
economies on the overall rankings only twomdashMalaysia and
Taiwanmdashhave a better primary than secondary cost score
In keeping with this trend of lower Secondary Cost
countries scoring better on the CoDB Index the United
States placed fifth on the CoDB Index despite being tied
with Switzerland for 14th on the Primary Cost Index This
high Primary Cost Index ranking was primarily due to high
labor costs The United States was able to compensate
somewhat for these unfavorable scores on the Primary
Cost Index by placing first in the Secondary Cost Index
As part of this analysis we also examined if tax reform had
a material impact on the relative standing of the US In
particular we compared how the US ranks now (post-tax-
reform combined federal and local tax rate of 27 percent)
relative to the pre-reform with a corporate tax rate of 40
percent (combined federal and state average) The impact
on the USrsquos CoDB Index ranking is quite significant After
tax reform the USrsquos competitiveness increasedmdashas
evidenced by its current rank of 5mdashcompared with its
previous rank of 11 under pre-reform tax rates
A closer look at the countries that outperformed the US
on the CoDB Index ranking indicates some interesting
factors For example the US outperformed all of the
countries on the Secondary Cost Index due to better labor
productivity and business conditions This implies that the
outperformance on the CoDB Index by Canada Taiwan
South Korea and Malaysia are all driven by Primary Cost
factors Specifically Canadarsquos rank is driven primarily by
its ability to offer lower compensation costs and slightly
lower electricity rates while still maintaining Secondary
Cost Index rankings that were not far behind the US
South Korea ranked third by offsetting weaker ranking on
the Secondary Cost Index with even lower compensation
costs A sharper version of the tradeoff between Primary
and Secondary Cost explains the rankings of Taiwan and
Malaysia with Taiwan offering higher primary costs but
lower secondary costs
This study has focused on certain CoDB factors that are
commonly considered in manufacturing facility location
decisionsmdashat the country levelmdashand the results provide a
high-level perspective on the attributes of various countries
with respect to these factors However the location
decision is specific to each company and its consideration
of the supply chain and access to markets The decision
may be impacted by the type of industry the company is
active in the type of product where customers are and
the companyrsquos overall business strategy Thus individual
location decisions are significantly more complex than we
can address in an analysis such as this
For instance for heavy equipment manufacturing from a
transportation point of view it may be better to locate the
facility closer to suppliers and the market whereas from a
production standpoint it may be more desirable to locate
the facility closer to where the desired type of workforce
or raw materials might be available Alternatively for a
specialized precision products manufacturing operation
the firmrsquos decision may be heavily impacted by the
availability of labor with advanced manufacturing skills In
other instances tax and operating incentives offered by a
country may be significant enough to outweigh weakness
on other dimensions As such the location decision is
often guided by unique factors that may go well beyond
those we have considered
Additionally even within the factors we have considered
the relative importance of these factors to a specific firm
may be different than the weights we have considered
Furthermore it may well be the case that the factors we
classify for the purpose of convenience as secondary
are in fact primary factors for consideration in a location
decision for an individual firm or manufacturing sector
Finally a number of local factors that go into firm location
decisions may or may not be captured in the country-
level analysis For example labor and rent costs are
higher in urban areas relative to more distant suburban
or rural areas Recognizing this we have developed a
Tableau analytic and visualization tool in conjunction with
this study that allows the interested reader to alter the
weights and to reassess the score based on the relative
importance of these factors to them Click here for the
Cost of Manufacturing Operations Tool We also note for
copy 2020 KPMG LLP a Delaware limited liability partnership and the US member firm of the KPMG network of independent
member firms affiliated with KPMG International Cooperative (ldquoKPMG Internationalrdquo) a Swiss entity All rights reserved The
KPMG name and logo are registered trademarks or trademarks of KPMG International NDP089741-1A
the reader that the Primary Cost factors
are measured in US dollars Since we
have compared costs on a US dollar
denominated basis our results are impacted
by the relative strength of the various
currencies relative to the dollar As the
foreign exchange rates fluctuate as they
inevitably will the cost measurements we
have relied on would vary and possibly
impact the ranking of individual cost
components even if local currency costs do
not change
Finally we note that the rankings are based
on the best historical information available
Such data is mostly available only with a lag
and therefore the impact of recent trade
disputes or the market disruptions from
COVID-19 are not reflected in the results
copy 2020 KPMG LLP a Delaware limited liability partnership and the US member firm of the KPMG network of independent
member firms affiliated with KPMG International Cooperative (ldquoKPMG Internationalrdquo) a Swiss entity All rights reserved
The KPMG name and logo are registered trademarks or trademarks of KPMG International NDP089741-1A
16Cost of manufacturing operations
around the globe
Appendix A Data sources
copy 2020 KPMG LLP a Delaware limited liability partnership and the US member firm of the KPMG network of independent
member firms affiliated with KPMG International Cooperative (ldquoKPMG Internationalrdquo) a Swiss entity All rights reserved
The KPMG name and logo are registered trademarks or trademarks of KPMG International NDP089741-1A
copy 2020 KPMG LLP a Delaware limited liability partnership and a member firm of the KPMG global organization of independent member firms
affiliated with KPMG International Limited a private English company limited by guarantee All rights reserved The KPMG name and logo are
trademarks used under license by the independent member firms of the KPMG global organization NDP08974-1A
As discussed previously we relied on a variety of sources
to gather data on 23 metrics that spanned Primary and
Secondary Cost factors
Primary Cost Index
The Conference Board is a well-known source of data for
economists While researching international labor costs
we noted two indicators related to the manufacturing
industry that we deemed useful for our study The first
is hourly compensation costs which is a sum of hourly
pay for time worked hourly direct benefits and hourly
social insurance expenditures and labor-related taxes
The Conference Board did not have this information for
Malaysia and Vietnam so we substituted the Economist
Intelligence Unitrsquos labor cost per hour (pay and nonpay
costs) figures for these two countries
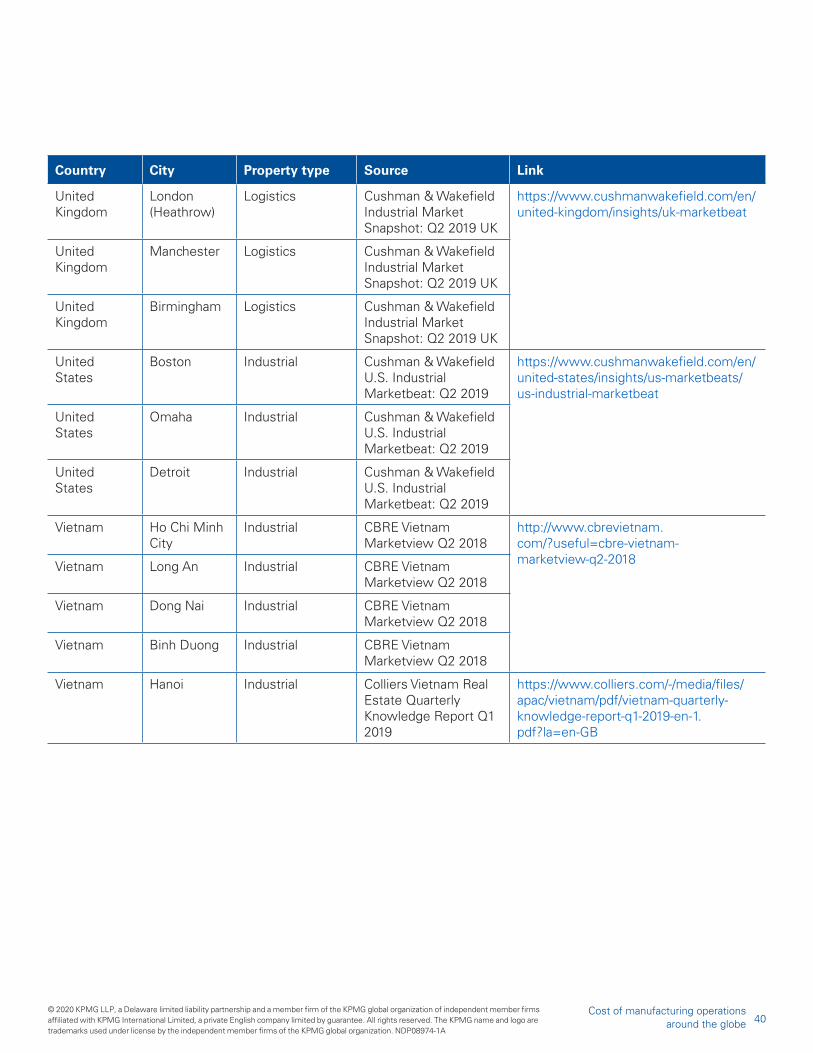
Real estate cost data that is leasing cost per square foot
was compiled from a mix of sources We collected data
from real estate advisory firms and asset managers such
as Cushman amp Wakefield Colliers International CBRE
Group Deutsche Bank DWS and UBS
Utility costs measure the average price per kilowatt hour
of electricity paid by all businesses and households in each
country excluding taxes and tariffs These prices were
retrieved from each countryrsquos respective energy regulatory
agency website
Corporate tax rates were available through internal KPMG
sources The tax rates cited in this study reflect combined
statutory federal and provincial tax rates only and do not
account for specific tax incentives International Financial
Statistics provided interest rates for Brazil Canada China
India Malaysia Mexico South Korea Switzerland the
United States and Vietnam
Interest rate data for all economies except the Euro
area countries the United Kingdom Japan and Taiwan
were obtained from the International Monetary Fundrsquos
International Financial Statistics database Interest rates for
Taiwan were retrieved from the Taiwanese central bank
while rates for the remaining economies were retrieved
from the US Federal Reserve Economic Data (FRED)
database Interest rates obtained from the IMF reflect the
monetary policy-related interest rate while interest rates
obtained from all other sources measure the discount rate
Secondary Cost measures
Quality of labor
Outside of the Doing Business report the World Bank
Group provided two additional measures for our study
learning-adjusted years of schooling and access to
internetWi-Fi
Learning-adjusted years of schooling used in the quality
of labor aggregation gives us insight into how advanced
a workerrsquos skill set might be in different countries It is
calculated by multiplying the expected years of school by
the ratio of the most recent harmonized test score and to
advancement attainment on the Trends in International
Mathematics and Science Study (TIMSS) test (The World
Bank Group)11
The Global Competitiveness Index published by the
World Economic Forum included an assessment of the
skill set of graduates (secondary and university graduates)
from each country as captured by the WEFrsquos Executive
Opinion Survey It is included in the ldquoaccess to advanced
educationrdquo category Including this measure while
similar to the learning-adjusted years of schooling takes
into account how executives perceive the quality of the
labor force and allows us to consider the perspective of a
company operating in one of these countries
Real value added per employee is a crucial metric for
companies as it has a direct impact on profits It measures
how much value each additional employee is adding to
the industry For example real value added can increase
if new employees are bringing advanced skill sets into
the workforce We used total real value added from the
Conference Board as well as the total number of people
employed to calculate real value added per employee
The Conference Board did not have this information on
Malaysia and Vietnam so we found comparable variables
for real value added per employee from Malaysia and
Vietnam from separate sources
Ease of doing business
The World Bank Group annually publishes a report titled
Doing Business which ranks 190 countries based on
their ease of doing business This research involves
very detailed quantitative indicators and a few were
particularly valuable to our study We focused on the 2019
report observing the number of days to start a business
registering property enforcing contracts and protecting
minority investors indicators As noted by The World Bank
Group the number of days to start a business measures
how many days it takes for a ldquosmall- to medium-size
limited liability company to start up and formally operate
in each economyrsquos largest business cityrdquo This is the
only variable from the Doing Business report where we
did not look at the overall score for the category (starting
a business) we only observed the number of days For
the remaining three indicators we used the scores The
registering property score is based on ldquothe steps time
and cost involved in registering a property assuming
a standardized case of an entrepreneur who wants to
18Cost of manufacturing operations
around the globe
copy 2020 KPMG LLP a Delaware limited liability partnership and a member firm of the KPMG global organization of independent member firms
affiliated with KPMG International Limited a private English company limited by guarantee All rights reserved The KPMG name and logo are
trademarks used under license by the independent member firms of the KPMG global organization NDP08974-1A
purchase land and a building that is already registered
and free of title dispute In addition the score includes
the quality of the land administration system in each
economy The quality of land administration index has five
dimensions reliability of infrastructure transparency of
information geographic coverage land dispute resolution
and equal access to property rightsrdquo (The World Bank
Group) Number of days to start a business and registering
property along with burden of government regulation
were used in our ease of doing business aggregation
Burden of government regulation is another Executive
Opinion Survey question from the Global Competitiveness
Index It is a response to the survey question ldquoIn your
country how burdensome is it for companies to comply
with public administrationrsquos requirements (eg permits
regulations reporting)rdquo Respondents can choose
a number on a scale of 1 to 7 1 being ldquoextremely
burdensomerdquo and 7 being ldquonot burdensome at allrdquo
Infrastructure
The World Economic Forumrsquos (WEF) Global Competitiveness
Index (2018 Report) contains very useful indicators relating to
starting a business Based on the values or survey responses
for each variable each country is assigned a score from 1 to
100 (100 being the best) It is important to note that we used
these scores for our study not the direct values or survey
responses
The Global Competitiveness Index provides useful information
regarding a countryrsquos infrastructure We specifically look at
transportation infrastructure and utility infrastructure In this
report transportation infrastructure is addressed with eight
variables mdashfour are sourced from WEFrsquos Executive Opinion
Survey and four are based on statistics that they compiled
from external sources
Of these variables we used the survey-based figures to
measure road quality and railroad quality while we used the
external index figures from the International Air Transport
Association (IATA) and United Nations Conference on Trade
and Development to measure airport connectivity and liner
shipping connectivity respectively Index values were not
used for the road and railroad figures due to inconsistencies
with the WEF data when we attempted to reproduce the
WEFrsquos calculations for these measures
The road quality survey results capture the response to
the survey question ldquoIn your country what is the quality
(extensiveness and condition) of road infrastructure [1 =
extremely poor among the worst in the world 7 = extremely
good among the best in the world]rdquo Similarly railroad
quality captures the average response to the question ldquoIn
your country how efficient (ie frequency punctuality
speed price) are train transport services [1 = extremely
inefficient among the worst in the world 7 = extremely
efficient among the best in the world]rdquo Airport connectivity
represents ldquothe IATA airport connectivity indicator which
measures the degree of integration of a country within the
global air transport networkrdquo The Liner shipping connectivity
index ldquoassesses a countryrsquos connectivity to global shipping
networksrdquo and is based on ldquofive components of the maritime
transport sector the number of ships their container-carrying
capacity the maximum vessel size the number of services
and the number of companies that deploy container ships in a
countryrsquos portsrdquo (World Economic Forum)
For utility infrastructure we gathered electric power losses
exposure to unsafe drinking water and reliability of water
supply from the Global Competitiveness Index Electric power
losses which measures a countryrsquos electricity quality and
exposure to unsafe drinking water which takes into account
ldquothe extent of exposure by risk level and the severity of that
riskrsquos contribution to disease burdenrdquo are both based on
statistics that were compiled from external sources Reliability
of water supply is taken from the WEFrsquos Executive Opinion
Survey and answers the question ldquoIn your country how
reliable is the water supply (lack of interruptions and flow
fluctuations)rdquo Respondents can choose a number on a
scale of 1 to 7 1 being ldquoextremely unreliablerdquo and 7 being
ldquoextremely reliablerdquo As mentioned earlier the World Bank
Group provides us with our indicator access to internetWi-
Fi which is part of the overall infrastructure aggregation It
measures the percentage of the population that is using the
internet
Risk and protections
Our political risk data was sourced from the insurance
company Credendorsquos ldquoCountry Risks Synthetizing Chartrdquo
Countries are classified into seven categories (from 1 to 7)
reflecting the intensity of risks arising as a result of political
and assimilated events Category 1 includes those countries
for which the risk is considered the lowest and category 7
contains those countries with the highest likelihood of risks
being caused by political and assimilated events In our study
we chose to focus on political risk over medium- and long-
term periods
Enforcing contracts and protecting minority investors along
with political risk and the corruption perception index were
included in our risk and protections aggregation According
to the World Bank Group the enforcing contracts score
ldquomeasures the time and cost for resolving a commercial
dispute through a local first-instance court and the quality of
copy 2020 KPMG LLP a Delaware limited liability partnership and a member firm of the KPMG global organization of independent member firms
affiliated with KPMG International Limited a private English company limited by guarantee All rights reserved The KPMG name and logo are
trademarks used under license by the independent member firms of the KPMG global organization NDP08974-1A
Measure Country Source Source detail Year Link
Hourly Compensation Costs
All (except Malaysia and Vietnam)
The Conference Board
International Comparisons of Hourly Compensation Costs in Manufacturing
2016 httpwwwconference-boardorgilcprogramindexcfmid=38269
Hourly Compensation Costs
Malaysia and Vietnam
The Economist Intelligence Unit General Statistics Office of Vietnam and Department of Statistics Malaysia
Estimated Labor Cost per Hour Manufacturing
2016 Both httpdataeiucomEI UTableViewaspx initial=trueamppub type_id=1253181310
Vietnam
httpswwwgsogov vndefault_enaspx tabid=783
Malaysia
httpsnewssstatisticsgovmynewss-portalx epepDownloadContent SearchseamcontentId =54516ampactionMethod =ep2FepDownload ContentSearchxhtml 3AcontentActiondo DisplayContentampcid= 12789
Real Estate Costs
See Appendix E
Utility Costs China China Electricity Council
Analysis of National Electricity Market Transaction Information in the Fourth Quarter of 2018
2018 Adjusted to 2015 USD
httpwwwcecorgcnguihuayutongjidianligaige2019-03 -04189190html
Primary Cost measures ndash References
judicial processes index evaluating whether each economy
has adopted a series of good practices that promote
quality and efficiency in the court systemrdquo Protecting
minority investors focuses on ldquothe strength of minority
shareholder protections against misuse of corporate assets
by directors for their personal gain as well as shareholder
rights governance safeguards and corporate transparency
requirements that reduce the risk of abuserdquo (The World
Bank Group)
The WEFrsquos Global Competitiveness Index provided scores
for each country based on the Corruption Perception Index
2016 results This index measures ldquoperceptions of corruption
in the public sectorrdquo and is scaled from 0 (highly corrupt) to
100 (very clean) According to Transparency International
who created the index ldquoThe global average score is a
paltry 43 indicating endemic corruption in a countryrsquos public
sector Top-scoring countries are far outnumbered by [low-
scoring] countries where citizens face the tangible impact of
corruption on a daily basisrdquo
Specific data sources used and linked references are provided
below
20Cost of manufacturing operations
around the globe
copy 2020 KPMG LLP a Delaware limited liability partnership and a member firm of the KPMG global organization of independent member firms
affiliated with KPMG International Limited a private English company limited by guarantee All rights reserved The KPMG name and logo are
trademarks used under license by the independent member firms of the KPMG global organization NDP08974-1A
Measure Country Source Source detail Year Link
Utility Costs France Germany Ireland Italy and United Kingdom
Eurostat Electricity prices for nonhousehold consumers ndash biannual data
2015 httpappssoeurostateceuropaeunuishowdodataset=nrg_pc_205amplang=en
Utility Costs Canada Government of Canada ndash Canada Energy Regulator
Market Snapshot Explaining the high cost of power in northern Canada February 16 2017
2016 Adjusted to 2015 USD
The Canada Energy Regulator 2017 Reproduced with the permission of Public Works and Government Services 2020
Utility Costs Brazil Governo do Brasil
Anuaacuterio Estatiacutestico de Energia Eleacutetrica 2016
2015 httppateducacaobagovbrconteudosconteudos-digitaisdownload8667pdf
Utility Costs South Korea Korea Energy Statistical Information System
Average revenues per kWh sold by segments
2015 httpwwwkesisnetsubsubChartEngjspreport_id=34110ampreport Type=0
Utility Costs Malaysia Malaysia Energy Data and Research
Malaysia Energy Statistics Handbook 2018
2015 httpsmeihstgovmydocuments10620c7e69704-6f80-40ae-a764-ad0acf4a844d
Utility Costs India Power Finance Corporation Ltd (A Govt of India Undertaking)
The Performance of State Power Utilities for the years 2013ndash14 to 2015ndash16
2015 httpswwwpfcindiacomDocumentRepositoryckfinderfilesOperationsPerformance_Reports_of_State_Power_Utilities1_Report on the Performance of State Power Utilities 2013-14 to 2015-16pdf
Utility Costs Switzerland Swiss Office of Energy
Switzerland Utility Costs 2015 httpswwwbfeadminchbfedehomehtml
Utility Costs Taiwan Taiwan Bureau of Energy
Energy Statistical Annual Reports
2015 httpswwwmoeaboegovtwECWenglishcontentContentLinkaspxmenu_id=1540
Utility Costs Japan US Energy Information Administration ndash Independent Statistics and Analysis
Japanrsquos electricity prices rising or stable despite recent fuel cost changes
2015 httpswwweiagovtodayinenergydetailphpid=27872
copy 2020 KPMG LLP a Delaware limited liability partnership and a member firm of the KPMG global organization of independent member firms
affiliated with KPMG International Limited a private English company limited by guarantee All rights reserved The KPMG name and logo are
trademarks used under license by the independent member firms of the KPMG global organization NDP08974-1A
Measure Country Source Source detail Year Link
Utility Costs United States US Energy Information Administration ndash Independent Statistics and Analysis
Average retail price of electricity United States annual
2015 httpswwweiagov
electricitydatabrowser
topic7agg=01ampgeo=
gampendsec=vgamplinechart
=ELECPRICEUS-ALL
A~ELECPRICEUS-RES
A~ELECPRICEUS-COM
A~ELECPRICEUS-IND
Aampcolumnchart=ELEC
PRICE
US-ALLA~ELECPRICE
US-RESA~ELECPRICE
US-COMA~ELECPRICE
US-INDAampmap=ELEC
PRICEUS-ALLAampfreq=
Aampctype=linechartlt=rdquordquo
div=rdquordquo style=rdquobox-sizing
border-boxrdquogt
Utility Costs Mexico US Energy Information Administration ndash Independent Statistics and Analysis
Mexico electricity market reforms attempt to reduce costs and develop new capacity
2015 httpswwweiagovtodayinenergydetailphpid=26932
Utility Costs Vietnam Vietnam Electricity ndash EVN
Vietnam Electricity Annual Report 2016
2015 httpsenevncomvnuserfileUserhuongbttfiles20177AnnualReport2016pdf
Corporate Tax Rates
All KPMG Corporate tax rates table 2019 httpshomekpmgxxenhomeservicestaxtax-tools-and-resourcestax-rates-onlinecorporate-tax-rates-tablehtml
Interest Rates Euro Area India and Japan
Federal Reserve Economic Data (FRED)
Discount Rates (Euro Area India and Japan)
2018 httpsfredstlouisfedorg
Interest Rates Taiwan Central Bank of the Republic of China
Discount Rate (Taiwan) 2018 httpswwwcbcgovtwenlp-695-2html
Interest Rates United Kingdom Bank of England Discount Rate (UK) 2018 httpswwwbankofenglandcoukmonetary-policythe-interest-rate-bank-rate
Interest Rates All (except Euro Area the UK India Japan and Taiwan)
International Financial Statistics
Interest Rates and Monetary Policy-Related Interest Rate percent per annum
2018 httpsdataimforg sk=388DFA60-1D26- 4ADE-B505-A05A55 8D9A42amp sId=1479331931186
22Cost of manufacturing operations
around the globe
copy 2020 KPMG LLP a Delaware limited liability partnership and a member firm of the KPMG global organization of independent member firms
affiliated with KPMG International Limited a private English company limited by guarantee All rights reserved The KPMG name and logo are
trademarks used under license by the independent member firms of the KPMG global organization NDP08974-1A
Secondary Cost measures
Measure Country Source Source detail Years Link
Learning-
Adjusted Years
of Schooling
All The World Bank Learning-Adjusted
Years of Schooling
2017 httpstcdata360
worldbankorg
indicatorsh00280750
country=BRA
ampindicator
=40964ampviz=bar_
chartampyears=2017
Skill set of
Graduates
All (except China) World Economic
Forum
Global
Competitiveness
Index 2019
Weighted
Average 2018ndash
2019
httpstcdata360
worldbankorg
indicators
h00280750
country=
BRAampindicator=
40964ampviz=
bar_chartampyears=2017
httpreports
weforumorg
global-
competitiveness-
report-2018
China Weighted Average
2016ndash2017
RVA per
Employee
All The Conference
Board
International
Comparisons of
Manufacturing
Productivity and
Unit Labor Costs
2017 httpswww
conference-board
orgilcprogram
indexcfmid=42672
Number of
Days to Start a
Business
All The World Bank Doing Business
2019
2019 httpswww
doingbusinessorg
endata
Burden of
Government
Regulation
All (except China) World Economic
Forum
Global
Competitiveness
Index 2019
Weighted
Average of
2018ndash2019
httpreports
weforumorgglobal-
competitiveness-
report-2019China Weighted
Average of
2016ndash2017
Registering
Property
All The World Bank Doing Business
2019
2019 httpswww
doingbusinessorg
endata
Road Quality All (except China) World Economic
Forum
Global
Competitiveness
Index 2019
Weighted
Average of
2018ndash2019
httpreports
weforumorgglobal-
competitiveness-
report-2019China Weighted
Average of
2016ndash2017
copy 2020 KPMG LLP a Delaware limited liability partnership and a member firm of the KPMG global organization of independent member firms
affiliated with KPMG International Limited a private English company limited by guarantee All rights reserved The KPMG name and logo are
trademarks used under license by the independent member firms of the KPMG global organization NDP08974-1A
Measure Country Source Source detail Years Link
Railroad Quality All (except China) World Economic
Forum
Global
Competitiveness
Index 2019
Weighted
Average of
2018ndash2019
httpreports
weforumorgglobal-
competitiveness-
report-2019China Weighted
Average of
2016ndash2017
Airport
Connectivity
All World Economic
Forum
Global
Competitiveness
Index 2019
2018 httpreports
weforumorgglobal-
competitiveness-
report-2019
Liner Shipping
Connectivity
Index
AllWorld Economic
Forum
Global
Competitiveness
Index 2018
2018
httpreports
weforumorgglobal-
competitiveness-
report-2018
Electric Power
LossesAll
World Economic
Forum
Global
Competitiveness
Index 2018
2016
httpreports
weforumorgglobal-
competitiveness-
report-2018
Exposure to
Unsafe Drinking
Water
AllWorld Economic
Forum
Global
Competitiveness
Index 2018
2017
httpreports
weforumorgglobal-
competitiveness-
report-2018
Reliability of
Water Supply
All (except China)
World Economic
Forum
Global
Competitiveness
Index 2018
Weighted
Average
2018ndash2019httpreports
weforumorgglobal-
competitiveness-
report-2018China
Weighted
Average
2016ndash2017
Access to
InternetWi-Fi
France Germany
Ireland Italy
Malaysia
Mexico South
Korea UK
Vietnam Taiwan The World Bank
Individuals using
the Internet ( of
population)
2018 httpsdata
worldbank
orgindicator
ITNETUSER
ZSview=mapBrazil Canada
China India
Japan
Switzerland US
2017
Political Risk All CredendoCountry Risk and
Insights2019
24Cost of manufacturing operations
around the globe
copy 2020 KPMG LLP a Delaware limited liability partnership and a member firm of the KPMG global organization of independent member firms
affiliated with KPMG International Limited a private English company limited by guarantee All rights reserved The KPMG name and logo are
trademarks used under license by the independent member firms of the KPMG global organization NDP08974-1A
Measure Country Source Source detail Years Link
Corruption
Perception
Index
AllWorld Economic
Forum
Global
Competitiveness
Index 2018
2018
httpreports
weforumorgglobal-
competitiveness-
report-2018
Protecting
Minority
Investors
All The World BankDoing Business
20192019
httpswww
doingbusinessorg
endata
Enforcing
ContractsAll The World Bank
Doing Business
20192019
httpswww
doingbusinessorg
endata
Measure Country Source Source detail Years Link
Manufacturing
Value Added
All except Taiwan World Bank World Bank National
Accounts Data
2016 httpsdata
worldbankorg
indicatorNVIND
MANFCD
Manufacturing
Value Added
Taiwan The Conference
Board
International
Comparisons of
Manufacturing
Productivity and Unit
Labor Costs
2016 httpswww
conference-board
orgilcprogram
indexcfmid=42672
Manufacturing
Exports to the
US
All US Census
Bureau
Manufacturing Exports
(Customs Value)
2016 httpsusatrade
censusgov
Labor Share of
Manufacturing
Costs
United States Morgan Stanley
ndash As reported in
Business Insider
Chart of the Day The
Manufacturing Cost
Components For A
Bunch Of Different
Things
2013 httpswww
businessinsider
comchart-the-cost-
of-manufacturing-
stuff-2013-4
Trade-Weighted
US Dollar
Index
NA Federal Reserve
Bank of St Louis
Trade-Weighted US
Dollar Index Major
Currencies Goods
(Index Mar 1973=100
Monthly Not
Seasonally Adjusted)
2015ndash2019 httpsfred
stlouisfedorg
seriesTWEXMMTH
Other supporting data sources
copy 2020 KPMG LLP a Delaware limited liability partnership and the US member firm of the KPMG network of independent
member firms affiliated with KPMG International Cooperative (ldquoKPMG Internationalrdquo) a Swiss entity All rights reserved
The KPMG name and logo are registered trademarks or trademarks of KPMG International NDP089741-1A
copy 2020 KPMG LLP a Delaware limited liability partnership and a member firm of the KPMG global organization of independent member firms
affiliated with KPMG International Limited a private English company limited by guarantee All rights reserved The KPMG name and logo are
trademarks used under license by the independent member firms of the KPMG global organization NDP08974-1A26
Cost of manufacturing operations
around the globe
copy 2020 KPMG LLP a Delaware limited liability partnership and the US member firm of the KPMG network of independent
member firms affiliated with KPMG International Cooperative (ldquoKPMG Internationalrdquo) a Swiss entity All rights reserved
The KPMG name and logo are registered trademarks or trademarks of KPMG International NDP089741-1A
Appendix B Review of other studies
copy 2020 KPMG LLP a Delaware limited liability partnership and the US member firm of the KPMG network of independent
member firms affiliated with KPMG International Cooperative (ldquoKPMG Internationalrdquo) a Swiss entity All rights reserved
The KPMG name and logo are registered trademarks or trademarks of KPMG International NDP089741-1A
copy 2020 KPMG LLP a Delaware limited liability partnership and a member firm of the KPMG global organization of independent member firms
affiliated with KPMG International Limited a private English company limited by guarantee All rights reserved The KPMG name and logo are
trademarks used under license by the independent member firms of the KPMG global organization NDP08974-1A
While each companyrsquos location selection decision is
unique and reflects a range of factors various studies
have attempted to compare how companies would fare
if they considered alternate locations for their production
facilities For instance the Boston Consulting Group
performed a study in 2014 that examined the perception
that Latin America or Eastern Europe offered lower costs
of production than Western Europe the US or Japan
Based on a set of metrics such as manufacturing wages
labor productivity energy costs and exchange rates across
25 countries over time the study concluded that some of
the cost advantages of the lower-cost-base countries such
as Brazil and China have eroded over time10
The Congressional Research Service also performed a
study to assess the health of US manufacturing relative
to other countries in 201811 While focused primarily on
overall manufacturing trends in areas such as value added
by the manufacturing sector countriesrsquo share of global
manufacturing manufacturing employment and research
and development spending the study also compared
hourly costs in manufacturing across 14 countries
The study concluded that US labor costs are well above
those in emerging economies but similar in magnitude to
those in the major economies of continental Europe
Yet another study performed by the Brookings Institution
considered a broader range of indicators spanning topics
such as overall policies and regulations tax policy
energy transportation health costs workforce quality
and infrastructure and innovation across 19 countries12
This study however did not compare labor costs in
manufacturing Based on the scorecard developed by the
authors to assess the manufacturing environment the
study noted that countries that had made investments in
workforce and infrastructure such as the United Kingdom
Switzerland the United States Japan and Canada fared
much better than nations such as Brazil Indonesia
Mexico Russia India and China Our study takes a more
firm-centric approach We consider only the leading
manufacturing exporters to the US as our comparison
countries and consider a focus on primary costs including
labor and real estate
10 Boston Consulting Group ldquoThe Shifting Economics of Global Manufacturing How Cost Competitiveness is Changing Worldwiderdquo 2014
11 Congressional Research Service US Manufacturing in International Perspective February 21 2018
12 Brookings Institution Global Manufacturing Scorecard How the US Compares to 18 Other Nations 2018
28Cost of manufacturing operations
around the globe
copy 2020 KPMG LLP a Delaware limited liability partnership and the US member firm of the KPMG network of independent
member firms affiliated with KPMG International Cooperative (ldquoKPMG Internationalrdquo) a Swiss entity All rights reserved
The KPMG name and logo are registered trademarks or trademarks of KPMG International NDP089741-1A
Appendix C Shortlist of comparison countries
copy 2020 KPMG LLP a Delaware limited liability partnership and the US member firm of the KPMG network of independent
member firms affiliated with KPMG International Cooperative (ldquoKPMG Internationalrdquo) a Swiss entity All rights reserved
The KPMG name and logo are registered trademarks or trademarks of KPMG International NDP089741-1A
copy 2020 KPMG LLP a Delaware limited liability partnership and a member firm of the KPMG global organization of independent member firms
affiliated with KPMG International Limited a private English company limited by guarantee All rights reserved The KPMG name and logo are
trademarks used under license by the independent member firms of the KPMG global organization NDP08974-1A
Table 13 2016 global country rankings
Source US Census Bureau World Bank
This analysis considers a total of 16 economies in addition to the United States Table 13 lists each of
these economies as well as their respective rankings by manufacturing exports to the US and total
value added in manufacturing in 2016 Figure 2 presents the accompanying dollar value of manufacturing
exports for each economy to the US in 2016
These countries were first selected based on the customs value of manufacturing exports to the US
However the list generated on this basis did not include any countries from South America To make the
study more comprehensive Brazil the leading economy in South America with an industrial manufacturing
base in automotive aircraft and other sectors was added to the list
Country Manufacturing exports to US Total manufacturing value add
China 1 1
Mexico 2 12
Canada 3 16
Japan 4 3
Germany 5 4
Korea Rep 6 5
United Kingdom 7 9
Ireland 8 19
India 9 6
Italy 10 7
France 11 8
Vietnam 12 46
Taiwan 13 13
Malaysia 14 26
Switzerland 15 17
Brazil 18 10
copy 2020 KPMG LLP a Delaware limited liability partnership and the US member firm of the KPMG network of independent
member firms affiliated with KPMG International Cooperative (ldquoKPMG Internationalrdquo) a Swiss entity All rights reserved
The KPMG name and logo are registered trademarks or trademarks of KPMG International NDP089741-1A
30Cost of manufacturing operations
around the globe
copy 2020 KPMG LLP a Delaware limited liability partnership and a member firm of the KPMG global organization of independent member firms
affiliated with KPMG International Limited a private English company limited by guarantee All rights reserved The KPMG name and logo are
trademarks used under license by the independent member firms of the KPMG global organization NDP08974-1A
We note here that while we use exports to the US as a basis for selecting these countries the selected benchmark
countries generally rank highly when based on manufacturing output as well13 There is also a significant overlap between
these countries and those considered in other studies that we reviewed
13 US Census Bureau Manufacturing Exports (Customs Value) Accessible at httpsusatradecensusgov
Source US Census Bureau
Note that Canada data is as of 2015 and Taiwan does not contain World Bank data for any year
The global manufacturing output ranking from the World Bank source is also included for reference
Figure 1 2016 Total Manufacturing Exports to the US
Export
ing e
conom
y
Customs value (USD billions)
$500$450$400$350$300$250$200$150$100$50$0
Brazil $18
Switzerland $32
Malaysia $36
Taiwan $37
Vietnam $39
France $40
Italy $42
India $43
Ireland $43
UK $46
South Korea $68
Germany $107
Japan $128
$202Canada
$264Mexico
$454China
Appendix D Index methodology
copy 2020 KPMG LLP a Delaware limited liability partnership and a member firm of the KPMG global organization of independent
member firms affiliated with KPMG International Limited a private English company limited by guarantee All rights reserved
The KPMG name and logo are trademarks used under license by the independent member firms of the KPMG global
organization NDP08974-1A
32Cost of manufacturing operations
around the globe
copy 2020 KPMG LLP a Delaware limited liability partnership and a member firm of the KPMG global organization of independent member firms
affiliated with KPMG International Limited a private English company limited by guarantee All rights reserved The KPMG name and logo are
trademarks used under license by the independent member firms of the KPMG global organization NDP08974-1A
We use 23 metrics to develop an overall weight of the country The metrics are further segregated into Primary
and Secondary Costs The Primary Costs consist of five subcategories of costs and the Secondary Costs
consisted of an additional four subcategories (with a varying number of metrics for each category for a total of
18 categories)
The Primary and Secondary Cost Indices are equally weighted at 50 percent each and each subcategory within
these two broad categories was also equally weighted The weighting for each individual factor however varies as
the number of factors consider for each metric variesmdashthus the five Primary Costs have 20 percent weight each
for an overall ranking weight of 10 percent (50 percent20 percent) while the secondary factors have 25 percent
weight each Quality of labor for example has three metrics associated with it with each metric weighted at 42
percent (approximately 50 percent25 percent13) The table below shows the final weights for each metric
Figure 2 Weights by measure category
Table 14 Final weights in overall ranking by metric
Measure Cost type SubcategoryOverall ranking weight
1 Hourly compensation costs Primary 100
2 Real estate costs Primary 100
3 Utility costs Primary 100
4 Corporate tax rates Primary 100
5 Interest rates Primary 100
6 Learning-adjusted years of schooling Secondary Quality of Labor 42
7 Skill set of graduates Secondary Quality of Labor 42
8 Real value added per employee Secondary Quality of Labor 42
9 Days to start business Secondary Ease of Doing Business 42
10 Burden of government regulation Secondary Ease of Doing Business 42
11 Registering property Secondary Ease of Doing Business 42
12 Road quality index Secondary Infrastructure 10
13 Railroad quality Secondary Infrastructure 10
14 Airport connectivity Secondary Infrastructure 10
20
20
20
20
20
PrimaryCost Index
Hourly Compensation Costs
Real Estate Costs
Utility Costs
Corporate Tax Rates
Interest Rates
SecondaryCost Index
Quality of Labor
Ease of Doing Business
Infrastructure
Risk and Protections
25
2525
25
Primary Costs
Secondary Costs
CoDB Index 5050
Table 15 Percentile rankings by metric
Measure Cost type SubcategoryOverall ranking weight
15 Liner shipping connectivity index Secondary Infrastructure 10
16 Electric power losses ( of output) Secondary Infrastructure 14
17 Exposure to unsafe drinking water Secondary Infrastructure 14
18 Reliability of water supply Secondary Infrastructure 14
19 Access to internetWi-fi Secondary Infrastructure 42
20 Political risk Secondary Risk and Protections 31
21 Enforcing contracts Secondary Risk and Protections 31
22 Protecting minority investors Secondary Risk and Protections 31
23 Corruption perception index Secondary Risk and Protections 31
In addition to the weights assigned for each metric the
methodology for developing the index consisted of the
following steps
mdash Performance on each metric is ranked using a
percentile-based methodology The top (or bottom from
an operating cost perspective based on the metric) 15
percent receives the highest rank and the lowest (or
highest) 15 percent receives a rank of 5 Ranks for real
estate costs are shown below as an example Thus the
cheapest or lowest 15 percentile of real estate costs is
rank 1 percentiles between the 15 and 35 percentiles
receive a rank of 2 and so on This is further illustrated
in the table below
mdash The final scores are calculated by applying the
appropriate weights for each metric first at the
subcategory level and combined (using weight
multiplied by the rank) with the Primary and Secondary
Cost scores and ultimately to the overall score
The scores are then ranked for ease of display and
comparison
Real estate costs
Ranking From To
1 000 1499
2 1500 3499
3 3500 6499
4 6500 8499
5 8500 10000
copy 2020 KPMG LLP a Delaware limited liability partnership and the US member firm of the KPMG network of independent member firms
affiliated with KPMG International Cooperative (ldquoKPMG Internationalrdquo) a Swiss entity All rights reserved The KPMG name and logo are
registered trademarks or trademarks of KPMG International NDP089741-1A
34Cost of manufacturing operations
around the globe
Appendix E Real estate data sources in various cities
copy 2020 KPMG LLP a Delaware limited liability partnership and the US member firm of the KPMG network of independent
member firms affiliated with KPMG International Cooperative (ldquoKPMG Internationalrdquo) a Swiss entity All rights reserved
The KPMG name and logo are registered trademarks or trademarks of KPMG International NDP089741-1A
copy 2020 KPMG LLP a Delaware limited liability partnership and a member firm of the KPMG global organization of independent member firms
affiliated with KPMG International Limited a private English company limited by guarantee All rights reserved The KPMG name and logo are
trademarks used under license by the independent member firms of the KPMG global organization NDP08974-1A
Country City Property type Source Link
Brazil Santa Cruz
Campo
Grande
Industrial Cushman amp Wakefield
Industrial Marketbeat
Q2 2019 Brazil
Industrial Report
httpswwwcushmanwakefieldcomen
brazilinsightsbrazil-marketbeats
Brazil Satildeo Paulo Industrial Cushman amp Wakefield
Industrial Marketbeat
Q2 2019 Brazil
Industrial Report
Brazil Rio de
Janeiro
Industrial Cushman amp Wakefield
Industrial Marketbeat
Q2 2019 Brazil
Industrial Report
Canada Calgary Industrial Cushman amp Wakefield
Industrial Marketbeat
Q2 2019 Canada
Industrial Report
httpswwwcushmanwakefieldcomen
canadainsightscanada-marketbeats
Canada Ottawa Industrial Cushman amp Wakefield
Industrial Marketbeat
Q2 2019 Canada
Industrial Report
Canada Toronto Industrial Cushman amp Wakefield
Industrial Marketbeat
Q2 2019 Canada
Industrial Report
China Chengdu Logistics Colliers Quarterly
Logistics Research
Chengdu-Chonqing Q1
2019
httpswwwcollierscom-media
filesmarketresearchapacchina
southwestchina-researchwestchina-
logistics-q1-2019-enpdfla=en-GB
China Beijing Logistics Colliers Quarterly
Industrial Beijing-
Tianjin-Langeang Q1
2018
httpswwwcollierscom-mediafiles
marketresearchapacchinanorthchina-
researchbj-tj-lf-industrial-q1-2018
pdfla=en-GB
China Tianjin Logistics Colliers Quarterly
Industrial Beijing-
Tianjin-Langeang Q1
2018
France Paris Industrial and
Logistics
Cushman amp Wakefield
Industrial Market
Snapshot Q2 2019
France
httpswwwcushmanwakefieldcomen
franceinsightsfrance-marketbeat
France Lyon Industrial and
Logistics
Cushman amp Wakefield
Industrial Market
Snapshot Q2 2019
France
36Cost of manufacturing operations
around the globe
copy 2020 KPMG LLP a Delaware limited liability partnership and a member firm of the KPMG global organization of independent member firms
affiliated with KPMG International Limited a private English company limited by guarantee All rights reserved The KPMG name and logo are
trademarks used under license by the independent member firms of the KPMG global organization NDP08974-1A
Country City Property type Source Link
France Marseille Industrial and
Logistics
Cushman amp Wakefield
Industrial Market
Snapshot Q2 2019
France
httpswwwcushmanwakefieldcomen
franceinsightsfrance-marketbeat
France Bordeaux Industrial and
Logistics
Cushman amp Wakefield
Industrial Market
Snapshot Q2 2019
France
France Strasbourg Industrial and
Logistics
Cushman amp Wakefield
Industrial Market
Snapshot Q2 2019
France
France Lille Industrial and
Logistics
Cushman amp Wakefield
Industrial Market
Snapshot Q2 2019
France
France Toulouse Industrial and
Logistics
Cushman amp Wakefield
Industrial Market
Snapshot Q2 2019
France
Germany Berlin Industrial and
Logistics
Colliers Industrial and
Logistics Markets
Overview Germany
20182019
httpswwwcolliersdewp-
contentuploads201906
ColliersResearchMarket-Report-
IL20182019englpdf
Germany Dusseldorf Industrial and
Logistics
Colliers Industrial and
Logistics Markets
Overview Germany
20182019
Germany Frankfurt Industrial and
Logistics
Colliers Industrial and
Logistics Markets
Overview Germany
20182019
Germany Hamburg Industrial and
Logistics
Colliers Industrial and
Logistics Markets
Overview Germany
20182019
Germany Cologne Industrial and
Logistics
Colliers Industrial and
Logistics Markets
Overview Germany
20182019
Germany Leipzig Industrial and
Logistics
Colliers Industrial and
Logistics Markets
Overview Germany
20182019
copy 2020 KPMG LLP a Delaware limited liability partnership and a member firm of the KPMG global organization of independent member firms
affiliated with KPMG International Limited a private English company limited by guarantee All rights reserved The KPMG name and logo are
trademarks used under license by the independent member firms of the KPMG global organization NDP08974-1A
Country City Property type Source Link
Germany Munich Industrial and
Logistics
Colliers Industrial and
Logistics Markets
Overview Germany
20182019
httpswwwcolliersdewp-
contentuploads201906
ColliersResearchMarket-Report-
IL20182019englpdf
Germany Stuttgart Industrial and
Logistics
Colliers Industrial and
Logistics Markets
Overview Germany
20182019
India Delhi Industrial Cushman amp Wakefield
Industrial Marketbeat
Q4 2018 Delhi
Industrial Report
httpswwwcushmanwakefieldcomen
indiainsightsdelhi-ncr-marketbeat
India Mumbai Industrial Cushman amp Wakefield
Industrial Marketbeat
Q4 2018 Mumbai
Industrial Report
httpswwwcushmanwakefieldcomen
indiainsightsmumbai-marketbeat
Ireland Dublin Logistics Cushman amp Wakefield
Industrial Marketbeat
Q1 2019 Ireland
Industrial Report
httpswwwcushmanwakefieldcomen
irelandinsightsireland-marketbeat
Ireland Cork Logistics Cushman amp Wakefield
Industrial Marketbeat
Q1 2019 Ireland
Industrial Report
Ireland Galway Logistics Cushman amp Wakefield
Industrial Marketbeat
Q1 2019 Ireland
Industrial Report
Italy Rome Logistics CBRE Italy Logistics
MarketView Q4 2019
httpswwwcbredeenresearchItaly-
Logistics-MarketView-Q4-2019
Italy Milan Logistics CBRE Italy Logistics
MarketView Q4 2019
Italy Bologna Logistics CBRE Italy Logistics
MarketView Q4 2019
Japan Osaka Logistics CBRE Japan Real
Estate Market Outlook
2019
httpswwwcbrecomresearch-and-
reportsJapan-Real-Estate-Market-
Outlook-2019
Japan Nagoya Logistics CBRE Japan Real
Estate Market Outlook
2019
38Cost of manufacturing operations
around the globe
copy 2020 KPMG LLP a Delaware limited liability partnership and a member firm of the KPMG global organization of independent member firms
affiliated with KPMG International Limited a private English company limited by guarantee All rights reserved The KPMG name and logo are
trademarks used under license by the independent member firms of the KPMG global organization NDP08974-1A
Country City Property type Source Link
Malaysia Klang Valley Industrial CBRE Malaysia Real
Estate Market Outlook
2019
httpswwwcbrecomreport-
downloadPUBID=44c7f5c6-5dbe-4a76-
a335-ff80e9c57a79
Malaysia Penang Industrial CBRE Malaysia Real
Estate Market Outlook
2019
Malaysia Iskandar
Malaysia
Industrial CBRE Malaysia Real
Estate Market Outlook
2019
Malaysia Kuching Industrial CBRE Malaysia Real
Estate Market Outlook
2019
Mexico Mexico Industrial CBRE Mexico Industrial
Market Outlook Q2 2019
httpswwwcbrecommxenresearch-
and-reports
South Korea Greater
Seoul
Logistics DWS Market Outlook
2018
httpswwwdwscomglobalassets
institutionalresearchpdfsDWS_South_
Korea_Real_Estate_Market_Outlook_
April_2018pdf
Switzerland Industrial UBS Real Estate Focus
2019
httpsfiabciorguploadsswiss-real-
estate-focus-2019-enpdf
Taiwan Neihu
District
Taipei
Industrial Colliers Radar
Industrial Taiwan
August 2019
httpswwwcollierscom-media
filesapactaiwanother20
reports2019radarreport-enpdfla=en-
GBTaiwan Nangang
Taipei
Industrial Colliers Radar
Industrial Taiwan
August 2019
Taiwan Xizhi New
Taipei City
Industrial Colliers Radar
Industrial Taiwan
August 2019
Taiwan Jhonghe
New Taipei
City
Industrial Colliers Radar
Industrial Taiwan
August 2019
Taiwan Xindien New
Taipei City
Industrial Colliers Radar
Industrial Taiwan
August 2019
Taiwan Sanchong
New Taipei
City
Industrial Colliers Radar
Industrial Taiwan
August 2019
Taiwan Xinchuang
New Taipei
City
Industrial Colliers Radar
Industrial Taiwan
August 2019
Taiwan Tucheng
New Taipei
City
Industrial Colliers Radar
Industrial Taiwan
August 2019
copy 2020 KPMG LLP a Delaware limited liability partnership and a member firm of the KPMG global organization of independent member firms
affiliated with KPMG International Limited a private English company limited by guarantee All rights reserved The KPMG name and logo are
trademarks used under license by the independent member firms of the KPMG global organization NDP08974-1A
Country City Property type Source Link
United
Kingdom
London
(Heathrow)
Logistics Cushman amp Wakefield
Industrial Market
Snapshot Q2 2019 UK
httpswwwcushmanwakefieldcomen
united-kingdominsightsuk-marketbeat
United
Kingdom
Manchester Logistics Cushman amp Wakefield
Industrial Market
Snapshot Q2 2019 UK
United
Kingdom
Birmingham Logistics Cushman amp Wakefield
Industrial Market
Snapshot Q2 2019 UK
United
States
Boston Industrial Cushman amp Wakefield
US Industrial
Marketbeat Q2 2019
httpswwwcushmanwakefieldcomen
united-statesinsightsus-marketbeats
us-industrial-marketbeat
United
States
Omaha Industrial Cushman amp Wakefield
US Industrial
Marketbeat Q2 2019
United
States
Detroit Industrial Cushman amp Wakefield
US Industrial
Marketbeat Q2 2019
Vietnam Ho Chi Minh
City
Industrial CBRE Vietnam
Marketview Q2 2018
httpwwwcbrevietnam
comuseful=cbre-vietnam-
marketview-q2-2018Vietnam Long An Industrial CBRE Vietnam
Marketview Q2 2018
Vietnam Dong Nai Industrial CBRE Vietnam
Marketview Q2 2018
Vietnam Binh Duong Industrial CBRE Vietnam
Marketview Q2 2018
Vietnam Hanoi Industrial Colliers Vietnam Real
Estate Quarterly
Knowledge Report Q1
2019
httpswwwcollierscom-mediafiles
apacvietnampdfvietnam-quarterly-
knowledge-report-q1-2019-en-1
pdfla=en-GB
40Cost of manufacturing operations
around the globe
copy 2020 KPMG LLP a Delaware limited liability partnership and the US member firm of the KPMG network of independent
member firms affiliated with KPMG International Cooperative (ldquoKPMG Internationalrdquo) a Swiss entity All rights reserved
The KPMG name and logo are registered trademarks or trademarks of KPMG International NDP089741-1A
copy 2020 KPMG LLP a Delaware limited liability partnership and a member firm of the KPMG global organization of independent member firms
affiliated with KPMG International Limited a private English company limited by guarantee All rights reserved The KPMG name and logo are
trademarks used under license by the independent member firms of the KPMG global organization NDP08974-1A
Cost of manufacturing operations
around the globe
Contact usErkan ErdemPrincipalKPMG ndash National Tax Industry Leader for Public Sector and Economic and Statistical ConsultingT 703-286-8188
E erkanerdemkpmgcom
Oommen ThomasManaging DirectorKPMG ndash Economic and Statistical ConsultingT 415-963-8125
E oommenthomaskpmgcom
Talha MuhammadManagerKPMG ndash Economic and Statistical ConsultingT 212-909-5401
E talhamuhammadkpmgcom
Brian HecklerPartnerKPMG ndash National Sector Leader for Industrial ManufacturingT 312-665-2693
E bhecklerkpmgcom
Ulrich Schmidt Principal KPMG - Global Location amp Expansion Services T 267-256-2786 E ulrichschmidtkpmgcom
Carolyn LeeExecutive DirectorThe Manufacturing InstituteT 202-637-3079
E cleenamorg
The following information is not intended to be ldquowritten advice concerning one or more Federal tax mattersrdquo subject to the requirements of section 1037(a)(2)
of Treasury Department Circular 230
The information contained herein is of a general nature and based on authorities that are subject to change Applicability of the information to specific situations
should be determined through consultation with your tax adviser
copy 2020 KPMG LLP a Delaware limited liability partnership and a member firm of the KPMG global organization of independent member firms affiliated with
KPMG International Limited a private English company limited by guarantee All rights reserved The KPMG name and logo are trademarks used under license
by the independent member firms of the KPMG global organization NDP08974-1A
kpmgcomsocialmedia
The authors gratefully acknowledge excellent research assistance provided by Andrew Bent and
Kristina Kohl Tableau visualizations created by Konul Riegel and technical support provided by Ian Flick

copy 2020 KPMG LLP a Delaware limited liability partnership and a member firm of the KPMG global organization of independent member firms
affiliated with KPMG International Limited a private English company limited by guarantee All rights reserved The KPMG name and logo are
trademarks used under license by the independent member firms of the KPMG global organization NDP08974-1A
Contents
This report is a result of a collaboration between KPMG and The Manufacturing Institute
Executive summary 1
Introduction 3
What are the ldquoCosts of Doing Businessrdquo 5
Developing the index 7
Results 8
Conclusions 15
Appendix A Data sources 17
Appendix B Review of other studies 27
Appendix C Shortlist of comparison countries 29
Appendix D Index methodology 32
Appendix E Real estate data sources in various cities 35
copy 2020 KPMG LLP a Delaware limited liability partnership and a member firm of the KPMG global organization of independent member firms
affiliated with KPMG International Limited a private English company limited by guarantee All rights reserved The KPMG name and logo are
trademarks used under license by the independent member firms of the KPMG global organization NDP08974-1A
GlossaryTerm Definition
Access to internet
Wi-Fi
The percentage of each countrys population that has used the internet within the last three
months
Airport connectivityThe International Air Transportation Authoritys (IATA) airport connectivity indicator which
measures the degree of integration of a country within the global air transport network
Burden of
government
regulation
The burden of government regulation as measured by business executives response to
the question ldquoIn your country how burdensome is it for companies to comply with public
administrationrsquos requirements (eg permits regulations reporting)rdquo
CoDBCost of Doing Business (CoDB) refers to the direct and indirect costs incurred by businesses
engaged in manufacturing operations
Corporate tax ratesStatutory corporate tax rates including federal and provincial tax rates but excluding tax
incentives for certain types of businesses
Corruption
perception index
A measure of experts and business peoples perceptions of corruption in the public sector
including both the frequency and magnitude of corrupt behaviors as well as the strength of
anticorruption measures
Days to start
business
The number of days it takes for a small- to medium-size limited liability company to start up and
formally operate in each economyrsquos largest business city as calculated by the World Bank
Electric power
losses ( of
output)
Measures the percentage of a countrys energy output that is lost in transmission and
distribution
Enforcing contracts
A measure of the time and cost for resolving a commercial dispute through a local first-instance
court and the quality of judicial processes index evaluating whether each economy has adopted
a series of good practices that promote quality and efficiency in the court system
Exposure to unsafe
drinking water The risk-weighted percentage of the population exposed to unsafe drinking water
Hourly
compensation
costs
The average price firms must pay for an hour of an employees labor including hourly pay for
time worked hourly direct benefits and hourly social insurance expenditures and labor-related
taxes
Interest ratesThe monetary policy-related interest rates reported by the IMF for each country Discount rates
were used where monetary-policy interest rates were not available from the IMF
Learning-adjusted
years of schooling
The expected years of schooling for all residents multiplied by the countrys relative scoring on
international tests such as PISA or TIMSS
Liner shipping
connectivity index
A measure of each countryrsquos connectivity to global shipping networks based on five components
of the maritime transport sector the number of ships their container-carrying capacity the
maximum vessel size the number of services and the number of companies that deploy
container ships in a countryrsquos ports
copy 2020 KPMG LLP a Delaware limited liability partnership and a member firm of the KPMG global organization of independent member firms
affiliated with KPMG International Limited a private English company limited by guarantee All rights reserved The KPMG name and logo are
trademarks used under license by the independent member firms of the KPMG global organization NDP08974-1A
Term Definition
Political riskMeasures the likelihood of a risk caused by political and assimilated events connected to cross-
border transactions with a risk horizon beyond one year
Primary costsCosts that directly affect a firms bottom line and can be easily expressed in dollars These cost
factors include expenses such as wages utilities real estate costs and taxes
Protecting minority
investors
A measure of the strength of minority shareholder protections against misuse of corporate
assets by directors for their personal gain as well as shareholder rights governance safeguards
and corporate transparency requirements that reduce the risk of abuse
Railroad qualityThe quality of railroads as measured by business executives response to the question ldquoIn your
country how efficient (ie frequency punctuality speed price) are train transport servicesrdquo
Real estate costs The average monthly rent per square foot for industrial properties in each country
Real value added
per employee
The net output of the manufacturing sector after adding up all outputs and subtracting
intermediate inputs divided by the number of workers employed by the manufacturing sector
(including part-time and self-employed employees)
Registering
property
A measure of the steps time and cost involved in registering a property assuming a
standardized case of an entrepreneur who wants to purchase land and a building that is already
registered and free of title dispute
Reliability of water
supply
The reliability of the water supply as measured by business executives response to the
question ldquoIn your country how reliable is the water supply (lack of interruptions and flow
fluctuations)rdquo
Road quality indexThe quality of roadways as measured by business executives response to the question ldquoIn your
country what is the quality (extensiveness and condition) of road infrastructurerdquo
Secondary costsFactors that impact overhead costs and the firmrsquos ability to operate efficiently The secondary
factors are typically related to the business environment or the ease of doing business
Skill set of
graduates
The skill set of graduates as measured by business executives response to the question ldquoIn
your country to what extent do graduating students from secondary education possess the
skills needed by businessesrdquo and ldquoIn your country to what extent do graduating students from
university possess the skills needed by businessesrdquo
MIThe Manufacturing Institute is the research and education partner of the National Association of
Manufacturers a trade group for manufacturers in the United States
Utility costsThe average price per kilowatt-hour (converted to USD) of electricity paid by all businesses and
households in each country excluding taxes and tariffs
5Cost of manufacturing operations
around the globe
copy 2020 KPMG LLP a Delaware limited liability partnership and a member firm of the KPMG global organization of independent member firms
affiliated with KPMG International Limited a private English company limited by guarantee All rights reserved The KPMG name and logo are
trademarks used under license by the independent member firms of the KPMG global organization NDP08974-1A
The competitiveness of the manufacturing sector in the
United States has been discussed extensively in the press
and economic literature in recent years This joint study
by KPMG and the Manufacturing Institute (MI) provides a
current assessment of how the US compares to its main
trading partners as a location for manufacturing
Specifically this study compares the primary and
secondary factors that impact the cost of operations (Cost
of Doing Business or CoDB) of a business conducting
manufacturing operations in the United States relative to
16 other countries that are leading manufacturing exporters
to the US These 17 economies together account for
about four-fifths of global value added in manufacturing
and thus a comparative analysis across countries provides
insight into how regional economic factors may affect the
global competitive landscape in manufacturing1
Our approach examines different cost factors including
costs that directly impact a firmrsquos bottom line (Primary
Costs) and costs that typically impact a firmrsquos operating
costs and profits more indirectly (Secondary Costs)
Executive summary
Some of our key findings consist of the following
mdash Secondary Cost Index performance is a strong predictor of overall CoDB Index rank For a given country
performing well on the Secondary Cost Index generally correlates with performing well on the CoDB Index rankings
ndash Manufacturers in the US face higher Primary Costs relative to other countries particularly labor costs This is
reflected in a Primary Cost score of 340 a score that is 157 percent higher than the average score of the
other manufacturing locations that are considered in this study and translates to a ranking of 14 out of a total
of 17 on the Primary Cost Index
ndash However strong performance on Secondary Costs for the US such as the quality of labor and superior
business conditions results in the US being ranked fifth on the overall CoDB Index
mdash Labor Quality is a differentiating factor for the US Examining the results from a labor market perspective it is
notable that the USrsquos strength in labor quality allows it to be a strong competitive contender Increasing the importance
(ie 25 to 70 in the Secondary Cost Index) of the quality of labor component improves the US ranking by one from
fifth to fourth place However there is significant competition from European countries in this regard The higher weight
on the quality of labor component also causes Ireland Germany and Switzerland to jump to the top five on the overall
CoDB Index ranking
mdash US tax reform has a material impact on US CoDB Index ranking As part of this analysis we also examined if the
recent US tax reform had a material impact on the relative standing of the United States In particular we compared
how the US would have ranked had we used the pre-reform corporate tax rate of 40 percent (combined federal and
state tax rate) instead of the post-tax-reform corporate rate of 27 percent The impact of the reform on the CoDB Index
ranking for the US is quite significant The ranking of the US on the CoDB Index improved from 11th to 5th
1World Bank Manufacturing Value Added Accessible at httpsdataworldbankorgindicatorNVINDMANFCD
copy 2020 KPMG LLP a Delaware limited liability partnership and a member firm of the KPMG global organization of independent member firms
affiliated with KPMG International Limited a private English company limited by guarantee All rights reserved The KPMG name and logo are
trademarks used under license by the independent member firms of the KPMG global organization NDP08974-1A
We collected data on 23 measures and then quantitatively
evaluated each country based on these measures to develop
an overall CoDB index (CoDB Index) to assess the economyrsquos
competitiveness as a manufacturing hub The components of
the CoDB Index in turn consist of an index of Primary Costs
(Primary Cost Index) that includes factors such as labor costs
real estate costs costs of financing (as measured by interest
rates) and utility costs as well as an index of Secondary Costs
(Secondary Cost Index) made up of 18 measures grouped
into four main areas quality of labor ease of doing business
infrastructure and risk
We note that this study and our conclusions are based
on certain CoDB factors that are commonly considered in
manufacturing facility location decisions and the results provide
a high-level perspective on the attributes of various countries
with respect to these factors However the location decision
is specific to each company and its consideration of additional
factors such as industry type of product supply chain access
to consumer markets and the companyrsquos overall business
strategy It is therefore important to recognize that an individual
location decision of a company may involve more factors and
considerations than we have evaluated in this analysis
Finally we note that while we have used the most recently
available data on the cost factors such data is available only
with a lag As such the rankings are based on the best historical
information available and as a consequence the impact of
recent trade disputes or the market disruptions from COVID-19
are not reflected in the results
254
263
265
267
269
269
274
277
277
283
284
300
326
333
346
349
420
Canada
Taiwan
South Korea
Malaysia
United States
United Kingdom
Germany
Switzerland
Ireland
France
China
Italy
Japan
Mexico
Vietnam
India
Brazil
CoDB Index Score by Country (1=best5=worst)
Source Cost of Manufacturing Operations Around the Globe KPMG LLP 2020
Cost of manufacturing operations
around the globe2
Where to locate a production facility is an important
strategic decision for a manufacturing company The
location decision can have a long-term impact on
performance The selection of a particular site (or country)
requires more than just an assessment of labor costs It
requires the consideration of multiple factors including
the cost of setting up the facility real estate costs energy
costs the quality of the labor force and infrastructure
the regulatory environment and intellectual property
protections
In 2011 MI published a cost of doing business study
(the MI Report)2 The MI Report compared the cost of
production in the United States and nine major trading
partners Canada China France Germany Japan South
Korea Mexico Taiwan and the United Kingdom The study
examined the ldquorawrdquo cost of production based on wage
costs relative to value added in manufacturing and a variety
of other ldquostructuralrdquo costs of doing business in each
country including corporate tax rates employee benefits
tort litigation regulatory compliance and energy The study
noted that unlike in previous years manufacturers in the
US faced lower ldquoraw costsrdquo (ie wage compensation
relative to total valued added in manufacturing) than its
trading partners Specifically raw costs faced by US
manufacturers were about 9 percent lower than the
trade-weighted average of its nine largest trading partners
However the study noted that this advantage was entirely
offset by the higher structural costs (ie corporate tax
rates employee benefit costs tort litigation regulatory
compliance and energy) with US manufacturing costs
(on a trade-weighted basis) being about 9 percent higher
than that of its nine largest trading partners
This study seeks to update the MI Report by
mdash Including more recent data
mdash Considering additional indicators of the cost of doing
business
mdash Expanding the comparison to seven additional
countries Brazil Ireland Italy India Malaysia
Switzerland and Vietnam
Introduction
2 The Manufacturing Institute and the Manufacturers Alliance for
Productivity and Innovation 2011 Report on the Structural Cost of
US Manufacturing 2011copy 2020 KPMG LLP a Delaware limited liability partnership and a member firm of the KPMG
global organization of independent member firms affiliated with KPMG International Limited a
private English company limited by guarantee All rights reserved The KPMG name and logo are
trademarks used under license by the independent member firms of the KPMG global organization
NDP08974-1A
copy 2020 KPMG LLP a Delaware limited liability partnership and the US member firm of the KPMG network of independent
member firms affiliated with KPMG International Cooperative (ldquoKPMG Internationalrdquo) a Swiss entity All rights reserved
The KPMG name and logo are registered trademarks or trademarks of KPMG International NDP089741-1A
Cost of manufacturing operations
around the globe
copy 2020 KPMG LLP a Delaware limited liability partnership and a member firm of the KPMG global organization of independent member firms
affiliated with KPMG International Limited a private English company limited by guarantee All rights reserved The KPMG name and logo are
trademarks used under license by the independent member firms of the KPMG global organization NDP08974-1A4
copy 2020 KPMG LLP a Delaware limited liability partnership and a member firm of the KPMG global organization of independent member firms
affiliated with KPMG International Limited a private English company limited by guarantee All rights reserved The KPMG name and logo are
trademarks used under license by the independent member firms of the KPMG global organization NDP08974-1A
What are the ldquoCosts of Doing Businessrdquo
Companies consider a variety of CoDB factors when
evaluating their international manufacturing location
decisions Our study considers the factors evaluated
by companies at the country level and seeks to
incorporate these into country-level rankings A countryrsquos
competitiveness is often judged by the cost of labor
and an often cited motivation for moving manufacturing
offshore (relative to higher-cost countries like the US) is
the desire to gain access to low labor costs and to lower
the cost of production Studies however have indicated
that a range of other factors go into the location selection
decision3 The leading factors identified in the literature
that contribute to the location decision are
1 Availability of skilled labor
2 Cost and productivity of labor
3 Availability of and proximity to transportation
infrastructure
4 Tax rates
5 Regulatory environment
6 Real estate costs
7 Availability and cost of power communications water
and other utilities
8 Access to and cost of capital
9 Transparency in government and business practices
and ease of doing business
10 Politically and economically stable environment with
ability to enforce legal and property rights
We compiled data on each of these factors directly or
through proxy measures over the 2012 to 2019 time
period for the 17 countries (see Appendix A for details)
The selection of specific categories of costs to compare
were guided by the surveys and studies we reviewed (see
Appendix A for details) We note here that data for every
cost element was not available for every country or not
available for a recent time period Thus the cost types
analyzed are those that could be obtained from public
sources spanning 2012ndash2019 but we use only the most
recent data in our analysis where available
Given the large number of indicators being considered
we categorized these decision factors into two groups
mdash Primary Costs ndash Those that can be measured in cost
terms (dollars or percentage in the case of cost of
capital and tax rates) These cost factors are more
readily assessed and include expenses such as wages
utilities real estate costs and taxes
mdash Secondary Costs ndash Factors that impact overhead
costs and the facilityrsquos ability to operate efficiently
The secondary factors are typically related to the
business environment or the ease of doing business
For instance it takes into consideration the level of
transparency in business and government processes
legal protection of property rights and regulatory
burden
For Primary Cost factors the specific measures we
included are
mdash Labor costs ndash Hourly labor rates (including benefits)
mdash Utility costs ndash Energy costs
mdash Real estate costs ndash Lease costs for industriallogistics
locations
mdash Cost of capital ndash Borrowing interest rates
mdash Corporate tax rates
For Secondary Cost factors tied to the business
environment and infrastructure we considered a range
of indicators reflecting the quality of labor ease of doing
business infrastructure and risk and protections Table 1
on the following page summarizes the measures and cost
types considered
a BL MacCarthy and W Atthirawong ldquoFactors affecting location decisions in international operations ndash a Delphi studyrdquo International Journal of
Operations amp Production Management 2003
b C Manning M Rodriguez and Chinmoy Ghosh ldquoDevising a Corporate Facility Location Strategy to Maximize Shareholder Wealthrdquo Journal of
Real Estate Research 1999
c F Karakaya and C Canel Underlying dimensions of Business Location Decisions Industrial Management amp Data Systems 1998
d S Turhan BC Ozbag and B Cetin ldquoFactors Affecting Location Decisions of Food Processing Plants Journal of Applied Sciences 2007
e M Plaziak and AI Symanska Role of Modern Factors in the Process of Choosing a Location of the Enterprise
3 For a discussion of these factors see for example
copy 2020 KPMG LLP a Delaware limited liability partnership and a member firm of the KPMG global organization of independent member firms
affiliated with KPMG International Limited a private English company limited by guarantee All rights reserved The KPMG name and logo are
trademarks used under license by the independent member firms of the KPMG global organization NDP08974-1A
Measure Cost type Subcategory
1 Hourly compensation costs Primary -
2 Real estate costs Primary -
3 Utility costs Primary -
4 Corporate tax rates Primary -
5 Interest rates Primary -
6 Learning-adjusted years of schooling Secondary Quality of labor
7 Skill set of graduates Secondary Quality of labor
8 Real value added per employee Secondary Quality of labor
9 Days to start business Secondary Ease of doing business
10 Burden of government regulation Secondary Ease of doing business
11 Registering property Secondary Ease of doing business
12 Road quality index Secondary Infrastructure
13 Railroad quality Secondary Infrastructure
14 Airport connectivity Secondary Infrastructure
15 Liner shipping connectivity index Secondary Infrastructure
16 Electric power losses ( of output) Secondary Infrastructure
17 Exposure to unsafe drinking water Secondary Infrastructure
18 Reliability of water supply Secondary Infrastructure
19 Access to internetWi-Fi Secondary Infrastructure
20 Political risk Secondary Risk and protections
21 Enforcing contracts Secondary Risk and protections
22 Protecting minority investors Secondary Risk and protections
23 Corruption perception index Secondary Risk and protections
Based on these indicators we first developed separate indices one for the Primary Costs and another for
Secondary Costs and then combined the two to produce the CoDB Index an overall competitiveness index
We adopted this approach to produce one common index by which to rank the countries with respect to
CoDB while retaining the ability to explore how the Primary and Secondary Costs influenced the overall rank
Appendix A provides details on the sources from which the data on these measures were gathered
Table 1 Primary and secondary measures by subcategory
6Cost of manufacturing operations
around the globe
copy 2020 KPMG LLP a Delaware limited liability partnership and a member firm of the KPMG global organization of independent member firms
affiliated with KPMG International Limited a private English company limited by guarantee All rights reserved The KPMG name and logo are
trademarks used under license by the independent member firms of the KPMG global organization NDP08974-1A
Developing the indexSince we are evaluating 23 factorsmdashsome that impact a
manufacturing company operations in a country directly and
others more indirectlymdashit is challenging to draw cross-country
inferences by evaluating each separate CoDB factor Instead
we created a composite index that would jointly reflect the
information provided by the various individual measures We
recognize that such an index will subsume a significant range
of information across all the identified measures To provide
transparency and to allow further exploration to identify the
set of factors driving a countryrsquos index level (and rank) we
developed two indicesmdashone for the Primary Cost factors and
another for the Secondary Cost factors Subsequently we
combined them to generate an overall index (CoDB Index)
to benchmark country performance This allowed us to
analyze the relative importance of each set of factors to each
countryrsquos overall index score
As with any index the weighting placed on each component
is a key consideration Most studies that examine CoDB
factors tend to weight the key factors equally4 It did
not appear that one or some of the five Secondary Cost
categories we consideredmdashquality of labor ease of doing
business infrastructure and riskmdashstood out in importance
relative to the others Accordingly the assumption of equal
weighting appeared to be reasonable for all factors (see
Appendix D for a specific breakdown of the weights)
With respect to the Primary Cost factors namely labor utility
real estate costs interest rates and tax rates we evaluated
the need to place higher weight on labor given its perceived
importance as a factor in location decisions Specifically
we reviewed data on the contribution of labor costs to
manufacturing Analysis performed by Morgan Stanley
on the contribution to total costs of various components
indicates that for the manufacturing sector labor costs
account for approximately 16 percent of total manufacturing
costs in the US (and as high as 30 percent of total costs for
certain sectors such as electronics and apparel and as low
as 6ndash7 percent for sectors such as motor vehicles where
capital costs are much more significant)5 The 16 percent
weight indicated by this analysis is similar in magnitude to
the 20 percent weight that we use for labor under an equal
weighting approach In the absence of any clear indication
that pointed to an alternate weighting choice we assigned
equal weighting to the five primary factors6
4 For example the Brookings Institutionrsquos report Global manufacturing scorecard How the US compares to 18 other nations accessible at
httpswwwbrookingseduresearchglobal-manufacturing-scorecard-how-the-us-compares-to-18-other-nations
5 Morgan Stanley Analyst Report as cited in ldquoThe Cost Of Manufacturing StuffrdquoBusiness Insider May 2013
6 We recognize that there are alternate index weighting choices that could be adopted and that an alternate set of weights would likely yield
a different ranking on the overall index To allow the interested reader to alter the weights to reflect their facts and circumstances and
to explore sensitivity of results to these changes we have developed a Tableau visualization tool in conjunction with this study This tool
provides the ability to emphasize or deemphasize various cost factors and to visualize the impact of the changes on the CoDB Index rank
In summary we utilized the following weights presented when calculating index values for each country
Index weights
20
20
20
20
20
PrimaryCost Index
Hourly Compensation Costs
Real Estate Costs
Utility Costs
Corporate Tax Rates
Interest Rates
SecondaryCost Index
Quality of Labor
Ease of Doing Business
Infrastructure
Risk and Protections
25
2525
25
Primary Costs
Secondary Costs
CoDB Index 5050
copy 2020 KPMG LLP a Delaware limited liability partnership and a member firm of the KPMG global organization of independent member firms
affiliated with KPMG International Limited a private English company limited by guarantee All rights reserved The KPMG name and logo are
trademarks used under license by the independent member firms of the KPMG global organization NDP08974-1A
Table 3 Country ranking ndash CoDB Index
Source Cost of Manufacturing Operations Around the Globe KPMG LLP 2020
The application of the indexing methodology resulted in a ranking of countries as summarized
in Table 3 (based on score from 1ndash5 with 1 being the best and 5 being the worst)
Canada Taiwan and South Korea ranked as the top three countries on the CoDB Index
which equally weights Primary Costs factors and Secondary Cost factors The United
States ranked fifth among the 17 countries The country with the lowest rank was Brazil
with Japan Mexico Vietnam and India ranking just above
To understand the overall CoDB rankings based on the Primary Cost Index and the
Secondary Cost Index Table 4 (Primary Costs) and Table 5 (Secondary Costs) summarize
the rankings across the two subcategories of factors For Primary Costs unsurprisingly
for the most part Malaysia China Mexico and Vietnam are all tied for top position (ie
most competitive)
Results
Countries Ranking CoDB Index Score by Country (1=best 5=worst)
Canada 1 254
Taiwan 2 263
South Korea 3 265
Malaysia 4 267
United States 5 269
United Kingdom 6 269
Germany 7 274
Switzerland 8 277
Ireland 9 277
France 10 283
China 11 284
Italy 12 300
Japan 13 326
Mexico 14 333
Vietnam 15 346
India 16 349
Brazil 17 420
8Cost of manufacturing operations
around the globe
copy 2020 KPMG LLP a Delaware limited liability partnership and a member firm of the KPMG global organization of independent member firms
affiliated with KPMG International Limited a private English company limited by guarantee All rights reserved The KPMG name and logo are
trademarks used under license by the independent member firms of the KPMG global organization NDP08974-1A
From a review of the Primary and the Secondary Cost Indices it becomes apparent there are
different reasons why countries rank where they do on the CoDB Index Consider the case of
Canada which scored highest on the CoDB Index The primary driver of this rank is the fact that
Canada scored very highly on the Secondary Cost Index while maintaining a middle rank on the
Primary Cost Index The United Statesrsquo overall 5th place ranking is primarily driven by its score
on the Secondary Cost Index since it ranks 14th on the Primary Cost Index
Table 4 Country ranking ndash Primary Cost Index
Source Cost of Manufacturing Operations Around the Globe KPMG LLP 2020
Countries Ranking CoDB Primary Score Index by Country (1=best 5=worst)
Malaysia 1 240
China 1 240
Mexico 1 240
Vietnam 1 240
India 5 260
Canada 6 280
Taiwan 6 280
Italy 6 280
South Korea 9 300
Ireland 9 300
France 9 300
Germany 12 320
United Kingdom 13 320
United States 14 340
Switzerland 14 340
Brazil 16 360
Japan 17 400
copy 2020 KPMG LLP a Delaware limited liability partnership and a member firm of the KPMG global organization of independent member firms
affiliated with KPMG International Limited a private English company limited by guarantee All rights reserved The KPMG name and logo are
trademarks used under license by the independent member firms of the KPMG global organization NDP08974-1A
Table 5 Country ranking ndash Secondary Cost Index
Source Cost of Manufacturing Operations Around the Globe KPMG LLP 2020
In contrast the ranks of Malaysia and Taiwan on the CoDB
Index result from high scores on the Primary Cost Index
For instance Taiwan ranks second on the CoDB Index
despite a ranking of seventh on the Secondary Cost Index
Interestingly Chinarsquos middling score of 11 on the CoDB
Index despite being part of a four-way tie for first on the
primary factors is caused by its poor performance (rank of
13th) on the Secondary Cost Index Chinarsquos low score on
Secondary Cost Index arises primarily from higher operating
risks Overall it appears that countries that do well on
primary factors do less well on the secondary factors and
vice versa The clear exception appears to be Brazil which
ranks poorly on both indices
Primary Costs are clearly important to location decisions
To examine how the overall CoDB ranking may change
under an alternate set of weights we recomputed the
results placing a a greater consideration on Primary Costs
That is we re-ran our analysis changing the weight of
the Primary Costs and Secondary Costs from equal or 50
percentndash50 percent weighting to 70 percentndash30 percent
in favor of Primary Costs As presented in Table 6 not
surprisingly this caused Chinarsquos ranking on the CoDB Index
to move up significantly from 11th to 3rd and the US
ranking to decline from 5th to 12th However Canada
Malaysia and South Korea retained their top-five CoDB
rankings despite this change
Countries Ranking CoDB Secondary Index Score by Country (1=best 5=worst)
United States 1 197
Switzerland 2 213
United Kingdom 3 219
Canada 4 227
Germany 5 228
South Korea 6 229
Taiwan 7 247
Japan 8 252
Ireland 9 254
France 10 265
Malaysia 11 293
Italy 12 321
China 13 328
Mexico 14 426
India 15 438
Vietnam 16 451
Brazil 17 481
10Cost of manufacturing operations
around the globe
copy 2020 KPMG LLP a Delaware limited liability partnership and a member firm of the KPMG global organization of independent member firms
affiliated with KPMG International Limited a private English company limited by guarantee All rights reserved The KPMG name and logo are
trademarks used under license by the independent member firms of the KPMG global organization NDP08974-1A
Table 7 US ranking with higher weight on labor quality
Source Cost of Manufacturing Operations Around the Globe
KPMG LLP 2020
CountriesOverall ranking
Primary Cost
ranking
Secondary Cost
ranking
Ireland 1 9 2
Canada 2 6 5
Germany 3 12 4
United States 4 14 1
Switzerland 5 14 3
South Korea 6 9 6
7 We increase the weight on quality of labor to 70 percent in the Secondary Cost Index and equally weight the other
three measures at 10 percent each
8 The US tax rates used here are after tax reform
Understanding the results
Primary Cost Index
Table 8 Selected country Primary Cost percentile rankings (sorted by Primary Cost Index)
Source Cost of Manufacturing Operations Around the Globe KPMG
LLP 2020
To understand these results better we further examined the
constituents of the Primary and Secondary Cost Indices
To further understand the drivers of our findings we
examined which factors cause East Asian countries such as
Vietnam Taiwan and Malaysia to rank highly on the Primary
Cost Index and the US to rank 14 Table 8 to follow presents
constituent ranks for countries that rank highly on the Primary
Cost IndexmdashVietnam Taiwan Malaysia India China and
Mexicomdashand for the United States Note that the table
shows percentile ranks that is to say a percentile rank of 5
represents top 15 percentile of costs The percentile ranking
of 1 indicates the best performing in the category and the
percentile ranking of 5 indicates the worst performing in the
category (see Appendix D for additional details) As Table
8 indicates the differences are most stark with respect to
hourly compensation costs between US and other countries
CountryHourly
compensation costs
Real estate costs
Utility costs
Corporate tax rates
Interest rates
Malaysia 2 1 3 2 4
China 2 2 1 3 4
Mexico 1 1 1 4 5
Vietnam 1 4 1 2 4
India 1 1 2 4 5
Taiwan 3 4 2 2 3
United States
5 3 3 3 3
In terms of real estate costs and cost of capital the
United States is relatively competitive compared to the
Southeast Asian nations Among these countries only
India Malaysia and China had lower average costs for
industrial property than the US while only Taiwan had
a lower interest rate The US compares less favorably
to the Southeast Asian nations on the measures of utility
costs and corporate tax rates8 The US is tied with
Malaysia for the highest electricity costs among these
countries significantly higher than the average rate paid
by Chinese electricity users In terms of corporate tax
rates among this group only India and Mexico have higher
statutory tax rates at 30 percent compared to 27 percent
for the US
From a labor market perspective the quality of labor
available in the US is a strong asset However increasing
the weight of the quality of labor measure reveals that
there is also significant competition from European
countries and Canada in this regard For example as
presented in Table 7 increasing the weight on the
quality of labor to 70 percent from 25 percent within
the Secondary Cost Index (but maintaining equal weight
between Primary and Secondary Costs) causes Ireland
Germany and Switzerland to rise to the top five most
competitive countries with the US and Canada rising and
falling by one rank respectively7
Table 6 Country ranking with higher weight on Primary Costs
Source Cost of Manufacturing Operations Around the Globe
KPMG LLP 2020
CountriesCoDB Index
ranking
Primary Cost Index
ranking
Secondary Cost Index
ranking
Malaysia 1 1 11
Canada 2 6 4
China 3 1 13
Taiwan 4 6 7
South Korea 5 9 6
Ireland 6 9 9
copy 2020 KPMG LLP a Delaware limited liability partnership and a member firm of the KPMG global organization of independent member firms
affiliated with KPMG International Limited a private English company limited by guarantee All rights reserved The KPMG name and logo are
trademarks used under license by the independent member firms of the KPMG global organization NDP08974-1A
Table 9 Industrialized country Primary Cost percentile rankings (sorted by Primary Cost Index)
Source Cost of Manufacturing Operations Around the Globe
KPMG LLP 2020
CountryHourly
compensation costs
Real estate costs
Utility costs
Corporate tax rates
Interest rates
Canada 3 3 2 3 3
South
Korea3 3 3 3 3
United
Kingdom3 5 4 1 3
United States
5 3 3 3 3
Japan 3 5 5 5 2
The impact of tax reform
As part of this analysis we also examined if tax reform
had a material impact on the relative standing of the
US In particular we examined how the US would
have ranked had we used the pre-tax-reform corporate
tax rate of 40 percent (combined federal and state
average) instead of the post-tax-reform combined rate
of 27 percent
It is worth noting here that our analysis of the tax
input is limited to the statutory corporate rate only
We recognize that many other factors contribute to the
overall tax burden in any given jurisdiction ndash including
but not limited to the methodology of cost recovery
deductibility of debt service and the taxation of cross
border flows of income Those other factors which vary
from jurisdiction to jurisdiction were outside the scope
of this report Still we believe that use of the statutory
rate alone provides valid directional information even if
not necessarily the entire picture
As presented in Table 10 the tax reform improved the
USrsquos ranking not only on the corporate tax measure
but also on the Primary Cost Index and the CoDB Index
With tax reform the US was considered a median tax
country Had the US corporate tax rate continued to be
40 percent it would have one of the highest corporate
tax rates in the comparison group of countries The tax
reform resulted in the US ranking on the Primary Cost
Index to improve two notches from being 16th to 14th
out of the 17 countries The impact on the CoDB Index
score is even more significant with the US ranking
increasing from 11th place (considering pre-reform tax
rates) to 5th (after tax reform)
Ranking of the industrialized countries
Table 9 provides a comparison to some of the industrialized
countries relative to the US The table shows percentile
ranks that is to say a percentile rank of 5 represents
the top 15th percentile of costs (worst performing
from competitiveness standpoint) while a percentile
rank of 1 slots into the best performing in the category
(see Appendix D for additional details) We note that
even compared to the industrialized countries US
labor costs are high Hourly rates in Canada United
Kingdom and Japan range between $23 per hour and
$30 per hour compared to $39 per hour in the US With
respect to corporate tax rates where tax reform lowered
rates significantly the US rates are lower than Japan
comparable to Canada but still higher than that imposed
by the United Kingdom
12Cost of manufacturing operations
around the globe
copy 2020 KPMG LLP a Delaware limited liability partnership and a member firm of the KPMG global organization of independent member firms
affiliated with KPMG International Limited a private English company limited by guarantee All rights reserved The KPMG name and logo are
trademarks used under license by the independent member firms of the KPMG global organization NDP08974-1A
Secondary Cost Index
With respect to Secondary Cost factors the US clearly is in a strong position As Table 11 below
indicates (the countries sorted by their respective rank on the Secondary Cost Index) the US
scores are among the top three on almost all of the metrics including quality of labor transport
infrastructure and ease of doing business The scores below represent weighted averages of
percentile ranks for each measure considered under the category A score of one (1) is best while
five (5) is worst (see Appendix D for additional details)
Source Cost of Manufacturing Operations Around the Globe KPMG LLP 2020
Table 11 Secondary Index Cost factor scores (sorted by Secondary Cost Index)
CountriesQuality of labor score
Ease of doing business score
Infrastructure score10
Infrastructure ndash Transport score
Infrastructure ndash Utility score
Risk and protections score
United States 167 200 222 200 267 200
Switzerland 167 167 244 300 233 275
United Kingdom 267 233 225 275 300 150
Canada 233 233 242 325 300 200
Germany 167 267 228 250 233 250
South Korea 233 333 150 150 200 200
Taiwan 300 233 278 300 233 175
Japan 233 300 225 175 200 250
Ireland 133 300 358 475 300 225
France 267 300 269 275 233 225
Malaysia 333 233 306 250 367 300
Italy 333 300 350 350 300 300
China 367 233 364 225 367 350
Mexico 433 400 444 400 433 425
India 500 433 442 325 500 375
Vietnam 467 433 431 425 467 475
Brazil 500 500 447 475 467 475
9 Infrastructure score is a combined score across transportation utility and internet Details are shown for transportation and utility
subcomponents while internet access is not shown in the table but is included the combined score Each of these three factors
(transport utility and internet) get an equal weight
CountriesCurrent CoDB index rank
Pre-tax-reform CoDB index rank
Change in rankings due to US tax reform
Canada 1 1 0
Taiwan 2 2 0
South Korea 3 4 +1
Malaysia 4 5 +1
United States 5 11 +6
United Kingdom 6 6 0
Source Cost of Manufacturing Operations Around the Globe KPMG LLP 2020
Table 10 Impact of the US tax reform
copy 2020 KPMG LLP a Delaware limited liability partnership and a member firm of the KPMG global organization of independent member firms
affiliated with KPMG International Limited a private English company limited by guarantee All rights reserved The KPMG name and logo are
trademarks used under license by the independent member firms of the KPMG global organization NDP08974-1A
Source Cost of Manufacturing Operations Around the Globe
KPMG LLP 2020
Table 12 Percentile ranks for cost and quality of labor
On all of the secondary factors considered including quality
of labor the United States ranks significantly better than
countries that offer lower labor costs such as Vietnam
China Mexico and India To put it differently the low ranking
of these countries on the Secondary Cost Index reflects
the weaker investment climatemdashfor example the poorer
connectivity from limited road rail and airline networks more
challenging business operating environments and lower
levels of transparency in government operation and reduced
legal protections available to businesses
The industrialized countries generally rank favorably and
similarly across secondary metrics falling for the most part
in the top half of the countries Among them however
the US clearly ranks better with respect to at least two
factors the quality of labor and ease of doing business
Thus relative to the other 16 countries considered the
US ranks best on the Secondary Cost components
Labor ndash Cost and quality
As noted earlier compensation cost is often the most cited
factor for locating manufacturing facilities in Asian countries
such as China Taiwan or Vietnam As the data confirm these
countries do offer among the lowest hourly compensation
costs for labor Further the hourly compensation costs in the
US are among the highest in the world
As Table 12 shows a different picture emerges when
productivity attributes are considered in addition to the
quality of labor For example countries with the most
favorable cost attributes are not always the ones with the
highest real value added per employee In fact Table 12
suggests a high degree of positive correlation between
costs and productivity
Thus it would appear that for manufacturing activities that
are more routine in nature and require less advanced skills
where the loss of productivity may be outweighed by lower
costs companies may consider locating their manufacturing
facilities in lower costs countries such as China Vietnam
or Taiwan however in higher-value-added manufacturing
where the process is more complex or automated and
requires highly skilled labor to manage the United States
may be considered more favorably as a location
CountriesHourly
compensation costs
RVA per employee
Vietnam 1 5
India 1 5
Mexico 1 4
China 2 4
Malaysia 2 4
Brazil 2 5
Taiwan 3 3
South Korea 3 3
Japan 3 3
United Kingdom 3 2
Canada 3 3
Italy 4 3
Ireland 4 1
France 4 2
United States 5 1
Germany 5 2
Switzerland 5 1
14Cost of manufacturing operations
around the globe
copy 2020 KPMG LLP a Delaware limited liability partnership and a member firm of the KPMG global organization of independent member firms
affiliated with KPMG International Limited a private English company limited by guarantee All rights reserved The KPMG name and logo are
trademarks used under license by the independent member firms of the KPMG global organization NDP08974-1A
ConclusionsOur results indicate that countries that placed better on
the Secondary Cost Index generally performed better on
the overall rankings Of the top five most competitive
economies on the overall rankings only twomdashMalaysia and
Taiwanmdashhave a better primary than secondary cost score
In keeping with this trend of lower Secondary Cost
countries scoring better on the CoDB Index the United
States placed fifth on the CoDB Index despite being tied
with Switzerland for 14th on the Primary Cost Index This
high Primary Cost Index ranking was primarily due to high
labor costs The United States was able to compensate
somewhat for these unfavorable scores on the Primary
Cost Index by placing first in the Secondary Cost Index
As part of this analysis we also examined if tax reform had
a material impact on the relative standing of the US In
particular we compared how the US ranks now (post-tax-
reform combined federal and local tax rate of 27 percent)
relative to the pre-reform with a corporate tax rate of 40
percent (combined federal and state average) The impact
on the USrsquos CoDB Index ranking is quite significant After
tax reform the USrsquos competitiveness increasedmdashas
evidenced by its current rank of 5mdashcompared with its
previous rank of 11 under pre-reform tax rates
A closer look at the countries that outperformed the US
on the CoDB Index ranking indicates some interesting
factors For example the US outperformed all of the
countries on the Secondary Cost Index due to better labor
productivity and business conditions This implies that the
outperformance on the CoDB Index by Canada Taiwan
South Korea and Malaysia are all driven by Primary Cost
factors Specifically Canadarsquos rank is driven primarily by
its ability to offer lower compensation costs and slightly
lower electricity rates while still maintaining Secondary
Cost Index rankings that were not far behind the US
South Korea ranked third by offsetting weaker ranking on
the Secondary Cost Index with even lower compensation
costs A sharper version of the tradeoff between Primary
and Secondary Cost explains the rankings of Taiwan and
Malaysia with Taiwan offering higher primary costs but
lower secondary costs
This study has focused on certain CoDB factors that are
commonly considered in manufacturing facility location
decisionsmdashat the country levelmdashand the results provide a
high-level perspective on the attributes of various countries
with respect to these factors However the location
decision is specific to each company and its consideration
of the supply chain and access to markets The decision
may be impacted by the type of industry the company is
active in the type of product where customers are and
the companyrsquos overall business strategy Thus individual
location decisions are significantly more complex than we
can address in an analysis such as this
For instance for heavy equipment manufacturing from a
transportation point of view it may be better to locate the
facility closer to suppliers and the market whereas from a
production standpoint it may be more desirable to locate
the facility closer to where the desired type of workforce
or raw materials might be available Alternatively for a
specialized precision products manufacturing operation
the firmrsquos decision may be heavily impacted by the
availability of labor with advanced manufacturing skills In
other instances tax and operating incentives offered by a
country may be significant enough to outweigh weakness
on other dimensions As such the location decision is
often guided by unique factors that may go well beyond
those we have considered
Additionally even within the factors we have considered
the relative importance of these factors to a specific firm
may be different than the weights we have considered
Furthermore it may well be the case that the factors we
classify for the purpose of convenience as secondary
are in fact primary factors for consideration in a location
decision for an individual firm or manufacturing sector
Finally a number of local factors that go into firm location
decisions may or may not be captured in the country-
level analysis For example labor and rent costs are
higher in urban areas relative to more distant suburban
or rural areas Recognizing this we have developed a
Tableau analytic and visualization tool in conjunction with
this study that allows the interested reader to alter the
weights and to reassess the score based on the relative
importance of these factors to them Click here for the
Cost of Manufacturing Operations Tool We also note for
copy 2020 KPMG LLP a Delaware limited liability partnership and the US member firm of the KPMG network of independent
member firms affiliated with KPMG International Cooperative (ldquoKPMG Internationalrdquo) a Swiss entity All rights reserved The
KPMG name and logo are registered trademarks or trademarks of KPMG International NDP089741-1A
the reader that the Primary Cost factors
are measured in US dollars Since we
have compared costs on a US dollar
denominated basis our results are impacted
by the relative strength of the various
currencies relative to the dollar As the
foreign exchange rates fluctuate as they
inevitably will the cost measurements we
have relied on would vary and possibly
impact the ranking of individual cost
components even if local currency costs do
not change
Finally we note that the rankings are based
on the best historical information available
Such data is mostly available only with a lag
and therefore the impact of recent trade
disputes or the market disruptions from
COVID-19 are not reflected in the results
copy 2020 KPMG LLP a Delaware limited liability partnership and the US member firm of the KPMG network of independent
member firms affiliated with KPMG International Cooperative (ldquoKPMG Internationalrdquo) a Swiss entity All rights reserved
The KPMG name and logo are registered trademarks or trademarks of KPMG International NDP089741-1A
16Cost of manufacturing operations
around the globe
Appendix A Data sources
copy 2020 KPMG LLP a Delaware limited liability partnership and the US member firm of the KPMG network of independent
member firms affiliated with KPMG International Cooperative (ldquoKPMG Internationalrdquo) a Swiss entity All rights reserved
The KPMG name and logo are registered trademarks or trademarks of KPMG International NDP089741-1A
copy 2020 KPMG LLP a Delaware limited liability partnership and a member firm of the KPMG global organization of independent member firms
affiliated with KPMG International Limited a private English company limited by guarantee All rights reserved The KPMG name and logo are
trademarks used under license by the independent member firms of the KPMG global organization NDP08974-1A
As discussed previously we relied on a variety of sources
to gather data on 23 metrics that spanned Primary and
Secondary Cost factors
Primary Cost Index
The Conference Board is a well-known source of data for
economists While researching international labor costs
we noted two indicators related to the manufacturing
industry that we deemed useful for our study The first
is hourly compensation costs which is a sum of hourly
pay for time worked hourly direct benefits and hourly
social insurance expenditures and labor-related taxes
The Conference Board did not have this information for
Malaysia and Vietnam so we substituted the Economist
Intelligence Unitrsquos labor cost per hour (pay and nonpay
costs) figures for these two countries
Real estate cost data that is leasing cost per square foot
was compiled from a mix of sources We collected data
from real estate advisory firms and asset managers such
as Cushman amp Wakefield Colliers International CBRE
Group Deutsche Bank DWS and UBS
Utility costs measure the average price per kilowatt hour
of electricity paid by all businesses and households in each
country excluding taxes and tariffs These prices were
retrieved from each countryrsquos respective energy regulatory
agency website
Corporate tax rates were available through internal KPMG
sources The tax rates cited in this study reflect combined
statutory federal and provincial tax rates only and do not
account for specific tax incentives International Financial
Statistics provided interest rates for Brazil Canada China
India Malaysia Mexico South Korea Switzerland the
United States and Vietnam
Interest rate data for all economies except the Euro
area countries the United Kingdom Japan and Taiwan
were obtained from the International Monetary Fundrsquos
International Financial Statistics database Interest rates for
Taiwan were retrieved from the Taiwanese central bank
while rates for the remaining economies were retrieved
from the US Federal Reserve Economic Data (FRED)
database Interest rates obtained from the IMF reflect the
monetary policy-related interest rate while interest rates
obtained from all other sources measure the discount rate
Secondary Cost measures
Quality of labor
Outside of the Doing Business report the World Bank
Group provided two additional measures for our study
learning-adjusted years of schooling and access to
internetWi-Fi
Learning-adjusted years of schooling used in the quality
of labor aggregation gives us insight into how advanced
a workerrsquos skill set might be in different countries It is
calculated by multiplying the expected years of school by
the ratio of the most recent harmonized test score and to
advancement attainment on the Trends in International
Mathematics and Science Study (TIMSS) test (The World
Bank Group)11
The Global Competitiveness Index published by the
World Economic Forum included an assessment of the
skill set of graduates (secondary and university graduates)
from each country as captured by the WEFrsquos Executive
Opinion Survey It is included in the ldquoaccess to advanced
educationrdquo category Including this measure while
similar to the learning-adjusted years of schooling takes
into account how executives perceive the quality of the
labor force and allows us to consider the perspective of a
company operating in one of these countries
Real value added per employee is a crucial metric for
companies as it has a direct impact on profits It measures
how much value each additional employee is adding to
the industry For example real value added can increase
if new employees are bringing advanced skill sets into
the workforce We used total real value added from the
Conference Board as well as the total number of people
employed to calculate real value added per employee
The Conference Board did not have this information on
Malaysia and Vietnam so we found comparable variables
for real value added per employee from Malaysia and
Vietnam from separate sources
Ease of doing business
The World Bank Group annually publishes a report titled
Doing Business which ranks 190 countries based on
their ease of doing business This research involves
very detailed quantitative indicators and a few were
particularly valuable to our study We focused on the 2019
report observing the number of days to start a business
registering property enforcing contracts and protecting
minority investors indicators As noted by The World Bank
Group the number of days to start a business measures
how many days it takes for a ldquosmall- to medium-size
limited liability company to start up and formally operate
in each economyrsquos largest business cityrdquo This is the
only variable from the Doing Business report where we
did not look at the overall score for the category (starting
a business) we only observed the number of days For
the remaining three indicators we used the scores The
registering property score is based on ldquothe steps time
and cost involved in registering a property assuming
a standardized case of an entrepreneur who wants to
18Cost of manufacturing operations
around the globe
copy 2020 KPMG LLP a Delaware limited liability partnership and a member firm of the KPMG global organization of independent member firms
affiliated with KPMG International Limited a private English company limited by guarantee All rights reserved The KPMG name and logo are
trademarks used under license by the independent member firms of the KPMG global organization NDP08974-1A
purchase land and a building that is already registered
and free of title dispute In addition the score includes
the quality of the land administration system in each
economy The quality of land administration index has five
dimensions reliability of infrastructure transparency of
information geographic coverage land dispute resolution
and equal access to property rightsrdquo (The World Bank
Group) Number of days to start a business and registering
property along with burden of government regulation
were used in our ease of doing business aggregation
Burden of government regulation is another Executive
Opinion Survey question from the Global Competitiveness
Index It is a response to the survey question ldquoIn your
country how burdensome is it for companies to comply
with public administrationrsquos requirements (eg permits
regulations reporting)rdquo Respondents can choose
a number on a scale of 1 to 7 1 being ldquoextremely
burdensomerdquo and 7 being ldquonot burdensome at allrdquo
Infrastructure
The World Economic Forumrsquos (WEF) Global Competitiveness
Index (2018 Report) contains very useful indicators relating to
starting a business Based on the values or survey responses
for each variable each country is assigned a score from 1 to
100 (100 being the best) It is important to note that we used
these scores for our study not the direct values or survey
responses
The Global Competitiveness Index provides useful information
regarding a countryrsquos infrastructure We specifically look at
transportation infrastructure and utility infrastructure In this
report transportation infrastructure is addressed with eight
variables mdashfour are sourced from WEFrsquos Executive Opinion
Survey and four are based on statistics that they compiled
from external sources
Of these variables we used the survey-based figures to
measure road quality and railroad quality while we used the
external index figures from the International Air Transport
Association (IATA) and United Nations Conference on Trade
and Development to measure airport connectivity and liner
shipping connectivity respectively Index values were not
used for the road and railroad figures due to inconsistencies
with the WEF data when we attempted to reproduce the
WEFrsquos calculations for these measures
The road quality survey results capture the response to
the survey question ldquoIn your country what is the quality
(extensiveness and condition) of road infrastructure [1 =
extremely poor among the worst in the world 7 = extremely
good among the best in the world]rdquo Similarly railroad
quality captures the average response to the question ldquoIn
your country how efficient (ie frequency punctuality
speed price) are train transport services [1 = extremely
inefficient among the worst in the world 7 = extremely
efficient among the best in the world]rdquo Airport connectivity
represents ldquothe IATA airport connectivity indicator which
measures the degree of integration of a country within the
global air transport networkrdquo The Liner shipping connectivity
index ldquoassesses a countryrsquos connectivity to global shipping
networksrdquo and is based on ldquofive components of the maritime
transport sector the number of ships their container-carrying
capacity the maximum vessel size the number of services
and the number of companies that deploy container ships in a
countryrsquos portsrdquo (World Economic Forum)
For utility infrastructure we gathered electric power losses
exposure to unsafe drinking water and reliability of water
supply from the Global Competitiveness Index Electric power
losses which measures a countryrsquos electricity quality and
exposure to unsafe drinking water which takes into account
ldquothe extent of exposure by risk level and the severity of that
riskrsquos contribution to disease burdenrdquo are both based on
statistics that were compiled from external sources Reliability
of water supply is taken from the WEFrsquos Executive Opinion
Survey and answers the question ldquoIn your country how
reliable is the water supply (lack of interruptions and flow
fluctuations)rdquo Respondents can choose a number on a
scale of 1 to 7 1 being ldquoextremely unreliablerdquo and 7 being
ldquoextremely reliablerdquo As mentioned earlier the World Bank
Group provides us with our indicator access to internetWi-
Fi which is part of the overall infrastructure aggregation It
measures the percentage of the population that is using the
internet
Risk and protections
Our political risk data was sourced from the insurance
company Credendorsquos ldquoCountry Risks Synthetizing Chartrdquo
Countries are classified into seven categories (from 1 to 7)
reflecting the intensity of risks arising as a result of political
and assimilated events Category 1 includes those countries
for which the risk is considered the lowest and category 7
contains those countries with the highest likelihood of risks
being caused by political and assimilated events In our study
we chose to focus on political risk over medium- and long-
term periods
Enforcing contracts and protecting minority investors along
with political risk and the corruption perception index were
included in our risk and protections aggregation According
to the World Bank Group the enforcing contracts score
ldquomeasures the time and cost for resolving a commercial
dispute through a local first-instance court and the quality of
copy 2020 KPMG LLP a Delaware limited liability partnership and a member firm of the KPMG global organization of independent member firms
affiliated with KPMG International Limited a private English company limited by guarantee All rights reserved The KPMG name and logo are
trademarks used under license by the independent member firms of the KPMG global organization NDP08974-1A
Measure Country Source Source detail Year Link
Hourly Compensation Costs
All (except Malaysia and Vietnam)
The Conference Board
International Comparisons of Hourly Compensation Costs in Manufacturing
2016 httpwwwconference-boardorgilcprogramindexcfmid=38269
Hourly Compensation Costs
Malaysia and Vietnam
The Economist Intelligence Unit General Statistics Office of Vietnam and Department of Statistics Malaysia
Estimated Labor Cost per Hour Manufacturing
2016 Both httpdataeiucomEI UTableViewaspx initial=trueamppub type_id=1253181310
Vietnam
httpswwwgsogov vndefault_enaspx tabid=783
Malaysia
httpsnewssstatisticsgovmynewss-portalx epepDownloadContent SearchseamcontentId =54516ampactionMethod =ep2FepDownload ContentSearchxhtml 3AcontentActiondo DisplayContentampcid= 12789
Real Estate Costs
See Appendix E
Utility Costs China China Electricity Council
Analysis of National Electricity Market Transaction Information in the Fourth Quarter of 2018
2018 Adjusted to 2015 USD
httpwwwcecorgcnguihuayutongjidianligaige2019-03 -04189190html
Primary Cost measures ndash References
judicial processes index evaluating whether each economy
has adopted a series of good practices that promote
quality and efficiency in the court systemrdquo Protecting
minority investors focuses on ldquothe strength of minority
shareholder protections against misuse of corporate assets
by directors for their personal gain as well as shareholder
rights governance safeguards and corporate transparency
requirements that reduce the risk of abuserdquo (The World
Bank Group)
The WEFrsquos Global Competitiveness Index provided scores
for each country based on the Corruption Perception Index
2016 results This index measures ldquoperceptions of corruption
in the public sectorrdquo and is scaled from 0 (highly corrupt) to
100 (very clean) According to Transparency International
who created the index ldquoThe global average score is a
paltry 43 indicating endemic corruption in a countryrsquos public
sector Top-scoring countries are far outnumbered by [low-
scoring] countries where citizens face the tangible impact of
corruption on a daily basisrdquo
Specific data sources used and linked references are provided
below
20Cost of manufacturing operations
around the globe
copy 2020 KPMG LLP a Delaware limited liability partnership and a member firm of the KPMG global organization of independent member firms
affiliated with KPMG International Limited a private English company limited by guarantee All rights reserved The KPMG name and logo are
trademarks used under license by the independent member firms of the KPMG global organization NDP08974-1A
Measure Country Source Source detail Year Link
Utility Costs France Germany Ireland Italy and United Kingdom
Eurostat Electricity prices for nonhousehold consumers ndash biannual data
2015 httpappssoeurostateceuropaeunuishowdodataset=nrg_pc_205amplang=en
Utility Costs Canada Government of Canada ndash Canada Energy Regulator
Market Snapshot Explaining the high cost of power in northern Canada February 16 2017
2016 Adjusted to 2015 USD
The Canada Energy Regulator 2017 Reproduced with the permission of Public Works and Government Services 2020
Utility Costs Brazil Governo do Brasil
Anuaacuterio Estatiacutestico de Energia Eleacutetrica 2016
2015 httppateducacaobagovbrconteudosconteudos-digitaisdownload8667pdf
Utility Costs South Korea Korea Energy Statistical Information System
Average revenues per kWh sold by segments
2015 httpwwwkesisnetsubsubChartEngjspreport_id=34110ampreport Type=0
Utility Costs Malaysia Malaysia Energy Data and Research
Malaysia Energy Statistics Handbook 2018
2015 httpsmeihstgovmydocuments10620c7e69704-6f80-40ae-a764-ad0acf4a844d
Utility Costs India Power Finance Corporation Ltd (A Govt of India Undertaking)
The Performance of State Power Utilities for the years 2013ndash14 to 2015ndash16
2015 httpswwwpfcindiacomDocumentRepositoryckfinderfilesOperationsPerformance_Reports_of_State_Power_Utilities1_Report on the Performance of State Power Utilities 2013-14 to 2015-16pdf
Utility Costs Switzerland Swiss Office of Energy
Switzerland Utility Costs 2015 httpswwwbfeadminchbfedehomehtml
Utility Costs Taiwan Taiwan Bureau of Energy
Energy Statistical Annual Reports
2015 httpswwwmoeaboegovtwECWenglishcontentContentLinkaspxmenu_id=1540
Utility Costs Japan US Energy Information Administration ndash Independent Statistics and Analysis
Japanrsquos electricity prices rising or stable despite recent fuel cost changes
2015 httpswwweiagovtodayinenergydetailphpid=27872
copy 2020 KPMG LLP a Delaware limited liability partnership and a member firm of the KPMG global organization of independent member firms
affiliated with KPMG International Limited a private English company limited by guarantee All rights reserved The KPMG name and logo are
trademarks used under license by the independent member firms of the KPMG global organization NDP08974-1A
Measure Country Source Source detail Year Link
Utility Costs United States US Energy Information Administration ndash Independent Statistics and Analysis
Average retail price of electricity United States annual
2015 httpswwweiagov
electricitydatabrowser
topic7agg=01ampgeo=
gampendsec=vgamplinechart
=ELECPRICEUS-ALL
A~ELECPRICEUS-RES
A~ELECPRICEUS-COM
A~ELECPRICEUS-IND
Aampcolumnchart=ELEC
PRICE
US-ALLA~ELECPRICE
US-RESA~ELECPRICE
US-COMA~ELECPRICE
US-INDAampmap=ELEC
PRICEUS-ALLAampfreq=
Aampctype=linechartlt=rdquordquo
div=rdquordquo style=rdquobox-sizing
border-boxrdquogt
Utility Costs Mexico US Energy Information Administration ndash Independent Statistics and Analysis
Mexico electricity market reforms attempt to reduce costs and develop new capacity
2015 httpswwweiagovtodayinenergydetailphpid=26932
Utility Costs Vietnam Vietnam Electricity ndash EVN
Vietnam Electricity Annual Report 2016
2015 httpsenevncomvnuserfileUserhuongbttfiles20177AnnualReport2016pdf
Corporate Tax Rates
All KPMG Corporate tax rates table 2019 httpshomekpmgxxenhomeservicestaxtax-tools-and-resourcestax-rates-onlinecorporate-tax-rates-tablehtml
Interest Rates Euro Area India and Japan
Federal Reserve Economic Data (FRED)
Discount Rates (Euro Area India and Japan)
2018 httpsfredstlouisfedorg
Interest Rates Taiwan Central Bank of the Republic of China
Discount Rate (Taiwan) 2018 httpswwwcbcgovtwenlp-695-2html
Interest Rates United Kingdom Bank of England Discount Rate (UK) 2018 httpswwwbankofenglandcoukmonetary-policythe-interest-rate-bank-rate
Interest Rates All (except Euro Area the UK India Japan and Taiwan)
International Financial Statistics
Interest Rates and Monetary Policy-Related Interest Rate percent per annum
2018 httpsdataimforg sk=388DFA60-1D26- 4ADE-B505-A05A55 8D9A42amp sId=1479331931186
22Cost of manufacturing operations
around the globe
copy 2020 KPMG LLP a Delaware limited liability partnership and a member firm of the KPMG global organization of independent member firms
affiliated with KPMG International Limited a private English company limited by guarantee All rights reserved The KPMG name and logo are
trademarks used under license by the independent member firms of the KPMG global organization NDP08974-1A
Secondary Cost measures
Measure Country Source Source detail Years Link
Learning-
Adjusted Years
of Schooling
All The World Bank Learning-Adjusted
Years of Schooling
2017 httpstcdata360
worldbankorg
indicatorsh00280750
country=BRA
ampindicator
=40964ampviz=bar_
chartampyears=2017
Skill set of
Graduates
All (except China) World Economic
Forum
Global
Competitiveness
Index 2019
Weighted
Average 2018ndash
2019
httpstcdata360
worldbankorg
indicators
h00280750
country=
BRAampindicator=
40964ampviz=
bar_chartampyears=2017
httpreports
weforumorg
global-
competitiveness-
report-2018
China Weighted Average
2016ndash2017
RVA per
Employee
All The Conference
Board
International
Comparisons of
Manufacturing
Productivity and
Unit Labor Costs
2017 httpswww
conference-board
orgilcprogram
indexcfmid=42672
Number of
Days to Start a
Business
All The World Bank Doing Business
2019
2019 httpswww
doingbusinessorg
endata
Burden of
Government
Regulation
All (except China) World Economic
Forum
Global
Competitiveness
Index 2019
Weighted
Average of
2018ndash2019
httpreports
weforumorgglobal-
competitiveness-
report-2019China Weighted
Average of
2016ndash2017
Registering
Property
All The World Bank Doing Business
2019
2019 httpswww
doingbusinessorg
endata
Road Quality All (except China) World Economic
Forum
Global
Competitiveness
Index 2019
Weighted
Average of
2018ndash2019
httpreports
weforumorgglobal-
competitiveness-
report-2019China Weighted
Average of
2016ndash2017
copy 2020 KPMG LLP a Delaware limited liability partnership and a member firm of the KPMG global organization of independent member firms
affiliated with KPMG International Limited a private English company limited by guarantee All rights reserved The KPMG name and logo are
trademarks used under license by the independent member firms of the KPMG global organization NDP08974-1A
Measure Country Source Source detail Years Link
Railroad Quality All (except China) World Economic
Forum
Global
Competitiveness
Index 2019
Weighted
Average of
2018ndash2019
httpreports
weforumorgglobal-
competitiveness-
report-2019China Weighted
Average of
2016ndash2017
Airport
Connectivity
All World Economic
Forum
Global
Competitiveness
Index 2019
2018 httpreports
weforumorgglobal-
competitiveness-
report-2019
Liner Shipping
Connectivity
Index
AllWorld Economic
Forum
Global
Competitiveness
Index 2018
2018
httpreports
weforumorgglobal-
competitiveness-
report-2018
Electric Power
LossesAll
World Economic
Forum
Global
Competitiveness
Index 2018
2016
httpreports
weforumorgglobal-
competitiveness-
report-2018
Exposure to
Unsafe Drinking
Water
AllWorld Economic
Forum
Global
Competitiveness
Index 2018
2017
httpreports
weforumorgglobal-
competitiveness-
report-2018
Reliability of
Water Supply
All (except China)
World Economic
Forum
Global
Competitiveness
Index 2018
Weighted
Average
2018ndash2019httpreports
weforumorgglobal-
competitiveness-
report-2018China
Weighted
Average
2016ndash2017
Access to
InternetWi-Fi
France Germany
Ireland Italy
Malaysia
Mexico South
Korea UK
Vietnam Taiwan The World Bank
Individuals using
the Internet ( of
population)
2018 httpsdata
worldbank
orgindicator
ITNETUSER
ZSview=mapBrazil Canada
China India
Japan
Switzerland US
2017
Political Risk All CredendoCountry Risk and
Insights2019
24Cost of manufacturing operations
around the globe
copy 2020 KPMG LLP a Delaware limited liability partnership and a member firm of the KPMG global organization of independent member firms
affiliated with KPMG International Limited a private English company limited by guarantee All rights reserved The KPMG name and logo are
trademarks used under license by the independent member firms of the KPMG global organization NDP08974-1A
Measure Country Source Source detail Years Link
Corruption
Perception
Index
AllWorld Economic
Forum
Global
Competitiveness
Index 2018
2018
httpreports
weforumorgglobal-
competitiveness-
report-2018
Protecting
Minority
Investors
All The World BankDoing Business
20192019
httpswww
doingbusinessorg
endata
Enforcing
ContractsAll The World Bank
Doing Business
20192019
httpswww
doingbusinessorg
endata
Measure Country Source Source detail Years Link
Manufacturing
Value Added
All except Taiwan World Bank World Bank National
Accounts Data
2016 httpsdata
worldbankorg
indicatorNVIND
MANFCD
Manufacturing
Value Added
Taiwan The Conference
Board
International
Comparisons of
Manufacturing
Productivity and Unit
Labor Costs
2016 httpswww
conference-board
orgilcprogram
indexcfmid=42672
Manufacturing
Exports to the
US
All US Census
Bureau
Manufacturing Exports
(Customs Value)
2016 httpsusatrade
censusgov
Labor Share of
Manufacturing
Costs
United States Morgan Stanley
ndash As reported in
Business Insider
Chart of the Day The
Manufacturing Cost
Components For A
Bunch Of Different
Things
2013 httpswww
businessinsider
comchart-the-cost-
of-manufacturing-
stuff-2013-4
Trade-Weighted
US Dollar
Index
NA Federal Reserve
Bank of St Louis
Trade-Weighted US
Dollar Index Major
Currencies Goods
(Index Mar 1973=100
Monthly Not
Seasonally Adjusted)
2015ndash2019 httpsfred
stlouisfedorg
seriesTWEXMMTH
Other supporting data sources
copy 2020 KPMG LLP a Delaware limited liability partnership and the US member firm of the KPMG network of independent
member firms affiliated with KPMG International Cooperative (ldquoKPMG Internationalrdquo) a Swiss entity All rights reserved
The KPMG name and logo are registered trademarks or trademarks of KPMG International NDP089741-1A
copy 2020 KPMG LLP a Delaware limited liability partnership and a member firm of the KPMG global organization of independent member firms
affiliated with KPMG International Limited a private English company limited by guarantee All rights reserved The KPMG name and logo are
trademarks used under license by the independent member firms of the KPMG global organization NDP08974-1A26
Cost of manufacturing operations
around the globe
copy 2020 KPMG LLP a Delaware limited liability partnership and the US member firm of the KPMG network of independent
member firms affiliated with KPMG International Cooperative (ldquoKPMG Internationalrdquo) a Swiss entity All rights reserved
The KPMG name and logo are registered trademarks or trademarks of KPMG International NDP089741-1A
Appendix B Review of other studies
copy 2020 KPMG LLP a Delaware limited liability partnership and the US member firm of the KPMG network of independent
member firms affiliated with KPMG International Cooperative (ldquoKPMG Internationalrdquo) a Swiss entity All rights reserved
The KPMG name and logo are registered trademarks or trademarks of KPMG International NDP089741-1A
copy 2020 KPMG LLP a Delaware limited liability partnership and a member firm of the KPMG global organization of independent member firms
affiliated with KPMG International Limited a private English company limited by guarantee All rights reserved The KPMG name and logo are
trademarks used under license by the independent member firms of the KPMG global organization NDP08974-1A
While each companyrsquos location selection decision is
unique and reflects a range of factors various studies
have attempted to compare how companies would fare
if they considered alternate locations for their production
facilities For instance the Boston Consulting Group
performed a study in 2014 that examined the perception
that Latin America or Eastern Europe offered lower costs
of production than Western Europe the US or Japan
Based on a set of metrics such as manufacturing wages
labor productivity energy costs and exchange rates across
25 countries over time the study concluded that some of
the cost advantages of the lower-cost-base countries such
as Brazil and China have eroded over time10
The Congressional Research Service also performed a
study to assess the health of US manufacturing relative
to other countries in 201811 While focused primarily on
overall manufacturing trends in areas such as value added
by the manufacturing sector countriesrsquo share of global
manufacturing manufacturing employment and research
and development spending the study also compared
hourly costs in manufacturing across 14 countries
The study concluded that US labor costs are well above
those in emerging economies but similar in magnitude to
those in the major economies of continental Europe
Yet another study performed by the Brookings Institution
considered a broader range of indicators spanning topics
such as overall policies and regulations tax policy
energy transportation health costs workforce quality
and infrastructure and innovation across 19 countries12
This study however did not compare labor costs in
manufacturing Based on the scorecard developed by the
authors to assess the manufacturing environment the
study noted that countries that had made investments in
workforce and infrastructure such as the United Kingdom
Switzerland the United States Japan and Canada fared
much better than nations such as Brazil Indonesia
Mexico Russia India and China Our study takes a more
firm-centric approach We consider only the leading
manufacturing exporters to the US as our comparison
countries and consider a focus on primary costs including
labor and real estate
10 Boston Consulting Group ldquoThe Shifting Economics of Global Manufacturing How Cost Competitiveness is Changing Worldwiderdquo 2014
11 Congressional Research Service US Manufacturing in International Perspective February 21 2018
12 Brookings Institution Global Manufacturing Scorecard How the US Compares to 18 Other Nations 2018
28Cost of manufacturing operations
around the globe
copy 2020 KPMG LLP a Delaware limited liability partnership and the US member firm of the KPMG network of independent
member firms affiliated with KPMG International Cooperative (ldquoKPMG Internationalrdquo) a Swiss entity All rights reserved
The KPMG name and logo are registered trademarks or trademarks of KPMG International NDP089741-1A
Appendix C Shortlist of comparison countries
copy 2020 KPMG LLP a Delaware limited liability partnership and the US member firm of the KPMG network of independent
member firms affiliated with KPMG International Cooperative (ldquoKPMG Internationalrdquo) a Swiss entity All rights reserved
The KPMG name and logo are registered trademarks or trademarks of KPMG International NDP089741-1A
copy 2020 KPMG LLP a Delaware limited liability partnership and a member firm of the KPMG global organization of independent member firms
affiliated with KPMG International Limited a private English company limited by guarantee All rights reserved The KPMG name and logo are
trademarks used under license by the independent member firms of the KPMG global organization NDP08974-1A
Table 13 2016 global country rankings
Source US Census Bureau World Bank
This analysis considers a total of 16 economies in addition to the United States Table 13 lists each of
these economies as well as their respective rankings by manufacturing exports to the US and total
value added in manufacturing in 2016 Figure 2 presents the accompanying dollar value of manufacturing
exports for each economy to the US in 2016
These countries were first selected based on the customs value of manufacturing exports to the US
However the list generated on this basis did not include any countries from South America To make the
study more comprehensive Brazil the leading economy in South America with an industrial manufacturing
base in automotive aircraft and other sectors was added to the list
Country Manufacturing exports to US Total manufacturing value add
China 1 1
Mexico 2 12
Canada 3 16
Japan 4 3
Germany 5 4
Korea Rep 6 5
United Kingdom 7 9
Ireland 8 19
India 9 6
Italy 10 7
France 11 8
Vietnam 12 46
Taiwan 13 13
Malaysia 14 26
Switzerland 15 17
Brazil 18 10
copy 2020 KPMG LLP a Delaware limited liability partnership and the US member firm of the KPMG network of independent
member firms affiliated with KPMG International Cooperative (ldquoKPMG Internationalrdquo) a Swiss entity All rights reserved
The KPMG name and logo are registered trademarks or trademarks of KPMG International NDP089741-1A
30Cost of manufacturing operations
around the globe
copy 2020 KPMG LLP a Delaware limited liability partnership and a member firm of the KPMG global organization of independent member firms
affiliated with KPMG International Limited a private English company limited by guarantee All rights reserved The KPMG name and logo are
trademarks used under license by the independent member firms of the KPMG global organization NDP08974-1A
We note here that while we use exports to the US as a basis for selecting these countries the selected benchmark
countries generally rank highly when based on manufacturing output as well13 There is also a significant overlap between
these countries and those considered in other studies that we reviewed
13 US Census Bureau Manufacturing Exports (Customs Value) Accessible at httpsusatradecensusgov
Source US Census Bureau
Note that Canada data is as of 2015 and Taiwan does not contain World Bank data for any year
The global manufacturing output ranking from the World Bank source is also included for reference
Figure 1 2016 Total Manufacturing Exports to the US
Export
ing e
conom
y
Customs value (USD billions)
$500$450$400$350$300$250$200$150$100$50$0
Brazil $18
Switzerland $32
Malaysia $36
Taiwan $37
Vietnam $39
France $40
Italy $42
India $43
Ireland $43
UK $46
South Korea $68
Germany $107
Japan $128
$202Canada
$264Mexico
$454China
Appendix D Index methodology
copy 2020 KPMG LLP a Delaware limited liability partnership and a member firm of the KPMG global organization of independent
member firms affiliated with KPMG International Limited a private English company limited by guarantee All rights reserved
The KPMG name and logo are trademarks used under license by the independent member firms of the KPMG global
organization NDP08974-1A
32Cost of manufacturing operations
around the globe
copy 2020 KPMG LLP a Delaware limited liability partnership and a member firm of the KPMG global organization of independent member firms
affiliated with KPMG International Limited a private English company limited by guarantee All rights reserved The KPMG name and logo are
trademarks used under license by the independent member firms of the KPMG global organization NDP08974-1A
We use 23 metrics to develop an overall weight of the country The metrics are further segregated into Primary
and Secondary Costs The Primary Costs consist of five subcategories of costs and the Secondary Costs
consisted of an additional four subcategories (with a varying number of metrics for each category for a total of
18 categories)
The Primary and Secondary Cost Indices are equally weighted at 50 percent each and each subcategory within
these two broad categories was also equally weighted The weighting for each individual factor however varies as
the number of factors consider for each metric variesmdashthus the five Primary Costs have 20 percent weight each
for an overall ranking weight of 10 percent (50 percent20 percent) while the secondary factors have 25 percent
weight each Quality of labor for example has three metrics associated with it with each metric weighted at 42
percent (approximately 50 percent25 percent13) The table below shows the final weights for each metric
Figure 2 Weights by measure category
Table 14 Final weights in overall ranking by metric
Measure Cost type SubcategoryOverall ranking weight
1 Hourly compensation costs Primary 100
2 Real estate costs Primary 100
3 Utility costs Primary 100
4 Corporate tax rates Primary 100
5 Interest rates Primary 100
6 Learning-adjusted years of schooling Secondary Quality of Labor 42
7 Skill set of graduates Secondary Quality of Labor 42
8 Real value added per employee Secondary Quality of Labor 42
9 Days to start business Secondary Ease of Doing Business 42
10 Burden of government regulation Secondary Ease of Doing Business 42
11 Registering property Secondary Ease of Doing Business 42
12 Road quality index Secondary Infrastructure 10
13 Railroad quality Secondary Infrastructure 10
14 Airport connectivity Secondary Infrastructure 10
20
20
20
20
20
PrimaryCost Index
Hourly Compensation Costs
Real Estate Costs
Utility Costs
Corporate Tax Rates
Interest Rates
SecondaryCost Index
Quality of Labor
Ease of Doing Business
Infrastructure
Risk and Protections
25
2525
25
Primary Costs
Secondary Costs
CoDB Index 5050
Table 15 Percentile rankings by metric
Measure Cost type SubcategoryOverall ranking weight
15 Liner shipping connectivity index Secondary Infrastructure 10
16 Electric power losses ( of output) Secondary Infrastructure 14
17 Exposure to unsafe drinking water Secondary Infrastructure 14
18 Reliability of water supply Secondary Infrastructure 14
19 Access to internetWi-fi Secondary Infrastructure 42
20 Political risk Secondary Risk and Protections 31
21 Enforcing contracts Secondary Risk and Protections 31
22 Protecting minority investors Secondary Risk and Protections 31
23 Corruption perception index Secondary Risk and Protections 31
In addition to the weights assigned for each metric the
methodology for developing the index consisted of the
following steps
mdash Performance on each metric is ranked using a
percentile-based methodology The top (or bottom from
an operating cost perspective based on the metric) 15
percent receives the highest rank and the lowest (or
highest) 15 percent receives a rank of 5 Ranks for real
estate costs are shown below as an example Thus the
cheapest or lowest 15 percentile of real estate costs is
rank 1 percentiles between the 15 and 35 percentiles
receive a rank of 2 and so on This is further illustrated
in the table below
mdash The final scores are calculated by applying the
appropriate weights for each metric first at the
subcategory level and combined (using weight
multiplied by the rank) with the Primary and Secondary
Cost scores and ultimately to the overall score
The scores are then ranked for ease of display and
comparison
Real estate costs
Ranking From To
1 000 1499
2 1500 3499
3 3500 6499
4 6500 8499
5 8500 10000
copy 2020 KPMG LLP a Delaware limited liability partnership and the US member firm of the KPMG network of independent member firms
affiliated with KPMG International Cooperative (ldquoKPMG Internationalrdquo) a Swiss entity All rights reserved The KPMG name and logo are
registered trademarks or trademarks of KPMG International NDP089741-1A
34Cost of manufacturing operations
around the globe
Appendix E Real estate data sources in various cities
copy 2020 KPMG LLP a Delaware limited liability partnership and the US member firm of the KPMG network of independent
member firms affiliated with KPMG International Cooperative (ldquoKPMG Internationalrdquo) a Swiss entity All rights reserved
The KPMG name and logo are registered trademarks or trademarks of KPMG International NDP089741-1A
copy 2020 KPMG LLP a Delaware limited liability partnership and a member firm of the KPMG global organization of independent member firms
affiliated with KPMG International Limited a private English company limited by guarantee All rights reserved The KPMG name and logo are
trademarks used under license by the independent member firms of the KPMG global organization NDP08974-1A
Country City Property type Source Link
Brazil Santa Cruz
Campo
Grande
Industrial Cushman amp Wakefield
Industrial Marketbeat
Q2 2019 Brazil
Industrial Report
httpswwwcushmanwakefieldcomen
brazilinsightsbrazil-marketbeats
Brazil Satildeo Paulo Industrial Cushman amp Wakefield
Industrial Marketbeat
Q2 2019 Brazil
Industrial Report
Brazil Rio de
Janeiro
Industrial Cushman amp Wakefield
Industrial Marketbeat
Q2 2019 Brazil
Industrial Report
Canada Calgary Industrial Cushman amp Wakefield
Industrial Marketbeat
Q2 2019 Canada
Industrial Report
httpswwwcushmanwakefieldcomen
canadainsightscanada-marketbeats
Canada Ottawa Industrial Cushman amp Wakefield
Industrial Marketbeat
Q2 2019 Canada
Industrial Report
Canada Toronto Industrial Cushman amp Wakefield
Industrial Marketbeat
Q2 2019 Canada
Industrial Report
China Chengdu Logistics Colliers Quarterly
Logistics Research
Chengdu-Chonqing Q1
2019
httpswwwcollierscom-media
filesmarketresearchapacchina
southwestchina-researchwestchina-
logistics-q1-2019-enpdfla=en-GB
China Beijing Logistics Colliers Quarterly
Industrial Beijing-
Tianjin-Langeang Q1
2018
httpswwwcollierscom-mediafiles
marketresearchapacchinanorthchina-
researchbj-tj-lf-industrial-q1-2018
pdfla=en-GB
China Tianjin Logistics Colliers Quarterly
Industrial Beijing-
Tianjin-Langeang Q1
2018
France Paris Industrial and
Logistics
Cushman amp Wakefield
Industrial Market
Snapshot Q2 2019
France
httpswwwcushmanwakefieldcomen
franceinsightsfrance-marketbeat
France Lyon Industrial and
Logistics
Cushman amp Wakefield
Industrial Market
Snapshot Q2 2019
France
36Cost of manufacturing operations
around the globe
copy 2020 KPMG LLP a Delaware limited liability partnership and a member firm of the KPMG global organization of independent member firms
affiliated with KPMG International Limited a private English company limited by guarantee All rights reserved The KPMG name and logo are
trademarks used under license by the independent member firms of the KPMG global organization NDP08974-1A
Country City Property type Source Link
France Marseille Industrial and
Logistics
Cushman amp Wakefield
Industrial Market
Snapshot Q2 2019
France
httpswwwcushmanwakefieldcomen
franceinsightsfrance-marketbeat
France Bordeaux Industrial and
Logistics
Cushman amp Wakefield
Industrial Market
Snapshot Q2 2019
France
France Strasbourg Industrial and
Logistics
Cushman amp Wakefield
Industrial Market
Snapshot Q2 2019
France
France Lille Industrial and
Logistics
Cushman amp Wakefield
Industrial Market
Snapshot Q2 2019
France
France Toulouse Industrial and
Logistics
Cushman amp Wakefield
Industrial Market
Snapshot Q2 2019
France
Germany Berlin Industrial and
Logistics
Colliers Industrial and
Logistics Markets
Overview Germany
20182019
httpswwwcolliersdewp-
contentuploads201906
ColliersResearchMarket-Report-
IL20182019englpdf
Germany Dusseldorf Industrial and
Logistics
Colliers Industrial and
Logistics Markets
Overview Germany
20182019
Germany Frankfurt Industrial and
Logistics
Colliers Industrial and
Logistics Markets
Overview Germany
20182019
Germany Hamburg Industrial and
Logistics
Colliers Industrial and
Logistics Markets
Overview Germany
20182019
Germany Cologne Industrial and
Logistics
Colliers Industrial and
Logistics Markets
Overview Germany
20182019
Germany Leipzig Industrial and
Logistics
Colliers Industrial and
Logistics Markets
Overview Germany
20182019
copy 2020 KPMG LLP a Delaware limited liability partnership and a member firm of the KPMG global organization of independent member firms
affiliated with KPMG International Limited a private English company limited by guarantee All rights reserved The KPMG name and logo are
trademarks used under license by the independent member firms of the KPMG global organization NDP08974-1A
Country City Property type Source Link
Germany Munich Industrial and
Logistics
Colliers Industrial and
Logistics Markets
Overview Germany
20182019
httpswwwcolliersdewp-
contentuploads201906
ColliersResearchMarket-Report-
IL20182019englpdf
Germany Stuttgart Industrial and
Logistics
Colliers Industrial and
Logistics Markets
Overview Germany
20182019
India Delhi Industrial Cushman amp Wakefield
Industrial Marketbeat
Q4 2018 Delhi
Industrial Report
httpswwwcushmanwakefieldcomen
indiainsightsdelhi-ncr-marketbeat
India Mumbai Industrial Cushman amp Wakefield
Industrial Marketbeat
Q4 2018 Mumbai
Industrial Report
httpswwwcushmanwakefieldcomen
indiainsightsmumbai-marketbeat
Ireland Dublin Logistics Cushman amp Wakefield
Industrial Marketbeat
Q1 2019 Ireland
Industrial Report
httpswwwcushmanwakefieldcomen
irelandinsightsireland-marketbeat
Ireland Cork Logistics Cushman amp Wakefield
Industrial Marketbeat
Q1 2019 Ireland
Industrial Report
Ireland Galway Logistics Cushman amp Wakefield
Industrial Marketbeat
Q1 2019 Ireland
Industrial Report
Italy Rome Logistics CBRE Italy Logistics
MarketView Q4 2019
httpswwwcbredeenresearchItaly-
Logistics-MarketView-Q4-2019
Italy Milan Logistics CBRE Italy Logistics
MarketView Q4 2019
Italy Bologna Logistics CBRE Italy Logistics
MarketView Q4 2019
Japan Osaka Logistics CBRE Japan Real
Estate Market Outlook
2019
httpswwwcbrecomresearch-and-
reportsJapan-Real-Estate-Market-
Outlook-2019
Japan Nagoya Logistics CBRE Japan Real
Estate Market Outlook
2019
38Cost of manufacturing operations
around the globe
copy 2020 KPMG LLP a Delaware limited liability partnership and a member firm of the KPMG global organization of independent member firms
affiliated with KPMG International Limited a private English company limited by guarantee All rights reserved The KPMG name and logo are
trademarks used under license by the independent member firms of the KPMG global organization NDP08974-1A
Country City Property type Source Link
Malaysia Klang Valley Industrial CBRE Malaysia Real
Estate Market Outlook
2019
httpswwwcbrecomreport-
downloadPUBID=44c7f5c6-5dbe-4a76-
a335-ff80e9c57a79
Malaysia Penang Industrial CBRE Malaysia Real
Estate Market Outlook
2019
Malaysia Iskandar
Malaysia
Industrial CBRE Malaysia Real
Estate Market Outlook
2019
Malaysia Kuching Industrial CBRE Malaysia Real
Estate Market Outlook
2019
Mexico Mexico Industrial CBRE Mexico Industrial
Market Outlook Q2 2019
httpswwwcbrecommxenresearch-
and-reports
South Korea Greater
Seoul
Logistics DWS Market Outlook
2018
httpswwwdwscomglobalassets
institutionalresearchpdfsDWS_South_
Korea_Real_Estate_Market_Outlook_
April_2018pdf
Switzerland Industrial UBS Real Estate Focus
2019
httpsfiabciorguploadsswiss-real-
estate-focus-2019-enpdf
Taiwan Neihu
District
Taipei
Industrial Colliers Radar
Industrial Taiwan
August 2019
httpswwwcollierscom-media
filesapactaiwanother20
reports2019radarreport-enpdfla=en-
GBTaiwan Nangang
Taipei
Industrial Colliers Radar
Industrial Taiwan
August 2019
Taiwan Xizhi New
Taipei City
Industrial Colliers Radar
Industrial Taiwan
August 2019
Taiwan Jhonghe
New Taipei
City
Industrial Colliers Radar
Industrial Taiwan
August 2019
Taiwan Xindien New
Taipei City
Industrial Colliers Radar
Industrial Taiwan
August 2019
Taiwan Sanchong
New Taipei
City
Industrial Colliers Radar
Industrial Taiwan
August 2019
Taiwan Xinchuang
New Taipei
City
Industrial Colliers Radar
Industrial Taiwan
August 2019
Taiwan Tucheng
New Taipei
City
Industrial Colliers Radar
Industrial Taiwan
August 2019
copy 2020 KPMG LLP a Delaware limited liability partnership and a member firm of the KPMG global organization of independent member firms
affiliated with KPMG International Limited a private English company limited by guarantee All rights reserved The KPMG name and logo are
trademarks used under license by the independent member firms of the KPMG global organization NDP08974-1A
Country City Property type Source Link
United
Kingdom
London
(Heathrow)
Logistics Cushman amp Wakefield
Industrial Market
Snapshot Q2 2019 UK
httpswwwcushmanwakefieldcomen
united-kingdominsightsuk-marketbeat
United
Kingdom
Manchester Logistics Cushman amp Wakefield
Industrial Market
Snapshot Q2 2019 UK
United
Kingdom
Birmingham Logistics Cushman amp Wakefield
Industrial Market
Snapshot Q2 2019 UK
United
States
Boston Industrial Cushman amp Wakefield
US Industrial
Marketbeat Q2 2019
httpswwwcushmanwakefieldcomen
united-statesinsightsus-marketbeats
us-industrial-marketbeat
United
States
Omaha Industrial Cushman amp Wakefield
US Industrial
Marketbeat Q2 2019
United
States
Detroit Industrial Cushman amp Wakefield
US Industrial
Marketbeat Q2 2019
Vietnam Ho Chi Minh
City
Industrial CBRE Vietnam
Marketview Q2 2018
httpwwwcbrevietnam
comuseful=cbre-vietnam-
marketview-q2-2018Vietnam Long An Industrial CBRE Vietnam
Marketview Q2 2018
Vietnam Dong Nai Industrial CBRE Vietnam
Marketview Q2 2018
Vietnam Binh Duong Industrial CBRE Vietnam
Marketview Q2 2018
Vietnam Hanoi Industrial Colliers Vietnam Real
Estate Quarterly
Knowledge Report Q1
2019
httpswwwcollierscom-mediafiles
apacvietnampdfvietnam-quarterly-
knowledge-report-q1-2019-en-1
pdfla=en-GB
40Cost of manufacturing operations
around the globe
copy 2020 KPMG LLP a Delaware limited liability partnership and the US member firm of the KPMG network of independent
member firms affiliated with KPMG International Cooperative (ldquoKPMG Internationalrdquo) a Swiss entity All rights reserved
The KPMG name and logo are registered trademarks or trademarks of KPMG International NDP089741-1A
copy 2020 KPMG LLP a Delaware limited liability partnership and a member firm of the KPMG global organization of independent member firms
affiliated with KPMG International Limited a private English company limited by guarantee All rights reserved The KPMG name and logo are
trademarks used under license by the independent member firms of the KPMG global organization NDP08974-1A
Cost of manufacturing operations
around the globe
Contact usErkan ErdemPrincipalKPMG ndash National Tax Industry Leader for Public Sector and Economic and Statistical ConsultingT 703-286-8188
E erkanerdemkpmgcom
Oommen ThomasManaging DirectorKPMG ndash Economic and Statistical ConsultingT 415-963-8125
E oommenthomaskpmgcom
Talha MuhammadManagerKPMG ndash Economic and Statistical ConsultingT 212-909-5401
E talhamuhammadkpmgcom
Brian HecklerPartnerKPMG ndash National Sector Leader for Industrial ManufacturingT 312-665-2693
E bhecklerkpmgcom
Ulrich Schmidt Principal KPMG - Global Location amp Expansion Services T 267-256-2786 E ulrichschmidtkpmgcom
Carolyn LeeExecutive DirectorThe Manufacturing InstituteT 202-637-3079
E cleenamorg
The following information is not intended to be ldquowritten advice concerning one or more Federal tax mattersrdquo subject to the requirements of section 1037(a)(2)
of Treasury Department Circular 230
The information contained herein is of a general nature and based on authorities that are subject to change Applicability of the information to specific situations
should be determined through consultation with your tax adviser
copy 2020 KPMG LLP a Delaware limited liability partnership and a member firm of the KPMG global organization of independent member firms affiliated with
KPMG International Limited a private English company limited by guarantee All rights reserved The KPMG name and logo are trademarks used under license
by the independent member firms of the KPMG global organization NDP08974-1A
kpmgcomsocialmedia
The authors gratefully acknowledge excellent research assistance provided by Andrew Bent and
Kristina Kohl Tableau visualizations created by Konul Riegel and technical support provided by Ian Flick

copy 2020 KPMG LLP a Delaware limited liability partnership and a member firm of the KPMG global organization of independent member firms
affiliated with KPMG International Limited a private English company limited by guarantee All rights reserved The KPMG name and logo are
trademarks used under license by the independent member firms of the KPMG global organization NDP08974-1A
GlossaryTerm Definition
Access to internet
Wi-Fi
The percentage of each countrys population that has used the internet within the last three
months
Airport connectivityThe International Air Transportation Authoritys (IATA) airport connectivity indicator which
measures the degree of integration of a country within the global air transport network
Burden of
government
regulation
The burden of government regulation as measured by business executives response to
the question ldquoIn your country how burdensome is it for companies to comply with public
administrationrsquos requirements (eg permits regulations reporting)rdquo
CoDBCost of Doing Business (CoDB) refers to the direct and indirect costs incurred by businesses
engaged in manufacturing operations
Corporate tax ratesStatutory corporate tax rates including federal and provincial tax rates but excluding tax
incentives for certain types of businesses
Corruption
perception index
A measure of experts and business peoples perceptions of corruption in the public sector
including both the frequency and magnitude of corrupt behaviors as well as the strength of
anticorruption measures
Days to start
business
The number of days it takes for a small- to medium-size limited liability company to start up and
formally operate in each economyrsquos largest business city as calculated by the World Bank
Electric power
losses ( of
output)
Measures the percentage of a countrys energy output that is lost in transmission and
distribution
Enforcing contracts
A measure of the time and cost for resolving a commercial dispute through a local first-instance
court and the quality of judicial processes index evaluating whether each economy has adopted
a series of good practices that promote quality and efficiency in the court system
Exposure to unsafe
drinking water The risk-weighted percentage of the population exposed to unsafe drinking water
Hourly
compensation
costs
The average price firms must pay for an hour of an employees labor including hourly pay for
time worked hourly direct benefits and hourly social insurance expenditures and labor-related
taxes
Interest ratesThe monetary policy-related interest rates reported by the IMF for each country Discount rates
were used where monetary-policy interest rates were not available from the IMF
Learning-adjusted
years of schooling
The expected years of schooling for all residents multiplied by the countrys relative scoring on
international tests such as PISA or TIMSS
Liner shipping
connectivity index
A measure of each countryrsquos connectivity to global shipping networks based on five components
of the maritime transport sector the number of ships their container-carrying capacity the
maximum vessel size the number of services and the number of companies that deploy
container ships in a countryrsquos ports
copy 2020 KPMG LLP a Delaware limited liability partnership and a member firm of the KPMG global organization of independent member firms
affiliated with KPMG International Limited a private English company limited by guarantee All rights reserved The KPMG name and logo are
trademarks used under license by the independent member firms of the KPMG global organization NDP08974-1A
Term Definition
Political riskMeasures the likelihood of a risk caused by political and assimilated events connected to cross-
border transactions with a risk horizon beyond one year
Primary costsCosts that directly affect a firms bottom line and can be easily expressed in dollars These cost
factors include expenses such as wages utilities real estate costs and taxes
Protecting minority
investors
A measure of the strength of minority shareholder protections against misuse of corporate
assets by directors for their personal gain as well as shareholder rights governance safeguards
and corporate transparency requirements that reduce the risk of abuse
Railroad qualityThe quality of railroads as measured by business executives response to the question ldquoIn your
country how efficient (ie frequency punctuality speed price) are train transport servicesrdquo
Real estate costs The average monthly rent per square foot for industrial properties in each country
Real value added
per employee
The net output of the manufacturing sector after adding up all outputs and subtracting
intermediate inputs divided by the number of workers employed by the manufacturing sector
(including part-time and self-employed employees)
Registering
property
A measure of the steps time and cost involved in registering a property assuming a
standardized case of an entrepreneur who wants to purchase land and a building that is already
registered and free of title dispute
Reliability of water
supply
The reliability of the water supply as measured by business executives response to the
question ldquoIn your country how reliable is the water supply (lack of interruptions and flow
fluctuations)rdquo
Road quality indexThe quality of roadways as measured by business executives response to the question ldquoIn your
country what is the quality (extensiveness and condition) of road infrastructurerdquo
Secondary costsFactors that impact overhead costs and the firmrsquos ability to operate efficiently The secondary
factors are typically related to the business environment or the ease of doing business
Skill set of
graduates
The skill set of graduates as measured by business executives response to the question ldquoIn
your country to what extent do graduating students from secondary education possess the
skills needed by businessesrdquo and ldquoIn your country to what extent do graduating students from
university possess the skills needed by businessesrdquo
MIThe Manufacturing Institute is the research and education partner of the National Association of
Manufacturers a trade group for manufacturers in the United States
Utility costsThe average price per kilowatt-hour (converted to USD) of electricity paid by all businesses and
households in each country excluding taxes and tariffs
5Cost of manufacturing operations
around the globe
copy 2020 KPMG LLP a Delaware limited liability partnership and a member firm of the KPMG global organization of independent member firms
affiliated with KPMG International Limited a private English company limited by guarantee All rights reserved The KPMG name and logo are
trademarks used under license by the independent member firms of the KPMG global organization NDP08974-1A
The competitiveness of the manufacturing sector in the
United States has been discussed extensively in the press
and economic literature in recent years This joint study
by KPMG and the Manufacturing Institute (MI) provides a
current assessment of how the US compares to its main
trading partners as a location for manufacturing
Specifically this study compares the primary and
secondary factors that impact the cost of operations (Cost
of Doing Business or CoDB) of a business conducting
manufacturing operations in the United States relative to
16 other countries that are leading manufacturing exporters
to the US These 17 economies together account for
about four-fifths of global value added in manufacturing
and thus a comparative analysis across countries provides
insight into how regional economic factors may affect the
global competitive landscape in manufacturing1
Our approach examines different cost factors including
costs that directly impact a firmrsquos bottom line (Primary
Costs) and costs that typically impact a firmrsquos operating
costs and profits more indirectly (Secondary Costs)
Executive summary
Some of our key findings consist of the following
mdash Secondary Cost Index performance is a strong predictor of overall CoDB Index rank For a given country
performing well on the Secondary Cost Index generally correlates with performing well on the CoDB Index rankings
ndash Manufacturers in the US face higher Primary Costs relative to other countries particularly labor costs This is
reflected in a Primary Cost score of 340 a score that is 157 percent higher than the average score of the
other manufacturing locations that are considered in this study and translates to a ranking of 14 out of a total
of 17 on the Primary Cost Index
ndash However strong performance on Secondary Costs for the US such as the quality of labor and superior
business conditions results in the US being ranked fifth on the overall CoDB Index
mdash Labor Quality is a differentiating factor for the US Examining the results from a labor market perspective it is
notable that the USrsquos strength in labor quality allows it to be a strong competitive contender Increasing the importance
(ie 25 to 70 in the Secondary Cost Index) of the quality of labor component improves the US ranking by one from
fifth to fourth place However there is significant competition from European countries in this regard The higher weight
on the quality of labor component also causes Ireland Germany and Switzerland to jump to the top five on the overall
CoDB Index ranking
mdash US tax reform has a material impact on US CoDB Index ranking As part of this analysis we also examined if the
recent US tax reform had a material impact on the relative standing of the United States In particular we compared
how the US would have ranked had we used the pre-reform corporate tax rate of 40 percent (combined federal and
state tax rate) instead of the post-tax-reform corporate rate of 27 percent The impact of the reform on the CoDB Index
ranking for the US is quite significant The ranking of the US on the CoDB Index improved from 11th to 5th
1World Bank Manufacturing Value Added Accessible at httpsdataworldbankorgindicatorNVINDMANFCD
copy 2020 KPMG LLP a Delaware limited liability partnership and a member firm of the KPMG global organization of independent member firms
affiliated with KPMG International Limited a private English company limited by guarantee All rights reserved The KPMG name and logo are
trademarks used under license by the independent member firms of the KPMG global organization NDP08974-1A
We collected data on 23 measures and then quantitatively
evaluated each country based on these measures to develop
an overall CoDB index (CoDB Index) to assess the economyrsquos
competitiveness as a manufacturing hub The components of
the CoDB Index in turn consist of an index of Primary Costs
(Primary Cost Index) that includes factors such as labor costs
real estate costs costs of financing (as measured by interest
rates) and utility costs as well as an index of Secondary Costs
(Secondary Cost Index) made up of 18 measures grouped
into four main areas quality of labor ease of doing business
infrastructure and risk
We note that this study and our conclusions are based
on certain CoDB factors that are commonly considered in
manufacturing facility location decisions and the results provide
a high-level perspective on the attributes of various countries
with respect to these factors However the location decision
is specific to each company and its consideration of additional
factors such as industry type of product supply chain access
to consumer markets and the companyrsquos overall business
strategy It is therefore important to recognize that an individual
location decision of a company may involve more factors and
considerations than we have evaluated in this analysis
Finally we note that while we have used the most recently
available data on the cost factors such data is available only
with a lag As such the rankings are based on the best historical
information available and as a consequence the impact of
recent trade disputes or the market disruptions from COVID-19
are not reflected in the results
254
263
265
267
269
269
274
277
277
283
284
300
326
333
346
349
420
Canada
Taiwan
South Korea
Malaysia
United States
United Kingdom
Germany
Switzerland
Ireland
France
China
Italy
Japan
Mexico
Vietnam
India
Brazil
CoDB Index Score by Country (1=best5=worst)
Source Cost of Manufacturing Operations Around the Globe KPMG LLP 2020
Cost of manufacturing operations
around the globe2
Where to locate a production facility is an important
strategic decision for a manufacturing company The
location decision can have a long-term impact on
performance The selection of a particular site (or country)
requires more than just an assessment of labor costs It
requires the consideration of multiple factors including
the cost of setting up the facility real estate costs energy
costs the quality of the labor force and infrastructure
the regulatory environment and intellectual property
protections
In 2011 MI published a cost of doing business study
(the MI Report)2 The MI Report compared the cost of
production in the United States and nine major trading
partners Canada China France Germany Japan South
Korea Mexico Taiwan and the United Kingdom The study
examined the ldquorawrdquo cost of production based on wage
costs relative to value added in manufacturing and a variety
of other ldquostructuralrdquo costs of doing business in each
country including corporate tax rates employee benefits
tort litigation regulatory compliance and energy The study
noted that unlike in previous years manufacturers in the
US faced lower ldquoraw costsrdquo (ie wage compensation
relative to total valued added in manufacturing) than its
trading partners Specifically raw costs faced by US
manufacturers were about 9 percent lower than the
trade-weighted average of its nine largest trading partners
However the study noted that this advantage was entirely
offset by the higher structural costs (ie corporate tax
rates employee benefit costs tort litigation regulatory
compliance and energy) with US manufacturing costs
(on a trade-weighted basis) being about 9 percent higher
than that of its nine largest trading partners
This study seeks to update the MI Report by
mdash Including more recent data
mdash Considering additional indicators of the cost of doing
business
mdash Expanding the comparison to seven additional
countries Brazil Ireland Italy India Malaysia
Switzerland and Vietnam
Introduction
2 The Manufacturing Institute and the Manufacturers Alliance for
Productivity and Innovation 2011 Report on the Structural Cost of
US Manufacturing 2011copy 2020 KPMG LLP a Delaware limited liability partnership and a member firm of the KPMG
global organization of independent member firms affiliated with KPMG International Limited a
private English company limited by guarantee All rights reserved The KPMG name and logo are
trademarks used under license by the independent member firms of the KPMG global organization
NDP08974-1A
copy 2020 KPMG LLP a Delaware limited liability partnership and the US member firm of the KPMG network of independent
member firms affiliated with KPMG International Cooperative (ldquoKPMG Internationalrdquo) a Swiss entity All rights reserved
The KPMG name and logo are registered trademarks or trademarks of KPMG International NDP089741-1A
Cost of manufacturing operations
around the globe
copy 2020 KPMG LLP a Delaware limited liability partnership and a member firm of the KPMG global organization of independent member firms
affiliated with KPMG International Limited a private English company limited by guarantee All rights reserved The KPMG name and logo are
trademarks used under license by the independent member firms of the KPMG global organization NDP08974-1A4
copy 2020 KPMG LLP a Delaware limited liability partnership and a member firm of the KPMG global organization of independent member firms
affiliated with KPMG International Limited a private English company limited by guarantee All rights reserved The KPMG name and logo are
trademarks used under license by the independent member firms of the KPMG global organization NDP08974-1A
What are the ldquoCosts of Doing Businessrdquo
Companies consider a variety of CoDB factors when
evaluating their international manufacturing location
decisions Our study considers the factors evaluated
by companies at the country level and seeks to
incorporate these into country-level rankings A countryrsquos
competitiveness is often judged by the cost of labor
and an often cited motivation for moving manufacturing
offshore (relative to higher-cost countries like the US) is
the desire to gain access to low labor costs and to lower
the cost of production Studies however have indicated
that a range of other factors go into the location selection
decision3 The leading factors identified in the literature
that contribute to the location decision are
1 Availability of skilled labor
2 Cost and productivity of labor
3 Availability of and proximity to transportation
infrastructure
4 Tax rates
5 Regulatory environment
6 Real estate costs
7 Availability and cost of power communications water
and other utilities
8 Access to and cost of capital
9 Transparency in government and business practices
and ease of doing business
10 Politically and economically stable environment with
ability to enforce legal and property rights
We compiled data on each of these factors directly or
through proxy measures over the 2012 to 2019 time
period for the 17 countries (see Appendix A for details)
The selection of specific categories of costs to compare
were guided by the surveys and studies we reviewed (see
Appendix A for details) We note here that data for every
cost element was not available for every country or not
available for a recent time period Thus the cost types
analyzed are those that could be obtained from public
sources spanning 2012ndash2019 but we use only the most
recent data in our analysis where available
Given the large number of indicators being considered
we categorized these decision factors into two groups
mdash Primary Costs ndash Those that can be measured in cost
terms (dollars or percentage in the case of cost of
capital and tax rates) These cost factors are more
readily assessed and include expenses such as wages
utilities real estate costs and taxes
mdash Secondary Costs ndash Factors that impact overhead
costs and the facilityrsquos ability to operate efficiently
The secondary factors are typically related to the
business environment or the ease of doing business
For instance it takes into consideration the level of
transparency in business and government processes
legal protection of property rights and regulatory
burden
For Primary Cost factors the specific measures we
included are
mdash Labor costs ndash Hourly labor rates (including benefits)
mdash Utility costs ndash Energy costs
mdash Real estate costs ndash Lease costs for industriallogistics
locations
mdash Cost of capital ndash Borrowing interest rates
mdash Corporate tax rates
For Secondary Cost factors tied to the business
environment and infrastructure we considered a range
of indicators reflecting the quality of labor ease of doing
business infrastructure and risk and protections Table 1
on the following page summarizes the measures and cost
types considered
a BL MacCarthy and W Atthirawong ldquoFactors affecting location decisions in international operations ndash a Delphi studyrdquo International Journal of
Operations amp Production Management 2003
b C Manning M Rodriguez and Chinmoy Ghosh ldquoDevising a Corporate Facility Location Strategy to Maximize Shareholder Wealthrdquo Journal of
Real Estate Research 1999
c F Karakaya and C Canel Underlying dimensions of Business Location Decisions Industrial Management amp Data Systems 1998
d S Turhan BC Ozbag and B Cetin ldquoFactors Affecting Location Decisions of Food Processing Plants Journal of Applied Sciences 2007
e M Plaziak and AI Symanska Role of Modern Factors in the Process of Choosing a Location of the Enterprise
3 For a discussion of these factors see for example
copy 2020 KPMG LLP a Delaware limited liability partnership and a member firm of the KPMG global organization of independent member firms
affiliated with KPMG International Limited a private English company limited by guarantee All rights reserved The KPMG name and logo are
trademarks used under license by the independent member firms of the KPMG global organization NDP08974-1A
Measure Cost type Subcategory
1 Hourly compensation costs Primary -
2 Real estate costs Primary -
3 Utility costs Primary -
4 Corporate tax rates Primary -
5 Interest rates Primary -
6 Learning-adjusted years of schooling Secondary Quality of labor
7 Skill set of graduates Secondary Quality of labor
8 Real value added per employee Secondary Quality of labor
9 Days to start business Secondary Ease of doing business
10 Burden of government regulation Secondary Ease of doing business
11 Registering property Secondary Ease of doing business
12 Road quality index Secondary Infrastructure
13 Railroad quality Secondary Infrastructure
14 Airport connectivity Secondary Infrastructure
15 Liner shipping connectivity index Secondary Infrastructure
16 Electric power losses ( of output) Secondary Infrastructure
17 Exposure to unsafe drinking water Secondary Infrastructure
18 Reliability of water supply Secondary Infrastructure
19 Access to internetWi-Fi Secondary Infrastructure
20 Political risk Secondary Risk and protections
21 Enforcing contracts Secondary Risk and protections
22 Protecting minority investors Secondary Risk and protections
23 Corruption perception index Secondary Risk and protections
Based on these indicators we first developed separate indices one for the Primary Costs and another for
Secondary Costs and then combined the two to produce the CoDB Index an overall competitiveness index
We adopted this approach to produce one common index by which to rank the countries with respect to
CoDB while retaining the ability to explore how the Primary and Secondary Costs influenced the overall rank
Appendix A provides details on the sources from which the data on these measures were gathered
Table 1 Primary and secondary measures by subcategory
6Cost of manufacturing operations
around the globe
copy 2020 KPMG LLP a Delaware limited liability partnership and a member firm of the KPMG global organization of independent member firms
affiliated with KPMG International Limited a private English company limited by guarantee All rights reserved The KPMG name and logo are
trademarks used under license by the independent member firms of the KPMG global organization NDP08974-1A
Developing the indexSince we are evaluating 23 factorsmdashsome that impact a
manufacturing company operations in a country directly and
others more indirectlymdashit is challenging to draw cross-country
inferences by evaluating each separate CoDB factor Instead
we created a composite index that would jointly reflect the
information provided by the various individual measures We
recognize that such an index will subsume a significant range
of information across all the identified measures To provide
transparency and to allow further exploration to identify the
set of factors driving a countryrsquos index level (and rank) we
developed two indicesmdashone for the Primary Cost factors and
another for the Secondary Cost factors Subsequently we
combined them to generate an overall index (CoDB Index)
to benchmark country performance This allowed us to
analyze the relative importance of each set of factors to each
countryrsquos overall index score
As with any index the weighting placed on each component
is a key consideration Most studies that examine CoDB
factors tend to weight the key factors equally4 It did
not appear that one or some of the five Secondary Cost
categories we consideredmdashquality of labor ease of doing
business infrastructure and riskmdashstood out in importance
relative to the others Accordingly the assumption of equal
weighting appeared to be reasonable for all factors (see
Appendix D for a specific breakdown of the weights)
With respect to the Primary Cost factors namely labor utility
real estate costs interest rates and tax rates we evaluated
the need to place higher weight on labor given its perceived
importance as a factor in location decisions Specifically
we reviewed data on the contribution of labor costs to
manufacturing Analysis performed by Morgan Stanley
on the contribution to total costs of various components
indicates that for the manufacturing sector labor costs
account for approximately 16 percent of total manufacturing
costs in the US (and as high as 30 percent of total costs for
certain sectors such as electronics and apparel and as low
as 6ndash7 percent for sectors such as motor vehicles where
capital costs are much more significant)5 The 16 percent
weight indicated by this analysis is similar in magnitude to
the 20 percent weight that we use for labor under an equal
weighting approach In the absence of any clear indication
that pointed to an alternate weighting choice we assigned
equal weighting to the five primary factors6
4 For example the Brookings Institutionrsquos report Global manufacturing scorecard How the US compares to 18 other nations accessible at
httpswwwbrookingseduresearchglobal-manufacturing-scorecard-how-the-us-compares-to-18-other-nations
5 Morgan Stanley Analyst Report as cited in ldquoThe Cost Of Manufacturing StuffrdquoBusiness Insider May 2013
6 We recognize that there are alternate index weighting choices that could be adopted and that an alternate set of weights would likely yield
a different ranking on the overall index To allow the interested reader to alter the weights to reflect their facts and circumstances and
to explore sensitivity of results to these changes we have developed a Tableau visualization tool in conjunction with this study This tool
provides the ability to emphasize or deemphasize various cost factors and to visualize the impact of the changes on the CoDB Index rank
In summary we utilized the following weights presented when calculating index values for each country
Index weights
20
20
20
20
20
PrimaryCost Index
Hourly Compensation Costs
Real Estate Costs
Utility Costs
Corporate Tax Rates
Interest Rates
SecondaryCost Index
Quality of Labor
Ease of Doing Business
Infrastructure
Risk and Protections
25
2525
25
Primary Costs
Secondary Costs
CoDB Index 5050
copy 2020 KPMG LLP a Delaware limited liability partnership and a member firm of the KPMG global organization of independent member firms
affiliated with KPMG International Limited a private English company limited by guarantee All rights reserved The KPMG name and logo are
trademarks used under license by the independent member firms of the KPMG global organization NDP08974-1A
Table 3 Country ranking ndash CoDB Index
Source Cost of Manufacturing Operations Around the Globe KPMG LLP 2020
The application of the indexing methodology resulted in a ranking of countries as summarized
in Table 3 (based on score from 1ndash5 with 1 being the best and 5 being the worst)
Canada Taiwan and South Korea ranked as the top three countries on the CoDB Index
which equally weights Primary Costs factors and Secondary Cost factors The United
States ranked fifth among the 17 countries The country with the lowest rank was Brazil
with Japan Mexico Vietnam and India ranking just above
To understand the overall CoDB rankings based on the Primary Cost Index and the
Secondary Cost Index Table 4 (Primary Costs) and Table 5 (Secondary Costs) summarize
the rankings across the two subcategories of factors For Primary Costs unsurprisingly
for the most part Malaysia China Mexico and Vietnam are all tied for top position (ie
most competitive)
Results
Countries Ranking CoDB Index Score by Country (1=best 5=worst)
Canada 1 254
Taiwan 2 263
South Korea 3 265
Malaysia 4 267
United States 5 269
United Kingdom 6 269
Germany 7 274
Switzerland 8 277
Ireland 9 277
France 10 283
China 11 284
Italy 12 300
Japan 13 326
Mexico 14 333
Vietnam 15 346
India 16 349
Brazil 17 420
8Cost of manufacturing operations
around the globe
copy 2020 KPMG LLP a Delaware limited liability partnership and a member firm of the KPMG global organization of independent member firms
affiliated with KPMG International Limited a private English company limited by guarantee All rights reserved The KPMG name and logo are
trademarks used under license by the independent member firms of the KPMG global organization NDP08974-1A
From a review of the Primary and the Secondary Cost Indices it becomes apparent there are
different reasons why countries rank where they do on the CoDB Index Consider the case of
Canada which scored highest on the CoDB Index The primary driver of this rank is the fact that
Canada scored very highly on the Secondary Cost Index while maintaining a middle rank on the
Primary Cost Index The United Statesrsquo overall 5th place ranking is primarily driven by its score
on the Secondary Cost Index since it ranks 14th on the Primary Cost Index
Table 4 Country ranking ndash Primary Cost Index
Source Cost of Manufacturing Operations Around the Globe KPMG LLP 2020
Countries Ranking CoDB Primary Score Index by Country (1=best 5=worst)
Malaysia 1 240
China 1 240
Mexico 1 240
Vietnam 1 240
India 5 260
Canada 6 280
Taiwan 6 280
Italy 6 280
South Korea 9 300
Ireland 9 300
France 9 300
Germany 12 320
United Kingdom 13 320
United States 14 340
Switzerland 14 340
Brazil 16 360
Japan 17 400
copy 2020 KPMG LLP a Delaware limited liability partnership and a member firm of the KPMG global organization of independent member firms
affiliated with KPMG International Limited a private English company limited by guarantee All rights reserved The KPMG name and logo are
trademarks used under license by the independent member firms of the KPMG global organization NDP08974-1A
Table 5 Country ranking ndash Secondary Cost Index
Source Cost of Manufacturing Operations Around the Globe KPMG LLP 2020
In contrast the ranks of Malaysia and Taiwan on the CoDB
Index result from high scores on the Primary Cost Index
For instance Taiwan ranks second on the CoDB Index
despite a ranking of seventh on the Secondary Cost Index
Interestingly Chinarsquos middling score of 11 on the CoDB
Index despite being part of a four-way tie for first on the
primary factors is caused by its poor performance (rank of
13th) on the Secondary Cost Index Chinarsquos low score on
Secondary Cost Index arises primarily from higher operating
risks Overall it appears that countries that do well on
primary factors do less well on the secondary factors and
vice versa The clear exception appears to be Brazil which
ranks poorly on both indices
Primary Costs are clearly important to location decisions
To examine how the overall CoDB ranking may change
under an alternate set of weights we recomputed the
results placing a a greater consideration on Primary Costs
That is we re-ran our analysis changing the weight of
the Primary Costs and Secondary Costs from equal or 50
percentndash50 percent weighting to 70 percentndash30 percent
in favor of Primary Costs As presented in Table 6 not
surprisingly this caused Chinarsquos ranking on the CoDB Index
to move up significantly from 11th to 3rd and the US
ranking to decline from 5th to 12th However Canada
Malaysia and South Korea retained their top-five CoDB
rankings despite this change
Countries Ranking CoDB Secondary Index Score by Country (1=best 5=worst)
United States 1 197
Switzerland 2 213
United Kingdom 3 219
Canada 4 227
Germany 5 228
South Korea 6 229
Taiwan 7 247
Japan 8 252
Ireland 9 254
France 10 265
Malaysia 11 293
Italy 12 321
China 13 328
Mexico 14 426
India 15 438
Vietnam 16 451
Brazil 17 481
10Cost of manufacturing operations
around the globe
copy 2020 KPMG LLP a Delaware limited liability partnership and a member firm of the KPMG global organization of independent member firms
affiliated with KPMG International Limited a private English company limited by guarantee All rights reserved The KPMG name and logo are
trademarks used under license by the independent member firms of the KPMG global organization NDP08974-1A
Table 7 US ranking with higher weight on labor quality
Source Cost of Manufacturing Operations Around the Globe
KPMG LLP 2020
CountriesOverall ranking
Primary Cost
ranking
Secondary Cost
ranking
Ireland 1 9 2
Canada 2 6 5
Germany 3 12 4
United States 4 14 1
Switzerland 5 14 3
South Korea 6 9 6
7 We increase the weight on quality of labor to 70 percent in the Secondary Cost Index and equally weight the other
three measures at 10 percent each
8 The US tax rates used here are after tax reform
Understanding the results
Primary Cost Index
Table 8 Selected country Primary Cost percentile rankings (sorted by Primary Cost Index)
Source Cost of Manufacturing Operations Around the Globe KPMG
LLP 2020
To understand these results better we further examined the
constituents of the Primary and Secondary Cost Indices
To further understand the drivers of our findings we
examined which factors cause East Asian countries such as
Vietnam Taiwan and Malaysia to rank highly on the Primary
Cost Index and the US to rank 14 Table 8 to follow presents
constituent ranks for countries that rank highly on the Primary
Cost IndexmdashVietnam Taiwan Malaysia India China and
Mexicomdashand for the United States Note that the table
shows percentile ranks that is to say a percentile rank of 5
represents top 15 percentile of costs The percentile ranking
of 1 indicates the best performing in the category and the
percentile ranking of 5 indicates the worst performing in the
category (see Appendix D for additional details) As Table
8 indicates the differences are most stark with respect to
hourly compensation costs between US and other countries
CountryHourly
compensation costs
Real estate costs
Utility costs
Corporate tax rates
Interest rates
Malaysia 2 1 3 2 4
China 2 2 1 3 4
Mexico 1 1 1 4 5
Vietnam 1 4 1 2 4
India 1 1 2 4 5
Taiwan 3 4 2 2 3
United States
5 3 3 3 3
In terms of real estate costs and cost of capital the
United States is relatively competitive compared to the
Southeast Asian nations Among these countries only
India Malaysia and China had lower average costs for
industrial property than the US while only Taiwan had
a lower interest rate The US compares less favorably
to the Southeast Asian nations on the measures of utility
costs and corporate tax rates8 The US is tied with
Malaysia for the highest electricity costs among these
countries significantly higher than the average rate paid
by Chinese electricity users In terms of corporate tax
rates among this group only India and Mexico have higher
statutory tax rates at 30 percent compared to 27 percent
for the US
From a labor market perspective the quality of labor
available in the US is a strong asset However increasing
the weight of the quality of labor measure reveals that
there is also significant competition from European
countries and Canada in this regard For example as
presented in Table 7 increasing the weight on the
quality of labor to 70 percent from 25 percent within
the Secondary Cost Index (but maintaining equal weight
between Primary and Secondary Costs) causes Ireland
Germany and Switzerland to rise to the top five most
competitive countries with the US and Canada rising and
falling by one rank respectively7
Table 6 Country ranking with higher weight on Primary Costs
Source Cost of Manufacturing Operations Around the Globe
KPMG LLP 2020
CountriesCoDB Index
ranking
Primary Cost Index
ranking
Secondary Cost Index
ranking
Malaysia 1 1 11
Canada 2 6 4
China 3 1 13
Taiwan 4 6 7
South Korea 5 9 6
Ireland 6 9 9
copy 2020 KPMG LLP a Delaware limited liability partnership and a member firm of the KPMG global organization of independent member firms
affiliated with KPMG International Limited a private English company limited by guarantee All rights reserved The KPMG name and logo are
trademarks used under license by the independent member firms of the KPMG global organization NDP08974-1A
Table 9 Industrialized country Primary Cost percentile rankings (sorted by Primary Cost Index)
Source Cost of Manufacturing Operations Around the Globe
KPMG LLP 2020
CountryHourly
compensation costs
Real estate costs
Utility costs
Corporate tax rates
Interest rates
Canada 3 3 2 3 3
South
Korea3 3 3 3 3
United
Kingdom3 5 4 1 3
United States
5 3 3 3 3
Japan 3 5 5 5 2
The impact of tax reform
As part of this analysis we also examined if tax reform
had a material impact on the relative standing of the
US In particular we examined how the US would
have ranked had we used the pre-tax-reform corporate
tax rate of 40 percent (combined federal and state
average) instead of the post-tax-reform combined rate
of 27 percent
It is worth noting here that our analysis of the tax
input is limited to the statutory corporate rate only
We recognize that many other factors contribute to the
overall tax burden in any given jurisdiction ndash including
but not limited to the methodology of cost recovery
deductibility of debt service and the taxation of cross
border flows of income Those other factors which vary
from jurisdiction to jurisdiction were outside the scope
of this report Still we believe that use of the statutory
rate alone provides valid directional information even if
not necessarily the entire picture
As presented in Table 10 the tax reform improved the
USrsquos ranking not only on the corporate tax measure
but also on the Primary Cost Index and the CoDB Index
With tax reform the US was considered a median tax
country Had the US corporate tax rate continued to be
40 percent it would have one of the highest corporate
tax rates in the comparison group of countries The tax
reform resulted in the US ranking on the Primary Cost
Index to improve two notches from being 16th to 14th
out of the 17 countries The impact on the CoDB Index
score is even more significant with the US ranking
increasing from 11th place (considering pre-reform tax
rates) to 5th (after tax reform)
Ranking of the industrialized countries
Table 9 provides a comparison to some of the industrialized
countries relative to the US The table shows percentile
ranks that is to say a percentile rank of 5 represents
the top 15th percentile of costs (worst performing
from competitiveness standpoint) while a percentile
rank of 1 slots into the best performing in the category
(see Appendix D for additional details) We note that
even compared to the industrialized countries US
labor costs are high Hourly rates in Canada United
Kingdom and Japan range between $23 per hour and
$30 per hour compared to $39 per hour in the US With
respect to corporate tax rates where tax reform lowered
rates significantly the US rates are lower than Japan
comparable to Canada but still higher than that imposed
by the United Kingdom
12Cost of manufacturing operations
around the globe
copy 2020 KPMG LLP a Delaware limited liability partnership and a member firm of the KPMG global organization of independent member firms
affiliated with KPMG International Limited a private English company limited by guarantee All rights reserved The KPMG name and logo are
trademarks used under license by the independent member firms of the KPMG global organization NDP08974-1A
Secondary Cost Index
With respect to Secondary Cost factors the US clearly is in a strong position As Table 11 below
indicates (the countries sorted by their respective rank on the Secondary Cost Index) the US
scores are among the top three on almost all of the metrics including quality of labor transport
infrastructure and ease of doing business The scores below represent weighted averages of
percentile ranks for each measure considered under the category A score of one (1) is best while
five (5) is worst (see Appendix D for additional details)
Source Cost of Manufacturing Operations Around the Globe KPMG LLP 2020
Table 11 Secondary Index Cost factor scores (sorted by Secondary Cost Index)
CountriesQuality of labor score
Ease of doing business score
Infrastructure score10
Infrastructure ndash Transport score
Infrastructure ndash Utility score
Risk and protections score
United States 167 200 222 200 267 200
Switzerland 167 167 244 300 233 275
United Kingdom 267 233 225 275 300 150
Canada 233 233 242 325 300 200
Germany 167 267 228 250 233 250
South Korea 233 333 150 150 200 200
Taiwan 300 233 278 300 233 175
Japan 233 300 225 175 200 250
Ireland 133 300 358 475 300 225
France 267 300 269 275 233 225
Malaysia 333 233 306 250 367 300
Italy 333 300 350 350 300 300
China 367 233 364 225 367 350
Mexico 433 400 444 400 433 425
India 500 433 442 325 500 375
Vietnam 467 433 431 425 467 475
Brazil 500 500 447 475 467 475
9 Infrastructure score is a combined score across transportation utility and internet Details are shown for transportation and utility
subcomponents while internet access is not shown in the table but is included the combined score Each of these three factors
(transport utility and internet) get an equal weight
CountriesCurrent CoDB index rank
Pre-tax-reform CoDB index rank
Change in rankings due to US tax reform
Canada 1 1 0
Taiwan 2 2 0
South Korea 3 4 +1
Malaysia 4 5 +1
United States 5 11 +6
United Kingdom 6 6 0
Source Cost of Manufacturing Operations Around the Globe KPMG LLP 2020
Table 10 Impact of the US tax reform
copy 2020 KPMG LLP a Delaware limited liability partnership and a member firm of the KPMG global organization of independent member firms
affiliated with KPMG International Limited a private English company limited by guarantee All rights reserved The KPMG name and logo are
trademarks used under license by the independent member firms of the KPMG global organization NDP08974-1A
Source Cost of Manufacturing Operations Around the Globe
KPMG LLP 2020
Table 12 Percentile ranks for cost and quality of labor
On all of the secondary factors considered including quality
of labor the United States ranks significantly better than
countries that offer lower labor costs such as Vietnam
China Mexico and India To put it differently the low ranking
of these countries on the Secondary Cost Index reflects
the weaker investment climatemdashfor example the poorer
connectivity from limited road rail and airline networks more
challenging business operating environments and lower
levels of transparency in government operation and reduced
legal protections available to businesses
The industrialized countries generally rank favorably and
similarly across secondary metrics falling for the most part
in the top half of the countries Among them however
the US clearly ranks better with respect to at least two
factors the quality of labor and ease of doing business
Thus relative to the other 16 countries considered the
US ranks best on the Secondary Cost components
Labor ndash Cost and quality
As noted earlier compensation cost is often the most cited
factor for locating manufacturing facilities in Asian countries
such as China Taiwan or Vietnam As the data confirm these
countries do offer among the lowest hourly compensation
costs for labor Further the hourly compensation costs in the
US are among the highest in the world
As Table 12 shows a different picture emerges when
productivity attributes are considered in addition to the
quality of labor For example countries with the most
favorable cost attributes are not always the ones with the
highest real value added per employee In fact Table 12
suggests a high degree of positive correlation between
costs and productivity
Thus it would appear that for manufacturing activities that
are more routine in nature and require less advanced skills
where the loss of productivity may be outweighed by lower
costs companies may consider locating their manufacturing
facilities in lower costs countries such as China Vietnam
or Taiwan however in higher-value-added manufacturing
where the process is more complex or automated and
requires highly skilled labor to manage the United States
may be considered more favorably as a location
CountriesHourly
compensation costs
RVA per employee
Vietnam 1 5
India 1 5
Mexico 1 4
China 2 4
Malaysia 2 4
Brazil 2 5
Taiwan 3 3
South Korea 3 3
Japan 3 3
United Kingdom 3 2
Canada 3 3
Italy 4 3
Ireland 4 1
France 4 2
United States 5 1
Germany 5 2
Switzerland 5 1
14Cost of manufacturing operations
around the globe
copy 2020 KPMG LLP a Delaware limited liability partnership and a member firm of the KPMG global organization of independent member firms
affiliated with KPMG International Limited a private English company limited by guarantee All rights reserved The KPMG name and logo are
trademarks used under license by the independent member firms of the KPMG global organization NDP08974-1A
ConclusionsOur results indicate that countries that placed better on
the Secondary Cost Index generally performed better on
the overall rankings Of the top five most competitive
economies on the overall rankings only twomdashMalaysia and
Taiwanmdashhave a better primary than secondary cost score
In keeping with this trend of lower Secondary Cost
countries scoring better on the CoDB Index the United
States placed fifth on the CoDB Index despite being tied
with Switzerland for 14th on the Primary Cost Index This
high Primary Cost Index ranking was primarily due to high
labor costs The United States was able to compensate
somewhat for these unfavorable scores on the Primary
Cost Index by placing first in the Secondary Cost Index
As part of this analysis we also examined if tax reform had
a material impact on the relative standing of the US In
particular we compared how the US ranks now (post-tax-
reform combined federal and local tax rate of 27 percent)
relative to the pre-reform with a corporate tax rate of 40
percent (combined federal and state average) The impact
on the USrsquos CoDB Index ranking is quite significant After
tax reform the USrsquos competitiveness increasedmdashas
evidenced by its current rank of 5mdashcompared with its
previous rank of 11 under pre-reform tax rates
A closer look at the countries that outperformed the US
on the CoDB Index ranking indicates some interesting
factors For example the US outperformed all of the
countries on the Secondary Cost Index due to better labor
productivity and business conditions This implies that the
outperformance on the CoDB Index by Canada Taiwan
South Korea and Malaysia are all driven by Primary Cost
factors Specifically Canadarsquos rank is driven primarily by
its ability to offer lower compensation costs and slightly
lower electricity rates while still maintaining Secondary
Cost Index rankings that were not far behind the US
South Korea ranked third by offsetting weaker ranking on
the Secondary Cost Index with even lower compensation
costs A sharper version of the tradeoff between Primary
and Secondary Cost explains the rankings of Taiwan and
Malaysia with Taiwan offering higher primary costs but
lower secondary costs
This study has focused on certain CoDB factors that are
commonly considered in manufacturing facility location
decisionsmdashat the country levelmdashand the results provide a
high-level perspective on the attributes of various countries
with respect to these factors However the location
decision is specific to each company and its consideration
of the supply chain and access to markets The decision
may be impacted by the type of industry the company is
active in the type of product where customers are and
the companyrsquos overall business strategy Thus individual
location decisions are significantly more complex than we
can address in an analysis such as this
For instance for heavy equipment manufacturing from a
transportation point of view it may be better to locate the
facility closer to suppliers and the market whereas from a
production standpoint it may be more desirable to locate
the facility closer to where the desired type of workforce
or raw materials might be available Alternatively for a
specialized precision products manufacturing operation
the firmrsquos decision may be heavily impacted by the
availability of labor with advanced manufacturing skills In
other instances tax and operating incentives offered by a
country may be significant enough to outweigh weakness
on other dimensions As such the location decision is
often guided by unique factors that may go well beyond
those we have considered
Additionally even within the factors we have considered
the relative importance of these factors to a specific firm
may be different than the weights we have considered
Furthermore it may well be the case that the factors we
classify for the purpose of convenience as secondary
are in fact primary factors for consideration in a location
decision for an individual firm or manufacturing sector
Finally a number of local factors that go into firm location
decisions may or may not be captured in the country-
level analysis For example labor and rent costs are
higher in urban areas relative to more distant suburban
or rural areas Recognizing this we have developed a
Tableau analytic and visualization tool in conjunction with
this study that allows the interested reader to alter the
weights and to reassess the score based on the relative
importance of these factors to them Click here for the
Cost of Manufacturing Operations Tool We also note for
copy 2020 KPMG LLP a Delaware limited liability partnership and the US member firm of the KPMG network of independent
member firms affiliated with KPMG International Cooperative (ldquoKPMG Internationalrdquo) a Swiss entity All rights reserved The
KPMG name and logo are registered trademarks or trademarks of KPMG International NDP089741-1A
the reader that the Primary Cost factors
are measured in US dollars Since we
have compared costs on a US dollar
denominated basis our results are impacted
by the relative strength of the various
currencies relative to the dollar As the
foreign exchange rates fluctuate as they
inevitably will the cost measurements we
have relied on would vary and possibly
impact the ranking of individual cost
components even if local currency costs do
not change
Finally we note that the rankings are based
on the best historical information available
Such data is mostly available only with a lag
and therefore the impact of recent trade
disputes or the market disruptions from
COVID-19 are not reflected in the results
copy 2020 KPMG LLP a Delaware limited liability partnership and the US member firm of the KPMG network of independent
member firms affiliated with KPMG International Cooperative (ldquoKPMG Internationalrdquo) a Swiss entity All rights reserved
The KPMG name and logo are registered trademarks or trademarks of KPMG International NDP089741-1A
16Cost of manufacturing operations
around the globe
Appendix A Data sources
copy 2020 KPMG LLP a Delaware limited liability partnership and the US member firm of the KPMG network of independent
member firms affiliated with KPMG International Cooperative (ldquoKPMG Internationalrdquo) a Swiss entity All rights reserved
The KPMG name and logo are registered trademarks or trademarks of KPMG International NDP089741-1A
copy 2020 KPMG LLP a Delaware limited liability partnership and a member firm of the KPMG global organization of independent member firms
affiliated with KPMG International Limited a private English company limited by guarantee All rights reserved The KPMG name and logo are
trademarks used under license by the independent member firms of the KPMG global organization NDP08974-1A
As discussed previously we relied on a variety of sources
to gather data on 23 metrics that spanned Primary and
Secondary Cost factors
Primary Cost Index
The Conference Board is a well-known source of data for
economists While researching international labor costs
we noted two indicators related to the manufacturing
industry that we deemed useful for our study The first
is hourly compensation costs which is a sum of hourly
pay for time worked hourly direct benefits and hourly
social insurance expenditures and labor-related taxes
The Conference Board did not have this information for
Malaysia and Vietnam so we substituted the Economist
Intelligence Unitrsquos labor cost per hour (pay and nonpay
costs) figures for these two countries
Real estate cost data that is leasing cost per square foot
was compiled from a mix of sources We collected data
from real estate advisory firms and asset managers such
as Cushman amp Wakefield Colliers International CBRE
Group Deutsche Bank DWS and UBS
Utility costs measure the average price per kilowatt hour
of electricity paid by all businesses and households in each
country excluding taxes and tariffs These prices were
retrieved from each countryrsquos respective energy regulatory
agency website
Corporate tax rates were available through internal KPMG
sources The tax rates cited in this study reflect combined
statutory federal and provincial tax rates only and do not
account for specific tax incentives International Financial
Statistics provided interest rates for Brazil Canada China
India Malaysia Mexico South Korea Switzerland the
United States and Vietnam
Interest rate data for all economies except the Euro
area countries the United Kingdom Japan and Taiwan
were obtained from the International Monetary Fundrsquos
International Financial Statistics database Interest rates for
Taiwan were retrieved from the Taiwanese central bank
while rates for the remaining economies were retrieved
from the US Federal Reserve Economic Data (FRED)
database Interest rates obtained from the IMF reflect the
monetary policy-related interest rate while interest rates
obtained from all other sources measure the discount rate
Secondary Cost measures
Quality of labor
Outside of the Doing Business report the World Bank
Group provided two additional measures for our study
learning-adjusted years of schooling and access to
internetWi-Fi
Learning-adjusted years of schooling used in the quality
of labor aggregation gives us insight into how advanced
a workerrsquos skill set might be in different countries It is
calculated by multiplying the expected years of school by
the ratio of the most recent harmonized test score and to
advancement attainment on the Trends in International
Mathematics and Science Study (TIMSS) test (The World
Bank Group)11
The Global Competitiveness Index published by the
World Economic Forum included an assessment of the
skill set of graduates (secondary and university graduates)
from each country as captured by the WEFrsquos Executive
Opinion Survey It is included in the ldquoaccess to advanced
educationrdquo category Including this measure while
similar to the learning-adjusted years of schooling takes
into account how executives perceive the quality of the
labor force and allows us to consider the perspective of a
company operating in one of these countries
Real value added per employee is a crucial metric for
companies as it has a direct impact on profits It measures
how much value each additional employee is adding to
the industry For example real value added can increase
if new employees are bringing advanced skill sets into
the workforce We used total real value added from the
Conference Board as well as the total number of people
employed to calculate real value added per employee
The Conference Board did not have this information on
Malaysia and Vietnam so we found comparable variables
for real value added per employee from Malaysia and
Vietnam from separate sources
Ease of doing business
The World Bank Group annually publishes a report titled
Doing Business which ranks 190 countries based on
their ease of doing business This research involves
very detailed quantitative indicators and a few were
particularly valuable to our study We focused on the 2019
report observing the number of days to start a business
registering property enforcing contracts and protecting
minority investors indicators As noted by The World Bank
Group the number of days to start a business measures
how many days it takes for a ldquosmall- to medium-size
limited liability company to start up and formally operate
in each economyrsquos largest business cityrdquo This is the
only variable from the Doing Business report where we
did not look at the overall score for the category (starting
a business) we only observed the number of days For
the remaining three indicators we used the scores The
registering property score is based on ldquothe steps time
and cost involved in registering a property assuming
a standardized case of an entrepreneur who wants to
18Cost of manufacturing operations
around the globe
copy 2020 KPMG LLP a Delaware limited liability partnership and a member firm of the KPMG global organization of independent member firms
affiliated with KPMG International Limited a private English company limited by guarantee All rights reserved The KPMG name and logo are
trademarks used under license by the independent member firms of the KPMG global organization NDP08974-1A
purchase land and a building that is already registered
and free of title dispute In addition the score includes
the quality of the land administration system in each
economy The quality of land administration index has five
dimensions reliability of infrastructure transparency of
information geographic coverage land dispute resolution
and equal access to property rightsrdquo (The World Bank
Group) Number of days to start a business and registering
property along with burden of government regulation
were used in our ease of doing business aggregation
Burden of government regulation is another Executive
Opinion Survey question from the Global Competitiveness
Index It is a response to the survey question ldquoIn your
country how burdensome is it for companies to comply
with public administrationrsquos requirements (eg permits
regulations reporting)rdquo Respondents can choose
a number on a scale of 1 to 7 1 being ldquoextremely
burdensomerdquo and 7 being ldquonot burdensome at allrdquo
Infrastructure
The World Economic Forumrsquos (WEF) Global Competitiveness
Index (2018 Report) contains very useful indicators relating to
starting a business Based on the values or survey responses
for each variable each country is assigned a score from 1 to
100 (100 being the best) It is important to note that we used
these scores for our study not the direct values or survey
responses
The Global Competitiveness Index provides useful information
regarding a countryrsquos infrastructure We specifically look at
transportation infrastructure and utility infrastructure In this
report transportation infrastructure is addressed with eight
variables mdashfour are sourced from WEFrsquos Executive Opinion
Survey and four are based on statistics that they compiled
from external sources
Of these variables we used the survey-based figures to
measure road quality and railroad quality while we used the
external index figures from the International Air Transport
Association (IATA) and United Nations Conference on Trade
and Development to measure airport connectivity and liner
shipping connectivity respectively Index values were not
used for the road and railroad figures due to inconsistencies
with the WEF data when we attempted to reproduce the
WEFrsquos calculations for these measures
The road quality survey results capture the response to
the survey question ldquoIn your country what is the quality
(extensiveness and condition) of road infrastructure [1 =
extremely poor among the worst in the world 7 = extremely
good among the best in the world]rdquo Similarly railroad
quality captures the average response to the question ldquoIn
your country how efficient (ie frequency punctuality
speed price) are train transport services [1 = extremely
inefficient among the worst in the world 7 = extremely
efficient among the best in the world]rdquo Airport connectivity
represents ldquothe IATA airport connectivity indicator which
measures the degree of integration of a country within the
global air transport networkrdquo The Liner shipping connectivity
index ldquoassesses a countryrsquos connectivity to global shipping
networksrdquo and is based on ldquofive components of the maritime
transport sector the number of ships their container-carrying
capacity the maximum vessel size the number of services
and the number of companies that deploy container ships in a
countryrsquos portsrdquo (World Economic Forum)
For utility infrastructure we gathered electric power losses
exposure to unsafe drinking water and reliability of water
supply from the Global Competitiveness Index Electric power
losses which measures a countryrsquos electricity quality and
exposure to unsafe drinking water which takes into account
ldquothe extent of exposure by risk level and the severity of that
riskrsquos contribution to disease burdenrdquo are both based on
statistics that were compiled from external sources Reliability
of water supply is taken from the WEFrsquos Executive Opinion
Survey and answers the question ldquoIn your country how
reliable is the water supply (lack of interruptions and flow
fluctuations)rdquo Respondents can choose a number on a
scale of 1 to 7 1 being ldquoextremely unreliablerdquo and 7 being
ldquoextremely reliablerdquo As mentioned earlier the World Bank
Group provides us with our indicator access to internetWi-
Fi which is part of the overall infrastructure aggregation It
measures the percentage of the population that is using the
internet
Risk and protections
Our political risk data was sourced from the insurance
company Credendorsquos ldquoCountry Risks Synthetizing Chartrdquo
Countries are classified into seven categories (from 1 to 7)
reflecting the intensity of risks arising as a result of political
and assimilated events Category 1 includes those countries
for which the risk is considered the lowest and category 7
contains those countries with the highest likelihood of risks
being caused by political and assimilated events In our study
we chose to focus on political risk over medium- and long-
term periods
Enforcing contracts and protecting minority investors along
with political risk and the corruption perception index were
included in our risk and protections aggregation According
to the World Bank Group the enforcing contracts score
ldquomeasures the time and cost for resolving a commercial
dispute through a local first-instance court and the quality of
copy 2020 KPMG LLP a Delaware limited liability partnership and a member firm of the KPMG global organization of independent member firms
affiliated with KPMG International Limited a private English company limited by guarantee All rights reserved The KPMG name and logo are
trademarks used under license by the independent member firms of the KPMG global organization NDP08974-1A
Measure Country Source Source detail Year Link
Hourly Compensation Costs
All (except Malaysia and Vietnam)
The Conference Board
International Comparisons of Hourly Compensation Costs in Manufacturing
2016 httpwwwconference-boardorgilcprogramindexcfmid=38269
Hourly Compensation Costs
Malaysia and Vietnam
The Economist Intelligence Unit General Statistics Office of Vietnam and Department of Statistics Malaysia
Estimated Labor Cost per Hour Manufacturing
2016 Both httpdataeiucomEI UTableViewaspx initial=trueamppub type_id=1253181310
Vietnam
httpswwwgsogov vndefault_enaspx tabid=783
Malaysia
httpsnewssstatisticsgovmynewss-portalx epepDownloadContent SearchseamcontentId =54516ampactionMethod =ep2FepDownload ContentSearchxhtml 3AcontentActiondo DisplayContentampcid= 12789
Real Estate Costs
See Appendix E
Utility Costs China China Electricity Council
Analysis of National Electricity Market Transaction Information in the Fourth Quarter of 2018
2018 Adjusted to 2015 USD
httpwwwcecorgcnguihuayutongjidianligaige2019-03 -04189190html
Primary Cost measures ndash References
judicial processes index evaluating whether each economy
has adopted a series of good practices that promote
quality and efficiency in the court systemrdquo Protecting
minority investors focuses on ldquothe strength of minority
shareholder protections against misuse of corporate assets
by directors for their personal gain as well as shareholder
rights governance safeguards and corporate transparency
requirements that reduce the risk of abuserdquo (The World
Bank Group)
The WEFrsquos Global Competitiveness Index provided scores
for each country based on the Corruption Perception Index
2016 results This index measures ldquoperceptions of corruption
in the public sectorrdquo and is scaled from 0 (highly corrupt) to
100 (very clean) According to Transparency International
who created the index ldquoThe global average score is a
paltry 43 indicating endemic corruption in a countryrsquos public
sector Top-scoring countries are far outnumbered by [low-
scoring] countries where citizens face the tangible impact of
corruption on a daily basisrdquo
Specific data sources used and linked references are provided
below
20Cost of manufacturing operations
around the globe
copy 2020 KPMG LLP a Delaware limited liability partnership and a member firm of the KPMG global organization of independent member firms
affiliated with KPMG International Limited a private English company limited by guarantee All rights reserved The KPMG name and logo are
trademarks used under license by the independent member firms of the KPMG global organization NDP08974-1A
Measure Country Source Source detail Year Link
Utility Costs France Germany Ireland Italy and United Kingdom
Eurostat Electricity prices for nonhousehold consumers ndash biannual data
2015 httpappssoeurostateceuropaeunuishowdodataset=nrg_pc_205amplang=en
Utility Costs Canada Government of Canada ndash Canada Energy Regulator
Market Snapshot Explaining the high cost of power in northern Canada February 16 2017
2016 Adjusted to 2015 USD
The Canada Energy Regulator 2017 Reproduced with the permission of Public Works and Government Services 2020
Utility Costs Brazil Governo do Brasil
Anuaacuterio Estatiacutestico de Energia Eleacutetrica 2016
2015 httppateducacaobagovbrconteudosconteudos-digitaisdownload8667pdf
Utility Costs South Korea Korea Energy Statistical Information System
Average revenues per kWh sold by segments
2015 httpwwwkesisnetsubsubChartEngjspreport_id=34110ampreport Type=0
Utility Costs Malaysia Malaysia Energy Data and Research
Malaysia Energy Statistics Handbook 2018
2015 httpsmeihstgovmydocuments10620c7e69704-6f80-40ae-a764-ad0acf4a844d
Utility Costs India Power Finance Corporation Ltd (A Govt of India Undertaking)
The Performance of State Power Utilities for the years 2013ndash14 to 2015ndash16
2015 httpswwwpfcindiacomDocumentRepositoryckfinderfilesOperationsPerformance_Reports_of_State_Power_Utilities1_Report on the Performance of State Power Utilities 2013-14 to 2015-16pdf
Utility Costs Switzerland Swiss Office of Energy
Switzerland Utility Costs 2015 httpswwwbfeadminchbfedehomehtml
Utility Costs Taiwan Taiwan Bureau of Energy
Energy Statistical Annual Reports
2015 httpswwwmoeaboegovtwECWenglishcontentContentLinkaspxmenu_id=1540
Utility Costs Japan US Energy Information Administration ndash Independent Statistics and Analysis
Japanrsquos electricity prices rising or stable despite recent fuel cost changes
2015 httpswwweiagovtodayinenergydetailphpid=27872
copy 2020 KPMG LLP a Delaware limited liability partnership and a member firm of the KPMG global organization of independent member firms
affiliated with KPMG International Limited a private English company limited by guarantee All rights reserved The KPMG name and logo are
trademarks used under license by the independent member firms of the KPMG global organization NDP08974-1A
Measure Country Source Source detail Year Link
Utility Costs United States US Energy Information Administration ndash Independent Statistics and Analysis
Average retail price of electricity United States annual
2015 httpswwweiagov
electricitydatabrowser
topic7agg=01ampgeo=
gampendsec=vgamplinechart
=ELECPRICEUS-ALL
A~ELECPRICEUS-RES
A~ELECPRICEUS-COM
A~ELECPRICEUS-IND
Aampcolumnchart=ELEC
PRICE
US-ALLA~ELECPRICE
US-RESA~ELECPRICE
US-COMA~ELECPRICE
US-INDAampmap=ELEC
PRICEUS-ALLAampfreq=
Aampctype=linechartlt=rdquordquo
div=rdquordquo style=rdquobox-sizing
border-boxrdquogt
Utility Costs Mexico US Energy Information Administration ndash Independent Statistics and Analysis
Mexico electricity market reforms attempt to reduce costs and develop new capacity
2015 httpswwweiagovtodayinenergydetailphpid=26932
Utility Costs Vietnam Vietnam Electricity ndash EVN
Vietnam Electricity Annual Report 2016
2015 httpsenevncomvnuserfileUserhuongbttfiles20177AnnualReport2016pdf
Corporate Tax Rates
All KPMG Corporate tax rates table 2019 httpshomekpmgxxenhomeservicestaxtax-tools-and-resourcestax-rates-onlinecorporate-tax-rates-tablehtml
Interest Rates Euro Area India and Japan
Federal Reserve Economic Data (FRED)
Discount Rates (Euro Area India and Japan)
2018 httpsfredstlouisfedorg
Interest Rates Taiwan Central Bank of the Republic of China
Discount Rate (Taiwan) 2018 httpswwwcbcgovtwenlp-695-2html
Interest Rates United Kingdom Bank of England Discount Rate (UK) 2018 httpswwwbankofenglandcoukmonetary-policythe-interest-rate-bank-rate
Interest Rates All (except Euro Area the UK India Japan and Taiwan)
International Financial Statistics
Interest Rates and Monetary Policy-Related Interest Rate percent per annum
2018 httpsdataimforg sk=388DFA60-1D26- 4ADE-B505-A05A55 8D9A42amp sId=1479331931186
22Cost of manufacturing operations
around the globe
copy 2020 KPMG LLP a Delaware limited liability partnership and a member firm of the KPMG global organization of independent member firms
affiliated with KPMG International Limited a private English company limited by guarantee All rights reserved The KPMG name and logo are
trademarks used under license by the independent member firms of the KPMG global organization NDP08974-1A
Secondary Cost measures
Measure Country Source Source detail Years Link
Learning-
Adjusted Years
of Schooling
All The World Bank Learning-Adjusted
Years of Schooling
2017 httpstcdata360
worldbankorg
indicatorsh00280750
country=BRA
ampindicator
=40964ampviz=bar_
chartampyears=2017
Skill set of
Graduates
All (except China) World Economic
Forum
Global
Competitiveness
Index 2019
Weighted
Average 2018ndash
2019
httpstcdata360
worldbankorg
indicators
h00280750
country=
BRAampindicator=
40964ampviz=
bar_chartampyears=2017
httpreports
weforumorg
global-
competitiveness-
report-2018
China Weighted Average
2016ndash2017
RVA per
Employee
All The Conference
Board
International
Comparisons of
Manufacturing
Productivity and
Unit Labor Costs
2017 httpswww
conference-board
orgilcprogram
indexcfmid=42672
Number of
Days to Start a
Business
All The World Bank Doing Business
2019
2019 httpswww
doingbusinessorg
endata
Burden of
Government
Regulation
All (except China) World Economic
Forum
Global
Competitiveness
Index 2019
Weighted
Average of
2018ndash2019
httpreports
weforumorgglobal-
competitiveness-
report-2019China Weighted
Average of
2016ndash2017
Registering
Property
All The World Bank Doing Business
2019
2019 httpswww
doingbusinessorg
endata
Road Quality All (except China) World Economic
Forum
Global
Competitiveness
Index 2019
Weighted
Average of
2018ndash2019
httpreports
weforumorgglobal-
competitiveness-
report-2019China Weighted
Average of
2016ndash2017
copy 2020 KPMG LLP a Delaware limited liability partnership and a member firm of the KPMG global organization of independent member firms
affiliated with KPMG International Limited a private English company limited by guarantee All rights reserved The KPMG name and logo are
trademarks used under license by the independent member firms of the KPMG global organization NDP08974-1A
Measure Country Source Source detail Years Link
Railroad Quality All (except China) World Economic
Forum
Global
Competitiveness
Index 2019
Weighted
Average of
2018ndash2019
httpreports
weforumorgglobal-
competitiveness-
report-2019China Weighted
Average of
2016ndash2017
Airport
Connectivity
All World Economic
Forum
Global
Competitiveness
Index 2019
2018 httpreports
weforumorgglobal-
competitiveness-
report-2019
Liner Shipping
Connectivity
Index
AllWorld Economic
Forum
Global
Competitiveness
Index 2018
2018
httpreports
weforumorgglobal-
competitiveness-
report-2018
Electric Power
LossesAll
World Economic
Forum
Global
Competitiveness
Index 2018
2016
httpreports
weforumorgglobal-
competitiveness-
report-2018
Exposure to
Unsafe Drinking
Water
AllWorld Economic
Forum
Global
Competitiveness
Index 2018
2017
httpreports
weforumorgglobal-
competitiveness-
report-2018
Reliability of
Water Supply
All (except China)
World Economic
Forum
Global
Competitiveness
Index 2018
Weighted
Average
2018ndash2019httpreports
weforumorgglobal-
competitiveness-
report-2018China
Weighted
Average
2016ndash2017
Access to
InternetWi-Fi
France Germany
Ireland Italy
Malaysia
Mexico South
Korea UK
Vietnam Taiwan The World Bank
Individuals using
the Internet ( of
population)
2018 httpsdata
worldbank
orgindicator
ITNETUSER
ZSview=mapBrazil Canada
China India
Japan
Switzerland US
2017
Political Risk All CredendoCountry Risk and
Insights2019
24Cost of manufacturing operations
around the globe
copy 2020 KPMG LLP a Delaware limited liability partnership and a member firm of the KPMG global organization of independent member firms
affiliated with KPMG International Limited a private English company limited by guarantee All rights reserved The KPMG name and logo are
trademarks used under license by the independent member firms of the KPMG global organization NDP08974-1A
Measure Country Source Source detail Years Link
Corruption
Perception
Index
AllWorld Economic
Forum
Global
Competitiveness
Index 2018
2018
httpreports
weforumorgglobal-
competitiveness-
report-2018
Protecting
Minority
Investors
All The World BankDoing Business
20192019
httpswww
doingbusinessorg
endata
Enforcing
ContractsAll The World Bank
Doing Business
20192019
httpswww
doingbusinessorg
endata
Measure Country Source Source detail Years Link
Manufacturing
Value Added
All except Taiwan World Bank World Bank National
Accounts Data
2016 httpsdata
worldbankorg
indicatorNVIND
MANFCD
Manufacturing
Value Added
Taiwan The Conference
Board
International
Comparisons of
Manufacturing
Productivity and Unit
Labor Costs
2016 httpswww
conference-board
orgilcprogram
indexcfmid=42672
Manufacturing
Exports to the
US
All US Census
Bureau
Manufacturing Exports
(Customs Value)
2016 httpsusatrade
censusgov
Labor Share of
Manufacturing
Costs
United States Morgan Stanley
ndash As reported in
Business Insider
Chart of the Day The
Manufacturing Cost
Components For A
Bunch Of Different
Things
2013 httpswww
businessinsider
comchart-the-cost-
of-manufacturing-
stuff-2013-4
Trade-Weighted
US Dollar
Index
NA Federal Reserve
Bank of St Louis
Trade-Weighted US
Dollar Index Major
Currencies Goods
(Index Mar 1973=100
Monthly Not
Seasonally Adjusted)
2015ndash2019 httpsfred
stlouisfedorg
seriesTWEXMMTH
Other supporting data sources
copy 2020 KPMG LLP a Delaware limited liability partnership and the US member firm of the KPMG network of independent
member firms affiliated with KPMG International Cooperative (ldquoKPMG Internationalrdquo) a Swiss entity All rights reserved
The KPMG name and logo are registered trademarks or trademarks of KPMG International NDP089741-1A
copy 2020 KPMG LLP a Delaware limited liability partnership and a member firm of the KPMG global organization of independent member firms
affiliated with KPMG International Limited a private English company limited by guarantee All rights reserved The KPMG name and logo are
trademarks used under license by the independent member firms of the KPMG global organization NDP08974-1A26
Cost of manufacturing operations
around the globe
copy 2020 KPMG LLP a Delaware limited liability partnership and the US member firm of the KPMG network of independent
member firms affiliated with KPMG International Cooperative (ldquoKPMG Internationalrdquo) a Swiss entity All rights reserved
The KPMG name and logo are registered trademarks or trademarks of KPMG International NDP089741-1A
Appendix B Review of other studies
copy 2020 KPMG LLP a Delaware limited liability partnership and the US member firm of the KPMG network of independent
member firms affiliated with KPMG International Cooperative (ldquoKPMG Internationalrdquo) a Swiss entity All rights reserved
The KPMG name and logo are registered trademarks or trademarks of KPMG International NDP089741-1A
copy 2020 KPMG LLP a Delaware limited liability partnership and a member firm of the KPMG global organization of independent member firms
affiliated with KPMG International Limited a private English company limited by guarantee All rights reserved The KPMG name and logo are
trademarks used under license by the independent member firms of the KPMG global organization NDP08974-1A
While each companyrsquos location selection decision is
unique and reflects a range of factors various studies
have attempted to compare how companies would fare
if they considered alternate locations for their production
facilities For instance the Boston Consulting Group
performed a study in 2014 that examined the perception
that Latin America or Eastern Europe offered lower costs
of production than Western Europe the US or Japan
Based on a set of metrics such as manufacturing wages
labor productivity energy costs and exchange rates across
25 countries over time the study concluded that some of
the cost advantages of the lower-cost-base countries such
as Brazil and China have eroded over time10
The Congressional Research Service also performed a
study to assess the health of US manufacturing relative
to other countries in 201811 While focused primarily on
overall manufacturing trends in areas such as value added
by the manufacturing sector countriesrsquo share of global
manufacturing manufacturing employment and research
and development spending the study also compared
hourly costs in manufacturing across 14 countries
The study concluded that US labor costs are well above
those in emerging economies but similar in magnitude to
those in the major economies of continental Europe
Yet another study performed by the Brookings Institution
considered a broader range of indicators spanning topics
such as overall policies and regulations tax policy
energy transportation health costs workforce quality
and infrastructure and innovation across 19 countries12
This study however did not compare labor costs in
manufacturing Based on the scorecard developed by the
authors to assess the manufacturing environment the
study noted that countries that had made investments in
workforce and infrastructure such as the United Kingdom
Switzerland the United States Japan and Canada fared
much better than nations such as Brazil Indonesia
Mexico Russia India and China Our study takes a more
firm-centric approach We consider only the leading
manufacturing exporters to the US as our comparison
countries and consider a focus on primary costs including
labor and real estate
10 Boston Consulting Group ldquoThe Shifting Economics of Global Manufacturing How Cost Competitiveness is Changing Worldwiderdquo 2014
11 Congressional Research Service US Manufacturing in International Perspective February 21 2018
12 Brookings Institution Global Manufacturing Scorecard How the US Compares to 18 Other Nations 2018
28Cost of manufacturing operations
around the globe
copy 2020 KPMG LLP a Delaware limited liability partnership and the US member firm of the KPMG network of independent
member firms affiliated with KPMG International Cooperative (ldquoKPMG Internationalrdquo) a Swiss entity All rights reserved
The KPMG name and logo are registered trademarks or trademarks of KPMG International NDP089741-1A
Appendix C Shortlist of comparison countries
copy 2020 KPMG LLP a Delaware limited liability partnership and the US member firm of the KPMG network of independent
member firms affiliated with KPMG International Cooperative (ldquoKPMG Internationalrdquo) a Swiss entity All rights reserved
The KPMG name and logo are registered trademarks or trademarks of KPMG International NDP089741-1A
copy 2020 KPMG LLP a Delaware limited liability partnership and a member firm of the KPMG global organization of independent member firms
affiliated with KPMG International Limited a private English company limited by guarantee All rights reserved The KPMG name and logo are
trademarks used under license by the independent member firms of the KPMG global organization NDP08974-1A
Table 13 2016 global country rankings
Source US Census Bureau World Bank
This analysis considers a total of 16 economies in addition to the United States Table 13 lists each of
these economies as well as their respective rankings by manufacturing exports to the US and total
value added in manufacturing in 2016 Figure 2 presents the accompanying dollar value of manufacturing
exports for each economy to the US in 2016
These countries were first selected based on the customs value of manufacturing exports to the US
However the list generated on this basis did not include any countries from South America To make the
study more comprehensive Brazil the leading economy in South America with an industrial manufacturing
base in automotive aircraft and other sectors was added to the list
Country Manufacturing exports to US Total manufacturing value add
China 1 1
Mexico 2 12
Canada 3 16
Japan 4 3
Germany 5 4
Korea Rep 6 5
United Kingdom 7 9
Ireland 8 19
India 9 6
Italy 10 7
France 11 8
Vietnam 12 46
Taiwan 13 13
Malaysia 14 26
Switzerland 15 17
Brazil 18 10
copy 2020 KPMG LLP a Delaware limited liability partnership and the US member firm of the KPMG network of independent
member firms affiliated with KPMG International Cooperative (ldquoKPMG Internationalrdquo) a Swiss entity All rights reserved
The KPMG name and logo are registered trademarks or trademarks of KPMG International NDP089741-1A
30Cost of manufacturing operations
around the globe
copy 2020 KPMG LLP a Delaware limited liability partnership and a member firm of the KPMG global organization of independent member firms
affiliated with KPMG International Limited a private English company limited by guarantee All rights reserved The KPMG name and logo are
trademarks used under license by the independent member firms of the KPMG global organization NDP08974-1A
We note here that while we use exports to the US as a basis for selecting these countries the selected benchmark
countries generally rank highly when based on manufacturing output as well13 There is also a significant overlap between
these countries and those considered in other studies that we reviewed
13 US Census Bureau Manufacturing Exports (Customs Value) Accessible at httpsusatradecensusgov
Source US Census Bureau
Note that Canada data is as of 2015 and Taiwan does not contain World Bank data for any year
The global manufacturing output ranking from the World Bank source is also included for reference
Figure 1 2016 Total Manufacturing Exports to the US
Export
ing e
conom
y
Customs value (USD billions)
$500$450$400$350$300$250$200$150$100$50$0
Brazil $18
Switzerland $32
Malaysia $36
Taiwan $37
Vietnam $39
France $40
Italy $42
India $43
Ireland $43
UK $46
South Korea $68
Germany $107
Japan $128
$202Canada
$264Mexico
$454China
Appendix D Index methodology
copy 2020 KPMG LLP a Delaware limited liability partnership and a member firm of the KPMG global organization of independent
member firms affiliated with KPMG International Limited a private English company limited by guarantee All rights reserved
The KPMG name and logo are trademarks used under license by the independent member firms of the KPMG global
organization NDP08974-1A
32Cost of manufacturing operations
around the globe
copy 2020 KPMG LLP a Delaware limited liability partnership and a member firm of the KPMG global organization of independent member firms
affiliated with KPMG International Limited a private English company limited by guarantee All rights reserved The KPMG name and logo are
trademarks used under license by the independent member firms of the KPMG global organization NDP08974-1A
We use 23 metrics to develop an overall weight of the country The metrics are further segregated into Primary
and Secondary Costs The Primary Costs consist of five subcategories of costs and the Secondary Costs
consisted of an additional four subcategories (with a varying number of metrics for each category for a total of
18 categories)
The Primary and Secondary Cost Indices are equally weighted at 50 percent each and each subcategory within
these two broad categories was also equally weighted The weighting for each individual factor however varies as
the number of factors consider for each metric variesmdashthus the five Primary Costs have 20 percent weight each
for an overall ranking weight of 10 percent (50 percent20 percent) while the secondary factors have 25 percent
weight each Quality of labor for example has three metrics associated with it with each metric weighted at 42
percent (approximately 50 percent25 percent13) The table below shows the final weights for each metric
Figure 2 Weights by measure category
Table 14 Final weights in overall ranking by metric
Measure Cost type SubcategoryOverall ranking weight
1 Hourly compensation costs Primary 100
2 Real estate costs Primary 100
3 Utility costs Primary 100
4 Corporate tax rates Primary 100
5 Interest rates Primary 100
6 Learning-adjusted years of schooling Secondary Quality of Labor 42
7 Skill set of graduates Secondary Quality of Labor 42
8 Real value added per employee Secondary Quality of Labor 42
9 Days to start business Secondary Ease of Doing Business 42
10 Burden of government regulation Secondary Ease of Doing Business 42
11 Registering property Secondary Ease of Doing Business 42
12 Road quality index Secondary Infrastructure 10
13 Railroad quality Secondary Infrastructure 10
14 Airport connectivity Secondary Infrastructure 10
20
20
20
20
20
PrimaryCost Index
Hourly Compensation Costs
Real Estate Costs
Utility Costs
Corporate Tax Rates
Interest Rates
SecondaryCost Index
Quality of Labor
Ease of Doing Business
Infrastructure
Risk and Protections
25
2525
25
Primary Costs
Secondary Costs
CoDB Index 5050
Table 15 Percentile rankings by metric
Measure Cost type SubcategoryOverall ranking weight
15 Liner shipping connectivity index Secondary Infrastructure 10
16 Electric power losses ( of output) Secondary Infrastructure 14
17 Exposure to unsafe drinking water Secondary Infrastructure 14
18 Reliability of water supply Secondary Infrastructure 14
19 Access to internetWi-fi Secondary Infrastructure 42
20 Political risk Secondary Risk and Protections 31
21 Enforcing contracts Secondary Risk and Protections 31
22 Protecting minority investors Secondary Risk and Protections 31
23 Corruption perception index Secondary Risk and Protections 31
In addition to the weights assigned for each metric the
methodology for developing the index consisted of the
following steps
mdash Performance on each metric is ranked using a
percentile-based methodology The top (or bottom from
an operating cost perspective based on the metric) 15
percent receives the highest rank and the lowest (or
highest) 15 percent receives a rank of 5 Ranks for real
estate costs are shown below as an example Thus the
cheapest or lowest 15 percentile of real estate costs is
rank 1 percentiles between the 15 and 35 percentiles
receive a rank of 2 and so on This is further illustrated
in the table below
mdash The final scores are calculated by applying the
appropriate weights for each metric first at the
subcategory level and combined (using weight
multiplied by the rank) with the Primary and Secondary
Cost scores and ultimately to the overall score
The scores are then ranked for ease of display and
comparison
Real estate costs
Ranking From To
1 000 1499
2 1500 3499
3 3500 6499
4 6500 8499
5 8500 10000
copy 2020 KPMG LLP a Delaware limited liability partnership and the US member firm of the KPMG network of independent member firms
affiliated with KPMG International Cooperative (ldquoKPMG Internationalrdquo) a Swiss entity All rights reserved The KPMG name and logo are
registered trademarks or trademarks of KPMG International NDP089741-1A
34Cost of manufacturing operations
around the globe
Appendix E Real estate data sources in various cities
copy 2020 KPMG LLP a Delaware limited liability partnership and the US member firm of the KPMG network of independent
member firms affiliated with KPMG International Cooperative (ldquoKPMG Internationalrdquo) a Swiss entity All rights reserved
The KPMG name and logo are registered trademarks or trademarks of KPMG International NDP089741-1A
copy 2020 KPMG LLP a Delaware limited liability partnership and a member firm of the KPMG global organization of independent member firms
affiliated with KPMG International Limited a private English company limited by guarantee All rights reserved The KPMG name and logo are
trademarks used under license by the independent member firms of the KPMG global organization NDP08974-1A
Country City Property type Source Link
Brazil Santa Cruz
Campo
Grande
Industrial Cushman amp Wakefield
Industrial Marketbeat
Q2 2019 Brazil
Industrial Report
httpswwwcushmanwakefieldcomen
brazilinsightsbrazil-marketbeats
Brazil Satildeo Paulo Industrial Cushman amp Wakefield
Industrial Marketbeat
Q2 2019 Brazil
Industrial Report
Brazil Rio de
Janeiro
Industrial Cushman amp Wakefield
Industrial Marketbeat
Q2 2019 Brazil
Industrial Report
Canada Calgary Industrial Cushman amp Wakefield
Industrial Marketbeat
Q2 2019 Canada
Industrial Report
httpswwwcushmanwakefieldcomen
canadainsightscanada-marketbeats
Canada Ottawa Industrial Cushman amp Wakefield
Industrial Marketbeat
Q2 2019 Canada
Industrial Report
Canada Toronto Industrial Cushman amp Wakefield
Industrial Marketbeat
Q2 2019 Canada
Industrial Report
China Chengdu Logistics Colliers Quarterly
Logistics Research
Chengdu-Chonqing Q1
2019
httpswwwcollierscom-media
filesmarketresearchapacchina
southwestchina-researchwestchina-
logistics-q1-2019-enpdfla=en-GB
China Beijing Logistics Colliers Quarterly
Industrial Beijing-
Tianjin-Langeang Q1
2018
httpswwwcollierscom-mediafiles
marketresearchapacchinanorthchina-
researchbj-tj-lf-industrial-q1-2018
pdfla=en-GB
China Tianjin Logistics Colliers Quarterly
Industrial Beijing-
Tianjin-Langeang Q1
2018
France Paris Industrial and
Logistics
Cushman amp Wakefield
Industrial Market
Snapshot Q2 2019
France
httpswwwcushmanwakefieldcomen
franceinsightsfrance-marketbeat
France Lyon Industrial and
Logistics
Cushman amp Wakefield
Industrial Market
Snapshot Q2 2019
France
36Cost of manufacturing operations
around the globe
copy 2020 KPMG LLP a Delaware limited liability partnership and a member firm of the KPMG global organization of independent member firms
affiliated with KPMG International Limited a private English company limited by guarantee All rights reserved The KPMG name and logo are
trademarks used under license by the independent member firms of the KPMG global organization NDP08974-1A
Country City Property type Source Link
France Marseille Industrial and
Logistics
Cushman amp Wakefield
Industrial Market
Snapshot Q2 2019
France
httpswwwcushmanwakefieldcomen
franceinsightsfrance-marketbeat
France Bordeaux Industrial and
Logistics
Cushman amp Wakefield
Industrial Market
Snapshot Q2 2019
France
France Strasbourg Industrial and
Logistics
Cushman amp Wakefield
Industrial Market
Snapshot Q2 2019
France
France Lille Industrial and
Logistics
Cushman amp Wakefield
Industrial Market
Snapshot Q2 2019
France
France Toulouse Industrial and
Logistics
Cushman amp Wakefield
Industrial Market
Snapshot Q2 2019
France
Germany Berlin Industrial and
Logistics
Colliers Industrial and
Logistics Markets
Overview Germany
20182019
httpswwwcolliersdewp-
contentuploads201906
ColliersResearchMarket-Report-
IL20182019englpdf
Germany Dusseldorf Industrial and
Logistics
Colliers Industrial and
Logistics Markets
Overview Germany
20182019
Germany Frankfurt Industrial and
Logistics
Colliers Industrial and
Logistics Markets
Overview Germany
20182019
Germany Hamburg Industrial and
Logistics
Colliers Industrial and
Logistics Markets
Overview Germany
20182019
Germany Cologne Industrial and
Logistics
Colliers Industrial and
Logistics Markets
Overview Germany
20182019
Germany Leipzig Industrial and
Logistics
Colliers Industrial and
Logistics Markets
Overview Germany
20182019
copy 2020 KPMG LLP a Delaware limited liability partnership and a member firm of the KPMG global organization of independent member firms
affiliated with KPMG International Limited a private English company limited by guarantee All rights reserved The KPMG name and logo are
trademarks used under license by the independent member firms of the KPMG global organization NDP08974-1A
Country City Property type Source Link
Germany Munich Industrial and
Logistics
Colliers Industrial and
Logistics Markets
Overview Germany
20182019
httpswwwcolliersdewp-
contentuploads201906
ColliersResearchMarket-Report-
IL20182019englpdf
Germany Stuttgart Industrial and
Logistics
Colliers Industrial and
Logistics Markets
Overview Germany
20182019
India Delhi Industrial Cushman amp Wakefield
Industrial Marketbeat
Q4 2018 Delhi
Industrial Report
httpswwwcushmanwakefieldcomen
indiainsightsdelhi-ncr-marketbeat
India Mumbai Industrial Cushman amp Wakefield
Industrial Marketbeat
Q4 2018 Mumbai
Industrial Report
httpswwwcushmanwakefieldcomen
indiainsightsmumbai-marketbeat
Ireland Dublin Logistics Cushman amp Wakefield
Industrial Marketbeat
Q1 2019 Ireland
Industrial Report
httpswwwcushmanwakefieldcomen
irelandinsightsireland-marketbeat
Ireland Cork Logistics Cushman amp Wakefield
Industrial Marketbeat
Q1 2019 Ireland
Industrial Report
Ireland Galway Logistics Cushman amp Wakefield
Industrial Marketbeat
Q1 2019 Ireland
Industrial Report
Italy Rome Logistics CBRE Italy Logistics
MarketView Q4 2019
httpswwwcbredeenresearchItaly-
Logistics-MarketView-Q4-2019
Italy Milan Logistics CBRE Italy Logistics
MarketView Q4 2019
Italy Bologna Logistics CBRE Italy Logistics
MarketView Q4 2019
Japan Osaka Logistics CBRE Japan Real
Estate Market Outlook
2019
httpswwwcbrecomresearch-and-
reportsJapan-Real-Estate-Market-
Outlook-2019
Japan Nagoya Logistics CBRE Japan Real
Estate Market Outlook
2019
38Cost of manufacturing operations
around the globe
copy 2020 KPMG LLP a Delaware limited liability partnership and a member firm of the KPMG global organization of independent member firms
affiliated with KPMG International Limited a private English company limited by guarantee All rights reserved The KPMG name and logo are
trademarks used under license by the independent member firms of the KPMG global organization NDP08974-1A
Country City Property type Source Link
Malaysia Klang Valley Industrial CBRE Malaysia Real
Estate Market Outlook
2019
httpswwwcbrecomreport-
downloadPUBID=44c7f5c6-5dbe-4a76-
a335-ff80e9c57a79
Malaysia Penang Industrial CBRE Malaysia Real
Estate Market Outlook
2019
Malaysia Iskandar
Malaysia
Industrial CBRE Malaysia Real
Estate Market Outlook
2019
Malaysia Kuching Industrial CBRE Malaysia Real
Estate Market Outlook
2019
Mexico Mexico Industrial CBRE Mexico Industrial
Market Outlook Q2 2019
httpswwwcbrecommxenresearch-
and-reports
South Korea Greater
Seoul
Logistics DWS Market Outlook
2018
httpswwwdwscomglobalassets
institutionalresearchpdfsDWS_South_
Korea_Real_Estate_Market_Outlook_
April_2018pdf
Switzerland Industrial UBS Real Estate Focus
2019
httpsfiabciorguploadsswiss-real-
estate-focus-2019-enpdf
Taiwan Neihu
District
Taipei
Industrial Colliers Radar
Industrial Taiwan
August 2019
httpswwwcollierscom-media
filesapactaiwanother20
reports2019radarreport-enpdfla=en-
GBTaiwan Nangang
Taipei
Industrial Colliers Radar
Industrial Taiwan
August 2019
Taiwan Xizhi New
Taipei City
Industrial Colliers Radar
Industrial Taiwan
August 2019
Taiwan Jhonghe
New Taipei
City
Industrial Colliers Radar
Industrial Taiwan
August 2019
Taiwan Xindien New
Taipei City
Industrial Colliers Radar
Industrial Taiwan
August 2019
Taiwan Sanchong
New Taipei
City
Industrial Colliers Radar
Industrial Taiwan
August 2019
Taiwan Xinchuang
New Taipei
City
Industrial Colliers Radar
Industrial Taiwan
August 2019
Taiwan Tucheng
New Taipei
City
Industrial Colliers Radar
Industrial Taiwan
August 2019
copy 2020 KPMG LLP a Delaware limited liability partnership and a member firm of the KPMG global organization of independent member firms
affiliated with KPMG International Limited a private English company limited by guarantee All rights reserved The KPMG name and logo are
trademarks used under license by the independent member firms of the KPMG global organization NDP08974-1A
Country City Property type Source Link
United
Kingdom
London
(Heathrow)
Logistics Cushman amp Wakefield
Industrial Market
Snapshot Q2 2019 UK
httpswwwcushmanwakefieldcomen
united-kingdominsightsuk-marketbeat
United
Kingdom
Manchester Logistics Cushman amp Wakefield
Industrial Market
Snapshot Q2 2019 UK
United
Kingdom
Birmingham Logistics Cushman amp Wakefield
Industrial Market
Snapshot Q2 2019 UK
United
States
Boston Industrial Cushman amp Wakefield
US Industrial
Marketbeat Q2 2019
httpswwwcushmanwakefieldcomen
united-statesinsightsus-marketbeats
us-industrial-marketbeat
United
States
Omaha Industrial Cushman amp Wakefield
US Industrial
Marketbeat Q2 2019
United
States
Detroit Industrial Cushman amp Wakefield
US Industrial
Marketbeat Q2 2019
Vietnam Ho Chi Minh
City
Industrial CBRE Vietnam
Marketview Q2 2018
httpwwwcbrevietnam
comuseful=cbre-vietnam-
marketview-q2-2018Vietnam Long An Industrial CBRE Vietnam
Marketview Q2 2018
Vietnam Dong Nai Industrial CBRE Vietnam
Marketview Q2 2018
Vietnam Binh Duong Industrial CBRE Vietnam
Marketview Q2 2018
Vietnam Hanoi Industrial Colliers Vietnam Real
Estate Quarterly
Knowledge Report Q1
2019
httpswwwcollierscom-mediafiles
apacvietnampdfvietnam-quarterly-
knowledge-report-q1-2019-en-1
pdfla=en-GB
40Cost of manufacturing operations
around the globe
copy 2020 KPMG LLP a Delaware limited liability partnership and the US member firm of the KPMG network of independent
member firms affiliated with KPMG International Cooperative (ldquoKPMG Internationalrdquo) a Swiss entity All rights reserved
The KPMG name and logo are registered trademarks or trademarks of KPMG International NDP089741-1A
copy 2020 KPMG LLP a Delaware limited liability partnership and a member firm of the KPMG global organization of independent member firms
affiliated with KPMG International Limited a private English company limited by guarantee All rights reserved The KPMG name and logo are
trademarks used under license by the independent member firms of the KPMG global organization NDP08974-1A
Cost of manufacturing operations
around the globe
Contact usErkan ErdemPrincipalKPMG ndash National Tax Industry Leader for Public Sector and Economic and Statistical ConsultingT 703-286-8188
E erkanerdemkpmgcom
Oommen ThomasManaging DirectorKPMG ndash Economic and Statistical ConsultingT 415-963-8125
E oommenthomaskpmgcom
Talha MuhammadManagerKPMG ndash Economic and Statistical ConsultingT 212-909-5401
E talhamuhammadkpmgcom
Brian HecklerPartnerKPMG ndash National Sector Leader for Industrial ManufacturingT 312-665-2693
E bhecklerkpmgcom
Ulrich Schmidt Principal KPMG - Global Location amp Expansion Services T 267-256-2786 E ulrichschmidtkpmgcom
Carolyn LeeExecutive DirectorThe Manufacturing InstituteT 202-637-3079
E cleenamorg
The following information is not intended to be ldquowritten advice concerning one or more Federal tax mattersrdquo subject to the requirements of section 1037(a)(2)
of Treasury Department Circular 230
The information contained herein is of a general nature and based on authorities that are subject to change Applicability of the information to specific situations
should be determined through consultation with your tax adviser
copy 2020 KPMG LLP a Delaware limited liability partnership and a member firm of the KPMG global organization of independent member firms affiliated with
KPMG International Limited a private English company limited by guarantee All rights reserved The KPMG name and logo are trademarks used under license
by the independent member firms of the KPMG global organization NDP08974-1A
kpmgcomsocialmedia
The authors gratefully acknowledge excellent research assistance provided by Andrew Bent and
Kristina Kohl Tableau visualizations created by Konul Riegel and technical support provided by Ian Flick
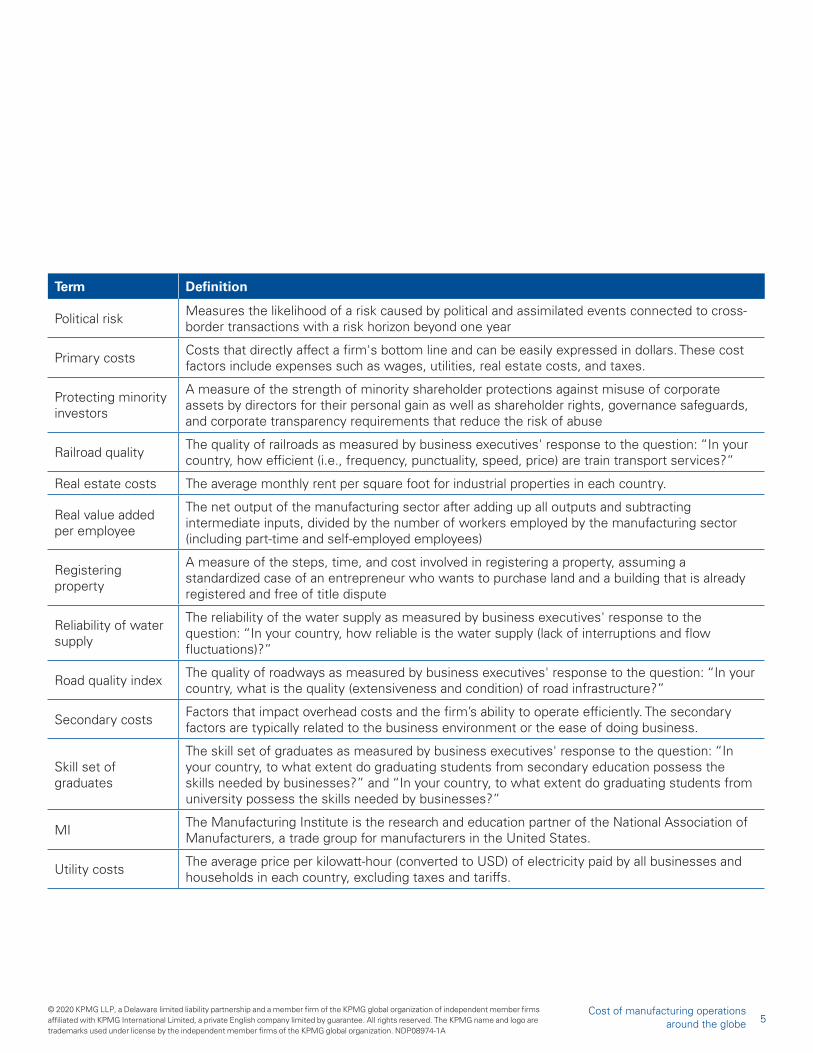
copy 2020 KPMG LLP a Delaware limited liability partnership and a member firm of the KPMG global organization of independent member firms
affiliated with KPMG International Limited a private English company limited by guarantee All rights reserved The KPMG name and logo are
trademarks used under license by the independent member firms of the KPMG global organization NDP08974-1A
We collected data on 23 measures and then quantitatively
evaluated each country based on these measures to develop
an overall CoDB index (CoDB Index) to assess the economyrsquos
competitiveness as a manufacturing hub The components of
the CoDB Index in turn consist of an index of Primary Costs
(Primary Cost Index) that includes factors such as labor costs
real estate costs costs of financing (as measured by interest
rates) and utility costs as well as an index of Secondary Costs
(Secondary Cost Index) made up of 18 measures grouped
into four main areas quality of labor ease of doing business
infrastructure and risk
We note that this study and our conclusions are based
on certain CoDB factors that are commonly considered in
manufacturing facility location decisions and the results provide
a high-level perspective on the attributes of various countries
with respect to these factors However the location decision
is specific to each company and its consideration of additional
factors such as industry type of product supply chain access
to consumer markets and the companyrsquos overall business
strategy It is therefore important to recognize that an individual
location decision of a company may involve more factors and
considerations than we have evaluated in this analysis
Finally we note that while we have used the most recently
available data on the cost factors such data is available only
with a lag As such the rankings are based on the best historical
information available and as a consequence the impact of
recent trade disputes or the market disruptions from COVID-19
are not reflected in the results
254
263
265
267
269
269
274
277
277
283
284
300
326
333
346
349
420
Canada
Taiwan
South Korea
Malaysia
United States
United Kingdom
Germany
Switzerland
Ireland
France
China
Italy
Japan
Mexico
Vietnam
India
Brazil
CoDB Index Score by Country (1=best5=worst)
Source Cost of Manufacturing Operations Around the Globe KPMG LLP 2020
Cost of manufacturing operations
around the globe2
Where to locate a production facility is an important
strategic decision for a manufacturing company The
location decision can have a long-term impact on
performance The selection of a particular site (or country)
requires more than just an assessment of labor costs It
requires the consideration of multiple factors including
the cost of setting up the facility real estate costs energy
costs the quality of the labor force and infrastructure
the regulatory environment and intellectual property
protections
In 2011 MI published a cost of doing business study
(the MI Report)2 The MI Report compared the cost of
production in the United States and nine major trading
partners Canada China France Germany Japan South
Korea Mexico Taiwan and the United Kingdom The study
examined the ldquorawrdquo cost of production based on wage
costs relative to value added in manufacturing and a variety
of other ldquostructuralrdquo costs of doing business in each
country including corporate tax rates employee benefits
tort litigation regulatory compliance and energy The study
noted that unlike in previous years manufacturers in the
US faced lower ldquoraw costsrdquo (ie wage compensation
relative to total valued added in manufacturing) than its
trading partners Specifically raw costs faced by US
manufacturers were about 9 percent lower than the
trade-weighted average of its nine largest trading partners
However the study noted that this advantage was entirely
offset by the higher structural costs (ie corporate tax
rates employee benefit costs tort litigation regulatory
compliance and energy) with US manufacturing costs
(on a trade-weighted basis) being about 9 percent higher
than that of its nine largest trading partners
This study seeks to update the MI Report by
mdash Including more recent data
mdash Considering additional indicators of the cost of doing
business
mdash Expanding the comparison to seven additional
countries Brazil Ireland Italy India Malaysia
Switzerland and Vietnam
Introduction
2 The Manufacturing Institute and the Manufacturers Alliance for
Productivity and Innovation 2011 Report on the Structural Cost of
US Manufacturing 2011copy 2020 KPMG LLP a Delaware limited liability partnership and a member firm of the KPMG
global organization of independent member firms affiliated with KPMG International Limited a
private English company limited by guarantee All rights reserved The KPMG name and logo are
trademarks used under license by the independent member firms of the KPMG global organization
NDP08974-1A
copy 2020 KPMG LLP a Delaware limited liability partnership and the US member firm of the KPMG network of independent
member firms affiliated with KPMG International Cooperative (ldquoKPMG Internationalrdquo) a Swiss entity All rights reserved
The KPMG name and logo are registered trademarks or trademarks of KPMG International NDP089741-1A
Cost of manufacturing operations
around the globe
copy 2020 KPMG LLP a Delaware limited liability partnership and a member firm of the KPMG global organization of independent member firms
affiliated with KPMG International Limited a private English company limited by guarantee All rights reserved The KPMG name and logo are
trademarks used under license by the independent member firms of the KPMG global organization NDP08974-1A4
copy 2020 KPMG LLP a Delaware limited liability partnership and a member firm of the KPMG global organization of independent member firms
affiliated with KPMG International Limited a private English company limited by guarantee All rights reserved The KPMG name and logo are
trademarks used under license by the independent member firms of the KPMG global organization NDP08974-1A
What are the ldquoCosts of Doing Businessrdquo
Companies consider a variety of CoDB factors when
evaluating their international manufacturing location
decisions Our study considers the factors evaluated
by companies at the country level and seeks to
incorporate these into country-level rankings A countryrsquos
competitiveness is often judged by the cost of labor
and an often cited motivation for moving manufacturing
offshore (relative to higher-cost countries like the US) is
the desire to gain access to low labor costs and to lower
the cost of production Studies however have indicated
that a range of other factors go into the location selection
decision3 The leading factors identified in the literature
that contribute to the location decision are
1 Availability of skilled labor
2 Cost and productivity of labor
3 Availability of and proximity to transportation
infrastructure
4 Tax rates
5 Regulatory environment
6 Real estate costs
7 Availability and cost of power communications water
and other utilities
8 Access to and cost of capital
9 Transparency in government and business practices
and ease of doing business
10 Politically and economically stable environment with
ability to enforce legal and property rights
We compiled data on each of these factors directly or
through proxy measures over the 2012 to 2019 time
period for the 17 countries (see Appendix A for details)
The selection of specific categories of costs to compare
were guided by the surveys and studies we reviewed (see
Appendix A for details) We note here that data for every
cost element was not available for every country or not
available for a recent time period Thus the cost types
analyzed are those that could be obtained from public
sources spanning 2012ndash2019 but we use only the most
recent data in our analysis where available
Given the large number of indicators being considered
we categorized these decision factors into two groups
mdash Primary Costs ndash Those that can be measured in cost
terms (dollars or percentage in the case of cost of
capital and tax rates) These cost factors are more
readily assessed and include expenses such as wages
utilities real estate costs and taxes
mdash Secondary Costs ndash Factors that impact overhead
costs and the facilityrsquos ability to operate efficiently
The secondary factors are typically related to the
business environment or the ease of doing business
For instance it takes into consideration the level of
transparency in business and government processes
legal protection of property rights and regulatory
burden
For Primary Cost factors the specific measures we
included are
mdash Labor costs ndash Hourly labor rates (including benefits)
mdash Utility costs ndash Energy costs
mdash Real estate costs ndash Lease costs for industriallogistics
locations
mdash Cost of capital ndash Borrowing interest rates
mdash Corporate tax rates
For Secondary Cost factors tied to the business
environment and infrastructure we considered a range
of indicators reflecting the quality of labor ease of doing
business infrastructure and risk and protections Table 1
on the following page summarizes the measures and cost
types considered
a BL MacCarthy and W Atthirawong ldquoFactors affecting location decisions in international operations ndash a Delphi studyrdquo International Journal of
Operations amp Production Management 2003
b C Manning M Rodriguez and Chinmoy Ghosh ldquoDevising a Corporate Facility Location Strategy to Maximize Shareholder Wealthrdquo Journal of
Real Estate Research 1999
c F Karakaya and C Canel Underlying dimensions of Business Location Decisions Industrial Management amp Data Systems 1998
d S Turhan BC Ozbag and B Cetin ldquoFactors Affecting Location Decisions of Food Processing Plants Journal of Applied Sciences 2007
e M Plaziak and AI Symanska Role of Modern Factors in the Process of Choosing a Location of the Enterprise
3 For a discussion of these factors see for example
copy 2020 KPMG LLP a Delaware limited liability partnership and a member firm of the KPMG global organization of independent member firms
affiliated with KPMG International Limited a private English company limited by guarantee All rights reserved The KPMG name and logo are
trademarks used under license by the independent member firms of the KPMG global organization NDP08974-1A
Measure Cost type Subcategory
1 Hourly compensation costs Primary -
2 Real estate costs Primary -
3 Utility costs Primary -
4 Corporate tax rates Primary -
5 Interest rates Primary -
6 Learning-adjusted years of schooling Secondary Quality of labor
7 Skill set of graduates Secondary Quality of labor
8 Real value added per employee Secondary Quality of labor
9 Days to start business Secondary Ease of doing business
10 Burden of government regulation Secondary Ease of doing business
11 Registering property Secondary Ease of doing business
12 Road quality index Secondary Infrastructure
13 Railroad quality Secondary Infrastructure
14 Airport connectivity Secondary Infrastructure
15 Liner shipping connectivity index Secondary Infrastructure
16 Electric power losses ( of output) Secondary Infrastructure
17 Exposure to unsafe drinking water Secondary Infrastructure
18 Reliability of water supply Secondary Infrastructure
19 Access to internetWi-Fi Secondary Infrastructure
20 Political risk Secondary Risk and protections
21 Enforcing contracts Secondary Risk and protections
22 Protecting minority investors Secondary Risk and protections
23 Corruption perception index Secondary Risk and protections
Based on these indicators we first developed separate indices one for the Primary Costs and another for
Secondary Costs and then combined the two to produce the CoDB Index an overall competitiveness index
We adopted this approach to produce one common index by which to rank the countries with respect to
CoDB while retaining the ability to explore how the Primary and Secondary Costs influenced the overall rank
Appendix A provides details on the sources from which the data on these measures were gathered
Table 1 Primary and secondary measures by subcategory
6Cost of manufacturing operations
around the globe
copy 2020 KPMG LLP a Delaware limited liability partnership and a member firm of the KPMG global organization of independent member firms
affiliated with KPMG International Limited a private English company limited by guarantee All rights reserved The KPMG name and logo are
trademarks used under license by the independent member firms of the KPMG global organization NDP08974-1A
Developing the indexSince we are evaluating 23 factorsmdashsome that impact a
manufacturing company operations in a country directly and
others more indirectlymdashit is challenging to draw cross-country
inferences by evaluating each separate CoDB factor Instead
we created a composite index that would jointly reflect the
information provided by the various individual measures We
recognize that such an index will subsume a significant range
of information across all the identified measures To provide
transparency and to allow further exploration to identify the
set of factors driving a countryrsquos index level (and rank) we
developed two indicesmdashone for the Primary Cost factors and
another for the Secondary Cost factors Subsequently we
combined them to generate an overall index (CoDB Index)
to benchmark country performance This allowed us to
analyze the relative importance of each set of factors to each
countryrsquos overall index score
As with any index the weighting placed on each component
is a key consideration Most studies that examine CoDB
factors tend to weight the key factors equally4 It did
not appear that one or some of the five Secondary Cost
categories we consideredmdashquality of labor ease of doing
business infrastructure and riskmdashstood out in importance
relative to the others Accordingly the assumption of equal
weighting appeared to be reasonable for all factors (see
Appendix D for a specific breakdown of the weights)
With respect to the Primary Cost factors namely labor utility
real estate costs interest rates and tax rates we evaluated
the need to place higher weight on labor given its perceived
importance as a factor in location decisions Specifically
we reviewed data on the contribution of labor costs to
manufacturing Analysis performed by Morgan Stanley
on the contribution to total costs of various components
indicates that for the manufacturing sector labor costs
account for approximately 16 percent of total manufacturing
costs in the US (and as high as 30 percent of total costs for
certain sectors such as electronics and apparel and as low
as 6ndash7 percent for sectors such as motor vehicles where
capital costs are much more significant)5 The 16 percent
weight indicated by this analysis is similar in magnitude to
the 20 percent weight that we use for labor under an equal
weighting approach In the absence of any clear indication
that pointed to an alternate weighting choice we assigned
equal weighting to the five primary factors6
4 For example the Brookings Institutionrsquos report Global manufacturing scorecard How the US compares to 18 other nations accessible at
httpswwwbrookingseduresearchglobal-manufacturing-scorecard-how-the-us-compares-to-18-other-nations
5 Morgan Stanley Analyst Report as cited in ldquoThe Cost Of Manufacturing StuffrdquoBusiness Insider May 2013
6 We recognize that there are alternate index weighting choices that could be adopted and that an alternate set of weights would likely yield
a different ranking on the overall index To allow the interested reader to alter the weights to reflect their facts and circumstances and
to explore sensitivity of results to these changes we have developed a Tableau visualization tool in conjunction with this study This tool
provides the ability to emphasize or deemphasize various cost factors and to visualize the impact of the changes on the CoDB Index rank
In summary we utilized the following weights presented when calculating index values for each country
Index weights
20
20
20
20
20
PrimaryCost Index
Hourly Compensation Costs
Real Estate Costs
Utility Costs
Corporate Tax Rates
Interest Rates
SecondaryCost Index
Quality of Labor
Ease of Doing Business
Infrastructure
Risk and Protections
25
2525
25
Primary Costs
Secondary Costs
CoDB Index 5050
copy 2020 KPMG LLP a Delaware limited liability partnership and a member firm of the KPMG global organization of independent member firms
affiliated with KPMG International Limited a private English company limited by guarantee All rights reserved The KPMG name and logo are
trademarks used under license by the independent member firms of the KPMG global organization NDP08974-1A
Table 3 Country ranking ndash CoDB Index
Source Cost of Manufacturing Operations Around the Globe KPMG LLP 2020
The application of the indexing methodology resulted in a ranking of countries as summarized
in Table 3 (based on score from 1ndash5 with 1 being the best and 5 being the worst)
Canada Taiwan and South Korea ranked as the top three countries on the CoDB Index
which equally weights Primary Costs factors and Secondary Cost factors The United
States ranked fifth among the 17 countries The country with the lowest rank was Brazil
with Japan Mexico Vietnam and India ranking just above
To understand the overall CoDB rankings based on the Primary Cost Index and the
Secondary Cost Index Table 4 (Primary Costs) and Table 5 (Secondary Costs) summarize
the rankings across the two subcategories of factors For Primary Costs unsurprisingly
for the most part Malaysia China Mexico and Vietnam are all tied for top position (ie
most competitive)
Results
Countries Ranking CoDB Index Score by Country (1=best 5=worst)
Canada 1 254
Taiwan 2 263
South Korea 3 265
Malaysia 4 267
United States 5 269
United Kingdom 6 269
Germany 7 274
Switzerland 8 277
Ireland 9 277
France 10 283
China 11 284
Italy 12 300
Japan 13 326
Mexico 14 333
Vietnam 15 346
India 16 349
Brazil 17 420
8Cost of manufacturing operations
around the globe
copy 2020 KPMG LLP a Delaware limited liability partnership and a member firm of the KPMG global organization of independent member firms
affiliated with KPMG International Limited a private English company limited by guarantee All rights reserved The KPMG name and logo are
trademarks used under license by the independent member firms of the KPMG global organization NDP08974-1A
From a review of the Primary and the Secondary Cost Indices it becomes apparent there are
different reasons why countries rank where they do on the CoDB Index Consider the case of
Canada which scored highest on the CoDB Index The primary driver of this rank is the fact that
Canada scored very highly on the Secondary Cost Index while maintaining a middle rank on the
Primary Cost Index The United Statesrsquo overall 5th place ranking is primarily driven by its score
on the Secondary Cost Index since it ranks 14th on the Primary Cost Index
Table 4 Country ranking ndash Primary Cost Index
Source Cost of Manufacturing Operations Around the Globe KPMG LLP 2020
Countries Ranking CoDB Primary Score Index by Country (1=best 5=worst)
Malaysia 1 240
China 1 240
Mexico 1 240
Vietnam 1 240
India 5 260
Canada 6 280
Taiwan 6 280
Italy 6 280
South Korea 9 300
Ireland 9 300
France 9 300
Germany 12 320
United Kingdom 13 320
United States 14 340
Switzerland 14 340
Brazil 16 360
Japan 17 400
copy 2020 KPMG LLP a Delaware limited liability partnership and a member firm of the KPMG global organization of independent member firms
affiliated with KPMG International Limited a private English company limited by guarantee All rights reserved The KPMG name and logo are
trademarks used under license by the independent member firms of the KPMG global organization NDP08974-1A
Table 5 Country ranking ndash Secondary Cost Index
Source Cost of Manufacturing Operations Around the Globe KPMG LLP 2020
In contrast the ranks of Malaysia and Taiwan on the CoDB
Index result from high scores on the Primary Cost Index
For instance Taiwan ranks second on the CoDB Index
despite a ranking of seventh on the Secondary Cost Index
Interestingly Chinarsquos middling score of 11 on the CoDB
Index despite being part of a four-way tie for first on the
primary factors is caused by its poor performance (rank of
13th) on the Secondary Cost Index Chinarsquos low score on
Secondary Cost Index arises primarily from higher operating
risks Overall it appears that countries that do well on
primary factors do less well on the secondary factors and
vice versa The clear exception appears to be Brazil which
ranks poorly on both indices
Primary Costs are clearly important to location decisions
To examine how the overall CoDB ranking may change
under an alternate set of weights we recomputed the
results placing a a greater consideration on Primary Costs
That is we re-ran our analysis changing the weight of
the Primary Costs and Secondary Costs from equal or 50
percentndash50 percent weighting to 70 percentndash30 percent
in favor of Primary Costs As presented in Table 6 not
surprisingly this caused Chinarsquos ranking on the CoDB Index
to move up significantly from 11th to 3rd and the US
ranking to decline from 5th to 12th However Canada
Malaysia and South Korea retained their top-five CoDB
rankings despite this change
Countries Ranking CoDB Secondary Index Score by Country (1=best 5=worst)
United States 1 197
Switzerland 2 213
United Kingdom 3 219
Canada 4 227
Germany 5 228
South Korea 6 229
Taiwan 7 247
Japan 8 252
Ireland 9 254
France 10 265
Malaysia 11 293
Italy 12 321
China 13 328
Mexico 14 426
India 15 438
Vietnam 16 451
Brazil 17 481
10Cost of manufacturing operations
around the globe
copy 2020 KPMG LLP a Delaware limited liability partnership and a member firm of the KPMG global organization of independent member firms
affiliated with KPMG International Limited a private English company limited by guarantee All rights reserved The KPMG name and logo are
trademarks used under license by the independent member firms of the KPMG global organization NDP08974-1A
Table 7 US ranking with higher weight on labor quality
Source Cost of Manufacturing Operations Around the Globe
KPMG LLP 2020
CountriesOverall ranking
Primary Cost
ranking
Secondary Cost
ranking
Ireland 1 9 2
Canada 2 6 5
Germany 3 12 4
United States 4 14 1
Switzerland 5 14 3
South Korea 6 9 6
7 We increase the weight on quality of labor to 70 percent in the Secondary Cost Index and equally weight the other
three measures at 10 percent each
8 The US tax rates used here are after tax reform
Understanding the results
Primary Cost Index
Table 8 Selected country Primary Cost percentile rankings (sorted by Primary Cost Index)
Source Cost of Manufacturing Operations Around the Globe KPMG
LLP 2020
To understand these results better we further examined the
constituents of the Primary and Secondary Cost Indices
To further understand the drivers of our findings we
examined which factors cause East Asian countries such as
Vietnam Taiwan and Malaysia to rank highly on the Primary
Cost Index and the US to rank 14 Table 8 to follow presents
constituent ranks for countries that rank highly on the Primary
Cost IndexmdashVietnam Taiwan Malaysia India China and
Mexicomdashand for the United States Note that the table
shows percentile ranks that is to say a percentile rank of 5
represents top 15 percentile of costs The percentile ranking
of 1 indicates the best performing in the category and the
percentile ranking of 5 indicates the worst performing in the
category (see Appendix D for additional details) As Table
8 indicates the differences are most stark with respect to
hourly compensation costs between US and other countries
CountryHourly
compensation costs
Real estate costs
Utility costs
Corporate tax rates
Interest rates
Malaysia 2 1 3 2 4
China 2 2 1 3 4
Mexico 1 1 1 4 5
Vietnam 1 4 1 2 4
India 1 1 2 4 5
Taiwan 3 4 2 2 3
United States
5 3 3 3 3
In terms of real estate costs and cost of capital the
United States is relatively competitive compared to the
Southeast Asian nations Among these countries only
India Malaysia and China had lower average costs for
industrial property than the US while only Taiwan had
a lower interest rate The US compares less favorably
to the Southeast Asian nations on the measures of utility
costs and corporate tax rates8 The US is tied with
Malaysia for the highest electricity costs among these
countries significantly higher than the average rate paid
by Chinese electricity users In terms of corporate tax
rates among this group only India and Mexico have higher
statutory tax rates at 30 percent compared to 27 percent
for the US
From a labor market perspective the quality of labor
available in the US is a strong asset However increasing
the weight of the quality of labor measure reveals that
there is also significant competition from European
countries and Canada in this regard For example as
presented in Table 7 increasing the weight on the
quality of labor to 70 percent from 25 percent within
the Secondary Cost Index (but maintaining equal weight
between Primary and Secondary Costs) causes Ireland
Germany and Switzerland to rise to the top five most
competitive countries with the US and Canada rising and
falling by one rank respectively7
Table 6 Country ranking with higher weight on Primary Costs
Source Cost of Manufacturing Operations Around the Globe
KPMG LLP 2020
CountriesCoDB Index
ranking
Primary Cost Index
ranking
Secondary Cost Index
ranking
Malaysia 1 1 11
Canada 2 6 4
China 3 1 13
Taiwan 4 6 7
South Korea 5 9 6
Ireland 6 9 9
copy 2020 KPMG LLP a Delaware limited liability partnership and a member firm of the KPMG global organization of independent member firms
affiliated with KPMG International Limited a private English company limited by guarantee All rights reserved The KPMG name and logo are
trademarks used under license by the independent member firms of the KPMG global organization NDP08974-1A
Table 9 Industrialized country Primary Cost percentile rankings (sorted by Primary Cost Index)
Source Cost of Manufacturing Operations Around the Globe
KPMG LLP 2020
CountryHourly
compensation costs
Real estate costs
Utility costs
Corporate tax rates
Interest rates
Canada 3 3 2 3 3
South
Korea3 3 3 3 3
United
Kingdom3 5 4 1 3
United States
5 3 3 3 3
Japan 3 5 5 5 2
The impact of tax reform
As part of this analysis we also examined if tax reform
had a material impact on the relative standing of the
US In particular we examined how the US would
have ranked had we used the pre-tax-reform corporate
tax rate of 40 percent (combined federal and state
average) instead of the post-tax-reform combined rate
of 27 percent
It is worth noting here that our analysis of the tax
input is limited to the statutory corporate rate only
We recognize that many other factors contribute to the
overall tax burden in any given jurisdiction ndash including
but not limited to the methodology of cost recovery
deductibility of debt service and the taxation of cross
border flows of income Those other factors which vary
from jurisdiction to jurisdiction were outside the scope
of this report Still we believe that use of the statutory
rate alone provides valid directional information even if
not necessarily the entire picture
As presented in Table 10 the tax reform improved the
USrsquos ranking not only on the corporate tax measure
but also on the Primary Cost Index and the CoDB Index
With tax reform the US was considered a median tax
country Had the US corporate tax rate continued to be
40 percent it would have one of the highest corporate
tax rates in the comparison group of countries The tax
reform resulted in the US ranking on the Primary Cost
Index to improve two notches from being 16th to 14th
out of the 17 countries The impact on the CoDB Index
score is even more significant with the US ranking
increasing from 11th place (considering pre-reform tax
rates) to 5th (after tax reform)
Ranking of the industrialized countries
Table 9 provides a comparison to some of the industrialized
countries relative to the US The table shows percentile
ranks that is to say a percentile rank of 5 represents
the top 15th percentile of costs (worst performing
from competitiveness standpoint) while a percentile
rank of 1 slots into the best performing in the category
(see Appendix D for additional details) We note that
even compared to the industrialized countries US
labor costs are high Hourly rates in Canada United
Kingdom and Japan range between $23 per hour and
$30 per hour compared to $39 per hour in the US With
respect to corporate tax rates where tax reform lowered
rates significantly the US rates are lower than Japan
comparable to Canada but still higher than that imposed
by the United Kingdom
12Cost of manufacturing operations
around the globe
copy 2020 KPMG LLP a Delaware limited liability partnership and a member firm of the KPMG global organization of independent member firms
affiliated with KPMG International Limited a private English company limited by guarantee All rights reserved The KPMG name and logo are
trademarks used under license by the independent member firms of the KPMG global organization NDP08974-1A
Secondary Cost Index
With respect to Secondary Cost factors the US clearly is in a strong position As Table 11 below
indicates (the countries sorted by their respective rank on the Secondary Cost Index) the US
scores are among the top three on almost all of the metrics including quality of labor transport
infrastructure and ease of doing business The scores below represent weighted averages of
percentile ranks for each measure considered under the category A score of one (1) is best while
five (5) is worst (see Appendix D for additional details)
Source Cost of Manufacturing Operations Around the Globe KPMG LLP 2020
Table 11 Secondary Index Cost factor scores (sorted by Secondary Cost Index)
CountriesQuality of labor score
Ease of doing business score
Infrastructure score10
Infrastructure ndash Transport score
Infrastructure ndash Utility score
Risk and protections score
United States 167 200 222 200 267 200
Switzerland 167 167 244 300 233 275
United Kingdom 267 233 225 275 300 150
Canada 233 233 242 325 300 200
Germany 167 267 228 250 233 250
South Korea 233 333 150 150 200 200
Taiwan 300 233 278 300 233 175
Japan 233 300 225 175 200 250
Ireland 133 300 358 475 300 225
France 267 300 269 275 233 225
Malaysia 333 233 306 250 367 300
Italy 333 300 350 350 300 300
China 367 233 364 225 367 350
Mexico 433 400 444 400 433 425
India 500 433 442 325 500 375
Vietnam 467 433 431 425 467 475
Brazil 500 500 447 475 467 475
9 Infrastructure score is a combined score across transportation utility and internet Details are shown for transportation and utility
subcomponents while internet access is not shown in the table but is included the combined score Each of these three factors
(transport utility and internet) get an equal weight
CountriesCurrent CoDB index rank
Pre-tax-reform CoDB index rank
Change in rankings due to US tax reform
Canada 1 1 0
Taiwan 2 2 0
South Korea 3 4 +1
Malaysia 4 5 +1
United States 5 11 +6
United Kingdom 6 6 0
Source Cost of Manufacturing Operations Around the Globe KPMG LLP 2020
Table 10 Impact of the US tax reform
copy 2020 KPMG LLP a Delaware limited liability partnership and a member firm of the KPMG global organization of independent member firms
affiliated with KPMG International Limited a private English company limited by guarantee All rights reserved The KPMG name and logo are
trademarks used under license by the independent member firms of the KPMG global organization NDP08974-1A
Source Cost of Manufacturing Operations Around the Globe
KPMG LLP 2020
Table 12 Percentile ranks for cost and quality of labor
On all of the secondary factors considered including quality
of labor the United States ranks significantly better than
countries that offer lower labor costs such as Vietnam
China Mexico and India To put it differently the low ranking
of these countries on the Secondary Cost Index reflects
the weaker investment climatemdashfor example the poorer
connectivity from limited road rail and airline networks more
challenging business operating environments and lower
levels of transparency in government operation and reduced
legal protections available to businesses
The industrialized countries generally rank favorably and
similarly across secondary metrics falling for the most part
in the top half of the countries Among them however
the US clearly ranks better with respect to at least two
factors the quality of labor and ease of doing business
Thus relative to the other 16 countries considered the
US ranks best on the Secondary Cost components
Labor ndash Cost and quality
As noted earlier compensation cost is often the most cited
factor for locating manufacturing facilities in Asian countries
such as China Taiwan or Vietnam As the data confirm these
countries do offer among the lowest hourly compensation
costs for labor Further the hourly compensation costs in the
US are among the highest in the world
As Table 12 shows a different picture emerges when
productivity attributes are considered in addition to the
quality of labor For example countries with the most
favorable cost attributes are not always the ones with the
highest real value added per employee In fact Table 12
suggests a high degree of positive correlation between
costs and productivity
Thus it would appear that for manufacturing activities that
are more routine in nature and require less advanced skills
where the loss of productivity may be outweighed by lower
costs companies may consider locating their manufacturing
facilities in lower costs countries such as China Vietnam
or Taiwan however in higher-value-added manufacturing
where the process is more complex or automated and
requires highly skilled labor to manage the United States
may be considered more favorably as a location
CountriesHourly
compensation costs
RVA per employee
Vietnam 1 5
India 1 5
Mexico 1 4
China 2 4
Malaysia 2 4
Brazil 2 5
Taiwan 3 3
South Korea 3 3
Japan 3 3
United Kingdom 3 2
Canada 3 3
Italy 4 3
Ireland 4 1
France 4 2
United States 5 1
Germany 5 2
Switzerland 5 1
14Cost of manufacturing operations
around the globe
copy 2020 KPMG LLP a Delaware limited liability partnership and a member firm of the KPMG global organization of independent member firms
affiliated with KPMG International Limited a private English company limited by guarantee All rights reserved The KPMG name and logo are
trademarks used under license by the independent member firms of the KPMG global organization NDP08974-1A
ConclusionsOur results indicate that countries that placed better on
the Secondary Cost Index generally performed better on
the overall rankings Of the top five most competitive
economies on the overall rankings only twomdashMalaysia and
Taiwanmdashhave a better primary than secondary cost score
In keeping with this trend of lower Secondary Cost
countries scoring better on the CoDB Index the United
States placed fifth on the CoDB Index despite being tied
with Switzerland for 14th on the Primary Cost Index This
high Primary Cost Index ranking was primarily due to high
labor costs The United States was able to compensate
somewhat for these unfavorable scores on the Primary
Cost Index by placing first in the Secondary Cost Index
As part of this analysis we also examined if tax reform had
a material impact on the relative standing of the US In
particular we compared how the US ranks now (post-tax-
reform combined federal and local tax rate of 27 percent)
relative to the pre-reform with a corporate tax rate of 40
percent (combined federal and state average) The impact
on the USrsquos CoDB Index ranking is quite significant After
tax reform the USrsquos competitiveness increasedmdashas
evidenced by its current rank of 5mdashcompared with its
previous rank of 11 under pre-reform tax rates
A closer look at the countries that outperformed the US
on the CoDB Index ranking indicates some interesting
factors For example the US outperformed all of the
countries on the Secondary Cost Index due to better labor
productivity and business conditions This implies that the
outperformance on the CoDB Index by Canada Taiwan
South Korea and Malaysia are all driven by Primary Cost
factors Specifically Canadarsquos rank is driven primarily by
its ability to offer lower compensation costs and slightly
lower electricity rates while still maintaining Secondary
Cost Index rankings that were not far behind the US
South Korea ranked third by offsetting weaker ranking on
the Secondary Cost Index with even lower compensation
costs A sharper version of the tradeoff between Primary
and Secondary Cost explains the rankings of Taiwan and
Malaysia with Taiwan offering higher primary costs but
lower secondary costs
This study has focused on certain CoDB factors that are
commonly considered in manufacturing facility location
decisionsmdashat the country levelmdashand the results provide a
high-level perspective on the attributes of various countries
with respect to these factors However the location
decision is specific to each company and its consideration
of the supply chain and access to markets The decision
may be impacted by the type of industry the company is
active in the type of product where customers are and
the companyrsquos overall business strategy Thus individual
location decisions are significantly more complex than we
can address in an analysis such as this
For instance for heavy equipment manufacturing from a
transportation point of view it may be better to locate the
facility closer to suppliers and the market whereas from a
production standpoint it may be more desirable to locate
the facility closer to where the desired type of workforce
or raw materials might be available Alternatively for a
specialized precision products manufacturing operation
the firmrsquos decision may be heavily impacted by the
availability of labor with advanced manufacturing skills In
other instances tax and operating incentives offered by a
country may be significant enough to outweigh weakness
on other dimensions As such the location decision is
often guided by unique factors that may go well beyond
those we have considered
Additionally even within the factors we have considered
the relative importance of these factors to a specific firm
may be different than the weights we have considered
Furthermore it may well be the case that the factors we
classify for the purpose of convenience as secondary
are in fact primary factors for consideration in a location
decision for an individual firm or manufacturing sector
Finally a number of local factors that go into firm location
decisions may or may not be captured in the country-
level analysis For example labor and rent costs are
higher in urban areas relative to more distant suburban
or rural areas Recognizing this we have developed a
Tableau analytic and visualization tool in conjunction with
this study that allows the interested reader to alter the
weights and to reassess the score based on the relative
importance of these factors to them Click here for the
Cost of Manufacturing Operations Tool We also note for
copy 2020 KPMG LLP a Delaware limited liability partnership and the US member firm of the KPMG network of independent
member firms affiliated with KPMG International Cooperative (ldquoKPMG Internationalrdquo) a Swiss entity All rights reserved The
KPMG name and logo are registered trademarks or trademarks of KPMG International NDP089741-1A
the reader that the Primary Cost factors
are measured in US dollars Since we
have compared costs on a US dollar
denominated basis our results are impacted
by the relative strength of the various
currencies relative to the dollar As the
foreign exchange rates fluctuate as they
inevitably will the cost measurements we
have relied on would vary and possibly
impact the ranking of individual cost
components even if local currency costs do
not change
Finally we note that the rankings are based
on the best historical information available
Such data is mostly available only with a lag
and therefore the impact of recent trade
disputes or the market disruptions from
COVID-19 are not reflected in the results
copy 2020 KPMG LLP a Delaware limited liability partnership and the US member firm of the KPMG network of independent
member firms affiliated with KPMG International Cooperative (ldquoKPMG Internationalrdquo) a Swiss entity All rights reserved
The KPMG name and logo are registered trademarks or trademarks of KPMG International NDP089741-1A
16Cost of manufacturing operations
around the globe
Appendix A Data sources
copy 2020 KPMG LLP a Delaware limited liability partnership and the US member firm of the KPMG network of independent
member firms affiliated with KPMG International Cooperative (ldquoKPMG Internationalrdquo) a Swiss entity All rights reserved
The KPMG name and logo are registered trademarks or trademarks of KPMG International NDP089741-1A
copy 2020 KPMG LLP a Delaware limited liability partnership and a member firm of the KPMG global organization of independent member firms
affiliated with KPMG International Limited a private English company limited by guarantee All rights reserved The KPMG name and logo are
trademarks used under license by the independent member firms of the KPMG global organization NDP08974-1A
As discussed previously we relied on a variety of sources
to gather data on 23 metrics that spanned Primary and
Secondary Cost factors
Primary Cost Index
The Conference Board is a well-known source of data for
economists While researching international labor costs
we noted two indicators related to the manufacturing
industry that we deemed useful for our study The first
is hourly compensation costs which is a sum of hourly
pay for time worked hourly direct benefits and hourly
social insurance expenditures and labor-related taxes
The Conference Board did not have this information for
Malaysia and Vietnam so we substituted the Economist
Intelligence Unitrsquos labor cost per hour (pay and nonpay
costs) figures for these two countries
Real estate cost data that is leasing cost per square foot
was compiled from a mix of sources We collected data
from real estate advisory firms and asset managers such
as Cushman amp Wakefield Colliers International CBRE
Group Deutsche Bank DWS and UBS
Utility costs measure the average price per kilowatt hour
of electricity paid by all businesses and households in each
country excluding taxes and tariffs These prices were
retrieved from each countryrsquos respective energy regulatory
agency website
Corporate tax rates were available through internal KPMG
sources The tax rates cited in this study reflect combined
statutory federal and provincial tax rates only and do not
account for specific tax incentives International Financial
Statistics provided interest rates for Brazil Canada China
India Malaysia Mexico South Korea Switzerland the
United States and Vietnam
Interest rate data for all economies except the Euro
area countries the United Kingdom Japan and Taiwan
were obtained from the International Monetary Fundrsquos
International Financial Statistics database Interest rates for
Taiwan were retrieved from the Taiwanese central bank
while rates for the remaining economies were retrieved
from the US Federal Reserve Economic Data (FRED)
database Interest rates obtained from the IMF reflect the
monetary policy-related interest rate while interest rates
obtained from all other sources measure the discount rate
Secondary Cost measures
Quality of labor
Outside of the Doing Business report the World Bank
Group provided two additional measures for our study
learning-adjusted years of schooling and access to
internetWi-Fi
Learning-adjusted years of schooling used in the quality
of labor aggregation gives us insight into how advanced
a workerrsquos skill set might be in different countries It is
calculated by multiplying the expected years of school by
the ratio of the most recent harmonized test score and to
advancement attainment on the Trends in International
Mathematics and Science Study (TIMSS) test (The World
Bank Group)11
The Global Competitiveness Index published by the
World Economic Forum included an assessment of the
skill set of graduates (secondary and university graduates)
from each country as captured by the WEFrsquos Executive
Opinion Survey It is included in the ldquoaccess to advanced
educationrdquo category Including this measure while
similar to the learning-adjusted years of schooling takes
into account how executives perceive the quality of the
labor force and allows us to consider the perspective of a
company operating in one of these countries
Real value added per employee is a crucial metric for
companies as it has a direct impact on profits It measures
how much value each additional employee is adding to
the industry For example real value added can increase
if new employees are bringing advanced skill sets into
the workforce We used total real value added from the
Conference Board as well as the total number of people
employed to calculate real value added per employee
The Conference Board did not have this information on
Malaysia and Vietnam so we found comparable variables
for real value added per employee from Malaysia and
Vietnam from separate sources
Ease of doing business
The World Bank Group annually publishes a report titled
Doing Business which ranks 190 countries based on
their ease of doing business This research involves
very detailed quantitative indicators and a few were
particularly valuable to our study We focused on the 2019
report observing the number of days to start a business
registering property enforcing contracts and protecting
minority investors indicators As noted by The World Bank
Group the number of days to start a business measures
how many days it takes for a ldquosmall- to medium-size
limited liability company to start up and formally operate
in each economyrsquos largest business cityrdquo This is the
only variable from the Doing Business report where we
did not look at the overall score for the category (starting
a business) we only observed the number of days For
the remaining three indicators we used the scores The
registering property score is based on ldquothe steps time
and cost involved in registering a property assuming
a standardized case of an entrepreneur who wants to
18Cost of manufacturing operations
around the globe
copy 2020 KPMG LLP a Delaware limited liability partnership and a member firm of the KPMG global organization of independent member firms
affiliated with KPMG International Limited a private English company limited by guarantee All rights reserved The KPMG name and logo are
trademarks used under license by the independent member firms of the KPMG global organization NDP08974-1A
purchase land and a building that is already registered
and free of title dispute In addition the score includes
the quality of the land administration system in each
economy The quality of land administration index has five
dimensions reliability of infrastructure transparency of
information geographic coverage land dispute resolution
and equal access to property rightsrdquo (The World Bank
Group) Number of days to start a business and registering
property along with burden of government regulation
were used in our ease of doing business aggregation
Burden of government regulation is another Executive
Opinion Survey question from the Global Competitiveness
Index It is a response to the survey question ldquoIn your
country how burdensome is it for companies to comply
with public administrationrsquos requirements (eg permits
regulations reporting)rdquo Respondents can choose
a number on a scale of 1 to 7 1 being ldquoextremely
burdensomerdquo and 7 being ldquonot burdensome at allrdquo
Infrastructure
The World Economic Forumrsquos (WEF) Global Competitiveness
Index (2018 Report) contains very useful indicators relating to
starting a business Based on the values or survey responses
for each variable each country is assigned a score from 1 to
100 (100 being the best) It is important to note that we used
these scores for our study not the direct values or survey
responses
The Global Competitiveness Index provides useful information
regarding a countryrsquos infrastructure We specifically look at
transportation infrastructure and utility infrastructure In this
report transportation infrastructure is addressed with eight
variables mdashfour are sourced from WEFrsquos Executive Opinion
Survey and four are based on statistics that they compiled
from external sources
Of these variables we used the survey-based figures to
measure road quality and railroad quality while we used the
external index figures from the International Air Transport
Association (IATA) and United Nations Conference on Trade
and Development to measure airport connectivity and liner
shipping connectivity respectively Index values were not
used for the road and railroad figures due to inconsistencies
with the WEF data when we attempted to reproduce the
WEFrsquos calculations for these measures
The road quality survey results capture the response to
the survey question ldquoIn your country what is the quality
(extensiveness and condition) of road infrastructure [1 =
extremely poor among the worst in the world 7 = extremely
good among the best in the world]rdquo Similarly railroad
quality captures the average response to the question ldquoIn
your country how efficient (ie frequency punctuality
speed price) are train transport services [1 = extremely
inefficient among the worst in the world 7 = extremely
efficient among the best in the world]rdquo Airport connectivity
represents ldquothe IATA airport connectivity indicator which
measures the degree of integration of a country within the
global air transport networkrdquo The Liner shipping connectivity
index ldquoassesses a countryrsquos connectivity to global shipping
networksrdquo and is based on ldquofive components of the maritime
transport sector the number of ships their container-carrying
capacity the maximum vessel size the number of services
and the number of companies that deploy container ships in a
countryrsquos portsrdquo (World Economic Forum)
For utility infrastructure we gathered electric power losses
exposure to unsafe drinking water and reliability of water
supply from the Global Competitiveness Index Electric power
losses which measures a countryrsquos electricity quality and
exposure to unsafe drinking water which takes into account
ldquothe extent of exposure by risk level and the severity of that
riskrsquos contribution to disease burdenrdquo are both based on
statistics that were compiled from external sources Reliability
of water supply is taken from the WEFrsquos Executive Opinion
Survey and answers the question ldquoIn your country how
reliable is the water supply (lack of interruptions and flow
fluctuations)rdquo Respondents can choose a number on a
scale of 1 to 7 1 being ldquoextremely unreliablerdquo and 7 being
ldquoextremely reliablerdquo As mentioned earlier the World Bank
Group provides us with our indicator access to internetWi-
Fi which is part of the overall infrastructure aggregation It
measures the percentage of the population that is using the
internet
Risk and protections
Our political risk data was sourced from the insurance
company Credendorsquos ldquoCountry Risks Synthetizing Chartrdquo
Countries are classified into seven categories (from 1 to 7)
reflecting the intensity of risks arising as a result of political
and assimilated events Category 1 includes those countries
for which the risk is considered the lowest and category 7
contains those countries with the highest likelihood of risks
being caused by political and assimilated events In our study
we chose to focus on political risk over medium- and long-
term periods
Enforcing contracts and protecting minority investors along
with political risk and the corruption perception index were
included in our risk and protections aggregation According
to the World Bank Group the enforcing contracts score
ldquomeasures the time and cost for resolving a commercial
dispute through a local first-instance court and the quality of
copy 2020 KPMG LLP a Delaware limited liability partnership and a member firm of the KPMG global organization of independent member firms
affiliated with KPMG International Limited a private English company limited by guarantee All rights reserved The KPMG name and logo are
trademarks used under license by the independent member firms of the KPMG global organization NDP08974-1A
Measure Country Source Source detail Year Link
Hourly Compensation Costs
All (except Malaysia and Vietnam)
The Conference Board
International Comparisons of Hourly Compensation Costs in Manufacturing
2016 httpwwwconference-boardorgilcprogramindexcfmid=38269
Hourly Compensation Costs
Malaysia and Vietnam
The Economist Intelligence Unit General Statistics Office of Vietnam and Department of Statistics Malaysia
Estimated Labor Cost per Hour Manufacturing
2016 Both httpdataeiucomEI UTableViewaspx initial=trueamppub type_id=1253181310
Vietnam
httpswwwgsogov vndefault_enaspx tabid=783
Malaysia
httpsnewssstatisticsgovmynewss-portalx epepDownloadContent SearchseamcontentId =54516ampactionMethod =ep2FepDownload ContentSearchxhtml 3AcontentActiondo DisplayContentampcid= 12789
Real Estate Costs
See Appendix E
Utility Costs China China Electricity Council
Analysis of National Electricity Market Transaction Information in the Fourth Quarter of 2018
2018 Adjusted to 2015 USD
httpwwwcecorgcnguihuayutongjidianligaige2019-03 -04189190html
Primary Cost measures ndash References
judicial processes index evaluating whether each economy
has adopted a series of good practices that promote
quality and efficiency in the court systemrdquo Protecting
minority investors focuses on ldquothe strength of minority
shareholder protections against misuse of corporate assets
by directors for their personal gain as well as shareholder
rights governance safeguards and corporate transparency
requirements that reduce the risk of abuserdquo (The World
Bank Group)
The WEFrsquos Global Competitiveness Index provided scores
for each country based on the Corruption Perception Index
2016 results This index measures ldquoperceptions of corruption
in the public sectorrdquo and is scaled from 0 (highly corrupt) to
100 (very clean) According to Transparency International
who created the index ldquoThe global average score is a
paltry 43 indicating endemic corruption in a countryrsquos public
sector Top-scoring countries are far outnumbered by [low-
scoring] countries where citizens face the tangible impact of
corruption on a daily basisrdquo
Specific data sources used and linked references are provided
below
20Cost of manufacturing operations
around the globe
copy 2020 KPMG LLP a Delaware limited liability partnership and a member firm of the KPMG global organization of independent member firms
affiliated with KPMG International Limited a private English company limited by guarantee All rights reserved The KPMG name and logo are
trademarks used under license by the independent member firms of the KPMG global organization NDP08974-1A
Measure Country Source Source detail Year Link
Utility Costs France Germany Ireland Italy and United Kingdom
Eurostat Electricity prices for nonhousehold consumers ndash biannual data
2015 httpappssoeurostateceuropaeunuishowdodataset=nrg_pc_205amplang=en
Utility Costs Canada Government of Canada ndash Canada Energy Regulator
Market Snapshot Explaining the high cost of power in northern Canada February 16 2017
2016 Adjusted to 2015 USD
The Canada Energy Regulator 2017 Reproduced with the permission of Public Works and Government Services 2020
Utility Costs Brazil Governo do Brasil
Anuaacuterio Estatiacutestico de Energia Eleacutetrica 2016
2015 httppateducacaobagovbrconteudosconteudos-digitaisdownload8667pdf
Utility Costs South Korea Korea Energy Statistical Information System
Average revenues per kWh sold by segments
2015 httpwwwkesisnetsubsubChartEngjspreport_id=34110ampreport Type=0
Utility Costs Malaysia Malaysia Energy Data and Research
Malaysia Energy Statistics Handbook 2018
2015 httpsmeihstgovmydocuments10620c7e69704-6f80-40ae-a764-ad0acf4a844d
Utility Costs India Power Finance Corporation Ltd (A Govt of India Undertaking)
The Performance of State Power Utilities for the years 2013ndash14 to 2015ndash16
2015 httpswwwpfcindiacomDocumentRepositoryckfinderfilesOperationsPerformance_Reports_of_State_Power_Utilities1_Report on the Performance of State Power Utilities 2013-14 to 2015-16pdf
Utility Costs Switzerland Swiss Office of Energy
Switzerland Utility Costs 2015 httpswwwbfeadminchbfedehomehtml
Utility Costs Taiwan Taiwan Bureau of Energy
Energy Statistical Annual Reports
2015 httpswwwmoeaboegovtwECWenglishcontentContentLinkaspxmenu_id=1540
Utility Costs Japan US Energy Information Administration ndash Independent Statistics and Analysis
Japanrsquos electricity prices rising or stable despite recent fuel cost changes
2015 httpswwweiagovtodayinenergydetailphpid=27872
copy 2020 KPMG LLP a Delaware limited liability partnership and a member firm of the KPMG global organization of independent member firms
affiliated with KPMG International Limited a private English company limited by guarantee All rights reserved The KPMG name and logo are
trademarks used under license by the independent member firms of the KPMG global organization NDP08974-1A
Measure Country Source Source detail Year Link
Utility Costs United States US Energy Information Administration ndash Independent Statistics and Analysis
Average retail price of electricity United States annual
2015 httpswwweiagov
electricitydatabrowser
topic7agg=01ampgeo=
gampendsec=vgamplinechart
=ELECPRICEUS-ALL
A~ELECPRICEUS-RES
A~ELECPRICEUS-COM
A~ELECPRICEUS-IND
Aampcolumnchart=ELEC
PRICE
US-ALLA~ELECPRICE
US-RESA~ELECPRICE
US-COMA~ELECPRICE
US-INDAampmap=ELEC
PRICEUS-ALLAampfreq=
Aampctype=linechartlt=rdquordquo
div=rdquordquo style=rdquobox-sizing
border-boxrdquogt
Utility Costs Mexico US Energy Information Administration ndash Independent Statistics and Analysis
Mexico electricity market reforms attempt to reduce costs and develop new capacity
2015 httpswwweiagovtodayinenergydetailphpid=26932
Utility Costs Vietnam Vietnam Electricity ndash EVN
Vietnam Electricity Annual Report 2016
2015 httpsenevncomvnuserfileUserhuongbttfiles20177AnnualReport2016pdf
Corporate Tax Rates
All KPMG Corporate tax rates table 2019 httpshomekpmgxxenhomeservicestaxtax-tools-and-resourcestax-rates-onlinecorporate-tax-rates-tablehtml
Interest Rates Euro Area India and Japan
Federal Reserve Economic Data (FRED)
Discount Rates (Euro Area India and Japan)
2018 httpsfredstlouisfedorg
Interest Rates Taiwan Central Bank of the Republic of China
Discount Rate (Taiwan) 2018 httpswwwcbcgovtwenlp-695-2html
Interest Rates United Kingdom Bank of England Discount Rate (UK) 2018 httpswwwbankofenglandcoukmonetary-policythe-interest-rate-bank-rate
Interest Rates All (except Euro Area the UK India Japan and Taiwan)
International Financial Statistics
Interest Rates and Monetary Policy-Related Interest Rate percent per annum
2018 httpsdataimforg sk=388DFA60-1D26- 4ADE-B505-A05A55 8D9A42amp sId=1479331931186
22Cost of manufacturing operations
around the globe
copy 2020 KPMG LLP a Delaware limited liability partnership and a member firm of the KPMG global organization of independent member firms
affiliated with KPMG International Limited a private English company limited by guarantee All rights reserved The KPMG name and logo are
trademarks used under license by the independent member firms of the KPMG global organization NDP08974-1A
Secondary Cost measures
Measure Country Source Source detail Years Link
Learning-
Adjusted Years
of Schooling
All The World Bank Learning-Adjusted
Years of Schooling
2017 httpstcdata360
worldbankorg
indicatorsh00280750
country=BRA
ampindicator
=40964ampviz=bar_
chartampyears=2017
Skill set of
Graduates
All (except China) World Economic
Forum
Global
Competitiveness
Index 2019
Weighted
Average 2018ndash
2019
httpstcdata360
worldbankorg
indicators
h00280750
country=
BRAampindicator=
40964ampviz=
bar_chartampyears=2017
httpreports
weforumorg
global-
competitiveness-
report-2018
China Weighted Average
2016ndash2017
RVA per
Employee
All The Conference
Board
International
Comparisons of
Manufacturing
Productivity and
Unit Labor Costs
2017 httpswww
conference-board
orgilcprogram
indexcfmid=42672
Number of
Days to Start a
Business
All The World Bank Doing Business
2019
2019 httpswww
doingbusinessorg
endata
Burden of
Government
Regulation
All (except China) World Economic
Forum
Global
Competitiveness
Index 2019
Weighted
Average of
2018ndash2019
httpreports
weforumorgglobal-
competitiveness-
report-2019China Weighted
Average of
2016ndash2017
Registering
Property
All The World Bank Doing Business
2019
2019 httpswww
doingbusinessorg
endata
Road Quality All (except China) World Economic
Forum
Global
Competitiveness
Index 2019
Weighted
Average of
2018ndash2019
httpreports
weforumorgglobal-
competitiveness-
report-2019China Weighted
Average of
2016ndash2017
copy 2020 KPMG LLP a Delaware limited liability partnership and a member firm of the KPMG global organization of independent member firms
affiliated with KPMG International Limited a private English company limited by guarantee All rights reserved The KPMG name and logo are
trademarks used under license by the independent member firms of the KPMG global organization NDP08974-1A
Measure Country Source Source detail Years Link
Railroad Quality All (except China) World Economic
Forum
Global
Competitiveness
Index 2019
Weighted
Average of
2018ndash2019
httpreports
weforumorgglobal-
competitiveness-
report-2019China Weighted
Average of
2016ndash2017
Airport
Connectivity
All World Economic
Forum
Global
Competitiveness
Index 2019
2018 httpreports
weforumorgglobal-
competitiveness-
report-2019
Liner Shipping
Connectivity
Index
AllWorld Economic
Forum
Global
Competitiveness
Index 2018
2018
httpreports
weforumorgglobal-
competitiveness-
report-2018
Electric Power
LossesAll
World Economic
Forum
Global
Competitiveness
Index 2018
2016
httpreports
weforumorgglobal-
competitiveness-
report-2018
Exposure to
Unsafe Drinking
Water
AllWorld Economic
Forum
Global
Competitiveness
Index 2018
2017
httpreports
weforumorgglobal-
competitiveness-
report-2018
Reliability of
Water Supply
All (except China)
World Economic
Forum
Global
Competitiveness
Index 2018
Weighted
Average
2018ndash2019httpreports
weforumorgglobal-
competitiveness-
report-2018China
Weighted
Average
2016ndash2017
Access to
InternetWi-Fi
France Germany
Ireland Italy
Malaysia
Mexico South
Korea UK
Vietnam Taiwan The World Bank
Individuals using
the Internet ( of
population)
2018 httpsdata
worldbank
orgindicator
ITNETUSER
ZSview=mapBrazil Canada
China India
Japan
Switzerland US
2017
Political Risk All CredendoCountry Risk and
Insights2019
24Cost of manufacturing operations
around the globe
copy 2020 KPMG LLP a Delaware limited liability partnership and a member firm of the KPMG global organization of independent member firms
affiliated with KPMG International Limited a private English company limited by guarantee All rights reserved The KPMG name and logo are
trademarks used under license by the independent member firms of the KPMG global organization NDP08974-1A
Measure Country Source Source detail Years Link
Corruption
Perception
Index
AllWorld Economic
Forum
Global
Competitiveness
Index 2018
2018
httpreports
weforumorgglobal-
competitiveness-
report-2018
Protecting
Minority
Investors
All The World BankDoing Business
20192019
httpswww
doingbusinessorg
endata
Enforcing
ContractsAll The World Bank
Doing Business
20192019
httpswww
doingbusinessorg
endata
Measure Country Source Source detail Years Link
Manufacturing
Value Added
All except Taiwan World Bank World Bank National
Accounts Data
2016 httpsdata
worldbankorg
indicatorNVIND
MANFCD
Manufacturing
Value Added
Taiwan The Conference
Board
International
Comparisons of
Manufacturing
Productivity and Unit
Labor Costs
2016 httpswww
conference-board
orgilcprogram
indexcfmid=42672
Manufacturing
Exports to the
US
All US Census
Bureau
Manufacturing Exports
(Customs Value)
2016 httpsusatrade
censusgov
Labor Share of
Manufacturing
Costs
United States Morgan Stanley
ndash As reported in
Business Insider
Chart of the Day The
Manufacturing Cost
Components For A
Bunch Of Different
Things
2013 httpswww
businessinsider
comchart-the-cost-
of-manufacturing-
stuff-2013-4
Trade-Weighted
US Dollar
Index
NA Federal Reserve
Bank of St Louis
Trade-Weighted US
Dollar Index Major
Currencies Goods
(Index Mar 1973=100
Monthly Not
Seasonally Adjusted)
2015ndash2019 httpsfred
stlouisfedorg
seriesTWEXMMTH
Other supporting data sources
copy 2020 KPMG LLP a Delaware limited liability partnership and the US member firm of the KPMG network of independent
member firms affiliated with KPMG International Cooperative (ldquoKPMG Internationalrdquo) a Swiss entity All rights reserved
The KPMG name and logo are registered trademarks or trademarks of KPMG International NDP089741-1A
copy 2020 KPMG LLP a Delaware limited liability partnership and a member firm of the KPMG global organization of independent member firms
affiliated with KPMG International Limited a private English company limited by guarantee All rights reserved The KPMG name and logo are
trademarks used under license by the independent member firms of the KPMG global organization NDP08974-1A26
Cost of manufacturing operations
around the globe
copy 2020 KPMG LLP a Delaware limited liability partnership and the US member firm of the KPMG network of independent
member firms affiliated with KPMG International Cooperative (ldquoKPMG Internationalrdquo) a Swiss entity All rights reserved
The KPMG name and logo are registered trademarks or trademarks of KPMG International NDP089741-1A
Appendix B Review of other studies
copy 2020 KPMG LLP a Delaware limited liability partnership and the US member firm of the KPMG network of independent
member firms affiliated with KPMG International Cooperative (ldquoKPMG Internationalrdquo) a Swiss entity All rights reserved
The KPMG name and logo are registered trademarks or trademarks of KPMG International NDP089741-1A
copy 2020 KPMG LLP a Delaware limited liability partnership and a member firm of the KPMG global organization of independent member firms
affiliated with KPMG International Limited a private English company limited by guarantee All rights reserved The KPMG name and logo are
trademarks used under license by the independent member firms of the KPMG global organization NDP08974-1A
While each companyrsquos location selection decision is
unique and reflects a range of factors various studies
have attempted to compare how companies would fare
if they considered alternate locations for their production
facilities For instance the Boston Consulting Group
performed a study in 2014 that examined the perception
that Latin America or Eastern Europe offered lower costs
of production than Western Europe the US or Japan
Based on a set of metrics such as manufacturing wages
labor productivity energy costs and exchange rates across
25 countries over time the study concluded that some of
the cost advantages of the lower-cost-base countries such
as Brazil and China have eroded over time10
The Congressional Research Service also performed a
study to assess the health of US manufacturing relative
to other countries in 201811 While focused primarily on
overall manufacturing trends in areas such as value added
by the manufacturing sector countriesrsquo share of global
manufacturing manufacturing employment and research
and development spending the study also compared
hourly costs in manufacturing across 14 countries
The study concluded that US labor costs are well above
those in emerging economies but similar in magnitude to
those in the major economies of continental Europe
Yet another study performed by the Brookings Institution
considered a broader range of indicators spanning topics
such as overall policies and regulations tax policy
energy transportation health costs workforce quality
and infrastructure and innovation across 19 countries12
This study however did not compare labor costs in
manufacturing Based on the scorecard developed by the
authors to assess the manufacturing environment the
study noted that countries that had made investments in
workforce and infrastructure such as the United Kingdom
Switzerland the United States Japan and Canada fared
much better than nations such as Brazil Indonesia
Mexico Russia India and China Our study takes a more
firm-centric approach We consider only the leading
manufacturing exporters to the US as our comparison
countries and consider a focus on primary costs including
labor and real estate
10 Boston Consulting Group ldquoThe Shifting Economics of Global Manufacturing How Cost Competitiveness is Changing Worldwiderdquo 2014
11 Congressional Research Service US Manufacturing in International Perspective February 21 2018
12 Brookings Institution Global Manufacturing Scorecard How the US Compares to 18 Other Nations 2018
28Cost of manufacturing operations
around the globe
copy 2020 KPMG LLP a Delaware limited liability partnership and the US member firm of the KPMG network of independent
member firms affiliated with KPMG International Cooperative (ldquoKPMG Internationalrdquo) a Swiss entity All rights reserved
The KPMG name and logo are registered trademarks or trademarks of KPMG International NDP089741-1A
Appendix C Shortlist of comparison countries
copy 2020 KPMG LLP a Delaware limited liability partnership and the US member firm of the KPMG network of independent
member firms affiliated with KPMG International Cooperative (ldquoKPMG Internationalrdquo) a Swiss entity All rights reserved
The KPMG name and logo are registered trademarks or trademarks of KPMG International NDP089741-1A
copy 2020 KPMG LLP a Delaware limited liability partnership and a member firm of the KPMG global organization of independent member firms
affiliated with KPMG International Limited a private English company limited by guarantee All rights reserved The KPMG name and logo are
trademarks used under license by the independent member firms of the KPMG global organization NDP08974-1A
Table 13 2016 global country rankings
Source US Census Bureau World Bank
This analysis considers a total of 16 economies in addition to the United States Table 13 lists each of
these economies as well as their respective rankings by manufacturing exports to the US and total
value added in manufacturing in 2016 Figure 2 presents the accompanying dollar value of manufacturing
exports for each economy to the US in 2016
These countries were first selected based on the customs value of manufacturing exports to the US
However the list generated on this basis did not include any countries from South America To make the
study more comprehensive Brazil the leading economy in South America with an industrial manufacturing
base in automotive aircraft and other sectors was added to the list
Country Manufacturing exports to US Total manufacturing value add
China 1 1
Mexico 2 12
Canada 3 16
Japan 4 3
Germany 5 4
Korea Rep 6 5
United Kingdom 7 9
Ireland 8 19
India 9 6
Italy 10 7
France 11 8
Vietnam 12 46
Taiwan 13 13
Malaysia 14 26
Switzerland 15 17
Brazil 18 10
copy 2020 KPMG LLP a Delaware limited liability partnership and the US member firm of the KPMG network of independent
member firms affiliated with KPMG International Cooperative (ldquoKPMG Internationalrdquo) a Swiss entity All rights reserved
The KPMG name and logo are registered trademarks or trademarks of KPMG International NDP089741-1A
30Cost of manufacturing operations
around the globe
copy 2020 KPMG LLP a Delaware limited liability partnership and a member firm of the KPMG global organization of independent member firms
affiliated with KPMG International Limited a private English company limited by guarantee All rights reserved The KPMG name and logo are
trademarks used under license by the independent member firms of the KPMG global organization NDP08974-1A
We note here that while we use exports to the US as a basis for selecting these countries the selected benchmark
countries generally rank highly when based on manufacturing output as well13 There is also a significant overlap between
these countries and those considered in other studies that we reviewed
13 US Census Bureau Manufacturing Exports (Customs Value) Accessible at httpsusatradecensusgov
Source US Census Bureau
Note that Canada data is as of 2015 and Taiwan does not contain World Bank data for any year
The global manufacturing output ranking from the World Bank source is also included for reference
Figure 1 2016 Total Manufacturing Exports to the US
Export
ing e
conom
y
Customs value (USD billions)
$500$450$400$350$300$250$200$150$100$50$0
Brazil $18
Switzerland $32
Malaysia $36
Taiwan $37
Vietnam $39
France $40
Italy $42
India $43
Ireland $43
UK $46
South Korea $68
Germany $107
Japan $128
$202Canada
$264Mexico
$454China
Appendix D Index methodology
copy 2020 KPMG LLP a Delaware limited liability partnership and a member firm of the KPMG global organization of independent
member firms affiliated with KPMG International Limited a private English company limited by guarantee All rights reserved
The KPMG name and logo are trademarks used under license by the independent member firms of the KPMG global
organization NDP08974-1A
32Cost of manufacturing operations
around the globe
copy 2020 KPMG LLP a Delaware limited liability partnership and a member firm of the KPMG global organization of independent member firms
affiliated with KPMG International Limited a private English company limited by guarantee All rights reserved The KPMG name and logo are
trademarks used under license by the independent member firms of the KPMG global organization NDP08974-1A
We use 23 metrics to develop an overall weight of the country The metrics are further segregated into Primary
and Secondary Costs The Primary Costs consist of five subcategories of costs and the Secondary Costs
consisted of an additional four subcategories (with a varying number of metrics for each category for a total of
18 categories)
The Primary and Secondary Cost Indices are equally weighted at 50 percent each and each subcategory within
these two broad categories was also equally weighted The weighting for each individual factor however varies as
the number of factors consider for each metric variesmdashthus the five Primary Costs have 20 percent weight each
for an overall ranking weight of 10 percent (50 percent20 percent) while the secondary factors have 25 percent
weight each Quality of labor for example has three metrics associated with it with each metric weighted at 42
percent (approximately 50 percent25 percent13) The table below shows the final weights for each metric
Figure 2 Weights by measure category
Table 14 Final weights in overall ranking by metric
Measure Cost type SubcategoryOverall ranking weight
1 Hourly compensation costs Primary 100
2 Real estate costs Primary 100
3 Utility costs Primary 100
4 Corporate tax rates Primary 100
5 Interest rates Primary 100
6 Learning-adjusted years of schooling Secondary Quality of Labor 42
7 Skill set of graduates Secondary Quality of Labor 42
8 Real value added per employee Secondary Quality of Labor 42
9 Days to start business Secondary Ease of Doing Business 42
10 Burden of government regulation Secondary Ease of Doing Business 42
11 Registering property Secondary Ease of Doing Business 42
12 Road quality index Secondary Infrastructure 10
13 Railroad quality Secondary Infrastructure 10
14 Airport connectivity Secondary Infrastructure 10
20
20
20
20
20
PrimaryCost Index
Hourly Compensation Costs
Real Estate Costs
Utility Costs
Corporate Tax Rates
Interest Rates
SecondaryCost Index
Quality of Labor
Ease of Doing Business
Infrastructure
Risk and Protections
25
2525
25
Primary Costs
Secondary Costs
CoDB Index 5050
Table 15 Percentile rankings by metric
Measure Cost type SubcategoryOverall ranking weight
15 Liner shipping connectivity index Secondary Infrastructure 10
16 Electric power losses ( of output) Secondary Infrastructure 14
17 Exposure to unsafe drinking water Secondary Infrastructure 14
18 Reliability of water supply Secondary Infrastructure 14
19 Access to internetWi-fi Secondary Infrastructure 42
20 Political risk Secondary Risk and Protections 31
21 Enforcing contracts Secondary Risk and Protections 31
22 Protecting minority investors Secondary Risk and Protections 31
23 Corruption perception index Secondary Risk and Protections 31
In addition to the weights assigned for each metric the
methodology for developing the index consisted of the
following steps
mdash Performance on each metric is ranked using a
percentile-based methodology The top (or bottom from
an operating cost perspective based on the metric) 15
percent receives the highest rank and the lowest (or
highest) 15 percent receives a rank of 5 Ranks for real
estate costs are shown below as an example Thus the
cheapest or lowest 15 percentile of real estate costs is
rank 1 percentiles between the 15 and 35 percentiles
receive a rank of 2 and so on This is further illustrated
in the table below
mdash The final scores are calculated by applying the
appropriate weights for each metric first at the
subcategory level and combined (using weight
multiplied by the rank) with the Primary and Secondary
Cost scores and ultimately to the overall score
The scores are then ranked for ease of display and
comparison
Real estate costs
Ranking From To
1 000 1499
2 1500 3499
3 3500 6499
4 6500 8499
5 8500 10000
copy 2020 KPMG LLP a Delaware limited liability partnership and the US member firm of the KPMG network of independent member firms
affiliated with KPMG International Cooperative (ldquoKPMG Internationalrdquo) a Swiss entity All rights reserved The KPMG name and logo are
registered trademarks or trademarks of KPMG International NDP089741-1A
34Cost of manufacturing operations
around the globe
Appendix E Real estate data sources in various cities
copy 2020 KPMG LLP a Delaware limited liability partnership and the US member firm of the KPMG network of independent
member firms affiliated with KPMG International Cooperative (ldquoKPMG Internationalrdquo) a Swiss entity All rights reserved
The KPMG name and logo are registered trademarks or trademarks of KPMG International NDP089741-1A
copy 2020 KPMG LLP a Delaware limited liability partnership and a member firm of the KPMG global organization of independent member firms
affiliated with KPMG International Limited a private English company limited by guarantee All rights reserved The KPMG name and logo are
trademarks used under license by the independent member firms of the KPMG global organization NDP08974-1A
Country City Property type Source Link
Brazil Santa Cruz
Campo
Grande
Industrial Cushman amp Wakefield
Industrial Marketbeat
Q2 2019 Brazil
Industrial Report
httpswwwcushmanwakefieldcomen
brazilinsightsbrazil-marketbeats
Brazil Satildeo Paulo Industrial Cushman amp Wakefield
Industrial Marketbeat
Q2 2019 Brazil
Industrial Report
Brazil Rio de
Janeiro
Industrial Cushman amp Wakefield
Industrial Marketbeat
Q2 2019 Brazil
Industrial Report
Canada Calgary Industrial Cushman amp Wakefield
Industrial Marketbeat
Q2 2019 Canada
Industrial Report
httpswwwcushmanwakefieldcomen
canadainsightscanada-marketbeats
Canada Ottawa Industrial Cushman amp Wakefield
Industrial Marketbeat
Q2 2019 Canada
Industrial Report
Canada Toronto Industrial Cushman amp Wakefield
Industrial Marketbeat
Q2 2019 Canada
Industrial Report
China Chengdu Logistics Colliers Quarterly
Logistics Research
Chengdu-Chonqing Q1
2019
httpswwwcollierscom-media
filesmarketresearchapacchina
southwestchina-researchwestchina-
logistics-q1-2019-enpdfla=en-GB
China Beijing Logistics Colliers Quarterly
Industrial Beijing-
Tianjin-Langeang Q1
2018
httpswwwcollierscom-mediafiles
marketresearchapacchinanorthchina-
researchbj-tj-lf-industrial-q1-2018
pdfla=en-GB
China Tianjin Logistics Colliers Quarterly
Industrial Beijing-
Tianjin-Langeang Q1
2018
France Paris Industrial and
Logistics
Cushman amp Wakefield
Industrial Market
Snapshot Q2 2019
France
httpswwwcushmanwakefieldcomen
franceinsightsfrance-marketbeat
France Lyon Industrial and
Logistics
Cushman amp Wakefield
Industrial Market
Snapshot Q2 2019
France
36Cost of manufacturing operations
around the globe
copy 2020 KPMG LLP a Delaware limited liability partnership and a member firm of the KPMG global organization of independent member firms
affiliated with KPMG International Limited a private English company limited by guarantee All rights reserved The KPMG name and logo are
trademarks used under license by the independent member firms of the KPMG global organization NDP08974-1A
Country City Property type Source Link
France Marseille Industrial and
Logistics
Cushman amp Wakefield
Industrial Market
Snapshot Q2 2019
France
httpswwwcushmanwakefieldcomen
franceinsightsfrance-marketbeat
France Bordeaux Industrial and
Logistics
Cushman amp Wakefield
Industrial Market
Snapshot Q2 2019
France
France Strasbourg Industrial and
Logistics
Cushman amp Wakefield
Industrial Market
Snapshot Q2 2019
France
France Lille Industrial and
Logistics
Cushman amp Wakefield
Industrial Market
Snapshot Q2 2019
France
France Toulouse Industrial and
Logistics
Cushman amp Wakefield
Industrial Market
Snapshot Q2 2019
France
Germany Berlin Industrial and
Logistics
Colliers Industrial and
Logistics Markets
Overview Germany
20182019
httpswwwcolliersdewp-
contentuploads201906
ColliersResearchMarket-Report-
IL20182019englpdf
Germany Dusseldorf Industrial and
Logistics
Colliers Industrial and
Logistics Markets
Overview Germany
20182019
Germany Frankfurt Industrial and
Logistics
Colliers Industrial and
Logistics Markets
Overview Germany
20182019
Germany Hamburg Industrial and
Logistics
Colliers Industrial and
Logistics Markets
Overview Germany
20182019
Germany Cologne Industrial and
Logistics
Colliers Industrial and
Logistics Markets
Overview Germany
20182019
Germany Leipzig Industrial and
Logistics
Colliers Industrial and
Logistics Markets
Overview Germany
20182019
copy 2020 KPMG LLP a Delaware limited liability partnership and a member firm of the KPMG global organization of independent member firms
affiliated with KPMG International Limited a private English company limited by guarantee All rights reserved The KPMG name and logo are
trademarks used under license by the independent member firms of the KPMG global organization NDP08974-1A
Country City Property type Source Link
Germany Munich Industrial and
Logistics
Colliers Industrial and
Logistics Markets
Overview Germany
20182019
httpswwwcolliersdewp-
contentuploads201906
ColliersResearchMarket-Report-
IL20182019englpdf
Germany Stuttgart Industrial and
Logistics
Colliers Industrial and
Logistics Markets
Overview Germany
20182019
India Delhi Industrial Cushman amp Wakefield
Industrial Marketbeat
Q4 2018 Delhi
Industrial Report
httpswwwcushmanwakefieldcomen
indiainsightsdelhi-ncr-marketbeat
India Mumbai Industrial Cushman amp Wakefield
Industrial Marketbeat
Q4 2018 Mumbai
Industrial Report
httpswwwcushmanwakefieldcomen
indiainsightsmumbai-marketbeat
Ireland Dublin Logistics Cushman amp Wakefield
Industrial Marketbeat
Q1 2019 Ireland
Industrial Report
httpswwwcushmanwakefieldcomen
irelandinsightsireland-marketbeat
Ireland Cork Logistics Cushman amp Wakefield
Industrial Marketbeat
Q1 2019 Ireland
Industrial Report
Ireland Galway Logistics Cushman amp Wakefield
Industrial Marketbeat
Q1 2019 Ireland
Industrial Report
Italy Rome Logistics CBRE Italy Logistics
MarketView Q4 2019
httpswwwcbredeenresearchItaly-
Logistics-MarketView-Q4-2019
Italy Milan Logistics CBRE Italy Logistics
MarketView Q4 2019
Italy Bologna Logistics CBRE Italy Logistics
MarketView Q4 2019
Japan Osaka Logistics CBRE Japan Real
Estate Market Outlook
2019
httpswwwcbrecomresearch-and-
reportsJapan-Real-Estate-Market-
Outlook-2019
Japan Nagoya Logistics CBRE Japan Real
Estate Market Outlook
2019
38Cost of manufacturing operations
around the globe
copy 2020 KPMG LLP a Delaware limited liability partnership and a member firm of the KPMG global organization of independent member firms
affiliated with KPMG International Limited a private English company limited by guarantee All rights reserved The KPMG name and logo are
trademarks used under license by the independent member firms of the KPMG global organization NDP08974-1A
Country City Property type Source Link
Malaysia Klang Valley Industrial CBRE Malaysia Real
Estate Market Outlook
2019
httpswwwcbrecomreport-
downloadPUBID=44c7f5c6-5dbe-4a76-
a335-ff80e9c57a79
Malaysia Penang Industrial CBRE Malaysia Real
Estate Market Outlook
2019
Malaysia Iskandar
Malaysia
Industrial CBRE Malaysia Real
Estate Market Outlook
2019
Malaysia Kuching Industrial CBRE Malaysia Real
Estate Market Outlook
2019
Mexico Mexico Industrial CBRE Mexico Industrial
Market Outlook Q2 2019
httpswwwcbrecommxenresearch-
and-reports
South Korea Greater
Seoul
Logistics DWS Market Outlook
2018
httpswwwdwscomglobalassets
institutionalresearchpdfsDWS_South_
Korea_Real_Estate_Market_Outlook_
April_2018pdf
Switzerland Industrial UBS Real Estate Focus
2019
httpsfiabciorguploadsswiss-real-
estate-focus-2019-enpdf
Taiwan Neihu
District
Taipei
Industrial Colliers Radar
Industrial Taiwan
August 2019
httpswwwcollierscom-media
filesapactaiwanother20
reports2019radarreport-enpdfla=en-
GBTaiwan Nangang
Taipei
Industrial Colliers Radar
Industrial Taiwan
August 2019
Taiwan Xizhi New
Taipei City
Industrial Colliers Radar
Industrial Taiwan
August 2019
Taiwan Jhonghe
New Taipei
City
Industrial Colliers Radar
Industrial Taiwan
August 2019
Taiwan Xindien New
Taipei City
Industrial Colliers Radar
Industrial Taiwan
August 2019
Taiwan Sanchong
New Taipei
City
Industrial Colliers Radar
Industrial Taiwan
August 2019
Taiwan Xinchuang
New Taipei
City
Industrial Colliers Radar
Industrial Taiwan
August 2019
Taiwan Tucheng
New Taipei
City
Industrial Colliers Radar
Industrial Taiwan
August 2019
copy 2020 KPMG LLP a Delaware limited liability partnership and a member firm of the KPMG global organization of independent member firms
affiliated with KPMG International Limited a private English company limited by guarantee All rights reserved The KPMG name and logo are
trademarks used under license by the independent member firms of the KPMG global organization NDP08974-1A
Country City Property type Source Link
United
Kingdom
London
(Heathrow)
Logistics Cushman amp Wakefield
Industrial Market
Snapshot Q2 2019 UK
httpswwwcushmanwakefieldcomen
united-kingdominsightsuk-marketbeat
United
Kingdom
Manchester Logistics Cushman amp Wakefield
Industrial Market
Snapshot Q2 2019 UK
United
Kingdom
Birmingham Logistics Cushman amp Wakefield
Industrial Market
Snapshot Q2 2019 UK
United
States
Boston Industrial Cushman amp Wakefield
US Industrial
Marketbeat Q2 2019
httpswwwcushmanwakefieldcomen
united-statesinsightsus-marketbeats
us-industrial-marketbeat
United
States
Omaha Industrial Cushman amp Wakefield
US Industrial
Marketbeat Q2 2019
United
States
Detroit Industrial Cushman amp Wakefield
US Industrial
Marketbeat Q2 2019
Vietnam Ho Chi Minh
City
Industrial CBRE Vietnam
Marketview Q2 2018
httpwwwcbrevietnam
comuseful=cbre-vietnam-
marketview-q2-2018Vietnam Long An Industrial CBRE Vietnam
Marketview Q2 2018
Vietnam Dong Nai Industrial CBRE Vietnam
Marketview Q2 2018
Vietnam Binh Duong Industrial CBRE Vietnam
Marketview Q2 2018
Vietnam Hanoi Industrial Colliers Vietnam Real
Estate Quarterly
Knowledge Report Q1
2019
httpswwwcollierscom-mediafiles
apacvietnampdfvietnam-quarterly-
knowledge-report-q1-2019-en-1
pdfla=en-GB
40Cost of manufacturing operations
around the globe
copy 2020 KPMG LLP a Delaware limited liability partnership and the US member firm of the KPMG network of independent
member firms affiliated with KPMG International Cooperative (ldquoKPMG Internationalrdquo) a Swiss entity All rights reserved
The KPMG name and logo are registered trademarks or trademarks of KPMG International NDP089741-1A
copy 2020 KPMG LLP a Delaware limited liability partnership and a member firm of the KPMG global organization of independent member firms
affiliated with KPMG International Limited a private English company limited by guarantee All rights reserved The KPMG name and logo are
trademarks used under license by the independent member firms of the KPMG global organization NDP08974-1A
Cost of manufacturing operations
around the globe
Contact usErkan ErdemPrincipalKPMG ndash National Tax Industry Leader for Public Sector and Economic and Statistical ConsultingT 703-286-8188
E erkanerdemkpmgcom
Oommen ThomasManaging DirectorKPMG ndash Economic and Statistical ConsultingT 415-963-8125
E oommenthomaskpmgcom
Talha MuhammadManagerKPMG ndash Economic and Statistical ConsultingT 212-909-5401
E talhamuhammadkpmgcom
Brian HecklerPartnerKPMG ndash National Sector Leader for Industrial ManufacturingT 312-665-2693
E bhecklerkpmgcom
Ulrich Schmidt Principal KPMG - Global Location amp Expansion Services T 267-256-2786 E ulrichschmidtkpmgcom
Carolyn LeeExecutive DirectorThe Manufacturing InstituteT 202-637-3079
E cleenamorg
The following information is not intended to be ldquowritten advice concerning one or more Federal tax mattersrdquo subject to the requirements of section 1037(a)(2)
of Treasury Department Circular 230
The information contained herein is of a general nature and based on authorities that are subject to change Applicability of the information to specific situations
should be determined through consultation with your tax adviser
copy 2020 KPMG LLP a Delaware limited liability partnership and a member firm of the KPMG global organization of independent member firms affiliated with
KPMG International Limited a private English company limited by guarantee All rights reserved The KPMG name and logo are trademarks used under license
by the independent member firms of the KPMG global organization NDP08974-1A
kpmgcomsocialmedia
The authors gratefully acknowledge excellent research assistance provided by Andrew Bent and
Kristina Kohl Tableau visualizations created by Konul Riegel and technical support provided by Ian Flick

copy 2020 KPMG LLP a Delaware limited liability partnership and the US member firm of the KPMG network of independent
member firms affiliated with KPMG International Cooperative (ldquoKPMG Internationalrdquo) a Swiss entity All rights reserved
The KPMG name and logo are registered trademarks or trademarks of KPMG International NDP089741-1A
Cost of manufacturing operations
around the globe
copy 2020 KPMG LLP a Delaware limited liability partnership and a member firm of the KPMG global organization of independent member firms
affiliated with KPMG International Limited a private English company limited by guarantee All rights reserved The KPMG name and logo are
trademarks used under license by the independent member firms of the KPMG global organization NDP08974-1A4
copy 2020 KPMG LLP a Delaware limited liability partnership and a member firm of the KPMG global organization of independent member firms
affiliated with KPMG International Limited a private English company limited by guarantee All rights reserved The KPMG name and logo are
trademarks used under license by the independent member firms of the KPMG global organization NDP08974-1A
What are the ldquoCosts of Doing Businessrdquo
Companies consider a variety of CoDB factors when
evaluating their international manufacturing location
decisions Our study considers the factors evaluated
by companies at the country level and seeks to
incorporate these into country-level rankings A countryrsquos
competitiveness is often judged by the cost of labor
and an often cited motivation for moving manufacturing
offshore (relative to higher-cost countries like the US) is
the desire to gain access to low labor costs and to lower
the cost of production Studies however have indicated
that a range of other factors go into the location selection
decision3 The leading factors identified in the literature
that contribute to the location decision are
1 Availability of skilled labor
2 Cost and productivity of labor
3 Availability of and proximity to transportation
infrastructure
4 Tax rates
5 Regulatory environment
6 Real estate costs
7 Availability and cost of power communications water
and other utilities
8 Access to and cost of capital
9 Transparency in government and business practices
and ease of doing business
10 Politically and economically stable environment with
ability to enforce legal and property rights
We compiled data on each of these factors directly or
through proxy measures over the 2012 to 2019 time
period for the 17 countries (see Appendix A for details)
The selection of specific categories of costs to compare
were guided by the surveys and studies we reviewed (see
Appendix A for details) We note here that data for every
cost element was not available for every country or not
available for a recent time period Thus the cost types
analyzed are those that could be obtained from public
sources spanning 2012ndash2019 but we use only the most
recent data in our analysis where available
Given the large number of indicators being considered
we categorized these decision factors into two groups
mdash Primary Costs ndash Those that can be measured in cost
terms (dollars or percentage in the case of cost of
capital and tax rates) These cost factors are more
readily assessed and include expenses such as wages
utilities real estate costs and taxes
mdash Secondary Costs ndash Factors that impact overhead
costs and the facilityrsquos ability to operate efficiently
The secondary factors are typically related to the
business environment or the ease of doing business
For instance it takes into consideration the level of
transparency in business and government processes
legal protection of property rights and regulatory
burden
For Primary Cost factors the specific measures we
included are
mdash Labor costs ndash Hourly labor rates (including benefits)
mdash Utility costs ndash Energy costs
mdash Real estate costs ndash Lease costs for industriallogistics
locations
mdash Cost of capital ndash Borrowing interest rates
mdash Corporate tax rates
For Secondary Cost factors tied to the business
environment and infrastructure we considered a range
of indicators reflecting the quality of labor ease of doing
business infrastructure and risk and protections Table 1
on the following page summarizes the measures and cost
types considered
a BL MacCarthy and W Atthirawong ldquoFactors affecting location decisions in international operations ndash a Delphi studyrdquo International Journal of
Operations amp Production Management 2003
b C Manning M Rodriguez and Chinmoy Ghosh ldquoDevising a Corporate Facility Location Strategy to Maximize Shareholder Wealthrdquo Journal of
Real Estate Research 1999
c F Karakaya and C Canel Underlying dimensions of Business Location Decisions Industrial Management amp Data Systems 1998
d S Turhan BC Ozbag and B Cetin ldquoFactors Affecting Location Decisions of Food Processing Plants Journal of Applied Sciences 2007
e M Plaziak and AI Symanska Role of Modern Factors in the Process of Choosing a Location of the Enterprise
3 For a discussion of these factors see for example
copy 2020 KPMG LLP a Delaware limited liability partnership and a member firm of the KPMG global organization of independent member firms
affiliated with KPMG International Limited a private English company limited by guarantee All rights reserved The KPMG name and logo are
trademarks used under license by the independent member firms of the KPMG global organization NDP08974-1A
Measure Cost type Subcategory
1 Hourly compensation costs Primary -
2 Real estate costs Primary -
3 Utility costs Primary -
4 Corporate tax rates Primary -
5 Interest rates Primary -
6 Learning-adjusted years of schooling Secondary Quality of labor
7 Skill set of graduates Secondary Quality of labor
8 Real value added per employee Secondary Quality of labor
9 Days to start business Secondary Ease of doing business
10 Burden of government regulation Secondary Ease of doing business
11 Registering property Secondary Ease of doing business
12 Road quality index Secondary Infrastructure
13 Railroad quality Secondary Infrastructure
14 Airport connectivity Secondary Infrastructure
15 Liner shipping connectivity index Secondary Infrastructure
16 Electric power losses ( of output) Secondary Infrastructure
17 Exposure to unsafe drinking water Secondary Infrastructure
18 Reliability of water supply Secondary Infrastructure
19 Access to internetWi-Fi Secondary Infrastructure
20 Political risk Secondary Risk and protections
21 Enforcing contracts Secondary Risk and protections
22 Protecting minority investors Secondary Risk and protections
23 Corruption perception index Secondary Risk and protections
Based on these indicators we first developed separate indices one for the Primary Costs and another for
Secondary Costs and then combined the two to produce the CoDB Index an overall competitiveness index
We adopted this approach to produce one common index by which to rank the countries with respect to
CoDB while retaining the ability to explore how the Primary and Secondary Costs influenced the overall rank
Appendix A provides details on the sources from which the data on these measures were gathered
Table 1 Primary and secondary measures by subcategory
6Cost of manufacturing operations
around the globe
copy 2020 KPMG LLP a Delaware limited liability partnership and a member firm of the KPMG global organization of independent member firms
affiliated with KPMG International Limited a private English company limited by guarantee All rights reserved The KPMG name and logo are
trademarks used under license by the independent member firms of the KPMG global organization NDP08974-1A
Developing the indexSince we are evaluating 23 factorsmdashsome that impact a
manufacturing company operations in a country directly and
others more indirectlymdashit is challenging to draw cross-country
inferences by evaluating each separate CoDB factor Instead
we created a composite index that would jointly reflect the
information provided by the various individual measures We
recognize that such an index will subsume a significant range
of information across all the identified measures To provide
transparency and to allow further exploration to identify the
set of factors driving a countryrsquos index level (and rank) we
developed two indicesmdashone for the Primary Cost factors and
another for the Secondary Cost factors Subsequently we
combined them to generate an overall index (CoDB Index)
to benchmark country performance This allowed us to
analyze the relative importance of each set of factors to each
countryrsquos overall index score
As with any index the weighting placed on each component
is a key consideration Most studies that examine CoDB
factors tend to weight the key factors equally4 It did
not appear that one or some of the five Secondary Cost
categories we consideredmdashquality of labor ease of doing
business infrastructure and riskmdashstood out in importance
relative to the others Accordingly the assumption of equal
weighting appeared to be reasonable for all factors (see
Appendix D for a specific breakdown of the weights)
With respect to the Primary Cost factors namely labor utility
real estate costs interest rates and tax rates we evaluated
the need to place higher weight on labor given its perceived
importance as a factor in location decisions Specifically
we reviewed data on the contribution of labor costs to
manufacturing Analysis performed by Morgan Stanley
on the contribution to total costs of various components
indicates that for the manufacturing sector labor costs
account for approximately 16 percent of total manufacturing
costs in the US (and as high as 30 percent of total costs for
certain sectors such as electronics and apparel and as low
as 6ndash7 percent for sectors such as motor vehicles where
capital costs are much more significant)5 The 16 percent
weight indicated by this analysis is similar in magnitude to
the 20 percent weight that we use for labor under an equal
weighting approach In the absence of any clear indication
that pointed to an alternate weighting choice we assigned
equal weighting to the five primary factors6
4 For example the Brookings Institutionrsquos report Global manufacturing scorecard How the US compares to 18 other nations accessible at
httpswwwbrookingseduresearchglobal-manufacturing-scorecard-how-the-us-compares-to-18-other-nations
5 Morgan Stanley Analyst Report as cited in ldquoThe Cost Of Manufacturing StuffrdquoBusiness Insider May 2013
6 We recognize that there are alternate index weighting choices that could be adopted and that an alternate set of weights would likely yield
a different ranking on the overall index To allow the interested reader to alter the weights to reflect their facts and circumstances and
to explore sensitivity of results to these changes we have developed a Tableau visualization tool in conjunction with this study This tool
provides the ability to emphasize or deemphasize various cost factors and to visualize the impact of the changes on the CoDB Index rank
In summary we utilized the following weights presented when calculating index values for each country
Index weights
20
20
20
20
20
PrimaryCost Index
Hourly Compensation Costs
Real Estate Costs
Utility Costs
Corporate Tax Rates
Interest Rates
SecondaryCost Index
Quality of Labor
Ease of Doing Business
Infrastructure
Risk and Protections
25
2525
25
Primary Costs
Secondary Costs
CoDB Index 5050
copy 2020 KPMG LLP a Delaware limited liability partnership and a member firm of the KPMG global organization of independent member firms
affiliated with KPMG International Limited a private English company limited by guarantee All rights reserved The KPMG name and logo are
trademarks used under license by the independent member firms of the KPMG global organization NDP08974-1A
Table 3 Country ranking ndash CoDB Index
Source Cost of Manufacturing Operations Around the Globe KPMG LLP 2020
The application of the indexing methodology resulted in a ranking of countries as summarized
in Table 3 (based on score from 1ndash5 with 1 being the best and 5 being the worst)
Canada Taiwan and South Korea ranked as the top three countries on the CoDB Index
which equally weights Primary Costs factors and Secondary Cost factors The United
States ranked fifth among the 17 countries The country with the lowest rank was Brazil
with Japan Mexico Vietnam and India ranking just above
To understand the overall CoDB rankings based on the Primary Cost Index and the
Secondary Cost Index Table 4 (Primary Costs) and Table 5 (Secondary Costs) summarize
the rankings across the two subcategories of factors For Primary Costs unsurprisingly
for the most part Malaysia China Mexico and Vietnam are all tied for top position (ie
most competitive)
Results
Countries Ranking CoDB Index Score by Country (1=best 5=worst)
Canada 1 254
Taiwan 2 263
South Korea 3 265
Malaysia 4 267
United States 5 269
United Kingdom 6 269
Germany 7 274
Switzerland 8 277
Ireland 9 277
France 10 283
China 11 284
Italy 12 300
Japan 13 326
Mexico 14 333
Vietnam 15 346
India 16 349
Brazil 17 420
8Cost of manufacturing operations
around the globe
copy 2020 KPMG LLP a Delaware limited liability partnership and a member firm of the KPMG global organization of independent member firms
affiliated with KPMG International Limited a private English company limited by guarantee All rights reserved The KPMG name and logo are
trademarks used under license by the independent member firms of the KPMG global organization NDP08974-1A
From a review of the Primary and the Secondary Cost Indices it becomes apparent there are
different reasons why countries rank where they do on the CoDB Index Consider the case of
Canada which scored highest on the CoDB Index The primary driver of this rank is the fact that
Canada scored very highly on the Secondary Cost Index while maintaining a middle rank on the
Primary Cost Index The United Statesrsquo overall 5th place ranking is primarily driven by its score
on the Secondary Cost Index since it ranks 14th on the Primary Cost Index
Table 4 Country ranking ndash Primary Cost Index
Source Cost of Manufacturing Operations Around the Globe KPMG LLP 2020
Countries Ranking CoDB Primary Score Index by Country (1=best 5=worst)
Malaysia 1 240
China 1 240
Mexico 1 240
Vietnam 1 240
India 5 260
Canada 6 280
Taiwan 6 280
Italy 6 280
South Korea 9 300
Ireland 9 300
France 9 300
Germany 12 320
United Kingdom 13 320
United States 14 340
Switzerland 14 340
Brazil 16 360
Japan 17 400
copy 2020 KPMG LLP a Delaware limited liability partnership and a member firm of the KPMG global organization of independent member firms
affiliated with KPMG International Limited a private English company limited by guarantee All rights reserved The KPMG name and logo are
trademarks used under license by the independent member firms of the KPMG global organization NDP08974-1A
Table 5 Country ranking ndash Secondary Cost Index
Source Cost of Manufacturing Operations Around the Globe KPMG LLP 2020
In contrast the ranks of Malaysia and Taiwan on the CoDB
Index result from high scores on the Primary Cost Index
For instance Taiwan ranks second on the CoDB Index
despite a ranking of seventh on the Secondary Cost Index
Interestingly Chinarsquos middling score of 11 on the CoDB
Index despite being part of a four-way tie for first on the
primary factors is caused by its poor performance (rank of
13th) on the Secondary Cost Index Chinarsquos low score on
Secondary Cost Index arises primarily from higher operating
risks Overall it appears that countries that do well on
primary factors do less well on the secondary factors and
vice versa The clear exception appears to be Brazil which
ranks poorly on both indices
Primary Costs are clearly important to location decisions
To examine how the overall CoDB ranking may change
under an alternate set of weights we recomputed the
results placing a a greater consideration on Primary Costs
That is we re-ran our analysis changing the weight of
the Primary Costs and Secondary Costs from equal or 50
percentndash50 percent weighting to 70 percentndash30 percent
in favor of Primary Costs As presented in Table 6 not
surprisingly this caused Chinarsquos ranking on the CoDB Index
to move up significantly from 11th to 3rd and the US
ranking to decline from 5th to 12th However Canada
Malaysia and South Korea retained their top-five CoDB
rankings despite this change
Countries Ranking CoDB Secondary Index Score by Country (1=best 5=worst)
United States 1 197
Switzerland 2 213
United Kingdom 3 219
Canada 4 227
Germany 5 228
South Korea 6 229
Taiwan 7 247
Japan 8 252
Ireland 9 254
France 10 265
Malaysia 11 293
Italy 12 321
China 13 328
Mexico 14 426
India 15 438
Vietnam 16 451
Brazil 17 481
10Cost of manufacturing operations
around the globe
copy 2020 KPMG LLP a Delaware limited liability partnership and a member firm of the KPMG global organization of independent member firms
affiliated with KPMG International Limited a private English company limited by guarantee All rights reserved The KPMG name and logo are
trademarks used under license by the independent member firms of the KPMG global organization NDP08974-1A
Table 7 US ranking with higher weight on labor quality
Source Cost of Manufacturing Operations Around the Globe
KPMG LLP 2020
CountriesOverall ranking
Primary Cost
ranking
Secondary Cost
ranking
Ireland 1 9 2
Canada 2 6 5
Germany 3 12 4
United States 4 14 1
Switzerland 5 14 3
South Korea 6 9 6
7 We increase the weight on quality of labor to 70 percent in the Secondary Cost Index and equally weight the other
three measures at 10 percent each
8 The US tax rates used here are after tax reform
Understanding the results
Primary Cost Index
Table 8 Selected country Primary Cost percentile rankings (sorted by Primary Cost Index)
Source Cost of Manufacturing Operations Around the Globe KPMG
LLP 2020
To understand these results better we further examined the
constituents of the Primary and Secondary Cost Indices
To further understand the drivers of our findings we
examined which factors cause East Asian countries such as
Vietnam Taiwan and Malaysia to rank highly on the Primary
Cost Index and the US to rank 14 Table 8 to follow presents
constituent ranks for countries that rank highly on the Primary
Cost IndexmdashVietnam Taiwan Malaysia India China and
Mexicomdashand for the United States Note that the table
shows percentile ranks that is to say a percentile rank of 5
represents top 15 percentile of costs The percentile ranking
of 1 indicates the best performing in the category and the
percentile ranking of 5 indicates the worst performing in the
category (see Appendix D for additional details) As Table
8 indicates the differences are most stark with respect to
hourly compensation costs between US and other countries
CountryHourly
compensation costs
Real estate costs
Utility costs
Corporate tax rates
Interest rates
Malaysia 2 1 3 2 4
China 2 2 1 3 4
Mexico 1 1 1 4 5
Vietnam 1 4 1 2 4
India 1 1 2 4 5
Taiwan 3 4 2 2 3
United States
5 3 3 3 3
In terms of real estate costs and cost of capital the
United States is relatively competitive compared to the
Southeast Asian nations Among these countries only
India Malaysia and China had lower average costs for
industrial property than the US while only Taiwan had
a lower interest rate The US compares less favorably
to the Southeast Asian nations on the measures of utility
costs and corporate tax rates8 The US is tied with
Malaysia for the highest electricity costs among these
countries significantly higher than the average rate paid
by Chinese electricity users In terms of corporate tax
rates among this group only India and Mexico have higher
statutory tax rates at 30 percent compared to 27 percent
for the US
From a labor market perspective the quality of labor
available in the US is a strong asset However increasing
the weight of the quality of labor measure reveals that
there is also significant competition from European
countries and Canada in this regard For example as
presented in Table 7 increasing the weight on the
quality of labor to 70 percent from 25 percent within
the Secondary Cost Index (but maintaining equal weight
between Primary and Secondary Costs) causes Ireland
Germany and Switzerland to rise to the top five most
competitive countries with the US and Canada rising and
falling by one rank respectively7
Table 6 Country ranking with higher weight on Primary Costs
Source Cost of Manufacturing Operations Around the Globe
KPMG LLP 2020
CountriesCoDB Index
ranking
Primary Cost Index
ranking
Secondary Cost Index
ranking
Malaysia 1 1 11
Canada 2 6 4
China 3 1 13
Taiwan 4 6 7
South Korea 5 9 6
Ireland 6 9 9
copy 2020 KPMG LLP a Delaware limited liability partnership and a member firm of the KPMG global organization of independent member firms
affiliated with KPMG International Limited a private English company limited by guarantee All rights reserved The KPMG name and logo are
trademarks used under license by the independent member firms of the KPMG global organization NDP08974-1A
Table 9 Industrialized country Primary Cost percentile rankings (sorted by Primary Cost Index)
Source Cost of Manufacturing Operations Around the Globe
KPMG LLP 2020
CountryHourly
compensation costs
Real estate costs
Utility costs
Corporate tax rates
Interest rates
Canada 3 3 2 3 3
South
Korea3 3 3 3 3
United
Kingdom3 5 4 1 3
United States
5 3 3 3 3
Japan 3 5 5 5 2
The impact of tax reform
As part of this analysis we also examined if tax reform
had a material impact on the relative standing of the
US In particular we examined how the US would
have ranked had we used the pre-tax-reform corporate
tax rate of 40 percent (combined federal and state
average) instead of the post-tax-reform combined rate
of 27 percent
It is worth noting here that our analysis of the tax
input is limited to the statutory corporate rate only
We recognize that many other factors contribute to the
overall tax burden in any given jurisdiction ndash including
but not limited to the methodology of cost recovery
deductibility of debt service and the taxation of cross
border flows of income Those other factors which vary
from jurisdiction to jurisdiction were outside the scope
of this report Still we believe that use of the statutory
rate alone provides valid directional information even if
not necessarily the entire picture
As presented in Table 10 the tax reform improved the
USrsquos ranking not only on the corporate tax measure
but also on the Primary Cost Index and the CoDB Index
With tax reform the US was considered a median tax
country Had the US corporate tax rate continued to be
40 percent it would have one of the highest corporate
tax rates in the comparison group of countries The tax
reform resulted in the US ranking on the Primary Cost
Index to improve two notches from being 16th to 14th
out of the 17 countries The impact on the CoDB Index
score is even more significant with the US ranking
increasing from 11th place (considering pre-reform tax
rates) to 5th (after tax reform)
Ranking of the industrialized countries
Table 9 provides a comparison to some of the industrialized
countries relative to the US The table shows percentile
ranks that is to say a percentile rank of 5 represents
the top 15th percentile of costs (worst performing
from competitiveness standpoint) while a percentile
rank of 1 slots into the best performing in the category
(see Appendix D for additional details) We note that
even compared to the industrialized countries US
labor costs are high Hourly rates in Canada United
Kingdom and Japan range between $23 per hour and
$30 per hour compared to $39 per hour in the US With
respect to corporate tax rates where tax reform lowered
rates significantly the US rates are lower than Japan
comparable to Canada but still higher than that imposed
by the United Kingdom
12Cost of manufacturing operations
around the globe
copy 2020 KPMG LLP a Delaware limited liability partnership and a member firm of the KPMG global organization of independent member firms
affiliated with KPMG International Limited a private English company limited by guarantee All rights reserved The KPMG name and logo are
trademarks used under license by the independent member firms of the KPMG global organization NDP08974-1A
Secondary Cost Index
With respect to Secondary Cost factors the US clearly is in a strong position As Table 11 below
indicates (the countries sorted by their respective rank on the Secondary Cost Index) the US
scores are among the top three on almost all of the metrics including quality of labor transport
infrastructure and ease of doing business The scores below represent weighted averages of
percentile ranks for each measure considered under the category A score of one (1) is best while
five (5) is worst (see Appendix D for additional details)
Source Cost of Manufacturing Operations Around the Globe KPMG LLP 2020
Table 11 Secondary Index Cost factor scores (sorted by Secondary Cost Index)
CountriesQuality of labor score
Ease of doing business score
Infrastructure score10
Infrastructure ndash Transport score
Infrastructure ndash Utility score
Risk and protections score
United States 167 200 222 200 267 200
Switzerland 167 167 244 300 233 275
United Kingdom 267 233 225 275 300 150
Canada 233 233 242 325 300 200
Germany 167 267 228 250 233 250
South Korea 233 333 150 150 200 200
Taiwan 300 233 278 300 233 175
Japan 233 300 225 175 200 250
Ireland 133 300 358 475 300 225
France 267 300 269 275 233 225
Malaysia 333 233 306 250 367 300
Italy 333 300 350 350 300 300
China 367 233 364 225 367 350
Mexico 433 400 444 400 433 425
India 500 433 442 325 500 375
Vietnam 467 433 431 425 467 475
Brazil 500 500 447 475 467 475
9 Infrastructure score is a combined score across transportation utility and internet Details are shown for transportation and utility
subcomponents while internet access is not shown in the table but is included the combined score Each of these three factors
(transport utility and internet) get an equal weight
CountriesCurrent CoDB index rank
Pre-tax-reform CoDB index rank
Change in rankings due to US tax reform
Canada 1 1 0
Taiwan 2 2 0
South Korea 3 4 +1
Malaysia 4 5 +1
United States 5 11 +6
United Kingdom 6 6 0
Source Cost of Manufacturing Operations Around the Globe KPMG LLP 2020
Table 10 Impact of the US tax reform
copy 2020 KPMG LLP a Delaware limited liability partnership and a member firm of the KPMG global organization of independent member firms
affiliated with KPMG International Limited a private English company limited by guarantee All rights reserved The KPMG name and logo are
trademarks used under license by the independent member firms of the KPMG global organization NDP08974-1A
Source Cost of Manufacturing Operations Around the Globe
KPMG LLP 2020
Table 12 Percentile ranks for cost and quality of labor
On all of the secondary factors considered including quality
of labor the United States ranks significantly better than
countries that offer lower labor costs such as Vietnam
China Mexico and India To put it differently the low ranking
of these countries on the Secondary Cost Index reflects
the weaker investment climatemdashfor example the poorer
connectivity from limited road rail and airline networks more
challenging business operating environments and lower
levels of transparency in government operation and reduced
legal protections available to businesses
The industrialized countries generally rank favorably and
similarly across secondary metrics falling for the most part
in the top half of the countries Among them however
the US clearly ranks better with respect to at least two
factors the quality of labor and ease of doing business
Thus relative to the other 16 countries considered the
US ranks best on the Secondary Cost components
Labor ndash Cost and quality
As noted earlier compensation cost is often the most cited
factor for locating manufacturing facilities in Asian countries
such as China Taiwan or Vietnam As the data confirm these
countries do offer among the lowest hourly compensation
costs for labor Further the hourly compensation costs in the
US are among the highest in the world
As Table 12 shows a different picture emerges when
productivity attributes are considered in addition to the
quality of labor For example countries with the most
favorable cost attributes are not always the ones with the
highest real value added per employee In fact Table 12
suggests a high degree of positive correlation between
costs and productivity
Thus it would appear that for manufacturing activities that
are more routine in nature and require less advanced skills
where the loss of productivity may be outweighed by lower
costs companies may consider locating their manufacturing
facilities in lower costs countries such as China Vietnam
or Taiwan however in higher-value-added manufacturing
where the process is more complex or automated and
requires highly skilled labor to manage the United States
may be considered more favorably as a location
CountriesHourly
compensation costs
RVA per employee
Vietnam 1 5
India 1 5
Mexico 1 4
China 2 4
Malaysia 2 4
Brazil 2 5
Taiwan 3 3
South Korea 3 3
Japan 3 3
United Kingdom 3 2
Canada 3 3
Italy 4 3
Ireland 4 1
France 4 2
United States 5 1
Germany 5 2
Switzerland 5 1
14Cost of manufacturing operations
around the globe
copy 2020 KPMG LLP a Delaware limited liability partnership and a member firm of the KPMG global organization of independent member firms
affiliated with KPMG International Limited a private English company limited by guarantee All rights reserved The KPMG name and logo are
trademarks used under license by the independent member firms of the KPMG global organization NDP08974-1A
ConclusionsOur results indicate that countries that placed better on
the Secondary Cost Index generally performed better on
the overall rankings Of the top five most competitive
economies on the overall rankings only twomdashMalaysia and
Taiwanmdashhave a better primary than secondary cost score
In keeping with this trend of lower Secondary Cost
countries scoring better on the CoDB Index the United
States placed fifth on the CoDB Index despite being tied
with Switzerland for 14th on the Primary Cost Index This
high Primary Cost Index ranking was primarily due to high
labor costs The United States was able to compensate
somewhat for these unfavorable scores on the Primary
Cost Index by placing first in the Secondary Cost Index
As part of this analysis we also examined if tax reform had
a material impact on the relative standing of the US In
particular we compared how the US ranks now (post-tax-
reform combined federal and local tax rate of 27 percent)
relative to the pre-reform with a corporate tax rate of 40
percent (combined federal and state average) The impact
on the USrsquos CoDB Index ranking is quite significant After
tax reform the USrsquos competitiveness increasedmdashas
evidenced by its current rank of 5mdashcompared with its
previous rank of 11 under pre-reform tax rates
A closer look at the countries that outperformed the US
on the CoDB Index ranking indicates some interesting
factors For example the US outperformed all of the
countries on the Secondary Cost Index due to better labor
productivity and business conditions This implies that the
outperformance on the CoDB Index by Canada Taiwan
South Korea and Malaysia are all driven by Primary Cost
factors Specifically Canadarsquos rank is driven primarily by
its ability to offer lower compensation costs and slightly
lower electricity rates while still maintaining Secondary
Cost Index rankings that were not far behind the US
South Korea ranked third by offsetting weaker ranking on
the Secondary Cost Index with even lower compensation
costs A sharper version of the tradeoff between Primary
and Secondary Cost explains the rankings of Taiwan and
Malaysia with Taiwan offering higher primary costs but
lower secondary costs
This study has focused on certain CoDB factors that are
commonly considered in manufacturing facility location
decisionsmdashat the country levelmdashand the results provide a
high-level perspective on the attributes of various countries
with respect to these factors However the location
decision is specific to each company and its consideration
of the supply chain and access to markets The decision
may be impacted by the type of industry the company is
active in the type of product where customers are and
the companyrsquos overall business strategy Thus individual
location decisions are significantly more complex than we
can address in an analysis such as this
For instance for heavy equipment manufacturing from a
transportation point of view it may be better to locate the
facility closer to suppliers and the market whereas from a
production standpoint it may be more desirable to locate
the facility closer to where the desired type of workforce
or raw materials might be available Alternatively for a
specialized precision products manufacturing operation
the firmrsquos decision may be heavily impacted by the
availability of labor with advanced manufacturing skills In
other instances tax and operating incentives offered by a
country may be significant enough to outweigh weakness
on other dimensions As such the location decision is
often guided by unique factors that may go well beyond
those we have considered
Additionally even within the factors we have considered
the relative importance of these factors to a specific firm
may be different than the weights we have considered
Furthermore it may well be the case that the factors we
classify for the purpose of convenience as secondary
are in fact primary factors for consideration in a location
decision for an individual firm or manufacturing sector
Finally a number of local factors that go into firm location
decisions may or may not be captured in the country-
level analysis For example labor and rent costs are
higher in urban areas relative to more distant suburban
or rural areas Recognizing this we have developed a
Tableau analytic and visualization tool in conjunction with
this study that allows the interested reader to alter the
weights and to reassess the score based on the relative
importance of these factors to them Click here for the
Cost of Manufacturing Operations Tool We also note for
copy 2020 KPMG LLP a Delaware limited liability partnership and the US member firm of the KPMG network of independent
member firms affiliated with KPMG International Cooperative (ldquoKPMG Internationalrdquo) a Swiss entity All rights reserved The
KPMG name and logo are registered trademarks or trademarks of KPMG International NDP089741-1A
the reader that the Primary Cost factors
are measured in US dollars Since we
have compared costs on a US dollar
denominated basis our results are impacted
by the relative strength of the various
currencies relative to the dollar As the
foreign exchange rates fluctuate as they
inevitably will the cost measurements we
have relied on would vary and possibly
impact the ranking of individual cost
components even if local currency costs do
not change
Finally we note that the rankings are based
on the best historical information available
Such data is mostly available only with a lag
and therefore the impact of recent trade
disputes or the market disruptions from
COVID-19 are not reflected in the results
copy 2020 KPMG LLP a Delaware limited liability partnership and the US member firm of the KPMG network of independent
member firms affiliated with KPMG International Cooperative (ldquoKPMG Internationalrdquo) a Swiss entity All rights reserved
The KPMG name and logo are registered trademarks or trademarks of KPMG International NDP089741-1A
16Cost of manufacturing operations
around the globe
Appendix A Data sources
copy 2020 KPMG LLP a Delaware limited liability partnership and the US member firm of the KPMG network of independent
member firms affiliated with KPMG International Cooperative (ldquoKPMG Internationalrdquo) a Swiss entity All rights reserved
The KPMG name and logo are registered trademarks or trademarks of KPMG International NDP089741-1A
copy 2020 KPMG LLP a Delaware limited liability partnership and a member firm of the KPMG global organization of independent member firms
affiliated with KPMG International Limited a private English company limited by guarantee All rights reserved The KPMG name and logo are
trademarks used under license by the independent member firms of the KPMG global organization NDP08974-1A
As discussed previously we relied on a variety of sources
to gather data on 23 metrics that spanned Primary and
Secondary Cost factors
Primary Cost Index
The Conference Board is a well-known source of data for
economists While researching international labor costs
we noted two indicators related to the manufacturing
industry that we deemed useful for our study The first
is hourly compensation costs which is a sum of hourly
pay for time worked hourly direct benefits and hourly
social insurance expenditures and labor-related taxes
The Conference Board did not have this information for
Malaysia and Vietnam so we substituted the Economist
Intelligence Unitrsquos labor cost per hour (pay and nonpay
costs) figures for these two countries
Real estate cost data that is leasing cost per square foot
was compiled from a mix of sources We collected data
from real estate advisory firms and asset managers such
as Cushman amp Wakefield Colliers International CBRE
Group Deutsche Bank DWS and UBS
Utility costs measure the average price per kilowatt hour
of electricity paid by all businesses and households in each
country excluding taxes and tariffs These prices were
retrieved from each countryrsquos respective energy regulatory
agency website
Corporate tax rates were available through internal KPMG
sources The tax rates cited in this study reflect combined
statutory federal and provincial tax rates only and do not
account for specific tax incentives International Financial
Statistics provided interest rates for Brazil Canada China
India Malaysia Mexico South Korea Switzerland the
United States and Vietnam
Interest rate data for all economies except the Euro
area countries the United Kingdom Japan and Taiwan
were obtained from the International Monetary Fundrsquos
International Financial Statistics database Interest rates for
Taiwan were retrieved from the Taiwanese central bank
while rates for the remaining economies were retrieved
from the US Federal Reserve Economic Data (FRED)
database Interest rates obtained from the IMF reflect the
monetary policy-related interest rate while interest rates
obtained from all other sources measure the discount rate
Secondary Cost measures
Quality of labor
Outside of the Doing Business report the World Bank
Group provided two additional measures for our study
learning-adjusted years of schooling and access to
internetWi-Fi
Learning-adjusted years of schooling used in the quality
of labor aggregation gives us insight into how advanced
a workerrsquos skill set might be in different countries It is
calculated by multiplying the expected years of school by
the ratio of the most recent harmonized test score and to
advancement attainment on the Trends in International
Mathematics and Science Study (TIMSS) test (The World
Bank Group)11
The Global Competitiveness Index published by the
World Economic Forum included an assessment of the
skill set of graduates (secondary and university graduates)
from each country as captured by the WEFrsquos Executive
Opinion Survey It is included in the ldquoaccess to advanced
educationrdquo category Including this measure while
similar to the learning-adjusted years of schooling takes
into account how executives perceive the quality of the
labor force and allows us to consider the perspective of a
company operating in one of these countries
Real value added per employee is a crucial metric for
companies as it has a direct impact on profits It measures
how much value each additional employee is adding to
the industry For example real value added can increase
if new employees are bringing advanced skill sets into
the workforce We used total real value added from the
Conference Board as well as the total number of people
employed to calculate real value added per employee
The Conference Board did not have this information on
Malaysia and Vietnam so we found comparable variables
for real value added per employee from Malaysia and
Vietnam from separate sources
Ease of doing business
The World Bank Group annually publishes a report titled
Doing Business which ranks 190 countries based on
their ease of doing business This research involves
very detailed quantitative indicators and a few were
particularly valuable to our study We focused on the 2019
report observing the number of days to start a business
registering property enforcing contracts and protecting
minority investors indicators As noted by The World Bank
Group the number of days to start a business measures
how many days it takes for a ldquosmall- to medium-size
limited liability company to start up and formally operate
in each economyrsquos largest business cityrdquo This is the
only variable from the Doing Business report where we
did not look at the overall score for the category (starting
a business) we only observed the number of days For
the remaining three indicators we used the scores The
registering property score is based on ldquothe steps time
and cost involved in registering a property assuming
a standardized case of an entrepreneur who wants to
18Cost of manufacturing operations
around the globe
copy 2020 KPMG LLP a Delaware limited liability partnership and a member firm of the KPMG global organization of independent member firms
affiliated with KPMG International Limited a private English company limited by guarantee All rights reserved The KPMG name and logo are
trademarks used under license by the independent member firms of the KPMG global organization NDP08974-1A
purchase land and a building that is already registered
and free of title dispute In addition the score includes
the quality of the land administration system in each
economy The quality of land administration index has five
dimensions reliability of infrastructure transparency of
information geographic coverage land dispute resolution
and equal access to property rightsrdquo (The World Bank
Group) Number of days to start a business and registering
property along with burden of government regulation
were used in our ease of doing business aggregation
Burden of government regulation is another Executive
Opinion Survey question from the Global Competitiveness
Index It is a response to the survey question ldquoIn your
country how burdensome is it for companies to comply
with public administrationrsquos requirements (eg permits
regulations reporting)rdquo Respondents can choose
a number on a scale of 1 to 7 1 being ldquoextremely
burdensomerdquo and 7 being ldquonot burdensome at allrdquo
Infrastructure
The World Economic Forumrsquos (WEF) Global Competitiveness
Index (2018 Report) contains very useful indicators relating to
starting a business Based on the values or survey responses
for each variable each country is assigned a score from 1 to
100 (100 being the best) It is important to note that we used
these scores for our study not the direct values or survey
responses
The Global Competitiveness Index provides useful information
regarding a countryrsquos infrastructure We specifically look at
transportation infrastructure and utility infrastructure In this
report transportation infrastructure is addressed with eight
variables mdashfour are sourced from WEFrsquos Executive Opinion
Survey and four are based on statistics that they compiled
from external sources
Of these variables we used the survey-based figures to
measure road quality and railroad quality while we used the
external index figures from the International Air Transport
Association (IATA) and United Nations Conference on Trade
and Development to measure airport connectivity and liner
shipping connectivity respectively Index values were not
used for the road and railroad figures due to inconsistencies
with the WEF data when we attempted to reproduce the
WEFrsquos calculations for these measures
The road quality survey results capture the response to
the survey question ldquoIn your country what is the quality
(extensiveness and condition) of road infrastructure [1 =
extremely poor among the worst in the world 7 = extremely
good among the best in the world]rdquo Similarly railroad
quality captures the average response to the question ldquoIn
your country how efficient (ie frequency punctuality
speed price) are train transport services [1 = extremely
inefficient among the worst in the world 7 = extremely
efficient among the best in the world]rdquo Airport connectivity
represents ldquothe IATA airport connectivity indicator which
measures the degree of integration of a country within the
global air transport networkrdquo The Liner shipping connectivity
index ldquoassesses a countryrsquos connectivity to global shipping
networksrdquo and is based on ldquofive components of the maritime
transport sector the number of ships their container-carrying
capacity the maximum vessel size the number of services
and the number of companies that deploy container ships in a
countryrsquos portsrdquo (World Economic Forum)
For utility infrastructure we gathered electric power losses
exposure to unsafe drinking water and reliability of water
supply from the Global Competitiveness Index Electric power
losses which measures a countryrsquos electricity quality and
exposure to unsafe drinking water which takes into account
ldquothe extent of exposure by risk level and the severity of that
riskrsquos contribution to disease burdenrdquo are both based on
statistics that were compiled from external sources Reliability
of water supply is taken from the WEFrsquos Executive Opinion
Survey and answers the question ldquoIn your country how
reliable is the water supply (lack of interruptions and flow
fluctuations)rdquo Respondents can choose a number on a
scale of 1 to 7 1 being ldquoextremely unreliablerdquo and 7 being
ldquoextremely reliablerdquo As mentioned earlier the World Bank
Group provides us with our indicator access to internetWi-
Fi which is part of the overall infrastructure aggregation It
measures the percentage of the population that is using the
internet
Risk and protections
Our political risk data was sourced from the insurance
company Credendorsquos ldquoCountry Risks Synthetizing Chartrdquo
Countries are classified into seven categories (from 1 to 7)
reflecting the intensity of risks arising as a result of political
and assimilated events Category 1 includes those countries
for which the risk is considered the lowest and category 7
contains those countries with the highest likelihood of risks
being caused by political and assimilated events In our study
we chose to focus on political risk over medium- and long-
term periods
Enforcing contracts and protecting minority investors along
with political risk and the corruption perception index were
included in our risk and protections aggregation According
to the World Bank Group the enforcing contracts score
ldquomeasures the time and cost for resolving a commercial
dispute through a local first-instance court and the quality of
copy 2020 KPMG LLP a Delaware limited liability partnership and a member firm of the KPMG global organization of independent member firms
affiliated with KPMG International Limited a private English company limited by guarantee All rights reserved The KPMG name and logo are
trademarks used under license by the independent member firms of the KPMG global organization NDP08974-1A
Measure Country Source Source detail Year Link
Hourly Compensation Costs
All (except Malaysia and Vietnam)
The Conference Board
International Comparisons of Hourly Compensation Costs in Manufacturing
2016 httpwwwconference-boardorgilcprogramindexcfmid=38269
Hourly Compensation Costs
Malaysia and Vietnam
The Economist Intelligence Unit General Statistics Office of Vietnam and Department of Statistics Malaysia
Estimated Labor Cost per Hour Manufacturing
2016 Both httpdataeiucomEI UTableViewaspx initial=trueamppub type_id=1253181310
Vietnam
httpswwwgsogov vndefault_enaspx tabid=783
Malaysia
httpsnewssstatisticsgovmynewss-portalx epepDownloadContent SearchseamcontentId =54516ampactionMethod =ep2FepDownload ContentSearchxhtml 3AcontentActiondo DisplayContentampcid= 12789
Real Estate Costs
See Appendix E
Utility Costs China China Electricity Council
Analysis of National Electricity Market Transaction Information in the Fourth Quarter of 2018
2018 Adjusted to 2015 USD
httpwwwcecorgcnguihuayutongjidianligaige2019-03 -04189190html
Primary Cost measures ndash References
judicial processes index evaluating whether each economy
has adopted a series of good practices that promote
quality and efficiency in the court systemrdquo Protecting
minority investors focuses on ldquothe strength of minority
shareholder protections against misuse of corporate assets
by directors for their personal gain as well as shareholder
rights governance safeguards and corporate transparency
requirements that reduce the risk of abuserdquo (The World
Bank Group)
The WEFrsquos Global Competitiveness Index provided scores
for each country based on the Corruption Perception Index
2016 results This index measures ldquoperceptions of corruption
in the public sectorrdquo and is scaled from 0 (highly corrupt) to
100 (very clean) According to Transparency International
who created the index ldquoThe global average score is a
paltry 43 indicating endemic corruption in a countryrsquos public
sector Top-scoring countries are far outnumbered by [low-
scoring] countries where citizens face the tangible impact of
corruption on a daily basisrdquo
Specific data sources used and linked references are provided
below
20Cost of manufacturing operations
around the globe
copy 2020 KPMG LLP a Delaware limited liability partnership and a member firm of the KPMG global organization of independent member firms
affiliated with KPMG International Limited a private English company limited by guarantee All rights reserved The KPMG name and logo are
trademarks used under license by the independent member firms of the KPMG global organization NDP08974-1A
Measure Country Source Source detail Year Link
Utility Costs France Germany Ireland Italy and United Kingdom
Eurostat Electricity prices for nonhousehold consumers ndash biannual data
2015 httpappssoeurostateceuropaeunuishowdodataset=nrg_pc_205amplang=en
Utility Costs Canada Government of Canada ndash Canada Energy Regulator
Market Snapshot Explaining the high cost of power in northern Canada February 16 2017
2016 Adjusted to 2015 USD
The Canada Energy Regulator 2017 Reproduced with the permission of Public Works and Government Services 2020
Utility Costs Brazil Governo do Brasil
Anuaacuterio Estatiacutestico de Energia Eleacutetrica 2016
2015 httppateducacaobagovbrconteudosconteudos-digitaisdownload8667pdf
Utility Costs South Korea Korea Energy Statistical Information System
Average revenues per kWh sold by segments
2015 httpwwwkesisnetsubsubChartEngjspreport_id=34110ampreport Type=0
Utility Costs Malaysia Malaysia Energy Data and Research
Malaysia Energy Statistics Handbook 2018
2015 httpsmeihstgovmydocuments10620c7e69704-6f80-40ae-a764-ad0acf4a844d
Utility Costs India Power Finance Corporation Ltd (A Govt of India Undertaking)
The Performance of State Power Utilities for the years 2013ndash14 to 2015ndash16
2015 httpswwwpfcindiacomDocumentRepositoryckfinderfilesOperationsPerformance_Reports_of_State_Power_Utilities1_Report on the Performance of State Power Utilities 2013-14 to 2015-16pdf
Utility Costs Switzerland Swiss Office of Energy
Switzerland Utility Costs 2015 httpswwwbfeadminchbfedehomehtml
Utility Costs Taiwan Taiwan Bureau of Energy
Energy Statistical Annual Reports
2015 httpswwwmoeaboegovtwECWenglishcontentContentLinkaspxmenu_id=1540
Utility Costs Japan US Energy Information Administration ndash Independent Statistics and Analysis
Japanrsquos electricity prices rising or stable despite recent fuel cost changes
2015 httpswwweiagovtodayinenergydetailphpid=27872
copy 2020 KPMG LLP a Delaware limited liability partnership and a member firm of the KPMG global organization of independent member firms
affiliated with KPMG International Limited a private English company limited by guarantee All rights reserved The KPMG name and logo are
trademarks used under license by the independent member firms of the KPMG global organization NDP08974-1A
Measure Country Source Source detail Year Link
Utility Costs United States US Energy Information Administration ndash Independent Statistics and Analysis
Average retail price of electricity United States annual
2015 httpswwweiagov
electricitydatabrowser
topic7agg=01ampgeo=
gampendsec=vgamplinechart
=ELECPRICEUS-ALL
A~ELECPRICEUS-RES
A~ELECPRICEUS-COM
A~ELECPRICEUS-IND
Aampcolumnchart=ELEC
PRICE
US-ALLA~ELECPRICE
US-RESA~ELECPRICE
US-COMA~ELECPRICE
US-INDAampmap=ELEC
PRICEUS-ALLAampfreq=
Aampctype=linechartlt=rdquordquo
div=rdquordquo style=rdquobox-sizing
border-boxrdquogt
Utility Costs Mexico US Energy Information Administration ndash Independent Statistics and Analysis
Mexico electricity market reforms attempt to reduce costs and develop new capacity
2015 httpswwweiagovtodayinenergydetailphpid=26932
Utility Costs Vietnam Vietnam Electricity ndash EVN
Vietnam Electricity Annual Report 2016
2015 httpsenevncomvnuserfileUserhuongbttfiles20177AnnualReport2016pdf
Corporate Tax Rates
All KPMG Corporate tax rates table 2019 httpshomekpmgxxenhomeservicestaxtax-tools-and-resourcestax-rates-onlinecorporate-tax-rates-tablehtml
Interest Rates Euro Area India and Japan
Federal Reserve Economic Data (FRED)
Discount Rates (Euro Area India and Japan)
2018 httpsfredstlouisfedorg
Interest Rates Taiwan Central Bank of the Republic of China
Discount Rate (Taiwan) 2018 httpswwwcbcgovtwenlp-695-2html
Interest Rates United Kingdom Bank of England Discount Rate (UK) 2018 httpswwwbankofenglandcoukmonetary-policythe-interest-rate-bank-rate
Interest Rates All (except Euro Area the UK India Japan and Taiwan)
International Financial Statistics
Interest Rates and Monetary Policy-Related Interest Rate percent per annum
2018 httpsdataimforg sk=388DFA60-1D26- 4ADE-B505-A05A55 8D9A42amp sId=1479331931186
22Cost of manufacturing operations
around the globe
copy 2020 KPMG LLP a Delaware limited liability partnership and a member firm of the KPMG global organization of independent member firms
affiliated with KPMG International Limited a private English company limited by guarantee All rights reserved The KPMG name and logo are
trademarks used under license by the independent member firms of the KPMG global organization NDP08974-1A
Secondary Cost measures
Measure Country Source Source detail Years Link
Learning-
Adjusted Years
of Schooling
All The World Bank Learning-Adjusted
Years of Schooling
2017 httpstcdata360
worldbankorg
indicatorsh00280750
country=BRA
ampindicator
=40964ampviz=bar_
chartampyears=2017
Skill set of
Graduates
All (except China) World Economic
Forum
Global
Competitiveness
Index 2019
Weighted
Average 2018ndash
2019
httpstcdata360
worldbankorg
indicators
h00280750
country=
BRAampindicator=
40964ampviz=
bar_chartampyears=2017
httpreports
weforumorg
global-
competitiveness-
report-2018
China Weighted Average
2016ndash2017
RVA per
Employee
All The Conference
Board
International
Comparisons of
Manufacturing
Productivity and
Unit Labor Costs
2017 httpswww
conference-board
orgilcprogram
indexcfmid=42672
Number of
Days to Start a
Business
All The World Bank Doing Business
2019
2019 httpswww
doingbusinessorg
endata
Burden of
Government
Regulation
All (except China) World Economic
Forum
Global
Competitiveness
Index 2019
Weighted
Average of
2018ndash2019
httpreports
weforumorgglobal-
competitiveness-
report-2019China Weighted
Average of
2016ndash2017
Registering
Property
All The World Bank Doing Business
2019
2019 httpswww
doingbusinessorg
endata
Road Quality All (except China) World Economic
Forum
Global
Competitiveness
Index 2019
Weighted
Average of
2018ndash2019
httpreports
weforumorgglobal-
competitiveness-
report-2019China Weighted
Average of
2016ndash2017
copy 2020 KPMG LLP a Delaware limited liability partnership and a member firm of the KPMG global organization of independent member firms
affiliated with KPMG International Limited a private English company limited by guarantee All rights reserved The KPMG name and logo are
trademarks used under license by the independent member firms of the KPMG global organization NDP08974-1A
Measure Country Source Source detail Years Link
Railroad Quality All (except China) World Economic
Forum
Global
Competitiveness
Index 2019
Weighted
Average of
2018ndash2019
httpreports
weforumorgglobal-
competitiveness-
report-2019China Weighted
Average of
2016ndash2017
Airport
Connectivity
All World Economic
Forum
Global
Competitiveness
Index 2019
2018 httpreports
weforumorgglobal-
competitiveness-
report-2019
Liner Shipping
Connectivity
Index
AllWorld Economic
Forum
Global
Competitiveness
Index 2018
2018
httpreports
weforumorgglobal-
competitiveness-
report-2018
Electric Power
LossesAll
World Economic
Forum
Global
Competitiveness
Index 2018
2016
httpreports
weforumorgglobal-
competitiveness-
report-2018
Exposure to
Unsafe Drinking
Water
AllWorld Economic
Forum
Global
Competitiveness
Index 2018
2017
httpreports
weforumorgglobal-
competitiveness-
report-2018
Reliability of
Water Supply
All (except China)
World Economic
Forum
Global
Competitiveness
Index 2018
Weighted
Average
2018ndash2019httpreports
weforumorgglobal-
competitiveness-
report-2018China
Weighted
Average
2016ndash2017
Access to
InternetWi-Fi
France Germany
Ireland Italy
Malaysia
Mexico South
Korea UK
Vietnam Taiwan The World Bank
Individuals using
the Internet ( of
population)
2018 httpsdata
worldbank
orgindicator
ITNETUSER
ZSview=mapBrazil Canada
China India
Japan
Switzerland US
2017
Political Risk All CredendoCountry Risk and
Insights2019
24Cost of manufacturing operations
around the globe
copy 2020 KPMG LLP a Delaware limited liability partnership and a member firm of the KPMG global organization of independent member firms
affiliated with KPMG International Limited a private English company limited by guarantee All rights reserved The KPMG name and logo are
trademarks used under license by the independent member firms of the KPMG global organization NDP08974-1A
Measure Country Source Source detail Years Link
Corruption
Perception
Index
AllWorld Economic
Forum
Global
Competitiveness
Index 2018
2018
httpreports
weforumorgglobal-
competitiveness-
report-2018
Protecting
Minority
Investors
All The World BankDoing Business
20192019
httpswww
doingbusinessorg
endata
Enforcing
ContractsAll The World Bank
Doing Business
20192019
httpswww
doingbusinessorg
endata
Measure Country Source Source detail Years Link
Manufacturing
Value Added
All except Taiwan World Bank World Bank National
Accounts Data
2016 httpsdata
worldbankorg
indicatorNVIND
MANFCD
Manufacturing
Value Added
Taiwan The Conference
Board
International
Comparisons of
Manufacturing
Productivity and Unit
Labor Costs
2016 httpswww
conference-board
orgilcprogram
indexcfmid=42672
Manufacturing
Exports to the
US
All US Census
Bureau
Manufacturing Exports
(Customs Value)
2016 httpsusatrade
censusgov
Labor Share of
Manufacturing
Costs
United States Morgan Stanley
ndash As reported in
Business Insider
Chart of the Day The
Manufacturing Cost
Components For A
Bunch Of Different
Things
2013 httpswww
businessinsider
comchart-the-cost-
of-manufacturing-
stuff-2013-4
Trade-Weighted
US Dollar
Index
NA Federal Reserve
Bank of St Louis
Trade-Weighted US
Dollar Index Major
Currencies Goods
(Index Mar 1973=100
Monthly Not
Seasonally Adjusted)
2015ndash2019 httpsfred
stlouisfedorg
seriesTWEXMMTH
Other supporting data sources
copy 2020 KPMG LLP a Delaware limited liability partnership and the US member firm of the KPMG network of independent
member firms affiliated with KPMG International Cooperative (ldquoKPMG Internationalrdquo) a Swiss entity All rights reserved
The KPMG name and logo are registered trademarks or trademarks of KPMG International NDP089741-1A
copy 2020 KPMG LLP a Delaware limited liability partnership and a member firm of the KPMG global organization of independent member firms
affiliated with KPMG International Limited a private English company limited by guarantee All rights reserved The KPMG name and logo are
trademarks used under license by the independent member firms of the KPMG global organization NDP08974-1A26
Cost of manufacturing operations
around the globe
copy 2020 KPMG LLP a Delaware limited liability partnership and the US member firm of the KPMG network of independent
member firms affiliated with KPMG International Cooperative (ldquoKPMG Internationalrdquo) a Swiss entity All rights reserved
The KPMG name and logo are registered trademarks or trademarks of KPMG International NDP089741-1A
Appendix B Review of other studies
copy 2020 KPMG LLP a Delaware limited liability partnership and the US member firm of the KPMG network of independent
member firms affiliated with KPMG International Cooperative (ldquoKPMG Internationalrdquo) a Swiss entity All rights reserved
The KPMG name and logo are registered trademarks or trademarks of KPMG International NDP089741-1A
copy 2020 KPMG LLP a Delaware limited liability partnership and a member firm of the KPMG global organization of independent member firms
affiliated with KPMG International Limited a private English company limited by guarantee All rights reserved The KPMG name and logo are
trademarks used under license by the independent member firms of the KPMG global organization NDP08974-1A
While each companyrsquos location selection decision is
unique and reflects a range of factors various studies
have attempted to compare how companies would fare
if they considered alternate locations for their production
facilities For instance the Boston Consulting Group
performed a study in 2014 that examined the perception
that Latin America or Eastern Europe offered lower costs
of production than Western Europe the US or Japan
Based on a set of metrics such as manufacturing wages
labor productivity energy costs and exchange rates across
25 countries over time the study concluded that some of
the cost advantages of the lower-cost-base countries such
as Brazil and China have eroded over time10
The Congressional Research Service also performed a
study to assess the health of US manufacturing relative
to other countries in 201811 While focused primarily on
overall manufacturing trends in areas such as value added
by the manufacturing sector countriesrsquo share of global
manufacturing manufacturing employment and research
and development spending the study also compared
hourly costs in manufacturing across 14 countries
The study concluded that US labor costs are well above
those in emerging economies but similar in magnitude to
those in the major economies of continental Europe
Yet another study performed by the Brookings Institution
considered a broader range of indicators spanning topics
such as overall policies and regulations tax policy
energy transportation health costs workforce quality
and infrastructure and innovation across 19 countries12
This study however did not compare labor costs in
manufacturing Based on the scorecard developed by the
authors to assess the manufacturing environment the
study noted that countries that had made investments in
workforce and infrastructure such as the United Kingdom
Switzerland the United States Japan and Canada fared
much better than nations such as Brazil Indonesia
Mexico Russia India and China Our study takes a more
firm-centric approach We consider only the leading
manufacturing exporters to the US as our comparison
countries and consider a focus on primary costs including
labor and real estate
10 Boston Consulting Group ldquoThe Shifting Economics of Global Manufacturing How Cost Competitiveness is Changing Worldwiderdquo 2014
11 Congressional Research Service US Manufacturing in International Perspective February 21 2018
12 Brookings Institution Global Manufacturing Scorecard How the US Compares to 18 Other Nations 2018
28Cost of manufacturing operations
around the globe
copy 2020 KPMG LLP a Delaware limited liability partnership and the US member firm of the KPMG network of independent
member firms affiliated with KPMG International Cooperative (ldquoKPMG Internationalrdquo) a Swiss entity All rights reserved
The KPMG name and logo are registered trademarks or trademarks of KPMG International NDP089741-1A
Appendix C Shortlist of comparison countries
copy 2020 KPMG LLP a Delaware limited liability partnership and the US member firm of the KPMG network of independent
member firms affiliated with KPMG International Cooperative (ldquoKPMG Internationalrdquo) a Swiss entity All rights reserved
The KPMG name and logo are registered trademarks or trademarks of KPMG International NDP089741-1A
copy 2020 KPMG LLP a Delaware limited liability partnership and a member firm of the KPMG global organization of independent member firms
affiliated with KPMG International Limited a private English company limited by guarantee All rights reserved The KPMG name and logo are
trademarks used under license by the independent member firms of the KPMG global organization NDP08974-1A
Table 13 2016 global country rankings
Source US Census Bureau World Bank
This analysis considers a total of 16 economies in addition to the United States Table 13 lists each of
these economies as well as their respective rankings by manufacturing exports to the US and total
value added in manufacturing in 2016 Figure 2 presents the accompanying dollar value of manufacturing
exports for each economy to the US in 2016
These countries were first selected based on the customs value of manufacturing exports to the US
However the list generated on this basis did not include any countries from South America To make the
study more comprehensive Brazil the leading economy in South America with an industrial manufacturing
base in automotive aircraft and other sectors was added to the list
Country Manufacturing exports to US Total manufacturing value add
China 1 1
Mexico 2 12
Canada 3 16
Japan 4 3
Germany 5 4
Korea Rep 6 5
United Kingdom 7 9
Ireland 8 19
India 9 6
Italy 10 7
France 11 8
Vietnam 12 46
Taiwan 13 13
Malaysia 14 26
Switzerland 15 17
Brazil 18 10
copy 2020 KPMG LLP a Delaware limited liability partnership and the US member firm of the KPMG network of independent
member firms affiliated with KPMG International Cooperative (ldquoKPMG Internationalrdquo) a Swiss entity All rights reserved
The KPMG name and logo are registered trademarks or trademarks of KPMG International NDP089741-1A
30Cost of manufacturing operations
around the globe
copy 2020 KPMG LLP a Delaware limited liability partnership and a member firm of the KPMG global organization of independent member firms
affiliated with KPMG International Limited a private English company limited by guarantee All rights reserved The KPMG name and logo are
trademarks used under license by the independent member firms of the KPMG global organization NDP08974-1A
We note here that while we use exports to the US as a basis for selecting these countries the selected benchmark
countries generally rank highly when based on manufacturing output as well13 There is also a significant overlap between
these countries and those considered in other studies that we reviewed
13 US Census Bureau Manufacturing Exports (Customs Value) Accessible at httpsusatradecensusgov
Source US Census Bureau
Note that Canada data is as of 2015 and Taiwan does not contain World Bank data for any year
The global manufacturing output ranking from the World Bank source is also included for reference
Figure 1 2016 Total Manufacturing Exports to the US
Export
ing e
conom
y
Customs value (USD billions)
$500$450$400$350$300$250$200$150$100$50$0
Brazil $18
Switzerland $32
Malaysia $36
Taiwan $37
Vietnam $39
France $40
Italy $42
India $43
Ireland $43
UK $46
South Korea $68
Germany $107
Japan $128
$202Canada
$264Mexico
$454China
Appendix D Index methodology
copy 2020 KPMG LLP a Delaware limited liability partnership and a member firm of the KPMG global organization of independent
member firms affiliated with KPMG International Limited a private English company limited by guarantee All rights reserved
The KPMG name and logo are trademarks used under license by the independent member firms of the KPMG global
organization NDP08974-1A
32Cost of manufacturing operations
around the globe
copy 2020 KPMG LLP a Delaware limited liability partnership and a member firm of the KPMG global organization of independent member firms
affiliated with KPMG International Limited a private English company limited by guarantee All rights reserved The KPMG name and logo are
trademarks used under license by the independent member firms of the KPMG global organization NDP08974-1A
We use 23 metrics to develop an overall weight of the country The metrics are further segregated into Primary
and Secondary Costs The Primary Costs consist of five subcategories of costs and the Secondary Costs
consisted of an additional four subcategories (with a varying number of metrics for each category for a total of
18 categories)
The Primary and Secondary Cost Indices are equally weighted at 50 percent each and each subcategory within
these two broad categories was also equally weighted The weighting for each individual factor however varies as
the number of factors consider for each metric variesmdashthus the five Primary Costs have 20 percent weight each
for an overall ranking weight of 10 percent (50 percent20 percent) while the secondary factors have 25 percent
weight each Quality of labor for example has three metrics associated with it with each metric weighted at 42
percent (approximately 50 percent25 percent13) The table below shows the final weights for each metric
Figure 2 Weights by measure category
Table 14 Final weights in overall ranking by metric
Measure Cost type SubcategoryOverall ranking weight
1 Hourly compensation costs Primary 100
2 Real estate costs Primary 100
3 Utility costs Primary 100
4 Corporate tax rates Primary 100
5 Interest rates Primary 100
6 Learning-adjusted years of schooling Secondary Quality of Labor 42
7 Skill set of graduates Secondary Quality of Labor 42
8 Real value added per employee Secondary Quality of Labor 42
9 Days to start business Secondary Ease of Doing Business 42
10 Burden of government regulation Secondary Ease of Doing Business 42
11 Registering property Secondary Ease of Doing Business 42
12 Road quality index Secondary Infrastructure 10
13 Railroad quality Secondary Infrastructure 10
14 Airport connectivity Secondary Infrastructure 10
20
20
20
20
20
PrimaryCost Index
Hourly Compensation Costs
Real Estate Costs
Utility Costs
Corporate Tax Rates
Interest Rates
SecondaryCost Index
Quality of Labor
Ease of Doing Business
Infrastructure
Risk and Protections
25
2525
25
Primary Costs
Secondary Costs
CoDB Index 5050
Table 15 Percentile rankings by metric
Measure Cost type SubcategoryOverall ranking weight
15 Liner shipping connectivity index Secondary Infrastructure 10
16 Electric power losses ( of output) Secondary Infrastructure 14
17 Exposure to unsafe drinking water Secondary Infrastructure 14
18 Reliability of water supply Secondary Infrastructure 14
19 Access to internetWi-fi Secondary Infrastructure 42
20 Political risk Secondary Risk and Protections 31
21 Enforcing contracts Secondary Risk and Protections 31
22 Protecting minority investors Secondary Risk and Protections 31
23 Corruption perception index Secondary Risk and Protections 31
In addition to the weights assigned for each metric the
methodology for developing the index consisted of the
following steps
mdash Performance on each metric is ranked using a
percentile-based methodology The top (or bottom from
an operating cost perspective based on the metric) 15
percent receives the highest rank and the lowest (or
highest) 15 percent receives a rank of 5 Ranks for real
estate costs are shown below as an example Thus the
cheapest or lowest 15 percentile of real estate costs is
rank 1 percentiles between the 15 and 35 percentiles
receive a rank of 2 and so on This is further illustrated
in the table below
mdash The final scores are calculated by applying the
appropriate weights for each metric first at the
subcategory level and combined (using weight
multiplied by the rank) with the Primary and Secondary
Cost scores and ultimately to the overall score
The scores are then ranked for ease of display and
comparison
Real estate costs
Ranking From To
1 000 1499
2 1500 3499
3 3500 6499
4 6500 8499
5 8500 10000
copy 2020 KPMG LLP a Delaware limited liability partnership and the US member firm of the KPMG network of independent member firms
affiliated with KPMG International Cooperative (ldquoKPMG Internationalrdquo) a Swiss entity All rights reserved The KPMG name and logo are
registered trademarks or trademarks of KPMG International NDP089741-1A
34Cost of manufacturing operations
around the globe
Appendix E Real estate data sources in various cities
copy 2020 KPMG LLP a Delaware limited liability partnership and the US member firm of the KPMG network of independent
member firms affiliated with KPMG International Cooperative (ldquoKPMG Internationalrdquo) a Swiss entity All rights reserved
The KPMG name and logo are registered trademarks or trademarks of KPMG International NDP089741-1A
copy 2020 KPMG LLP a Delaware limited liability partnership and a member firm of the KPMG global organization of independent member firms
affiliated with KPMG International Limited a private English company limited by guarantee All rights reserved The KPMG name and logo are
trademarks used under license by the independent member firms of the KPMG global organization NDP08974-1A
Country City Property type Source Link
Brazil Santa Cruz
Campo
Grande
Industrial Cushman amp Wakefield
Industrial Marketbeat
Q2 2019 Brazil
Industrial Report
httpswwwcushmanwakefieldcomen
brazilinsightsbrazil-marketbeats
Brazil Satildeo Paulo Industrial Cushman amp Wakefield
Industrial Marketbeat
Q2 2019 Brazil
Industrial Report
Brazil Rio de
Janeiro
Industrial Cushman amp Wakefield
Industrial Marketbeat
Q2 2019 Brazil
Industrial Report
Canada Calgary Industrial Cushman amp Wakefield
Industrial Marketbeat
Q2 2019 Canada
Industrial Report
httpswwwcushmanwakefieldcomen
canadainsightscanada-marketbeats
Canada Ottawa Industrial Cushman amp Wakefield
Industrial Marketbeat
Q2 2019 Canada
Industrial Report
Canada Toronto Industrial Cushman amp Wakefield
Industrial Marketbeat
Q2 2019 Canada
Industrial Report
China Chengdu Logistics Colliers Quarterly
Logistics Research
Chengdu-Chonqing Q1
2019
httpswwwcollierscom-media
filesmarketresearchapacchina
southwestchina-researchwestchina-
logistics-q1-2019-enpdfla=en-GB
China Beijing Logistics Colliers Quarterly
Industrial Beijing-
Tianjin-Langeang Q1
2018
httpswwwcollierscom-mediafiles
marketresearchapacchinanorthchina-
researchbj-tj-lf-industrial-q1-2018
pdfla=en-GB
China Tianjin Logistics Colliers Quarterly
Industrial Beijing-
Tianjin-Langeang Q1
2018
France Paris Industrial and
Logistics
Cushman amp Wakefield
Industrial Market
Snapshot Q2 2019
France
httpswwwcushmanwakefieldcomen
franceinsightsfrance-marketbeat
France Lyon Industrial and
Logistics
Cushman amp Wakefield
Industrial Market
Snapshot Q2 2019
France
36Cost of manufacturing operations
around the globe
copy 2020 KPMG LLP a Delaware limited liability partnership and a member firm of the KPMG global organization of independent member firms
affiliated with KPMG International Limited a private English company limited by guarantee All rights reserved The KPMG name and logo are
trademarks used under license by the independent member firms of the KPMG global organization NDP08974-1A
Country City Property type Source Link
France Marseille Industrial and
Logistics
Cushman amp Wakefield
Industrial Market
Snapshot Q2 2019
France
httpswwwcushmanwakefieldcomen
franceinsightsfrance-marketbeat
France Bordeaux Industrial and
Logistics
Cushman amp Wakefield
Industrial Market
Snapshot Q2 2019
France
France Strasbourg Industrial and
Logistics
Cushman amp Wakefield
Industrial Market
Snapshot Q2 2019
France
France Lille Industrial and
Logistics
Cushman amp Wakefield
Industrial Market
Snapshot Q2 2019
France
France Toulouse Industrial and
Logistics
Cushman amp Wakefield
Industrial Market
Snapshot Q2 2019
France
Germany Berlin Industrial and
Logistics
Colliers Industrial and
Logistics Markets
Overview Germany
20182019
httpswwwcolliersdewp-
contentuploads201906
ColliersResearchMarket-Report-
IL20182019englpdf
Germany Dusseldorf Industrial and
Logistics
Colliers Industrial and
Logistics Markets
Overview Germany
20182019
Germany Frankfurt Industrial and
Logistics
Colliers Industrial and
Logistics Markets
Overview Germany
20182019
Germany Hamburg Industrial and
Logistics
Colliers Industrial and
Logistics Markets
Overview Germany
20182019
Germany Cologne Industrial and
Logistics
Colliers Industrial and
Logistics Markets
Overview Germany
20182019
Germany Leipzig Industrial and
Logistics
Colliers Industrial and
Logistics Markets
Overview Germany
20182019
copy 2020 KPMG LLP a Delaware limited liability partnership and a member firm of the KPMG global organization of independent member firms
affiliated with KPMG International Limited a private English company limited by guarantee All rights reserved The KPMG name and logo are
trademarks used under license by the independent member firms of the KPMG global organization NDP08974-1A
Country City Property type Source Link
Germany Munich Industrial and
Logistics
Colliers Industrial and
Logistics Markets
Overview Germany
20182019
httpswwwcolliersdewp-
contentuploads201906
ColliersResearchMarket-Report-
IL20182019englpdf
Germany Stuttgart Industrial and
Logistics
Colliers Industrial and
Logistics Markets
Overview Germany
20182019
India Delhi Industrial Cushman amp Wakefield
Industrial Marketbeat
Q4 2018 Delhi
Industrial Report
httpswwwcushmanwakefieldcomen
indiainsightsdelhi-ncr-marketbeat
India Mumbai Industrial Cushman amp Wakefield
Industrial Marketbeat
Q4 2018 Mumbai
Industrial Report
httpswwwcushmanwakefieldcomen
indiainsightsmumbai-marketbeat
Ireland Dublin Logistics Cushman amp Wakefield
Industrial Marketbeat
Q1 2019 Ireland
Industrial Report
httpswwwcushmanwakefieldcomen
irelandinsightsireland-marketbeat
Ireland Cork Logistics Cushman amp Wakefield
Industrial Marketbeat
Q1 2019 Ireland
Industrial Report
Ireland Galway Logistics Cushman amp Wakefield
Industrial Marketbeat
Q1 2019 Ireland
Industrial Report
Italy Rome Logistics CBRE Italy Logistics
MarketView Q4 2019
httpswwwcbredeenresearchItaly-
Logistics-MarketView-Q4-2019
Italy Milan Logistics CBRE Italy Logistics
MarketView Q4 2019
Italy Bologna Logistics CBRE Italy Logistics
MarketView Q4 2019
Japan Osaka Logistics CBRE Japan Real
Estate Market Outlook
2019
httpswwwcbrecomresearch-and-
reportsJapan-Real-Estate-Market-
Outlook-2019
Japan Nagoya Logistics CBRE Japan Real
Estate Market Outlook
2019
38Cost of manufacturing operations
around the globe
copy 2020 KPMG LLP a Delaware limited liability partnership and a member firm of the KPMG global organization of independent member firms
affiliated with KPMG International Limited a private English company limited by guarantee All rights reserved The KPMG name and logo are
trademarks used under license by the independent member firms of the KPMG global organization NDP08974-1A
Country City Property type Source Link
Malaysia Klang Valley Industrial CBRE Malaysia Real
Estate Market Outlook
2019
httpswwwcbrecomreport-
downloadPUBID=44c7f5c6-5dbe-4a76-
a335-ff80e9c57a79
Malaysia Penang Industrial CBRE Malaysia Real
Estate Market Outlook
2019
Malaysia Iskandar
Malaysia
Industrial CBRE Malaysia Real
Estate Market Outlook
2019
Malaysia Kuching Industrial CBRE Malaysia Real
Estate Market Outlook
2019
Mexico Mexico Industrial CBRE Mexico Industrial
Market Outlook Q2 2019
httpswwwcbrecommxenresearch-
and-reports
South Korea Greater
Seoul
Logistics DWS Market Outlook
2018
httpswwwdwscomglobalassets
institutionalresearchpdfsDWS_South_
Korea_Real_Estate_Market_Outlook_
April_2018pdf
Switzerland Industrial UBS Real Estate Focus
2019
httpsfiabciorguploadsswiss-real-
estate-focus-2019-enpdf
Taiwan Neihu
District
Taipei
Industrial Colliers Radar
Industrial Taiwan
August 2019
httpswwwcollierscom-media
filesapactaiwanother20
reports2019radarreport-enpdfla=en-
GBTaiwan Nangang
Taipei
Industrial Colliers Radar
Industrial Taiwan
August 2019
Taiwan Xizhi New
Taipei City
Industrial Colliers Radar
Industrial Taiwan
August 2019
Taiwan Jhonghe
New Taipei
City
Industrial Colliers Radar
Industrial Taiwan
August 2019
Taiwan Xindien New
Taipei City
Industrial Colliers Radar
Industrial Taiwan
August 2019
Taiwan Sanchong
New Taipei
City
Industrial Colliers Radar
Industrial Taiwan
August 2019
Taiwan Xinchuang
New Taipei
City
Industrial Colliers Radar
Industrial Taiwan
August 2019
Taiwan Tucheng
New Taipei
City
Industrial Colliers Radar
Industrial Taiwan
August 2019
copy 2020 KPMG LLP a Delaware limited liability partnership and a member firm of the KPMG global organization of independent member firms
affiliated with KPMG International Limited a private English company limited by guarantee All rights reserved The KPMG name and logo are
trademarks used under license by the independent member firms of the KPMG global organization NDP08974-1A
Country City Property type Source Link
United
Kingdom
London
(Heathrow)
Logistics Cushman amp Wakefield
Industrial Market
Snapshot Q2 2019 UK
httpswwwcushmanwakefieldcomen
united-kingdominsightsuk-marketbeat
United
Kingdom
Manchester Logistics Cushman amp Wakefield
Industrial Market
Snapshot Q2 2019 UK
United
Kingdom
Birmingham Logistics Cushman amp Wakefield
Industrial Market
Snapshot Q2 2019 UK
United
States
Boston Industrial Cushman amp Wakefield
US Industrial
Marketbeat Q2 2019
httpswwwcushmanwakefieldcomen
united-statesinsightsus-marketbeats
us-industrial-marketbeat
United
States
Omaha Industrial Cushman amp Wakefield
US Industrial
Marketbeat Q2 2019
United
States
Detroit Industrial Cushman amp Wakefield
US Industrial
Marketbeat Q2 2019
Vietnam Ho Chi Minh
City
Industrial CBRE Vietnam
Marketview Q2 2018
httpwwwcbrevietnam
comuseful=cbre-vietnam-
marketview-q2-2018Vietnam Long An Industrial CBRE Vietnam
Marketview Q2 2018
Vietnam Dong Nai Industrial CBRE Vietnam
Marketview Q2 2018
Vietnam Binh Duong Industrial CBRE Vietnam
Marketview Q2 2018
Vietnam Hanoi Industrial Colliers Vietnam Real
Estate Quarterly
Knowledge Report Q1
2019
httpswwwcollierscom-mediafiles
apacvietnampdfvietnam-quarterly-
knowledge-report-q1-2019-en-1
pdfla=en-GB
40Cost of manufacturing operations
around the globe
copy 2020 KPMG LLP a Delaware limited liability partnership and the US member firm of the KPMG network of independent
member firms affiliated with KPMG International Cooperative (ldquoKPMG Internationalrdquo) a Swiss entity All rights reserved
The KPMG name and logo are registered trademarks or trademarks of KPMG International NDP089741-1A
copy 2020 KPMG LLP a Delaware limited liability partnership and a member firm of the KPMG global organization of independent member firms
affiliated with KPMG International Limited a private English company limited by guarantee All rights reserved The KPMG name and logo are
trademarks used under license by the independent member firms of the KPMG global organization NDP08974-1A
Cost of manufacturing operations
around the globe
Contact usErkan ErdemPrincipalKPMG ndash National Tax Industry Leader for Public Sector and Economic and Statistical ConsultingT 703-286-8188
E erkanerdemkpmgcom
Oommen ThomasManaging DirectorKPMG ndash Economic and Statistical ConsultingT 415-963-8125
E oommenthomaskpmgcom
Talha MuhammadManagerKPMG ndash Economic and Statistical ConsultingT 212-909-5401
E talhamuhammadkpmgcom
Brian HecklerPartnerKPMG ndash National Sector Leader for Industrial ManufacturingT 312-665-2693
E bhecklerkpmgcom
Ulrich Schmidt Principal KPMG - Global Location amp Expansion Services T 267-256-2786 E ulrichschmidtkpmgcom
Carolyn LeeExecutive DirectorThe Manufacturing InstituteT 202-637-3079
E cleenamorg
The following information is not intended to be ldquowritten advice concerning one or more Federal tax mattersrdquo subject to the requirements of section 1037(a)(2)
of Treasury Department Circular 230
The information contained herein is of a general nature and based on authorities that are subject to change Applicability of the information to specific situations
should be determined through consultation with your tax adviser
copy 2020 KPMG LLP a Delaware limited liability partnership and a member firm of the KPMG global organization of independent member firms affiliated with
KPMG International Limited a private English company limited by guarantee All rights reserved The KPMG name and logo are trademarks used under license
by the independent member firms of the KPMG global organization NDP08974-1A
kpmgcomsocialmedia
The authors gratefully acknowledge excellent research assistance provided by Andrew Bent and
Kristina Kohl Tableau visualizations created by Konul Riegel and technical support provided by Ian Flick

copy 2020 KPMG LLP a Delaware limited liability partnership and a member firm of the KPMG global organization of independent member firms
affiliated with KPMG International Limited a private English company limited by guarantee All rights reserved The KPMG name and logo are
trademarks used under license by the independent member firms of the KPMG global organization NDP08974-1A
Measure Cost type Subcategory
1 Hourly compensation costs Primary -
2 Real estate costs Primary -
3 Utility costs Primary -
4 Corporate tax rates Primary -
5 Interest rates Primary -
6 Learning-adjusted years of schooling Secondary Quality of labor
7 Skill set of graduates Secondary Quality of labor
8 Real value added per employee Secondary Quality of labor
9 Days to start business Secondary Ease of doing business
10 Burden of government regulation Secondary Ease of doing business
11 Registering property Secondary Ease of doing business
12 Road quality index Secondary Infrastructure
13 Railroad quality Secondary Infrastructure
14 Airport connectivity Secondary Infrastructure
15 Liner shipping connectivity index Secondary Infrastructure
16 Electric power losses ( of output) Secondary Infrastructure
17 Exposure to unsafe drinking water Secondary Infrastructure
18 Reliability of water supply Secondary Infrastructure
19 Access to internetWi-Fi Secondary Infrastructure
20 Political risk Secondary Risk and protections
21 Enforcing contracts Secondary Risk and protections
22 Protecting minority investors Secondary Risk and protections
23 Corruption perception index Secondary Risk and protections
Based on these indicators we first developed separate indices one for the Primary Costs and another for
Secondary Costs and then combined the two to produce the CoDB Index an overall competitiveness index
We adopted this approach to produce one common index by which to rank the countries with respect to
CoDB while retaining the ability to explore how the Primary and Secondary Costs influenced the overall rank
Appendix A provides details on the sources from which the data on these measures were gathered
Table 1 Primary and secondary measures by subcategory
6Cost of manufacturing operations
around the globe
copy 2020 KPMG LLP a Delaware limited liability partnership and a member firm of the KPMG global organization of independent member firms
affiliated with KPMG International Limited a private English company limited by guarantee All rights reserved The KPMG name and logo are
trademarks used under license by the independent member firms of the KPMG global organization NDP08974-1A
Developing the indexSince we are evaluating 23 factorsmdashsome that impact a
manufacturing company operations in a country directly and
others more indirectlymdashit is challenging to draw cross-country
inferences by evaluating each separate CoDB factor Instead
we created a composite index that would jointly reflect the
information provided by the various individual measures We
recognize that such an index will subsume a significant range
of information across all the identified measures To provide
transparency and to allow further exploration to identify the
set of factors driving a countryrsquos index level (and rank) we
developed two indicesmdashone for the Primary Cost factors and
another for the Secondary Cost factors Subsequently we
combined them to generate an overall index (CoDB Index)
to benchmark country performance This allowed us to
analyze the relative importance of each set of factors to each
countryrsquos overall index score
As with any index the weighting placed on each component
is a key consideration Most studies that examine CoDB
factors tend to weight the key factors equally4 It did
not appear that one or some of the five Secondary Cost
categories we consideredmdashquality of labor ease of doing
business infrastructure and riskmdashstood out in importance
relative to the others Accordingly the assumption of equal
weighting appeared to be reasonable for all factors (see
Appendix D for a specific breakdown of the weights)
With respect to the Primary Cost factors namely labor utility
real estate costs interest rates and tax rates we evaluated
the need to place higher weight on labor given its perceived
importance as a factor in location decisions Specifically
we reviewed data on the contribution of labor costs to
manufacturing Analysis performed by Morgan Stanley
on the contribution to total costs of various components
indicates that for the manufacturing sector labor costs
account for approximately 16 percent of total manufacturing
costs in the US (and as high as 30 percent of total costs for
certain sectors such as electronics and apparel and as low
as 6ndash7 percent for sectors such as motor vehicles where
capital costs are much more significant)5 The 16 percent
weight indicated by this analysis is similar in magnitude to
the 20 percent weight that we use for labor under an equal
weighting approach In the absence of any clear indication
that pointed to an alternate weighting choice we assigned
equal weighting to the five primary factors6
4 For example the Brookings Institutionrsquos report Global manufacturing scorecard How the US compares to 18 other nations accessible at
httpswwwbrookingseduresearchglobal-manufacturing-scorecard-how-the-us-compares-to-18-other-nations
5 Morgan Stanley Analyst Report as cited in ldquoThe Cost Of Manufacturing StuffrdquoBusiness Insider May 2013
6 We recognize that there are alternate index weighting choices that could be adopted and that an alternate set of weights would likely yield
a different ranking on the overall index To allow the interested reader to alter the weights to reflect their facts and circumstances and
to explore sensitivity of results to these changes we have developed a Tableau visualization tool in conjunction with this study This tool
provides the ability to emphasize or deemphasize various cost factors and to visualize the impact of the changes on the CoDB Index rank
In summary we utilized the following weights presented when calculating index values for each country
Index weights
20
20
20
20
20
PrimaryCost Index
Hourly Compensation Costs
Real Estate Costs
Utility Costs
Corporate Tax Rates
Interest Rates
SecondaryCost Index
Quality of Labor
Ease of Doing Business
Infrastructure
Risk and Protections
25
2525
25
Primary Costs
Secondary Costs
CoDB Index 5050
copy 2020 KPMG LLP a Delaware limited liability partnership and a member firm of the KPMG global organization of independent member firms
affiliated with KPMG International Limited a private English company limited by guarantee All rights reserved The KPMG name and logo are
trademarks used under license by the independent member firms of the KPMG global organization NDP08974-1A
Table 3 Country ranking ndash CoDB Index
Source Cost of Manufacturing Operations Around the Globe KPMG LLP 2020
The application of the indexing methodology resulted in a ranking of countries as summarized
in Table 3 (based on score from 1ndash5 with 1 being the best and 5 being the worst)
Canada Taiwan and South Korea ranked as the top three countries on the CoDB Index
which equally weights Primary Costs factors and Secondary Cost factors The United
States ranked fifth among the 17 countries The country with the lowest rank was Brazil
with Japan Mexico Vietnam and India ranking just above
To understand the overall CoDB rankings based on the Primary Cost Index and the
Secondary Cost Index Table 4 (Primary Costs) and Table 5 (Secondary Costs) summarize
the rankings across the two subcategories of factors For Primary Costs unsurprisingly
for the most part Malaysia China Mexico and Vietnam are all tied for top position (ie
most competitive)
Results
Countries Ranking CoDB Index Score by Country (1=best 5=worst)
Canada 1 254
Taiwan 2 263
South Korea 3 265
Malaysia 4 267
United States 5 269
United Kingdom 6 269
Germany 7 274
Switzerland 8 277
Ireland 9 277
France 10 283
China 11 284
Italy 12 300
Japan 13 326
Mexico 14 333
Vietnam 15 346
India 16 349
Brazil 17 420
8Cost of manufacturing operations
around the globe
copy 2020 KPMG LLP a Delaware limited liability partnership and a member firm of the KPMG global organization of independent member firms
affiliated with KPMG International Limited a private English company limited by guarantee All rights reserved The KPMG name and logo are
trademarks used under license by the independent member firms of the KPMG global organization NDP08974-1A
From a review of the Primary and the Secondary Cost Indices it becomes apparent there are
different reasons why countries rank where they do on the CoDB Index Consider the case of
Canada which scored highest on the CoDB Index The primary driver of this rank is the fact that
Canada scored very highly on the Secondary Cost Index while maintaining a middle rank on the
Primary Cost Index The United Statesrsquo overall 5th place ranking is primarily driven by its score
on the Secondary Cost Index since it ranks 14th on the Primary Cost Index
Table 4 Country ranking ndash Primary Cost Index
Source Cost of Manufacturing Operations Around the Globe KPMG LLP 2020
Countries Ranking CoDB Primary Score Index by Country (1=best 5=worst)
Malaysia 1 240
China 1 240
Mexico 1 240
Vietnam 1 240
India 5 260
Canada 6 280
Taiwan 6 280
Italy 6 280
South Korea 9 300
Ireland 9 300
France 9 300
Germany 12 320
United Kingdom 13 320
United States 14 340
Switzerland 14 340
Brazil 16 360
Japan 17 400
copy 2020 KPMG LLP a Delaware limited liability partnership and a member firm of the KPMG global organization of independent member firms
affiliated with KPMG International Limited a private English company limited by guarantee All rights reserved The KPMG name and logo are
trademarks used under license by the independent member firms of the KPMG global organization NDP08974-1A
Table 5 Country ranking ndash Secondary Cost Index
Source Cost of Manufacturing Operations Around the Globe KPMG LLP 2020
In contrast the ranks of Malaysia and Taiwan on the CoDB
Index result from high scores on the Primary Cost Index
For instance Taiwan ranks second on the CoDB Index
despite a ranking of seventh on the Secondary Cost Index
Interestingly Chinarsquos middling score of 11 on the CoDB
Index despite being part of a four-way tie for first on the
primary factors is caused by its poor performance (rank of
13th) on the Secondary Cost Index Chinarsquos low score on
Secondary Cost Index arises primarily from higher operating
risks Overall it appears that countries that do well on
primary factors do less well on the secondary factors and
vice versa The clear exception appears to be Brazil which
ranks poorly on both indices
Primary Costs are clearly important to location decisions
To examine how the overall CoDB ranking may change
under an alternate set of weights we recomputed the
results placing a a greater consideration on Primary Costs
That is we re-ran our analysis changing the weight of
the Primary Costs and Secondary Costs from equal or 50
percentndash50 percent weighting to 70 percentndash30 percent
in favor of Primary Costs As presented in Table 6 not
surprisingly this caused Chinarsquos ranking on the CoDB Index
to move up significantly from 11th to 3rd and the US
ranking to decline from 5th to 12th However Canada
Malaysia and South Korea retained their top-five CoDB
rankings despite this change
Countries Ranking CoDB Secondary Index Score by Country (1=best 5=worst)
United States 1 197
Switzerland 2 213
United Kingdom 3 219
Canada 4 227
Germany 5 228
South Korea 6 229
Taiwan 7 247
Japan 8 252
Ireland 9 254
France 10 265
Malaysia 11 293
Italy 12 321
China 13 328
Mexico 14 426
India 15 438
Vietnam 16 451
Brazil 17 481
10Cost of manufacturing operations
around the globe
copy 2020 KPMG LLP a Delaware limited liability partnership and a member firm of the KPMG global organization of independent member firms
affiliated with KPMG International Limited a private English company limited by guarantee All rights reserved The KPMG name and logo are
trademarks used under license by the independent member firms of the KPMG global organization NDP08974-1A
Table 7 US ranking with higher weight on labor quality
Source Cost of Manufacturing Operations Around the Globe
KPMG LLP 2020
CountriesOverall ranking
Primary Cost
ranking
Secondary Cost
ranking
Ireland 1 9 2
Canada 2 6 5
Germany 3 12 4
United States 4 14 1
Switzerland 5 14 3
South Korea 6 9 6
7 We increase the weight on quality of labor to 70 percent in the Secondary Cost Index and equally weight the other
three measures at 10 percent each
8 The US tax rates used here are after tax reform
Understanding the results
Primary Cost Index
Table 8 Selected country Primary Cost percentile rankings (sorted by Primary Cost Index)
Source Cost of Manufacturing Operations Around the Globe KPMG
LLP 2020
To understand these results better we further examined the
constituents of the Primary and Secondary Cost Indices
To further understand the drivers of our findings we
examined which factors cause East Asian countries such as
Vietnam Taiwan and Malaysia to rank highly on the Primary
Cost Index and the US to rank 14 Table 8 to follow presents
constituent ranks for countries that rank highly on the Primary
Cost IndexmdashVietnam Taiwan Malaysia India China and
Mexicomdashand for the United States Note that the table
shows percentile ranks that is to say a percentile rank of 5
represents top 15 percentile of costs The percentile ranking
of 1 indicates the best performing in the category and the
percentile ranking of 5 indicates the worst performing in the
category (see Appendix D for additional details) As Table
8 indicates the differences are most stark with respect to
hourly compensation costs between US and other countries
CountryHourly
compensation costs
Real estate costs
Utility costs
Corporate tax rates
Interest rates
Malaysia 2 1 3 2 4
China 2 2 1 3 4
Mexico 1 1 1 4 5
Vietnam 1 4 1 2 4
India 1 1 2 4 5
Taiwan 3 4 2 2 3
United States
5 3 3 3 3
In terms of real estate costs and cost of capital the
United States is relatively competitive compared to the
Southeast Asian nations Among these countries only
India Malaysia and China had lower average costs for
industrial property than the US while only Taiwan had
a lower interest rate The US compares less favorably
to the Southeast Asian nations on the measures of utility
costs and corporate tax rates8 The US is tied with
Malaysia for the highest electricity costs among these
countries significantly higher than the average rate paid
by Chinese electricity users In terms of corporate tax
rates among this group only India and Mexico have higher
statutory tax rates at 30 percent compared to 27 percent
for the US
From a labor market perspective the quality of labor
available in the US is a strong asset However increasing
the weight of the quality of labor measure reveals that
there is also significant competition from European
countries and Canada in this regard For example as
presented in Table 7 increasing the weight on the
quality of labor to 70 percent from 25 percent within
the Secondary Cost Index (but maintaining equal weight
between Primary and Secondary Costs) causes Ireland
Germany and Switzerland to rise to the top five most
competitive countries with the US and Canada rising and
falling by one rank respectively7
Table 6 Country ranking with higher weight on Primary Costs
Source Cost of Manufacturing Operations Around the Globe
KPMG LLP 2020
CountriesCoDB Index
ranking
Primary Cost Index
ranking
Secondary Cost Index
ranking
Malaysia 1 1 11
Canada 2 6 4
China 3 1 13
Taiwan 4 6 7
South Korea 5 9 6
Ireland 6 9 9
copy 2020 KPMG LLP a Delaware limited liability partnership and a member firm of the KPMG global organization of independent member firms
affiliated with KPMG International Limited a private English company limited by guarantee All rights reserved The KPMG name and logo are
trademarks used under license by the independent member firms of the KPMG global organization NDP08974-1A
Table 9 Industrialized country Primary Cost percentile rankings (sorted by Primary Cost Index)
Source Cost of Manufacturing Operations Around the Globe
KPMG LLP 2020
CountryHourly
compensation costs
Real estate costs
Utility costs
Corporate tax rates
Interest rates
Canada 3 3 2 3 3
South
Korea3 3 3 3 3
United
Kingdom3 5 4 1 3
United States
5 3 3 3 3
Japan 3 5 5 5 2
The impact of tax reform
As part of this analysis we also examined if tax reform
had a material impact on the relative standing of the
US In particular we examined how the US would
have ranked had we used the pre-tax-reform corporate
tax rate of 40 percent (combined federal and state
average) instead of the post-tax-reform combined rate
of 27 percent
It is worth noting here that our analysis of the tax
input is limited to the statutory corporate rate only
We recognize that many other factors contribute to the
overall tax burden in any given jurisdiction ndash including
but not limited to the methodology of cost recovery
deductibility of debt service and the taxation of cross
border flows of income Those other factors which vary
from jurisdiction to jurisdiction were outside the scope
of this report Still we believe that use of the statutory
rate alone provides valid directional information even if
not necessarily the entire picture
As presented in Table 10 the tax reform improved the
USrsquos ranking not only on the corporate tax measure
but also on the Primary Cost Index and the CoDB Index
With tax reform the US was considered a median tax
country Had the US corporate tax rate continued to be
40 percent it would have one of the highest corporate
tax rates in the comparison group of countries The tax
reform resulted in the US ranking on the Primary Cost
Index to improve two notches from being 16th to 14th
out of the 17 countries The impact on the CoDB Index
score is even more significant with the US ranking
increasing from 11th place (considering pre-reform tax
rates) to 5th (after tax reform)
Ranking of the industrialized countries
Table 9 provides a comparison to some of the industrialized
countries relative to the US The table shows percentile
ranks that is to say a percentile rank of 5 represents
the top 15th percentile of costs (worst performing
from competitiveness standpoint) while a percentile
rank of 1 slots into the best performing in the category
(see Appendix D for additional details) We note that
even compared to the industrialized countries US
labor costs are high Hourly rates in Canada United
Kingdom and Japan range between $23 per hour and
$30 per hour compared to $39 per hour in the US With
respect to corporate tax rates where tax reform lowered
rates significantly the US rates are lower than Japan
comparable to Canada but still higher than that imposed
by the United Kingdom
12Cost of manufacturing operations
around the globe
copy 2020 KPMG LLP a Delaware limited liability partnership and a member firm of the KPMG global organization of independent member firms
affiliated with KPMG International Limited a private English company limited by guarantee All rights reserved The KPMG name and logo are
trademarks used under license by the independent member firms of the KPMG global organization NDP08974-1A
Secondary Cost Index
With respect to Secondary Cost factors the US clearly is in a strong position As Table 11 below
indicates (the countries sorted by their respective rank on the Secondary Cost Index) the US
scores are among the top three on almost all of the metrics including quality of labor transport
infrastructure and ease of doing business The scores below represent weighted averages of
percentile ranks for each measure considered under the category A score of one (1) is best while
five (5) is worst (see Appendix D for additional details)
Source Cost of Manufacturing Operations Around the Globe KPMG LLP 2020
Table 11 Secondary Index Cost factor scores (sorted by Secondary Cost Index)
CountriesQuality of labor score
Ease of doing business score
Infrastructure score10
Infrastructure ndash Transport score
Infrastructure ndash Utility score
Risk and protections score
United States 167 200 222 200 267 200
Switzerland 167 167 244 300 233 275
United Kingdom 267 233 225 275 300 150
Canada 233 233 242 325 300 200
Germany 167 267 228 250 233 250
South Korea 233 333 150 150 200 200
Taiwan 300 233 278 300 233 175
Japan 233 300 225 175 200 250
Ireland 133 300 358 475 300 225
France 267 300 269 275 233 225
Malaysia 333 233 306 250 367 300
Italy 333 300 350 350 300 300
China 367 233 364 225 367 350
Mexico 433 400 444 400 433 425
India 500 433 442 325 500 375
Vietnam 467 433 431 425 467 475
Brazil 500 500 447 475 467 475
9 Infrastructure score is a combined score across transportation utility and internet Details are shown for transportation and utility
subcomponents while internet access is not shown in the table but is included the combined score Each of these three factors
(transport utility and internet) get an equal weight
CountriesCurrent CoDB index rank
Pre-tax-reform CoDB index rank
Change in rankings due to US tax reform
Canada 1 1 0
Taiwan 2 2 0
South Korea 3 4 +1
Malaysia 4 5 +1
United States 5 11 +6
United Kingdom 6 6 0
Source Cost of Manufacturing Operations Around the Globe KPMG LLP 2020
Table 10 Impact of the US tax reform
copy 2020 KPMG LLP a Delaware limited liability partnership and a member firm of the KPMG global organization of independent member firms
affiliated with KPMG International Limited a private English company limited by guarantee All rights reserved The KPMG name and logo are
trademarks used under license by the independent member firms of the KPMG global organization NDP08974-1A
Source Cost of Manufacturing Operations Around the Globe
KPMG LLP 2020
Table 12 Percentile ranks for cost and quality of labor
On all of the secondary factors considered including quality
of labor the United States ranks significantly better than
countries that offer lower labor costs such as Vietnam
China Mexico and India To put it differently the low ranking
of these countries on the Secondary Cost Index reflects
the weaker investment climatemdashfor example the poorer
connectivity from limited road rail and airline networks more
challenging business operating environments and lower
levels of transparency in government operation and reduced
legal protections available to businesses
The industrialized countries generally rank favorably and
similarly across secondary metrics falling for the most part
in the top half of the countries Among them however
the US clearly ranks better with respect to at least two
factors the quality of labor and ease of doing business
Thus relative to the other 16 countries considered the
US ranks best on the Secondary Cost components
Labor ndash Cost and quality
As noted earlier compensation cost is often the most cited
factor for locating manufacturing facilities in Asian countries
such as China Taiwan or Vietnam As the data confirm these
countries do offer among the lowest hourly compensation
costs for labor Further the hourly compensation costs in the
US are among the highest in the world
As Table 12 shows a different picture emerges when
productivity attributes are considered in addition to the
quality of labor For example countries with the most
favorable cost attributes are not always the ones with the
highest real value added per employee In fact Table 12
suggests a high degree of positive correlation between
costs and productivity
Thus it would appear that for manufacturing activities that
are more routine in nature and require less advanced skills
where the loss of productivity may be outweighed by lower
costs companies may consider locating their manufacturing
facilities in lower costs countries such as China Vietnam
or Taiwan however in higher-value-added manufacturing
where the process is more complex or automated and
requires highly skilled labor to manage the United States
may be considered more favorably as a location
CountriesHourly
compensation costs
RVA per employee
Vietnam 1 5
India 1 5
Mexico 1 4
China 2 4
Malaysia 2 4
Brazil 2 5
Taiwan 3 3
South Korea 3 3
Japan 3 3
United Kingdom 3 2
Canada 3 3
Italy 4 3
Ireland 4 1
France 4 2
United States 5 1
Germany 5 2
Switzerland 5 1
14Cost of manufacturing operations
around the globe
copy 2020 KPMG LLP a Delaware limited liability partnership and a member firm of the KPMG global organization of independent member firms
affiliated with KPMG International Limited a private English company limited by guarantee All rights reserved The KPMG name and logo are
trademarks used under license by the independent member firms of the KPMG global organization NDP08974-1A
ConclusionsOur results indicate that countries that placed better on
the Secondary Cost Index generally performed better on
the overall rankings Of the top five most competitive
economies on the overall rankings only twomdashMalaysia and
Taiwanmdashhave a better primary than secondary cost score
In keeping with this trend of lower Secondary Cost
countries scoring better on the CoDB Index the United
States placed fifth on the CoDB Index despite being tied
with Switzerland for 14th on the Primary Cost Index This
high Primary Cost Index ranking was primarily due to high
labor costs The United States was able to compensate
somewhat for these unfavorable scores on the Primary
Cost Index by placing first in the Secondary Cost Index
As part of this analysis we also examined if tax reform had
a material impact on the relative standing of the US In
particular we compared how the US ranks now (post-tax-
reform combined federal and local tax rate of 27 percent)
relative to the pre-reform with a corporate tax rate of 40
percent (combined federal and state average) The impact
on the USrsquos CoDB Index ranking is quite significant After
tax reform the USrsquos competitiveness increasedmdashas
evidenced by its current rank of 5mdashcompared with its
previous rank of 11 under pre-reform tax rates
A closer look at the countries that outperformed the US
on the CoDB Index ranking indicates some interesting
factors For example the US outperformed all of the
countries on the Secondary Cost Index due to better labor
productivity and business conditions This implies that the
outperformance on the CoDB Index by Canada Taiwan
South Korea and Malaysia are all driven by Primary Cost
factors Specifically Canadarsquos rank is driven primarily by
its ability to offer lower compensation costs and slightly
lower electricity rates while still maintaining Secondary
Cost Index rankings that were not far behind the US
South Korea ranked third by offsetting weaker ranking on
the Secondary Cost Index with even lower compensation
costs A sharper version of the tradeoff between Primary
and Secondary Cost explains the rankings of Taiwan and
Malaysia with Taiwan offering higher primary costs but
lower secondary costs
This study has focused on certain CoDB factors that are
commonly considered in manufacturing facility location
decisionsmdashat the country levelmdashand the results provide a
high-level perspective on the attributes of various countries
with respect to these factors However the location
decision is specific to each company and its consideration
of the supply chain and access to markets The decision
may be impacted by the type of industry the company is
active in the type of product where customers are and
the companyrsquos overall business strategy Thus individual
location decisions are significantly more complex than we
can address in an analysis such as this
For instance for heavy equipment manufacturing from a
transportation point of view it may be better to locate the
facility closer to suppliers and the market whereas from a
production standpoint it may be more desirable to locate
the facility closer to where the desired type of workforce
or raw materials might be available Alternatively for a
specialized precision products manufacturing operation
the firmrsquos decision may be heavily impacted by the
availability of labor with advanced manufacturing skills In
other instances tax and operating incentives offered by a
country may be significant enough to outweigh weakness
on other dimensions As such the location decision is
often guided by unique factors that may go well beyond
those we have considered
Additionally even within the factors we have considered
the relative importance of these factors to a specific firm
may be different than the weights we have considered
Furthermore it may well be the case that the factors we
classify for the purpose of convenience as secondary
are in fact primary factors for consideration in a location
decision for an individual firm or manufacturing sector
Finally a number of local factors that go into firm location
decisions may or may not be captured in the country-
level analysis For example labor and rent costs are
higher in urban areas relative to more distant suburban
or rural areas Recognizing this we have developed a
Tableau analytic and visualization tool in conjunction with
this study that allows the interested reader to alter the
weights and to reassess the score based on the relative
importance of these factors to them Click here for the
Cost of Manufacturing Operations Tool We also note for
copy 2020 KPMG LLP a Delaware limited liability partnership and the US member firm of the KPMG network of independent
member firms affiliated with KPMG International Cooperative (ldquoKPMG Internationalrdquo) a Swiss entity All rights reserved The
KPMG name and logo are registered trademarks or trademarks of KPMG International NDP089741-1A
the reader that the Primary Cost factors
are measured in US dollars Since we
have compared costs on a US dollar
denominated basis our results are impacted
by the relative strength of the various
currencies relative to the dollar As the
foreign exchange rates fluctuate as they
inevitably will the cost measurements we
have relied on would vary and possibly
impact the ranking of individual cost
components even if local currency costs do
not change
Finally we note that the rankings are based
on the best historical information available
Such data is mostly available only with a lag
and therefore the impact of recent trade
disputes or the market disruptions from
COVID-19 are not reflected in the results
copy 2020 KPMG LLP a Delaware limited liability partnership and the US member firm of the KPMG network of independent
member firms affiliated with KPMG International Cooperative (ldquoKPMG Internationalrdquo) a Swiss entity All rights reserved
The KPMG name and logo are registered trademarks or trademarks of KPMG International NDP089741-1A
16Cost of manufacturing operations
around the globe
Appendix A Data sources
copy 2020 KPMG LLP a Delaware limited liability partnership and the US member firm of the KPMG network of independent
member firms affiliated with KPMG International Cooperative (ldquoKPMG Internationalrdquo) a Swiss entity All rights reserved
The KPMG name and logo are registered trademarks or trademarks of KPMG International NDP089741-1A
copy 2020 KPMG LLP a Delaware limited liability partnership and a member firm of the KPMG global organization of independent member firms
affiliated with KPMG International Limited a private English company limited by guarantee All rights reserved The KPMG name and logo are
trademarks used under license by the independent member firms of the KPMG global organization NDP08974-1A
As discussed previously we relied on a variety of sources
to gather data on 23 metrics that spanned Primary and
Secondary Cost factors
Primary Cost Index
The Conference Board is a well-known source of data for
economists While researching international labor costs
we noted two indicators related to the manufacturing
industry that we deemed useful for our study The first
is hourly compensation costs which is a sum of hourly
pay for time worked hourly direct benefits and hourly
social insurance expenditures and labor-related taxes
The Conference Board did not have this information for
Malaysia and Vietnam so we substituted the Economist
Intelligence Unitrsquos labor cost per hour (pay and nonpay
costs) figures for these two countries
Real estate cost data that is leasing cost per square foot
was compiled from a mix of sources We collected data
from real estate advisory firms and asset managers such
as Cushman amp Wakefield Colliers International CBRE
Group Deutsche Bank DWS and UBS
Utility costs measure the average price per kilowatt hour
of electricity paid by all businesses and households in each
country excluding taxes and tariffs These prices were
retrieved from each countryrsquos respective energy regulatory
agency website
Corporate tax rates were available through internal KPMG
sources The tax rates cited in this study reflect combined
statutory federal and provincial tax rates only and do not
account for specific tax incentives International Financial
Statistics provided interest rates for Brazil Canada China
India Malaysia Mexico South Korea Switzerland the
United States and Vietnam
Interest rate data for all economies except the Euro
area countries the United Kingdom Japan and Taiwan
were obtained from the International Monetary Fundrsquos
International Financial Statistics database Interest rates for
Taiwan were retrieved from the Taiwanese central bank
while rates for the remaining economies were retrieved
from the US Federal Reserve Economic Data (FRED)
database Interest rates obtained from the IMF reflect the
monetary policy-related interest rate while interest rates
obtained from all other sources measure the discount rate
Secondary Cost measures
Quality of labor
Outside of the Doing Business report the World Bank
Group provided two additional measures for our study
learning-adjusted years of schooling and access to
internetWi-Fi
Learning-adjusted years of schooling used in the quality
of labor aggregation gives us insight into how advanced
a workerrsquos skill set might be in different countries It is
calculated by multiplying the expected years of school by
the ratio of the most recent harmonized test score and to
advancement attainment on the Trends in International
Mathematics and Science Study (TIMSS) test (The World
Bank Group)11
The Global Competitiveness Index published by the
World Economic Forum included an assessment of the
skill set of graduates (secondary and university graduates)
from each country as captured by the WEFrsquos Executive
Opinion Survey It is included in the ldquoaccess to advanced
educationrdquo category Including this measure while
similar to the learning-adjusted years of schooling takes
into account how executives perceive the quality of the
labor force and allows us to consider the perspective of a
company operating in one of these countries
Real value added per employee is a crucial metric for
companies as it has a direct impact on profits It measures
how much value each additional employee is adding to
the industry For example real value added can increase
if new employees are bringing advanced skill sets into
the workforce We used total real value added from the
Conference Board as well as the total number of people
employed to calculate real value added per employee
The Conference Board did not have this information on
Malaysia and Vietnam so we found comparable variables
for real value added per employee from Malaysia and
Vietnam from separate sources
Ease of doing business
The World Bank Group annually publishes a report titled
Doing Business which ranks 190 countries based on
their ease of doing business This research involves
very detailed quantitative indicators and a few were
particularly valuable to our study We focused on the 2019
report observing the number of days to start a business
registering property enforcing contracts and protecting
minority investors indicators As noted by The World Bank
Group the number of days to start a business measures
how many days it takes for a ldquosmall- to medium-size
limited liability company to start up and formally operate
in each economyrsquos largest business cityrdquo This is the
only variable from the Doing Business report where we
did not look at the overall score for the category (starting
a business) we only observed the number of days For
the remaining three indicators we used the scores The
registering property score is based on ldquothe steps time
and cost involved in registering a property assuming
a standardized case of an entrepreneur who wants to
18Cost of manufacturing operations
around the globe
copy 2020 KPMG LLP a Delaware limited liability partnership and a member firm of the KPMG global organization of independent member firms
affiliated with KPMG International Limited a private English company limited by guarantee All rights reserved The KPMG name and logo are
trademarks used under license by the independent member firms of the KPMG global organization NDP08974-1A
purchase land and a building that is already registered
and free of title dispute In addition the score includes
the quality of the land administration system in each
economy The quality of land administration index has five
dimensions reliability of infrastructure transparency of
information geographic coverage land dispute resolution
and equal access to property rightsrdquo (The World Bank
Group) Number of days to start a business and registering
property along with burden of government regulation
were used in our ease of doing business aggregation
Burden of government regulation is another Executive
Opinion Survey question from the Global Competitiveness
Index It is a response to the survey question ldquoIn your
country how burdensome is it for companies to comply
with public administrationrsquos requirements (eg permits
regulations reporting)rdquo Respondents can choose
a number on a scale of 1 to 7 1 being ldquoextremely
burdensomerdquo and 7 being ldquonot burdensome at allrdquo
Infrastructure
The World Economic Forumrsquos (WEF) Global Competitiveness
Index (2018 Report) contains very useful indicators relating to
starting a business Based on the values or survey responses
for each variable each country is assigned a score from 1 to
100 (100 being the best) It is important to note that we used
these scores for our study not the direct values or survey
responses
The Global Competitiveness Index provides useful information
regarding a countryrsquos infrastructure We specifically look at
transportation infrastructure and utility infrastructure In this
report transportation infrastructure is addressed with eight
variables mdashfour are sourced from WEFrsquos Executive Opinion
Survey and four are based on statistics that they compiled
from external sources
Of these variables we used the survey-based figures to
measure road quality and railroad quality while we used the
external index figures from the International Air Transport
Association (IATA) and United Nations Conference on Trade
and Development to measure airport connectivity and liner
shipping connectivity respectively Index values were not
used for the road and railroad figures due to inconsistencies
with the WEF data when we attempted to reproduce the
WEFrsquos calculations for these measures
The road quality survey results capture the response to
the survey question ldquoIn your country what is the quality
(extensiveness and condition) of road infrastructure [1 =
extremely poor among the worst in the world 7 = extremely
good among the best in the world]rdquo Similarly railroad
quality captures the average response to the question ldquoIn
your country how efficient (ie frequency punctuality
speed price) are train transport services [1 = extremely
inefficient among the worst in the world 7 = extremely
efficient among the best in the world]rdquo Airport connectivity
represents ldquothe IATA airport connectivity indicator which
measures the degree of integration of a country within the
global air transport networkrdquo The Liner shipping connectivity
index ldquoassesses a countryrsquos connectivity to global shipping
networksrdquo and is based on ldquofive components of the maritime
transport sector the number of ships their container-carrying
capacity the maximum vessel size the number of services
and the number of companies that deploy container ships in a
countryrsquos portsrdquo (World Economic Forum)
For utility infrastructure we gathered electric power losses
exposure to unsafe drinking water and reliability of water
supply from the Global Competitiveness Index Electric power
losses which measures a countryrsquos electricity quality and
exposure to unsafe drinking water which takes into account
ldquothe extent of exposure by risk level and the severity of that
riskrsquos contribution to disease burdenrdquo are both based on
statistics that were compiled from external sources Reliability
of water supply is taken from the WEFrsquos Executive Opinion
Survey and answers the question ldquoIn your country how
reliable is the water supply (lack of interruptions and flow
fluctuations)rdquo Respondents can choose a number on a
scale of 1 to 7 1 being ldquoextremely unreliablerdquo and 7 being
ldquoextremely reliablerdquo As mentioned earlier the World Bank
Group provides us with our indicator access to internetWi-
Fi which is part of the overall infrastructure aggregation It
measures the percentage of the population that is using the
internet
Risk and protections
Our political risk data was sourced from the insurance
company Credendorsquos ldquoCountry Risks Synthetizing Chartrdquo
Countries are classified into seven categories (from 1 to 7)
reflecting the intensity of risks arising as a result of political
and assimilated events Category 1 includes those countries
for which the risk is considered the lowest and category 7
contains those countries with the highest likelihood of risks
being caused by political and assimilated events In our study
we chose to focus on political risk over medium- and long-
term periods
Enforcing contracts and protecting minority investors along
with political risk and the corruption perception index were
included in our risk and protections aggregation According
to the World Bank Group the enforcing contracts score
ldquomeasures the time and cost for resolving a commercial
dispute through a local first-instance court and the quality of
copy 2020 KPMG LLP a Delaware limited liability partnership and a member firm of the KPMG global organization of independent member firms
affiliated with KPMG International Limited a private English company limited by guarantee All rights reserved The KPMG name and logo are
trademarks used under license by the independent member firms of the KPMG global organization NDP08974-1A
Measure Country Source Source detail Year Link
Hourly Compensation Costs
All (except Malaysia and Vietnam)
The Conference Board
International Comparisons of Hourly Compensation Costs in Manufacturing
2016 httpwwwconference-boardorgilcprogramindexcfmid=38269
Hourly Compensation Costs
Malaysia and Vietnam
The Economist Intelligence Unit General Statistics Office of Vietnam and Department of Statistics Malaysia
Estimated Labor Cost per Hour Manufacturing
2016 Both httpdataeiucomEI UTableViewaspx initial=trueamppub type_id=1253181310
Vietnam
httpswwwgsogov vndefault_enaspx tabid=783
Malaysia
httpsnewssstatisticsgovmynewss-portalx epepDownloadContent SearchseamcontentId =54516ampactionMethod =ep2FepDownload ContentSearchxhtml 3AcontentActiondo DisplayContentampcid= 12789
Real Estate Costs
See Appendix E
Utility Costs China China Electricity Council
Analysis of National Electricity Market Transaction Information in the Fourth Quarter of 2018
2018 Adjusted to 2015 USD
httpwwwcecorgcnguihuayutongjidianligaige2019-03 -04189190html
Primary Cost measures ndash References
judicial processes index evaluating whether each economy
has adopted a series of good practices that promote
quality and efficiency in the court systemrdquo Protecting
minority investors focuses on ldquothe strength of minority
shareholder protections against misuse of corporate assets
by directors for their personal gain as well as shareholder
rights governance safeguards and corporate transparency
requirements that reduce the risk of abuserdquo (The World
Bank Group)
The WEFrsquos Global Competitiveness Index provided scores
for each country based on the Corruption Perception Index
2016 results This index measures ldquoperceptions of corruption
in the public sectorrdquo and is scaled from 0 (highly corrupt) to
100 (very clean) According to Transparency International
who created the index ldquoThe global average score is a
paltry 43 indicating endemic corruption in a countryrsquos public
sector Top-scoring countries are far outnumbered by [low-
scoring] countries where citizens face the tangible impact of
corruption on a daily basisrdquo
Specific data sources used and linked references are provided
below
20Cost of manufacturing operations
around the globe
copy 2020 KPMG LLP a Delaware limited liability partnership and a member firm of the KPMG global organization of independent member firms
affiliated with KPMG International Limited a private English company limited by guarantee All rights reserved The KPMG name and logo are
trademarks used under license by the independent member firms of the KPMG global organization NDP08974-1A
Measure Country Source Source detail Year Link
Utility Costs France Germany Ireland Italy and United Kingdom
Eurostat Electricity prices for nonhousehold consumers ndash biannual data
2015 httpappssoeurostateceuropaeunuishowdodataset=nrg_pc_205amplang=en
Utility Costs Canada Government of Canada ndash Canada Energy Regulator
Market Snapshot Explaining the high cost of power in northern Canada February 16 2017
2016 Adjusted to 2015 USD
The Canada Energy Regulator 2017 Reproduced with the permission of Public Works and Government Services 2020
Utility Costs Brazil Governo do Brasil
Anuaacuterio Estatiacutestico de Energia Eleacutetrica 2016
2015 httppateducacaobagovbrconteudosconteudos-digitaisdownload8667pdf
Utility Costs South Korea Korea Energy Statistical Information System
Average revenues per kWh sold by segments
2015 httpwwwkesisnetsubsubChartEngjspreport_id=34110ampreport Type=0
Utility Costs Malaysia Malaysia Energy Data and Research
Malaysia Energy Statistics Handbook 2018
2015 httpsmeihstgovmydocuments10620c7e69704-6f80-40ae-a764-ad0acf4a844d
Utility Costs India Power Finance Corporation Ltd (A Govt of India Undertaking)
The Performance of State Power Utilities for the years 2013ndash14 to 2015ndash16
2015 httpswwwpfcindiacomDocumentRepositoryckfinderfilesOperationsPerformance_Reports_of_State_Power_Utilities1_Report on the Performance of State Power Utilities 2013-14 to 2015-16pdf
Utility Costs Switzerland Swiss Office of Energy
Switzerland Utility Costs 2015 httpswwwbfeadminchbfedehomehtml
Utility Costs Taiwan Taiwan Bureau of Energy
Energy Statistical Annual Reports
2015 httpswwwmoeaboegovtwECWenglishcontentContentLinkaspxmenu_id=1540
Utility Costs Japan US Energy Information Administration ndash Independent Statistics and Analysis
Japanrsquos electricity prices rising or stable despite recent fuel cost changes
2015 httpswwweiagovtodayinenergydetailphpid=27872
copy 2020 KPMG LLP a Delaware limited liability partnership and a member firm of the KPMG global organization of independent member firms
affiliated with KPMG International Limited a private English company limited by guarantee All rights reserved The KPMG name and logo are
trademarks used under license by the independent member firms of the KPMG global organization NDP08974-1A
Measure Country Source Source detail Year Link
Utility Costs United States US Energy Information Administration ndash Independent Statistics and Analysis
Average retail price of electricity United States annual
2015 httpswwweiagov
electricitydatabrowser
topic7agg=01ampgeo=
gampendsec=vgamplinechart
=ELECPRICEUS-ALL
A~ELECPRICEUS-RES
A~ELECPRICEUS-COM
A~ELECPRICEUS-IND
Aampcolumnchart=ELEC
PRICE
US-ALLA~ELECPRICE
US-RESA~ELECPRICE
US-COMA~ELECPRICE
US-INDAampmap=ELEC
PRICEUS-ALLAampfreq=
Aampctype=linechartlt=rdquordquo
div=rdquordquo style=rdquobox-sizing
border-boxrdquogt
Utility Costs Mexico US Energy Information Administration ndash Independent Statistics and Analysis
Mexico electricity market reforms attempt to reduce costs and develop new capacity
2015 httpswwweiagovtodayinenergydetailphpid=26932
Utility Costs Vietnam Vietnam Electricity ndash EVN
Vietnam Electricity Annual Report 2016
2015 httpsenevncomvnuserfileUserhuongbttfiles20177AnnualReport2016pdf
Corporate Tax Rates
All KPMG Corporate tax rates table 2019 httpshomekpmgxxenhomeservicestaxtax-tools-and-resourcestax-rates-onlinecorporate-tax-rates-tablehtml
Interest Rates Euro Area India and Japan
Federal Reserve Economic Data (FRED)
Discount Rates (Euro Area India and Japan)
2018 httpsfredstlouisfedorg
Interest Rates Taiwan Central Bank of the Republic of China
Discount Rate (Taiwan) 2018 httpswwwcbcgovtwenlp-695-2html
Interest Rates United Kingdom Bank of England Discount Rate (UK) 2018 httpswwwbankofenglandcoukmonetary-policythe-interest-rate-bank-rate
Interest Rates All (except Euro Area the UK India Japan and Taiwan)
International Financial Statistics
Interest Rates and Monetary Policy-Related Interest Rate percent per annum
2018 httpsdataimforg sk=388DFA60-1D26- 4ADE-B505-A05A55 8D9A42amp sId=1479331931186
22Cost of manufacturing operations
around the globe
copy 2020 KPMG LLP a Delaware limited liability partnership and a member firm of the KPMG global organization of independent member firms
affiliated with KPMG International Limited a private English company limited by guarantee All rights reserved The KPMG name and logo are
trademarks used under license by the independent member firms of the KPMG global organization NDP08974-1A
Secondary Cost measures
Measure Country Source Source detail Years Link
Learning-
Adjusted Years
of Schooling
All The World Bank Learning-Adjusted
Years of Schooling
2017 httpstcdata360
worldbankorg
indicatorsh00280750
country=BRA
ampindicator
=40964ampviz=bar_
chartampyears=2017
Skill set of
Graduates
All (except China) World Economic
Forum
Global
Competitiveness
Index 2019
Weighted
Average 2018ndash
2019
httpstcdata360
worldbankorg
indicators
h00280750
country=
BRAampindicator=
40964ampviz=
bar_chartampyears=2017
httpreports
weforumorg
global-
competitiveness-
report-2018
China Weighted Average
2016ndash2017
RVA per
Employee
All The Conference
Board
International
Comparisons of
Manufacturing
Productivity and
Unit Labor Costs
2017 httpswww
conference-board
orgilcprogram
indexcfmid=42672
Number of
Days to Start a
Business
All The World Bank Doing Business
2019
2019 httpswww
doingbusinessorg
endata
Burden of
Government
Regulation
All (except China) World Economic
Forum
Global
Competitiveness
Index 2019
Weighted
Average of
2018ndash2019
httpreports
weforumorgglobal-
competitiveness-
report-2019China Weighted
Average of
2016ndash2017
Registering
Property
All The World Bank Doing Business
2019
2019 httpswww
doingbusinessorg
endata
Road Quality All (except China) World Economic
Forum
Global
Competitiveness
Index 2019
Weighted
Average of
2018ndash2019
httpreports
weforumorgglobal-
competitiveness-
report-2019China Weighted
Average of
2016ndash2017
copy 2020 KPMG LLP a Delaware limited liability partnership and a member firm of the KPMG global organization of independent member firms
affiliated with KPMG International Limited a private English company limited by guarantee All rights reserved The KPMG name and logo are
trademarks used under license by the independent member firms of the KPMG global organization NDP08974-1A
Measure Country Source Source detail Years Link
Railroad Quality All (except China) World Economic
Forum
Global
Competitiveness
Index 2019
Weighted
Average of
2018ndash2019
httpreports
weforumorgglobal-
competitiveness-
report-2019China Weighted
Average of
2016ndash2017
Airport
Connectivity
All World Economic
Forum
Global
Competitiveness
Index 2019
2018 httpreports
weforumorgglobal-
competitiveness-
report-2019
Liner Shipping
Connectivity
Index
AllWorld Economic
Forum
Global
Competitiveness
Index 2018
2018
httpreports
weforumorgglobal-
competitiveness-
report-2018
Electric Power
LossesAll
World Economic
Forum
Global
Competitiveness
Index 2018
2016
httpreports
weforumorgglobal-
competitiveness-
report-2018
Exposure to
Unsafe Drinking
Water
AllWorld Economic
Forum
Global
Competitiveness
Index 2018
2017
httpreports
weforumorgglobal-
competitiveness-
report-2018
Reliability of
Water Supply
All (except China)
World Economic
Forum
Global
Competitiveness
Index 2018
Weighted
Average
2018ndash2019httpreports
weforumorgglobal-
competitiveness-
report-2018China
Weighted
Average
2016ndash2017
Access to
InternetWi-Fi
France Germany
Ireland Italy
Malaysia
Mexico South
Korea UK
Vietnam Taiwan The World Bank
Individuals using
the Internet ( of
population)
2018 httpsdata
worldbank
orgindicator
ITNETUSER
ZSview=mapBrazil Canada
China India
Japan
Switzerland US
2017
Political Risk All CredendoCountry Risk and
Insights2019
24Cost of manufacturing operations
around the globe
copy 2020 KPMG LLP a Delaware limited liability partnership and a member firm of the KPMG global organization of independent member firms
affiliated with KPMG International Limited a private English company limited by guarantee All rights reserved The KPMG name and logo are
trademarks used under license by the independent member firms of the KPMG global organization NDP08974-1A
Measure Country Source Source detail Years Link
Corruption
Perception
Index
AllWorld Economic
Forum
Global
Competitiveness
Index 2018
2018
httpreports
weforumorgglobal-
competitiveness-
report-2018
Protecting
Minority
Investors
All The World BankDoing Business
20192019
httpswww
doingbusinessorg
endata
Enforcing
ContractsAll The World Bank
Doing Business
20192019
httpswww
doingbusinessorg
endata
Measure Country Source Source detail Years Link
Manufacturing
Value Added
All except Taiwan World Bank World Bank National
Accounts Data
2016 httpsdata
worldbankorg
indicatorNVIND
MANFCD
Manufacturing
Value Added
Taiwan The Conference
Board
International
Comparisons of
Manufacturing
Productivity and Unit
Labor Costs
2016 httpswww
conference-board
orgilcprogram
indexcfmid=42672
Manufacturing
Exports to the
US
All US Census
Bureau
Manufacturing Exports
(Customs Value)
2016 httpsusatrade
censusgov
Labor Share of
Manufacturing
Costs
United States Morgan Stanley
ndash As reported in
Business Insider
Chart of the Day The
Manufacturing Cost
Components For A
Bunch Of Different
Things
2013 httpswww
businessinsider
comchart-the-cost-
of-manufacturing-
stuff-2013-4
Trade-Weighted
US Dollar
Index
NA Federal Reserve
Bank of St Louis
Trade-Weighted US
Dollar Index Major
Currencies Goods
(Index Mar 1973=100
Monthly Not
Seasonally Adjusted)
2015ndash2019 httpsfred
stlouisfedorg
seriesTWEXMMTH
Other supporting data sources
copy 2020 KPMG LLP a Delaware limited liability partnership and the US member firm of the KPMG network of independent
member firms affiliated with KPMG International Cooperative (ldquoKPMG Internationalrdquo) a Swiss entity All rights reserved
The KPMG name and logo are registered trademarks or trademarks of KPMG International NDP089741-1A
copy 2020 KPMG LLP a Delaware limited liability partnership and a member firm of the KPMG global organization of independent member firms
affiliated with KPMG International Limited a private English company limited by guarantee All rights reserved The KPMG name and logo are
trademarks used under license by the independent member firms of the KPMG global organization NDP08974-1A26
Cost of manufacturing operations
around the globe
copy 2020 KPMG LLP a Delaware limited liability partnership and the US member firm of the KPMG network of independent
member firms affiliated with KPMG International Cooperative (ldquoKPMG Internationalrdquo) a Swiss entity All rights reserved
The KPMG name and logo are registered trademarks or trademarks of KPMG International NDP089741-1A
Appendix B Review of other studies
copy 2020 KPMG LLP a Delaware limited liability partnership and the US member firm of the KPMG network of independent
member firms affiliated with KPMG International Cooperative (ldquoKPMG Internationalrdquo) a Swiss entity All rights reserved
The KPMG name and logo are registered trademarks or trademarks of KPMG International NDP089741-1A
copy 2020 KPMG LLP a Delaware limited liability partnership and a member firm of the KPMG global organization of independent member firms
affiliated with KPMG International Limited a private English company limited by guarantee All rights reserved The KPMG name and logo are
trademarks used under license by the independent member firms of the KPMG global organization NDP08974-1A
While each companyrsquos location selection decision is
unique and reflects a range of factors various studies
have attempted to compare how companies would fare
if they considered alternate locations for their production
facilities For instance the Boston Consulting Group
performed a study in 2014 that examined the perception
that Latin America or Eastern Europe offered lower costs
of production than Western Europe the US or Japan
Based on a set of metrics such as manufacturing wages
labor productivity energy costs and exchange rates across
25 countries over time the study concluded that some of
the cost advantages of the lower-cost-base countries such
as Brazil and China have eroded over time10
The Congressional Research Service also performed a
study to assess the health of US manufacturing relative
to other countries in 201811 While focused primarily on
overall manufacturing trends in areas such as value added
by the manufacturing sector countriesrsquo share of global
manufacturing manufacturing employment and research
and development spending the study also compared
hourly costs in manufacturing across 14 countries
The study concluded that US labor costs are well above
those in emerging economies but similar in magnitude to
those in the major economies of continental Europe
Yet another study performed by the Brookings Institution
considered a broader range of indicators spanning topics
such as overall policies and regulations tax policy
energy transportation health costs workforce quality
and infrastructure and innovation across 19 countries12
This study however did not compare labor costs in
manufacturing Based on the scorecard developed by the
authors to assess the manufacturing environment the
study noted that countries that had made investments in
workforce and infrastructure such as the United Kingdom
Switzerland the United States Japan and Canada fared
much better than nations such as Brazil Indonesia
Mexico Russia India and China Our study takes a more
firm-centric approach We consider only the leading
manufacturing exporters to the US as our comparison
countries and consider a focus on primary costs including
labor and real estate
10 Boston Consulting Group ldquoThe Shifting Economics of Global Manufacturing How Cost Competitiveness is Changing Worldwiderdquo 2014
11 Congressional Research Service US Manufacturing in International Perspective February 21 2018
12 Brookings Institution Global Manufacturing Scorecard How the US Compares to 18 Other Nations 2018
28Cost of manufacturing operations
around the globe
copy 2020 KPMG LLP a Delaware limited liability partnership and the US member firm of the KPMG network of independent
member firms affiliated with KPMG International Cooperative (ldquoKPMG Internationalrdquo) a Swiss entity All rights reserved
The KPMG name and logo are registered trademarks or trademarks of KPMG International NDP089741-1A
Appendix C Shortlist of comparison countries
copy 2020 KPMG LLP a Delaware limited liability partnership and the US member firm of the KPMG network of independent
member firms affiliated with KPMG International Cooperative (ldquoKPMG Internationalrdquo) a Swiss entity All rights reserved
The KPMG name and logo are registered trademarks or trademarks of KPMG International NDP089741-1A
copy 2020 KPMG LLP a Delaware limited liability partnership and a member firm of the KPMG global organization of independent member firms
affiliated with KPMG International Limited a private English company limited by guarantee All rights reserved The KPMG name and logo are
trademarks used under license by the independent member firms of the KPMG global organization NDP08974-1A
Table 13 2016 global country rankings
Source US Census Bureau World Bank
This analysis considers a total of 16 economies in addition to the United States Table 13 lists each of
these economies as well as their respective rankings by manufacturing exports to the US and total
value added in manufacturing in 2016 Figure 2 presents the accompanying dollar value of manufacturing
exports for each economy to the US in 2016
These countries were first selected based on the customs value of manufacturing exports to the US
However the list generated on this basis did not include any countries from South America To make the
study more comprehensive Brazil the leading economy in South America with an industrial manufacturing
base in automotive aircraft and other sectors was added to the list
Country Manufacturing exports to US Total manufacturing value add
China 1 1
Mexico 2 12
Canada 3 16
Japan 4 3
Germany 5 4
Korea Rep 6 5
United Kingdom 7 9
Ireland 8 19
India 9 6
Italy 10 7
France 11 8
Vietnam 12 46
Taiwan 13 13
Malaysia 14 26
Switzerland 15 17
Brazil 18 10
copy 2020 KPMG LLP a Delaware limited liability partnership and the US member firm of the KPMG network of independent
member firms affiliated with KPMG International Cooperative (ldquoKPMG Internationalrdquo) a Swiss entity All rights reserved
The KPMG name and logo are registered trademarks or trademarks of KPMG International NDP089741-1A
30Cost of manufacturing operations
around the globe
copy 2020 KPMG LLP a Delaware limited liability partnership and a member firm of the KPMG global organization of independent member firms
affiliated with KPMG International Limited a private English company limited by guarantee All rights reserved The KPMG name and logo are
trademarks used under license by the independent member firms of the KPMG global organization NDP08974-1A
We note here that while we use exports to the US as a basis for selecting these countries the selected benchmark
countries generally rank highly when based on manufacturing output as well13 There is also a significant overlap between
these countries and those considered in other studies that we reviewed
13 US Census Bureau Manufacturing Exports (Customs Value) Accessible at httpsusatradecensusgov
Source US Census Bureau
Note that Canada data is as of 2015 and Taiwan does not contain World Bank data for any year
The global manufacturing output ranking from the World Bank source is also included for reference
Figure 1 2016 Total Manufacturing Exports to the US
Export
ing e
conom
y
Customs value (USD billions)
$500$450$400$350$300$250$200$150$100$50$0
Brazil $18
Switzerland $32
Malaysia $36
Taiwan $37
Vietnam $39
France $40
Italy $42
India $43
Ireland $43
UK $46
South Korea $68
Germany $107
Japan $128
$202Canada
$264Mexico
$454China
Appendix D Index methodology
copy 2020 KPMG LLP a Delaware limited liability partnership and a member firm of the KPMG global organization of independent
member firms affiliated with KPMG International Limited a private English company limited by guarantee All rights reserved
The KPMG name and logo are trademarks used under license by the independent member firms of the KPMG global
organization NDP08974-1A
32Cost of manufacturing operations
around the globe
copy 2020 KPMG LLP a Delaware limited liability partnership and a member firm of the KPMG global organization of independent member firms
affiliated with KPMG International Limited a private English company limited by guarantee All rights reserved The KPMG name and logo are
trademarks used under license by the independent member firms of the KPMG global organization NDP08974-1A
We use 23 metrics to develop an overall weight of the country The metrics are further segregated into Primary
and Secondary Costs The Primary Costs consist of five subcategories of costs and the Secondary Costs
consisted of an additional four subcategories (with a varying number of metrics for each category for a total of
18 categories)
The Primary and Secondary Cost Indices are equally weighted at 50 percent each and each subcategory within
these two broad categories was also equally weighted The weighting for each individual factor however varies as
the number of factors consider for each metric variesmdashthus the five Primary Costs have 20 percent weight each
for an overall ranking weight of 10 percent (50 percent20 percent) while the secondary factors have 25 percent
weight each Quality of labor for example has three metrics associated with it with each metric weighted at 42
percent (approximately 50 percent25 percent13) The table below shows the final weights for each metric
Figure 2 Weights by measure category
Table 14 Final weights in overall ranking by metric
Measure Cost type SubcategoryOverall ranking weight
1 Hourly compensation costs Primary 100
2 Real estate costs Primary 100
3 Utility costs Primary 100
4 Corporate tax rates Primary 100
5 Interest rates Primary 100
6 Learning-adjusted years of schooling Secondary Quality of Labor 42
7 Skill set of graduates Secondary Quality of Labor 42
8 Real value added per employee Secondary Quality of Labor 42
9 Days to start business Secondary Ease of Doing Business 42
10 Burden of government regulation Secondary Ease of Doing Business 42
11 Registering property Secondary Ease of Doing Business 42
12 Road quality index Secondary Infrastructure 10
13 Railroad quality Secondary Infrastructure 10
14 Airport connectivity Secondary Infrastructure 10
20
20
20
20
20
PrimaryCost Index
Hourly Compensation Costs
Real Estate Costs
Utility Costs
Corporate Tax Rates
Interest Rates
SecondaryCost Index
Quality of Labor
Ease of Doing Business
Infrastructure
Risk and Protections
25
2525
25
Primary Costs
Secondary Costs
CoDB Index 5050
Table 15 Percentile rankings by metric
Measure Cost type SubcategoryOverall ranking weight
15 Liner shipping connectivity index Secondary Infrastructure 10
16 Electric power losses ( of output) Secondary Infrastructure 14
17 Exposure to unsafe drinking water Secondary Infrastructure 14
18 Reliability of water supply Secondary Infrastructure 14
19 Access to internetWi-fi Secondary Infrastructure 42
20 Political risk Secondary Risk and Protections 31
21 Enforcing contracts Secondary Risk and Protections 31
22 Protecting minority investors Secondary Risk and Protections 31
23 Corruption perception index Secondary Risk and Protections 31
In addition to the weights assigned for each metric the
methodology for developing the index consisted of the
following steps
mdash Performance on each metric is ranked using a
percentile-based methodology The top (or bottom from
an operating cost perspective based on the metric) 15
percent receives the highest rank and the lowest (or
highest) 15 percent receives a rank of 5 Ranks for real
estate costs are shown below as an example Thus the
cheapest or lowest 15 percentile of real estate costs is
rank 1 percentiles between the 15 and 35 percentiles
receive a rank of 2 and so on This is further illustrated
in the table below
mdash The final scores are calculated by applying the
appropriate weights for each metric first at the
subcategory level and combined (using weight
multiplied by the rank) with the Primary and Secondary
Cost scores and ultimately to the overall score
The scores are then ranked for ease of display and
comparison
Real estate costs
Ranking From To
1 000 1499
2 1500 3499
3 3500 6499
4 6500 8499
5 8500 10000
copy 2020 KPMG LLP a Delaware limited liability partnership and the US member firm of the KPMG network of independent member firms
affiliated with KPMG International Cooperative (ldquoKPMG Internationalrdquo) a Swiss entity All rights reserved The KPMG name and logo are
registered trademarks or trademarks of KPMG International NDP089741-1A
34Cost of manufacturing operations
around the globe
Appendix E Real estate data sources in various cities
copy 2020 KPMG LLP a Delaware limited liability partnership and the US member firm of the KPMG network of independent
member firms affiliated with KPMG International Cooperative (ldquoKPMG Internationalrdquo) a Swiss entity All rights reserved
The KPMG name and logo are registered trademarks or trademarks of KPMG International NDP089741-1A
copy 2020 KPMG LLP a Delaware limited liability partnership and a member firm of the KPMG global organization of independent member firms
affiliated with KPMG International Limited a private English company limited by guarantee All rights reserved The KPMG name and logo are
trademarks used under license by the independent member firms of the KPMG global organization NDP08974-1A
Country City Property type Source Link
Brazil Santa Cruz
Campo
Grande
Industrial Cushman amp Wakefield
Industrial Marketbeat
Q2 2019 Brazil
Industrial Report
httpswwwcushmanwakefieldcomen
brazilinsightsbrazil-marketbeats
Brazil Satildeo Paulo Industrial Cushman amp Wakefield
Industrial Marketbeat
Q2 2019 Brazil
Industrial Report
Brazil Rio de
Janeiro
Industrial Cushman amp Wakefield
Industrial Marketbeat
Q2 2019 Brazil
Industrial Report
Canada Calgary Industrial Cushman amp Wakefield
Industrial Marketbeat
Q2 2019 Canada
Industrial Report
httpswwwcushmanwakefieldcomen
canadainsightscanada-marketbeats
Canada Ottawa Industrial Cushman amp Wakefield
Industrial Marketbeat
Q2 2019 Canada
Industrial Report
Canada Toronto Industrial Cushman amp Wakefield
Industrial Marketbeat
Q2 2019 Canada
Industrial Report
China Chengdu Logistics Colliers Quarterly
Logistics Research
Chengdu-Chonqing Q1
2019
httpswwwcollierscom-media
filesmarketresearchapacchina
southwestchina-researchwestchina-
logistics-q1-2019-enpdfla=en-GB
China Beijing Logistics Colliers Quarterly
Industrial Beijing-
Tianjin-Langeang Q1
2018
httpswwwcollierscom-mediafiles
marketresearchapacchinanorthchina-
researchbj-tj-lf-industrial-q1-2018
pdfla=en-GB
China Tianjin Logistics Colliers Quarterly
Industrial Beijing-
Tianjin-Langeang Q1
2018
France Paris Industrial and
Logistics
Cushman amp Wakefield
Industrial Market
Snapshot Q2 2019
France
httpswwwcushmanwakefieldcomen
franceinsightsfrance-marketbeat
France Lyon Industrial and
Logistics
Cushman amp Wakefield
Industrial Market
Snapshot Q2 2019
France
36Cost of manufacturing operations
around the globe
copy 2020 KPMG LLP a Delaware limited liability partnership and a member firm of the KPMG global organization of independent member firms
affiliated with KPMG International Limited a private English company limited by guarantee All rights reserved The KPMG name and logo are
trademarks used under license by the independent member firms of the KPMG global organization NDP08974-1A
Country City Property type Source Link
France Marseille Industrial and
Logistics
Cushman amp Wakefield
Industrial Market
Snapshot Q2 2019
France
httpswwwcushmanwakefieldcomen
franceinsightsfrance-marketbeat
France Bordeaux Industrial and
Logistics
Cushman amp Wakefield
Industrial Market
Snapshot Q2 2019
France
France Strasbourg Industrial and
Logistics
Cushman amp Wakefield
Industrial Market
Snapshot Q2 2019
France
France Lille Industrial and
Logistics
Cushman amp Wakefield
Industrial Market
Snapshot Q2 2019
France
France Toulouse Industrial and
Logistics
Cushman amp Wakefield
Industrial Market
Snapshot Q2 2019
France
Germany Berlin Industrial and
Logistics
Colliers Industrial and
Logistics Markets
Overview Germany
20182019
httpswwwcolliersdewp-
contentuploads201906
ColliersResearchMarket-Report-
IL20182019englpdf
Germany Dusseldorf Industrial and
Logistics
Colliers Industrial and
Logistics Markets
Overview Germany
20182019
Germany Frankfurt Industrial and
Logistics
Colliers Industrial and
Logistics Markets
Overview Germany
20182019
Germany Hamburg Industrial and
Logistics
Colliers Industrial and
Logistics Markets
Overview Germany
20182019
Germany Cologne Industrial and
Logistics
Colliers Industrial and
Logistics Markets
Overview Germany
20182019
Germany Leipzig Industrial and
Logistics
Colliers Industrial and
Logistics Markets
Overview Germany
20182019
copy 2020 KPMG LLP a Delaware limited liability partnership and a member firm of the KPMG global organization of independent member firms
affiliated with KPMG International Limited a private English company limited by guarantee All rights reserved The KPMG name and logo are
trademarks used under license by the independent member firms of the KPMG global organization NDP08974-1A
Country City Property type Source Link
Germany Munich Industrial and
Logistics
Colliers Industrial and
Logistics Markets
Overview Germany
20182019
httpswwwcolliersdewp-
contentuploads201906
ColliersResearchMarket-Report-
IL20182019englpdf
Germany Stuttgart Industrial and
Logistics
Colliers Industrial and
Logistics Markets
Overview Germany
20182019
India Delhi Industrial Cushman amp Wakefield
Industrial Marketbeat
Q4 2018 Delhi
Industrial Report
httpswwwcushmanwakefieldcomen
indiainsightsdelhi-ncr-marketbeat
India Mumbai Industrial Cushman amp Wakefield
Industrial Marketbeat
Q4 2018 Mumbai
Industrial Report
httpswwwcushmanwakefieldcomen
indiainsightsmumbai-marketbeat
Ireland Dublin Logistics Cushman amp Wakefield
Industrial Marketbeat
Q1 2019 Ireland
Industrial Report
httpswwwcushmanwakefieldcomen
irelandinsightsireland-marketbeat
Ireland Cork Logistics Cushman amp Wakefield
Industrial Marketbeat
Q1 2019 Ireland
Industrial Report
Ireland Galway Logistics Cushman amp Wakefield
Industrial Marketbeat
Q1 2019 Ireland
Industrial Report
Italy Rome Logistics CBRE Italy Logistics
MarketView Q4 2019
httpswwwcbredeenresearchItaly-
Logistics-MarketView-Q4-2019
Italy Milan Logistics CBRE Italy Logistics
MarketView Q4 2019
Italy Bologna Logistics CBRE Italy Logistics
MarketView Q4 2019
Japan Osaka Logistics CBRE Japan Real
Estate Market Outlook
2019
httpswwwcbrecomresearch-and-
reportsJapan-Real-Estate-Market-
Outlook-2019
Japan Nagoya Logistics CBRE Japan Real
Estate Market Outlook
2019
38Cost of manufacturing operations
around the globe
copy 2020 KPMG LLP a Delaware limited liability partnership and a member firm of the KPMG global organization of independent member firms
affiliated with KPMG International Limited a private English company limited by guarantee All rights reserved The KPMG name and logo are
trademarks used under license by the independent member firms of the KPMG global organization NDP08974-1A
Country City Property type Source Link
Malaysia Klang Valley Industrial CBRE Malaysia Real
Estate Market Outlook
2019
httpswwwcbrecomreport-
downloadPUBID=44c7f5c6-5dbe-4a76-
a335-ff80e9c57a79
Malaysia Penang Industrial CBRE Malaysia Real
Estate Market Outlook
2019
Malaysia Iskandar
Malaysia
Industrial CBRE Malaysia Real
Estate Market Outlook
2019
Malaysia Kuching Industrial CBRE Malaysia Real
Estate Market Outlook
2019
Mexico Mexico Industrial CBRE Mexico Industrial
Market Outlook Q2 2019
httpswwwcbrecommxenresearch-
and-reports
South Korea Greater
Seoul
Logistics DWS Market Outlook
2018
httpswwwdwscomglobalassets
institutionalresearchpdfsDWS_South_
Korea_Real_Estate_Market_Outlook_
April_2018pdf
Switzerland Industrial UBS Real Estate Focus
2019
httpsfiabciorguploadsswiss-real-
estate-focus-2019-enpdf
Taiwan Neihu
District
Taipei
Industrial Colliers Radar
Industrial Taiwan
August 2019
httpswwwcollierscom-media
filesapactaiwanother20
reports2019radarreport-enpdfla=en-
GBTaiwan Nangang
Taipei
Industrial Colliers Radar
Industrial Taiwan
August 2019
Taiwan Xizhi New
Taipei City
Industrial Colliers Radar
Industrial Taiwan
August 2019
Taiwan Jhonghe
New Taipei
City
Industrial Colliers Radar
Industrial Taiwan
August 2019
Taiwan Xindien New
Taipei City
Industrial Colliers Radar
Industrial Taiwan
August 2019
Taiwan Sanchong
New Taipei
City
Industrial Colliers Radar
Industrial Taiwan
August 2019
Taiwan Xinchuang
New Taipei
City
Industrial Colliers Radar
Industrial Taiwan
August 2019
Taiwan Tucheng
New Taipei
City
Industrial Colliers Radar
Industrial Taiwan
August 2019
copy 2020 KPMG LLP a Delaware limited liability partnership and a member firm of the KPMG global organization of independent member firms
affiliated with KPMG International Limited a private English company limited by guarantee All rights reserved The KPMG name and logo are
trademarks used under license by the independent member firms of the KPMG global organization NDP08974-1A
Country City Property type Source Link
United
Kingdom
London
(Heathrow)
Logistics Cushman amp Wakefield
Industrial Market
Snapshot Q2 2019 UK
httpswwwcushmanwakefieldcomen
united-kingdominsightsuk-marketbeat
United
Kingdom
Manchester Logistics Cushman amp Wakefield
Industrial Market
Snapshot Q2 2019 UK
United
Kingdom
Birmingham Logistics Cushman amp Wakefield
Industrial Market
Snapshot Q2 2019 UK
United
States
Boston Industrial Cushman amp Wakefield
US Industrial
Marketbeat Q2 2019
httpswwwcushmanwakefieldcomen
united-statesinsightsus-marketbeats
us-industrial-marketbeat
United
States
Omaha Industrial Cushman amp Wakefield
US Industrial
Marketbeat Q2 2019
United
States
Detroit Industrial Cushman amp Wakefield
US Industrial
Marketbeat Q2 2019
Vietnam Ho Chi Minh
City
Industrial CBRE Vietnam
Marketview Q2 2018
httpwwwcbrevietnam
comuseful=cbre-vietnam-
marketview-q2-2018Vietnam Long An Industrial CBRE Vietnam
Marketview Q2 2018
Vietnam Dong Nai Industrial CBRE Vietnam
Marketview Q2 2018
Vietnam Binh Duong Industrial CBRE Vietnam
Marketview Q2 2018
Vietnam Hanoi Industrial Colliers Vietnam Real
Estate Quarterly
Knowledge Report Q1
2019
httpswwwcollierscom-mediafiles
apacvietnampdfvietnam-quarterly-
knowledge-report-q1-2019-en-1
pdfla=en-GB
40Cost of manufacturing operations
around the globe
copy 2020 KPMG LLP a Delaware limited liability partnership and the US member firm of the KPMG network of independent
member firms affiliated with KPMG International Cooperative (ldquoKPMG Internationalrdquo) a Swiss entity All rights reserved
The KPMG name and logo are registered trademarks or trademarks of KPMG International NDP089741-1A
copy 2020 KPMG LLP a Delaware limited liability partnership and a member firm of the KPMG global organization of independent member firms
affiliated with KPMG International Limited a private English company limited by guarantee All rights reserved The KPMG name and logo are
trademarks used under license by the independent member firms of the KPMG global organization NDP08974-1A
Cost of manufacturing operations
around the globe
Contact usErkan ErdemPrincipalKPMG ndash National Tax Industry Leader for Public Sector and Economic and Statistical ConsultingT 703-286-8188
E erkanerdemkpmgcom
Oommen ThomasManaging DirectorKPMG ndash Economic and Statistical ConsultingT 415-963-8125
E oommenthomaskpmgcom
Talha MuhammadManagerKPMG ndash Economic and Statistical ConsultingT 212-909-5401
E talhamuhammadkpmgcom
Brian HecklerPartnerKPMG ndash National Sector Leader for Industrial ManufacturingT 312-665-2693
E bhecklerkpmgcom
Ulrich Schmidt Principal KPMG - Global Location amp Expansion Services T 267-256-2786 E ulrichschmidtkpmgcom
Carolyn LeeExecutive DirectorThe Manufacturing InstituteT 202-637-3079
E cleenamorg
The following information is not intended to be ldquowritten advice concerning one or more Federal tax mattersrdquo subject to the requirements of section 1037(a)(2)
of Treasury Department Circular 230
The information contained herein is of a general nature and based on authorities that are subject to change Applicability of the information to specific situations
should be determined through consultation with your tax adviser
copy 2020 KPMG LLP a Delaware limited liability partnership and a member firm of the KPMG global organization of independent member firms affiliated with
KPMG International Limited a private English company limited by guarantee All rights reserved The KPMG name and logo are trademarks used under license
by the independent member firms of the KPMG global organization NDP08974-1A
kpmgcomsocialmedia
The authors gratefully acknowledge excellent research assistance provided by Andrew Bent and
Kristina Kohl Tableau visualizations created by Konul Riegel and technical support provided by Ian Flick
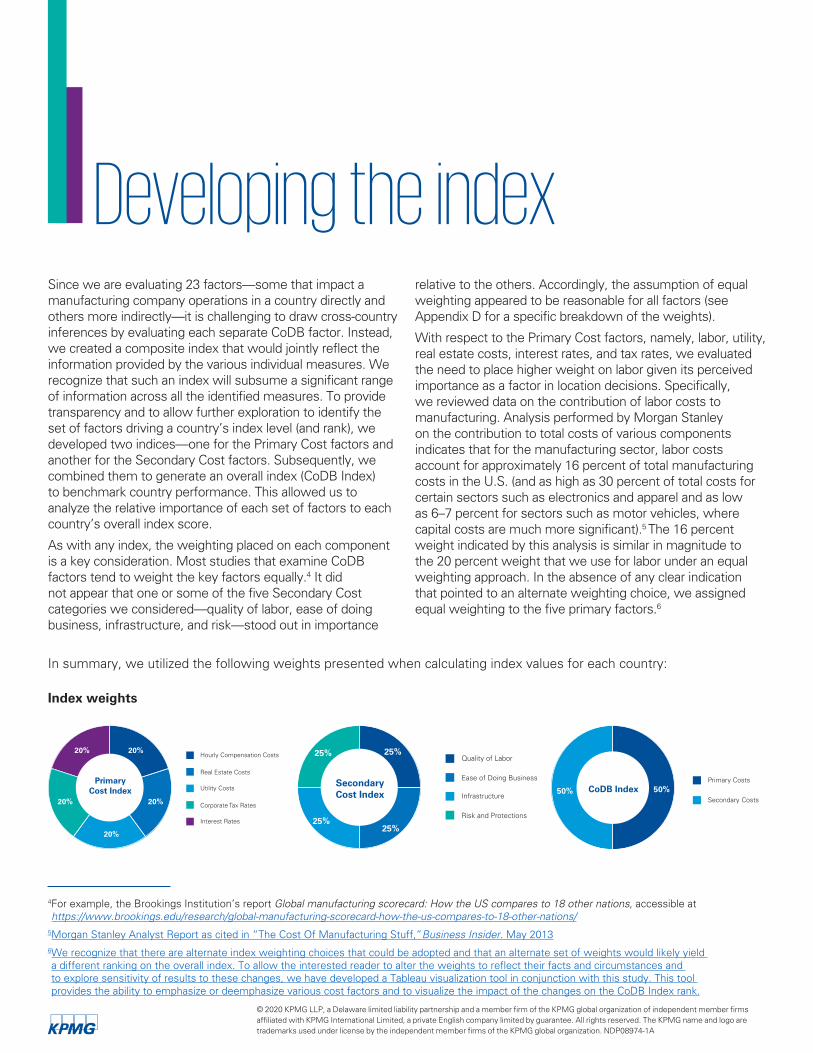
copy 2020 KPMG LLP a Delaware limited liability partnership and a member firm of the KPMG global organization of independent member firms
affiliated with KPMG International Limited a private English company limited by guarantee All rights reserved The KPMG name and logo are
trademarks used under license by the independent member firms of the KPMG global organization NDP08974-1A
Table 5 Country ranking ndash Secondary Cost Index
Source Cost of Manufacturing Operations Around the Globe KPMG LLP 2020
In contrast the ranks of Malaysia and Taiwan on the CoDB
Index result from high scores on the Primary Cost Index
For instance Taiwan ranks second on the CoDB Index
despite a ranking of seventh on the Secondary Cost Index
Interestingly Chinarsquos middling score of 11 on the CoDB
Index despite being part of a four-way tie for first on the
primary factors is caused by its poor performance (rank of
13th) on the Secondary Cost Index Chinarsquos low score on
Secondary Cost Index arises primarily from higher operating
risks Overall it appears that countries that do well on
primary factors do less well on the secondary factors and
vice versa The clear exception appears to be Brazil which
ranks poorly on both indices
Primary Costs are clearly important to location decisions
To examine how the overall CoDB ranking may change
under an alternate set of weights we recomputed the
results placing a a greater consideration on Primary Costs
That is we re-ran our analysis changing the weight of
the Primary Costs and Secondary Costs from equal or 50
percentndash50 percent weighting to 70 percentndash30 percent
in favor of Primary Costs As presented in Table 6 not
surprisingly this caused Chinarsquos ranking on the CoDB Index
to move up significantly from 11th to 3rd and the US
ranking to decline from 5th to 12th However Canada
Malaysia and South Korea retained their top-five CoDB
rankings despite this change
Countries Ranking CoDB Secondary Index Score by Country (1=best 5=worst)
United States 1 197
Switzerland 2 213
United Kingdom 3 219
Canada 4 227
Germany 5 228
South Korea 6 229
Taiwan 7 247
Japan 8 252
Ireland 9 254
France 10 265
Malaysia 11 293
Italy 12 321
China 13 328
Mexico 14 426
India 15 438
Vietnam 16 451
Brazil 17 481
10Cost of manufacturing operations
around the globe
copy 2020 KPMG LLP a Delaware limited liability partnership and a member firm of the KPMG global organization of independent member firms
affiliated with KPMG International Limited a private English company limited by guarantee All rights reserved The KPMG name and logo are
trademarks used under license by the independent member firms of the KPMG global organization NDP08974-1A
Table 7 US ranking with higher weight on labor quality
Source Cost of Manufacturing Operations Around the Globe
KPMG LLP 2020
CountriesOverall ranking
Primary Cost
ranking
Secondary Cost
ranking
Ireland 1 9 2
Canada 2 6 5
Germany 3 12 4
United States 4 14 1
Switzerland 5 14 3
South Korea 6 9 6
7 We increase the weight on quality of labor to 70 percent in the Secondary Cost Index and equally weight the other
three measures at 10 percent each
8 The US tax rates used here are after tax reform
Understanding the results
Primary Cost Index
Table 8 Selected country Primary Cost percentile rankings (sorted by Primary Cost Index)
Source Cost of Manufacturing Operations Around the Globe KPMG
LLP 2020
To understand these results better we further examined the
constituents of the Primary and Secondary Cost Indices
To further understand the drivers of our findings we
examined which factors cause East Asian countries such as
Vietnam Taiwan and Malaysia to rank highly on the Primary
Cost Index and the US to rank 14 Table 8 to follow presents
constituent ranks for countries that rank highly on the Primary
Cost IndexmdashVietnam Taiwan Malaysia India China and
Mexicomdashand for the United States Note that the table
shows percentile ranks that is to say a percentile rank of 5
represents top 15 percentile of costs The percentile ranking
of 1 indicates the best performing in the category and the
percentile ranking of 5 indicates the worst performing in the
category (see Appendix D for additional details) As Table
8 indicates the differences are most stark with respect to
hourly compensation costs between US and other countries
CountryHourly
compensation costs
Real estate costs
Utility costs
Corporate tax rates
Interest rates
Malaysia 2 1 3 2 4
China 2 2 1 3 4
Mexico 1 1 1 4 5
Vietnam 1 4 1 2 4
India 1 1 2 4 5
Taiwan 3 4 2 2 3
United States
5 3 3 3 3
In terms of real estate costs and cost of capital the
United States is relatively competitive compared to the
Southeast Asian nations Among these countries only
India Malaysia and China had lower average costs for
industrial property than the US while only Taiwan had
a lower interest rate The US compares less favorably
to the Southeast Asian nations on the measures of utility
costs and corporate tax rates8 The US is tied with
Malaysia for the highest electricity costs among these
countries significantly higher than the average rate paid
by Chinese electricity users In terms of corporate tax
rates among this group only India and Mexico have higher
statutory tax rates at 30 percent compared to 27 percent
for the US
From a labor market perspective the quality of labor
available in the US is a strong asset However increasing
the weight of the quality of labor measure reveals that
there is also significant competition from European
countries and Canada in this regard For example as
presented in Table 7 increasing the weight on the
quality of labor to 70 percent from 25 percent within
the Secondary Cost Index (but maintaining equal weight
between Primary and Secondary Costs) causes Ireland
Germany and Switzerland to rise to the top five most
competitive countries with the US and Canada rising and
falling by one rank respectively7
Table 6 Country ranking with higher weight on Primary Costs
Source Cost of Manufacturing Operations Around the Globe
KPMG LLP 2020
CountriesCoDB Index
ranking
Primary Cost Index
ranking
Secondary Cost Index
ranking
Malaysia 1 1 11
Canada 2 6 4
China 3 1 13
Taiwan 4 6 7
South Korea 5 9 6
Ireland 6 9 9
copy 2020 KPMG LLP a Delaware limited liability partnership and a member firm of the KPMG global organization of independent member firms
affiliated with KPMG International Limited a private English company limited by guarantee All rights reserved The KPMG name and logo are
trademarks used under license by the independent member firms of the KPMG global organization NDP08974-1A
Table 9 Industrialized country Primary Cost percentile rankings (sorted by Primary Cost Index)
Source Cost of Manufacturing Operations Around the Globe
KPMG LLP 2020
CountryHourly
compensation costs
Real estate costs
Utility costs
Corporate tax rates
Interest rates
Canada 3 3 2 3 3
South
Korea3 3 3 3 3
United
Kingdom3 5 4 1 3
United States
5 3 3 3 3
Japan 3 5 5 5 2
The impact of tax reform
As part of this analysis we also examined if tax reform
had a material impact on the relative standing of the
US In particular we examined how the US would
have ranked had we used the pre-tax-reform corporate
tax rate of 40 percent (combined federal and state
average) instead of the post-tax-reform combined rate
of 27 percent
It is worth noting here that our analysis of the tax
input is limited to the statutory corporate rate only
We recognize that many other factors contribute to the
overall tax burden in any given jurisdiction ndash including
but not limited to the methodology of cost recovery
deductibility of debt service and the taxation of cross
border flows of income Those other factors which vary
from jurisdiction to jurisdiction were outside the scope
of this report Still we believe that use of the statutory
rate alone provides valid directional information even if
not necessarily the entire picture
As presented in Table 10 the tax reform improved the
USrsquos ranking not only on the corporate tax measure
but also on the Primary Cost Index and the CoDB Index
With tax reform the US was considered a median tax
country Had the US corporate tax rate continued to be
40 percent it would have one of the highest corporate
tax rates in the comparison group of countries The tax
reform resulted in the US ranking on the Primary Cost
Index to improve two notches from being 16th to 14th
out of the 17 countries The impact on the CoDB Index
score is even more significant with the US ranking
increasing from 11th place (considering pre-reform tax
rates) to 5th (after tax reform)
Ranking of the industrialized countries
Table 9 provides a comparison to some of the industrialized
countries relative to the US The table shows percentile
ranks that is to say a percentile rank of 5 represents
the top 15th percentile of costs (worst performing
from competitiveness standpoint) while a percentile
rank of 1 slots into the best performing in the category
(see Appendix D for additional details) We note that
even compared to the industrialized countries US
labor costs are high Hourly rates in Canada United
Kingdom and Japan range between $23 per hour and
$30 per hour compared to $39 per hour in the US With
respect to corporate tax rates where tax reform lowered
rates significantly the US rates are lower than Japan
comparable to Canada but still higher than that imposed
by the United Kingdom
12Cost of manufacturing operations
around the globe
copy 2020 KPMG LLP a Delaware limited liability partnership and a member firm of the KPMG global organization of independent member firms
affiliated with KPMG International Limited a private English company limited by guarantee All rights reserved The KPMG name and logo are
trademarks used under license by the independent member firms of the KPMG global organization NDP08974-1A
Secondary Cost Index
With respect to Secondary Cost factors the US clearly is in a strong position As Table 11 below
indicates (the countries sorted by their respective rank on the Secondary Cost Index) the US
scores are among the top three on almost all of the metrics including quality of labor transport
infrastructure and ease of doing business The scores below represent weighted averages of
percentile ranks for each measure considered under the category A score of one (1) is best while
five (5) is worst (see Appendix D for additional details)
Source Cost of Manufacturing Operations Around the Globe KPMG LLP 2020
Table 11 Secondary Index Cost factor scores (sorted by Secondary Cost Index)
CountriesQuality of labor score
Ease of doing business score
Infrastructure score10
Infrastructure ndash Transport score
Infrastructure ndash Utility score
Risk and protections score
United States 167 200 222 200 267 200
Switzerland 167 167 244 300 233 275
United Kingdom 267 233 225 275 300 150
Canada 233 233 242 325 300 200
Germany 167 267 228 250 233 250
South Korea 233 333 150 150 200 200
Taiwan 300 233 278 300 233 175
Japan 233 300 225 175 200 250
Ireland 133 300 358 475 300 225
France 267 300 269 275 233 225
Malaysia 333 233 306 250 367 300
Italy 333 300 350 350 300 300
China 367 233 364 225 367 350
Mexico 433 400 444 400 433 425
India 500 433 442 325 500 375
Vietnam 467 433 431 425 467 475
Brazil 500 500 447 475 467 475
9 Infrastructure score is a combined score across transportation utility and internet Details are shown for transportation and utility
subcomponents while internet access is not shown in the table but is included the combined score Each of these three factors
(transport utility and internet) get an equal weight
CountriesCurrent CoDB index rank
Pre-tax-reform CoDB index rank
Change in rankings due to US tax reform
Canada 1 1 0
Taiwan 2 2 0
South Korea 3 4 +1
Malaysia 4 5 +1
United States 5 11 +6
United Kingdom 6 6 0
Source Cost of Manufacturing Operations Around the Globe KPMG LLP 2020
Table 10 Impact of the US tax reform
copy 2020 KPMG LLP a Delaware limited liability partnership and a member firm of the KPMG global organization of independent member firms
affiliated with KPMG International Limited a private English company limited by guarantee All rights reserved The KPMG name and logo are
trademarks used under license by the independent member firms of the KPMG global organization NDP08974-1A
Source Cost of Manufacturing Operations Around the Globe
KPMG LLP 2020
Table 12 Percentile ranks for cost and quality of labor
On all of the secondary factors considered including quality
of labor the United States ranks significantly better than
countries that offer lower labor costs such as Vietnam
China Mexico and India To put it differently the low ranking
of these countries on the Secondary Cost Index reflects
the weaker investment climatemdashfor example the poorer
connectivity from limited road rail and airline networks more
challenging business operating environments and lower
levels of transparency in government operation and reduced
legal protections available to businesses
The industrialized countries generally rank favorably and
similarly across secondary metrics falling for the most part
in the top half of the countries Among them however
the US clearly ranks better with respect to at least two
factors the quality of labor and ease of doing business
Thus relative to the other 16 countries considered the
US ranks best on the Secondary Cost components
Labor ndash Cost and quality
As noted earlier compensation cost is often the most cited
factor for locating manufacturing facilities in Asian countries
such as China Taiwan or Vietnam As the data confirm these
countries do offer among the lowest hourly compensation
costs for labor Further the hourly compensation costs in the
US are among the highest in the world
As Table 12 shows a different picture emerges when
productivity attributes are considered in addition to the
quality of labor For example countries with the most
favorable cost attributes are not always the ones with the
highest real value added per employee In fact Table 12
suggests a high degree of positive correlation between
costs and productivity
Thus it would appear that for manufacturing activities that
are more routine in nature and require less advanced skills
where the loss of productivity may be outweighed by lower
costs companies may consider locating their manufacturing
facilities in lower costs countries such as China Vietnam
or Taiwan however in higher-value-added manufacturing
where the process is more complex or automated and
requires highly skilled labor to manage the United States
may be considered more favorably as a location
CountriesHourly
compensation costs
RVA per employee
Vietnam 1 5
India 1 5
Mexico 1 4
China 2 4
Malaysia 2 4
Brazil 2 5
Taiwan 3 3
South Korea 3 3
Japan 3 3
United Kingdom 3 2
Canada 3 3
Italy 4 3
Ireland 4 1
France 4 2
United States 5 1
Germany 5 2
Switzerland 5 1
14Cost of manufacturing operations
around the globe
copy 2020 KPMG LLP a Delaware limited liability partnership and a member firm of the KPMG global organization of independent member firms
affiliated with KPMG International Limited a private English company limited by guarantee All rights reserved The KPMG name and logo are
trademarks used under license by the independent member firms of the KPMG global organization NDP08974-1A
ConclusionsOur results indicate that countries that placed better on
the Secondary Cost Index generally performed better on
the overall rankings Of the top five most competitive
economies on the overall rankings only twomdashMalaysia and
Taiwanmdashhave a better primary than secondary cost score
In keeping with this trend of lower Secondary Cost
countries scoring better on the CoDB Index the United
States placed fifth on the CoDB Index despite being tied
with Switzerland for 14th on the Primary Cost Index This
high Primary Cost Index ranking was primarily due to high
labor costs The United States was able to compensate
somewhat for these unfavorable scores on the Primary
Cost Index by placing first in the Secondary Cost Index
As part of this analysis we also examined if tax reform had
a material impact on the relative standing of the US In
particular we compared how the US ranks now (post-tax-
reform combined federal and local tax rate of 27 percent)
relative to the pre-reform with a corporate tax rate of 40
percent (combined federal and state average) The impact
on the USrsquos CoDB Index ranking is quite significant After
tax reform the USrsquos competitiveness increasedmdashas
evidenced by its current rank of 5mdashcompared with its
previous rank of 11 under pre-reform tax rates
A closer look at the countries that outperformed the US
on the CoDB Index ranking indicates some interesting
factors For example the US outperformed all of the
countries on the Secondary Cost Index due to better labor
productivity and business conditions This implies that the
outperformance on the CoDB Index by Canada Taiwan
South Korea and Malaysia are all driven by Primary Cost
factors Specifically Canadarsquos rank is driven primarily by
its ability to offer lower compensation costs and slightly
lower electricity rates while still maintaining Secondary
Cost Index rankings that were not far behind the US
South Korea ranked third by offsetting weaker ranking on
the Secondary Cost Index with even lower compensation
costs A sharper version of the tradeoff between Primary
and Secondary Cost explains the rankings of Taiwan and
Malaysia with Taiwan offering higher primary costs but
lower secondary costs
This study has focused on certain CoDB factors that are
commonly considered in manufacturing facility location
decisionsmdashat the country levelmdashand the results provide a
high-level perspective on the attributes of various countries
with respect to these factors However the location
decision is specific to each company and its consideration
of the supply chain and access to markets The decision
may be impacted by the type of industry the company is
active in the type of product where customers are and
the companyrsquos overall business strategy Thus individual
location decisions are significantly more complex than we
can address in an analysis such as this
For instance for heavy equipment manufacturing from a
transportation point of view it may be better to locate the
facility closer to suppliers and the market whereas from a
production standpoint it may be more desirable to locate
the facility closer to where the desired type of workforce
or raw materials might be available Alternatively for a
specialized precision products manufacturing operation
the firmrsquos decision may be heavily impacted by the
availability of labor with advanced manufacturing skills In
other instances tax and operating incentives offered by a
country may be significant enough to outweigh weakness
on other dimensions As such the location decision is
often guided by unique factors that may go well beyond
those we have considered
Additionally even within the factors we have considered
the relative importance of these factors to a specific firm
may be different than the weights we have considered
Furthermore it may well be the case that the factors we
classify for the purpose of convenience as secondary
are in fact primary factors for consideration in a location
decision for an individual firm or manufacturing sector
Finally a number of local factors that go into firm location
decisions may or may not be captured in the country-
level analysis For example labor and rent costs are
higher in urban areas relative to more distant suburban
or rural areas Recognizing this we have developed a
Tableau analytic and visualization tool in conjunction with
this study that allows the interested reader to alter the
weights and to reassess the score based on the relative
importance of these factors to them Click here for the
Cost of Manufacturing Operations Tool We also note for
copy 2020 KPMG LLP a Delaware limited liability partnership and the US member firm of the KPMG network of independent
member firms affiliated with KPMG International Cooperative (ldquoKPMG Internationalrdquo) a Swiss entity All rights reserved The
KPMG name and logo are registered trademarks or trademarks of KPMG International NDP089741-1A
the reader that the Primary Cost factors
are measured in US dollars Since we
have compared costs on a US dollar
denominated basis our results are impacted
by the relative strength of the various
currencies relative to the dollar As the
foreign exchange rates fluctuate as they
inevitably will the cost measurements we
have relied on would vary and possibly
impact the ranking of individual cost
components even if local currency costs do
not change
Finally we note that the rankings are based
on the best historical information available
Such data is mostly available only with a lag
and therefore the impact of recent trade
disputes or the market disruptions from
COVID-19 are not reflected in the results
copy 2020 KPMG LLP a Delaware limited liability partnership and the US member firm of the KPMG network of independent
member firms affiliated with KPMG International Cooperative (ldquoKPMG Internationalrdquo) a Swiss entity All rights reserved
The KPMG name and logo are registered trademarks or trademarks of KPMG International NDP089741-1A
16Cost of manufacturing operations
around the globe
Appendix A Data sources
copy 2020 KPMG LLP a Delaware limited liability partnership and the US member firm of the KPMG network of independent
member firms affiliated with KPMG International Cooperative (ldquoKPMG Internationalrdquo) a Swiss entity All rights reserved
The KPMG name and logo are registered trademarks or trademarks of KPMG International NDP089741-1A
copy 2020 KPMG LLP a Delaware limited liability partnership and a member firm of the KPMG global organization of independent member firms
affiliated with KPMG International Limited a private English company limited by guarantee All rights reserved The KPMG name and logo are
trademarks used under license by the independent member firms of the KPMG global organization NDP08974-1A
As discussed previously we relied on a variety of sources
to gather data on 23 metrics that spanned Primary and
Secondary Cost factors
Primary Cost Index
The Conference Board is a well-known source of data for
economists While researching international labor costs
we noted two indicators related to the manufacturing
industry that we deemed useful for our study The first
is hourly compensation costs which is a sum of hourly
pay for time worked hourly direct benefits and hourly
social insurance expenditures and labor-related taxes
The Conference Board did not have this information for
Malaysia and Vietnam so we substituted the Economist
Intelligence Unitrsquos labor cost per hour (pay and nonpay
costs) figures for these two countries
Real estate cost data that is leasing cost per square foot
was compiled from a mix of sources We collected data
from real estate advisory firms and asset managers such
as Cushman amp Wakefield Colliers International CBRE
Group Deutsche Bank DWS and UBS
Utility costs measure the average price per kilowatt hour
of electricity paid by all businesses and households in each
country excluding taxes and tariffs These prices were
retrieved from each countryrsquos respective energy regulatory
agency website
Corporate tax rates were available through internal KPMG
sources The tax rates cited in this study reflect combined
statutory federal and provincial tax rates only and do not
account for specific tax incentives International Financial
Statistics provided interest rates for Brazil Canada China
India Malaysia Mexico South Korea Switzerland the
United States and Vietnam
Interest rate data for all economies except the Euro
area countries the United Kingdom Japan and Taiwan
were obtained from the International Monetary Fundrsquos
International Financial Statistics database Interest rates for
Taiwan were retrieved from the Taiwanese central bank
while rates for the remaining economies were retrieved
from the US Federal Reserve Economic Data (FRED)
database Interest rates obtained from the IMF reflect the
monetary policy-related interest rate while interest rates
obtained from all other sources measure the discount rate
Secondary Cost measures
Quality of labor
Outside of the Doing Business report the World Bank
Group provided two additional measures for our study
learning-adjusted years of schooling and access to
internetWi-Fi
Learning-adjusted years of schooling used in the quality
of labor aggregation gives us insight into how advanced
a workerrsquos skill set might be in different countries It is
calculated by multiplying the expected years of school by
the ratio of the most recent harmonized test score and to
advancement attainment on the Trends in International
Mathematics and Science Study (TIMSS) test (The World
Bank Group)11
The Global Competitiveness Index published by the
World Economic Forum included an assessment of the
skill set of graduates (secondary and university graduates)
from each country as captured by the WEFrsquos Executive
Opinion Survey It is included in the ldquoaccess to advanced
educationrdquo category Including this measure while
similar to the learning-adjusted years of schooling takes
into account how executives perceive the quality of the
labor force and allows us to consider the perspective of a
company operating in one of these countries
Real value added per employee is a crucial metric for
companies as it has a direct impact on profits It measures
how much value each additional employee is adding to
the industry For example real value added can increase
if new employees are bringing advanced skill sets into
the workforce We used total real value added from the
Conference Board as well as the total number of people
employed to calculate real value added per employee
The Conference Board did not have this information on
Malaysia and Vietnam so we found comparable variables
for real value added per employee from Malaysia and
Vietnam from separate sources
Ease of doing business
The World Bank Group annually publishes a report titled
Doing Business which ranks 190 countries based on
their ease of doing business This research involves
very detailed quantitative indicators and a few were
particularly valuable to our study We focused on the 2019
report observing the number of days to start a business
registering property enforcing contracts and protecting
minority investors indicators As noted by The World Bank
Group the number of days to start a business measures
how many days it takes for a ldquosmall- to medium-size
limited liability company to start up and formally operate
in each economyrsquos largest business cityrdquo This is the
only variable from the Doing Business report where we
did not look at the overall score for the category (starting
a business) we only observed the number of days For
the remaining three indicators we used the scores The
registering property score is based on ldquothe steps time
and cost involved in registering a property assuming
a standardized case of an entrepreneur who wants to
18Cost of manufacturing operations
around the globe
copy 2020 KPMG LLP a Delaware limited liability partnership and a member firm of the KPMG global organization of independent member firms
affiliated with KPMG International Limited a private English company limited by guarantee All rights reserved The KPMG name and logo are
trademarks used under license by the independent member firms of the KPMG global organization NDP08974-1A
purchase land and a building that is already registered
and free of title dispute In addition the score includes
the quality of the land administration system in each
economy The quality of land administration index has five
dimensions reliability of infrastructure transparency of
information geographic coverage land dispute resolution
and equal access to property rightsrdquo (The World Bank
Group) Number of days to start a business and registering
property along with burden of government regulation
were used in our ease of doing business aggregation
Burden of government regulation is another Executive
Opinion Survey question from the Global Competitiveness
Index It is a response to the survey question ldquoIn your
country how burdensome is it for companies to comply
with public administrationrsquos requirements (eg permits
regulations reporting)rdquo Respondents can choose
a number on a scale of 1 to 7 1 being ldquoextremely
burdensomerdquo and 7 being ldquonot burdensome at allrdquo
Infrastructure
The World Economic Forumrsquos (WEF) Global Competitiveness
Index (2018 Report) contains very useful indicators relating to
starting a business Based on the values or survey responses
for each variable each country is assigned a score from 1 to
100 (100 being the best) It is important to note that we used
these scores for our study not the direct values or survey
responses
The Global Competitiveness Index provides useful information
regarding a countryrsquos infrastructure We specifically look at
transportation infrastructure and utility infrastructure In this
report transportation infrastructure is addressed with eight
variables mdashfour are sourced from WEFrsquos Executive Opinion
Survey and four are based on statistics that they compiled
from external sources
Of these variables we used the survey-based figures to
measure road quality and railroad quality while we used the
external index figures from the International Air Transport
Association (IATA) and United Nations Conference on Trade
and Development to measure airport connectivity and liner
shipping connectivity respectively Index values were not
used for the road and railroad figures due to inconsistencies
with the WEF data when we attempted to reproduce the
WEFrsquos calculations for these measures
The road quality survey results capture the response to
the survey question ldquoIn your country what is the quality
(extensiveness and condition) of road infrastructure [1 =
extremely poor among the worst in the world 7 = extremely
good among the best in the world]rdquo Similarly railroad
quality captures the average response to the question ldquoIn
your country how efficient (ie frequency punctuality
speed price) are train transport services [1 = extremely
inefficient among the worst in the world 7 = extremely
efficient among the best in the world]rdquo Airport connectivity
represents ldquothe IATA airport connectivity indicator which
measures the degree of integration of a country within the
global air transport networkrdquo The Liner shipping connectivity
index ldquoassesses a countryrsquos connectivity to global shipping
networksrdquo and is based on ldquofive components of the maritime
transport sector the number of ships their container-carrying
capacity the maximum vessel size the number of services
and the number of companies that deploy container ships in a
countryrsquos portsrdquo (World Economic Forum)
For utility infrastructure we gathered electric power losses
exposure to unsafe drinking water and reliability of water
supply from the Global Competitiveness Index Electric power
losses which measures a countryrsquos electricity quality and
exposure to unsafe drinking water which takes into account
ldquothe extent of exposure by risk level and the severity of that
riskrsquos contribution to disease burdenrdquo are both based on
statistics that were compiled from external sources Reliability
of water supply is taken from the WEFrsquos Executive Opinion
Survey and answers the question ldquoIn your country how
reliable is the water supply (lack of interruptions and flow
fluctuations)rdquo Respondents can choose a number on a
scale of 1 to 7 1 being ldquoextremely unreliablerdquo and 7 being
ldquoextremely reliablerdquo As mentioned earlier the World Bank
Group provides us with our indicator access to internetWi-
Fi which is part of the overall infrastructure aggregation It
measures the percentage of the population that is using the
internet
Risk and protections
Our political risk data was sourced from the insurance
company Credendorsquos ldquoCountry Risks Synthetizing Chartrdquo
Countries are classified into seven categories (from 1 to 7)
reflecting the intensity of risks arising as a result of political
and assimilated events Category 1 includes those countries
for which the risk is considered the lowest and category 7
contains those countries with the highest likelihood of risks
being caused by political and assimilated events In our study
we chose to focus on political risk over medium- and long-
term periods
Enforcing contracts and protecting minority investors along
with political risk and the corruption perception index were
included in our risk and protections aggregation According
to the World Bank Group the enforcing contracts score
ldquomeasures the time and cost for resolving a commercial
dispute through a local first-instance court and the quality of
copy 2020 KPMG LLP a Delaware limited liability partnership and a member firm of the KPMG global organization of independent member firms
affiliated with KPMG International Limited a private English company limited by guarantee All rights reserved The KPMG name and logo are
trademarks used under license by the independent member firms of the KPMG global organization NDP08974-1A
Measure Country Source Source detail Year Link
Hourly Compensation Costs
All (except Malaysia and Vietnam)
The Conference Board
International Comparisons of Hourly Compensation Costs in Manufacturing
2016 httpwwwconference-boardorgilcprogramindexcfmid=38269
Hourly Compensation Costs
Malaysia and Vietnam
The Economist Intelligence Unit General Statistics Office of Vietnam and Department of Statistics Malaysia
Estimated Labor Cost per Hour Manufacturing
2016 Both httpdataeiucomEI UTableViewaspx initial=trueamppub type_id=1253181310
Vietnam
httpswwwgsogov vndefault_enaspx tabid=783
Malaysia
httpsnewssstatisticsgovmynewss-portalx epepDownloadContent SearchseamcontentId =54516ampactionMethod =ep2FepDownload ContentSearchxhtml 3AcontentActiondo DisplayContentampcid= 12789
Real Estate Costs
See Appendix E
Utility Costs China China Electricity Council
Analysis of National Electricity Market Transaction Information in the Fourth Quarter of 2018
2018 Adjusted to 2015 USD
httpwwwcecorgcnguihuayutongjidianligaige2019-03 -04189190html
Primary Cost measures ndash References
judicial processes index evaluating whether each economy
has adopted a series of good practices that promote
quality and efficiency in the court systemrdquo Protecting
minority investors focuses on ldquothe strength of minority
shareholder protections against misuse of corporate assets
by directors for their personal gain as well as shareholder
rights governance safeguards and corporate transparency
requirements that reduce the risk of abuserdquo (The World
Bank Group)
The WEFrsquos Global Competitiveness Index provided scores
for each country based on the Corruption Perception Index
2016 results This index measures ldquoperceptions of corruption
in the public sectorrdquo and is scaled from 0 (highly corrupt) to
100 (very clean) According to Transparency International
who created the index ldquoThe global average score is a
paltry 43 indicating endemic corruption in a countryrsquos public
sector Top-scoring countries are far outnumbered by [low-
scoring] countries where citizens face the tangible impact of
corruption on a daily basisrdquo
Specific data sources used and linked references are provided
below
20Cost of manufacturing operations
around the globe
copy 2020 KPMG LLP a Delaware limited liability partnership and a member firm of the KPMG global organization of independent member firms
affiliated with KPMG International Limited a private English company limited by guarantee All rights reserved The KPMG name and logo are
trademarks used under license by the independent member firms of the KPMG global organization NDP08974-1A
Measure Country Source Source detail Year Link
Utility Costs France Germany Ireland Italy and United Kingdom
Eurostat Electricity prices for nonhousehold consumers ndash biannual data
2015 httpappssoeurostateceuropaeunuishowdodataset=nrg_pc_205amplang=en
Utility Costs Canada Government of Canada ndash Canada Energy Regulator
Market Snapshot Explaining the high cost of power in northern Canada February 16 2017
2016 Adjusted to 2015 USD
The Canada Energy Regulator 2017 Reproduced with the permission of Public Works and Government Services 2020
Utility Costs Brazil Governo do Brasil
Anuaacuterio Estatiacutestico de Energia Eleacutetrica 2016
2015 httppateducacaobagovbrconteudosconteudos-digitaisdownload8667pdf
Utility Costs South Korea Korea Energy Statistical Information System
Average revenues per kWh sold by segments
2015 httpwwwkesisnetsubsubChartEngjspreport_id=34110ampreport Type=0
Utility Costs Malaysia Malaysia Energy Data and Research
Malaysia Energy Statistics Handbook 2018
2015 httpsmeihstgovmydocuments10620c7e69704-6f80-40ae-a764-ad0acf4a844d
Utility Costs India Power Finance Corporation Ltd (A Govt of India Undertaking)
The Performance of State Power Utilities for the years 2013ndash14 to 2015ndash16
2015 httpswwwpfcindiacomDocumentRepositoryckfinderfilesOperationsPerformance_Reports_of_State_Power_Utilities1_Report on the Performance of State Power Utilities 2013-14 to 2015-16pdf
Utility Costs Switzerland Swiss Office of Energy
Switzerland Utility Costs 2015 httpswwwbfeadminchbfedehomehtml
Utility Costs Taiwan Taiwan Bureau of Energy
Energy Statistical Annual Reports
2015 httpswwwmoeaboegovtwECWenglishcontentContentLinkaspxmenu_id=1540
Utility Costs Japan US Energy Information Administration ndash Independent Statistics and Analysis
Japanrsquos electricity prices rising or stable despite recent fuel cost changes
2015 httpswwweiagovtodayinenergydetailphpid=27872
copy 2020 KPMG LLP a Delaware limited liability partnership and a member firm of the KPMG global organization of independent member firms
affiliated with KPMG International Limited a private English company limited by guarantee All rights reserved The KPMG name and logo are
trademarks used under license by the independent member firms of the KPMG global organization NDP08974-1A
Measure Country Source Source detail Year Link
Utility Costs United States US Energy Information Administration ndash Independent Statistics and Analysis
Average retail price of electricity United States annual
2015 httpswwweiagov
electricitydatabrowser
topic7agg=01ampgeo=
gampendsec=vgamplinechart
=ELECPRICEUS-ALL
A~ELECPRICEUS-RES
A~ELECPRICEUS-COM
A~ELECPRICEUS-IND
Aampcolumnchart=ELEC
PRICE
US-ALLA~ELECPRICE
US-RESA~ELECPRICE
US-COMA~ELECPRICE
US-INDAampmap=ELEC
PRICEUS-ALLAampfreq=
Aampctype=linechartlt=rdquordquo
div=rdquordquo style=rdquobox-sizing
border-boxrdquogt
Utility Costs Mexico US Energy Information Administration ndash Independent Statistics and Analysis
Mexico electricity market reforms attempt to reduce costs and develop new capacity
2015 httpswwweiagovtodayinenergydetailphpid=26932
Utility Costs Vietnam Vietnam Electricity ndash EVN
Vietnam Electricity Annual Report 2016
2015 httpsenevncomvnuserfileUserhuongbttfiles20177AnnualReport2016pdf
Corporate Tax Rates
All KPMG Corporate tax rates table 2019 httpshomekpmgxxenhomeservicestaxtax-tools-and-resourcestax-rates-onlinecorporate-tax-rates-tablehtml
Interest Rates Euro Area India and Japan
Federal Reserve Economic Data (FRED)
Discount Rates (Euro Area India and Japan)
2018 httpsfredstlouisfedorg
Interest Rates Taiwan Central Bank of the Republic of China
Discount Rate (Taiwan) 2018 httpswwwcbcgovtwenlp-695-2html
Interest Rates United Kingdom Bank of England Discount Rate (UK) 2018 httpswwwbankofenglandcoukmonetary-policythe-interest-rate-bank-rate
Interest Rates All (except Euro Area the UK India Japan and Taiwan)
International Financial Statistics
Interest Rates and Monetary Policy-Related Interest Rate percent per annum
2018 httpsdataimforg sk=388DFA60-1D26- 4ADE-B505-A05A55 8D9A42amp sId=1479331931186
22Cost of manufacturing operations
around the globe
copy 2020 KPMG LLP a Delaware limited liability partnership and a member firm of the KPMG global organization of independent member firms
affiliated with KPMG International Limited a private English company limited by guarantee All rights reserved The KPMG name and logo are
trademarks used under license by the independent member firms of the KPMG global organization NDP08974-1A
Secondary Cost measures
Measure Country Source Source detail Years Link
Learning-
Adjusted Years
of Schooling
All The World Bank Learning-Adjusted
Years of Schooling
2017 httpstcdata360
worldbankorg
indicatorsh00280750
country=BRA
ampindicator
=40964ampviz=bar_
chartampyears=2017
Skill set of
Graduates
All (except China) World Economic
Forum
Global
Competitiveness
Index 2019
Weighted
Average 2018ndash
2019
httpstcdata360
worldbankorg
indicators
h00280750
country=
BRAampindicator=
40964ampviz=
bar_chartampyears=2017
httpreports
weforumorg
global-
competitiveness-
report-2018
China Weighted Average
2016ndash2017
RVA per
Employee
All The Conference
Board
International
Comparisons of
Manufacturing
Productivity and
Unit Labor Costs
2017 httpswww
conference-board
orgilcprogram
indexcfmid=42672
Number of
Days to Start a
Business
All The World Bank Doing Business
2019
2019 httpswww
doingbusinessorg
endata
Burden of
Government
Regulation
All (except China) World Economic
Forum
Global
Competitiveness
Index 2019
Weighted
Average of
2018ndash2019
httpreports
weforumorgglobal-
competitiveness-
report-2019China Weighted
Average of
2016ndash2017
Registering
Property
All The World Bank Doing Business
2019
2019 httpswww
doingbusinessorg
endata
Road Quality All (except China) World Economic
Forum
Global
Competitiveness
Index 2019
Weighted
Average of
2018ndash2019
httpreports
weforumorgglobal-
competitiveness-
report-2019China Weighted
Average of
2016ndash2017
copy 2020 KPMG LLP a Delaware limited liability partnership and a member firm of the KPMG global organization of independent member firms
affiliated with KPMG International Limited a private English company limited by guarantee All rights reserved The KPMG name and logo are
trademarks used under license by the independent member firms of the KPMG global organization NDP08974-1A
Measure Country Source Source detail Years Link
Railroad Quality All (except China) World Economic
Forum
Global
Competitiveness
Index 2019
Weighted
Average of
2018ndash2019
httpreports
weforumorgglobal-
competitiveness-
report-2019China Weighted
Average of
2016ndash2017
Airport
Connectivity
All World Economic
Forum
Global
Competitiveness
Index 2019
2018 httpreports
weforumorgglobal-
competitiveness-
report-2019
Liner Shipping
Connectivity
Index
AllWorld Economic
Forum
Global
Competitiveness
Index 2018
2018
httpreports
weforumorgglobal-
competitiveness-
report-2018
Electric Power
LossesAll
World Economic
Forum
Global
Competitiveness
Index 2018
2016
httpreports
weforumorgglobal-
competitiveness-
report-2018
Exposure to
Unsafe Drinking
Water
AllWorld Economic
Forum
Global
Competitiveness
Index 2018
2017
httpreports
weforumorgglobal-
competitiveness-
report-2018
Reliability of
Water Supply
All (except China)
World Economic
Forum
Global
Competitiveness
Index 2018
Weighted
Average
2018ndash2019httpreports
weforumorgglobal-
competitiveness-
report-2018China
Weighted
Average
2016ndash2017
Access to
InternetWi-Fi
France Germany
Ireland Italy
Malaysia
Mexico South
Korea UK
Vietnam Taiwan The World Bank
Individuals using
the Internet ( of
population)
2018 httpsdata
worldbank
orgindicator
ITNETUSER
ZSview=mapBrazil Canada
China India
Japan
Switzerland US
2017
Political Risk All CredendoCountry Risk and
Insights2019
24Cost of manufacturing operations
around the globe
copy 2020 KPMG LLP a Delaware limited liability partnership and a member firm of the KPMG global organization of independent member firms
affiliated with KPMG International Limited a private English company limited by guarantee All rights reserved The KPMG name and logo are
trademarks used under license by the independent member firms of the KPMG global organization NDP08974-1A
Measure Country Source Source detail Years Link
Corruption
Perception
Index
AllWorld Economic
Forum
Global
Competitiveness
Index 2018
2018
httpreports
weforumorgglobal-
competitiveness-
report-2018
Protecting
Minority
Investors
All The World BankDoing Business
20192019
httpswww
doingbusinessorg
endata
Enforcing
ContractsAll The World Bank
Doing Business
20192019
httpswww
doingbusinessorg
endata
Measure Country Source Source detail Years Link
Manufacturing
Value Added
All except Taiwan World Bank World Bank National
Accounts Data
2016 httpsdata
worldbankorg
indicatorNVIND
MANFCD
Manufacturing
Value Added
Taiwan The Conference
Board
International
Comparisons of
Manufacturing
Productivity and Unit
Labor Costs
2016 httpswww
conference-board
orgilcprogram
indexcfmid=42672
Manufacturing
Exports to the
US
All US Census
Bureau
Manufacturing Exports
(Customs Value)
2016 httpsusatrade
censusgov
Labor Share of
Manufacturing
Costs
United States Morgan Stanley
ndash As reported in
Business Insider
Chart of the Day The
Manufacturing Cost
Components For A
Bunch Of Different
Things
2013 httpswww
businessinsider
comchart-the-cost-
of-manufacturing-
stuff-2013-4
Trade-Weighted
US Dollar
Index
NA Federal Reserve
Bank of St Louis
Trade-Weighted US
Dollar Index Major
Currencies Goods
(Index Mar 1973=100
Monthly Not
Seasonally Adjusted)
2015ndash2019 httpsfred
stlouisfedorg
seriesTWEXMMTH
Other supporting data sources
copy 2020 KPMG LLP a Delaware limited liability partnership and the US member firm of the KPMG network of independent
member firms affiliated with KPMG International Cooperative (ldquoKPMG Internationalrdquo) a Swiss entity All rights reserved
The KPMG name and logo are registered trademarks or trademarks of KPMG International NDP089741-1A
copy 2020 KPMG LLP a Delaware limited liability partnership and a member firm of the KPMG global organization of independent member firms
affiliated with KPMG International Limited a private English company limited by guarantee All rights reserved The KPMG name and logo are
trademarks used under license by the independent member firms of the KPMG global organization NDP08974-1A26
Cost of manufacturing operations
around the globe
copy 2020 KPMG LLP a Delaware limited liability partnership and the US member firm of the KPMG network of independent
member firms affiliated with KPMG International Cooperative (ldquoKPMG Internationalrdquo) a Swiss entity All rights reserved
The KPMG name and logo are registered trademarks or trademarks of KPMG International NDP089741-1A
Appendix B Review of other studies
copy 2020 KPMG LLP a Delaware limited liability partnership and the US member firm of the KPMG network of independent
member firms affiliated with KPMG International Cooperative (ldquoKPMG Internationalrdquo) a Swiss entity All rights reserved
The KPMG name and logo are registered trademarks or trademarks of KPMG International NDP089741-1A
copy 2020 KPMG LLP a Delaware limited liability partnership and a member firm of the KPMG global organization of independent member firms
affiliated with KPMG International Limited a private English company limited by guarantee All rights reserved The KPMG name and logo are
trademarks used under license by the independent member firms of the KPMG global organization NDP08974-1A
While each companyrsquos location selection decision is
unique and reflects a range of factors various studies
have attempted to compare how companies would fare
if they considered alternate locations for their production
facilities For instance the Boston Consulting Group
performed a study in 2014 that examined the perception
that Latin America or Eastern Europe offered lower costs
of production than Western Europe the US or Japan
Based on a set of metrics such as manufacturing wages
labor productivity energy costs and exchange rates across
25 countries over time the study concluded that some of
the cost advantages of the lower-cost-base countries such
as Brazil and China have eroded over time10
The Congressional Research Service also performed a
study to assess the health of US manufacturing relative
to other countries in 201811 While focused primarily on
overall manufacturing trends in areas such as value added
by the manufacturing sector countriesrsquo share of global
manufacturing manufacturing employment and research
and development spending the study also compared
hourly costs in manufacturing across 14 countries
The study concluded that US labor costs are well above
those in emerging economies but similar in magnitude to
those in the major economies of continental Europe
Yet another study performed by the Brookings Institution
considered a broader range of indicators spanning topics
such as overall policies and regulations tax policy
energy transportation health costs workforce quality
and infrastructure and innovation across 19 countries12
This study however did not compare labor costs in
manufacturing Based on the scorecard developed by the
authors to assess the manufacturing environment the
study noted that countries that had made investments in
workforce and infrastructure such as the United Kingdom
Switzerland the United States Japan and Canada fared
much better than nations such as Brazil Indonesia
Mexico Russia India and China Our study takes a more
firm-centric approach We consider only the leading
manufacturing exporters to the US as our comparison
countries and consider a focus on primary costs including
labor and real estate
10 Boston Consulting Group ldquoThe Shifting Economics of Global Manufacturing How Cost Competitiveness is Changing Worldwiderdquo 2014
11 Congressional Research Service US Manufacturing in International Perspective February 21 2018
12 Brookings Institution Global Manufacturing Scorecard How the US Compares to 18 Other Nations 2018
28Cost of manufacturing operations
around the globe
copy 2020 KPMG LLP a Delaware limited liability partnership and the US member firm of the KPMG network of independent
member firms affiliated with KPMG International Cooperative (ldquoKPMG Internationalrdquo) a Swiss entity All rights reserved
The KPMG name and logo are registered trademarks or trademarks of KPMG International NDP089741-1A
Appendix C Shortlist of comparison countries
copy 2020 KPMG LLP a Delaware limited liability partnership and the US member firm of the KPMG network of independent
member firms affiliated with KPMG International Cooperative (ldquoKPMG Internationalrdquo) a Swiss entity All rights reserved
The KPMG name and logo are registered trademarks or trademarks of KPMG International NDP089741-1A
copy 2020 KPMG LLP a Delaware limited liability partnership and a member firm of the KPMG global organization of independent member firms
affiliated with KPMG International Limited a private English company limited by guarantee All rights reserved The KPMG name and logo are
trademarks used under license by the independent member firms of the KPMG global organization NDP08974-1A
Table 13 2016 global country rankings
Source US Census Bureau World Bank
This analysis considers a total of 16 economies in addition to the United States Table 13 lists each of
these economies as well as their respective rankings by manufacturing exports to the US and total
value added in manufacturing in 2016 Figure 2 presents the accompanying dollar value of manufacturing
exports for each economy to the US in 2016
These countries were first selected based on the customs value of manufacturing exports to the US
However the list generated on this basis did not include any countries from South America To make the
study more comprehensive Brazil the leading economy in South America with an industrial manufacturing
base in automotive aircraft and other sectors was added to the list
Country Manufacturing exports to US Total manufacturing value add
China 1 1
Mexico 2 12
Canada 3 16
Japan 4 3
Germany 5 4
Korea Rep 6 5
United Kingdom 7 9
Ireland 8 19
India 9 6
Italy 10 7
France 11 8
Vietnam 12 46
Taiwan 13 13
Malaysia 14 26
Switzerland 15 17
Brazil 18 10
copy 2020 KPMG LLP a Delaware limited liability partnership and the US member firm of the KPMG network of independent
member firms affiliated with KPMG International Cooperative (ldquoKPMG Internationalrdquo) a Swiss entity All rights reserved
The KPMG name and logo are registered trademarks or trademarks of KPMG International NDP089741-1A
30Cost of manufacturing operations
around the globe
copy 2020 KPMG LLP a Delaware limited liability partnership and a member firm of the KPMG global organization of independent member firms
affiliated with KPMG International Limited a private English company limited by guarantee All rights reserved The KPMG name and logo are
trademarks used under license by the independent member firms of the KPMG global organization NDP08974-1A
We note here that while we use exports to the US as a basis for selecting these countries the selected benchmark
countries generally rank highly when based on manufacturing output as well13 There is also a significant overlap between
these countries and those considered in other studies that we reviewed
13 US Census Bureau Manufacturing Exports (Customs Value) Accessible at httpsusatradecensusgov
Source US Census Bureau
Note that Canada data is as of 2015 and Taiwan does not contain World Bank data for any year
The global manufacturing output ranking from the World Bank source is also included for reference
Figure 1 2016 Total Manufacturing Exports to the US
Export
ing e
conom
y
Customs value (USD billions)
$500$450$400$350$300$250$200$150$100$50$0
Brazil $18
Switzerland $32
Malaysia $36
Taiwan $37
Vietnam $39
France $40
Italy $42
India $43
Ireland $43
UK $46
South Korea $68
Germany $107
Japan $128
$202Canada
$264Mexico
$454China
Appendix D Index methodology
copy 2020 KPMG LLP a Delaware limited liability partnership and a member firm of the KPMG global organization of independent
member firms affiliated with KPMG International Limited a private English company limited by guarantee All rights reserved
The KPMG name and logo are trademarks used under license by the independent member firms of the KPMG global
organization NDP08974-1A
32Cost of manufacturing operations
around the globe
copy 2020 KPMG LLP a Delaware limited liability partnership and a member firm of the KPMG global organization of independent member firms
affiliated with KPMG International Limited a private English company limited by guarantee All rights reserved The KPMG name and logo are
trademarks used under license by the independent member firms of the KPMG global organization NDP08974-1A
We use 23 metrics to develop an overall weight of the country The metrics are further segregated into Primary
and Secondary Costs The Primary Costs consist of five subcategories of costs and the Secondary Costs
consisted of an additional four subcategories (with a varying number of metrics for each category for a total of
18 categories)
The Primary and Secondary Cost Indices are equally weighted at 50 percent each and each subcategory within
these two broad categories was also equally weighted The weighting for each individual factor however varies as
the number of factors consider for each metric variesmdashthus the five Primary Costs have 20 percent weight each
for an overall ranking weight of 10 percent (50 percent20 percent) while the secondary factors have 25 percent
weight each Quality of labor for example has three metrics associated with it with each metric weighted at 42
percent (approximately 50 percent25 percent13) The table below shows the final weights for each metric
Figure 2 Weights by measure category
Table 14 Final weights in overall ranking by metric
Measure Cost type SubcategoryOverall ranking weight
1 Hourly compensation costs Primary 100
2 Real estate costs Primary 100
3 Utility costs Primary 100
4 Corporate tax rates Primary 100
5 Interest rates Primary 100
6 Learning-adjusted years of schooling Secondary Quality of Labor 42
7 Skill set of graduates Secondary Quality of Labor 42
8 Real value added per employee Secondary Quality of Labor 42
9 Days to start business Secondary Ease of Doing Business 42
10 Burden of government regulation Secondary Ease of Doing Business 42
11 Registering property Secondary Ease of Doing Business 42
12 Road quality index Secondary Infrastructure 10
13 Railroad quality Secondary Infrastructure 10
14 Airport connectivity Secondary Infrastructure 10
20
20
20
20
20
PrimaryCost Index
Hourly Compensation Costs
Real Estate Costs
Utility Costs
Corporate Tax Rates
Interest Rates
SecondaryCost Index
Quality of Labor
Ease of Doing Business
Infrastructure
Risk and Protections
25
2525
25
Primary Costs
Secondary Costs
CoDB Index 5050
Table 15 Percentile rankings by metric
Measure Cost type SubcategoryOverall ranking weight
15 Liner shipping connectivity index Secondary Infrastructure 10
16 Electric power losses ( of output) Secondary Infrastructure 14
17 Exposure to unsafe drinking water Secondary Infrastructure 14
18 Reliability of water supply Secondary Infrastructure 14
19 Access to internetWi-fi Secondary Infrastructure 42
20 Political risk Secondary Risk and Protections 31
21 Enforcing contracts Secondary Risk and Protections 31
22 Protecting minority investors Secondary Risk and Protections 31
23 Corruption perception index Secondary Risk and Protections 31
In addition to the weights assigned for each metric the
methodology for developing the index consisted of the
following steps
mdash Performance on each metric is ranked using a
percentile-based methodology The top (or bottom from
an operating cost perspective based on the metric) 15
percent receives the highest rank and the lowest (or
highest) 15 percent receives a rank of 5 Ranks for real
estate costs are shown below as an example Thus the
cheapest or lowest 15 percentile of real estate costs is
rank 1 percentiles between the 15 and 35 percentiles
receive a rank of 2 and so on This is further illustrated
in the table below
mdash The final scores are calculated by applying the
appropriate weights for each metric first at the
subcategory level and combined (using weight
multiplied by the rank) with the Primary and Secondary
Cost scores and ultimately to the overall score
The scores are then ranked for ease of display and
comparison
Real estate costs
Ranking From To
1 000 1499
2 1500 3499
3 3500 6499
4 6500 8499
5 8500 10000
copy 2020 KPMG LLP a Delaware limited liability partnership and the US member firm of the KPMG network of independent member firms
affiliated with KPMG International Cooperative (ldquoKPMG Internationalrdquo) a Swiss entity All rights reserved The KPMG name and logo are
registered trademarks or trademarks of KPMG International NDP089741-1A
34Cost of manufacturing operations
around the globe
Appendix E Real estate data sources in various cities
copy 2020 KPMG LLP a Delaware limited liability partnership and the US member firm of the KPMG network of independent
member firms affiliated with KPMG International Cooperative (ldquoKPMG Internationalrdquo) a Swiss entity All rights reserved
The KPMG name and logo are registered trademarks or trademarks of KPMG International NDP089741-1A
copy 2020 KPMG LLP a Delaware limited liability partnership and a member firm of the KPMG global organization of independent member firms
affiliated with KPMG International Limited a private English company limited by guarantee All rights reserved The KPMG name and logo are
trademarks used under license by the independent member firms of the KPMG global organization NDP08974-1A
Country City Property type Source Link
Brazil Santa Cruz
Campo
Grande
Industrial Cushman amp Wakefield
Industrial Marketbeat
Q2 2019 Brazil
Industrial Report
httpswwwcushmanwakefieldcomen
brazilinsightsbrazil-marketbeats
Brazil Satildeo Paulo Industrial Cushman amp Wakefield
Industrial Marketbeat
Q2 2019 Brazil
Industrial Report
Brazil Rio de
Janeiro
Industrial Cushman amp Wakefield
Industrial Marketbeat
Q2 2019 Brazil
Industrial Report
Canada Calgary Industrial Cushman amp Wakefield
Industrial Marketbeat
Q2 2019 Canada
Industrial Report
httpswwwcushmanwakefieldcomen
canadainsightscanada-marketbeats
Canada Ottawa Industrial Cushman amp Wakefield
Industrial Marketbeat
Q2 2019 Canada
Industrial Report
Canada Toronto Industrial Cushman amp Wakefield
Industrial Marketbeat
Q2 2019 Canada
Industrial Report
China Chengdu Logistics Colliers Quarterly
Logistics Research
Chengdu-Chonqing Q1
2019
httpswwwcollierscom-media
filesmarketresearchapacchina
southwestchina-researchwestchina-
logistics-q1-2019-enpdfla=en-GB
China Beijing Logistics Colliers Quarterly
Industrial Beijing-
Tianjin-Langeang Q1
2018
httpswwwcollierscom-mediafiles
marketresearchapacchinanorthchina-
researchbj-tj-lf-industrial-q1-2018
pdfla=en-GB
China Tianjin Logistics Colliers Quarterly
Industrial Beijing-
Tianjin-Langeang Q1
2018
France Paris Industrial and
Logistics
Cushman amp Wakefield
Industrial Market
Snapshot Q2 2019
France
httpswwwcushmanwakefieldcomen
franceinsightsfrance-marketbeat
France Lyon Industrial and
Logistics
Cushman amp Wakefield
Industrial Market
Snapshot Q2 2019
France
36Cost of manufacturing operations
around the globe
copy 2020 KPMG LLP a Delaware limited liability partnership and a member firm of the KPMG global organization of independent member firms
affiliated with KPMG International Limited a private English company limited by guarantee All rights reserved The KPMG name and logo are
trademarks used under license by the independent member firms of the KPMG global organization NDP08974-1A
Country City Property type Source Link
France Marseille Industrial and
Logistics
Cushman amp Wakefield
Industrial Market
Snapshot Q2 2019
France
httpswwwcushmanwakefieldcomen
franceinsightsfrance-marketbeat
France Bordeaux Industrial and
Logistics
Cushman amp Wakefield
Industrial Market
Snapshot Q2 2019
France
France Strasbourg Industrial and
Logistics
Cushman amp Wakefield
Industrial Market
Snapshot Q2 2019
France
France Lille Industrial and
Logistics
Cushman amp Wakefield
Industrial Market
Snapshot Q2 2019
France
France Toulouse Industrial and
Logistics
Cushman amp Wakefield
Industrial Market
Snapshot Q2 2019
France
Germany Berlin Industrial and
Logistics
Colliers Industrial and
Logistics Markets
Overview Germany
20182019
httpswwwcolliersdewp-
contentuploads201906
ColliersResearchMarket-Report-
IL20182019englpdf
Germany Dusseldorf Industrial and
Logistics
Colliers Industrial and
Logistics Markets
Overview Germany
20182019
Germany Frankfurt Industrial and
Logistics
Colliers Industrial and
Logistics Markets
Overview Germany
20182019
Germany Hamburg Industrial and
Logistics
Colliers Industrial and
Logistics Markets
Overview Germany
20182019
Germany Cologne Industrial and
Logistics
Colliers Industrial and
Logistics Markets
Overview Germany
20182019
Germany Leipzig Industrial and
Logistics
Colliers Industrial and
Logistics Markets
Overview Germany
20182019
copy 2020 KPMG LLP a Delaware limited liability partnership and a member firm of the KPMG global organization of independent member firms
affiliated with KPMG International Limited a private English company limited by guarantee All rights reserved The KPMG name and logo are
trademarks used under license by the independent member firms of the KPMG global organization NDP08974-1A
Country City Property type Source Link
Germany Munich Industrial and
Logistics
Colliers Industrial and
Logistics Markets
Overview Germany
20182019
httpswwwcolliersdewp-
contentuploads201906
ColliersResearchMarket-Report-
IL20182019englpdf
Germany Stuttgart Industrial and
Logistics
Colliers Industrial and
Logistics Markets
Overview Germany
20182019
India Delhi Industrial Cushman amp Wakefield
Industrial Marketbeat
Q4 2018 Delhi
Industrial Report
httpswwwcushmanwakefieldcomen
indiainsightsdelhi-ncr-marketbeat
India Mumbai Industrial Cushman amp Wakefield
Industrial Marketbeat
Q4 2018 Mumbai
Industrial Report
httpswwwcushmanwakefieldcomen
indiainsightsmumbai-marketbeat
Ireland Dublin Logistics Cushman amp Wakefield
Industrial Marketbeat
Q1 2019 Ireland
Industrial Report
httpswwwcushmanwakefieldcomen
irelandinsightsireland-marketbeat
Ireland Cork Logistics Cushman amp Wakefield
Industrial Marketbeat
Q1 2019 Ireland
Industrial Report
Ireland Galway Logistics Cushman amp Wakefield
Industrial Marketbeat
Q1 2019 Ireland
Industrial Report
Italy Rome Logistics CBRE Italy Logistics
MarketView Q4 2019
httpswwwcbredeenresearchItaly-
Logistics-MarketView-Q4-2019
Italy Milan Logistics CBRE Italy Logistics
MarketView Q4 2019
Italy Bologna Logistics CBRE Italy Logistics
MarketView Q4 2019
Japan Osaka Logistics CBRE Japan Real
Estate Market Outlook
2019
httpswwwcbrecomresearch-and-
reportsJapan-Real-Estate-Market-
Outlook-2019
Japan Nagoya Logistics CBRE Japan Real
Estate Market Outlook
2019
38Cost of manufacturing operations
around the globe
copy 2020 KPMG LLP a Delaware limited liability partnership and a member firm of the KPMG global organization of independent member firms
affiliated with KPMG International Limited a private English company limited by guarantee All rights reserved The KPMG name and logo are
trademarks used under license by the independent member firms of the KPMG global organization NDP08974-1A
Country City Property type Source Link
Malaysia Klang Valley Industrial CBRE Malaysia Real
Estate Market Outlook
2019
httpswwwcbrecomreport-
downloadPUBID=44c7f5c6-5dbe-4a76-
a335-ff80e9c57a79
Malaysia Penang Industrial CBRE Malaysia Real
Estate Market Outlook
2019
Malaysia Iskandar
Malaysia
Industrial CBRE Malaysia Real
Estate Market Outlook
2019
Malaysia Kuching Industrial CBRE Malaysia Real
Estate Market Outlook
2019
Mexico Mexico Industrial CBRE Mexico Industrial
Market Outlook Q2 2019
httpswwwcbrecommxenresearch-
and-reports
South Korea Greater
Seoul
Logistics DWS Market Outlook
2018
httpswwwdwscomglobalassets
institutionalresearchpdfsDWS_South_
Korea_Real_Estate_Market_Outlook_
April_2018pdf
Switzerland Industrial UBS Real Estate Focus
2019
httpsfiabciorguploadsswiss-real-
estate-focus-2019-enpdf
Taiwan Neihu
District
Taipei
Industrial Colliers Radar
Industrial Taiwan
August 2019
httpswwwcollierscom-media
filesapactaiwanother20
reports2019radarreport-enpdfla=en-
GBTaiwan Nangang
Taipei
Industrial Colliers Radar
Industrial Taiwan
August 2019
Taiwan Xizhi New
Taipei City
Industrial Colliers Radar
Industrial Taiwan
August 2019
Taiwan Jhonghe
New Taipei
City
Industrial Colliers Radar
Industrial Taiwan
August 2019
Taiwan Xindien New
Taipei City
Industrial Colliers Radar
Industrial Taiwan
August 2019
Taiwan Sanchong
New Taipei
City
Industrial Colliers Radar
Industrial Taiwan
August 2019
Taiwan Xinchuang
New Taipei
City
Industrial Colliers Radar
Industrial Taiwan
August 2019
Taiwan Tucheng
New Taipei
City
Industrial Colliers Radar
Industrial Taiwan
August 2019
copy 2020 KPMG LLP a Delaware limited liability partnership and a member firm of the KPMG global organization of independent member firms
affiliated with KPMG International Limited a private English company limited by guarantee All rights reserved The KPMG name and logo are
trademarks used under license by the independent member firms of the KPMG global organization NDP08974-1A
Country City Property type Source Link
United
Kingdom
London
(Heathrow)
Logistics Cushman amp Wakefield
Industrial Market
Snapshot Q2 2019 UK
httpswwwcushmanwakefieldcomen
united-kingdominsightsuk-marketbeat
United
Kingdom
Manchester Logistics Cushman amp Wakefield
Industrial Market
Snapshot Q2 2019 UK
United
Kingdom
Birmingham Logistics Cushman amp Wakefield
Industrial Market
Snapshot Q2 2019 UK
United
States
Boston Industrial Cushman amp Wakefield
US Industrial
Marketbeat Q2 2019
httpswwwcushmanwakefieldcomen
united-statesinsightsus-marketbeats
us-industrial-marketbeat
United
States
Omaha Industrial Cushman amp Wakefield
US Industrial
Marketbeat Q2 2019
United
States
Detroit Industrial Cushman amp Wakefield
US Industrial
Marketbeat Q2 2019
Vietnam Ho Chi Minh
City
Industrial CBRE Vietnam
Marketview Q2 2018
httpwwwcbrevietnam
comuseful=cbre-vietnam-
marketview-q2-2018Vietnam Long An Industrial CBRE Vietnam
Marketview Q2 2018
Vietnam Dong Nai Industrial CBRE Vietnam
Marketview Q2 2018
Vietnam Binh Duong Industrial CBRE Vietnam
Marketview Q2 2018
Vietnam Hanoi Industrial Colliers Vietnam Real
Estate Quarterly
Knowledge Report Q1
2019
httpswwwcollierscom-mediafiles
apacvietnampdfvietnam-quarterly-
knowledge-report-q1-2019-en-1
pdfla=en-GB
40Cost of manufacturing operations
around the globe
copy 2020 KPMG LLP a Delaware limited liability partnership and the US member firm of the KPMG network of independent
member firms affiliated with KPMG International Cooperative (ldquoKPMG Internationalrdquo) a Swiss entity All rights reserved
The KPMG name and logo are registered trademarks or trademarks of KPMG International NDP089741-1A
copy 2020 KPMG LLP a Delaware limited liability partnership and a member firm of the KPMG global organization of independent member firms
affiliated with KPMG International Limited a private English company limited by guarantee All rights reserved The KPMG name and logo are
trademarks used under license by the independent member firms of the KPMG global organization NDP08974-1A
Cost of manufacturing operations
around the globe
Contact usErkan ErdemPrincipalKPMG ndash National Tax Industry Leader for Public Sector and Economic and Statistical ConsultingT 703-286-8188
E erkanerdemkpmgcom
Oommen ThomasManaging DirectorKPMG ndash Economic and Statistical ConsultingT 415-963-8125
E oommenthomaskpmgcom
Talha MuhammadManagerKPMG ndash Economic and Statistical ConsultingT 212-909-5401
E talhamuhammadkpmgcom
Brian HecklerPartnerKPMG ndash National Sector Leader for Industrial ManufacturingT 312-665-2693
E bhecklerkpmgcom
Ulrich Schmidt Principal KPMG - Global Location amp Expansion Services T 267-256-2786 E ulrichschmidtkpmgcom
Carolyn LeeExecutive DirectorThe Manufacturing InstituteT 202-637-3079
E cleenamorg
The following information is not intended to be ldquowritten advice concerning one or more Federal tax mattersrdquo subject to the requirements of section 1037(a)(2)
of Treasury Department Circular 230
The information contained herein is of a general nature and based on authorities that are subject to change Applicability of the information to specific situations
should be determined through consultation with your tax adviser
copy 2020 KPMG LLP a Delaware limited liability partnership and a member firm of the KPMG global organization of independent member firms affiliated with
KPMG International Limited a private English company limited by guarantee All rights reserved The KPMG name and logo are trademarks used under license
by the independent member firms of the KPMG global organization NDP08974-1A
kpmgcomsocialmedia
The authors gratefully acknowledge excellent research assistance provided by Andrew Bent and
Kristina Kohl Tableau visualizations created by Konul Riegel and technical support provided by Ian Flick
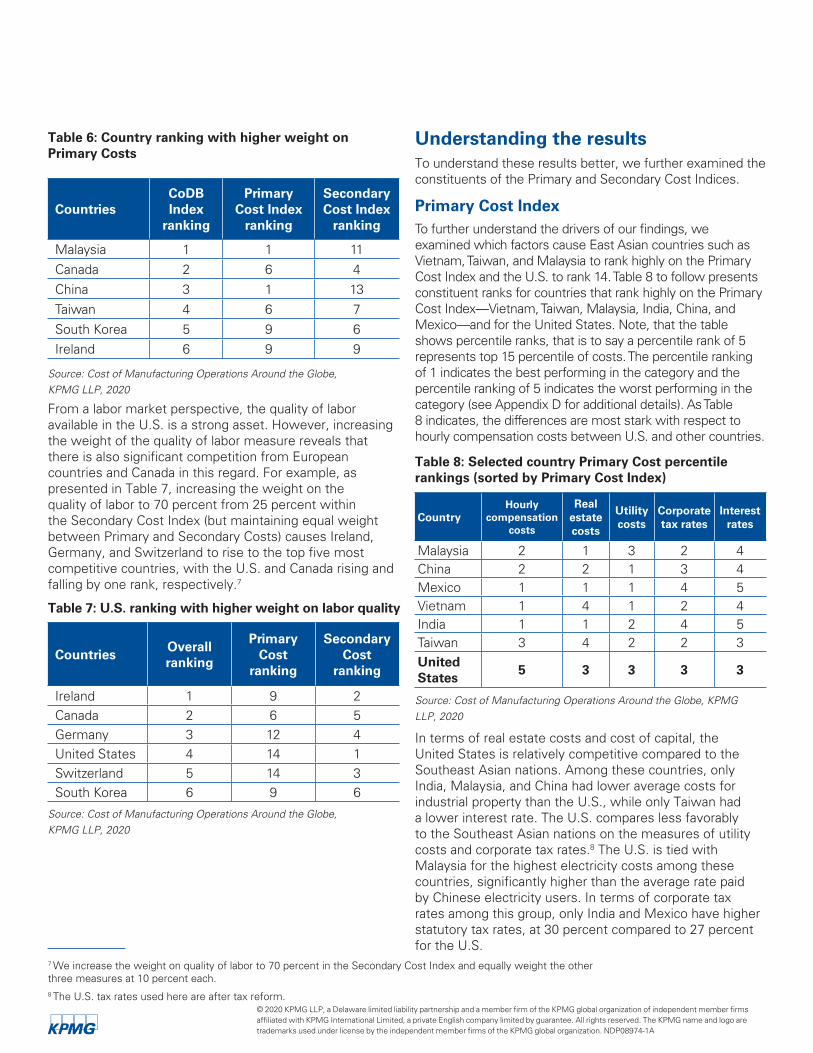
copy 2020 KPMG LLP a Delaware limited liability partnership and a member firm of the KPMG global organization of independent member firms
affiliated with KPMG International Limited a private English company limited by guarantee All rights reserved The KPMG name and logo are
trademarks used under license by the independent member firms of the KPMG global organization NDP08974-1A
ConclusionsOur results indicate that countries that placed better on
the Secondary Cost Index generally performed better on
the overall rankings Of the top five most competitive
economies on the overall rankings only twomdashMalaysia and
Taiwanmdashhave a better primary than secondary cost score
In keeping with this trend of lower Secondary Cost
countries scoring better on the CoDB Index the United
States placed fifth on the CoDB Index despite being tied
with Switzerland for 14th on the Primary Cost Index This
high Primary Cost Index ranking was primarily due to high
labor costs The United States was able to compensate
somewhat for these unfavorable scores on the Primary
Cost Index by placing first in the Secondary Cost Index
As part of this analysis we also examined if tax reform had
a material impact on the relative standing of the US In
particular we compared how the US ranks now (post-tax-
reform combined federal and local tax rate of 27 percent)
relative to the pre-reform with a corporate tax rate of 40
percent (combined federal and state average) The impact
on the USrsquos CoDB Index ranking is quite significant After
tax reform the USrsquos competitiveness increasedmdashas
evidenced by its current rank of 5mdashcompared with its
previous rank of 11 under pre-reform tax rates
A closer look at the countries that outperformed the US
on the CoDB Index ranking indicates some interesting
factors For example the US outperformed all of the
countries on the Secondary Cost Index due to better labor
productivity and business conditions This implies that the
outperformance on the CoDB Index by Canada Taiwan
South Korea and Malaysia are all driven by Primary Cost
factors Specifically Canadarsquos rank is driven primarily by
its ability to offer lower compensation costs and slightly
lower electricity rates while still maintaining Secondary
Cost Index rankings that were not far behind the US
South Korea ranked third by offsetting weaker ranking on
the Secondary Cost Index with even lower compensation
costs A sharper version of the tradeoff between Primary
and Secondary Cost explains the rankings of Taiwan and
Malaysia with Taiwan offering higher primary costs but
lower secondary costs
This study has focused on certain CoDB factors that are
commonly considered in manufacturing facility location
decisionsmdashat the country levelmdashand the results provide a
high-level perspective on the attributes of various countries
with respect to these factors However the location
decision is specific to each company and its consideration
of the supply chain and access to markets The decision
may be impacted by the type of industry the company is
active in the type of product where customers are and
the companyrsquos overall business strategy Thus individual
location decisions are significantly more complex than we
can address in an analysis such as this
For instance for heavy equipment manufacturing from a
transportation point of view it may be better to locate the
facility closer to suppliers and the market whereas from a
production standpoint it may be more desirable to locate
the facility closer to where the desired type of workforce
or raw materials might be available Alternatively for a
specialized precision products manufacturing operation
the firmrsquos decision may be heavily impacted by the
availability of labor with advanced manufacturing skills In
other instances tax and operating incentives offered by a
country may be significant enough to outweigh weakness
on other dimensions As such the location decision is
often guided by unique factors that may go well beyond
those we have considered
Additionally even within the factors we have considered
the relative importance of these factors to a specific firm
may be different than the weights we have considered
Furthermore it may well be the case that the factors we
classify for the purpose of convenience as secondary
are in fact primary factors for consideration in a location
decision for an individual firm or manufacturing sector
Finally a number of local factors that go into firm location
decisions may or may not be captured in the country-
level analysis For example labor and rent costs are
higher in urban areas relative to more distant suburban
or rural areas Recognizing this we have developed a
Tableau analytic and visualization tool in conjunction with
this study that allows the interested reader to alter the
weights and to reassess the score based on the relative
importance of these factors to them Click here for the
Cost of Manufacturing Operations Tool We also note for
copy 2020 KPMG LLP a Delaware limited liability partnership and the US member firm of the KPMG network of independent
member firms affiliated with KPMG International Cooperative (ldquoKPMG Internationalrdquo) a Swiss entity All rights reserved The
KPMG name and logo are registered trademarks or trademarks of KPMG International NDP089741-1A
the reader that the Primary Cost factors
are measured in US dollars Since we
have compared costs on a US dollar
denominated basis our results are impacted
by the relative strength of the various
currencies relative to the dollar As the
foreign exchange rates fluctuate as they
inevitably will the cost measurements we
have relied on would vary and possibly
impact the ranking of individual cost
components even if local currency costs do
not change
Finally we note that the rankings are based
on the best historical information available
Such data is mostly available only with a lag
and therefore the impact of recent trade
disputes or the market disruptions from
COVID-19 are not reflected in the results
copy 2020 KPMG LLP a Delaware limited liability partnership and the US member firm of the KPMG network of independent
member firms affiliated with KPMG International Cooperative (ldquoKPMG Internationalrdquo) a Swiss entity All rights reserved
The KPMG name and logo are registered trademarks or trademarks of KPMG International NDP089741-1A
16Cost of manufacturing operations
around the globe
Appendix A Data sources
copy 2020 KPMG LLP a Delaware limited liability partnership and the US member firm of the KPMG network of independent
member firms affiliated with KPMG International Cooperative (ldquoKPMG Internationalrdquo) a Swiss entity All rights reserved
The KPMG name and logo are registered trademarks or trademarks of KPMG International NDP089741-1A
copy 2020 KPMG LLP a Delaware limited liability partnership and a member firm of the KPMG global organization of independent member firms
affiliated with KPMG International Limited a private English company limited by guarantee All rights reserved The KPMG name and logo are
trademarks used under license by the independent member firms of the KPMG global organization NDP08974-1A
As discussed previously we relied on a variety of sources
to gather data on 23 metrics that spanned Primary and
Secondary Cost factors
Primary Cost Index
The Conference Board is a well-known source of data for
economists While researching international labor costs
we noted two indicators related to the manufacturing
industry that we deemed useful for our study The first
is hourly compensation costs which is a sum of hourly
pay for time worked hourly direct benefits and hourly
social insurance expenditures and labor-related taxes
The Conference Board did not have this information for
Malaysia and Vietnam so we substituted the Economist
Intelligence Unitrsquos labor cost per hour (pay and nonpay
costs) figures for these two countries
Real estate cost data that is leasing cost per square foot
was compiled from a mix of sources We collected data
from real estate advisory firms and asset managers such
as Cushman amp Wakefield Colliers International CBRE
Group Deutsche Bank DWS and UBS
Utility costs measure the average price per kilowatt hour
of electricity paid by all businesses and households in each
country excluding taxes and tariffs These prices were
retrieved from each countryrsquos respective energy regulatory
agency website
Corporate tax rates were available through internal KPMG
sources The tax rates cited in this study reflect combined
statutory federal and provincial tax rates only and do not
account for specific tax incentives International Financial
Statistics provided interest rates for Brazil Canada China
India Malaysia Mexico South Korea Switzerland the
United States and Vietnam
Interest rate data for all economies except the Euro
area countries the United Kingdom Japan and Taiwan
were obtained from the International Monetary Fundrsquos
International Financial Statistics database Interest rates for
Taiwan were retrieved from the Taiwanese central bank
while rates for the remaining economies were retrieved
from the US Federal Reserve Economic Data (FRED)
database Interest rates obtained from the IMF reflect the
monetary policy-related interest rate while interest rates
obtained from all other sources measure the discount rate
Secondary Cost measures
Quality of labor
Outside of the Doing Business report the World Bank
Group provided two additional measures for our study
learning-adjusted years of schooling and access to
internetWi-Fi
Learning-adjusted years of schooling used in the quality
of labor aggregation gives us insight into how advanced
a workerrsquos skill set might be in different countries It is
calculated by multiplying the expected years of school by
the ratio of the most recent harmonized test score and to
advancement attainment on the Trends in International
Mathematics and Science Study (TIMSS) test (The World
Bank Group)11
The Global Competitiveness Index published by the
World Economic Forum included an assessment of the
skill set of graduates (secondary and university graduates)
from each country as captured by the WEFrsquos Executive
Opinion Survey It is included in the ldquoaccess to advanced
educationrdquo category Including this measure while
similar to the learning-adjusted years of schooling takes
into account how executives perceive the quality of the
labor force and allows us to consider the perspective of a
company operating in one of these countries
Real value added per employee is a crucial metric for
companies as it has a direct impact on profits It measures
how much value each additional employee is adding to
the industry For example real value added can increase
if new employees are bringing advanced skill sets into
the workforce We used total real value added from the
Conference Board as well as the total number of people
employed to calculate real value added per employee
The Conference Board did not have this information on
Malaysia and Vietnam so we found comparable variables
for real value added per employee from Malaysia and
Vietnam from separate sources
Ease of doing business
The World Bank Group annually publishes a report titled
Doing Business which ranks 190 countries based on
their ease of doing business This research involves
very detailed quantitative indicators and a few were
particularly valuable to our study We focused on the 2019
report observing the number of days to start a business
registering property enforcing contracts and protecting
minority investors indicators As noted by The World Bank
Group the number of days to start a business measures
how many days it takes for a ldquosmall- to medium-size
limited liability company to start up and formally operate
in each economyrsquos largest business cityrdquo This is the
only variable from the Doing Business report where we
did not look at the overall score for the category (starting
a business) we only observed the number of days For
the remaining three indicators we used the scores The
registering property score is based on ldquothe steps time
and cost involved in registering a property assuming
a standardized case of an entrepreneur who wants to
18Cost of manufacturing operations
around the globe
copy 2020 KPMG LLP a Delaware limited liability partnership and a member firm of the KPMG global organization of independent member firms
affiliated with KPMG International Limited a private English company limited by guarantee All rights reserved The KPMG name and logo are
trademarks used under license by the independent member firms of the KPMG global organization NDP08974-1A
purchase land and a building that is already registered
and free of title dispute In addition the score includes
the quality of the land administration system in each
economy The quality of land administration index has five
dimensions reliability of infrastructure transparency of
information geographic coverage land dispute resolution
and equal access to property rightsrdquo (The World Bank
Group) Number of days to start a business and registering
property along with burden of government regulation
were used in our ease of doing business aggregation
Burden of government regulation is another Executive
Opinion Survey question from the Global Competitiveness
Index It is a response to the survey question ldquoIn your
country how burdensome is it for companies to comply
with public administrationrsquos requirements (eg permits
regulations reporting)rdquo Respondents can choose
a number on a scale of 1 to 7 1 being ldquoextremely
burdensomerdquo and 7 being ldquonot burdensome at allrdquo
Infrastructure
The World Economic Forumrsquos (WEF) Global Competitiveness
Index (2018 Report) contains very useful indicators relating to
starting a business Based on the values or survey responses
for each variable each country is assigned a score from 1 to
100 (100 being the best) It is important to note that we used
these scores for our study not the direct values or survey
responses
The Global Competitiveness Index provides useful information
regarding a countryrsquos infrastructure We specifically look at
transportation infrastructure and utility infrastructure In this
report transportation infrastructure is addressed with eight
variables mdashfour are sourced from WEFrsquos Executive Opinion
Survey and four are based on statistics that they compiled
from external sources
Of these variables we used the survey-based figures to
measure road quality and railroad quality while we used the
external index figures from the International Air Transport
Association (IATA) and United Nations Conference on Trade
and Development to measure airport connectivity and liner
shipping connectivity respectively Index values were not
used for the road and railroad figures due to inconsistencies
with the WEF data when we attempted to reproduce the
WEFrsquos calculations for these measures
The road quality survey results capture the response to
the survey question ldquoIn your country what is the quality
(extensiveness and condition) of road infrastructure [1 =
extremely poor among the worst in the world 7 = extremely
good among the best in the world]rdquo Similarly railroad
quality captures the average response to the question ldquoIn
your country how efficient (ie frequency punctuality
speed price) are train transport services [1 = extremely
inefficient among the worst in the world 7 = extremely
efficient among the best in the world]rdquo Airport connectivity
represents ldquothe IATA airport connectivity indicator which
measures the degree of integration of a country within the
global air transport networkrdquo The Liner shipping connectivity
index ldquoassesses a countryrsquos connectivity to global shipping
networksrdquo and is based on ldquofive components of the maritime
transport sector the number of ships their container-carrying
capacity the maximum vessel size the number of services
and the number of companies that deploy container ships in a
countryrsquos portsrdquo (World Economic Forum)
For utility infrastructure we gathered electric power losses
exposure to unsafe drinking water and reliability of water
supply from the Global Competitiveness Index Electric power
losses which measures a countryrsquos electricity quality and
exposure to unsafe drinking water which takes into account
ldquothe extent of exposure by risk level and the severity of that
riskrsquos contribution to disease burdenrdquo are both based on
statistics that were compiled from external sources Reliability
of water supply is taken from the WEFrsquos Executive Opinion
Survey and answers the question ldquoIn your country how
reliable is the water supply (lack of interruptions and flow
fluctuations)rdquo Respondents can choose a number on a
scale of 1 to 7 1 being ldquoextremely unreliablerdquo and 7 being
ldquoextremely reliablerdquo As mentioned earlier the World Bank
Group provides us with our indicator access to internetWi-
Fi which is part of the overall infrastructure aggregation It
measures the percentage of the population that is using the
internet
Risk and protections
Our political risk data was sourced from the insurance
company Credendorsquos ldquoCountry Risks Synthetizing Chartrdquo
Countries are classified into seven categories (from 1 to 7)
reflecting the intensity of risks arising as a result of political
and assimilated events Category 1 includes those countries
for which the risk is considered the lowest and category 7
contains those countries with the highest likelihood of risks
being caused by political and assimilated events In our study
we chose to focus on political risk over medium- and long-
term periods
Enforcing contracts and protecting minority investors along
with political risk and the corruption perception index were
included in our risk and protections aggregation According
to the World Bank Group the enforcing contracts score
ldquomeasures the time and cost for resolving a commercial
dispute through a local first-instance court and the quality of
copy 2020 KPMG LLP a Delaware limited liability partnership and a member firm of the KPMG global organization of independent member firms
affiliated with KPMG International Limited a private English company limited by guarantee All rights reserved The KPMG name and logo are
trademarks used under license by the independent member firms of the KPMG global organization NDP08974-1A
Measure Country Source Source detail Year Link
Hourly Compensation Costs
All (except Malaysia and Vietnam)
The Conference Board
International Comparisons of Hourly Compensation Costs in Manufacturing
2016 httpwwwconference-boardorgilcprogramindexcfmid=38269
Hourly Compensation Costs
Malaysia and Vietnam
The Economist Intelligence Unit General Statistics Office of Vietnam and Department of Statistics Malaysia
Estimated Labor Cost per Hour Manufacturing
2016 Both httpdataeiucomEI UTableViewaspx initial=trueamppub type_id=1253181310
Vietnam
httpswwwgsogov vndefault_enaspx tabid=783
Malaysia
httpsnewssstatisticsgovmynewss-portalx epepDownloadContent SearchseamcontentId =54516ampactionMethod =ep2FepDownload ContentSearchxhtml 3AcontentActiondo DisplayContentampcid= 12789
Real Estate Costs
See Appendix E
Utility Costs China China Electricity Council
Analysis of National Electricity Market Transaction Information in the Fourth Quarter of 2018
2018 Adjusted to 2015 USD
httpwwwcecorgcnguihuayutongjidianligaige2019-03 -04189190html
Primary Cost measures ndash References
judicial processes index evaluating whether each economy
has adopted a series of good practices that promote
quality and efficiency in the court systemrdquo Protecting
minority investors focuses on ldquothe strength of minority
shareholder protections against misuse of corporate assets
by directors for their personal gain as well as shareholder
rights governance safeguards and corporate transparency
requirements that reduce the risk of abuserdquo (The World
Bank Group)
The WEFrsquos Global Competitiveness Index provided scores
for each country based on the Corruption Perception Index
2016 results This index measures ldquoperceptions of corruption
in the public sectorrdquo and is scaled from 0 (highly corrupt) to
100 (very clean) According to Transparency International
who created the index ldquoThe global average score is a
paltry 43 indicating endemic corruption in a countryrsquos public
sector Top-scoring countries are far outnumbered by [low-
scoring] countries where citizens face the tangible impact of
corruption on a daily basisrdquo
Specific data sources used and linked references are provided
below
20Cost of manufacturing operations
around the globe
copy 2020 KPMG LLP a Delaware limited liability partnership and a member firm of the KPMG global organization of independent member firms
affiliated with KPMG International Limited a private English company limited by guarantee All rights reserved The KPMG name and logo are
trademarks used under license by the independent member firms of the KPMG global organization NDP08974-1A
Measure Country Source Source detail Year Link
Utility Costs France Germany Ireland Italy and United Kingdom
Eurostat Electricity prices for nonhousehold consumers ndash biannual data
2015 httpappssoeurostateceuropaeunuishowdodataset=nrg_pc_205amplang=en
Utility Costs Canada Government of Canada ndash Canada Energy Regulator
Market Snapshot Explaining the high cost of power in northern Canada February 16 2017
2016 Adjusted to 2015 USD
The Canada Energy Regulator 2017 Reproduced with the permission of Public Works and Government Services 2020
Utility Costs Brazil Governo do Brasil
Anuaacuterio Estatiacutestico de Energia Eleacutetrica 2016
2015 httppateducacaobagovbrconteudosconteudos-digitaisdownload8667pdf
Utility Costs South Korea Korea Energy Statistical Information System
Average revenues per kWh sold by segments
2015 httpwwwkesisnetsubsubChartEngjspreport_id=34110ampreport Type=0
Utility Costs Malaysia Malaysia Energy Data and Research
Malaysia Energy Statistics Handbook 2018
2015 httpsmeihstgovmydocuments10620c7e69704-6f80-40ae-a764-ad0acf4a844d
Utility Costs India Power Finance Corporation Ltd (A Govt of India Undertaking)
The Performance of State Power Utilities for the years 2013ndash14 to 2015ndash16
2015 httpswwwpfcindiacomDocumentRepositoryckfinderfilesOperationsPerformance_Reports_of_State_Power_Utilities1_Report on the Performance of State Power Utilities 2013-14 to 2015-16pdf
Utility Costs Switzerland Swiss Office of Energy
Switzerland Utility Costs 2015 httpswwwbfeadminchbfedehomehtml
Utility Costs Taiwan Taiwan Bureau of Energy
Energy Statistical Annual Reports
2015 httpswwwmoeaboegovtwECWenglishcontentContentLinkaspxmenu_id=1540
Utility Costs Japan US Energy Information Administration ndash Independent Statistics and Analysis
Japanrsquos electricity prices rising or stable despite recent fuel cost changes
2015 httpswwweiagovtodayinenergydetailphpid=27872
copy 2020 KPMG LLP a Delaware limited liability partnership and a member firm of the KPMG global organization of independent member firms
affiliated with KPMG International Limited a private English company limited by guarantee All rights reserved The KPMG name and logo are
trademarks used under license by the independent member firms of the KPMG global organization NDP08974-1A
Measure Country Source Source detail Year Link
Utility Costs United States US Energy Information Administration ndash Independent Statistics and Analysis
Average retail price of electricity United States annual
2015 httpswwweiagov
electricitydatabrowser
topic7agg=01ampgeo=
gampendsec=vgamplinechart
=ELECPRICEUS-ALL
A~ELECPRICEUS-RES
A~ELECPRICEUS-COM
A~ELECPRICEUS-IND
Aampcolumnchart=ELEC
PRICE
US-ALLA~ELECPRICE
US-RESA~ELECPRICE
US-COMA~ELECPRICE
US-INDAampmap=ELEC
PRICEUS-ALLAampfreq=
Aampctype=linechartlt=rdquordquo
div=rdquordquo style=rdquobox-sizing
border-boxrdquogt
Utility Costs Mexico US Energy Information Administration ndash Independent Statistics and Analysis
Mexico electricity market reforms attempt to reduce costs and develop new capacity
2015 httpswwweiagovtodayinenergydetailphpid=26932
Utility Costs Vietnam Vietnam Electricity ndash EVN
Vietnam Electricity Annual Report 2016
2015 httpsenevncomvnuserfileUserhuongbttfiles20177AnnualReport2016pdf
Corporate Tax Rates
All KPMG Corporate tax rates table 2019 httpshomekpmgxxenhomeservicestaxtax-tools-and-resourcestax-rates-onlinecorporate-tax-rates-tablehtml
Interest Rates Euro Area India and Japan
Federal Reserve Economic Data (FRED)
Discount Rates (Euro Area India and Japan)
2018 httpsfredstlouisfedorg
Interest Rates Taiwan Central Bank of the Republic of China
Discount Rate (Taiwan) 2018 httpswwwcbcgovtwenlp-695-2html
Interest Rates United Kingdom Bank of England Discount Rate (UK) 2018 httpswwwbankofenglandcoukmonetary-policythe-interest-rate-bank-rate
Interest Rates All (except Euro Area the UK India Japan and Taiwan)
International Financial Statistics
Interest Rates and Monetary Policy-Related Interest Rate percent per annum
2018 httpsdataimforg sk=388DFA60-1D26- 4ADE-B505-A05A55 8D9A42amp sId=1479331931186
22Cost of manufacturing operations
around the globe
copy 2020 KPMG LLP a Delaware limited liability partnership and a member firm of the KPMG global organization of independent member firms
affiliated with KPMG International Limited a private English company limited by guarantee All rights reserved The KPMG name and logo are
trademarks used under license by the independent member firms of the KPMG global organization NDP08974-1A
Secondary Cost measures
Measure Country Source Source detail Years Link
Learning-
Adjusted Years
of Schooling
All The World Bank Learning-Adjusted
Years of Schooling
2017 httpstcdata360
worldbankorg
indicatorsh00280750
country=BRA
ampindicator
=40964ampviz=bar_
chartampyears=2017
Skill set of
Graduates
All (except China) World Economic
Forum
Global
Competitiveness
Index 2019
Weighted
Average 2018ndash
2019
httpstcdata360
worldbankorg
indicators
h00280750
country=
BRAampindicator=
40964ampviz=
bar_chartampyears=2017
httpreports
weforumorg
global-
competitiveness-
report-2018
China Weighted Average
2016ndash2017
RVA per
Employee
All The Conference
Board
International
Comparisons of
Manufacturing
Productivity and
Unit Labor Costs
2017 httpswww
conference-board
orgilcprogram
indexcfmid=42672
Number of
Days to Start a
Business
All The World Bank Doing Business
2019
2019 httpswww
doingbusinessorg
endata
Burden of
Government
Regulation
All (except China) World Economic
Forum
Global
Competitiveness
Index 2019
Weighted
Average of
2018ndash2019
httpreports
weforumorgglobal-
competitiveness-
report-2019China Weighted
Average of
2016ndash2017
Registering
Property
All The World Bank Doing Business
2019
2019 httpswww
doingbusinessorg
endata
Road Quality All (except China) World Economic
Forum
Global
Competitiveness
Index 2019
Weighted
Average of
2018ndash2019
httpreports
weforumorgglobal-
competitiveness-
report-2019China Weighted
Average of
2016ndash2017
copy 2020 KPMG LLP a Delaware limited liability partnership and a member firm of the KPMG global organization of independent member firms
affiliated with KPMG International Limited a private English company limited by guarantee All rights reserved The KPMG name and logo are
trademarks used under license by the independent member firms of the KPMG global organization NDP08974-1A
Measure Country Source Source detail Years Link
Railroad Quality All (except China) World Economic
Forum
Global
Competitiveness
Index 2019
Weighted
Average of
2018ndash2019
httpreports
weforumorgglobal-
competitiveness-
report-2019China Weighted
Average of
2016ndash2017
Airport
Connectivity
All World Economic
Forum
Global
Competitiveness
Index 2019
2018 httpreports
weforumorgglobal-
competitiveness-
report-2019
Liner Shipping
Connectivity
Index
AllWorld Economic
Forum
Global
Competitiveness
Index 2018
2018
httpreports
weforumorgglobal-
competitiveness-
report-2018
Electric Power
LossesAll
World Economic
Forum
Global
Competitiveness
Index 2018
2016
httpreports
weforumorgglobal-
competitiveness-
report-2018
Exposure to
Unsafe Drinking
Water
AllWorld Economic
Forum
Global
Competitiveness
Index 2018
2017
httpreports
weforumorgglobal-
competitiveness-
report-2018
Reliability of
Water Supply
All (except China)
World Economic
Forum
Global
Competitiveness
Index 2018
Weighted
Average
2018ndash2019httpreports
weforumorgglobal-
competitiveness-
report-2018China
Weighted
Average
2016ndash2017
Access to
InternetWi-Fi
France Germany
Ireland Italy
Malaysia
Mexico South
Korea UK
Vietnam Taiwan The World Bank
Individuals using
the Internet ( of
population)
2018 httpsdata
worldbank
orgindicator
ITNETUSER
ZSview=mapBrazil Canada
China India
Japan
Switzerland US
2017
Political Risk All CredendoCountry Risk and
Insights2019
24Cost of manufacturing operations
around the globe
copy 2020 KPMG LLP a Delaware limited liability partnership and a member firm of the KPMG global organization of independent member firms
affiliated with KPMG International Limited a private English company limited by guarantee All rights reserved The KPMG name and logo are
trademarks used under license by the independent member firms of the KPMG global organization NDP08974-1A
Measure Country Source Source detail Years Link
Corruption
Perception
Index
AllWorld Economic
Forum
Global
Competitiveness
Index 2018
2018
httpreports
weforumorgglobal-
competitiveness-
report-2018
Protecting
Minority
Investors
All The World BankDoing Business
20192019
httpswww
doingbusinessorg
endata
Enforcing
ContractsAll The World Bank
Doing Business
20192019
httpswww
doingbusinessorg
endata
Measure Country Source Source detail Years Link
Manufacturing
Value Added
All except Taiwan World Bank World Bank National
Accounts Data
2016 httpsdata
worldbankorg
indicatorNVIND
MANFCD
Manufacturing
Value Added
Taiwan The Conference
Board
International
Comparisons of
Manufacturing
Productivity and Unit
Labor Costs
2016 httpswww
conference-board
orgilcprogram
indexcfmid=42672
Manufacturing
Exports to the
US
All US Census
Bureau
Manufacturing Exports
(Customs Value)
2016 httpsusatrade
censusgov
Labor Share of
Manufacturing
Costs
United States Morgan Stanley
ndash As reported in
Business Insider
Chart of the Day The
Manufacturing Cost
Components For A
Bunch Of Different
Things
2013 httpswww
businessinsider
comchart-the-cost-
of-manufacturing-
stuff-2013-4
Trade-Weighted
US Dollar
Index
NA Federal Reserve
Bank of St Louis
Trade-Weighted US
Dollar Index Major
Currencies Goods
(Index Mar 1973=100
Monthly Not
Seasonally Adjusted)
2015ndash2019 httpsfred
stlouisfedorg
seriesTWEXMMTH
Other supporting data sources
copy 2020 KPMG LLP a Delaware limited liability partnership and the US member firm of the KPMG network of independent
member firms affiliated with KPMG International Cooperative (ldquoKPMG Internationalrdquo) a Swiss entity All rights reserved
The KPMG name and logo are registered trademarks or trademarks of KPMG International NDP089741-1A
copy 2020 KPMG LLP a Delaware limited liability partnership and a member firm of the KPMG global organization of independent member firms
affiliated with KPMG International Limited a private English company limited by guarantee All rights reserved The KPMG name and logo are
trademarks used under license by the independent member firms of the KPMG global organization NDP08974-1A26
Cost of manufacturing operations
around the globe
copy 2020 KPMG LLP a Delaware limited liability partnership and the US member firm of the KPMG network of independent
member firms affiliated with KPMG International Cooperative (ldquoKPMG Internationalrdquo) a Swiss entity All rights reserved
The KPMG name and logo are registered trademarks or trademarks of KPMG International NDP089741-1A
Appendix B Review of other studies
copy 2020 KPMG LLP a Delaware limited liability partnership and the US member firm of the KPMG network of independent
member firms affiliated with KPMG International Cooperative (ldquoKPMG Internationalrdquo) a Swiss entity All rights reserved
The KPMG name and logo are registered trademarks or trademarks of KPMG International NDP089741-1A
copy 2020 KPMG LLP a Delaware limited liability partnership and a member firm of the KPMG global organization of independent member firms
affiliated with KPMG International Limited a private English company limited by guarantee All rights reserved The KPMG name and logo are
trademarks used under license by the independent member firms of the KPMG global organization NDP08974-1A
While each companyrsquos location selection decision is
unique and reflects a range of factors various studies
have attempted to compare how companies would fare
if they considered alternate locations for their production
facilities For instance the Boston Consulting Group
performed a study in 2014 that examined the perception
that Latin America or Eastern Europe offered lower costs
of production than Western Europe the US or Japan
Based on a set of metrics such as manufacturing wages
labor productivity energy costs and exchange rates across
25 countries over time the study concluded that some of
the cost advantages of the lower-cost-base countries such
as Brazil and China have eroded over time10
The Congressional Research Service also performed a
study to assess the health of US manufacturing relative
to other countries in 201811 While focused primarily on
overall manufacturing trends in areas such as value added
by the manufacturing sector countriesrsquo share of global
manufacturing manufacturing employment and research
and development spending the study also compared
hourly costs in manufacturing across 14 countries
The study concluded that US labor costs are well above
those in emerging economies but similar in magnitude to
those in the major economies of continental Europe
Yet another study performed by the Brookings Institution
considered a broader range of indicators spanning topics
such as overall policies and regulations tax policy
energy transportation health costs workforce quality
and infrastructure and innovation across 19 countries12
This study however did not compare labor costs in
manufacturing Based on the scorecard developed by the
authors to assess the manufacturing environment the
study noted that countries that had made investments in
workforce and infrastructure such as the United Kingdom
Switzerland the United States Japan and Canada fared
much better than nations such as Brazil Indonesia
Mexico Russia India and China Our study takes a more
firm-centric approach We consider only the leading
manufacturing exporters to the US as our comparison
countries and consider a focus on primary costs including
labor and real estate
10 Boston Consulting Group ldquoThe Shifting Economics of Global Manufacturing How Cost Competitiveness is Changing Worldwiderdquo 2014
11 Congressional Research Service US Manufacturing in International Perspective February 21 2018
12 Brookings Institution Global Manufacturing Scorecard How the US Compares to 18 Other Nations 2018
28Cost of manufacturing operations
around the globe
copy 2020 KPMG LLP a Delaware limited liability partnership and the US member firm of the KPMG network of independent
member firms affiliated with KPMG International Cooperative (ldquoKPMG Internationalrdquo) a Swiss entity All rights reserved
The KPMG name and logo are registered trademarks or trademarks of KPMG International NDP089741-1A
Appendix C Shortlist of comparison countries
copy 2020 KPMG LLP a Delaware limited liability partnership and the US member firm of the KPMG network of independent
member firms affiliated with KPMG International Cooperative (ldquoKPMG Internationalrdquo) a Swiss entity All rights reserved
The KPMG name and logo are registered trademarks or trademarks of KPMG International NDP089741-1A
copy 2020 KPMG LLP a Delaware limited liability partnership and a member firm of the KPMG global organization of independent member firms
affiliated with KPMG International Limited a private English company limited by guarantee All rights reserved The KPMG name and logo are
trademarks used under license by the independent member firms of the KPMG global organization NDP08974-1A
Table 13 2016 global country rankings
Source US Census Bureau World Bank
This analysis considers a total of 16 economies in addition to the United States Table 13 lists each of
these economies as well as their respective rankings by manufacturing exports to the US and total
value added in manufacturing in 2016 Figure 2 presents the accompanying dollar value of manufacturing
exports for each economy to the US in 2016
These countries were first selected based on the customs value of manufacturing exports to the US
However the list generated on this basis did not include any countries from South America To make the
study more comprehensive Brazil the leading economy in South America with an industrial manufacturing
base in automotive aircraft and other sectors was added to the list
Country Manufacturing exports to US Total manufacturing value add
China 1 1
Mexico 2 12
Canada 3 16
Japan 4 3
Germany 5 4
Korea Rep 6 5
United Kingdom 7 9
Ireland 8 19
India 9 6
Italy 10 7
France 11 8
Vietnam 12 46
Taiwan 13 13
Malaysia 14 26
Switzerland 15 17
Brazil 18 10
copy 2020 KPMG LLP a Delaware limited liability partnership and the US member firm of the KPMG network of independent
member firms affiliated with KPMG International Cooperative (ldquoKPMG Internationalrdquo) a Swiss entity All rights reserved
The KPMG name and logo are registered trademarks or trademarks of KPMG International NDP089741-1A
30Cost of manufacturing operations
around the globe
copy 2020 KPMG LLP a Delaware limited liability partnership and a member firm of the KPMG global organization of independent member firms
affiliated with KPMG International Limited a private English company limited by guarantee All rights reserved The KPMG name and logo are
trademarks used under license by the independent member firms of the KPMG global organization NDP08974-1A
We note here that while we use exports to the US as a basis for selecting these countries the selected benchmark
countries generally rank highly when based on manufacturing output as well13 There is also a significant overlap between
these countries and those considered in other studies that we reviewed
13 US Census Bureau Manufacturing Exports (Customs Value) Accessible at httpsusatradecensusgov
Source US Census Bureau
Note that Canada data is as of 2015 and Taiwan does not contain World Bank data for any year
The global manufacturing output ranking from the World Bank source is also included for reference
Figure 1 2016 Total Manufacturing Exports to the US
Export
ing e
conom
y
Customs value (USD billions)
$500$450$400$350$300$250$200$150$100$50$0
Brazil $18
Switzerland $32
Malaysia $36
Taiwan $37
Vietnam $39
France $40
Italy $42
India $43
Ireland $43
UK $46
South Korea $68
Germany $107
Japan $128
$202Canada
$264Mexico
$454China
Appendix D Index methodology
copy 2020 KPMG LLP a Delaware limited liability partnership and a member firm of the KPMG global organization of independent
member firms affiliated with KPMG International Limited a private English company limited by guarantee All rights reserved
The KPMG name and logo are trademarks used under license by the independent member firms of the KPMG global
organization NDP08974-1A
32Cost of manufacturing operations
around the globe
copy 2020 KPMG LLP a Delaware limited liability partnership and a member firm of the KPMG global organization of independent member firms
affiliated with KPMG International Limited a private English company limited by guarantee All rights reserved The KPMG name and logo are
trademarks used under license by the independent member firms of the KPMG global organization NDP08974-1A
We use 23 metrics to develop an overall weight of the country The metrics are further segregated into Primary
and Secondary Costs The Primary Costs consist of five subcategories of costs and the Secondary Costs
consisted of an additional four subcategories (with a varying number of metrics for each category for a total of
18 categories)
The Primary and Secondary Cost Indices are equally weighted at 50 percent each and each subcategory within
these two broad categories was also equally weighted The weighting for each individual factor however varies as
the number of factors consider for each metric variesmdashthus the five Primary Costs have 20 percent weight each
for an overall ranking weight of 10 percent (50 percent20 percent) while the secondary factors have 25 percent
weight each Quality of labor for example has three metrics associated with it with each metric weighted at 42
percent (approximately 50 percent25 percent13) The table below shows the final weights for each metric
Figure 2 Weights by measure category
Table 14 Final weights in overall ranking by metric
Measure Cost type SubcategoryOverall ranking weight
1 Hourly compensation costs Primary 100
2 Real estate costs Primary 100
3 Utility costs Primary 100
4 Corporate tax rates Primary 100
5 Interest rates Primary 100
6 Learning-adjusted years of schooling Secondary Quality of Labor 42
7 Skill set of graduates Secondary Quality of Labor 42
8 Real value added per employee Secondary Quality of Labor 42
9 Days to start business Secondary Ease of Doing Business 42
10 Burden of government regulation Secondary Ease of Doing Business 42
11 Registering property Secondary Ease of Doing Business 42
12 Road quality index Secondary Infrastructure 10
13 Railroad quality Secondary Infrastructure 10
14 Airport connectivity Secondary Infrastructure 10
20
20
20
20
20
PrimaryCost Index
Hourly Compensation Costs
Real Estate Costs
Utility Costs
Corporate Tax Rates
Interest Rates
SecondaryCost Index
Quality of Labor
Ease of Doing Business
Infrastructure
Risk and Protections
25
2525
25
Primary Costs
Secondary Costs
CoDB Index 5050
Table 15 Percentile rankings by metric
Measure Cost type SubcategoryOverall ranking weight
15 Liner shipping connectivity index Secondary Infrastructure 10
16 Electric power losses ( of output) Secondary Infrastructure 14
17 Exposure to unsafe drinking water Secondary Infrastructure 14
18 Reliability of water supply Secondary Infrastructure 14
19 Access to internetWi-fi Secondary Infrastructure 42
20 Political risk Secondary Risk and Protections 31
21 Enforcing contracts Secondary Risk and Protections 31
22 Protecting minority investors Secondary Risk and Protections 31
23 Corruption perception index Secondary Risk and Protections 31
In addition to the weights assigned for each metric the
methodology for developing the index consisted of the
following steps
mdash Performance on each metric is ranked using a
percentile-based methodology The top (or bottom from
an operating cost perspective based on the metric) 15
percent receives the highest rank and the lowest (or
highest) 15 percent receives a rank of 5 Ranks for real
estate costs are shown below as an example Thus the
cheapest or lowest 15 percentile of real estate costs is
rank 1 percentiles between the 15 and 35 percentiles
receive a rank of 2 and so on This is further illustrated
in the table below
mdash The final scores are calculated by applying the
appropriate weights for each metric first at the
subcategory level and combined (using weight
multiplied by the rank) with the Primary and Secondary
Cost scores and ultimately to the overall score
The scores are then ranked for ease of display and
comparison
Real estate costs
Ranking From To
1 000 1499
2 1500 3499
3 3500 6499
4 6500 8499
5 8500 10000
copy 2020 KPMG LLP a Delaware limited liability partnership and the US member firm of the KPMG network of independent member firms
affiliated with KPMG International Cooperative (ldquoKPMG Internationalrdquo) a Swiss entity All rights reserved The KPMG name and logo are
registered trademarks or trademarks of KPMG International NDP089741-1A
34Cost of manufacturing operations
around the globe
Appendix E Real estate data sources in various cities
copy 2020 KPMG LLP a Delaware limited liability partnership and the US member firm of the KPMG network of independent
member firms affiliated with KPMG International Cooperative (ldquoKPMG Internationalrdquo) a Swiss entity All rights reserved
The KPMG name and logo are registered trademarks or trademarks of KPMG International NDP089741-1A
copy 2020 KPMG LLP a Delaware limited liability partnership and a member firm of the KPMG global organization of independent member firms
affiliated with KPMG International Limited a private English company limited by guarantee All rights reserved The KPMG name and logo are
trademarks used under license by the independent member firms of the KPMG global organization NDP08974-1A
Country City Property type Source Link
Brazil Santa Cruz
Campo
Grande
Industrial Cushman amp Wakefield
Industrial Marketbeat
Q2 2019 Brazil
Industrial Report
httpswwwcushmanwakefieldcomen
brazilinsightsbrazil-marketbeats
Brazil Satildeo Paulo Industrial Cushman amp Wakefield
Industrial Marketbeat
Q2 2019 Brazil
Industrial Report
Brazil Rio de
Janeiro
Industrial Cushman amp Wakefield
Industrial Marketbeat
Q2 2019 Brazil
Industrial Report
Canada Calgary Industrial Cushman amp Wakefield
Industrial Marketbeat
Q2 2019 Canada
Industrial Report
httpswwwcushmanwakefieldcomen
canadainsightscanada-marketbeats
Canada Ottawa Industrial Cushman amp Wakefield
Industrial Marketbeat
Q2 2019 Canada
Industrial Report
Canada Toronto Industrial Cushman amp Wakefield
Industrial Marketbeat
Q2 2019 Canada
Industrial Report
China Chengdu Logistics Colliers Quarterly
Logistics Research
Chengdu-Chonqing Q1
2019
httpswwwcollierscom-media
filesmarketresearchapacchina
southwestchina-researchwestchina-
logistics-q1-2019-enpdfla=en-GB
China Beijing Logistics Colliers Quarterly
Industrial Beijing-
Tianjin-Langeang Q1
2018
httpswwwcollierscom-mediafiles
marketresearchapacchinanorthchina-
researchbj-tj-lf-industrial-q1-2018
pdfla=en-GB
China Tianjin Logistics Colliers Quarterly
Industrial Beijing-
Tianjin-Langeang Q1
2018
France Paris Industrial and
Logistics
Cushman amp Wakefield
Industrial Market
Snapshot Q2 2019
France
httpswwwcushmanwakefieldcomen
franceinsightsfrance-marketbeat
France Lyon Industrial and
Logistics
Cushman amp Wakefield
Industrial Market
Snapshot Q2 2019
France
36Cost of manufacturing operations
around the globe
copy 2020 KPMG LLP a Delaware limited liability partnership and a member firm of the KPMG global organization of independent member firms
affiliated with KPMG International Limited a private English company limited by guarantee All rights reserved The KPMG name and logo are
trademarks used under license by the independent member firms of the KPMG global organization NDP08974-1A
Country City Property type Source Link
France Marseille Industrial and
Logistics
Cushman amp Wakefield
Industrial Market
Snapshot Q2 2019
France
httpswwwcushmanwakefieldcomen
franceinsightsfrance-marketbeat
France Bordeaux Industrial and
Logistics
Cushman amp Wakefield
Industrial Market
Snapshot Q2 2019
France
France Strasbourg Industrial and
Logistics
Cushman amp Wakefield
Industrial Market
Snapshot Q2 2019
France
France Lille Industrial and
Logistics
Cushman amp Wakefield
Industrial Market
Snapshot Q2 2019
France
France Toulouse Industrial and
Logistics
Cushman amp Wakefield
Industrial Market
Snapshot Q2 2019
France
Germany Berlin Industrial and
Logistics
Colliers Industrial and
Logistics Markets
Overview Germany
20182019
httpswwwcolliersdewp-
contentuploads201906
ColliersResearchMarket-Report-
IL20182019englpdf
Germany Dusseldorf Industrial and
Logistics
Colliers Industrial and
Logistics Markets
Overview Germany
20182019
Germany Frankfurt Industrial and
Logistics
Colliers Industrial and
Logistics Markets
Overview Germany
20182019
Germany Hamburg Industrial and
Logistics
Colliers Industrial and
Logistics Markets
Overview Germany
20182019
Germany Cologne Industrial and
Logistics
Colliers Industrial and
Logistics Markets
Overview Germany
20182019
Germany Leipzig Industrial and
Logistics
Colliers Industrial and
Logistics Markets
Overview Germany
20182019
copy 2020 KPMG LLP a Delaware limited liability partnership and a member firm of the KPMG global organization of independent member firms
affiliated with KPMG International Limited a private English company limited by guarantee All rights reserved The KPMG name and logo are
trademarks used under license by the independent member firms of the KPMG global organization NDP08974-1A
Country City Property type Source Link
Germany Munich Industrial and
Logistics
Colliers Industrial and
Logistics Markets
Overview Germany
20182019
httpswwwcolliersdewp-
contentuploads201906
ColliersResearchMarket-Report-
IL20182019englpdf
Germany Stuttgart Industrial and
Logistics
Colliers Industrial and
Logistics Markets
Overview Germany
20182019
India Delhi Industrial Cushman amp Wakefield
Industrial Marketbeat
Q4 2018 Delhi
Industrial Report
httpswwwcushmanwakefieldcomen
indiainsightsdelhi-ncr-marketbeat
India Mumbai Industrial Cushman amp Wakefield
Industrial Marketbeat
Q4 2018 Mumbai
Industrial Report
httpswwwcushmanwakefieldcomen
indiainsightsmumbai-marketbeat
Ireland Dublin Logistics Cushman amp Wakefield
Industrial Marketbeat
Q1 2019 Ireland
Industrial Report
httpswwwcushmanwakefieldcomen
irelandinsightsireland-marketbeat
Ireland Cork Logistics Cushman amp Wakefield
Industrial Marketbeat
Q1 2019 Ireland
Industrial Report
Ireland Galway Logistics Cushman amp Wakefield
Industrial Marketbeat
Q1 2019 Ireland
Industrial Report
Italy Rome Logistics CBRE Italy Logistics
MarketView Q4 2019
httpswwwcbredeenresearchItaly-
Logistics-MarketView-Q4-2019
Italy Milan Logistics CBRE Italy Logistics
MarketView Q4 2019
Italy Bologna Logistics CBRE Italy Logistics
MarketView Q4 2019
Japan Osaka Logistics CBRE Japan Real
Estate Market Outlook
2019
httpswwwcbrecomresearch-and-
reportsJapan-Real-Estate-Market-
Outlook-2019
Japan Nagoya Logistics CBRE Japan Real
Estate Market Outlook
2019
38Cost of manufacturing operations
around the globe
copy 2020 KPMG LLP a Delaware limited liability partnership and a member firm of the KPMG global organization of independent member firms
affiliated with KPMG International Limited a private English company limited by guarantee All rights reserved The KPMG name and logo are
trademarks used under license by the independent member firms of the KPMG global organization NDP08974-1A
Country City Property type Source Link
Malaysia Klang Valley Industrial CBRE Malaysia Real
Estate Market Outlook
2019
httpswwwcbrecomreport-
downloadPUBID=44c7f5c6-5dbe-4a76-
a335-ff80e9c57a79
Malaysia Penang Industrial CBRE Malaysia Real
Estate Market Outlook
2019
Malaysia Iskandar
Malaysia
Industrial CBRE Malaysia Real
Estate Market Outlook
2019
Malaysia Kuching Industrial CBRE Malaysia Real
Estate Market Outlook
2019
Mexico Mexico Industrial CBRE Mexico Industrial
Market Outlook Q2 2019
httpswwwcbrecommxenresearch-
and-reports
South Korea Greater
Seoul
Logistics DWS Market Outlook
2018
httpswwwdwscomglobalassets
institutionalresearchpdfsDWS_South_
Korea_Real_Estate_Market_Outlook_
April_2018pdf
Switzerland Industrial UBS Real Estate Focus
2019
httpsfiabciorguploadsswiss-real-
estate-focus-2019-enpdf
Taiwan Neihu
District
Taipei
Industrial Colliers Radar
Industrial Taiwan
August 2019
httpswwwcollierscom-media
filesapactaiwanother20
reports2019radarreport-enpdfla=en-
GBTaiwan Nangang
Taipei
Industrial Colliers Radar
Industrial Taiwan
August 2019
Taiwan Xizhi New
Taipei City
Industrial Colliers Radar
Industrial Taiwan
August 2019
Taiwan Jhonghe
New Taipei
City
Industrial Colliers Radar
Industrial Taiwan
August 2019
Taiwan Xindien New
Taipei City
Industrial Colliers Radar
Industrial Taiwan
August 2019
Taiwan Sanchong
New Taipei
City
Industrial Colliers Radar
Industrial Taiwan
August 2019
Taiwan Xinchuang
New Taipei
City
Industrial Colliers Radar
Industrial Taiwan
August 2019
Taiwan Tucheng
New Taipei
City
Industrial Colliers Radar
Industrial Taiwan
August 2019
copy 2020 KPMG LLP a Delaware limited liability partnership and a member firm of the KPMG global organization of independent member firms
affiliated with KPMG International Limited a private English company limited by guarantee All rights reserved The KPMG name and logo are
trademarks used under license by the independent member firms of the KPMG global organization NDP08974-1A
Country City Property type Source Link
United
Kingdom
London
(Heathrow)
Logistics Cushman amp Wakefield
Industrial Market
Snapshot Q2 2019 UK
httpswwwcushmanwakefieldcomen
united-kingdominsightsuk-marketbeat
United
Kingdom
Manchester Logistics Cushman amp Wakefield
Industrial Market
Snapshot Q2 2019 UK
United
Kingdom
Birmingham Logistics Cushman amp Wakefield
Industrial Market
Snapshot Q2 2019 UK
United
States
Boston Industrial Cushman amp Wakefield
US Industrial
Marketbeat Q2 2019
httpswwwcushmanwakefieldcomen
united-statesinsightsus-marketbeats
us-industrial-marketbeat
United
States
Omaha Industrial Cushman amp Wakefield
US Industrial
Marketbeat Q2 2019
United
States
Detroit Industrial Cushman amp Wakefield
US Industrial
Marketbeat Q2 2019
Vietnam Ho Chi Minh
City
Industrial CBRE Vietnam
Marketview Q2 2018
httpwwwcbrevietnam
comuseful=cbre-vietnam-
marketview-q2-2018Vietnam Long An Industrial CBRE Vietnam
Marketview Q2 2018
Vietnam Dong Nai Industrial CBRE Vietnam
Marketview Q2 2018
Vietnam Binh Duong Industrial CBRE Vietnam
Marketview Q2 2018
Vietnam Hanoi Industrial Colliers Vietnam Real
Estate Quarterly
Knowledge Report Q1
2019
httpswwwcollierscom-mediafiles
apacvietnampdfvietnam-quarterly-
knowledge-report-q1-2019-en-1
pdfla=en-GB
40Cost of manufacturing operations
around the globe
copy 2020 KPMG LLP a Delaware limited liability partnership and the US member firm of the KPMG network of independent
member firms affiliated with KPMG International Cooperative (ldquoKPMG Internationalrdquo) a Swiss entity All rights reserved
The KPMG name and logo are registered trademarks or trademarks of KPMG International NDP089741-1A
copy 2020 KPMG LLP a Delaware limited liability partnership and a member firm of the KPMG global organization of independent member firms
affiliated with KPMG International Limited a private English company limited by guarantee All rights reserved The KPMG name and logo are
trademarks used under license by the independent member firms of the KPMG global organization NDP08974-1A
Cost of manufacturing operations
around the globe
Contact usErkan ErdemPrincipalKPMG ndash National Tax Industry Leader for Public Sector and Economic and Statistical ConsultingT 703-286-8188
E erkanerdemkpmgcom
Oommen ThomasManaging DirectorKPMG ndash Economic and Statistical ConsultingT 415-963-8125
E oommenthomaskpmgcom
Talha MuhammadManagerKPMG ndash Economic and Statistical ConsultingT 212-909-5401
E talhamuhammadkpmgcom
Brian HecklerPartnerKPMG ndash National Sector Leader for Industrial ManufacturingT 312-665-2693
E bhecklerkpmgcom
Ulrich Schmidt Principal KPMG - Global Location amp Expansion Services T 267-256-2786 E ulrichschmidtkpmgcom
Carolyn LeeExecutive DirectorThe Manufacturing InstituteT 202-637-3079
E cleenamorg
The following information is not intended to be ldquowritten advice concerning one or more Federal tax mattersrdquo subject to the requirements of section 1037(a)(2)
of Treasury Department Circular 230
The information contained herein is of a general nature and based on authorities that are subject to change Applicability of the information to specific situations
should be determined through consultation with your tax adviser
copy 2020 KPMG LLP a Delaware limited liability partnership and a member firm of the KPMG global organization of independent member firms affiliated with
KPMG International Limited a private English company limited by guarantee All rights reserved The KPMG name and logo are trademarks used under license
by the independent member firms of the KPMG global organization NDP08974-1A
kpmgcomsocialmedia
The authors gratefully acknowledge excellent research assistance provided by Andrew Bent and
Kristina Kohl Tableau visualizations created by Konul Riegel and technical support provided by Ian Flick

copy 2020 KPMG LLP a Delaware limited liability partnership and the US member firm of the KPMG network of independent
member firms affiliated with KPMG International Cooperative (ldquoKPMG Internationalrdquo) a Swiss entity All rights reserved The
KPMG name and logo are registered trademarks or trademarks of KPMG International NDP089741-1A
the reader that the Primary Cost factors
are measured in US dollars Since we
have compared costs on a US dollar
denominated basis our results are impacted
by the relative strength of the various
currencies relative to the dollar As the
foreign exchange rates fluctuate as they
inevitably will the cost measurements we
have relied on would vary and possibly
impact the ranking of individual cost
components even if local currency costs do
not change
Finally we note that the rankings are based
on the best historical information available
Such data is mostly available only with a lag
and therefore the impact of recent trade
disputes or the market disruptions from
COVID-19 are not reflected in the results
copy 2020 KPMG LLP a Delaware limited liability partnership and the US member firm of the KPMG network of independent
member firms affiliated with KPMG International Cooperative (ldquoKPMG Internationalrdquo) a Swiss entity All rights reserved
The KPMG name and logo are registered trademarks or trademarks of KPMG International NDP089741-1A
16Cost of manufacturing operations
around the globe
Appendix A Data sources
copy 2020 KPMG LLP a Delaware limited liability partnership and the US member firm of the KPMG network of independent
member firms affiliated with KPMG International Cooperative (ldquoKPMG Internationalrdquo) a Swiss entity All rights reserved
The KPMG name and logo are registered trademarks or trademarks of KPMG International NDP089741-1A
copy 2020 KPMG LLP a Delaware limited liability partnership and a member firm of the KPMG global organization of independent member firms
affiliated with KPMG International Limited a private English company limited by guarantee All rights reserved The KPMG name and logo are
trademarks used under license by the independent member firms of the KPMG global organization NDP08974-1A
As discussed previously we relied on a variety of sources
to gather data on 23 metrics that spanned Primary and
Secondary Cost factors
Primary Cost Index
The Conference Board is a well-known source of data for
economists While researching international labor costs
we noted two indicators related to the manufacturing
industry that we deemed useful for our study The first
is hourly compensation costs which is a sum of hourly
pay for time worked hourly direct benefits and hourly
social insurance expenditures and labor-related taxes
The Conference Board did not have this information for
Malaysia and Vietnam so we substituted the Economist
Intelligence Unitrsquos labor cost per hour (pay and nonpay
costs) figures for these two countries
Real estate cost data that is leasing cost per square foot
was compiled from a mix of sources We collected data
from real estate advisory firms and asset managers such
as Cushman amp Wakefield Colliers International CBRE
Group Deutsche Bank DWS and UBS
Utility costs measure the average price per kilowatt hour
of electricity paid by all businesses and households in each
country excluding taxes and tariffs These prices were
retrieved from each countryrsquos respective energy regulatory
agency website
Corporate tax rates were available through internal KPMG
sources The tax rates cited in this study reflect combined
statutory federal and provincial tax rates only and do not
account for specific tax incentives International Financial
Statistics provided interest rates for Brazil Canada China
India Malaysia Mexico South Korea Switzerland the
United States and Vietnam
Interest rate data for all economies except the Euro
area countries the United Kingdom Japan and Taiwan
were obtained from the International Monetary Fundrsquos
International Financial Statistics database Interest rates for
Taiwan were retrieved from the Taiwanese central bank
while rates for the remaining economies were retrieved
from the US Federal Reserve Economic Data (FRED)
database Interest rates obtained from the IMF reflect the
monetary policy-related interest rate while interest rates
obtained from all other sources measure the discount rate
Secondary Cost measures
Quality of labor
Outside of the Doing Business report the World Bank
Group provided two additional measures for our study
learning-adjusted years of schooling and access to
internetWi-Fi
Learning-adjusted years of schooling used in the quality
of labor aggregation gives us insight into how advanced
a workerrsquos skill set might be in different countries It is
calculated by multiplying the expected years of school by
the ratio of the most recent harmonized test score and to
advancement attainment on the Trends in International
Mathematics and Science Study (TIMSS) test (The World
Bank Group)11
The Global Competitiveness Index published by the
World Economic Forum included an assessment of the
skill set of graduates (secondary and university graduates)
from each country as captured by the WEFrsquos Executive
Opinion Survey It is included in the ldquoaccess to advanced
educationrdquo category Including this measure while
similar to the learning-adjusted years of schooling takes
into account how executives perceive the quality of the
labor force and allows us to consider the perspective of a
company operating in one of these countries
Real value added per employee is a crucial metric for
companies as it has a direct impact on profits It measures
how much value each additional employee is adding to
the industry For example real value added can increase
if new employees are bringing advanced skill sets into
the workforce We used total real value added from the
Conference Board as well as the total number of people
employed to calculate real value added per employee
The Conference Board did not have this information on
Malaysia and Vietnam so we found comparable variables
for real value added per employee from Malaysia and
Vietnam from separate sources
Ease of doing business
The World Bank Group annually publishes a report titled
Doing Business which ranks 190 countries based on
their ease of doing business This research involves
very detailed quantitative indicators and a few were
particularly valuable to our study We focused on the 2019
report observing the number of days to start a business
registering property enforcing contracts and protecting
minority investors indicators As noted by The World Bank
Group the number of days to start a business measures
how many days it takes for a ldquosmall- to medium-size
limited liability company to start up and formally operate
in each economyrsquos largest business cityrdquo This is the
only variable from the Doing Business report where we
did not look at the overall score for the category (starting
a business) we only observed the number of days For
the remaining three indicators we used the scores The
registering property score is based on ldquothe steps time
and cost involved in registering a property assuming
a standardized case of an entrepreneur who wants to
18Cost of manufacturing operations
around the globe
copy 2020 KPMG LLP a Delaware limited liability partnership and a member firm of the KPMG global organization of independent member firms
affiliated with KPMG International Limited a private English company limited by guarantee All rights reserved The KPMG name and logo are
trademarks used under license by the independent member firms of the KPMG global organization NDP08974-1A
purchase land and a building that is already registered
and free of title dispute In addition the score includes
the quality of the land administration system in each
economy The quality of land administration index has five
dimensions reliability of infrastructure transparency of
information geographic coverage land dispute resolution
and equal access to property rightsrdquo (The World Bank
Group) Number of days to start a business and registering
property along with burden of government regulation
were used in our ease of doing business aggregation
Burden of government regulation is another Executive
Opinion Survey question from the Global Competitiveness
Index It is a response to the survey question ldquoIn your
country how burdensome is it for companies to comply
with public administrationrsquos requirements (eg permits
regulations reporting)rdquo Respondents can choose
a number on a scale of 1 to 7 1 being ldquoextremely
burdensomerdquo and 7 being ldquonot burdensome at allrdquo
Infrastructure
The World Economic Forumrsquos (WEF) Global Competitiveness
Index (2018 Report) contains very useful indicators relating to
starting a business Based on the values or survey responses
for each variable each country is assigned a score from 1 to
100 (100 being the best) It is important to note that we used
these scores for our study not the direct values or survey
responses
The Global Competitiveness Index provides useful information
regarding a countryrsquos infrastructure We specifically look at
transportation infrastructure and utility infrastructure In this
report transportation infrastructure is addressed with eight
variables mdashfour are sourced from WEFrsquos Executive Opinion
Survey and four are based on statistics that they compiled
from external sources
Of these variables we used the survey-based figures to
measure road quality and railroad quality while we used the
external index figures from the International Air Transport
Association (IATA) and United Nations Conference on Trade
and Development to measure airport connectivity and liner
shipping connectivity respectively Index values were not
used for the road and railroad figures due to inconsistencies
with the WEF data when we attempted to reproduce the
WEFrsquos calculations for these measures
The road quality survey results capture the response to
the survey question ldquoIn your country what is the quality
(extensiveness and condition) of road infrastructure [1 =
extremely poor among the worst in the world 7 = extremely
good among the best in the world]rdquo Similarly railroad
quality captures the average response to the question ldquoIn
your country how efficient (ie frequency punctuality
speed price) are train transport services [1 = extremely
inefficient among the worst in the world 7 = extremely
efficient among the best in the world]rdquo Airport connectivity
represents ldquothe IATA airport connectivity indicator which
measures the degree of integration of a country within the
global air transport networkrdquo The Liner shipping connectivity
index ldquoassesses a countryrsquos connectivity to global shipping
networksrdquo and is based on ldquofive components of the maritime
transport sector the number of ships their container-carrying
capacity the maximum vessel size the number of services
and the number of companies that deploy container ships in a
countryrsquos portsrdquo (World Economic Forum)
For utility infrastructure we gathered electric power losses
exposure to unsafe drinking water and reliability of water
supply from the Global Competitiveness Index Electric power
losses which measures a countryrsquos electricity quality and
exposure to unsafe drinking water which takes into account
ldquothe extent of exposure by risk level and the severity of that
riskrsquos contribution to disease burdenrdquo are both based on
statistics that were compiled from external sources Reliability
of water supply is taken from the WEFrsquos Executive Opinion
Survey and answers the question ldquoIn your country how
reliable is the water supply (lack of interruptions and flow
fluctuations)rdquo Respondents can choose a number on a
scale of 1 to 7 1 being ldquoextremely unreliablerdquo and 7 being
ldquoextremely reliablerdquo As mentioned earlier the World Bank
Group provides us with our indicator access to internetWi-
Fi which is part of the overall infrastructure aggregation It
measures the percentage of the population that is using the
internet
Risk and protections
Our political risk data was sourced from the insurance
company Credendorsquos ldquoCountry Risks Synthetizing Chartrdquo
Countries are classified into seven categories (from 1 to 7)
reflecting the intensity of risks arising as a result of political
and assimilated events Category 1 includes those countries
for which the risk is considered the lowest and category 7
contains those countries with the highest likelihood of risks
being caused by political and assimilated events In our study
we chose to focus on political risk over medium- and long-
term periods
Enforcing contracts and protecting minority investors along
with political risk and the corruption perception index were
included in our risk and protections aggregation According
to the World Bank Group the enforcing contracts score
ldquomeasures the time and cost for resolving a commercial
dispute through a local first-instance court and the quality of
copy 2020 KPMG LLP a Delaware limited liability partnership and a member firm of the KPMG global organization of independent member firms
affiliated with KPMG International Limited a private English company limited by guarantee All rights reserved The KPMG name and logo are
trademarks used under license by the independent member firms of the KPMG global organization NDP08974-1A
Measure Country Source Source detail Year Link
Hourly Compensation Costs
All (except Malaysia and Vietnam)
The Conference Board
International Comparisons of Hourly Compensation Costs in Manufacturing
2016 httpwwwconference-boardorgilcprogramindexcfmid=38269
Hourly Compensation Costs
Malaysia and Vietnam
The Economist Intelligence Unit General Statistics Office of Vietnam and Department of Statistics Malaysia
Estimated Labor Cost per Hour Manufacturing
2016 Both httpdataeiucomEI UTableViewaspx initial=trueamppub type_id=1253181310
Vietnam
httpswwwgsogov vndefault_enaspx tabid=783
Malaysia
httpsnewssstatisticsgovmynewss-portalx epepDownloadContent SearchseamcontentId =54516ampactionMethod =ep2FepDownload ContentSearchxhtml 3AcontentActiondo DisplayContentampcid= 12789
Real Estate Costs
See Appendix E
Utility Costs China China Electricity Council
Analysis of National Electricity Market Transaction Information in the Fourth Quarter of 2018
2018 Adjusted to 2015 USD
httpwwwcecorgcnguihuayutongjidianligaige2019-03 -04189190html
Primary Cost measures ndash References
judicial processes index evaluating whether each economy
has adopted a series of good practices that promote
quality and efficiency in the court systemrdquo Protecting
minority investors focuses on ldquothe strength of minority
shareholder protections against misuse of corporate assets
by directors for their personal gain as well as shareholder
rights governance safeguards and corporate transparency
requirements that reduce the risk of abuserdquo (The World
Bank Group)
The WEFrsquos Global Competitiveness Index provided scores
for each country based on the Corruption Perception Index
2016 results This index measures ldquoperceptions of corruption
in the public sectorrdquo and is scaled from 0 (highly corrupt) to
100 (very clean) According to Transparency International
who created the index ldquoThe global average score is a
paltry 43 indicating endemic corruption in a countryrsquos public
sector Top-scoring countries are far outnumbered by [low-
scoring] countries where citizens face the tangible impact of
corruption on a daily basisrdquo
Specific data sources used and linked references are provided
below
20Cost of manufacturing operations
around the globe
copy 2020 KPMG LLP a Delaware limited liability partnership and a member firm of the KPMG global organization of independent member firms
affiliated with KPMG International Limited a private English company limited by guarantee All rights reserved The KPMG name and logo are
trademarks used under license by the independent member firms of the KPMG global organization NDP08974-1A
Measure Country Source Source detail Year Link
Utility Costs France Germany Ireland Italy and United Kingdom
Eurostat Electricity prices for nonhousehold consumers ndash biannual data
2015 httpappssoeurostateceuropaeunuishowdodataset=nrg_pc_205amplang=en
Utility Costs Canada Government of Canada ndash Canada Energy Regulator
Market Snapshot Explaining the high cost of power in northern Canada February 16 2017
2016 Adjusted to 2015 USD
The Canada Energy Regulator 2017 Reproduced with the permission of Public Works and Government Services 2020
Utility Costs Brazil Governo do Brasil
Anuaacuterio Estatiacutestico de Energia Eleacutetrica 2016
2015 httppateducacaobagovbrconteudosconteudos-digitaisdownload8667pdf
Utility Costs South Korea Korea Energy Statistical Information System
Average revenues per kWh sold by segments
2015 httpwwwkesisnetsubsubChartEngjspreport_id=34110ampreport Type=0
Utility Costs Malaysia Malaysia Energy Data and Research
Malaysia Energy Statistics Handbook 2018
2015 httpsmeihstgovmydocuments10620c7e69704-6f80-40ae-a764-ad0acf4a844d
Utility Costs India Power Finance Corporation Ltd (A Govt of India Undertaking)
The Performance of State Power Utilities for the years 2013ndash14 to 2015ndash16
2015 httpswwwpfcindiacomDocumentRepositoryckfinderfilesOperationsPerformance_Reports_of_State_Power_Utilities1_Report on the Performance of State Power Utilities 2013-14 to 2015-16pdf
Utility Costs Switzerland Swiss Office of Energy
Switzerland Utility Costs 2015 httpswwwbfeadminchbfedehomehtml
Utility Costs Taiwan Taiwan Bureau of Energy
Energy Statistical Annual Reports
2015 httpswwwmoeaboegovtwECWenglishcontentContentLinkaspxmenu_id=1540
Utility Costs Japan US Energy Information Administration ndash Independent Statistics and Analysis
Japanrsquos electricity prices rising or stable despite recent fuel cost changes
2015 httpswwweiagovtodayinenergydetailphpid=27872
copy 2020 KPMG LLP a Delaware limited liability partnership and a member firm of the KPMG global organization of independent member firms
affiliated with KPMG International Limited a private English company limited by guarantee All rights reserved The KPMG name and logo are
trademarks used under license by the independent member firms of the KPMG global organization NDP08974-1A
Measure Country Source Source detail Year Link
Utility Costs United States US Energy Information Administration ndash Independent Statistics and Analysis
Average retail price of electricity United States annual
2015 httpswwweiagov
electricitydatabrowser
topic7agg=01ampgeo=
gampendsec=vgamplinechart
=ELECPRICEUS-ALL
A~ELECPRICEUS-RES
A~ELECPRICEUS-COM
A~ELECPRICEUS-IND
Aampcolumnchart=ELEC
PRICE
US-ALLA~ELECPRICE
US-RESA~ELECPRICE
US-COMA~ELECPRICE
US-INDAampmap=ELEC
PRICEUS-ALLAampfreq=
Aampctype=linechartlt=rdquordquo
div=rdquordquo style=rdquobox-sizing
border-boxrdquogt
Utility Costs Mexico US Energy Information Administration ndash Independent Statistics and Analysis
Mexico electricity market reforms attempt to reduce costs and develop new capacity
2015 httpswwweiagovtodayinenergydetailphpid=26932
Utility Costs Vietnam Vietnam Electricity ndash EVN
Vietnam Electricity Annual Report 2016
2015 httpsenevncomvnuserfileUserhuongbttfiles20177AnnualReport2016pdf
Corporate Tax Rates
All KPMG Corporate tax rates table 2019 httpshomekpmgxxenhomeservicestaxtax-tools-and-resourcestax-rates-onlinecorporate-tax-rates-tablehtml
Interest Rates Euro Area India and Japan
Federal Reserve Economic Data (FRED)
Discount Rates (Euro Area India and Japan)
2018 httpsfredstlouisfedorg
Interest Rates Taiwan Central Bank of the Republic of China
Discount Rate (Taiwan) 2018 httpswwwcbcgovtwenlp-695-2html
Interest Rates United Kingdom Bank of England Discount Rate (UK) 2018 httpswwwbankofenglandcoukmonetary-policythe-interest-rate-bank-rate
Interest Rates All (except Euro Area the UK India Japan and Taiwan)
International Financial Statistics
Interest Rates and Monetary Policy-Related Interest Rate percent per annum
2018 httpsdataimforg sk=388DFA60-1D26- 4ADE-B505-A05A55 8D9A42amp sId=1479331931186
22Cost of manufacturing operations
around the globe
copy 2020 KPMG LLP a Delaware limited liability partnership and a member firm of the KPMG global organization of independent member firms
affiliated with KPMG International Limited a private English company limited by guarantee All rights reserved The KPMG name and logo are
trademarks used under license by the independent member firms of the KPMG global organization NDP08974-1A
Secondary Cost measures
Measure Country Source Source detail Years Link
Learning-
Adjusted Years
of Schooling
All The World Bank Learning-Adjusted
Years of Schooling
2017 httpstcdata360
worldbankorg
indicatorsh00280750
country=BRA
ampindicator
=40964ampviz=bar_
chartampyears=2017
Skill set of
Graduates
All (except China) World Economic
Forum
Global
Competitiveness
Index 2019
Weighted
Average 2018ndash
2019
httpstcdata360
worldbankorg
indicators
h00280750
country=
BRAampindicator=
40964ampviz=
bar_chartampyears=2017
httpreports
weforumorg
global-
competitiveness-
report-2018
China Weighted Average
2016ndash2017
RVA per
Employee
All The Conference
Board
International
Comparisons of
Manufacturing
Productivity and
Unit Labor Costs
2017 httpswww
conference-board
orgilcprogram
indexcfmid=42672
Number of
Days to Start a
Business
All The World Bank Doing Business
2019
2019 httpswww
doingbusinessorg
endata
Burden of
Government
Regulation
All (except China) World Economic
Forum
Global
Competitiveness
Index 2019
Weighted
Average of
2018ndash2019
httpreports
weforumorgglobal-
competitiveness-
report-2019China Weighted
Average of
2016ndash2017
Registering
Property
All The World Bank Doing Business
2019
2019 httpswww
doingbusinessorg
endata
Road Quality All (except China) World Economic
Forum
Global
Competitiveness
Index 2019
Weighted
Average of
2018ndash2019
httpreports
weforumorgglobal-
competitiveness-
report-2019China Weighted
Average of
2016ndash2017
copy 2020 KPMG LLP a Delaware limited liability partnership and a member firm of the KPMG global organization of independent member firms
affiliated with KPMG International Limited a private English company limited by guarantee All rights reserved The KPMG name and logo are
trademarks used under license by the independent member firms of the KPMG global organization NDP08974-1A
Measure Country Source Source detail Years Link
Railroad Quality All (except China) World Economic
Forum
Global
Competitiveness
Index 2019
Weighted
Average of
2018ndash2019
httpreports
weforumorgglobal-
competitiveness-
report-2019China Weighted
Average of
2016ndash2017
Airport
Connectivity
All World Economic
Forum
Global
Competitiveness
Index 2019
2018 httpreports
weforumorgglobal-
competitiveness-
report-2019
Liner Shipping
Connectivity
Index
AllWorld Economic
Forum
Global
Competitiveness
Index 2018
2018
httpreports
weforumorgglobal-
competitiveness-
report-2018
Electric Power
LossesAll
World Economic
Forum
Global
Competitiveness
Index 2018
2016
httpreports
weforumorgglobal-
competitiveness-
report-2018
Exposure to
Unsafe Drinking
Water
AllWorld Economic
Forum
Global
Competitiveness
Index 2018
2017
httpreports
weforumorgglobal-
competitiveness-
report-2018
Reliability of
Water Supply
All (except China)
World Economic
Forum
Global
Competitiveness
Index 2018
Weighted
Average
2018ndash2019httpreports
weforumorgglobal-
competitiveness-
report-2018China
Weighted
Average
2016ndash2017
Access to
InternetWi-Fi
France Germany
Ireland Italy
Malaysia
Mexico South
Korea UK
Vietnam Taiwan The World Bank
Individuals using
the Internet ( of
population)
2018 httpsdata
worldbank
orgindicator
ITNETUSER
ZSview=mapBrazil Canada
China India
Japan
Switzerland US
2017
Political Risk All CredendoCountry Risk and
Insights2019
24Cost of manufacturing operations
around the globe
copy 2020 KPMG LLP a Delaware limited liability partnership and a member firm of the KPMG global organization of independent member firms
affiliated with KPMG International Limited a private English company limited by guarantee All rights reserved The KPMG name and logo are
trademarks used under license by the independent member firms of the KPMG global organization NDP08974-1A
Measure Country Source Source detail Years Link
Corruption
Perception
Index
AllWorld Economic
Forum
Global
Competitiveness
Index 2018
2018
httpreports
weforumorgglobal-
competitiveness-
report-2018
Protecting
Minority
Investors
All The World BankDoing Business
20192019
httpswww
doingbusinessorg
endata
Enforcing
ContractsAll The World Bank
Doing Business
20192019
httpswww
doingbusinessorg
endata
Measure Country Source Source detail Years Link
Manufacturing
Value Added
All except Taiwan World Bank World Bank National
Accounts Data
2016 httpsdata
worldbankorg
indicatorNVIND
MANFCD
Manufacturing
Value Added
Taiwan The Conference
Board
International
Comparisons of
Manufacturing
Productivity and Unit
Labor Costs
2016 httpswww
conference-board
orgilcprogram
indexcfmid=42672
Manufacturing
Exports to the
US
All US Census
Bureau
Manufacturing Exports
(Customs Value)
2016 httpsusatrade
censusgov
Labor Share of
Manufacturing
Costs
United States Morgan Stanley
ndash As reported in
Business Insider
Chart of the Day The
Manufacturing Cost
Components For A
Bunch Of Different
Things
2013 httpswww
businessinsider
comchart-the-cost-
of-manufacturing-
stuff-2013-4
Trade-Weighted
US Dollar
Index
NA Federal Reserve
Bank of St Louis
Trade-Weighted US
Dollar Index Major
Currencies Goods
(Index Mar 1973=100
Monthly Not
Seasonally Adjusted)
2015ndash2019 httpsfred
stlouisfedorg
seriesTWEXMMTH
Other supporting data sources
copy 2020 KPMG LLP a Delaware limited liability partnership and the US member firm of the KPMG network of independent
member firms affiliated with KPMG International Cooperative (ldquoKPMG Internationalrdquo) a Swiss entity All rights reserved
The KPMG name and logo are registered trademarks or trademarks of KPMG International NDP089741-1A
copy 2020 KPMG LLP a Delaware limited liability partnership and a member firm of the KPMG global organization of independent member firms
affiliated with KPMG International Limited a private English company limited by guarantee All rights reserved The KPMG name and logo are
trademarks used under license by the independent member firms of the KPMG global organization NDP08974-1A26
Cost of manufacturing operations
around the globe
copy 2020 KPMG LLP a Delaware limited liability partnership and the US member firm of the KPMG network of independent
member firms affiliated with KPMG International Cooperative (ldquoKPMG Internationalrdquo) a Swiss entity All rights reserved
The KPMG name and logo are registered trademarks or trademarks of KPMG International NDP089741-1A
Appendix B Review of other studies
copy 2020 KPMG LLP a Delaware limited liability partnership and the US member firm of the KPMG network of independent
member firms affiliated with KPMG International Cooperative (ldquoKPMG Internationalrdquo) a Swiss entity All rights reserved
The KPMG name and logo are registered trademarks or trademarks of KPMG International NDP089741-1A
copy 2020 KPMG LLP a Delaware limited liability partnership and a member firm of the KPMG global organization of independent member firms
affiliated with KPMG International Limited a private English company limited by guarantee All rights reserved The KPMG name and logo are
trademarks used under license by the independent member firms of the KPMG global organization NDP08974-1A
While each companyrsquos location selection decision is
unique and reflects a range of factors various studies
have attempted to compare how companies would fare
if they considered alternate locations for their production
facilities For instance the Boston Consulting Group
performed a study in 2014 that examined the perception
that Latin America or Eastern Europe offered lower costs
of production than Western Europe the US or Japan
Based on a set of metrics such as manufacturing wages
labor productivity energy costs and exchange rates across
25 countries over time the study concluded that some of
the cost advantages of the lower-cost-base countries such
as Brazil and China have eroded over time10
The Congressional Research Service also performed a
study to assess the health of US manufacturing relative
to other countries in 201811 While focused primarily on
overall manufacturing trends in areas such as value added
by the manufacturing sector countriesrsquo share of global
manufacturing manufacturing employment and research
and development spending the study also compared
hourly costs in manufacturing across 14 countries
The study concluded that US labor costs are well above
those in emerging economies but similar in magnitude to
those in the major economies of continental Europe
Yet another study performed by the Brookings Institution
considered a broader range of indicators spanning topics
such as overall policies and regulations tax policy
energy transportation health costs workforce quality
and infrastructure and innovation across 19 countries12
This study however did not compare labor costs in
manufacturing Based on the scorecard developed by the
authors to assess the manufacturing environment the
study noted that countries that had made investments in
workforce and infrastructure such as the United Kingdom
Switzerland the United States Japan and Canada fared
much better than nations such as Brazil Indonesia
Mexico Russia India and China Our study takes a more
firm-centric approach We consider only the leading
manufacturing exporters to the US as our comparison
countries and consider a focus on primary costs including
labor and real estate
10 Boston Consulting Group ldquoThe Shifting Economics of Global Manufacturing How Cost Competitiveness is Changing Worldwiderdquo 2014
11 Congressional Research Service US Manufacturing in International Perspective February 21 2018
12 Brookings Institution Global Manufacturing Scorecard How the US Compares to 18 Other Nations 2018
28Cost of manufacturing operations
around the globe
copy 2020 KPMG LLP a Delaware limited liability partnership and the US member firm of the KPMG network of independent
member firms affiliated with KPMG International Cooperative (ldquoKPMG Internationalrdquo) a Swiss entity All rights reserved
The KPMG name and logo are registered trademarks or trademarks of KPMG International NDP089741-1A
Appendix C Shortlist of comparison countries
copy 2020 KPMG LLP a Delaware limited liability partnership and the US member firm of the KPMG network of independent
member firms affiliated with KPMG International Cooperative (ldquoKPMG Internationalrdquo) a Swiss entity All rights reserved
The KPMG name and logo are registered trademarks or trademarks of KPMG International NDP089741-1A
copy 2020 KPMG LLP a Delaware limited liability partnership and a member firm of the KPMG global organization of independent member firms
affiliated with KPMG International Limited a private English company limited by guarantee All rights reserved The KPMG name and logo are
trademarks used under license by the independent member firms of the KPMG global organization NDP08974-1A
Table 13 2016 global country rankings
Source US Census Bureau World Bank
This analysis considers a total of 16 economies in addition to the United States Table 13 lists each of
these economies as well as their respective rankings by manufacturing exports to the US and total
value added in manufacturing in 2016 Figure 2 presents the accompanying dollar value of manufacturing
exports for each economy to the US in 2016
These countries were first selected based on the customs value of manufacturing exports to the US
However the list generated on this basis did not include any countries from South America To make the
study more comprehensive Brazil the leading economy in South America with an industrial manufacturing
base in automotive aircraft and other sectors was added to the list
Country Manufacturing exports to US Total manufacturing value add
China 1 1
Mexico 2 12
Canada 3 16
Japan 4 3
Germany 5 4
Korea Rep 6 5
United Kingdom 7 9
Ireland 8 19
India 9 6
Italy 10 7
France 11 8
Vietnam 12 46
Taiwan 13 13
Malaysia 14 26
Switzerland 15 17
Brazil 18 10
copy 2020 KPMG LLP a Delaware limited liability partnership and the US member firm of the KPMG network of independent
member firms affiliated with KPMG International Cooperative (ldquoKPMG Internationalrdquo) a Swiss entity All rights reserved
The KPMG name and logo are registered trademarks or trademarks of KPMG International NDP089741-1A
30Cost of manufacturing operations
around the globe
copy 2020 KPMG LLP a Delaware limited liability partnership and a member firm of the KPMG global organization of independent member firms
affiliated with KPMG International Limited a private English company limited by guarantee All rights reserved The KPMG name and logo are
trademarks used under license by the independent member firms of the KPMG global organization NDP08974-1A
We note here that while we use exports to the US as a basis for selecting these countries the selected benchmark
countries generally rank highly when based on manufacturing output as well13 There is also a significant overlap between
these countries and those considered in other studies that we reviewed
13 US Census Bureau Manufacturing Exports (Customs Value) Accessible at httpsusatradecensusgov
Source US Census Bureau
Note that Canada data is as of 2015 and Taiwan does not contain World Bank data for any year
The global manufacturing output ranking from the World Bank source is also included for reference
Figure 1 2016 Total Manufacturing Exports to the US
Export
ing e
conom
y
Customs value (USD billions)
$500$450$400$350$300$250$200$150$100$50$0
Brazil $18
Switzerland $32
Malaysia $36
Taiwan $37
Vietnam $39
France $40
Italy $42
India $43
Ireland $43
UK $46
South Korea $68
Germany $107
Japan $128
$202Canada
$264Mexico
$454China
Appendix D Index methodology
copy 2020 KPMG LLP a Delaware limited liability partnership and a member firm of the KPMG global organization of independent
member firms affiliated with KPMG International Limited a private English company limited by guarantee All rights reserved
The KPMG name and logo are trademarks used under license by the independent member firms of the KPMG global
organization NDP08974-1A
32Cost of manufacturing operations
around the globe
copy 2020 KPMG LLP a Delaware limited liability partnership and a member firm of the KPMG global organization of independent member firms
affiliated with KPMG International Limited a private English company limited by guarantee All rights reserved The KPMG name and logo are
trademarks used under license by the independent member firms of the KPMG global organization NDP08974-1A
We use 23 metrics to develop an overall weight of the country The metrics are further segregated into Primary
and Secondary Costs The Primary Costs consist of five subcategories of costs and the Secondary Costs
consisted of an additional four subcategories (with a varying number of metrics for each category for a total of
18 categories)
The Primary and Secondary Cost Indices are equally weighted at 50 percent each and each subcategory within
these two broad categories was also equally weighted The weighting for each individual factor however varies as
the number of factors consider for each metric variesmdashthus the five Primary Costs have 20 percent weight each
for an overall ranking weight of 10 percent (50 percent20 percent) while the secondary factors have 25 percent
weight each Quality of labor for example has three metrics associated with it with each metric weighted at 42
percent (approximately 50 percent25 percent13) The table below shows the final weights for each metric
Figure 2 Weights by measure category
Table 14 Final weights in overall ranking by metric
Measure Cost type SubcategoryOverall ranking weight
1 Hourly compensation costs Primary 100
2 Real estate costs Primary 100
3 Utility costs Primary 100
4 Corporate tax rates Primary 100
5 Interest rates Primary 100
6 Learning-adjusted years of schooling Secondary Quality of Labor 42
7 Skill set of graduates Secondary Quality of Labor 42
8 Real value added per employee Secondary Quality of Labor 42
9 Days to start business Secondary Ease of Doing Business 42
10 Burden of government regulation Secondary Ease of Doing Business 42
11 Registering property Secondary Ease of Doing Business 42
12 Road quality index Secondary Infrastructure 10
13 Railroad quality Secondary Infrastructure 10
14 Airport connectivity Secondary Infrastructure 10
20
20
20
20
20
PrimaryCost Index
Hourly Compensation Costs
Real Estate Costs
Utility Costs
Corporate Tax Rates
Interest Rates
SecondaryCost Index
Quality of Labor
Ease of Doing Business
Infrastructure
Risk and Protections
25
2525
25
Primary Costs
Secondary Costs
CoDB Index 5050
Table 15 Percentile rankings by metric
Measure Cost type SubcategoryOverall ranking weight
15 Liner shipping connectivity index Secondary Infrastructure 10
16 Electric power losses ( of output) Secondary Infrastructure 14
17 Exposure to unsafe drinking water Secondary Infrastructure 14
18 Reliability of water supply Secondary Infrastructure 14
19 Access to internetWi-fi Secondary Infrastructure 42
20 Political risk Secondary Risk and Protections 31
21 Enforcing contracts Secondary Risk and Protections 31
22 Protecting minority investors Secondary Risk and Protections 31
23 Corruption perception index Secondary Risk and Protections 31
In addition to the weights assigned for each metric the
methodology for developing the index consisted of the
following steps
mdash Performance on each metric is ranked using a
percentile-based methodology The top (or bottom from
an operating cost perspective based on the metric) 15
percent receives the highest rank and the lowest (or
highest) 15 percent receives a rank of 5 Ranks for real
estate costs are shown below as an example Thus the
cheapest or lowest 15 percentile of real estate costs is
rank 1 percentiles between the 15 and 35 percentiles
receive a rank of 2 and so on This is further illustrated
in the table below
mdash The final scores are calculated by applying the
appropriate weights for each metric first at the
subcategory level and combined (using weight
multiplied by the rank) with the Primary and Secondary
Cost scores and ultimately to the overall score
The scores are then ranked for ease of display and
comparison
Real estate costs
Ranking From To
1 000 1499
2 1500 3499
3 3500 6499
4 6500 8499
5 8500 10000
copy 2020 KPMG LLP a Delaware limited liability partnership and the US member firm of the KPMG network of independent member firms
affiliated with KPMG International Cooperative (ldquoKPMG Internationalrdquo) a Swiss entity All rights reserved The KPMG name and logo are
registered trademarks or trademarks of KPMG International NDP089741-1A
34Cost of manufacturing operations
around the globe
Appendix E Real estate data sources in various cities
copy 2020 KPMG LLP a Delaware limited liability partnership and the US member firm of the KPMG network of independent
member firms affiliated with KPMG International Cooperative (ldquoKPMG Internationalrdquo) a Swiss entity All rights reserved
The KPMG name and logo are registered trademarks or trademarks of KPMG International NDP089741-1A
copy 2020 KPMG LLP a Delaware limited liability partnership and a member firm of the KPMG global organization of independent member firms
affiliated with KPMG International Limited a private English company limited by guarantee All rights reserved The KPMG name and logo are
trademarks used under license by the independent member firms of the KPMG global organization NDP08974-1A
Country City Property type Source Link
Brazil Santa Cruz
Campo
Grande
Industrial Cushman amp Wakefield
Industrial Marketbeat
Q2 2019 Brazil
Industrial Report
httpswwwcushmanwakefieldcomen
brazilinsightsbrazil-marketbeats
Brazil Satildeo Paulo Industrial Cushman amp Wakefield
Industrial Marketbeat
Q2 2019 Brazil
Industrial Report
Brazil Rio de
Janeiro
Industrial Cushman amp Wakefield
Industrial Marketbeat
Q2 2019 Brazil
Industrial Report
Canada Calgary Industrial Cushman amp Wakefield
Industrial Marketbeat
Q2 2019 Canada
Industrial Report
httpswwwcushmanwakefieldcomen
canadainsightscanada-marketbeats
Canada Ottawa Industrial Cushman amp Wakefield
Industrial Marketbeat
Q2 2019 Canada
Industrial Report
Canada Toronto Industrial Cushman amp Wakefield
Industrial Marketbeat
Q2 2019 Canada
Industrial Report
China Chengdu Logistics Colliers Quarterly
Logistics Research
Chengdu-Chonqing Q1
2019
httpswwwcollierscom-media
filesmarketresearchapacchina
southwestchina-researchwestchina-
logistics-q1-2019-enpdfla=en-GB
China Beijing Logistics Colliers Quarterly
Industrial Beijing-
Tianjin-Langeang Q1
2018
httpswwwcollierscom-mediafiles
marketresearchapacchinanorthchina-
researchbj-tj-lf-industrial-q1-2018
pdfla=en-GB
China Tianjin Logistics Colliers Quarterly
Industrial Beijing-
Tianjin-Langeang Q1
2018
France Paris Industrial and
Logistics
Cushman amp Wakefield
Industrial Market
Snapshot Q2 2019
France
httpswwwcushmanwakefieldcomen
franceinsightsfrance-marketbeat
France Lyon Industrial and
Logistics
Cushman amp Wakefield
Industrial Market
Snapshot Q2 2019
France
36Cost of manufacturing operations
around the globe
copy 2020 KPMG LLP a Delaware limited liability partnership and a member firm of the KPMG global organization of independent member firms
affiliated with KPMG International Limited a private English company limited by guarantee All rights reserved The KPMG name and logo are
trademarks used under license by the independent member firms of the KPMG global organization NDP08974-1A
Country City Property type Source Link
France Marseille Industrial and
Logistics
Cushman amp Wakefield
Industrial Market
Snapshot Q2 2019
France
httpswwwcushmanwakefieldcomen
franceinsightsfrance-marketbeat
France Bordeaux Industrial and
Logistics
Cushman amp Wakefield
Industrial Market
Snapshot Q2 2019
France
France Strasbourg Industrial and
Logistics
Cushman amp Wakefield
Industrial Market
Snapshot Q2 2019
France
France Lille Industrial and
Logistics
Cushman amp Wakefield
Industrial Market
Snapshot Q2 2019
France
France Toulouse Industrial and
Logistics
Cushman amp Wakefield
Industrial Market
Snapshot Q2 2019
France
Germany Berlin Industrial and
Logistics
Colliers Industrial and
Logistics Markets
Overview Germany
20182019
httpswwwcolliersdewp-
contentuploads201906
ColliersResearchMarket-Report-
IL20182019englpdf
Germany Dusseldorf Industrial and
Logistics
Colliers Industrial and
Logistics Markets
Overview Germany
20182019
Germany Frankfurt Industrial and
Logistics
Colliers Industrial and
Logistics Markets
Overview Germany
20182019
Germany Hamburg Industrial and
Logistics
Colliers Industrial and
Logistics Markets
Overview Germany
20182019
Germany Cologne Industrial and
Logistics
Colliers Industrial and
Logistics Markets
Overview Germany
20182019
Germany Leipzig Industrial and
Logistics
Colliers Industrial and
Logistics Markets
Overview Germany
20182019
copy 2020 KPMG LLP a Delaware limited liability partnership and a member firm of the KPMG global organization of independent member firms
affiliated with KPMG International Limited a private English company limited by guarantee All rights reserved The KPMG name and logo are
trademarks used under license by the independent member firms of the KPMG global organization NDP08974-1A
Country City Property type Source Link
Germany Munich Industrial and
Logistics
Colliers Industrial and
Logistics Markets
Overview Germany
20182019
httpswwwcolliersdewp-
contentuploads201906
ColliersResearchMarket-Report-
IL20182019englpdf
Germany Stuttgart Industrial and
Logistics
Colliers Industrial and
Logistics Markets
Overview Germany
20182019
India Delhi Industrial Cushman amp Wakefield
Industrial Marketbeat
Q4 2018 Delhi
Industrial Report
httpswwwcushmanwakefieldcomen
indiainsightsdelhi-ncr-marketbeat
India Mumbai Industrial Cushman amp Wakefield
Industrial Marketbeat
Q4 2018 Mumbai
Industrial Report
httpswwwcushmanwakefieldcomen
indiainsightsmumbai-marketbeat
Ireland Dublin Logistics Cushman amp Wakefield
Industrial Marketbeat
Q1 2019 Ireland
Industrial Report
httpswwwcushmanwakefieldcomen
irelandinsightsireland-marketbeat
Ireland Cork Logistics Cushman amp Wakefield
Industrial Marketbeat
Q1 2019 Ireland
Industrial Report
Ireland Galway Logistics Cushman amp Wakefield
Industrial Marketbeat
Q1 2019 Ireland
Industrial Report
Italy Rome Logistics CBRE Italy Logistics
MarketView Q4 2019
httpswwwcbredeenresearchItaly-
Logistics-MarketView-Q4-2019
Italy Milan Logistics CBRE Italy Logistics
MarketView Q4 2019
Italy Bologna Logistics CBRE Italy Logistics
MarketView Q4 2019
Japan Osaka Logistics CBRE Japan Real
Estate Market Outlook
2019
httpswwwcbrecomresearch-and-
reportsJapan-Real-Estate-Market-
Outlook-2019
Japan Nagoya Logistics CBRE Japan Real
Estate Market Outlook
2019
38Cost of manufacturing operations
around the globe
copy 2020 KPMG LLP a Delaware limited liability partnership and a member firm of the KPMG global organization of independent member firms
affiliated with KPMG International Limited a private English company limited by guarantee All rights reserved The KPMG name and logo are
trademarks used under license by the independent member firms of the KPMG global organization NDP08974-1A
Country City Property type Source Link
Malaysia Klang Valley Industrial CBRE Malaysia Real
Estate Market Outlook
2019
httpswwwcbrecomreport-
downloadPUBID=44c7f5c6-5dbe-4a76-
a335-ff80e9c57a79
Malaysia Penang Industrial CBRE Malaysia Real
Estate Market Outlook
2019
Malaysia Iskandar
Malaysia
Industrial CBRE Malaysia Real
Estate Market Outlook
2019
Malaysia Kuching Industrial CBRE Malaysia Real
Estate Market Outlook
2019
Mexico Mexico Industrial CBRE Mexico Industrial
Market Outlook Q2 2019
httpswwwcbrecommxenresearch-
and-reports
South Korea Greater
Seoul
Logistics DWS Market Outlook
2018
httpswwwdwscomglobalassets
institutionalresearchpdfsDWS_South_
Korea_Real_Estate_Market_Outlook_
April_2018pdf
Switzerland Industrial UBS Real Estate Focus
2019
httpsfiabciorguploadsswiss-real-
estate-focus-2019-enpdf
Taiwan Neihu
District
Taipei
Industrial Colliers Radar
Industrial Taiwan
August 2019
httpswwwcollierscom-media
filesapactaiwanother20
reports2019radarreport-enpdfla=en-
GBTaiwan Nangang
Taipei
Industrial Colliers Radar
Industrial Taiwan
August 2019
Taiwan Xizhi New
Taipei City
Industrial Colliers Radar
Industrial Taiwan
August 2019
Taiwan Jhonghe
New Taipei
City
Industrial Colliers Radar
Industrial Taiwan
August 2019
Taiwan Xindien New
Taipei City
Industrial Colliers Radar
Industrial Taiwan
August 2019
Taiwan Sanchong
New Taipei
City
Industrial Colliers Radar
Industrial Taiwan
August 2019
Taiwan Xinchuang
New Taipei
City
Industrial Colliers Radar
Industrial Taiwan
August 2019
Taiwan Tucheng
New Taipei
City
Industrial Colliers Radar
Industrial Taiwan
August 2019
copy 2020 KPMG LLP a Delaware limited liability partnership and a member firm of the KPMG global organization of independent member firms
affiliated with KPMG International Limited a private English company limited by guarantee All rights reserved The KPMG name and logo are
trademarks used under license by the independent member firms of the KPMG global organization NDP08974-1A
Country City Property type Source Link
United
Kingdom
London
(Heathrow)
Logistics Cushman amp Wakefield
Industrial Market
Snapshot Q2 2019 UK
httpswwwcushmanwakefieldcomen
united-kingdominsightsuk-marketbeat
United
Kingdom
Manchester Logistics Cushman amp Wakefield
Industrial Market
Snapshot Q2 2019 UK
United
Kingdom
Birmingham Logistics Cushman amp Wakefield
Industrial Market
Snapshot Q2 2019 UK
United
States
Boston Industrial Cushman amp Wakefield
US Industrial
Marketbeat Q2 2019
httpswwwcushmanwakefieldcomen
united-statesinsightsus-marketbeats
us-industrial-marketbeat
United
States
Omaha Industrial Cushman amp Wakefield
US Industrial
Marketbeat Q2 2019
United
States
Detroit Industrial Cushman amp Wakefield
US Industrial
Marketbeat Q2 2019
Vietnam Ho Chi Minh
City
Industrial CBRE Vietnam
Marketview Q2 2018
httpwwwcbrevietnam
comuseful=cbre-vietnam-
marketview-q2-2018Vietnam Long An Industrial CBRE Vietnam
Marketview Q2 2018
Vietnam Dong Nai Industrial CBRE Vietnam
Marketview Q2 2018
Vietnam Binh Duong Industrial CBRE Vietnam
Marketview Q2 2018
Vietnam Hanoi Industrial Colliers Vietnam Real
Estate Quarterly
Knowledge Report Q1
2019
httpswwwcollierscom-mediafiles
apacvietnampdfvietnam-quarterly-
knowledge-report-q1-2019-en-1
pdfla=en-GB
40Cost of manufacturing operations
around the globe
copy 2020 KPMG LLP a Delaware limited liability partnership and the US member firm of the KPMG network of independent
member firms affiliated with KPMG International Cooperative (ldquoKPMG Internationalrdquo) a Swiss entity All rights reserved
The KPMG name and logo are registered trademarks or trademarks of KPMG International NDP089741-1A
copy 2020 KPMG LLP a Delaware limited liability partnership and a member firm of the KPMG global organization of independent member firms
affiliated with KPMG International Limited a private English company limited by guarantee All rights reserved The KPMG name and logo are
trademarks used under license by the independent member firms of the KPMG global organization NDP08974-1A
Cost of manufacturing operations
around the globe
Contact usErkan ErdemPrincipalKPMG ndash National Tax Industry Leader for Public Sector and Economic and Statistical ConsultingT 703-286-8188
E erkanerdemkpmgcom
Oommen ThomasManaging DirectorKPMG ndash Economic and Statistical ConsultingT 415-963-8125
E oommenthomaskpmgcom
Talha MuhammadManagerKPMG ndash Economic and Statistical ConsultingT 212-909-5401
E talhamuhammadkpmgcom
Brian HecklerPartnerKPMG ndash National Sector Leader for Industrial ManufacturingT 312-665-2693
E bhecklerkpmgcom
Ulrich Schmidt Principal KPMG - Global Location amp Expansion Services T 267-256-2786 E ulrichschmidtkpmgcom
Carolyn LeeExecutive DirectorThe Manufacturing InstituteT 202-637-3079
E cleenamorg
The following information is not intended to be ldquowritten advice concerning one or more Federal tax mattersrdquo subject to the requirements of section 1037(a)(2)
of Treasury Department Circular 230
The information contained herein is of a general nature and based on authorities that are subject to change Applicability of the information to specific situations
should be determined through consultation with your tax adviser
copy 2020 KPMG LLP a Delaware limited liability partnership and a member firm of the KPMG global organization of independent member firms affiliated with
KPMG International Limited a private English company limited by guarantee All rights reserved The KPMG name and logo are trademarks used under license
by the independent member firms of the KPMG global organization NDP08974-1A
kpmgcomsocialmedia
The authors gratefully acknowledge excellent research assistance provided by Andrew Bent and
Kristina Kohl Tableau visualizations created by Konul Riegel and technical support provided by Ian Flick