cost optimization of wind turbines for large-scale
TRANSCRIPT
Ris0-R-1OOO(EN)
DK9801295
Cost Optimization of Wind Turbines forLarge-Scale Offshore Wind Farms
Peter Fuglsang, Kenneth Thomsen
RECEIVEDWWIfW
O8TI
DISTRIBUTION OF THIS DOCUMENT IS UNLIMITEDFOREIGN SALES PROHIBITED
2 9 - 3 5Ris0 National Laboratory, Roskilde, DenmarkFebruary 1998

DISCLAIMER
Portions of this document may be illegibleelectronic image products. Images areproduced from the best available originaldocument.
Ris0-R-1OOO(EN)
Cost Optimization of Wind Turbines forLarge-Scale OflFshore Wind Farms
Peter Fuglsang, Kenneth Thomsen
Ris0 National Laboratory, Roskilde, DenmarkFebruary 1998
AbstractThis report contains a preliminary investigation of site specific design of off-shore wind turbines for a large off-shore wind farm project at R0dsand that iscurrently being proposed by ELKRAFT/SEAS. The results were found using adesign tool for wind turbines that involve numerical optimization andaeroelastic calculations of response. The wind climate was modeled in detailand a cost function was used to estimate costs from manufacture andinstallation. Cost of energy is higher for off-shore installations. A comparisonof an off-shore wind farm site with a typical stand alone on-shore site showedan increase of the annual production of 28% due to the difference in windclimate. Extreme loads and blade fatigue loads were nearly identical, however,fatigue loads on other main components increased significantly. Optimizationswere carried out to find the optimum overall off-shore wind turbine design. Awind turbine for the off-shore wind farm should be different compared with astand-alone on-shore wind turbine. The overall design changed were increasedswept area and rated power combined with reduced rotor speed and towerheight. Cost was reduced by 12% for the final 5D/14D off-shore wind turbinefrom 0.306 DKr/kWh to 0.270 DKr/kWh. These figures include capital costsfrom manufacture and installation but not on-going costs from maintenance.These results make off-shore wind farms more competitive and comparable tothe reference on-shore stand-alone wind turbine. A corresponding reduction ofcost of energy could not be found for the stand alone on-shore wind turbine.Furthermore the fatigue loads on wind turbines in on-shore wind farms willincrease and cost of energy will increase in favor of off-shore wind farms.
The present work was carried out in cooperation with ELKRAFT/SEAS andwas funded by the European Union in the contract, JOR3-CT95-0089 and bythe Danish Energy Agency in the contract, ENS-1363/95-0001.
The report has passed an internal review of the Wind Energy and AtmosphericPhysics Department performed by:
Sten Fra'ndsen
ISBN 87-550-2331-2ISSN 0106-2840
Information Service Department, Ris0, 1998

Contents
1 Introduction 5
2 Description of the methods 6
3 Specifications for the design optimizations 8
3.1 Reference wind turbine 83.2 Wind farm layout 83.3 The wind resources 93.4 Free flow and wake operation 103.5 Load cases and operational conditions 113.6 Cost function 123.7 Design variables and constraints 15
4 Results 16
4.1 Design loads for the on-shore and 5D/5D off-shore sites 164.2 Optimum off-shore wind turbine 184.3 Sensitivity analysis 214.4 Final optimization 26
5 Conclusions 28
References 30
NEXT PAGE(S)left BLANK
Ris0-R-1OOO(EN)

1 IntroductionThis report presents the results of site-specific design optimizations of windturbines for a large-scale off-shore wind farm project that is being proposed byELKRAFT/SEAS. The report was carried out as a part of the European JouleIII project, "Cost optimising of large-scale off-shore wind farms", coordinatedby ELKRAFT/SEAS.
This study was intended as a preliminary investigation of the relevance of site-specific design, including only overall design parameters, whereas a morecomplete study should be carried out at a later stage in the project. The basisfor the optimization results is the planned wind farm at R0dsand in the southernpart of Denmark and the results are established for part one (of four) of thisplanned wind farm. Part one of the wind farm contains approximately 100 windturbines, each of about 1.5 MW of rated power.
The objective of the optimizations is to clarify the benefits of site specificdesign for off-shore wind turbines and to identify possible differences in thewind turbine design for off-shore wind turbines compared with on-shore windturbines. The results are intended to be general design guidelines for the nextgeneration of large off-shore wind turbines.
The results are based on the most recent developed design tools for windturbines involving numerical optimization, Fuglsang and Thomsen, 1998.Detailed knowledge of off-shore wind farm effects are used, Frandsen et al ,1996. An important part of this method is time domain aeroelastic calculationsof response that is used to establish detailed information on the design loads.The design method is briefly described in Chapter 2.
For the actual planned wind farm it is necessary to take two special operationalconditions into account while specifying the design loads. First, the wind farmis to be installed at sea in an off-shore environment, where the ambientturbulence is different from on-shore locations. Secondly, the influence ofoperation in the wake of upstream wind turbines must be taken into account.The most important design loads have to be identified and on basis of this acost function for the entire wind turbine must be developed. The cost functionincludes costs from manufacture and installation and is used to calculate thecost of energy which is the optimization objective. The load cases and theobjective function are described in Chapter 3.
In Chapter 4, comparisons are carried out between design loads for a standalone on-shore wind turbine at normal flat terrain and an off-shore wind turbinein a wind farm. The results of the optimization of a wind turbine for the off-shore wind farm are presented. A sensitivity analysis reveals the relativeimportance of the design variables and the conditions for the optimization.Finally, an optimization with the actual preliminary wind farm layout atR0dsand is carried out.
Chapter 5 contains a summarizing conclusion.
Ris0-R-1OOO(EN)
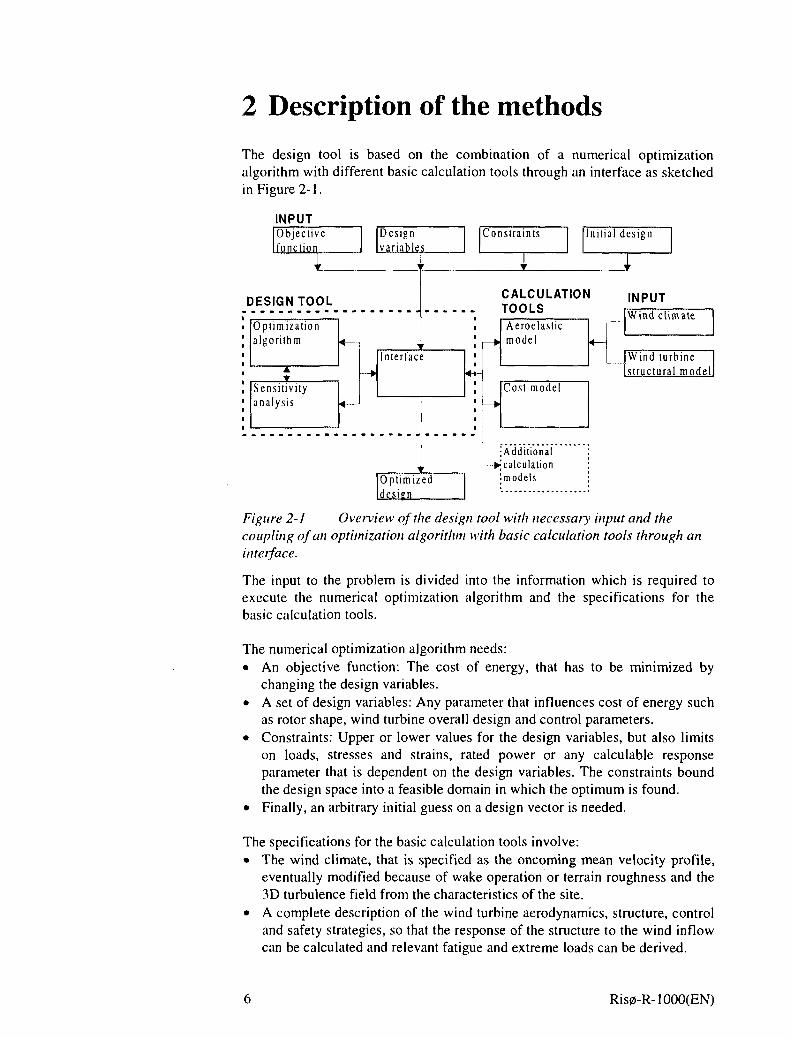
2 Description of the methodsThe design tool is based on the combination of a numerical optimizationalgorithm with different basic calculation tools through an interface as sketchedin Figure 2-1.
INPUTObjectivefunction
1
Designvariables
Constraints
DESIGN TOOL
Optimizationalgorithm
Sensitivityanalysis
Initial design
Interfacer—>
CALCULATIONTOOLSAeroelasticmodel «—
INPUTWind climate
Cost model
Wind turbinestructural model
Optimizeddesign
•Additional-••calculation
'•models
Figure 2-1 Overview of the design tool with necessary input and thecoupling of an optimization algorithm with basic calculation tools through aninterface.
The input to the problem is divided into the information which is required toexecute the numerical optimization algorithm and the specifications for thebasic calculation tools.
The numerical optimization algorithm needs:• An objective function: The cost of energy, that has to be minimized by
changing the design variables.• A set of design variables: Any parameter that influences cost of energy such
as rotor shape, wind turbine overall design and control parameters.• Constraints: Upper or lower values for the design variables, but also limits
on loads, stresses and strains, rated power or any calculable responseparameter that is dependent on the design variables. The constraints boundthe design space into a feasible domain in which the optimum is found.
• Finally, an arbitrary initial guess on a design vector is needed.
The specifications for the basic calculation tools involve:• The wind climate, that is specified as the oncoming mean velocity profile,
eventually modified because of wake operation or terrain roughness and the3D turbulence field from the characteristics of the site.
• A complete description of the wind turbine aerodynamics, structure, controland safety strategies, so that the response of the structure to the wind inflowcan be calculated and relevant fatigue and extreme loads can be derived.
Ris0-R-1OOO(EN)
When the design tool is applied, different basic calculation tools are used:• Traditional aerodynamic analysis based on ordinary blade
element/momentum theory is used for calculation of the power curve andmean loads.
• State-of-the-art aeroelastic calculations together with Rainflow countingprovide fatigue loads.
• Extreme loads are determined from response time series and from aDavenport type model (Dansk Ingeni0rforening, 1992).
• A cost model is used to determine the cost of each of the main componentsrelated to the design load cases. The cost of energy is then found from theannual energy production and the cost function that includes costs frommanufacture and installation.
The aeroelastic model used in the design tool was the code, FLEX4, which wasdeveloped by 0ye, 1992. It is a time integration aeroelastic model. It uses arelatively limited number of degrees of freedom (DOF) to describe the rigidbody motions and elastic deformations of a wind turbine. In case of a threebladed wind turbine the number of DOF's is limited to 20. These degrees offreedom are two tower deflections, tower torsion and tower top tilt deflection.The shaft is described by two bending DOF's and a torsion DOF. Each blade isdescribed by the first two mode shapes in the edge- and flapwise directions.The mean wind field over the rotor plane includes wind shear, yaw error andtower shadow. The turbulent part of the wind is included in the model as timeseries of simulated turbulence in a large number of points over the rotor disc, amethod described by Veers, 1988, which includes a three-dimensionalturbulence simulation.
The execution of the different calculation tools is controlled by the interface,that is tailored for communication between the numerical optimizationalgorithm and the calculation models. It generates the wind turbineconfiguration from the design variables. When the calculation tools have beenexecuted, the interface evaluates the objective function and the constraints andnecessary sensitivity information for use by the optimization algorithm.
The methods are described in more detail in Fuglsang and Thomsen, 1998 andin Fuglsang and Madsen, 1996.
Ris0-R-1OOO(EN)

3 Specifications for the designoptimizations
Design optimizations were carried out for two different off-shore wind farmlayouts and for an on-shore stand-alone wind turbine. Comparisons between on-shore and off-shore were carried out for the optimized wind turbine design,annual energy production, design loads and cost of energy.
The specifications for the optimization study include: A description of the 1.5MW wind turbine that was used as reference, the wind resources for the on-shore stand-alone site and for the two off-shore wind farms (see section 3.2),the wind farm layouts for the wind farms including the distribution of free andwake flow, the load cases and the operational conditions, the cost function, thedesign variables and the constraints.
3.1 Reference wind turbineThe reference wind turbine is a 1.5 MW stall regulated wind turbine with a stiffupwind rotor corresponding to a typical Danish wind turbine. The maindimensions are shown in Table 3-1. The LM 29.2 blade is based on NACAairfoils and has a root chord of approximately 3 m. The structuralcharacteristics of the reference turbine were modeled as a state-of-the-artDanish wind turbine.
Table 3-1 Reference wind turbine main dimensions
Rotor diameter (m)Hub height (m)Rotor speed (rpm)Rated power (MW)RegulationBlades
60.059.519.81.5StallLM 29.2
3.2 Wind farm layoutTwo different wind farm wake conditions were considered:1. The 5D/5D layout: A simplified wind farm layout with 5 rotor diameters (5
D) distance between the turbines and 5 D between the rows.2. The 5D/14D layout: The actual wind farm layout where the distance
between the wind turbines in the rows is 350 m and the distance between therows is 850 m.
The layout of the wind farms are illustrated in Figure 3-1. A wind turbine in themiddle of the wind farm was selected for the optimization. For some of theoptimizations the rotor diameter was a design variable and for simplicity thedistance between turbines was given relative to the rotor diameter, D. This
Ris0-R-1OOO(EN)
implies that if the rotor diameter increased during the optimizations theabsolute distance between the turbines increased.
The 5D/5D wind farm configuration was considered initially whereas the5D/14D wind farm was used only in the final optimization.
Based on results from Frandsen et al., 1996, only wake effects from the nearestturbines were considered.
O O O O O O
O O
O O •
Jo o • •*-© • • o o
o o o o o o o
14D 5D
O
O
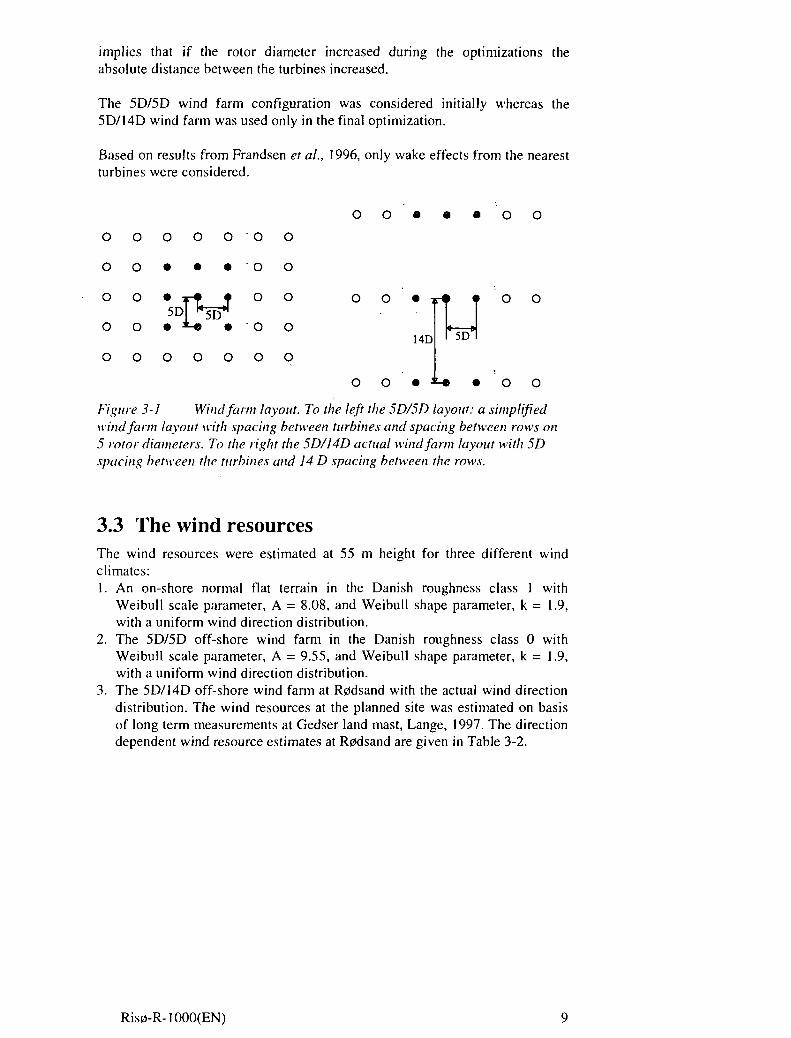
Figure 3-1 Wind farm layout. To the left the 5D/5D layout: a simplifiedwind farm layout with spacing between turbines and spacing between rows on5 rotor diameters. To the right the 5D/14D actual wind farm layout with 5Dspacing between the turbines and 14 D spacing between the rows.
3.3 The wind resourcesThe wind resources were estimated at 55 m height for three different windclimates:1. An on-shore normal flat terrain in the Danish roughness class 1 with
Weibull scale parameter, A = 8.08, and Weibull shape parameter, k = 1.9,with a uniform wind direction distribution.
2. The 5D/5D off-shore wind farm in the Danish roughness class 0 withWeibull scale parameter, A = 9.55, and Weibull shape parameter, k = 1.9,with a uniform wind direction distribution.
3. The 5D/14D off-shore wind farm at R0dsand with the actual wind directiondistribution. The wind resources at the planned site was estimated on basisof long term measurements at Gedser land mast, Lange, 1997. The directiondependent wind resource estimates at R0dsand are given in Table 3-2.
Ris0-R-1OOO(EN)

Table 3-2 Estimated direction dependent wind resource at R0dsand(55m). From (Lange, 1997)
Wind directionsector
0306090120150180210240270300330
Totals:
Wind directionprobabilities (%)
5.682.692.7910.5010.426.425.949.8613.2917.179.186.06100
Weibull A parameters(m/s)
8.037.897.2012.609.899.019.1010.5411.1711.538.929.0010.21
Weibull k
2.061.751.732.372.492.512.562.332.402.492.242.262.35
3.4 Free flow and wake operationFor some wind directions a wind turbine in the middle of the wind farm will beoperating in near wake (5D), eventually far wake (14D) and for other directionsin free flow. Using methods described in Thomsen, 1997 and Frandsen et aiy
1996, the number of operational hours in each of these three situations wascalculated for the 5D/5D wind farm with a uniform wind direction distribution,Table 3-3 and for the 5D/14D wind farm, Table 3-4. The number of operationalhours for the 5D/14D wind farm was obtained using the wind directiondistribution in Table 3-2. A life time of 20 years was assumed in both cases.
Table 3-3 Number of operational hours in different wind inflowconditions for the 5D/5D wind farm with a uniform wind direction distribution.Total lifetime was 20 years.
Wind speed(m/s)
4681012141618202224
Totals:
Free flow(hours)
1803118834168681338995806240372420461038487129
90366
5D wake(hours)
15501129069942716648693091181398449322860
57053
10 Ris0-R-1OOO(EN)
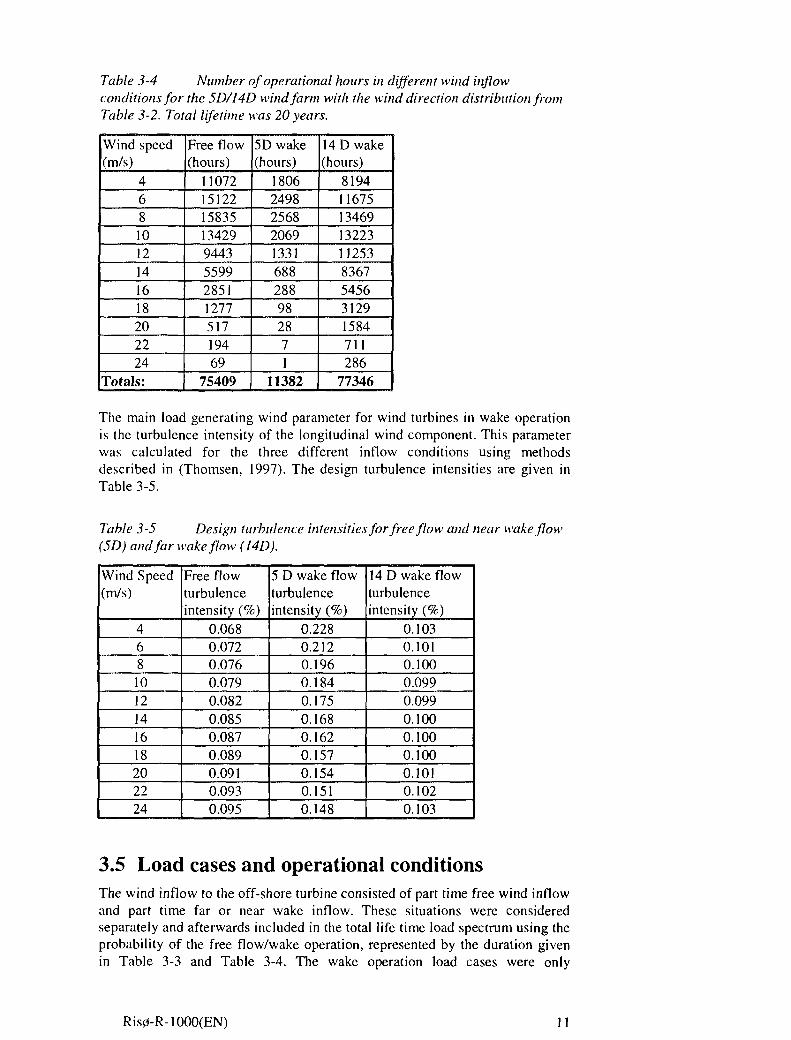
Table 3-4 Number of operational hours in different wind inflowconditions for the 5D/14D wind farm with the wind direction distribution fromTable 3-2. Total lifetime was 20 years.
Wind speed(m/s)
4681012141618202224
Totals:
Free flow(hours)
11072151221583513429944355992851127751719469
75409
5D wake(hours)
18062498256820691331688288982871
11382
14 D wake(hours)
8194116751346913223112538367545631291584711286
77346
The main load generating wind parameter for wind turbines in wake operationis the turbulence intensity of the longitudinal wind component. This parameterwas calculated for the three different inflow conditions using methodsdescribed in (Thomsen, 1997). The design turbulence intensities are given inTable 3-5.
Table 3-5 Design turbulence intensities for free flow and near wake flow(5D) and far wake flow (J4D).
Wind Speed(m/s)
4681012141618202224
Free flowturbulenceintensity (%)
0.0680.0720.0760.0790.0820.0850.0870.0890.0910.0930.095
5 D wake flowturbulenceintensity (%)
0.2280.2120.1960.1840.1750.1680.1620.1570.1540.1510.148
14 D wake flowturbulenceintensity (%)
0.1030.1010.1000.0990.0990.1000.1000.1000.1010.1020.103
3.5 Load cases and operational conditionsThe wind inflow to the off-shore turbine consisted of part time free wind inflowand part time far or near wake inflow. These situations were consideredseparately and afterwards included in the total life time load spectrum using theprobability of the free flow/wake operation, represented by the duration givenin Table 3-3 and Table 3-4. The wake operation load cases were only
Ris0-R-1OOO(EN) 11
considered for the fatigue analysis since the extreme loads on a turbine usuallyoccurs during high wind speeds where the turbine is shut down.Loads during normal operation, i.e., during power production between the cut-in and the cut-out wind speeds, were included in the fatigue design load basis.Furthermore, a fault condition - error in yawing mechanism - was included anddescribed as extreme yaw error, assumed to be ±30°, combined with cut-outwind speed, 25 m/s. Recent investigations illustrate the importance of this loadsituation, Thomsen et al., 1997.
Usually start and stop situations are included in the design basis for windturbines. However, for this particular optimization it was assumed that thesesituations would not contribute significantly to changes in the design loads forthe considered components and thus these situations were not included.
The total number of operational conditions was 13 for each inflow condition.For the wind turbine in a wind farm the inflow condition was a combination offree inflow and wake inflow and the resulting number of operational conditionswas either 26 or 39 depending on whether both near (5D) and far (14D) flowwas considered.
3.6 Cost functionThe cost function total cost, C, was calculated as a sum of contributions fromthe different wind turbine main components. The estimation of actual cost isdifficult, since the pricing of each component depends on sub contractors andmarket economy. Therefore cost analysis was based on the estimation ofcomponent weight. For each component, changes in the design loads wereconverted to changes in characteristic main dimensions from allowable ultimateand fatigue stresses and strains. The component weight, m,, was then estimatedfor each main component, /, from the characteristic dimensions.
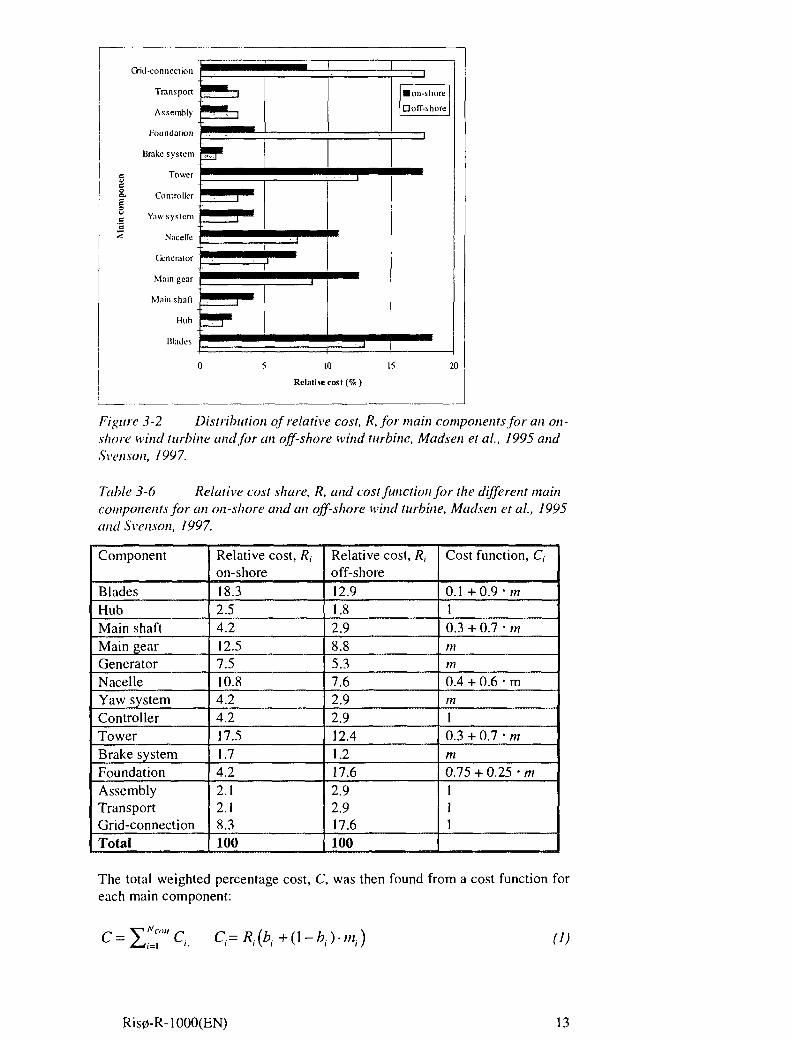
The percentage cost distribution on the different main components wasestimated for the reference rotor for installation at an on-shore site and at anoff-shore site respectively, Figure 3-2. The total relative cost was 42% higherfor the off-shore site because of increased foundation and grid connection costs,Svenson, 1997.
Each component cost, C,, was split into a fixed cost share, b\, and a variablecost share, (1-b,), b, e [0;l]. The fixed cost share represents for examplemanufacture and transport. The variable part depends on the component weight,Table 3-6. It was not considered to include different costs shares for on-shoreand off-shore wind turbines respectively.
12 Ris0-R-1OOO(EN)
g.E
Grid-connection
Transport
Assembly
Foundation
Brake system
Tower
Controller
Yaw system
Nacelle
Generator
Main gear
Main shaft
Hub
Blades
Relative cost (%)
Figure 3-2 Distribution of relative cost, R, for main components for an on-shore wind turbine and for an off-shore wind turbine, Madsen et al., 1995 andSvenson, 1997.
Table 3-6 Relative cost share, R, and cost function for the different maincomponents for an on-shore and an off-shore wind turbine, Madsen et al., 1995and Svenson, 1997.
Component
BladesHubMain shaftMain gearGeneratorNacelleYaw systemControllerTowerBrake systemFoundationAssemblyTransportGrid-connectionTotal
Relative cost, Rt
on-shore18.32.54.212.57.510.84.24.217.51.74.22.12.18.3100
Relative cost, /?,off-shore12.91.82.98.85.37.62.92.912.41.217.62.92.917.6100
Cost function, C,
0.1 +0.9-m10.3 + 0.7 • mmm0.4 + 0.6 • min
10.3 + 0.7 • mm0.75 + 0.25 • m111
The total weighted percentage cost, C, was then found from a cost function foreach main component:
(1)
Ris0-R-1OOO(EN) 13

Where /?, is the percentage cost for the fth component, with the total relative
cost, R = V /?; — 100%, Ncom is the number of main components.
We calculated the material consumption for each main component on a relativebasis compared with the reference rotor on basis of the design loads in Table 3-7. The m functions were based on Madsen et al., 1995 and Svenson, 1997. Eqn.(1) was then used to find the relative percentage change in the cost function.The cost function was then compared for two wind turbines of equal concept.Since the variation of C, with m-, is linear, only minor variations in the designloads and hence the characteristic dimensions should be allowed.
Table 3-7 Design loads.
Design load
Blade root flapwise bendingmomentBlade root edgewise bendingmomentRotor yaw bending moment
Rotor tilt bending moment
Rotor thrust force
Tower base bending moment
U extreme loadf fatigue loadM"flap, MJ
Jhl,
Muedl!t, M!
Cihe
*** van* *'* yaw
Mu,ith MJtilt
P u pi* thrush * thrust
* " tmverbtiset *** towerhase
The cost of energy, COE, on an annual basis was found relative to the referencerotor from:
COE =RC
a-E(2)
Where C is the manufacture and installation costs, a is the annuity factor. Onbasis of Table 3-8, a = 12.46. E is the annual energy production. R is the totalrelative cost. On-going costs such as maintenance and losses in energyproduction from availability below 100% were neglected. The totalmanufacture and installation costs for the reference wind turbine was set to17.6 million DKr for an off-shore installation and 12.4 million DKr for an on-shore installation, Svenson, 1997.
Table 3-8 Economic assumptions.
Economic parametersInterest rate, r, (% p.a.)Life time of turbine, L, (years)
520
14 Ris0-R-1OOO(EN)
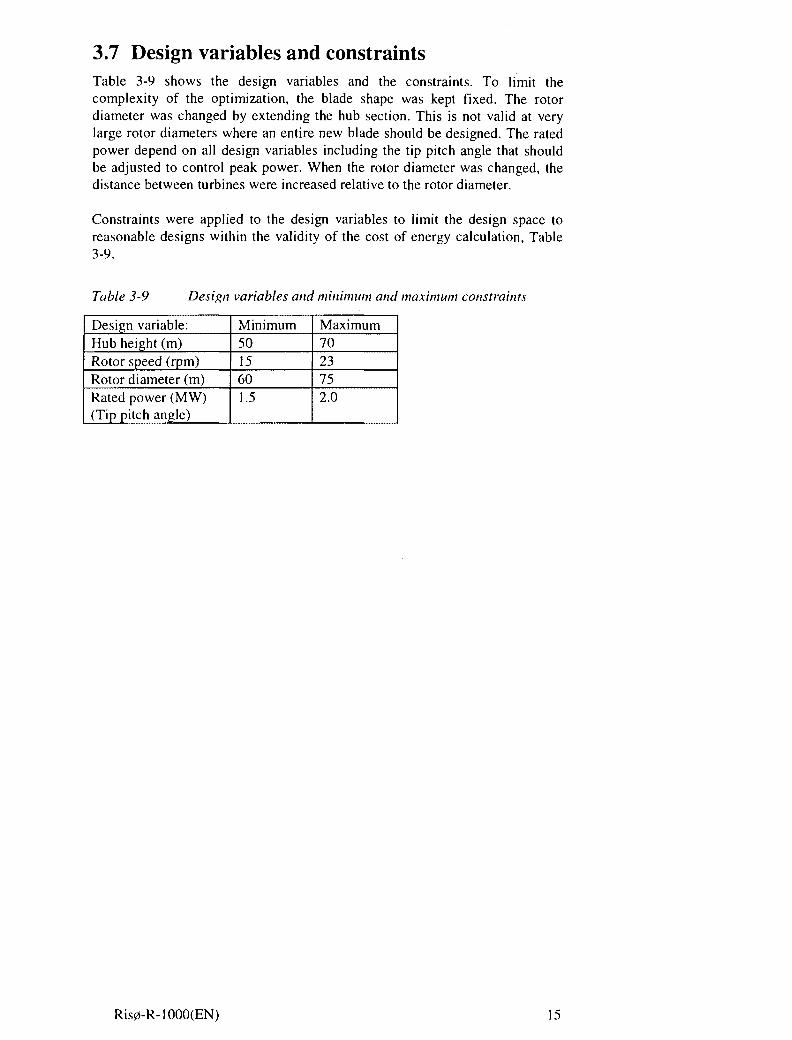
3.7 Design variables and constraintsTable 3-9 shows the design variables and the constraints. To limit thecomplexity of the optimization, the blade shape was kept fixed. The rotordiameter was changed by extending the hub section. This is not valid at verylarge rotor diameters where an entire new blade should be designed. The ratedpower depend on all design variables including the tip pitch angle that shouldbe adjusted to control peak power. When the rotor diameter was changed, thedistance between turbines were increased relative to the rotor diameter.
Constraints were applied to the design variables to limit the design space toreasonable designs within the validity of the cost of energy calculation, Table3-9.
Table 3-9 Design variables and minimum and maximum constraints
Design variable:Hub height (m)Rotor speed (rpm)Rotor diameter (m)Rated power (MW)(Tip pitch angle)
Minimum5015601.5
Maximum7023752.0
Ris0-R-1OOO(EN) 15
4 Results
First, the design loads were calculated for the reference wind turbine in thenormal flat terrain on-shore stand-alone site and in the 5D/5D off-shore windfarm site to investigate the change in loads for the differences in the windclimate and for the wind farm operation. Next, the reference wind turbine wasoptimized for both sites and design variables and main results were comparedwith the reference wind turbine at the respective sites. A sensitivity study wascarried out to investigate the importance of the design variables and thesensitivity of the optimization results to some of the assumptions. Finally, anoptimization was carried out for the 5D/14D off-shore wind farm.
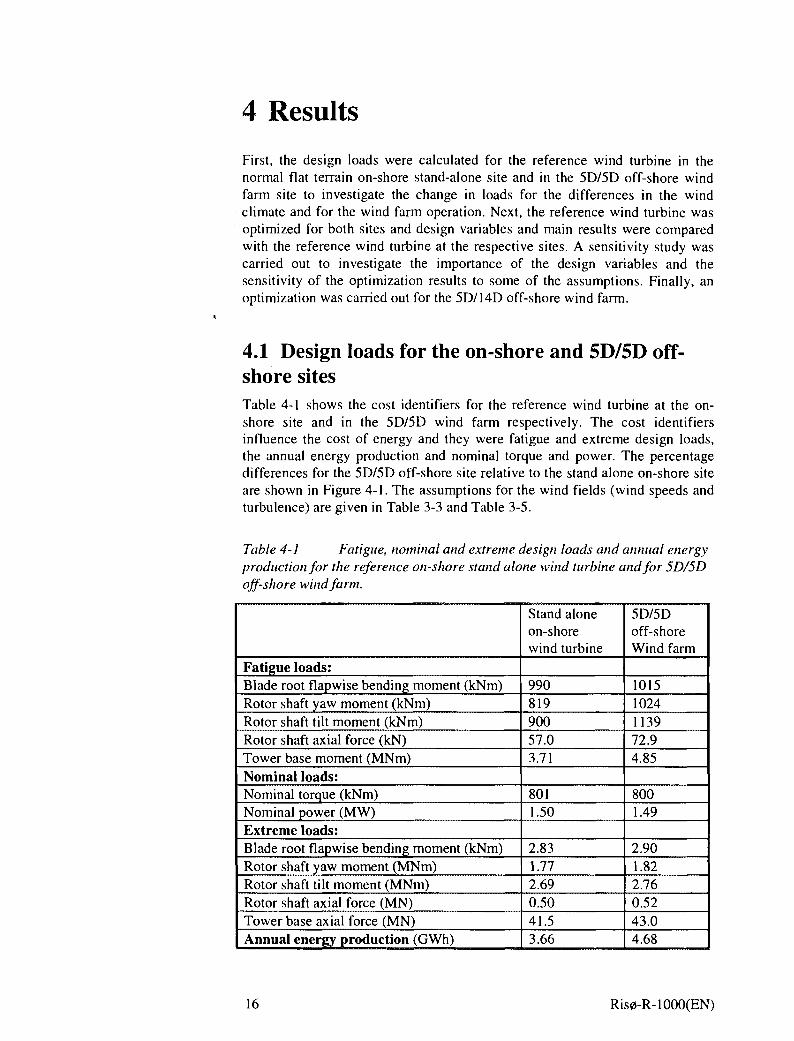
4.1 Design loads for the on-shore and 5D/5D off-shore sitesTable 4-1 shows the cost identifiers for the reference wind turbine at the on-shore site and in the 5D/5D wind farm respectively. The cost identifiersinfluence the cost of energy and they were fatigue and extreme design loads,the annual energy production and nominal torque and power. The percentagedifferences for the 5D/5D off-shore site relative to the stand alone on-shore siteare shown in Figure 4-1. The assumptions for the wind fields (wind speeds andturbulence) are given in Table 3-3 and Table 3-5.
Table 4-1 Fatigue, nominal and extreme design loads and annual energyproduction for the reference on-shore stand alone wind turbine and for 5D/5Doff-shore wind farm.
Fatigue loads:Blade root flapwise bending moment (kNm)Rotor shaft yaw moment (kNm)Rotor shaft tilt moment (kNm)Rotor shaft axial force (kN)Tower base moment (MNm)Nominal loads:Nominal torque (kNm)Nominal power (MW)Extreme loads:Blade root flapwise bending moment (kNm)Rotor shaft yaw moment (MNm)Rotor shaft tilt moment (MNm)Rotor shaft axial force (MN)Tower base axial force (MN)Annual energy production (GWh)
Stand aloneon-shorewind turbine
99081990057.03.71
8011.50
2.831.772.690.5041.53.66
5D/5Doff-shoreWind farm
10151024113972.94.85
8001.49
2.901.822.760.5243.04.68
16 Ris0-R-1OOO(EN)
3
Annual energyproduction
Extreme tower baseaxial force
Extreme rotor shaftaxial force
Extreme rotor shaft tiltmoment
Extreme rotor shaftyaw moment
Nominal power
Nominal torque
Fatigue tower basemoment
Fatigue rotor shaftaxial force
Fatigue rotor shaft tiltmoment
Fatigue rotor shaftyaw moment
Fatigue blade rootflapwise moment
10 15 20
Percentage change
25 30 35
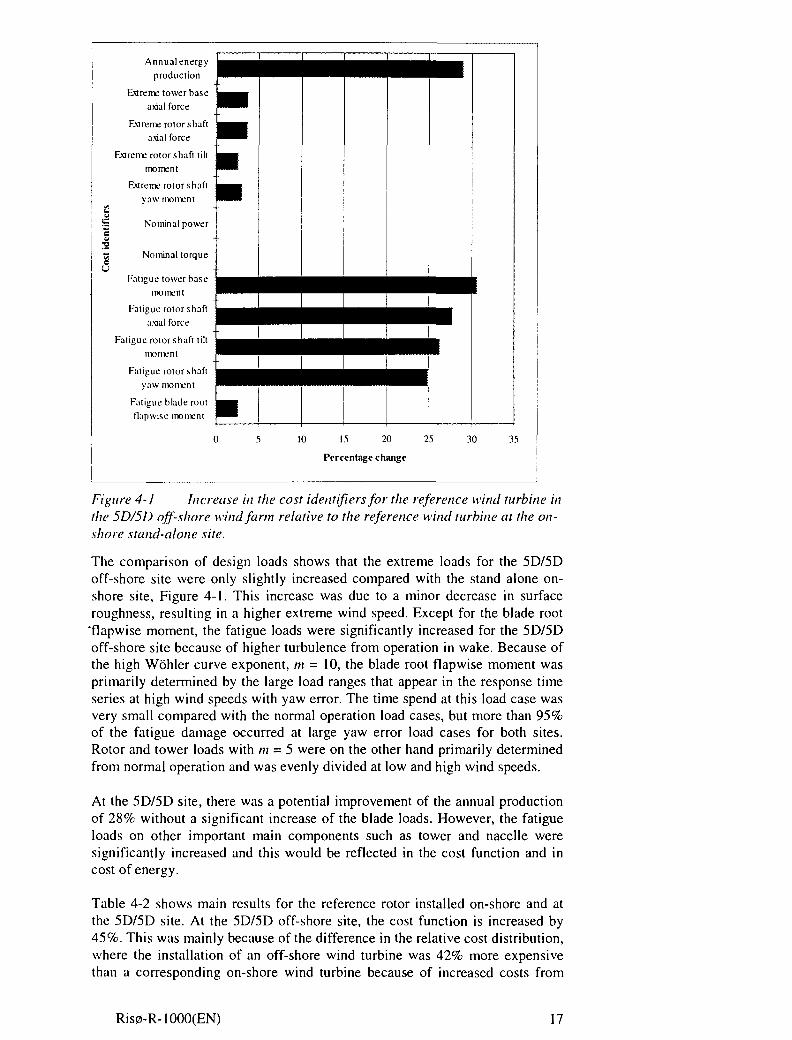
Figure 4-1 Increase in the cost identifiers for the reference wind turbine inthe 5D/5D off-shore wind farm relative to the reference wind turbine at the on-shore stand-alone site.
The comparison of design loads shows that the extreme loads for the 5D/5Doff-shore site were only slightly increased compared with the stand alone on-shore site, Figure 4-1. This increase was due to a minor decrease in surfaceroughness, resulting in a higher extreme wind speed. Except for the blade root
•flapwise moment, the fatigue loads were significantly increased for the 5D/5Doff-shore site because of higher turbulence from operation in wake. Because ofthe high Wohler curve exponent, m = 10, the blade root flapwise moment wasprimarily determined by the large load ranges that appear in the response timeseries at high wind speeds with yaw error. The time spend at this load case wasvery small compared with the normal operation load cases, but more than 95%of the fatigue damage occurred at large yaw error load cases for both sites.Rotor and tower loads with m = 5 were on the other hand primarily determinedfrom normal operation and was evenly divided at low and high wind speeds.
At the 5D/5D site, there was a potential improvement of the annual productionof 28% without a significant increase of the blade loads. However, the fatigueloads on other important main components such as tower and nacelle weresignificantly increased and this would be reflected in the cost function and incost of energy.
Table 4-2 shows main results for the reference rotor installed on-shore and atthe 5D/5D site. At the 5D/5D off-shore site, the cost function is increased by45%. This was mainly because of the difference in the relative cost distribution,where the installation of an off-shore wind turbine was 42% more expensivethan a corresponding on-shore wind turbine because of increased costs from
Ris0-R-1OOO(EN) 17
foundation and grid connection. The remaining difference from 42% to 45%was because of the increase in loads. Even though the fatigue loads weresignificantly increased, this is only marginally seen on the cost function.
The increase in annual energy production on 28% for the 5D/5D site did notcounterbalance the increase in the cost function on 45% and the cost of energywas increased by 13% to 0.31 DKr/kWh for the reference wind turbine at the5D/5D off-shore wind farm.
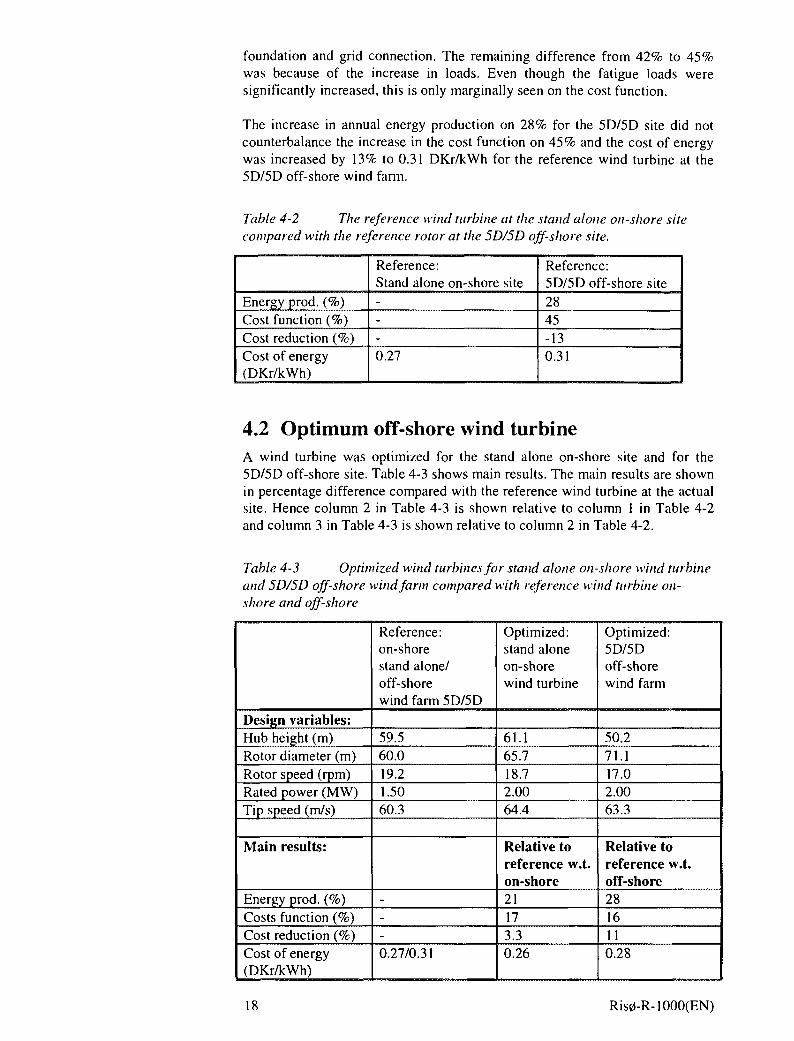
Table 4-2 The reference wind turbine at the stand alone on-shore sitecompared with the reference rotor at the 5D/5D off-shore site.
Energy prod. (%)Cost function (%)Cost reduction (%)Cost of energy(DKr/kWh)
Reference:Stand alone on-shore site---0.27
Reference:5D/5D off-shore site2845-130.31
4.2 Optimum off-shore wind turbineA wind turbine was optimized for the stand alone on-shore site and for the5D/5D off-shore site. Table 4-3 shows main results. The main results are shownin percentage difference compared with the reference wind turbine at the actualsite. Hence column 2 in Table 4-3 is shown relative to column 1 in Table 4-2and column 3 in Table 4-3 is shown relative to column 2 in Table 4-2.
Table 4-3 Optimized wind turbines for stand alone on-shore wind turbineand 5D/5D off-shore wind farm compared with reference wind turbine on-shore and off-shore
Design variables:Hub height (m)Rotor diameter (m)Rotor speed (rpm)Rated power (MW)Tip speed (m/s)
Main results:
Energy prod. (%)Costs function (%)Cost reduction (%)Cost of energy(DKr/kWh)
Reference:on-shorestand alone/off-shorewind farm 5D/5D
59.560.019.21.5060.3
---0.27/0.31
Optimized:stand aloneon-shorewind turbine
61.165.718.72.0064.4
Relative toreference w.t.on-shore21173.30.26
Optimized:5D/5Doff-shorewind farm
50.271.117.02.0063.3
Relative toreference w.t.off-shore2816110.28
18 Ris0-R-1OOO(EN)
For the on-shore wind turbine, the optimization resulted in a cost reduction of3.3%. The annual energy production was increased by 21% and this wasfollowed by an increase in the cost function of 17%. The increase in annualenergy production was achieved by increasing the swept area and the ratedpower at the expense of the rotor speed. The tip speed was increased eventhough the rotor speed was reduced and this helped to maintain maximumaerodynamic efficiency at a suitable wind speed. The hub height was slightlyincreased.
The increase in swept area involved more expensive rotor blades because ofincreased loading on the blade sections. In addition, the loading on the rotoraffected the costs of tower and foundation. The increase in rated power and thereduction of rotational speed increased the costs of the generator and the gearbox because of a higher torque. The decrease in rotor speed helped to limit therated power. The gain in annual energy production by a further increase inswept area could not counterbalance the increase in the cost function.
The optimization of the wind turbine for the 5D/5D off-shore site showed a costreduction of 11 %. This result was obtained by an increase in the annual energyproduction of 28% whereas the cost function increased 16%. Again the sweptarea and the rated power was increased. Rotational speed and hub height werereduced.
For the optimized wind turbine at the 5D/5D off-shore site, a cost reduction of11% was achieved from 0.31 DKr/kW to 0.28 DKr/kW. Compared with thestand alone on-shore optimization result on 3.3%, the off-shore optimizationresult was promising. The result may be explained by the difference in windclimate and the difference in cost function between on-shore and off-shore.This is used by the optimization algorithm to result in different overall windturbine designs where the reduction of the hub height for the off-shoreoptimization is important.
Lower hub height implies lower costs of tower and foundation but also lowerannual energy production. However, because of the lower surface roughness thevertical wind gradient is less and the annual energy production was onlymarginally reduced. At the same time, the increased loads made tower andfoundation relatively more expensive and it became more beneficial to lowerthe hub height. The reduction in annual energy production stemming from thereduction in hub height was counterbalanced by a reduction in tower andfoundation costs.
For the on-shore stand alone wind turbine the cost of the wind turbine itself was83% of the total cost function. For the 5D/5D off-shore wind turbine, the windturbine cost reduced to 59% of the cost function because of the high foundationand grid connection costs. An increase in wind turbine costs at the off-shoresite was therefore relatively less important for the total cost function and ittherefore became feasible to increase the swept area significantly.
For both the on-shore and off-shore optimizations, the rotor diameter wasincreased at the expense of lower rotational speed. Tip speed was slightlyincreased. Because of the constraint on rated power to below 2.0 MW, anincrease in swept area was more beneficial than an increase in the rotationalspeed. By the present selection of design variables, the specific loading of therotor ended around 500 W/m2 for the off-shore optimization and 590 W/m2 for
Ris0-R-1OOO(EN) 19

the on-shore optimization. Optimization of the blade shapes would reduce thespecific loading, since more slender blades would allow the swept area to beincreased even more.
In addition to the blade shape, further cost reductions should result from: Moredesign variables, new airfoils, stronger materials allowing higher stresses andstrains or more advanced-power control.
The cost distribution for the optimized 5D/5D off-shore wind turbine iscompared with the cost distribution for the reference rotor in Figure 4-2. Exceptfor transport, assembly, grid connection and controller that are independent ofthe cost identifiers, all main component costs have increased. The main gearand generator costs were increased because of the increase in torque fromhigher rated power and reduced rotational speed. The increase in swept areaadded to the cost of the rotor blades but also to the cost of the tower and thefoundation. Whereas rotor blade and tower costs were increased, the foundationcosts ended at approximately the same level because of the reduction in hubheight.
The reported reductions in cost of energy are biased from leaving outmaintenance and other on-going costs. These are likely to be higher off-shorethan on-shore. Assuming that the off-shore maintenance costs are 25% of theannual pay-back from manufacture and installation the cost reduction would bereduced to 7%.
Transport
Assembly
Grid connection
Foundation
Brake system
Tower
Controller
Yaw system
Nacelle
Generator
Main gear
Main shaft
Hub
Blades
—
m~*gsm
p:i:r
1[
i
• Optimized 5D/5D off-shore
3Reference off-shore
1
1
6 8 10 12
Percentage distribution
14 16 18
Figure 4-2 Relative cost for main components for optimized 5D/5D off-shore wind turbine compared with the reference wind turbine at the 5D/5D off-shore site.
20 Ris0-R-1OOO(EN)
4.3 Sensitivity analysisA sensitivity analysis was carried out to investigate the importance of theincluded design variables and to find the influence on the optimization resultsfor some of the economic assumptions and for the design loads.
Table 4-4 shows optimizations at different fixed hub heights compared with theoptimum hub height. The hub height was fixed whereas the remaining designvariables were optimized. When the hub height was reduced, the rated powerincreased together with the swept area. The rotational speed was increased untilthe limit on the rated power was achieved. After this, the rotational speed wasreduced to limit rated power. The cost reduction varied between 5.8% and 11 %.
Table 4-5 shows optimizations at different rotor diameters compared with theoptimum rotor diameter. The rotational speed was reduced when the swept areawas increased to limit rated power. The cost reduction varied between 5.8%and 11%.
Table 4-6 shows optimizations at different rotor speeds compared with theoptimum rotor speed. The swept area was increased when the rotor speed wasreduced. At low rotor speed the swept area needed to be increased to maintainhigh rated power. However, this increased the cost function because ofincreases in loads. At high rotor speeds, the swept area had to be reduced tolimit rated power. However, this decreased annual production. The optimumwas in between and was very sensitive to the rotor speed. The cost reductionvaried between -0.6% and 11%.
Table 4-7 shows optimizations at different rated powers compared with theoptimum rated power. The swept area was increased when the rated power wasincreased and rated power was adjusted by the rotor speed. The cost reductionvaried between 1.8% and 11%.
The sensitivity of the cost of energy to variations in the design variables wassummarized in Figure 4-3. The difference in cost reduction was within -0.6% to12% for variations up to 30% in the value of the design variables.
The sensitivity of cost of energy to swept area was significant and in all casesof reduced cost of energy, the swept area was increased. The sensitivity to ratedpower was also significant since the swept area can hardly be increased withoutincreasing rated power. This could only be done by reducing rotational speed,but cost was reduced more by increasing rated power. The variation withrotational speed was large and the upper limit on the rated power oftendetermined the allowable rotor speed. The sensitivity to hub height was minorand it appeared that the hub height should be further reduced. However, thevertical wind profile becomes non-linear towards the surface which willslightly increase fatigue loads. Furthermore the clearance between the bladesand the surface becomes a lower constraints.
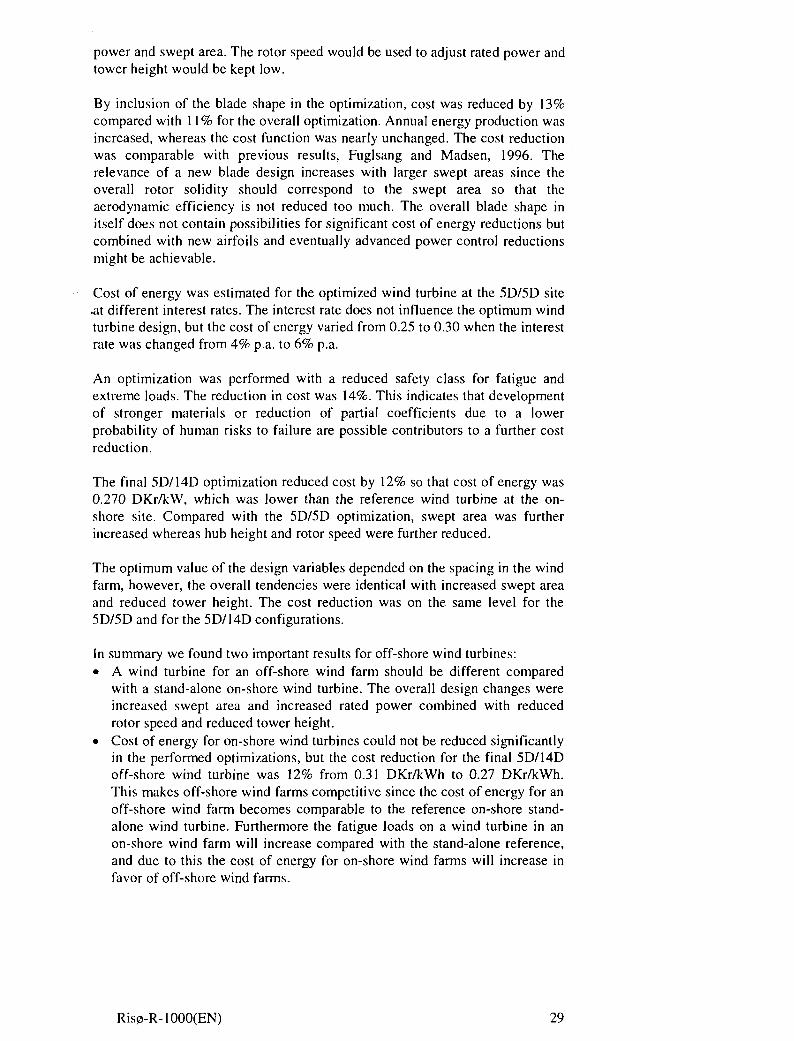
The sensitivity study of the overall design variables indicated that a further costreduction could be achieved by a further increase in rated power and sweptarea. The rotor speed would be used to adjust rated power and tower heightwould be kept low.
Ris0-R-1OOO(EN) 21

Table 4-4 Results for optimizations at different hub heights.
Design variables:Hub height (m)Rotor diameter (m)Rotor speed (rpm)Rated power (MW)Main results:Energy prod. (%)Cost function (%)Cost reduction (%)Cost of energy(DKr/kWh)
Reference:off-shore
59.560.019.21.50
---0.31
Optimized
50.271.117.02.00
2816110.28
OptimizedH = 55
5567.018.32.00
23138.80.28
Optimized:H = 60m
60.070.216.01.87
21155.80.29
Table 4-5 Results for optimizations at different rotor diameters.
Design variables:Hub height (m)Rotor diameter (m)Rotor speed (rpm)Rated power (MW)Main results:Energy prod. (%)Cost function (%)Cost reduction (%)Cost of energy(DKr/kWh)
Reference:off-shore
59.560.019.21.50
---0.31
Optimized:R = 60m
58.360.020.82.00
114.96.00.29
Optimized:R = 65m
58.265.019.02.00
20118.40.29
Optimized
50.271.117.02.00
2816110.28
Table 4-6 Results for optimizations at different rotor speed
Design variables:Hub height (m)Rotor diameter (m)Rotor speed (rpm)Rated power (MW)Main results:Energy prod. (%)Cost function (%)Cost reduction (%)Cost of energy(DKr/kWh)
Reference:off-shore
59.560.019.21.50
---0.31
Optimized:0 = 1 5 rpm
59.175151.93
33311.50.30
Optimized
50.271.117.02.00
2816110.28
Optimized:O = 23 rpm
60.060.023.02.00
4.24.9-0.60.31
22 Ris0-R-1OOO(EN)
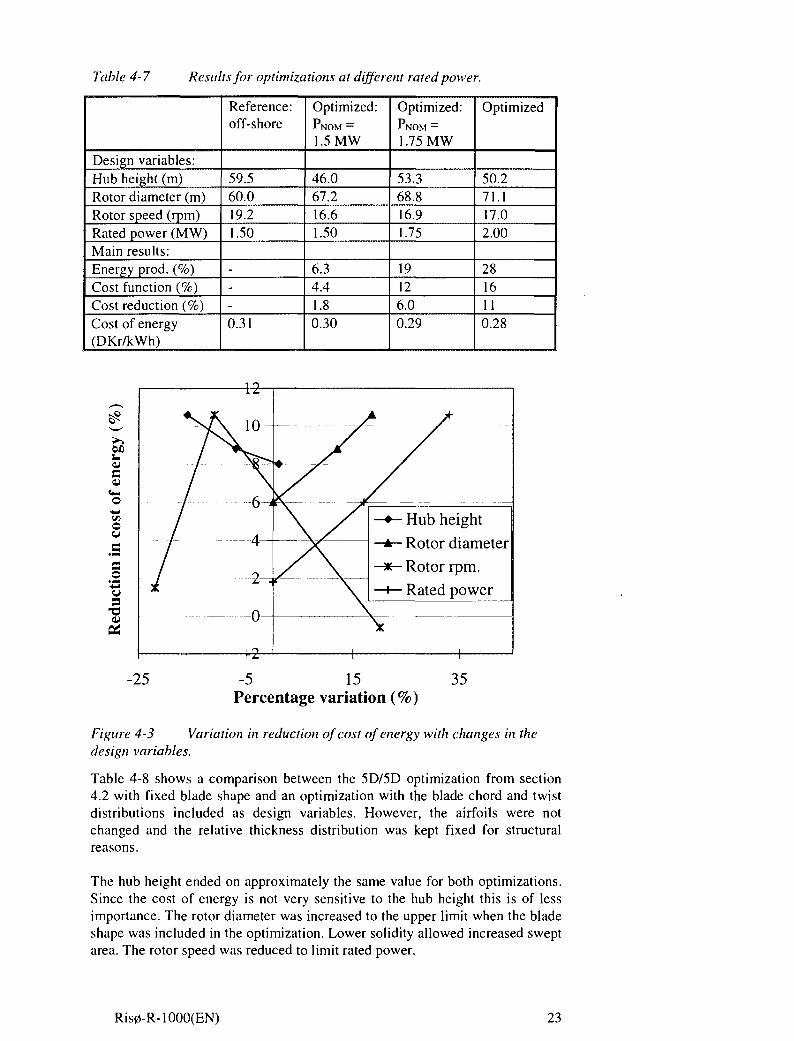
Table 4-7 Results for optimizations at different rated power.
Design variables:Hub height (m)Rotor diameter (m)Rotor speed (rpm)Rated power (MW)Main results:Energy prod. (%)Cost function (%)Cost reduction (%)Cost of energy(DKr/kWh)
Reference:off-shore
59.560.019.21.50
---0.31
Optimized:PNOM =
1.5 MW
46.067.216.61.50
6.34.41.80.30
Optimized:PNOM =1.75 MW
53.368.816.91.75
19126.00.29
Optimized
50.271.117.02.00
2816110.28
£
G
o
c+3
usu
Hub heightRotor diameterRotor rpm.Rated power
-25 -5 15Percentage variation (%)
35
Figure 4-3 Variation in reduction of cost of energy with changes in thedesign variables.
Table 4-8 shows a comparison between the 5D/5D optimization from section4.2 with fixed blade shape and an optimization with the blade chord and twistdistributions included as design variables. However, the airfoils were notchanged and the relative thickness distribution was kept fixed for structuralreasons.
The hub height ended on approximately the same value for both optimizations.Since the cost of energy is not very sensitive to the hub height this is of lessimportance. The rotor diameter was increased to the upper limit when the bladeshape was included in the optimization. Lower solidity allowed increased sweptarea. The rotor speed was reduced to limit rated power.
Ris0-R-1OOO(EN) 23

To obtain high aerodynamic efficiency at low wind speeds above maximumaerodynamic efficiency, the low solidity should be combined with higher rotorspeed. This was not possible for the optimization result because of the limit onrated power. However, high aerodynamic efficiency is not necessarilyassociated with low cost of energy. In this case, the increase in swept area wasmore beneficial to reduction in cost of energy compared with increasedaerodynamic efficiency.
By inclusion of the blade shape in the optimization, cost was reduced by 13%compared with 11% for the overall optimization. Annual energy production wasincreased, whereas the cost function was nearly unchanged. The cost reductionwas comparable with previous results, Fuglsang and Madsen, 1996. Therelevance of a new blade design increases with larger swept areas since theoverall rotor solidity should correspond to the swept area so that theaerodynamic efficiency is not reduced too much. The overall blade shape initself does not contain possibilities for significant cost of energy reductions butcombined with new airfoils and eventually advanced power control reductionsmight be achievable.
Table 4-8 Results for optimizations with fixed/free blade design.
Design variables:Hub height (m)Rotor diameter (m)Rotor speed (rpm)Rated power (MW)Main results:Energy prod. (%)Cost function (%)Cost reduction (%)Cost of energy(DKr/kWh)
Reference:off-shore
59.560.019.21.50
---0.31
OptimizedLM 29.2 blade
50.271.117.02.00
2816110.28
OptimizedNew blade
50.674.017.22.00
3216130.26
Table 4-9 shows the cost of energy for the 5D/5D off-shore optimization atdifferent interest rates. The optimum cost reduction does not depend on theannuity factor, so the calculation interest rate did not influence the overalldesign variables for the optimum rotor. However, together with the life-time,the interest rate determined the cost of energy through the annuity factor that isused to convert the optimum ratio of annual energy production to cost functioninto cost reduction and reduction of cost of energy.
When the interest rate was changed from 4% p.a. to 6% p.a., the cost of energyvaried from 0.25 to 0.30.
24 Ris0-R-1OOO(EN)
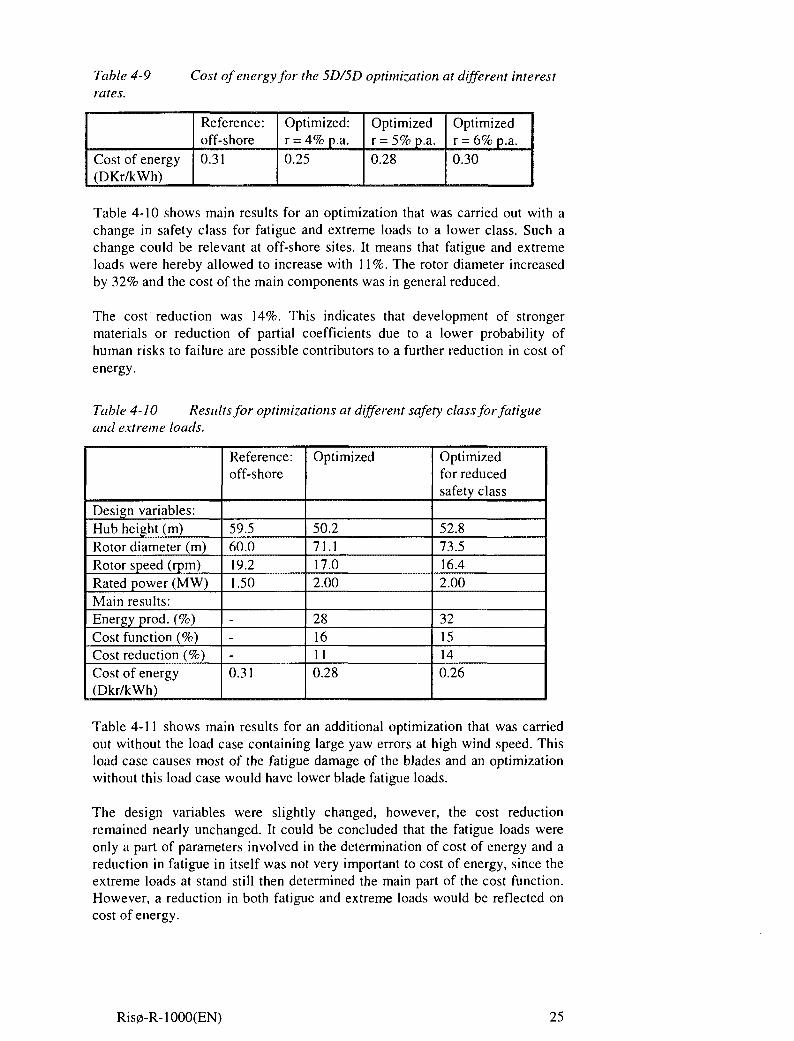
Table 4-9rates.
Cost of energy for the 5D/5D optimization at different interest
Cost of energy(DKr/kWh)
Reference:off-shore0.31
Optimized:r = 4%p.a.0.25
Optimizedr = 5% p.a.0.28
Optimizedr = 6% p.a.0.30
Table 4-10 shows main results for an optimization that was carried out with achange in safety class for fatigue and extreme loads to a lower class. Such achange could be relevant at off-shore sites. It means that fatigue and extremeloads were hereby allowed to increase with 11%. The rotor diameter increasedby 32% and the cost of the main components was in general reduced.
The cost reduction was 14%. This indicates that development of strongermaterials or reduction of partial coefficients due to a lower probability ofhuman risks to failure are possible contributors to a further reduction in cost ofenergy.
Table 4-10 Results for optimizations at different safety class for fatigueand extreme loads.
Design variables:Hub height (m)Rotor diameter (m)Rotor speed (rpm)Rated power (MW)Main results:Energy prod. (%)Cost function (%)Cost reduction (%)Cost of energy(Dkr/kWh)
Reference:off-shore
59.560.019.21.50
---0.31
Optimized
50.271.117.02.00
2816110.28
Optimizedfor reducedsafety class
52.873.516.42.00
3215140.26
Table 4-11 shows main results for an additional optimization that was carriedout without the load case containing large yaw errors at high wind speed. Thisload case causes most of the fatigue damage of the blades and an optimizationwithout this load case would have lower blade fatigue loads.
The design variables were slightly changed, however, the cost reductionremained nearly unchanged. It could be concluded that the fatigue loads wereonly a part of parameters involved in the determination of cost of energy and areduction in fatigue in itself was not very important to cost of energy, since theextreme loads at stand still then determined the main part of the cost function.However, a reduction in both fatigue and extreme loads would be reflected oncost of energy.
Ris0-R-1OOO(EN) 25
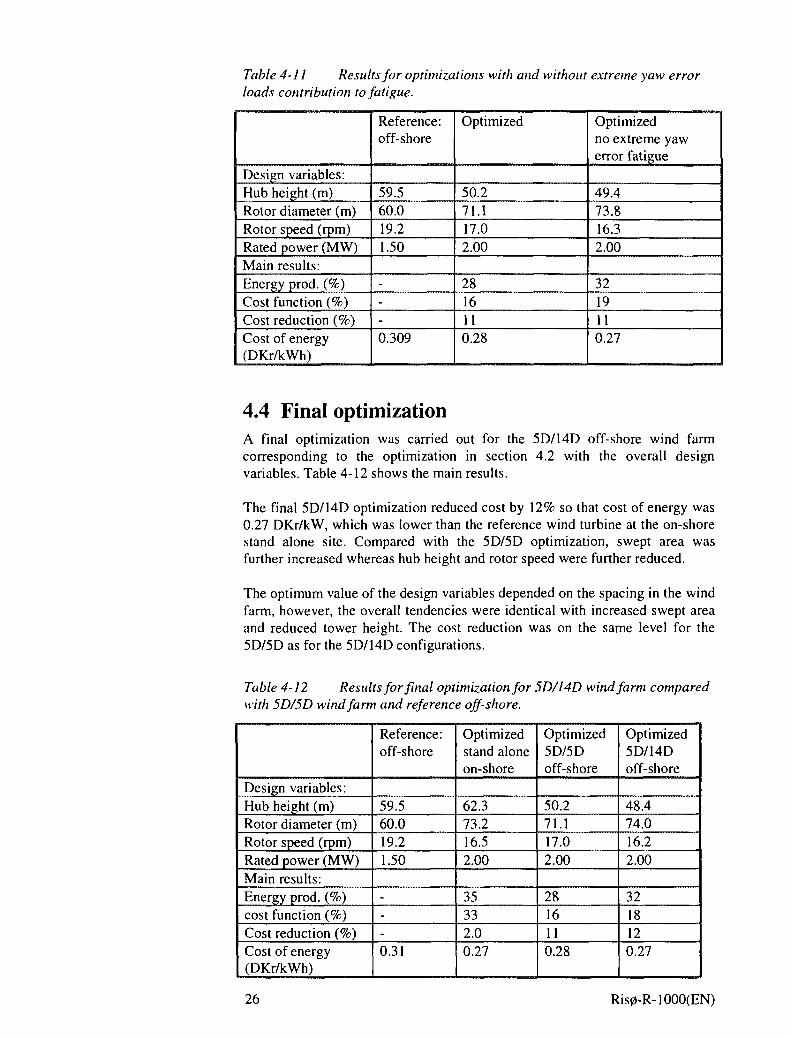
Table 4-11 Results for optimizations with and without extreme yaw errorloads contribution to fatigue.
Design variables:Hub height (m)Rotor diameter (m)Rotor speed (rpm)Rated power (MW)Main results:Energy prod. (%)Cost function (%)Cost reduction (%)Cost of energy(DKr/kWh)
Reference:off-shore
59.560.019.21.50
---0.309
Optimized
50.271.117.02.00
2816110.28
Optimizedno extreme yawerror fatigue
49.473.816.32.00
3219110.27
4.4 Final optimizationA final optimization was carried out for the 5D/14D off-shore wind farmcorresponding to the optimization in section 4.2 with the overall designvariables. Table 4-12 shows the main results.
The final 5D/14D optimization reduced cost by 12% so that cost of energy was0.27 DKr/kW, which was lower than the reference wind turbine at the on-shorestand alone site. Compared with the 5D/5D optimization, swept area wasfurther increased whereas hub height and rotor speed were further reduced.
The optimum value of the design variables depended on the spacing in the windfarm, however, the overall tendencies were identical with increased swept areaand reduced tower height. The cost reduction was on the same level for the5D/5D as for the 5D/14D configurations.
Table 4-12 Results for final optimization for 5D/14D wind farm comparedwith 5D/5D wind farm and reference off-shore.
Design variables:Hub height (m)Rotor diameter (m)Rotor speed (rpm)Rated power (MW)Main results:Energy prod. (%)cost function (%)Cost reduction (%)Cost of energy(DKr/kWh)
Reference:off-shore
59.560.019.21.50
---0.31
Optimizedstand aloneon-shore
62.373.216.52.00
35332.00.27
Optimized5D/5Doff-shore
50.271.117.02.00
2816110.28
Optimized5D/14Doff-shore
48.474.016.22.00
3218120.27
26 Ris0-R-1OOO(EN)
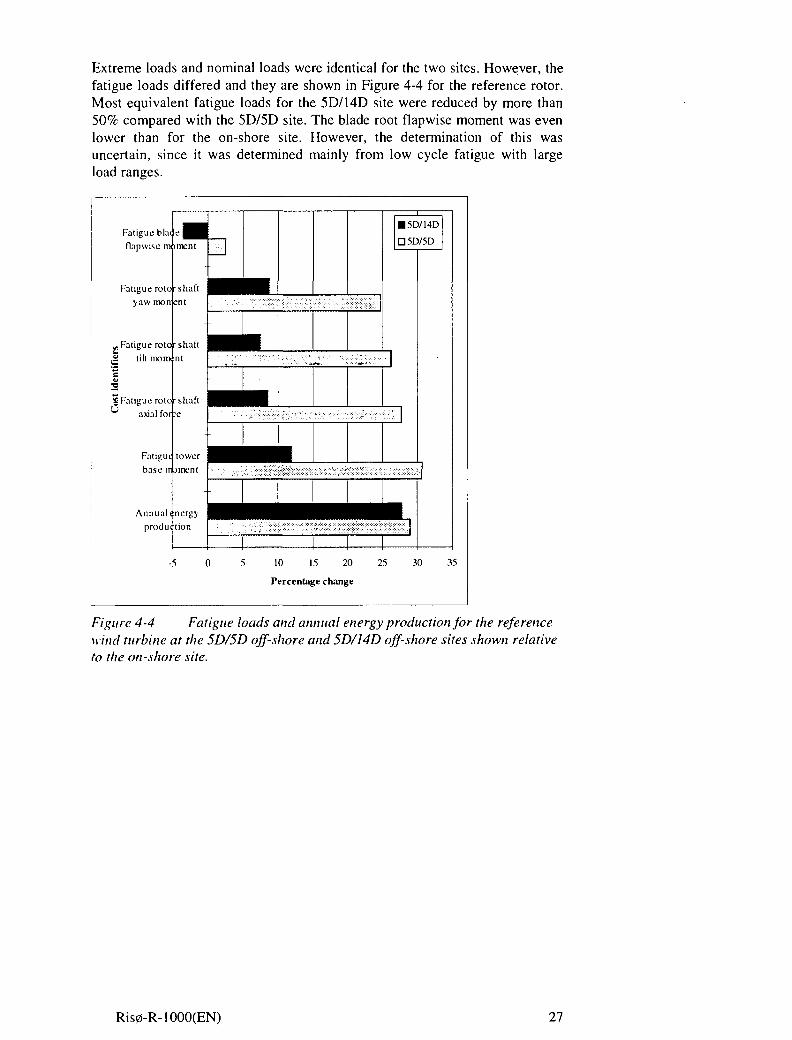
Extreme loads and nominal loads were identical for the two sites. However, thefatigue loads differed and they are shown in Figure 4-4 for the reference rotor.Most equivalent fatigue loads for the 5D/14D site were reduced by more than50% compared with the 5D/5D site. The blade root flapwise moment was evenlower than for the on-shore site. However, the determination of this wasuncertain, since it was determined mainly from low cycle fatigue with largeload ranges.
Fatigue blueflapwise m
Fatigue rotoyaw inon
„, Fatigue roto£ tilt mom
"cT3
g Fatigue rotoaxial foi
Fatiguibase IT
Annual tprodui
e H^B__iment
-shaft H Hment F
-shaft ^ ^ Hnt
-shaft
m
• 5D/14D
D5D/5D
mtower ^ ^ ^ ^ ^ ^ ^ ^ |•
\nergytion H •1 •1
X'X;"-,-:- ":->:•:-:-:
-5 0 5 10 15 20 25 30 35
Percentage change
Figure 4-4 Fatigue loads and annual energy production for the referencewind turbine at the 5D/5D off-shore and 5D/14D off-shore sites shown relativeto the on-shore site.
Ris0-R-1OOO(EN) 27
5 ConclusionsThis report contains a preliminary investigation of site specific design of windturbines for off-shore wind farm applications. The results were based on adesign tool for wind turbines that involve numerical optimization andaeroelastic calculations of response, Fuglsang and Thomsen, 1998.Optimizations were carried out to find the optimum overall wind turbine designfor minimum cost of energy.
Two different wind farm layouts were considered:1. A simplified 5D/5D layout with spacing of turbines of 5 rotor diameters
(5D) and spacing between rows on 5D.2. The preliminary 5D/14D wind farm layout to be used at R0dsand has
spacing between turbines: 5D and spacing between rows: 14D.Both wind farm layouts were compared with a traditional on-shore stand-alonesite.
A comparison of the design loads for the on-shore site and the 5D/5D off-shoresite showed that at the off-shore site, there was a potential improvement of theannual production of 28% without a significant increase of the blade loads.However, the fatigue loads on other important main components such as thetower and nacelle were significantly increased and this would be reflected onthe cost function and on cost of energy. The increase in annual energyproduction did not counterbalance the increase in the cost function and cost ofenergy was increased by 13% to 0.31 DKr/kWh for the reference wind turbineat the 5D/5D off-shore wind farm.
For the optimized wind turbine at the 5D/5D off-shore site, a cost reduction of11% was achieved from 0.31 DKr/kW to 0.28 DKr/kW. Compared with thestand alone on-shore optimization result on 3.3%, the off-shore optimizationresult was promising. The result may be explained by the difference in windclimate and the difference in cost function between on-shore and off-shore.This is used by the optimization algorithm to result in different overall windturbine designs where the reduction of the hub height for the off-shoreoptimization is important. The calculation of cost of energy did not include on-going costs from maintenance and this would reduce the obtained costreduction.
For both the on-shore and off-shore optimizations, the rotor diameter wasincreased at the expense of lower rotational speed. Tip-speed was slightlyincreased. Because of the constraint on rated power to below 2.0 MW, anincrease in swept area was more beneficial than an increase in the rotationalspeed. By the present selection of design variables, the specific rotor loadingended around 500 W/m2 for the off-shore optimization and 590 W/m2 for theon-shore optimization. Optimization of the blade shapes would reduce thespecific loading, since more slender blades would allow the swept area to beincreased even more.
The sensitivity study of the overall design variables indicated that a furtherreduction of cost of energy could be achieved by a further increase in rated
28 Ris0-R-1OOO(EN)
power and swept area. The rotor speed would be used to adjust rated power andtower height would be kept low.
By inclusion of the blade shape in the optimization, cost was reduced by 13%compared with 11% for the overall optimization. Annual energy production wasincreased, whereas the cost function was nearly unchanged. The cost reductionwas comparable with previous results, Fuglsang and Madsen, 1996. Therelevance of a new blade design increases with larger swept areas since theoverall rotor solidity should correspond to the swept area so that theaerodynamic efficiency is not reduced too much. The overall blade shape initself does not contain possibilities for significant cost of energy reductions butcombined with new airfoils and eventually advanced power control reductionsmight be achievable.
Cost of energy was estimated for the optimized wind turbine at the 5D/5D site•at different interest rates. The interest rate does not influence the optimum windturbine design, but the cost of energy varied from 0.25 to 0.30 when the interestrate was changed from 4% p.a. to 6% p.a.
An optimization was performed with a reduced safety class for fatigue andextreme loads. The reduction in cost was 14%. This indicates that developmentof stronger materials or reduction of partial coefficients due to a lowerprobability of human risks to failure are possible contributors to a further costreduction.
The final 5D/14D optimization reduced cost by 12% so that cost of energy was0.270 DKr/kW, which was lower than the reference wind turbine at the on-shore site. Compared with the 5D/5D optimization, swept area was furtherincreased whereas hub height and rotor speed were further reduced.
The optimum value of the design variables depended on the spacing in the windfarm, however, the overall tendencies were identical with increased swept areaand reduced tower height. The cost reduction was on the same level for the5D/5D and for the 5D/14D configurations.
In summary we found two important results for off-shore wind turbines:• A wind turbine for an off-shore wind farm should be different compared
with a stand-alone on-shore wind turbine. The overall design changes wereincreased swept area and increased rated power combined with reducedrotor speed and reduced tower height.
• Cost of energy for on-shore wind turbines could not be reduced significantlyin the performed optimizations, but the cost reduction for the final 5D/14Doff-shore wind turbine was 12% from 0.31 DKr/kWh to 0.27 DKr/kWh.This makes off-shore wind farms competitive since the cost of energy for anoff-shore wind farm becomes comparable to the reference on-shore stand-alone wind turbine. Furthermore the fatigue loads on a wind turbine in anon-shore wind farm will increase compared with the stand-alone reference,and due to this the cost of energy for on-shore wind farms will increase infavor of off-shore wind farms.
Ris0-R-1OOO(EN) 29

References
L. Bemhard (1997) Note to: Estimation of the Direction Dependent WindResource at R0dsand, Internal project note, Ris0 National Laboratory,Denmark.
Dansk Ingeni0rforening (1992) Danish Design Code for Wind TurbineConstructions, (In Danish), DS 472, Teknisk Forlag, Denmark.
S. Frandsen. (ed), L. Chacon, A. Crespo, P. Enevoldsen, R. Gomez-Elvira, J.Hernandez, J. H0jstrup, F. Manuel, K. Thomsen, P. S0rensen (1996) FinalReport on Measurements on and modeling of off-shore wind farms. Ris0-R-903(EN), Ris0 National Laboratory, Denmark.
P. Fuglsang and H.A. Madsen (1996), Numerical Optimization of WindTurbine Rotors. Proc. EUWEC'96, Goteborg, Sweden.
P. Fuglsang and K. Thomsen.(1998) Site Specific Design Optimization of WindTurbines. Proc. 17"' ASME Wind Energy Symposium, Reno, USA.
H. A. Madsen, P. Fuglsang, S. 0ye, C. H. Westergaard, M. Friedrich, L. Jensen(1995) Vingedesign EFP 95 Forprojekt - Aerodynamik. (In Danish) Ris0-I-931 (DA), Ris0 National Laboratory, Denmark.
J. Svenson (1997) Memo on Cost-optimising of offshore Wind turbines.Internal project note, ELKRAFT/SEAS, Denmark
K. Thomsen (1997) Design Load Basis for Optimization of Off-shore WindFarms. Internal project note, Ris0 National Laboratory, Denmark.
P. S. Veers (1988) Three-Dimensional Wind Simulation. Sandia ReportSAND88-0152.UC-261. Sandia National Laboratory, Albuquerque, NewMexico.
S. 0ye (1996) FLEX4 Simulation of Wind Turbine Dynamics. Proc. State ofthe Art of Aeroelastic Codes for Wind Turbine Calculations. 28"' Meeting ofExperts, International Energy Agency, Annex XI pp. 71-77. Ed. B.M. Pedersen,Technical University of Denmark, Denmark.
30 Ris0-R-1OOO(EN)
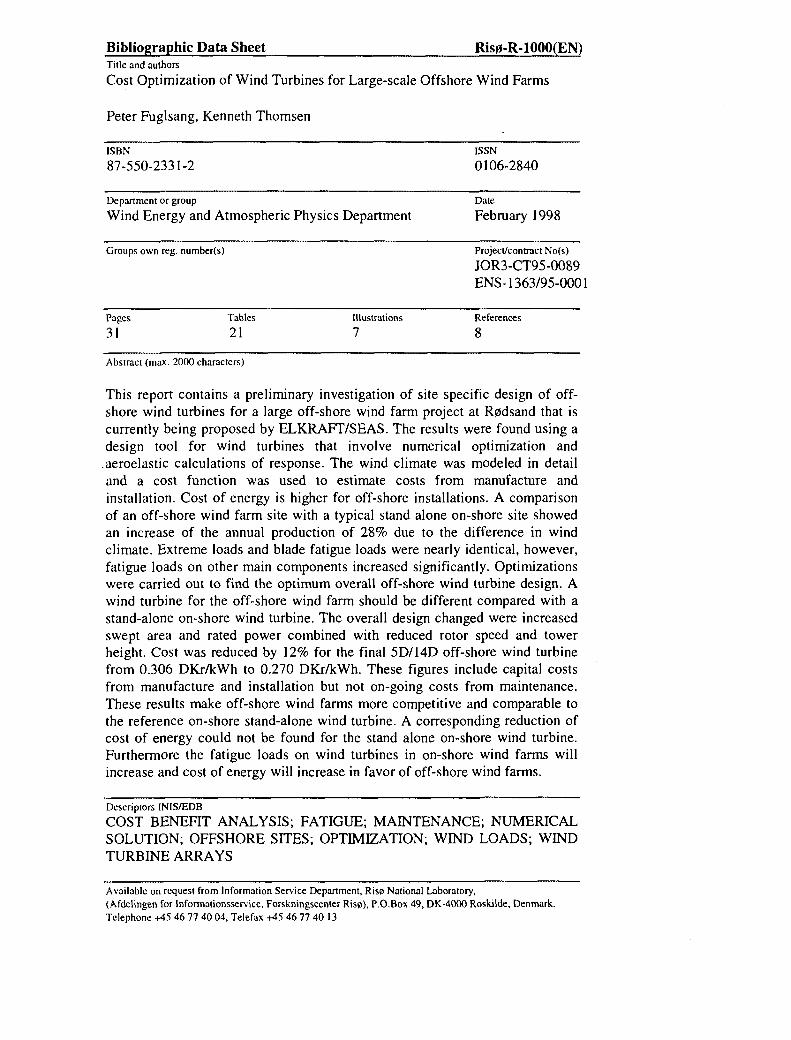
Bibliographic Data Sheet Ris0-R-1OOO(EN)Title and authors
Cost Optimization of Wind Turbines for Large-scale Offshore Wind Farms
Peter Fuglsang, Kenneth ThomsenISBN
87-550-2331-2
Department or group
Wind Energy and Atmospheric Physics Department
Groups own reg. number(s)
Pages Tables Illustrations
31 21 7
ISSN
0106-2840
Date
February 1998
Project/contract No(s)
JOR3-CT95-0089ENS-1363/95-0001
References
8
Abstract (max. 2000 characters)
This report contains a preliminary investigation of site specific design of off-shore wind turbines for a large off-shore wind farm project at R0dsand that iscurrently being proposed by ELKRAFT/SEAS. The results were found using adesign tool for wind turbines that involve numerical optimization and
.aeroelastic calculations of response. The wind climate was modeled in detailand a cost function was used to estimate costs from manufacture andinstallation. Cost of energy is higher for off-shore installations. A comparisonof an off-shore wind farm site with a typical stand alone on-shore site showedan increase of the annual production of 28% due to the difference in windclimate. Extreme loads and blade fatigue loads were nearly identical, however,fatigue loads on other main components increased significantly. Optimizationswere carried out to find the optimum overall off-shore wind turbine design. Awind turbine for the off-shore wind farm should be different compared with astand-alone on-shore wind turbine. The overall design changed were increasedswept area and rated power combined with reduced rotor speed and towerheight. Cost was reduced by 12% for the final 5D/14D off-shore wind turbinefrom 0.306 DKr/kWh to 0.270 DKr/kWh. These figures include capital costsfrom manufacture and installation but not on-going costs from maintenance.These results make off-shore wind farms more competitive and comparable tothe reference on-shore stand-alone wind turbine. A corresponding reduction ofcost of energy could not be found for the stand alone on-shore wind turbine.Furthermore the fatigue loads on wind turbines in on-shore wind farms willincrease and cost of energy will increase in favor of off-shore wind farms.
Descriptors INIS/EDB
COST BENEFIT ANALYSIS; FATIGUE; MAINTENANCE; NUMERICALSOLUTION; OFFSHORE SITES; OPTIMIZATION; WIND LOADS; WINDTURBINE ARRAYS
Available on request from Information Service Department, Ris0 National Laboratory,(Afdelingen for Infonnationsservice, Forskningscenter Ris0), P.O.Box 49, DK-4000 Roskilde, Denmark.Telephone +45 46 77 40 04, Telefax +45 46 77 40 13

Riso National Laboratory carries out research within science and technology,providing Danish society with new opportunities for technological development. Theresearch aims at strengthening Danish industry and reducing the adverse impact onthe environment of the industrial, energy and agricultural sectors.
Ristt advises government bodies on nuclear affairs.
This research is part of a range of Danish and international research programmes andsimilar collaborative ventures. The main emphasis is on basic research andparticipation in strategic collaborative research ventures and market driven tasks.
Research is carried^out within the following programme areas:
• Industrial materials• New functional materials• Optics and sensor systems• Plant production and circulation of matter• Systems analysis• Wind energy and atmospheric processes• Nuclear safety
Universities, research institutes, institutes of technology and businesses areimportant research partners to Risd.
A strong emphasis is placed on the education of young researchers through Ph.D.and post-doctoral programmes.
ISBNS7-550-2331-2ISSN 0106-2840
Copies of this publicationare available from
Riso National LaboratoryInformation Service DepartmentP.O. ISoks 49DK-4000 RoskildeDenmarkTelephone +45 4677 [email protected] 4677 4013Website www.risoe.dk