cost plus fixed fee (cpff) contract, v2.1 - princeton university
TRANSCRIPT
Discussion Paper 06: Utilisation of the UK’s Existing Airport Capacity
June 2014
An independent commission appointed by Government

Airports Commission 6th Floor Sanctuary Buildings 20 Great Smith Street London SW1P 3BT
Web: www.gov.uk/government/organisations/airports-commission Email: [email protected]
© Crown copyright 2014, except where otherwise stated
Copyright in the typographical arrangement rests with the Crown.
You may re-use this information (not including logos or third-party material) free of charge in any format or medium, under the terms of the Open Government Licence. To view this licence, visit www.nationalarchives.gov.uk/doc/open-government-licence/ or write to the Information Policy Team, The National Archives, Kew, London TW9 4DU, or e-mail: [email protected].
Where we have identified any third-party copyright information you will need to obtain permission from the copyright holders concerned.
3
Contents
Contents
Introduction 5
1. How do non-London airports currently provide connectivity and utility to the UK? 7Domestic connectivity 7
Reasons for the recent reduction in air connectivity between London and the UK regions 11
Other connectivity trends at non-London airports 16
Economic and other benefits provided by non-London airports 20
2. How are the business models of non-London airports changing, and how can they be expected to change further in time? 22Financial pressures on regional airports 22
Market dynamics at regional airports 24
3. Can the connectivity provided by these airports be enhanced? What are some of the options for Government and other bodies to intervene in this sector? 31State-aid 31
Alternative measures to enhance regional airports 35
The planning and policy framework 38
4. What role do airports serving London and the South East currently play in providing utility and connectivity to the South East and UK? 40
5. What strategies have airports serving London and the South East historically pursued? How are these changing, and how can they be expected to change further? 42Capacity and demand 42
Airport strategies 45
London City Airport 45
London Luton 45
London Southend 46
London Stansted 47
Smaller airports serving London and the South East 48
Conclusion 51
4
Utilisation of the UK’s Existing Airport Capacity
6. What are the constraints to developing further utility and connectivity at airports serving London and the South East? How and by whom can these constraints be mitigated to support developing further utility and connectivity? 53Types of constraint 53
Geographical constraints – site 54
Geographical constraints – access 54
Planning constraints 55
Commercial constraints 56
Airspace constraints 56
Regulatory, tax or legal constraints 57
Impact of the Commission’s final report 58
7. Questions and how to respond 59
5
Contents
Introduction
1. In its Interim Report the Commission looked at the possibility of moving traffic between London airports, or away from London airports, to obviate the need for new runway capacity.
2. The Commission’s forecasts suggest that airports serving London and the South East will be under very substantial pressure in 2030, with demand significantly in excess of the total available capacity by 2050.1 So moving traffic between London airports would at best only delay the capacity crunch.
3. The Commission’s analysis also suggested that there is relatively little scope to redistribute this demand away from London and South East airports, as such efforts would either have limited impact or have a negative effect on UK connectivity and capacity as a whole. The climate change impact would also be adverse.2
4. However, regional airports and those serving London and the South East other than Gatwick and Heathrow are still vital to the Commission’s analysis; it is clear that in the future these airports will play a crucial national role, especially at a time when the major London airports are operating very close to capacity.
5. The focus of this paper is therefore the connectivity and capacity provided by airports other than those short listed by the Commission for further consideration as long-term capacity options. The
1 Airports Commission, Interim Report, Chapter 4.
2 Airports Commission, Interim Report, Chapters 4 and 5.
Commission wishes to understand the long-term strategic context within which the eventual expansion option is likely to sit, and any recommendations it could usefully make to shape this context. This paper is a call for evidence on that subject.
6. The paper consists of two parts. First it examines non-London, or regional, airports.
●● Chapter 1 examines the role that non-London airports currently play in providing connectivity and utility to the UK.
●● Chapter 2 considers how the business models of these airports are changing, and how they can be expected to change further in time.
●● Chapter 3 asks whether the connectivity provided by these airports can be enhanced, and sets out some of the options the Government and other bodies have to intervene in this sector.
7. Second it examines other (i.e. non Heathrow and Gatwick) airports serving London and the South East.
●● Chapter 4 focuses on the role airports serving London and the South East currently play in providing connectivity and utility to the South East and UK.
6
Utilisation of the UK’s Existing Airport Capacity
●● Chapter 5 explores what strategies airports serving London and the South East have historically pursued and asks how these are changing, and how they can be expected to change further.
●● Chapter 6 considers the constraints to developing further connectivity and utility at airports serving London and the South East, as well as how and by whom these constraints can be mitigated.
●● Chapter 7 sets out a number of specific questions in relation to the above topics, and provides details of how to respond to the call for evidence. The Commission welcomes responses by Friday 25th July.
7
How do non-London airports currently provide connectivity and utility to the UK?
1. How do non-London airports currently provide connectivity and utility to the UK?
1.1 Airports are something of a mixed blessing for the communities in which they are located. Residents close to the facility are concerned by noise and pollution, but more broadly airports are often highly valued by their communities. They enable travel for work and leisure, and provide connectivity for individuals and businesses, be that through direct links to destinations, or through links to a larger airport providing onward connections. Airports may also be a hub for local business and enterprise, as well as a source of local pride.
1.2 The majority of the UK’s non-London (or regional) airports grew markedly in the 1990s and early 2000s. Fuelled by the growth of the low-cost short-haul sector, airports outside of London grew faster than those serving the capital, growing as a group at a rate of between 5-12% for each year between 1997 and 2005.3
1.3 During this period many regional airports grew in status and importance, attracting more passengers and more airlines and serving more destinations. For many UK passengers the option of flying from their local airport, rather than travelling to London to take a flight, became realistic for the first time. However, since the middle of the last decade this pattern of growth has changed. Whilst some airports outside of London continue to expand, a number have stopped growing, or are contracting. Some are in difficult
3 CAA, Cap 775: Air Services at UK Regional Airports, An Update on Developments (2005), p.2.
financial situations; others have closed or been nationalised.
1.4 This chapter will focus on the connectivity trends of airports outside London and the South East during the last decade, examining in particular how the recession has affected them. It will also consider the benefits and utility that these airports provide.
Domestic connectivity
1.5 Domestic air routes play a crucial role in connecting the different regions of the UK, shortening journey times between distant areas, and ensuring that the UK’s more isolated regions are connected to its major cultural and economic hubs. Domestic routes are particularly crucial to non-London airports, as they account for a larger proportion of their traffic than at London airports: in 2013 30% of passengers passing through regional airports were travelling to and from other UK airports. This compares to just 8% for the London area airports.4
1.6 In many cases, the key domestic connection for the UK’s regional airports is a link to the capital. Non-London airports and their corresponding regions have emphasised to the Commission the importance of safeguarding domestic links into London, and in particular Heathrow. As the Commission noted in its Interim Report,
4 CAA Airport Statistics. All further references to UK airport statistics will be taken from this dataset, unless specified otherwise.
8
Utilisation of the UK’s Existing Airport Capacity
domestic connections at Heathrow and other London airports are of economic significance for both London and the regions. The regions benefit both from access to the capital’s economy and from the long-haul connectivity they can access via Heathrow. London benefits from the contribution that those regional passengers make to enhance the business case for its long-haul routes.5
1.7 It is the double benefit of a) accessing the capital’s economy and b) accessing long-haul connectivity that has historically made the Heathrow link so desirable for regional stakeholders. As we shall see, alternative options can be taken by those outside of London to realise both of these benefits, but few of these options consistently achieve the two simultaneously.
1.8 The Interim Report documented how the number of UK destinations served from Heathrow had steadily decreased in recent years, from 19 ‘at least weekly’ services to non-London airports in 1990 to 8 ‘at least weekly’ services to non-London airports in 2012. The Commission’s demand forecasts indicate that by 2040, unless capacity is expanded, the number of domestic destinations served from Heathrow may fall further to 4.6
1.9 By and large, the domestic links that once operated out of Heathrow have not moved to other airports in the London network. Instead, the decline in air connectivity between the UK regions and Heathrow is part of a wider decline in domestic links to all London airports over the last decade (although this decline in
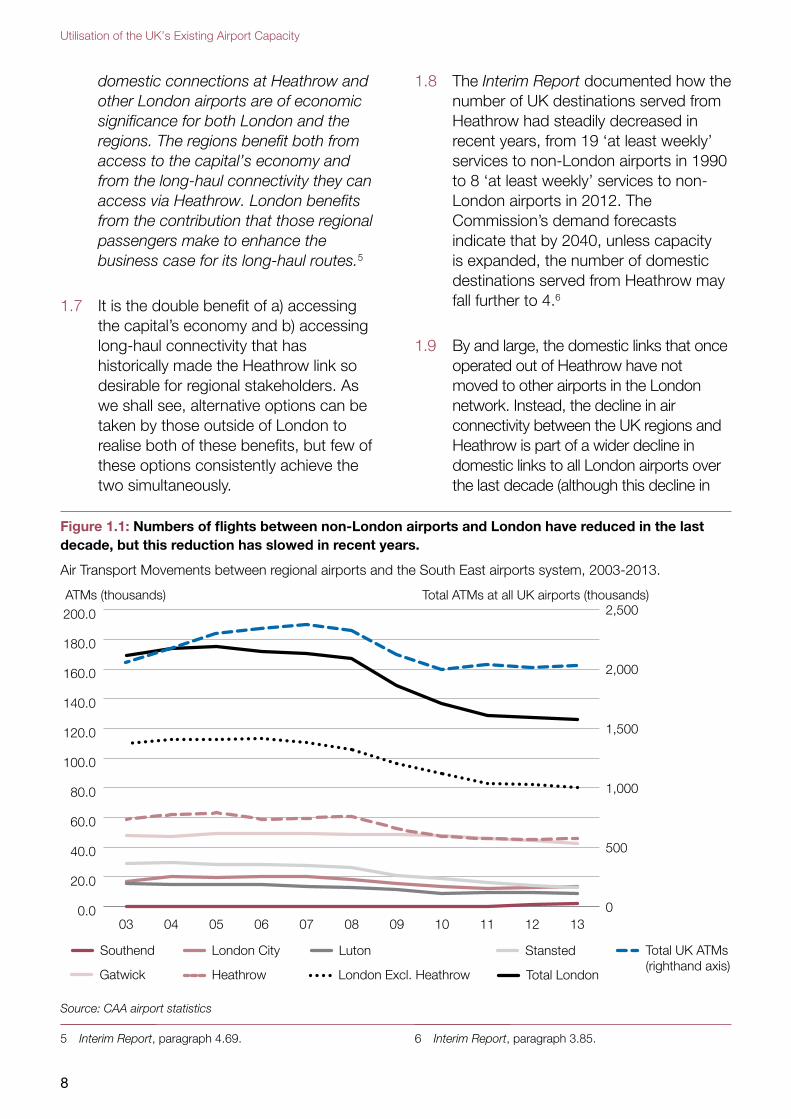
Figure 1.1: Numbers of flights between non-London airports and London have reduced in the last decade, but this reduction has slowed in recent years.
Air Transport Movements between regional airports and the South East airports system, 2003-2013.
0.0
20.0
40.0
60.0
80.0
100.0
120.0
140.0
160.0
180.0
200.0
Southend London City Luton Stansted
Gatwick Heathrow London Excl. Heathrow Total London
Total UK ATMs (righthand axis)
1312111009080706050403
ATMs (thousands) Total ATMs at all UK airports (thousands)2,500
2,000
1,500
1,000
500
0
Source: CAA airport statistics
5 Interim Report, paragraph 4.69. 6 Interim Report, paragraph 3.85.
9
How do non-London airports currently provide connectivity and utility to the UK?
traffic is less marked than at Heathrow). This system-wide reduction in services is shown in Figure 1.1. The figure illustrates two further points: first, from 2010 onwards the decline in domestic links into London runs counter to a pick-up in the UK’s overall traffic; second, since 2011 the reduction in domestic ATMs into London has slowed.
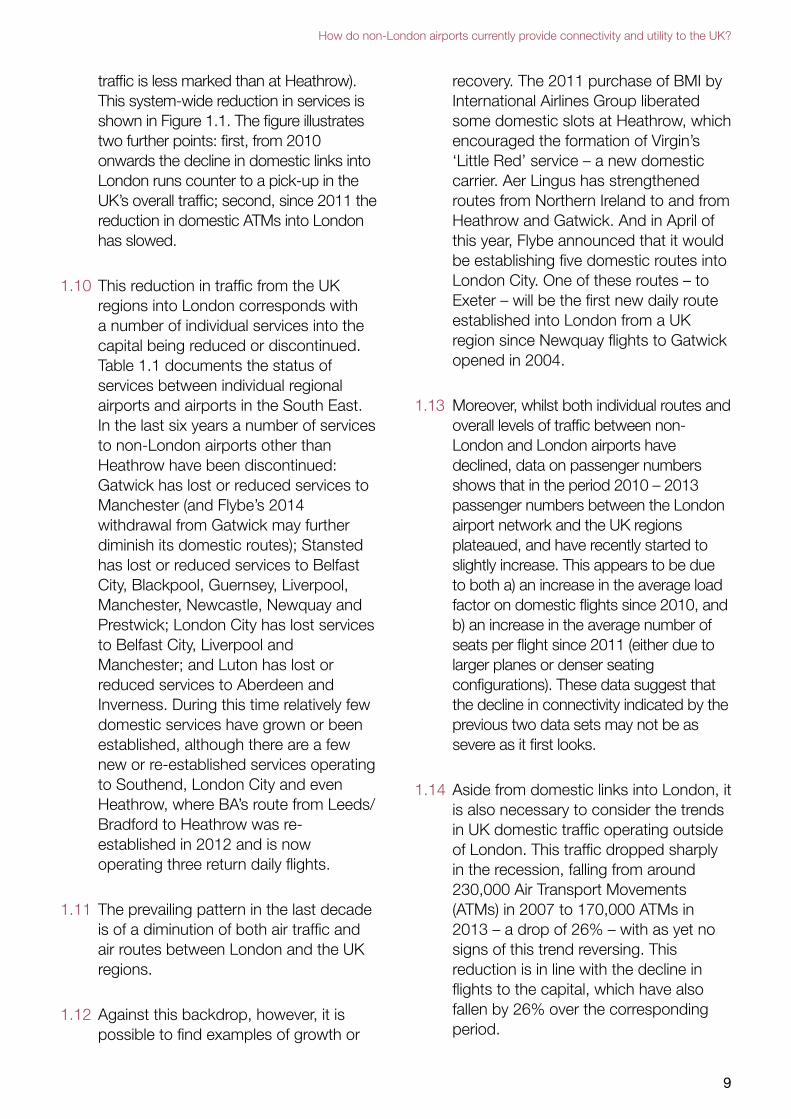
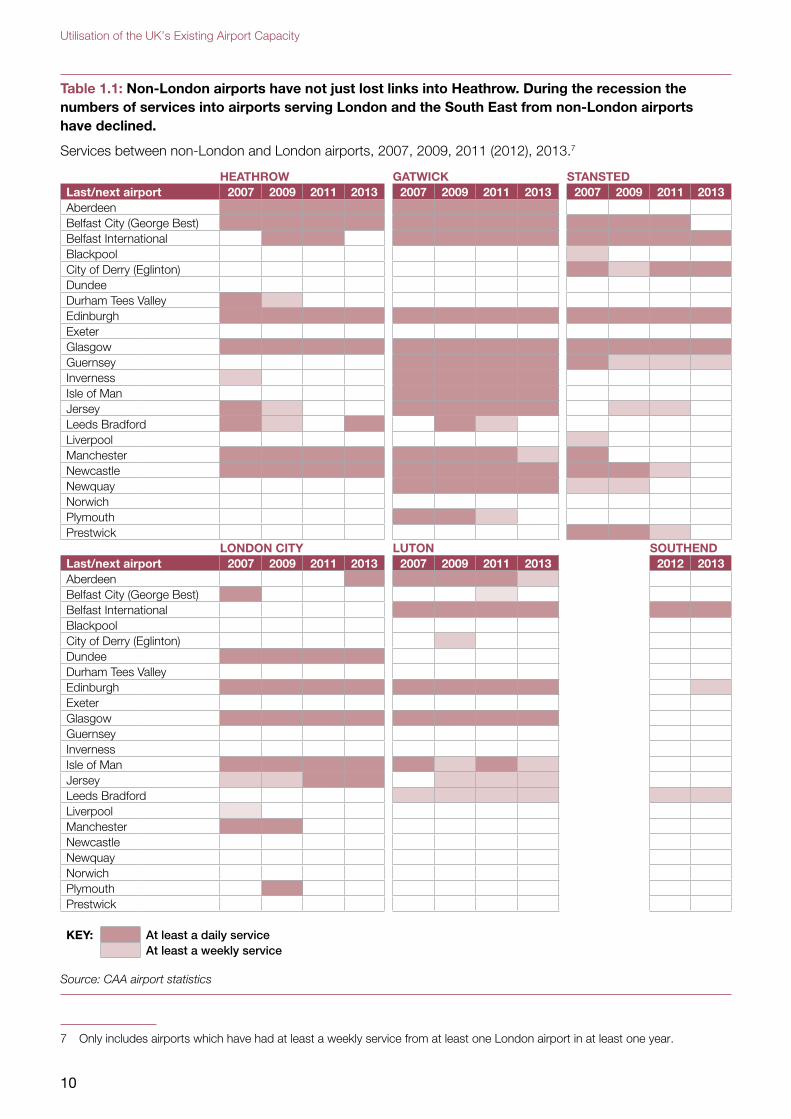
1.10 This reduction in traffic from the UK regions into London corresponds with a number of individual services into the capital being reduced or discontinued. Table 1.1 documents the status of services between individual regional airports and airports in the South East. In the last six years a number of services to non-London airports other than Heathrow have been discontinued: Gatwick has lost or reduced services to Manchester (and Flybe’s 2014 withdrawal from Gatwick may further diminish its domestic routes); Stansted has lost or reduced services to Belfast City, Blackpool, Guernsey, Liverpool, Manchester, Newcastle, Newquay and Prestwick; London City has lost services to Belfast City, Liverpool and Manchester; and Luton has lost or reduced services to Aberdeen and Inverness. During this time relatively few domestic services have grown or been established, although there are a few new or re-established services operating to Southend, London City and even Heathrow, where BA’s route from Leeds/Bradford to Heathrow was re-established in 2012 and is now operating three return daily flights.
1.11 The prevailing pattern in the last decade is of a diminution of both air traffic and air routes between London and the UK regions.
1.12 Against this backdrop, however, it is possible to find examples of growth or
recovery. The 2011 purchase of BMI by International Airlines Group liberated some domestic slots at Heathrow, which encouraged the formation of Virgin’s ‘Little Red’ service – a new domestic carrier. Aer Lingus has strengthened routes from Northern Ireland to and from Heathrow and Gatwick. And in April of this year, Flybe announced that it would be establishing five domestic routes into London City. One of these routes – to Exeter – will be the first new daily route established into London from a UK region since Newquay flights to Gatwick opened in 2004.
1.13 Moreover, whilst both individual routes and overall levels of traffic between non-London and London airports have declined, data on passenger numbers shows that in the period 2010 – 2013 passenger numbers between the London airport network and the UK regions plateaued, and have recently started to slightly increase. This appears to be due to both a) an increase in the average load factor on domestic flights since 2010, and b) an increase in the average number of seats per flight since 2011 (either due to larger planes or denser seating configurations). These data suggest that the decline in connectivity indicated by the previous two data sets may not be as severe as it first looks.
1.14 Aside from domestic links into London, it is also necessary to consider the trends in UK domestic traffic operating outside of London. This traffic dropped sharply in the recession, falling from around 230,000 Air Transport Movements (ATMs) in 2007 to 170,000 ATMs in 2013 – a drop of 26% – with as yet no signs of this trend reversing. This reduction is in line with the decline in flights to the capital, which have also fallen by 26% over the corresponding period.
10
Utilisation of the UK’s Existing Airport Capacity
Table 1.1: Non-London airports have not just lost links into Heathrow. During the recession the numbers of services into airports serving London and the South East from non-London airports have declined.
Services between non-London and London airports, 2007, 2009, 2011 (2012), 2013.7
HEATHROW GATWICK STANSTEDLast/next airport 2007 2009 2011 2013 2007 2009 2011 2013 2007 2009 2011 2013AberdeenBelfast City (George Best)Belfast InternationalBlackpoolCity of Derry (Eglinton)DundeeDurham Tees ValleyEdinburghExeterGlasgowGuernseyInvernessIsle of ManJerseyLeeds BradfordLiverpoolManchesterNewcastleNewquayNorwichPlymouthPrestwick
LONDON CITY LUTON SOUTHENDLast/next airport 2007 2009 2011 2013 2007 2009 2011 2013 2012 2013AberdeenBelfast City (George Best)Belfast InternationalBlackpoolCity of Derry (Eglinton)DundeeDurham Tees ValleyEdinburghExeterGlasgowGuernseyInvernessIsle of ManJerseyLeeds BradfordLiverpoolManchesterNewcastleNewquayNorwichPlymouthPrestwick
KEY: At least a daily serviceAt least a weekly service
Source: CAA airport statistics
7 Only includes airports which have had at least a weekly service from at least one London airport in at least one year.
11
How do non-London airports currently provide connectivity and utility to the UK?
1.15 Whilst the next section will focus on the reduction in air connectivity between London and the UK regions, a number of the reasons that we explore for this reduction will also be pertinent to the reduction in domestic services between non-London airports. Though for considerations of space this paper will not explore particular examples of this trend.
Reasons for the recent reduction in air connectivity between London and the UK regions
1.16 The Commission’s analysis suggests that the prevailing pattern of diminishing air connectivity between London and the regions may be the product of a number of factors. It is not easy to identify which of these factors are dominant; all are likely to have played a part. The main possibilities are: capacity constraints and their resultant pricing mechanisms disincentivising domestic traffic; an overall drop in demand for domestic services, which can be attributed to the recession, improved rail (and possibly coach) links, more rigorous security regimes and higher rates of taxation; and competition from foreign hub airports reducing the proportion of domestic passengers seeking to transfer at London airports.
Capacity constraints
1.17 It is often suggested that the decline in domestic links into Heathrow is the product of its capacity constraints. Heathrow argues that its ‘lack of runway capacity has particularly hurt regional growth in the UK by squeezing out regional routes’.8 This ‘squeezing out’ is said to occur because in a capacity constrained system airlines will prioritise the operation of their larger aircraft, in order to maximise revenue. It is in the
8 Heathrow Airport Ltd., A New Approach (2013), p.10.
airport’s interest to go along with or incentivise this behaviour, as larger planes bring more passengers and therefore maximise an airport’s non-aeronautical (parking, retail and catering) revenue. Some groups argue that the prioritisation of larger planes over smaller ones can hinder the UK’s domestic routes and their operators.
1.18 An obvious example of airports’ pricing mechanisms ‘squeezing out’ domestic routes is Flybe selling its Gatwick slots to EasyJet in 2011. Flybe sold the slots following Gatwick’s decision to re-structure its airport charges – significantly raising its per plane summer landing fees – which they said made it difficult profitably to operate small aircraft at the airport. Gatwick argued that this charging structure increased the average number of passengers per aircraft movement, making more efficient use of limited capacity. Flybe maintained that the move unreasonably discriminated against it and other operators of small aircraft, and lodged an appeal with the CAA on these grounds.
1.19 The CAA’s verdict supported the argument that some services may have been ‘squeezed out’, acknowledging that ‘some passengers may be harmed by Gatwick Airport Limited’s (GAL) changes to its charging structure’. Ultimately, however, the regulator found in favour of Gatwick, noting that ‘GAL had not unreasonably discriminated against any particular user of the airport or class of users’, and that ‘Overall, the CAA has not seen any evidence so far suggesting that regional passengers have markedly suffered harm from GAL’s amendments to its structure of charges’.9
9 CAA, ‘Investigation under Section 41 of the Airports Act 1986 of the structure of airport charges, levied by Gatwick Airport Limited – CAA decision’, (Jan 2013), p.2 and p.40.
12
Utilisation of the UK’s Existing Airport Capacity
1.20 Ultimately, the ‘squeezing out’ of domestic routes at capacity constrained airports is a product not just of airports’ charging policies, but of insufficient domestic demand to warrant the use of larger planes. There is nothing intrinsic to domestic services which require them to use smaller planes – in some countries it is not uncommon to see the use of jumbo jets on domestic routes, such as the Boeing 747-400 on flights between Seoul and the island of Jeju in South Korea, a distance of 283 miles. It is worth considering, therefore, what factors affect the underlying demand for domestic air services, and how these may have shifted in recent years.
Reduced demand
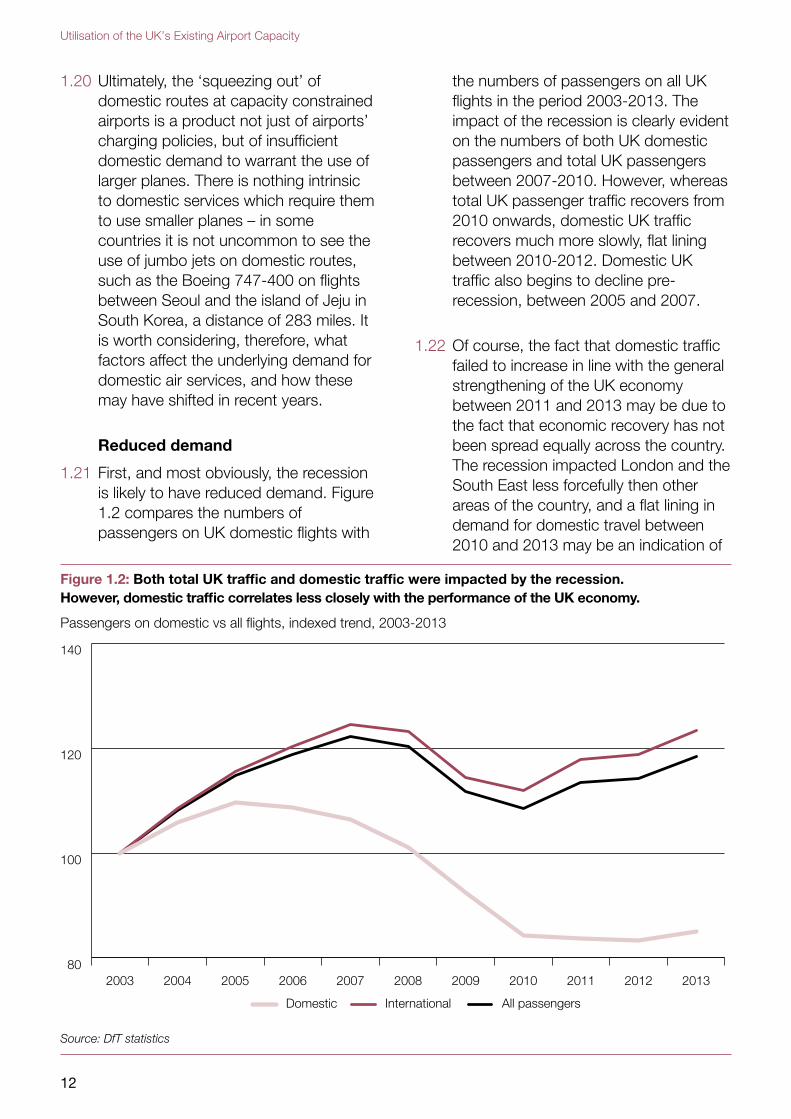
1.21 First, and most obviously, the recession is likely to have reduced demand. Figure 1.2 compares the numbers of passengers on UK domestic flights with
the numbers of passengers on all UK flights in the period 2003-2013. The impact of the recession is clearly evident on the numbers of both UK domestic passengers and total UK passengers between 2007-2010. However, whereas total UK passenger traffic recovers from 2010 onwards, domestic UK traffic recovers much more slowly, flat lining between 2010-2012. Domestic UK traffic also begins to decline pre-recession, between 2005 and 2007.
1.22 Of course, the fact that domestic traffic failed to increase in line with the general strengthening of the UK economy between 2011 and 2013 may be due to the fact that economic recovery has not been spread equally across the country. The recession impacted London and the South East less forcefully then other areas of the country, and a flat lining in demand for domestic travel between 2010 and 2013 may be an indication of
Figure 1.2: Both total UK traffic and domestic traffic were impacted by the recession. However, domestic traffic correlates less closely with the performance of the UK economy.
Passengers on domestic vs all flights, indexed trend, 2003-2013
80
100
120
140
All passengersInternationalDomestic
20132012201120102009200820072006200520042003
Source: DfT statistics
13
How do non-London airports currently provide connectivity and utility to the UK?
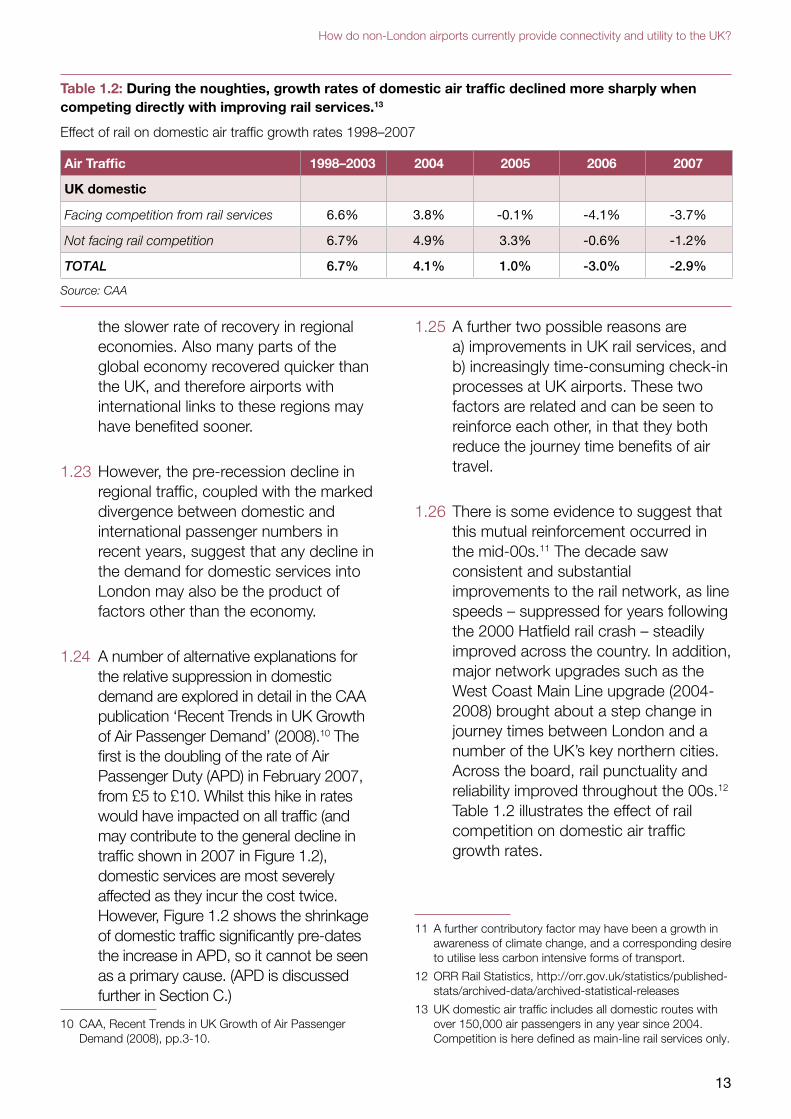
Table 1.2: During the noughties, growth rates of domestic air traffic declined more sharply when competing directly with improving rail services.13
Effect of rail on domestic air traffic growth rates 1998–2007
Air Traffic 1998–2003 2004 2005 2006 2007
UK domestic
Facing competition from rail services 6.6% 3.8% -0.1% -4.1% -3.7%
Not facing rail competition 6.7% 4.9% 3.3% -0.6% -1.2%
TOTAL 6.7% 4.1% 1.0% -3.0% -2.9%
Source: CAA
the slower rate of recovery in regional economies. Also many parts of the global economy recovered quicker than the UK, and therefore airports with international links to these regions may have benefited sooner.
1.23 However, the pre-recession decline in regional traffic, coupled with the marked divergence between domestic and international passenger numbers in recent years, suggest that any decline in the demand for domestic services into London may also be the product of factors other than the economy.
1.24 A number of alternative explanations for the relative suppression in domestic demand are explored in detail in the CAA publication ‘Recent Trends in UK Growth of Air Passenger Demand’ (2008).10 The first is the doubling of the rate of Air Passenger Duty (APD) in February 2007, from £5 to £10. Whilst this hike in rates would have impacted on all traffic (and may contribute to the general decline in traffic shown in 2007 in Figure 1.2), domestic services are most severely affected as they incur the cost twice. However, Figure 1.2 shows the shrinkage of domestic traffic significantly pre-dates the increase in APD, so it cannot be seen as a primary cause. (APD is discussed further in Section C.)
10 CAA, Recent Trends in UK Growth of Air Passenger Demand (2008), pp.3-10.
1.25 A further two possible reasons are a) improvements in UK rail services, and b) increasingly time-consuming check-in processes at UK airports. These two factors are related and can be seen to reinforce each other, in that they both reduce the journey time benefits of air travel.
1.26 There is some evidence to suggest that this mutual reinforcement occurred in the mid-00s.11 The decade saw consistent and substantial improvements to the rail network, as line speeds – suppressed for years following the 2000 Hatfield rail crash – steadily improved across the country. In addition, major network upgrades such as the West Coast Main Line upgrade (2004-2008) brought about a step change in journey times between London and a number of the UK’s key northern cities. Across the board, rail punctuality and reliability improved throughout the 00s.12 Table 1.2 illustrates the effect of rail competition on domestic air traffic growth rates.
11 A further contributory factor may have been a growth in awareness of climate change, and a corresponding desire to utilise less carbon intensive forms of transport.
12 ORR Rail Statistics, http://orr.gov.uk/statistics/published-stats/archived-data/archived-statistical-releases
13 UK domestic air traffic includes all domestic routes with over 150,000 air passengers in any year since 2004. Competition is here defined as main-line rail services only.
14
Utilisation of the UK’s Existing Airport Capacity
1.27 An additional benefit which bolstered rail services is the provision of wi-fi on certain trains, particularly in first class, which occurred years in advance of airlines developing similar technology. Equally important may have been the ability to access the internet through data services over the mobile phone network, which is again only a recent option for air passengers.
1.28 The improvement in rail services went hand-in-hand with tightened security restrictions following the terrorist threats of August 2006, which ‘increased the overall journey time […] for all passengers travelling from the UK’s main airports.’ The CAA’s 2008 report concluded that ‘There is evidence that competition from other modes of transport has affected domestic air traffic, particularly as a result of both
changes in airport security […] and improvements to long distance rail services.’14
Transferring elsewhere
1.29 Finally, demand for regional routes into London may have declined because UK passengers have chosen to make connections elsewhere. This may be a symptom of services being ‘squeezed out’ of capacity constrained airports, but may also be an independent trend due to the relative merits of alternative transfer hubs.
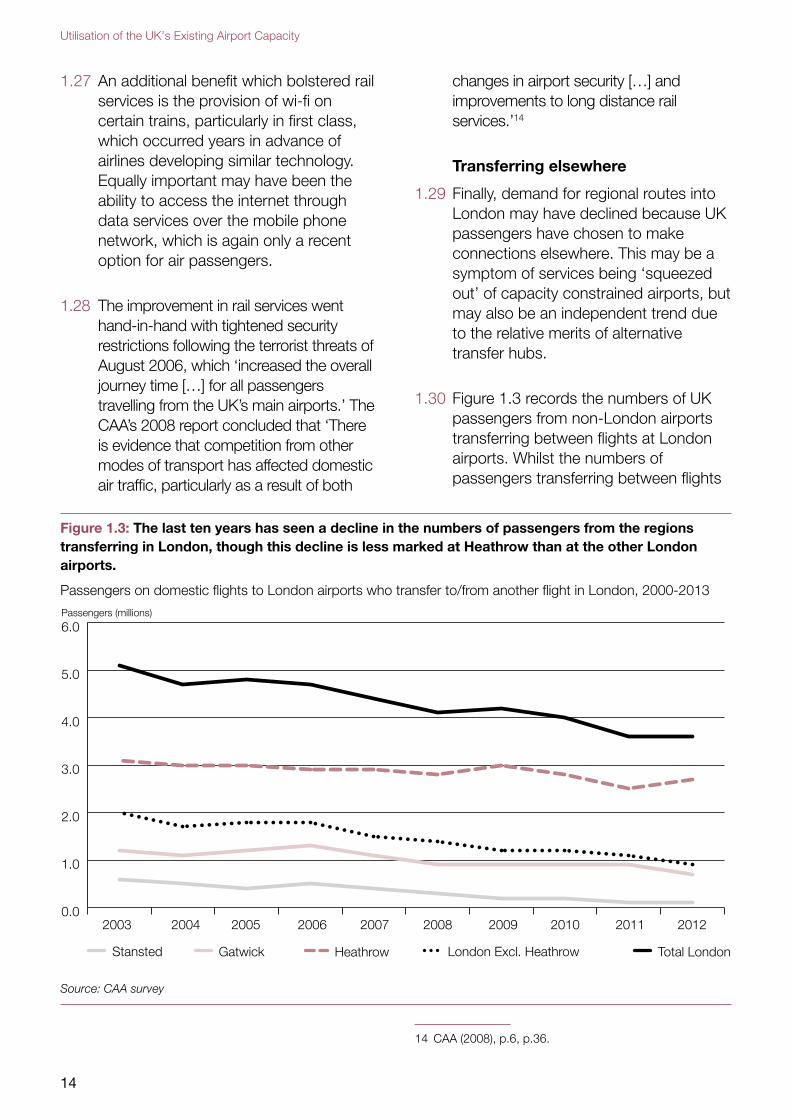
1.30 Figure 1.3 records the numbers of UK passengers from non-London airports transferring between flights at London airports. Whilst the numbers of passengers transferring between flights
Figure 1.3: The last ten years has seen a decline in the numbers of passengers from the regions transferring in London, though this decline is less marked at Heathrow than at the other London airports.
Passengers on domestic flights to London airports who transfer to/from another flight in London, 2000-2013
0.0
1.0
2.0
3.0
4.0
5.0
6.0
Stansted Gatwick Heathrow London Excl. Heathrow Total London
2012201120102009200820072006200520042003
Passengers (millions)
Source: CAA survey
14 CAA (2008), p.6, p.36.
15
How do non-London airports currently provide connectivity and utility to the UK?
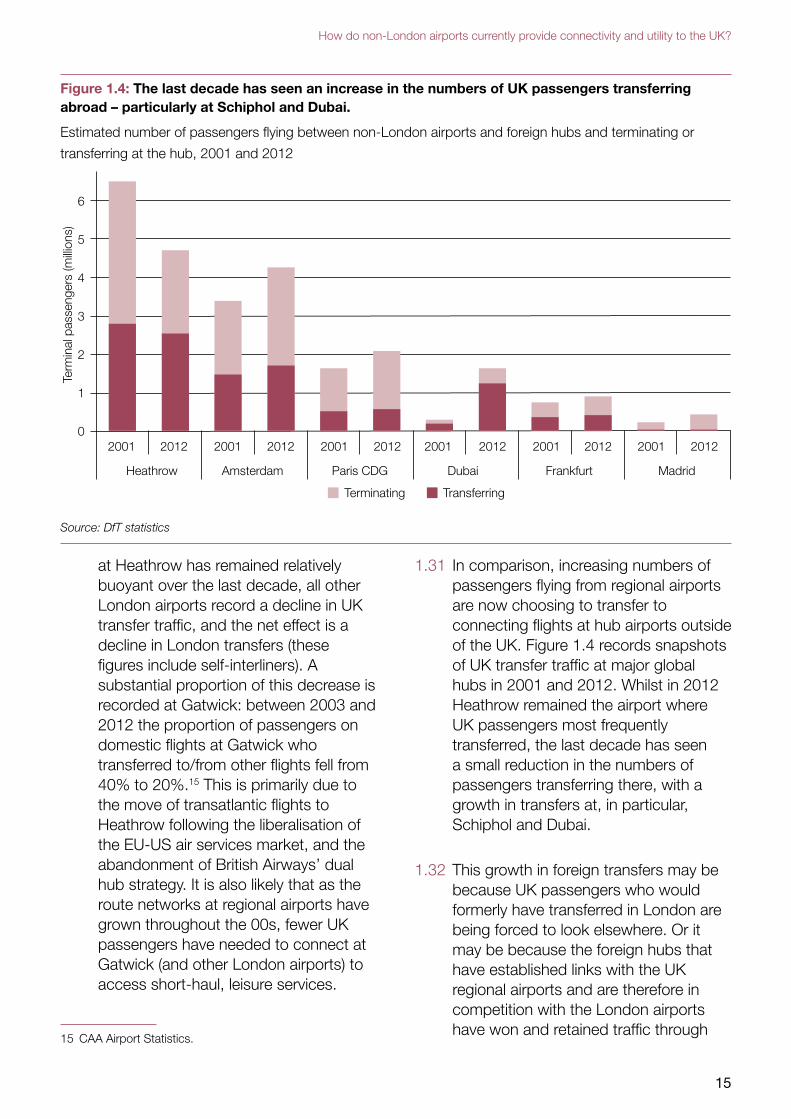
Figure 1.4: The last decade has seen an increase in the numbers of UK passengers transferring abroad – particularly at Schiphol and Dubai.
Estimated number of passengers flying between non-London airports and foreign hubs and terminating or
transferring at the hub, 2001 and 2012
6
5
4
3
2
1
02001
Heathrow
Term
inal
pas
seng
ers
(milli
ons)
2012 2001
Amsterdam
Terminating Transferring
2012 2001
Paris CDG
2012 2001
Dubai
2012 2001
Frankfurt
2012 2001
Madrid
2012
Source: DfT statistics
at Heathrow has remained relatively buoyant over the last decade, all other London airports record a decline in UK transfer traffic, and the net effect is a decline in London transfers (these figures include self-interliners). A substantial proportion of this decrease is recorded at Gatwick: between 2003 and 2012 the proportion of passengers on domestic flights at Gatwick who transferred to/from other flights fell from 40% to 20%.15 This is primarily due to the move of transatlantic flights to Heathrow following the liberalisation of the EU-US air services market, and the abandonment of British Airways’ dual hub strategy. It is also likely that as the route networks at regional airports have grown throughout the 00s, fewer UK passengers have needed to connect at Gatwick (and other London airports) to access short-haul, leisure services.
15 CAA Airport Statistics.
1.31 In comparison, increasing numbers of passengers flying from regional airports are now choosing to transfer to connecting flights at hub airports outside of the UK. Figure 1.4 records snapshots of UK transfer traffic at major global hubs in 2001 and 2012. Whilst in 2012 Heathrow remained the airport where UK passengers most frequently transferred, the last decade has seen a small reduction in the numbers of passengers transferring there, with a growth in transfers at, in particular, Schiphol and Dubai.
1.32 This growth in foreign transfers may be because UK passengers who would formerly have transferred in London are being forced to look elsewhere. Or it may be because the foreign hubs that have established links with the UK regional airports and are therefore in competition with the London airports have won and retained traffic through
16
Utilisation of the UK’s Existing Airport Capacity
their own merits, be that through geographical advantages, cheaper flights, better marketing or better services (such as faster minimum connect times). Equally, short surface access journey times to London airports will dictate that some air routes to the capital, such as from Birmingham, Sheffield (Doncaster Robin Hood) or Bristol, are not viable; and as surface access links improve nationally the number of destinations in this list will grow. Passengers travelling to long-distance destinations from these cities may prefer to make their entire journey by air, and are therefore very likely to fly outside of the UK to make any necessary transfer.
1.33 To summarise: air connectivity between London and the rest of the UK appears to have diminished in recent years (although there is evidence of some counter-trends). That reduction may have occurred because capacity constraints at Heathrow and (to a lesser extent) Gatwick have ‘squeezed out’ thinly-populated routes, and airports’ charging mechanisms may have exacerbated this trend. However, it has coincided with a number of developments – recession, improvements to alternative transport modes, increases in APD – which have combined to reduce the demand for air services from the UK regions into London. Finally, passengers from regional airports are transferring slightly less often in London and more often at other European or Middle Eastern hubs, and this could be either a symptom or a cause of the declining domestic demand.
1.34 The Commission is interested in how domestic air connectivity between London and the regions is likely to develop in the future. Assuming that the
UK continues its economic recovery, will London’s central role in the economy mean that demand for point-to-point services to the capital from the regions will grow in the coming years? The recent Flybe announcement discussed in paragraph 1.12 may be in accordance with this supposition.
1.35 Alternatively, will the factors which may have constrained demand for domestic air services in recent years continue, or grow stronger? And will future additional factors, such as tighter carbon constraints, further diminish the commercial viability of domestic air links?
Other connectivity trends at non-London airports
1.36 The final section in this chapter will widen its focus from domestic connectivity to consider other connectivity trends evident at non-London airports, in particular the growth or shrinkage of their route networks, and any changes to the type of passengers or traffic that these airports are attracting.
Route networks
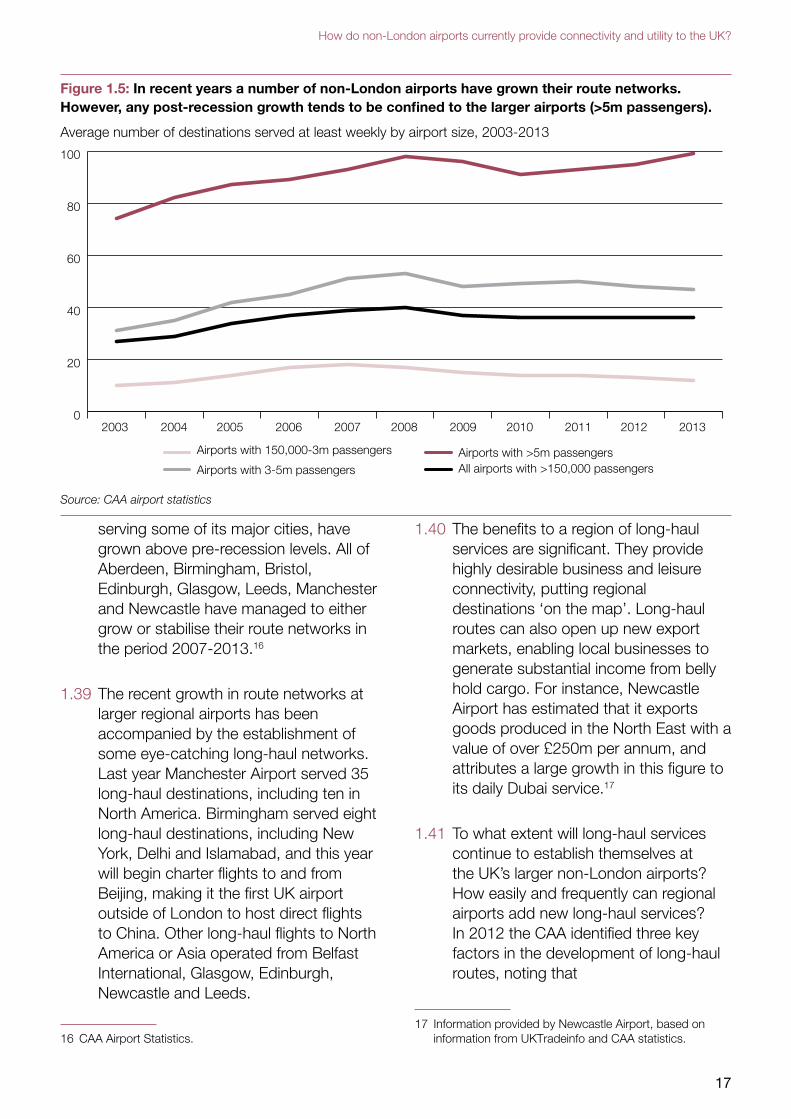
1.37 We have already considered Figure 1.4, which shows a growth in both overall traffic and transfer traffic to foreign hub airports from non-London airports. This growth in traffic to foreign hubs is symptomatic of an overall growth of route networks at regional airports in the previous decade, as the black line in Figure 1.5 shows.
1.38 However, as Figure 1.5 also shows, route networks at small and medium sized airports peaked pre-recession, and in recent years appear to be flatlining or slightly declining. On the other hand, route networks at the UK’s largest regional airports, such as those
17
How do non-London airports currently provide connectivity and utility to the UK?
Figure 1.5: In recent years a number of non-London airports have grown their route networks. However, any post-recession growth tends to be confined to the larger airports (>5m passengers).
Average number of destinations served at least weekly by airport size, 2003-2013
0
20
40
60
80
100
Airports with 150,000-3m passengers
Airports with 3-5m passengersAirports with >5m passengersAll airports with >150,000 passengers
20132012201120102009200820072006200520042003
Source: CAA airport statistics
serving some of its major cities, have grown above pre-recession levels. All of Aberdeen, Birmingham, Bristol, Edinburgh, Glasgow, Leeds, Manchester and Newcastle have managed to either grow or stabilise their route networks in the period 2007-2013.16
1.39 The recent growth in route networks at larger regional airports has been accompanied by the establishment of some eye-catching long-haul networks. Last year Manchester Airport served 35 long-haul destinations, including ten in North America. Birmingham served eight long-haul destinations, including New York, Delhi and Islamabad, and this year will begin charter flights to and from Beijing, making it the first UK airport outside of London to host direct flights to China. Other long-haul flights to North America or Asia operated from Belfast International, Glasgow, Edinburgh, Newcastle and Leeds.
16 CAA Airport Statistics.
1.40 The benefits to a region of long-haul services are significant. They provide highly desirable business and leisure connectivity, putting regional destinations ‘on the map’. Long-haul routes can also open up new export markets, enabling local businesses to generate substantial income from belly hold cargo. For instance, Newcastle Airport has estimated that it exports goods produced in the North East with a value of over £250m per annum, and attributes a large growth in this figure to its daily Dubai service.17
1.41 To what extent will long-haul services continue to establish themselves at the UK’s larger non-London airports? How easily and frequently can regional airports add new long-haul services? In 2012 the CAA identified three key factors in the development of long-haul routes, noting that
17 Information provided by Newcastle Airport, based on information from UKTradeinfo and CAA statistics.
18
Utilisation of the UK’s Existing Airport Capacity
Significant growth of long-haul route networks at regional airports would require:
●● access to a sufficiently large local market;
●● the ability to generate significant volumes of premium class traffic; and
●● the ability to attract network airlines or alliances who would supplement local demand with connecting traffic.
With regard to the first factor, the report also notes that ‘airport competition limits catchment areas’.18
1.42 The Commission is interested in understanding regional stakeholders’ views on these factors, both in terms of the accuracy of the CAA’s prognosis, and the relative importance of the three factors in attracting long-haul traffic. The issues of airport competition and the passenger market, as well as divergent trends between non-London airports, are returned to in Chapter 2.
Changes to routes and purpose of travel
1.43 The growth or shrinkage of route networks is one measure of an airport’s performance, but it is also necessary to consider which routes, and which types of traffic, are being lost or gained. One way into this question is to consider CAA survey data on the purpose of travel from non-London airports. Most of these airports are only surveyed on occasional years, meaning that annual time-series data is hard to produce. However, by pooling data from a number of airports of the same region, and considering snapshots of multiple surveyed years, it is possible to build up
18 CAA, Insight Note: Aviation Policy for the Consumer (2012), p. 33.
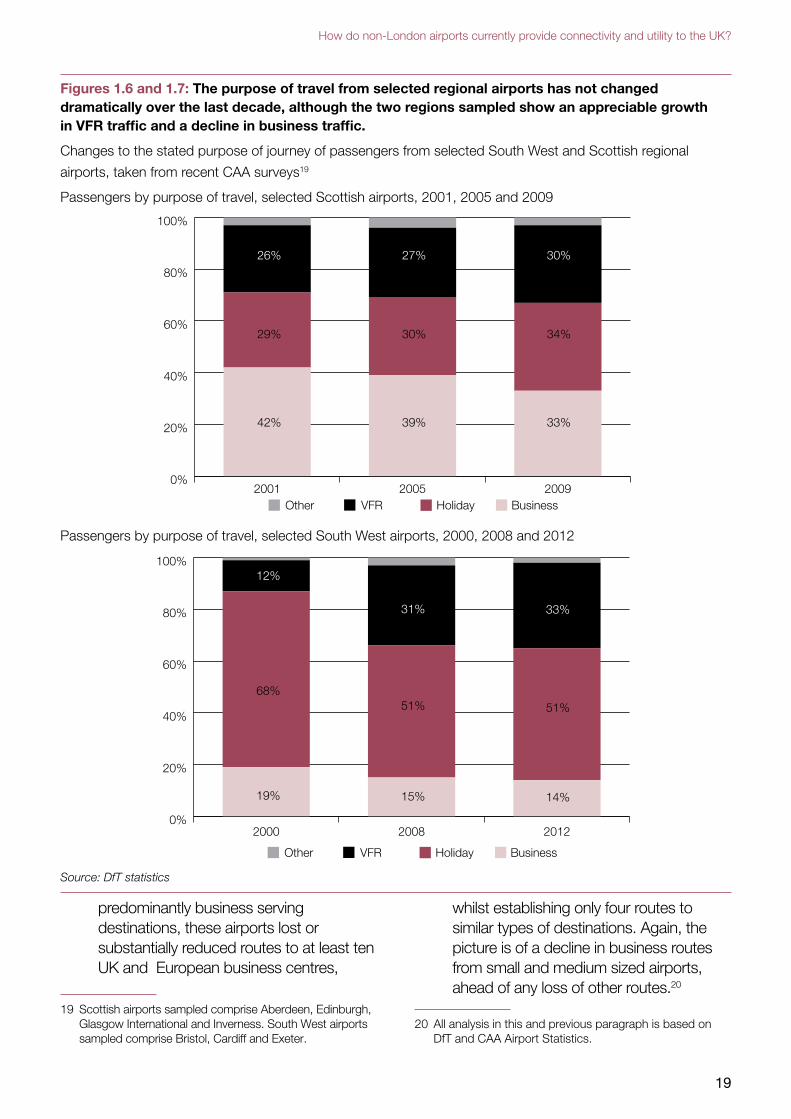
a picture of changing travel purposes, as Figures 1.6 and 1.7 show.
1.44 In the last decade, both Scottish and South West regions showed a slight decrease in the numbers of passengers travelling for business purposes and a growth in the numbers of passengers travelling to visit friends and relatives (VFR). Given both the infrequent survey dates, and the fact that the results are extrapolated from samples, it is necessary to be cautious about reading too much into these trends. But the Commission is interested to hear from regions and/or their airports about whether this trend is corroborated by their own data on passenger traffic, and whether this trend is common to all UK regions.
1.45 Equally, looking at the specific routes gained and lost by airports in these regions can give another indication of the types of traffic and passengers they are serving. Between 2007 – 2013 either Exeter and Cardiff, to choose two of the airports that make up the South West sample, lost or substantially reduced routes to Alicante, Bergerac, Faro, Guernsey, Malaga and Majorca – all of which are likely to predominantly cater for leisure or VFR – and gained one similar route to the Isles of Scilly. However, the airports lost more routes that were likely to be business oriented, including Amsterdam, Belfast City, Belfast International, Brest, Dublin, Edinburgh, Glasgow and Newcastle (with new routes added to Anglesey and Belfast City). If any trend is evident here it is a decline of business centred routes over and above the decline of leisure routes.
1.46 In Scotland, either Inverness or Glasgow International lost or substantially reduced routes to four predominantly leisure serving destinations, but gained routes to at least ten more. In terms of
19
How do non-London airports currently provide connectivity and utility to the UK?
Figures 1.6 and 1.7: The purpose of travel from selected regional airports has not changed dramatically over the last decade, although the two regions sampled show an appreciable growth in VFR traffic and a decline in business traffic.
Changes to the stated purpose of journey of passengers from selected South West and Scottish regional
airports, taken from recent CAA surveys19
Passengers by purpose of travel, selected Scottish airports, 2001, 2005 and 2009
Other VFR Holiday Business
0%
20%
40%
60%
80%
100%
200920052001
42%
29%
26%
39%
30%
27%
33%
34%
30%
Passengers by purpose of travel, selected South West airports, 2000, 2008 and 2012
0%
20%
40%
60%
80%
100%
201220082000
19%
68%
12%
15%
51%
31%
14%
51%
33%
Other VFR Holiday Business
Source: DfT statistics
predominantly business serving destinations, these airports lost or substantially reduced routes to at least ten UK and European business centres,
19 Scottish airports sampled comprise Aberdeen, Edinburgh, Glasgow International and Inverness. South West airports sampled comprise Bristol, Cardiff and Exeter.
whilst establishing only four routes to similar types of destinations. Again, the picture is of a decline in business routes from small and medium sized airports, ahead of any loss of other routes.20
20 All analysis in this and previous paragraph is based on DfT and CAA Airport Statistics.
20
Utilisation of the UK’s Existing Airport Capacity
1.47 Whilst a decline in business traffic during a recession is to be expected, it is not certain that this traffic ought to be affected more sharply than leisure traffic. The Commission would welcome views from respondents on what appears to be a disproportionate decline in business traffic at small and medium sized regional airports, or into and out of particular regions.
Economic and other benefits provided by non-London airports
1.48 In the Commission’s Connectivity and the Economy discussion paper, published last year, the Commission noted that the UK air transport sector generated around £9.8bn economic output in 2011, and directly employed about 120,000 workers. Apart from these direct benefits, the aviation sector contributes to the wider economy, facilitating the movement of goods and services, trade, investment and tourism.
1.49 A number of respondents to the Commission’s Connectivity and the Economy Paper outlined their views how these benefits accrue to particular airports. For example, a study commissioned by York Aviation for Newcastle Airport calculated that the total Gross Value Added benefit of the airport was £402.5m in 2012, and that the airport was responsible for 9,550 jobs; similarly a 2010 report commissioned by Aberdeen Airport found that the airport contributes more than £110m a year to the regional economy, supporting almost 3,400 jobs in the region, and that a runway extension would ultimately provide a further £20.3m to the local economy.
1.50 A number of airports were keen to note the increases in tourism that their institutions can promote: Bristol Airport
argues that its expansion to 10m passengers per annum could generate an additional £189m a year increased annual visitor expenditure in the surrounding region; Edinburgh Airport quoted work done by VisitScotland which notes that the tourism sector is worth £4.1bn to the Scottish economy, of which 32% is spent by overseas visitors, 87% of whom arrive in the country by air.21
1.51 The exact value and overall impact of these effects can be debated. For example, aviation connectivity also facilitates outbound tourism, as well as inbound, so the net impact is unclear. Regional airports do however have the potential to contribute to regional growth and employment.
1.52 Regional airports can also provide other benefits. They can make flying more convenient, and increase and diversify the range of people who visit a region.
1.53 Regional airports are also capable of improving the quality of life of local people, by making flying more convenient, and by increasing and diversifying the range of people who visit a region.
1.54 In addition, a number of parties have impressed on the Commission the importance that non-London airports play in facilitating and supporting the entire UK airports system. For instance, non-London airports host a number of activities that London airports are too
21 Aberdeen, Bristol, Edinburgh and Newcastle Airport’s responses to the Airports Commission’s call for evidence on Connectivity and the Economy, all published online: https://www.gov.uk/government/publications/stakeholder-responses-to-airports-commission-discussion-papers. Of course regional airports also take tourists away from their region. The Commission discussed the concept of trade and tourism deficits in its Interim Report, Chapter 3.

21
How do non-London airports currently provide connectivity and utility to the UK?
congested to undertake, such as fire safety and other operational training (Durham Tees Valley and Newcastle airports), BA pilot training and deep overhaul of BA’s long-haul aircraft fleet (Cardiff) and specialist pilot training (such as steeper descent approaches). The next chapter will consider how some regional airports are pro-actively seeking opportunities to further develop non-aeronautical-related lines of revenue beyond their core business.
22
Utilisation of the UK’s Existing Airport Capacity
2. How are the business models of non-London airports changing, and how can they be expected to change further in time?
2.1 Section B of this paper will consider the commercial viability of the UK’s regional airports, considering historical trends on usage, growth and profitability, and setting these airports’ performance in the context of the wider European airport sector. This chapter will analyse how airports may be responding to market trends, including the potential consolidation or closures of some non-London airports, and call for further evidence.
Financial pressures on regional airports
2.2 Further to the European Commission’s 2013 consultation on new guidelines for state aid rules on the financing of airports and airlines, the European branch of Airports Council International (a global airport association) issued a response which explored the costs borne by European airports. In particular, the ACI focused upon the financial pressures that smaller airports face.
For airports it is estimated that approximately 80% of costs are fixed – this means that airports have to bear these costs regardless of the number of passengers they have. These ‘sunk costs’ are not just capital costs for infrastructure but also operating costs, a significant proportion of which are driven either by regulatory requirements (safety & security), or by existing infrastructure requirements rather than the traffic
volumes. For example, irrespective of the number of passengers, an airport has to maintain a minimum rescue and fire-fighting service, has to ensure the security of the aerodrome perimeter, and has to ensure basic facility maintenance and cleaning. In practice, this means that smaller airports will always have higher costs on a per passenger basis compared to their larger peers. They can’t escape many of the costs, and at the same time don’t have the passenger numbers to spread the impact.22
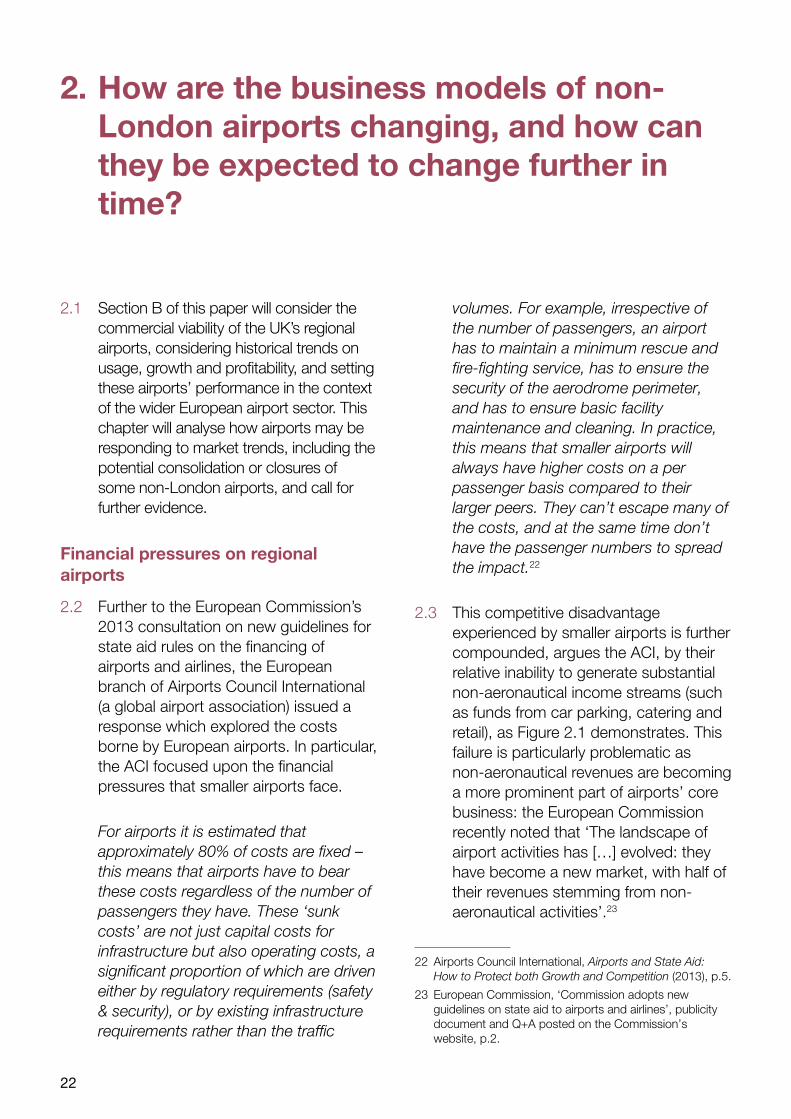
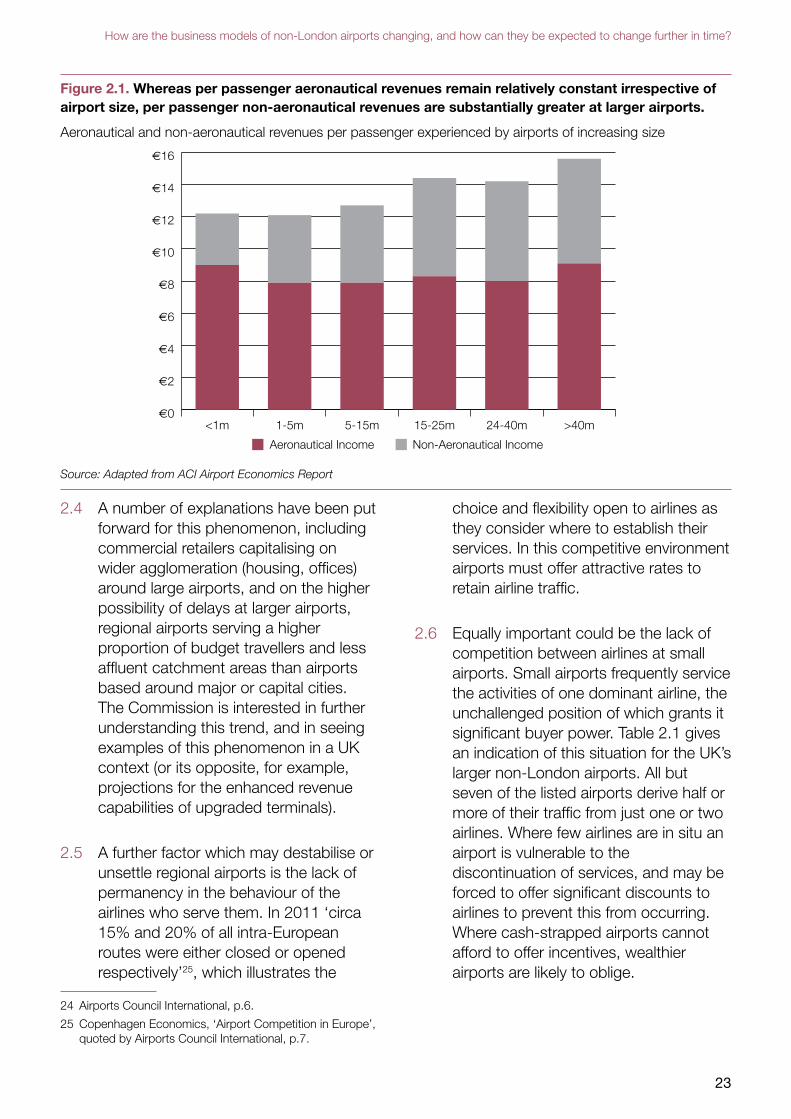
2.3 This competitive disadvantage experienced by smaller airports is further compounded, argues the ACI, by their relative inability to generate substantial non-aeronautical income streams (such as funds from car parking, catering and retail), as Figure 2.1 demonstrates. This failure is particularly problematic as non-aeronautical revenues are becoming a more prominent part of airports’ core business: the European Commission recently noted that ‘The landscape of airport activities has […] evolved: they have become a new market, with half of their revenues stemming from non-aeronautical activities’.23
22 Airports Council International, Airports and State Aid: How to Protect both Growth and Competition (2013), p.5.
23 European Commission, ‘Commission adopts new guidelines on state aid to airports and airlines’, publicity document and Q+A posted on the Commission’s website, p.2.
23
How are the business models of non-London airports changing, and how can they be expected to change further in time?
Figure 2.1. Whereas per passenger aeronautical revenues remain relatively constant irrespective of airport size, per passenger non-aeronautical revenues are substantially greater at larger airports.
Aeronautical and non-aeronautical revenues per passenger experienced by airports of increasing size
Source: Adapted from ACI Airport Economics Report
2.4 A number of explanations have been put forward for this phenomenon, including commercial retailers capitalising on wider agglomeration (housing, offices) around large airports, and on the higher possibility of delays at larger airports, regional airports serving a higher proportion of budget travellers and less affluent catchment areas than airports based around major or capital cities. The Commission is interested in further understanding this trend, and in seeing examples of this phenomenon in a UK context (or its opposite, for example, projections for the enhanced revenue capabilities of upgraded terminals).
2.5 A further factor which may destabilise or unsettle regional airports is the lack of permanency in the behaviour of the airlines who serve them. In 2011 ‘circa 15% and 20% of all intra-European routes were either closed or opened respectively’25, which illustrates the
24 Airports Council International, p.6.
25 Copenhagen Economics, ‘Airport Competition in Europe’, quoted by Airports Council International, p.7.
choice and flexibility open to airlines as they consider where to establish their services. In this competitive environment airports must offer attractive rates to retain airline traffic.
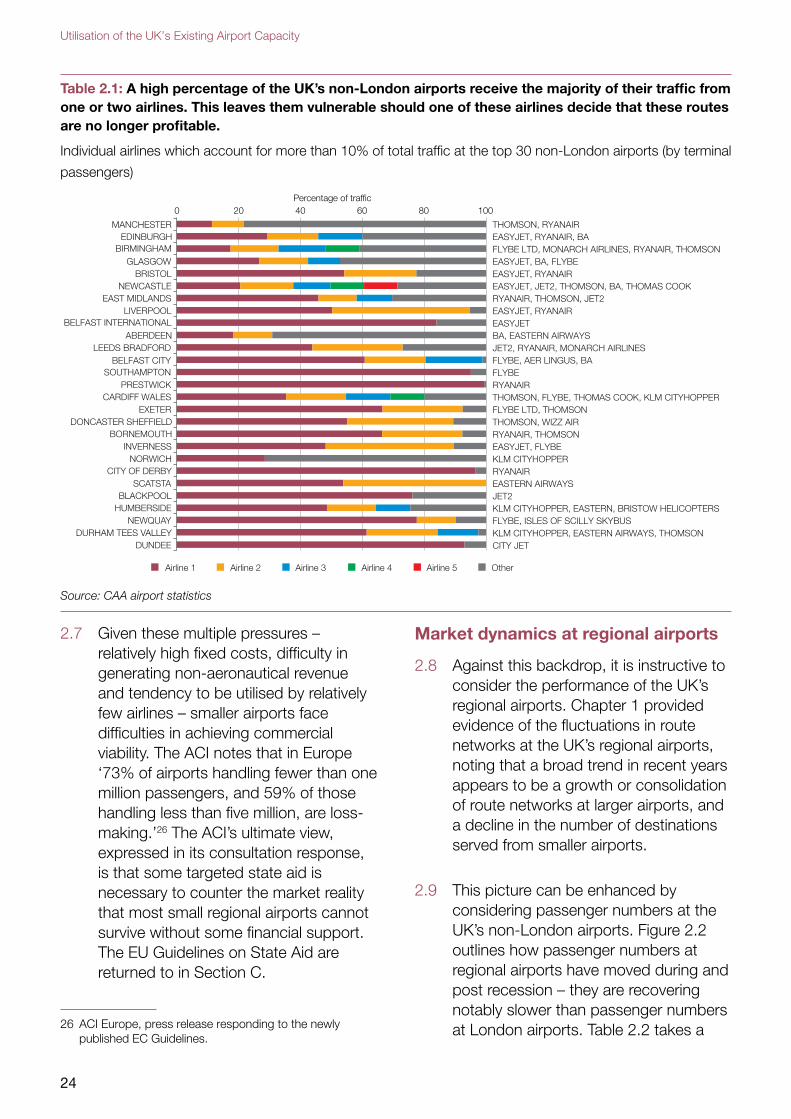
2.6 Equally important could be the lack of competition between airlines at small airports. Small airports frequently service the activities of one dominant airline, the unchallenged position of which grants it significant buyer power. Table 2.1 gives an indication of this situation for the UK’s larger non-London airports. All but seven of the listed airports derive half or more of their traffic from just one or two airlines. Where few airlines are in situ an airport is vulnerable to the discontinuation of services, and may be forced to offer significant discounts to airlines to prevent this from occurring. Where cash-strapped airports cannot afford to offer incentives, wealthier airports are likely to oblige.
€0
€2
€4
€6
€8
€10
€12
€14
€16
>40m24-40m15-25m5-15m1-5m<1m
Aeronautical Income Non-Aeronautical Income
24
Utilisation of the UK’s Existing Airport Capacity
Table 2.1: A high percentage of the UK’s non-London airports receive the majority of their traffic from one or two airlines. This leaves them vulnerable should one of these airlines decide that these routes are no longer profitable.
Individual airlines which account for more than 10% of total traffic at the top 30 non-London airports (by terminal
passengers)
Source: CAA airport statistics
2.7 Given these multiple pressures – relatively high fixed costs, difficulty in generating non-aeronautical revenue and tendency to be utilised by relatively few airlines – smaller airports face difficulties in achieving commercial viability. The ACI notes that in Europe ‘73% of airports handling fewer than one million passengers, and 59% of those handling less than five million, are loss-making.’26 The ACI’s ultimate view, expressed in its consultation response, is that some targeted state aid is necessary to counter the market reality that most small regional airports cannot survive without some financial support. The EU Guidelines on State Aid are returned to in Section C.
26 ACI Europe, press release responding to the newly published EC Guidelines.
Market dynamics at regional airports
2.8 Against this backdrop, it is instructive to consider the performance of the UK’s regional airports. Chapter 1 provided evidence of the fluctuations in route networks at the UK’s regional airports, noting that a broad trend in recent years appears to be a growth or consolidation of route networks at larger airports, and a decline in the number of destinations served from smaller airports.
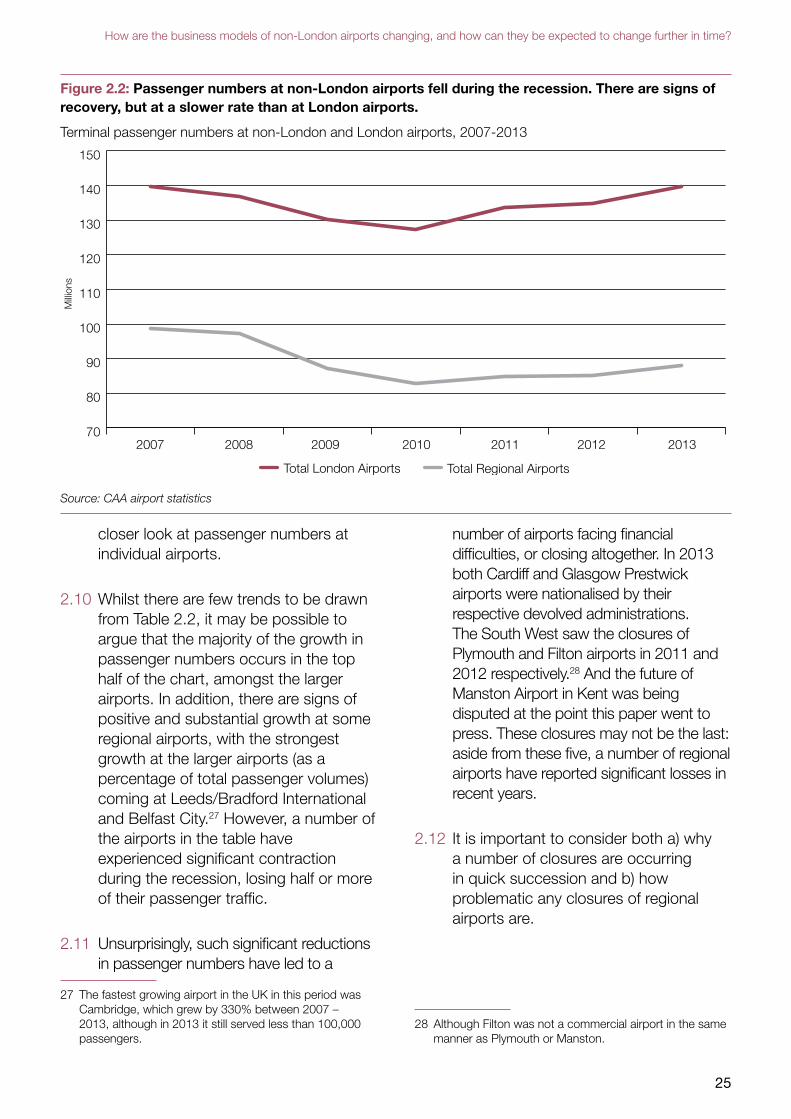
2.9 This picture can be enhanced by considering passenger numbers at the UK’s non-London airports. Figure 2.2 outlines how passenger numbers at regional airports have moved during and post recession – they are recovering notably slower than passenger numbers at London airports. Table 2.2 takes a
EDINBURGHMANCHESTER
BIRMINGHAM GLASGOW BRISTOL
NEWCASTLEEAST MIDLANDS
LIVERPOOLBELFAST INTERNATIONAL
ABERDEEN LEEDS BRADFORD
BELFAST CITYSOUTHAMPTON
PRESTWICKCARDIFF WALES
EXETER DONCASTER SHEFFIELD
BORNEMOUTHINVERNESS NORWICH
CITY OF DERBY SCATSTA
BLACKPOOLHUMBERSIDE NEWQUAY
DURHAM TEES VALLEY DUNDEE
Airline 1 Airline 2 Airline 3 Airline 4 Airline 5 Other
THOMSON, RYANAIREASYJET, RYANAIR, BAFLYBE LTD, MONARCH AIRLINES, RYANAIR, THOMSONEASYJET, BA, FLYBE EASYJET, RYANAIREASYJET, JET2, THOMSON, BA, THOMAS COOKRYANAIR, THOMSON, JET2EASYJET, RYANAIREASYJETBA, EASTERN AIRWAYSJET2, RYANAIR, MONARCH AIRLINESFLYBE, AER LINGUS, BAFLYBERYANAIRTHOMSON, FLYBE, THOMAS COOK, KLM CITYHOPPERFLYBE LTD, THOMSONTHOMSON, WIZZ AIRRYANAIR, THOMSONEASYJET, FLYBE KLM CITYHOPPERRYANAIREASTERN AIRWAYSJET2KLM CITYHOPPER, EASTERN, BRISTOW HELICOPTERSFLYBE, ISLES OF SCILLY SKYBUSKLM CITYHOPPER, EASTERN AIRWAYS, THOMSONCITY JET
Percentage of traffic200 40 60 80 100
25
How are the business models of non-London airports changing, and how can they be expected to change further in time?
Figure 2.2: Passenger numbers at non-London airports fell during the recession. There are signs of recovery, but at a slower rate than at London airports.
Terminal passenger numbers at non-London and London airports, 2007-2013
Source: CAA airport statistics
closer look at passenger numbers at individual airports.
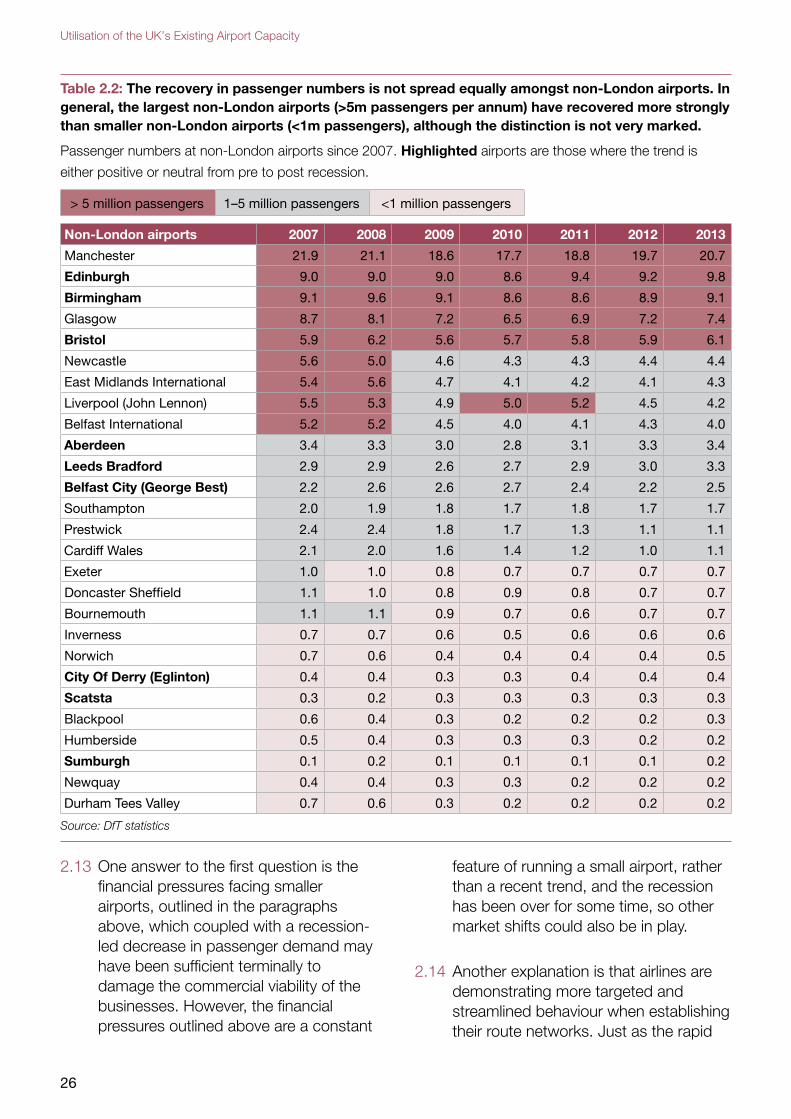
2.10 Whilst there are few trends to be drawn from Table 2.2, it may be possible to argue that the majority of the growth in passenger numbers occurs in the top half of the chart, amongst the larger airports. In addition, there are signs of positive and substantial growth at some regional airports, with the strongest growth at the larger airports (as a percentage of total passenger volumes) coming at Leeds/Bradford International and Belfast City.27 However, a number of the airports in the table have experienced significant contraction during the recession, losing half or more of their passenger traffic.
2.11 Unsurprisingly, such significant reductions in passenger numbers have led to a
27 The fastest growing airport in the UK in this period was Cambridge, which grew by 330% between 2007 – 2013, although in 2013 it still served less than 100,000 passengers.
number of airports facing financial difficulties, or closing altogether. In 2013 both Cardiff and Glasgow Prestwick airports were nationalised by their respective devolved administrations. The South West saw the closures of Plymouth and Filton airports in 2011 and 2012 respectively.28 And the future of Manston Airport in Kent was being disputed at the point this paper went to press. These closures may not be the last: aside from these five, a number of regional airports have reported significant losses in recent years.
2.12 It is important to consider both a) why a number of closures are occurring in quick succession and b) how problematic any closures of regional airports are.
28 Although Filton was not a commercial airport in the same manner as Plymouth or Manston.
70
80
90
100
110
120
130
140
150
Total London Airports Total Regional Airports
2013201220112010200920082007
Milli
ons
26
Utilisation of the UK’s Existing Airport Capacity
Table 2.2: The recovery in passenger numbers is not spread equally amongst non-London airports. In general, the largest non-London airports (>5m passengers per annum) have recovered more strongly than smaller non-London airports (<1m passengers), although the distinction is not very marked.
Passenger numbers at non-London airports since 2007. Highlighted airports are those where the trend is
either positive or neutral from pre to post recession.
> 5 million passengers 1–5 million passengers <1 million passengers
Non-London airports 2007 2008 2009 2010 2011 2012 2013
Manchester 21.9 21.1 18.6 17.7 18.8 19.7 20.7
Edinburgh 9.0 9.0 9.0 8.6 9.4 9.2 9.8
Birmingham 9.1 9.6 9.1 8.6 8.6 8.9 9.1
Glasgow 8.7 8.1 7.2 6.5 6.9 7.2 7.4
Bristol 5.9 6.2 5.6 5.7 5.8 5.9 6.1
Newcastle 5.6 5.0 4.6 4.3 4.3 4.4 4.4
East Midlands International 5.4 5.6 4.7 4.1 4.2 4.1 4.3
Liverpool (John Lennon) 5.5 5.3 4.9 5.0 5.2 4.5 4.2
Belfast International 5.2 5.2 4.5 4.0 4.1 4.3 4.0
Aberdeen 3.4 3.3 3.0 2.8 3.1 3.3 3.4
Leeds Bradford 2.9 2.9 2.6 2.7 2.9 3.0 3.3
Belfast City (George Best) 2.2 2.6 2.6 2.7 2.4 2.2 2.5
Southampton 2.0 1.9 1.8 1.7 1.8 1.7 1.7
Prestwick 2.4 2.4 1.8 1.7 1.3 1.1 1.1
Cardiff Wales 2.1 2.0 1.6 1.4 1.2 1.0 1.1
Exeter 1.0 1.0 0.8 0.7 0.7 0.7 0.7
Doncaster Sheffield 1.1 1.0 0.8 0.9 0.8 0.7 0.7
Bournemouth 1.1 1.1 0.9 0.7 0.6 0.7 0.7
Inverness 0.7 0.7 0.6 0.5 0.6 0.6 0.6
Norwich 0.7 0.6 0.4 0.4 0.4 0.4 0.5
City Of Derry (Eglinton) 0.4 0.4 0.3 0.3 0.4 0.4 0.4
Scatsta 0.3 0.2 0.3 0.3 0.3 0.3 0.3
Blackpool 0.6 0.4 0.3 0.2 0.2 0.2 0.3
Humberside 0.5 0.4 0.3 0.3 0.3 0.2 0.2
Sumburgh 0.1 0.2 0.1 0.1 0.1 0.1 0.2
Newquay 0.4 0.4 0.3 0.3 0.2 0.2 0.2
Durham Tees Valley 0.7 0.6 0.3 0.2 0.2 0.2 0.2
Source: DfT statistics
2.13 One answer to the first question is the financial pressures facing smaller airports, outlined in the paragraphs above, which coupled with a recession-led decrease in passenger demand may have been sufficient terminally to damage the commercial viability of the businesses. However, the financial pressures outlined above are a constant
feature of running a small airport, rather than a recent trend, and the recession has been over for some time, so other market shifts could also be in play.
2.14 Another explanation is that airlines are demonstrating more targeted and streamlined behaviour when establishing their route networks. Just as the rapid
27
How are the business models of non-London airports changing, and how can they be expected to change further in time?
growth in the low-cost short-haul sector led to the proliferation of services from the UK’s regional airports, so the maturation of this market may explain the reduction of these services. The low-cost market sector may have learnt to amend its business model or consolidate its services – speculating, for instance, on fewer new routes – in a manner that is not beneficial to smaller airports, or to airports some distance from major population centres. The Commission welcomes responses which explore this hypothesis, and which comment on the way in which recent changes to airline behaviour may be disadvantaging smaller or regional airports.
Population density in the UK and Europe
2.15 To turn to the second question, on how problematic the potential closures are, it is necessary to consider whether the
closures significantly disadvantage a) individual regions, b) the UK as a whole.
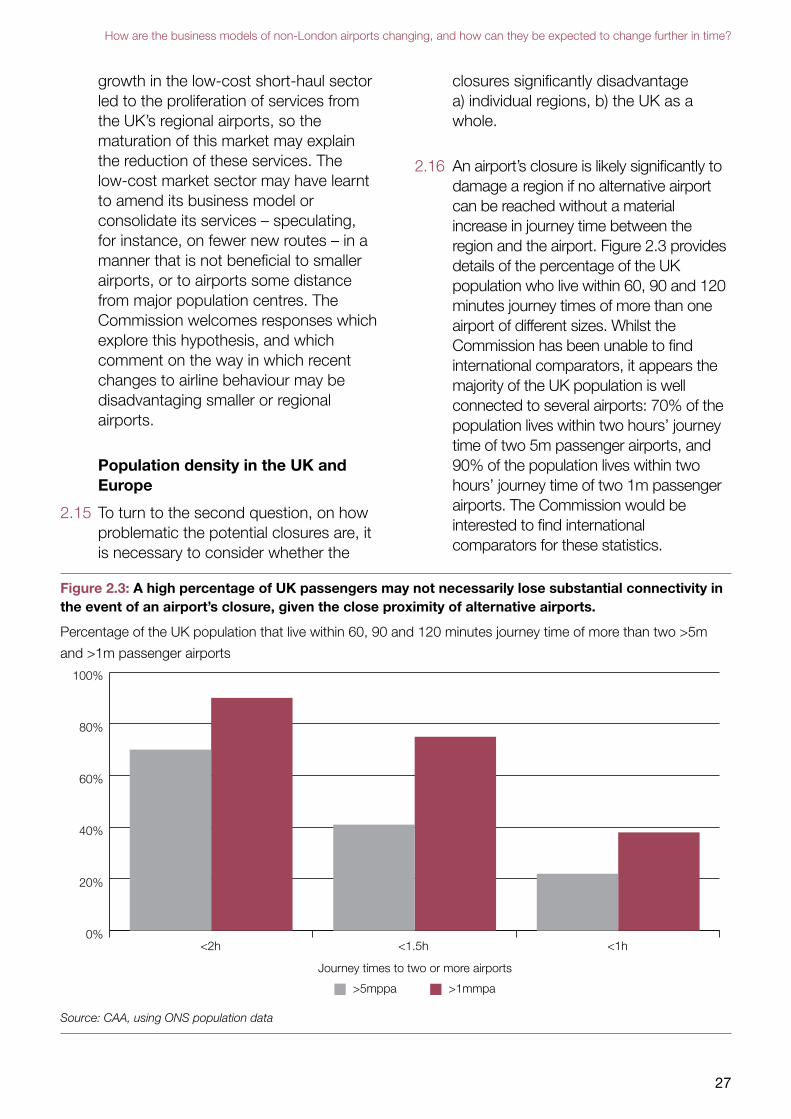
2.16 An airport’s closure is likely significantly to damage a region if no alternative airport can be reached without a material increase in journey time between the region and the airport. Figure 2.3 provides details of the percentage of the UK population who live within 60, 90 and 120 minutes journey times of more than one airport of different sizes. Whilst the Commission has been unable to find international comparators, it appears the majority of the UK population is well connected to several airports: 70% of the population lives within two hours’ journey time of two 5m passenger airports, and 90% of the population lives within two hours’ journey time of two 1m passenger airports. The Commission would be interested to find international comparators for these statistics.
Figure 2.3: A high percentage of UK passengers may not necessarily lose substantial connectivity in the event of an airport’s closure, given the close proximity of alternative airports.
Percentage of the UK population that live within 60, 90 and 120 minutes journey time of more than two >5m
and >1m passenger airports
0%
20%
40%
60%
80%
100%
<1h<1.5h<2h
Journey times to two or more airports
>5mppa >1mmpa
Source: CAA, using ONS population data
28
Utilisation of the UK’s Existing Airport Capacity
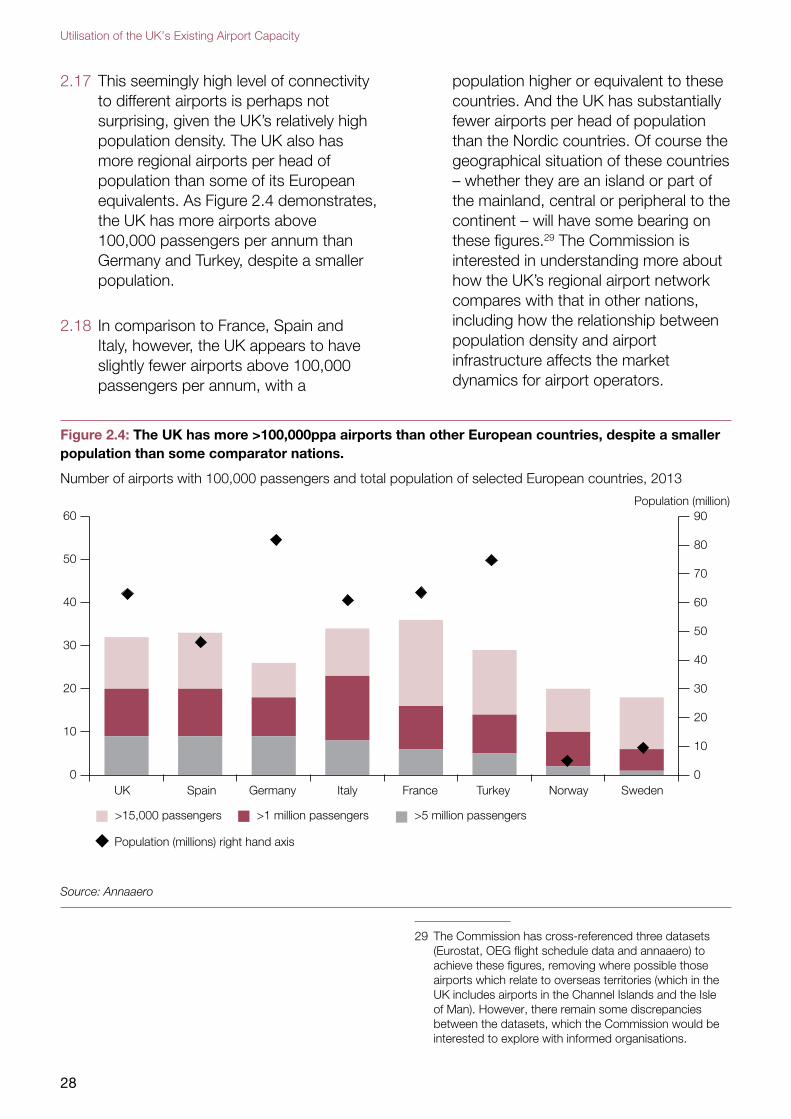
2.17 This seemingly high level of connectivity to different airports is perhaps not surprising, given the UK’s relatively high population density. The UK also has more regional airports per head of population than some of its European equivalents. As Figure 2.4 demonstrates, the UK has more airports above 100,000 passengers per annum than Germany and Turkey, despite a smaller population.
2.18 In comparison to France, Spain and Italy, however, the UK appears to have slightly fewer airports above 100,000 passengers per annum, with a
population higher or equivalent to these countries. And the UK has substantially fewer airports per head of population than the Nordic countries. Of course the geographical situation of these countries – whether they are an island or part of the mainland, central or peripheral to the continent – will have some bearing on these figures.29 The Commission is interested in understanding more about how the UK’s regional airport network compares with that in other nations, including how the relationship between population density and airport infrastructure affects the market dynamics for airport operators.
Figure 2.4: The UK has more >100,000ppa airports than other European countries, despite a smaller population than some comparator nations.
Number of airports with 100,000 passengers and total population of selected European countries, 2013
0
10
20
30
40
50
60
SwedenNorwayTurkeyFranceItalyGermanySpainUK0
10
20
30
40
50
60
70
80
90Population (million)
Population (millions) right hand axis
>15,000 passengers >1 million passengers >5 million passengers
Source: Annaaero
29 The Commission has cross-referenced three datasets (Eurostat, OEG flight schedule data and annaaero) to achieve these figures, removing where possible those airports which relate to overseas territories (which in the UK includes airports in the Channel Islands and the Isle of Man). However, there remain some discrepancies between the datasets, which the Commission would be interested to explore with informed organisations.
29
How are the business models of non-London airports changing, and how can they be expected to change further in time?
2.19 In the round, the above analysis suggests that many UK citizens have access to multiple airports, and that some consolidation of the market may be absorbed without causing significant diminution of connectivity to either individual regions or the UK as a whole. Indeed, it may be argued that consolidation of the UK’s regional airports into fewer, larger airports could enhance regional connectivity, as larger airports serving bigger catchment areas could attract a wider range of services, enhancing route networks and other services.
2.20 But these figures tell us nothing of the particular circumstances of individual communities, some of which may feel keenly the loss of adjacent capacity, or may require air connectivity to prevent isolation from cultural or economic centres. Neither do these figures consider the loss of jobs, and wider economic benefits or utility that can accompany the closure of airports.
2.21 So far this analysis has considered the financial pressures on regional airports purely in terms of closure, but there is evidence of financial pressures affecting the industry in other, less drastic ways. The high number of regional airports in the UK, coupled with their close proximity to each other, appears to be generating an intensively competitive environment in which airports compete with each other for airlines and passengers. It is possible that this competition could be raising standards and driving down fares for passengers – the Commission would encourage respondents to submit evidence of such positive impacts, if possible.
2.22 Furthermore, the intense competition may be causing more regional airports to diversify their businesses. In
December 2013 the Financial Times reported that a number of regional airports are starting to capitalise on their land assets. For instance, Durham Tees Valley was ‘developing income streams by seeking approval for housing, office, leisure and business space’.30 Further specialisation and diversification may come from pursuing particular airlines, the freight or business jet market, and other sectors.
2.23 This analysis poses questions as to the role Government should play in supporting the UK’s regional airports. This question is particularly relevant given the recent nationalisations of Cardiff and Glasgow Prestwick, in contrast to the recent closures of Plymouth, Filton and possibly Manston airports.
2.24 The Government’s Aviation Policy Framework states that ‘We support the growth of airports in Northern Ireland, Scotland, Wales and airports outside the South East of England’, but also notes that ‘The Government wants to see the best use of existing airport capacity’.31 Similarly, the European Commission recently stated that ‘The development of regional airports is important for economic growth and territorial cohesion. At the same time, a proliferation of regional airports which leads to the duplication of unused or not efficiently used airport infrastructure should be avoided.’32
2.25 Deciphering what constitutes ‘territorial cohesion’, ‘duplication’ and ‘not efficiently used’ infrastructure is, therefore, crucial to making effective
30 Financial Times, ‘UK’s small airports hit hardest by intense competition’ (Dec 2013).
31 Aviation Policy Framework, paragraph 1.24.
32 European Commission, ‘Commission adopts new guidelines on state aid to airports and airlines’, p.5.

30
Utilisation of the UK’s Existing Airport Capacity
interventions in the regional airports sector. These issues may be further complicated in the future by, for example, tighter and more restrictive carbon policies.
2.26 The Commission is interested to hear views on the strategic context for regional airports in the future, and how the current market dynamics support or detract from this context. The various levers for influencing these dynamics are the topic of the next chapter.
31
Can the connectivity provided by these airports be enhanced?
3. Can the connectivity provided by these airports be enhanced? What are some of the options for Government and other bodies to intervene in this sector?
3.1 The preceding chapters have attempted to sketch some of the traffic and connectivity trends at non-London airports, and to consider how regional airports are responding to these developments. The paper has posed questions about these emerging trends, and has asked respondents to consider whether these developments are problematic in terms of the UK’s overall connectivity.
3.2 This chapter presents some of the options that are open to Government or other bodies to support or bolster regional airports, and considers their implications. The Commission is interested in respondents’ views on the potential actions here discussed, and on the wider question of the role of local or national Government in the aviation market.
3.3 The chapter considers the provision of state aid, before exploring a range of other supportive measures. In addition, considering longer term developments, the chapter outlines some of the opportunities provided by overarching policy and planning frameworks.
State-aid
3.4 As we have seen in Chapter 2, the majority of smaller European airports operate at a loss. As a result, these airports have historically been recipients of state aid.
3.5 State aid in the aviation industry can take a number of forms. Support for airports can come in the form of operating aid, such as subsidies for the provision of lower landing fees or the provision of marketing funds. The state may also provide investment aid, be that investment in an airport’s infrastructure or its associated surface access. Finally, operating aid can be provided to airlines for a short period of time to support existing or develop new routes. Within the EU, state support for an airport or an airline must usually be justified on the grounds of supporting the regions that airports and airlines serve, rather than the businesses themselves.
Infrastructure financing and start-up funding
3.6 In February 2014 the European Commission (EC) adopted new guidelines on state aid to airports and airlines. The guidelines set out the conditions under which Member States and local authorities could grant state aid to airports and airlines in the EU. A number of Member States currently subsidise the operating costs of their smaller regional airports, and the new guidelines have been described as providing ‘revised rules that phase out public subsidies, [whilst giving] lossmaking airports a decade to adjust
32
Utilisation of the UK’s Existing Airport Capacity
to the change’.33 The provision of operating aid to regional airports has not been common practice in the UK, given the predominantly privatised nature of its aviation industry.
3.7 However, two areas are perhaps of particular relevance. First, the new guidelines allow Member States to grant state aid to finance infrastructure investment at airports of less than 5m passengers per annum, so long as ‘a genuine transport need and positive externalities for a region can be established’.34 Maximum levels of aid can range from 75% to 25% of eligible costs. Given the UK Government’s historical reluctance to support the provision of airport infrastructure within the UK’s privatised sector, it seems unlikely that this is an option the UK Government will pursue.
3.8 Second, under certain conditions, airlines may receive ‘start-up aid’ that gives them the necessary incentive to create new routes from regional airports. The specific details are as follows:
Airlines departing from airports with fewer than 3 million passengers per year can receive start-up aid for up to three years for increasing the connectivity of a region by launching a new route. The aid may cover a maximum of 50% of the airport charges and should be allocated on a non-discriminatory basis. An ex ante business plan should show that the route will become profitable after the start-up period. In the absence of a
33 Financial Times, ‘Brussels relaxes crackdown on regional airport sweeteners’, February 2014.
34 For airports with over 5mppa, the rules are much stricter: ‘for large airports with a passenger volume of over 5 million per annum, investment aid should in principle not be declared compatible with the internal market, save in very exceptional circumstances, such as relocation of an existing airport, characterised by a clear market failure and taking into account the magnitude of the investment and the limited competition distortions.’
business plan for a route, the airline must provide an irrevocable commitment to continue operating the route for at least the same period as the one during which it received start-up aid.
The published guidelines make it clear that aid to airports with under 3m passengers per annum is only applicable to ‘another airport within the Common European Aviation Area.’35
3.9 The EC guidance is less clear on what actions Member States and Local Authorities may take in relation to services operating to airports of between 3-5m passengers per annum, noting that any state aid to these airports can be considered compatible with the internal market only in ‘duly substantiated exceptional cases’.
3.10 The recent amendments to the EC guidelines were swiftly followed in the budget, this March, by the Government’s decision to double the amount of funding in its Regional Air Connectivity Fund, and to widen the scope of the fund so as to allow applications for start-up funding for airlines operating from regional airports with up to 5m passengers per annum.
3.11 It seems that these recent developments – amendments to the EC’s guidelines on state aid, coupled with the Government’s provision of funds in this area – could provide opportunities for regional airports.
3.12 The Commission understands that the Department for Transport is planning to consult this summer on how to interpret the new guidelines, and on how best to allocate the funding set aside by the
35 European Commission guidelines and supplementary guidance, taken from the Europa website.
33
Can the connectivity provided by these airports be enhanced?
Government in the recent budget. The Commission welcomes this consultation, and will follow the Government’s response with interest.
3.13 However, there remain a number of further questions about the state aid policy. How effective will any such policy be at growing regional connectivity? Is Government funding sufficiently large to promise significant benefits in this area? And what negative repercussions may state-aid provision generate elsewhere in the sector?
3.14 To answer the first question, it is worth reviewing the Route Development Funding policy pursued in the mid-noughties by the UK Government and implemented, via various regional government structures, in Northern Ireland, Scotland, Wales and the North East of England (a further route development fund was mooted in the North West of England, but never came to being).
3.15 The Centre for Aviation has analysed the performance of these Route Development Funds and argues that they were somewhat effective at attracting new routes, although different UK regions achieved varying degrees of success. The funds were ‘principally set up to bring in tourist visitors and aid business’, and had to be carefully designed and managed to ensure they worked towards these outcomes.36 Any future start up funding would need to navigate similar terrain.
3.16 In relation to the second question, it is instructive to consider an example. For these purposes we shall assume that the new EU State-Aid Guidelines can be interpreted so as to allow the
36 Centre for Aviation, ‘UK regional air connectivity fund – which airports does it help? And what is a “region” anyway?’ (April 2014).
establishment of a new route from a regional airport of 3-5m passengers per annum to a destination outside of the EU.37 Using an average of total airport charges for a range of regional airports of between 3-5m passengers per annum, and considering the operation of an A340-200 in a 2-class setting (around 300 seats) operating one return flight a day, 7 days a week, with a load factor of 80%, the total airport charges for a new route to the USA could amount to £2-3m per year. (These costs are based on 2103/14 published airport charges and are only for the UK end of the route.) Under the new state aid guidelines the Government would therefore be entitled to subsidise £1-1.5m of these costs, as a maximum. If airport landing charges tend to be around 10% of an airline’s operating costs, then this £1-1.5m subsidy could equate to around 5% of the costs of establishing a new route. The Regional Air Connectivity Fund has earmarked funds of £20m spread over the period of 2013-15.
3.17 The Commission would like to understand the extent to which this level of financial aid could act as a serious incentive to the development of new routes, and therefore how far the Government’s Regional Air Connectivity Fund could be expected to bring about a positive change in regional connectivity.
3.18 Finally, the Commission wishes to understand the case for refraining from providing state aid. It notes that recent state nationalisations of airports in the UK have divided opinion, with some competing operators arguing that such actions unfairly distort competition in the
37 Note, the airport must have sufficient runway length and terminal capacity to facilitate such a route.
34
Utilisation of the UK’s Existing Airport Capacity
market-place.38 To what extent can the same arguments be levelled at start-up funding? The Commission is interested to hear opinions on the framework via which state-aid interventions ought to be justified.
Public Service Obligations
3.19 One additional source of state-aid may come through Public Service Obligations (PSOs), the vehicle through which EU Member States may safeguard air services to airports serving a peripheral or development region, where such a route is considered vital for the economic and social development of the region. The UK’s guidance on how to apply for and establish PSOs for maintaining domestic air access to London was updated in December 2013, in response to the establishment of the Regional Air Connectivity Fund announced in the 2013 Autumn Statement.39
3.20 The PSO regulations allow the Government to safeguard slots for that route at an airport (the only occasion within the EU Slots Regime when a Government can intervene on airport slot co-ordination). However, PSOs are used to safeguard links between regions, and therefore may establish routes to any airport that serves that region – thus any PSOs established to London and the South East are very unlikely to be established at Heathrow. In addition to safeguarding an airport slot, the Government may also ‘where appropriate’ provide funding to an airline to compensate its running a non-commercially viable service. In the UK Dundee City Council has undertaken a
38 See the following BBC news article relating to Scottish airports: http://www.bbc.co.uk/news/uk-scotland-scotland-business-27061810
39 Public service obligation: regional air access to London, found here: https://www.gov.uk/government/publications/public-service-obligation-regional-air-access-to-london
tender process to find an operator to provide a PSO service between Dundee and London. And the Commission understands that Cornwall County Council has been in discussion with the Department for Transport and will shortly be in a position to launch a tender process for a Newquay to London route. Prior to these recent establishments, the UK’s only PSOs operated between Scottish islands, or from these islands into the mainland.40
3.21 One notable difference between the UK’s application of PSOs and that of some other EU members is that some Member States appear to use the provision to safeguard links between secondary and tertiary cities. In contrast, the UK has historically used the fund to connect its remote islands to the mainland or to each other, or to link remote regions into the capital, only. A check against the list of PSOs published by the European Commission identifies that these are the two most common uses of a PSO amongst Member States.41
3.22 However, there are some notable instances of Member States appearing to establish PSO routes outside of these patterns. Both France and Germany have used PSOs to safeguard links to their major, non-capital, cities. Between 2009 and 2014 France established a PSO route between Lyon and a number of large French cities, including Le Havre (6hrs 30 mins by road), Lorient (7hrs 45 mins by road) and Poitiers (4hrs 50 mins by road). Between 2009 and 2012 Germany established similar PSO routes linking
40 There is also a PSO between Anglesey and Cardiff, due to expire in December 2014.
41 European Commission, ‘List of Public Service Obligations’ (February 2013), found here: http://ec.europa.eu/transport/modes/air/internal_market/doc/pso_-_eu_and_eea_-_feb_2013.pdf
35
Can the connectivity provided by these airports be enhanced?
major conurbations, including one from Munich to Erfurt (4hrs by road).42
3.23 We noted earlier (paragraph 1.14) that traffic between the UK’s regional (non-London to non-London) airports has declined in recent years. Yet the establishment of PSOs on endangered domestic regional routes, as opposed to domestic routes into the capital, does not appear to be within the ambit of the latest Government guidance on the establishment of PSOs, nor within the terms of the Regional Air Connectivity Fund. The Commission would like to understand whether there is a case for the UK to broaden the usage of PSOs to align it with the practice of some other Member States.
Alternative measures to enhance regional airports
3.24 In addition to state aid, a range of additional measures may be undertaken to help support regional airports. The Commission is keen to hear views on the applicability and effectiveness of all of the following: the current tax regime, targeted intervention in the tourism market, local enterprise zones, and, building upon the recommendations already made by the Commission in its Interim Report, improved surface access links.
Air Passenger Duty
3.25 Reforms to Air Passenger Duty (APD) have been pursued strongly by industry in recent years. Analysis into changes to the tax have been published by a number of airlines, including a joint venture by BA, Virgin, Easyjet and Ryanair, and the Commission considered a number of suggestions in relation to APD-reform last year as part of its consideration of short-term options
42 All times taken from Google maps.
to improve the use of existing capacity.43 The Commission notes that as part of the Government’s wider taxation policy any changes to APD will have implications beyond the aviation industry, and therefore need to be considered in this broader context.
3.26 Earlier this year the Government announced the abolition of the two highest bands of APD, effective from April 2015. This move has been welcomed by many parts of the aviation industry. The policy objective of the change, as stated on the .gov.uk website, is to ‘[contribute] to the UK’s growth opportunities by lowering the cost of travelling to many emerging market destinations such as China, India and Brazil.’44 The Commission is interested to understand the likely success of the recent amendment in achieving this objective, particularly in the context of non-London airports, and encourages respondents to provide evidence of any changes to airline behaviour that the recent announcement may have generated, or could generate in future.
3.27 Whilst welcoming the recent change, opponents of the tax argue that the remaining bands discourage airlines from establishing routes to UK airports, and may therefore act as a brake on the economies that these airports serve. This complaint is voiced particularly strongly by providers (or would-be providers) of domestic routes, as return passengers on these services must pay the tax twice, once for each departure from a UK airport. As we have seen, the doubling of Air Passenger Duty in 2007 is one of a number of suggested
43 See Interim Report, Chapters 4 and 5.
44 HM Treasury, Air Passenger Duty: Banding Reform, found here: https://www.gov.uk/government/uploads/system/uploads/attachment_data/file/293853/TIIN_6063_air_passenger_duty_banding_reform.pdf
36
Utilisation of the UK’s Existing Airport Capacity
explanations for the recent decline in domestic air connectivity (1.24).
3.28 The case has been put to the Commission that it may be possible to end the current practice of incurring an APD charge on each flight of a domestic return trip – the so-called ‘double whammy’. However, the Commission understands that in 1998 the EC ruled that the practice of charging APD on only one leg of a domestic return journey, which was the UK practice at the time, was in contravention of the EU treaty, because it did not provide the same effective tax treatment for all EU flights. The Commission is not minded to question this judgement, unless representations can be made to the contrary by respondents.
Targeted international tourism
3.29 One means of stimulating traffic at non-London airports is to attract tourists to the area that the airport serves. Historically the large majority of international tourists to the UK have called predominantly at London, or begun and ended their journey at London airports with some travelling around the country in-between.
3.30 In recent years the UK’s international tourism agencies, VisitBritain, VisitEngland, VisitWales and VisitScotland, have worked hard to establish regional destinations outside of London as destinations in their own right. This requires first the attraction of tourists, and, second, the establishment of an air route to serve, facilitate and further stimulate the new tourist demand.
3.31 For instance, in recent years VisitBritain, the agency responsible for promoting British tourism overseas, has played a
role in marketing the possibilities for international tourists accessing regional airports. The agency has developed consortia with airports and marketing bodies to develop ‘gateway’ promotions, focusing on building demand for travel to tourist locations accessible from these airports. The first example of this approach was a joint campaign between tourist board, airport, city and airline in support of the new Air India route to Birmingham, which commenced operation in 2013. The campaign measurably increased load factors on flights inbound to the UK.45 Similarly, VisitWales and VisitScotland both have large international marketing budgets, which they deploy alongside their airports at airline route development conferences.
3.32 National and local destination organisations can also work with airports as they negotiate with airlines to develop new air routes, by creating or match-funding a destination marketing campaign to help promote a route in its early stages, or, in the case of national agencies, by making use of the UK’s wider diplomatic machinery, for instance by deploying support from FCO and UKTI officials. This support played a part in the successful negotiation of the new chartered air route between Birmingham and Beijing, which will operate for the first time in the summer of 2014.
3.33 Finally, VisitEngland has established a Regional Airports Task Force, bringing together regional airports, Local Enterprise Partnerships and local destination organisations, to foster collaborative and pro-active work between these organisations in seeking out or strengthening international tourism opportunities in their areas.
45 Comment provided by VisitBritain.
37
Can the connectivity provided by these airports be enhanced?
3.34 The Commission is interested to hear more about the successes and future possibilities of targeted tourism intervention.
Local Enterprise Zones
3.35 A further potential route to growth for regional airports is to seek to become designated, or for their surrounding areas to become designated, as Local Enterprise Zones. These bodies, established under the coalition Government, provide guarantees to businesses that establish themselves on the premises, such as business rate discounts for a time-bound period, as well as tax incentives for capital investment. The sites are also prioritised for future infrastructure upgrades, such as the early roll out of superfast broadband.
3.36 Of the 25 Local Enterprise Zones established around the country, three are centred on regional airports: Newquay Aerohub, where business is focused on advanced manufacturing and aerospace technology; Manchester Airport City, which focuses on the same issues but also pharmaceutical and industrial biotechnology; and Doncaster Robin Hood, announced only in March of this year, which is ‘[proactively encouraging] businesses in the manufacturing and engineering sectors […] into the region’.46
3.37 The Commission is interested in understanding the interplay between the airport and these enterprise zones. To what extent has the designation had an impact upon the airport’s traffic or commercial viability (such as its ability to generate greater non-aeronautical revenue)? How do the performances of
46 http://www.robinhoodairport.com/corporate-community/media-centre/press-releases/new-enterprise-zone-to-encourage-economic-growth-in-doncaster
the local enterprise zones at non-airport sites compare with those centred on an airport? How do the two institutions combine or co-exist, and what plans are in train to further develop in these areas?
Surface access improvements
3.38 Poor surface access links to airports can act as a brake on passenger demand, damage the commercial case for prospective airlines and ultimately lower the utility of an airport.
3.39 In Phase One of the Commission’s work programme it considered the case for surface access improvements to the UK’s airports, asking respondents to its consultation on short and medium term measures for making better use of existing capacity to identify priority areas for development. In its Interim Report, and prior to this in a letter to the Chancellor in relation to the National Infrastructure Plan, the Commission set out its recommendations in this area, including calls for improved surface access (or feasibility studies for improved surface access) at a number of South East airports and continued support for the Birmingham Gateway Project, the Northern Hub (to serve Manchester Airport) and improved bus links (or, in future, light rail options) to Glasgow Airport.
3.40 In relation to surface access to the UK’s smaller regional airports the Commission noted in its Interim Report that its
resources and remit mean that it is not the appropriate body to reach a view on many of the schemes proposed for improving access to smaller and regional airports. However, it is important that these airports can serve their local markets effectively, so central Government should work with Local Authorities and Local Enterprise
38
Utilisation of the UK’s Existing Airport Capacity
Partnerships to ensure that proper consideration is given to the needs of airport users when prioritising local transport investment.47
3.41 The Commission wishes to know how effective its recommendation in this area has been. To what extent do the named bodies liaise effectively to prioritise and progress surface access to regional airports, and how could this system be improved further? The Commission notes that where these parties work collaboratively – such as in Bristol, where local councils and the airport have worked closely together to improve the frequency, reliability and convenience of link bus services (with further improvements due to complete in 2016) – the improvements can be marked.
3.42 Further to last year’s call for evidence the Commission has continued to be presented with options for enhancing surface access at a number of non-London airports. Regional stakeholders may wish to continue to share details of options for potential or prospective surface access improvements, so as to inform any future recommendations the Commission may wish to make in this area.
The planning and policy framework
3.43 In addition to the above interventions, one fundamental means of supporting non-London airports is to ensure that the overarching policy framework supports their development. As noted in Chapter 2, the Government’s Aviation Policy Framework (APF), published in 2013, does this: ‘We support the growth of airports in Northern Ireland, Scotland, Wales and airports outside the South East of England’. This national-level policy support will be of benefit to
47 Interim Report, 5.89.
regional airports as they pursue planning permission and other developments at a local level.
3.44 Beyond this broad statement of support, however, is it possible to strengthen the policy framework that surrounds regional airports? This could include the backing of specific policies relating to regional airports. For instance, Bristol Airport has noted that when new technologies or policies are rolled out – such as new security or customs measures – prioritising their early implementation at regional airports may offer both a boon to these businesses, and a relatively sheltered environment in which to trial new practices.48 The Commission is interested to hear views on whether enshrining intentions such as these at the level of national policy would offer effective support.
3.45 There are several available vehicles for the Government to set national policy, for instance National Policy Statements (NPS) or White Papers. Under the Planning Act 2008, as amended by the Localism Act, the Secretary of State is empowered to publish a NPS on airports, setting out his assessment of the need for Nationally Significant Infrastructure Projects (NSIPs) of this kind.49 In this context, ‘nationally significant’ is defined in legislation as any development that would increase the capacity of an airport by more than 10 million passengers per year or 10,000 traffic movements – developments typically larger than those likely to occur at many regional airports. Nonetheless, as a statement of overarching Government policy a NPS could have resonance throughout the planning system.
48 Bristol Airport, ‘Giving Wings to Regional Airports’ (2013).
49 Applicable only to England and Wales, as planning policy is devolved to Scotland, which has established its own National Planning Framework.
39
Can the connectivity provided by these airports be enhanced?
3.46 The Commission is interested in exploring the implications and potential benefits of any NPS for airports. Later this year it will be publishing a further discussion paper on issues relating to the delivery of new infrastructure, which will consider how the Commission’s recommendations may be delivered as efficiently and expeditiously as possible, and will examine the planning framework in more detail. Respondents wishing to consider this issue in relation to non-London airports are encouraged also to respond to that discussion paper. The topic of planning and policy support is also covered with respect to airports serving London and the South East in Chapter 6 of this paper.
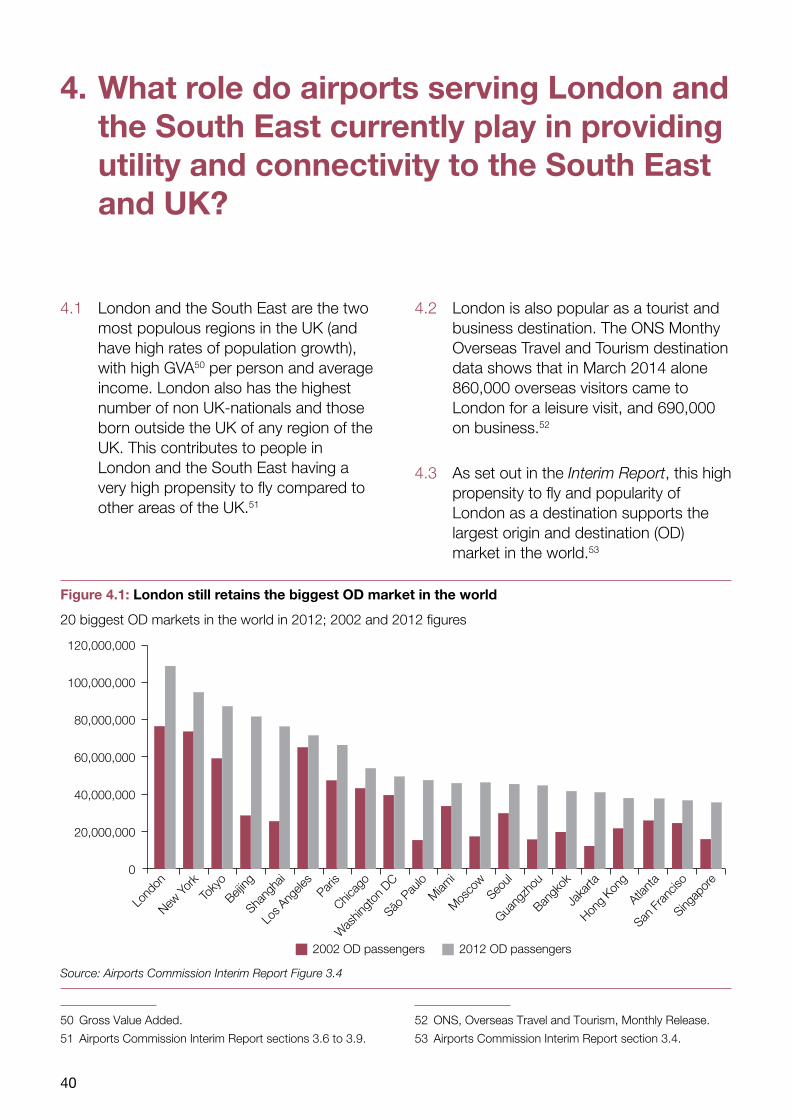
40
Utilisation of the UK’s Existing Airport Capacity
4. What role do airports serving London and the South East currently play in providing utility and connectivity to the South East and UK?
4.1 London and the South East are the two most populous regions in the UK (and have high rates of population growth), with high GVA50 per person and average income. London also has the highest number of non UK-nationals and those born outside the UK of any region of the UK. This contributes to people in London and the South East having a very high propensity to fly compared to other areas of the UK.51
50 Gross Value Added.
51 Airports Commission Interim Report sections 3.6 to 3.9.
4.2 London is also popular as a tourist and business destination. The ONS Monthy Overseas Travel and Tourism destination data shows that in March 2014 alone 860,000 overseas visitors came to London for a leisure visit, and 690,000 on business.52
4.3 As set out in the Interim Report, this high propensity to fly and popularity of London as a destination supports the largest origin and destination (OD) market in the world.53
52 ONS, Overseas Travel and Tourism, Monthly Release.
53 Airports Commission Interim Report section 3.4.
Figure 4.1: London still retains the biggest OD market in the world
20 biggest OD markets in the world in 2012; 2002 and 2012 figures
120,000,000
100,000,000
80,000,000
60,000,000
40,000,000
20,000,000
0
Lond
on
New Yo
rkTo
kyo
Beijing
Shang
hai
Los A
ngele
sPar
is
Chicag
o
Was
hingt
on D
C
São P
aulo
Miam
i
Mos
cow
Seoul
Guang
zhou
Bangk
ok
Jaka
rta
Hong
Kong
Atlant
a
San Fr
ancis
o
Singap
ore
2002 OD passengers 2012 OD passengers
Source: Airports Commission Interim Report Figure 3.4
41
What role do airports serving London and the South East currently play in providing utility and connectivity to the South East and UK?
4.4 The sheer size of the market can deliver benefits of scale to both London and the South East but also the UK as a whole. These impacts are covered in detail in Chapter 3 of the Interim Report and support the Commission’s assessment that there is a clear case for one net additional runway in London and the South East, to come into operation by 2030.
4.5 However, the combined London system of several independent competing airports drives additional benefits to London and the South East, and the UK as a whole, beyond those delivered by the scale of capacity. These benefits include:
●● Specialisation: Several airports serving London and the South East have taken advantage of the scale of the London market to specialise in a specific passenger or travel type. A good example of this is City Airport’s specialisation in short-haul European business travellers, providing passengers and airlines with the opportunity to choose an airport that most suits their needs and preferences.
●● Choice: Since the break-up of BAA London has had several independently owned and run airports. Passengers have the opportunity to fly to destinations from different airports in different geographical locations, with different surface transport connections, terminal facilities, airline types (e.g. low cost and legacy) and mixtures of short and long-haul routes.
●● Scope to accommodate growth: Under any of the proposals additional capacity will not be delivered at Heathrow or Gatwick until the 2020s. Even once this additional capacity has come on stream the demand for
aviation in London and the South East cannot be met by growth at Heathrow or Gatwick alone. The other airports serving London and the South East will continue to need to provide capacity to meet this demand.
●● Denser Routes for UK as a whole: While some UK passengers also transfer at non UK airports, for many a London airport can provide a valuable transfer opportunity.54
4.6 Several definitions can be used to determine which airports in the South East are London airports. We make no attempt to define this in this paper, and recognise that many airports such as Bournemouth, Birmingham and Southampton not discussed in detail in this paper play a valuable role in providing connectivity and capacity to some parts of London or the South East, and that some airfields that do not run commercial flights but provide infrastructure for leisure flights or specialist services (e.g. Lasham airfield or Duxford Aerodrome) also provide valuable benefit to their communities or the aviation industry generally.
54 Although the majority of these transfers occur at Heathrow and Gatwick the CAA Passenger Survey Report 2012 showed 172,000 domestic passengers connected in Stansted, City and Luton.
42
Utilisation of the UK’s Existing Airport Capacity
5. What strategies have airports serving London and the South East historically pursued? How are these changing, and how can they be expected to change further?
Capacity and demand
5.1 As part of its Interim Report the Airports Commission reviewed demand for and supply of air travel across several scenarios.55 Across all scenarios the Commission forecast that there would be significant growth in demand for aviation between now and 2050, placing additional pressure on already stressed airport infrastructure in London and the South East. The London airport system was forecast to be under pressure in 2030, and by 2050 demand will exceed the total available capacity.
5.2 By 2030 in the carbon capped, capacity unconstrained forecast (in which passenger choices are not restricted by the limitations of existing runways or other infrastructure) the total demand across the London airport system was projected to reach 96% of the available runway capacity (90% in the carbon capped, capacity constrained forecast). The Commission noted that these rates of utilisation are at or above the point at which high levels of reliability would no longer be able to be maintained – particularly on a system-wide basis.56
5.3 Given the relatively limited scope to redistribute this demand away from
55 Airports Commission Interim Report, Chapter 2.
56 Airports Commission Interim Report, Section 4.19.
London and South East airports the Commission concluded that there is a case for at least one net additional runway in London and the South East by 2030, and probably another by 2050.
5.4 Behind this overall supply and demand comparison, demand for specific London airports compared to their supply of capacity is different. The variance is dependent on factors such as the airports catchment area and the type of travel the airport specialises in (e.g. destinations, leisure/business), as well as the capacity available. This means that different London airports experience capacity crunches at different times, as Figure 5.1. All London airports are expected to reach capacity by 2041, with the majority reaching capacity much earlier.57
5.5 The above data is based on 100% utilisation of the theoretical maximum capacity58, which is unlikely to be desirable or operationally feasible. It also provides only a broad picture of capacity and demand. Several factors make the picture more complex, and lead to the
57 Southend is not shown in figure 5.1 and has only recently begun operating as a commercial airport, please see Figure 5.3 for details on capacity and demand
58 In the model capacity can be constrained by either runway or terminal capacity, these also reflect current planning limits
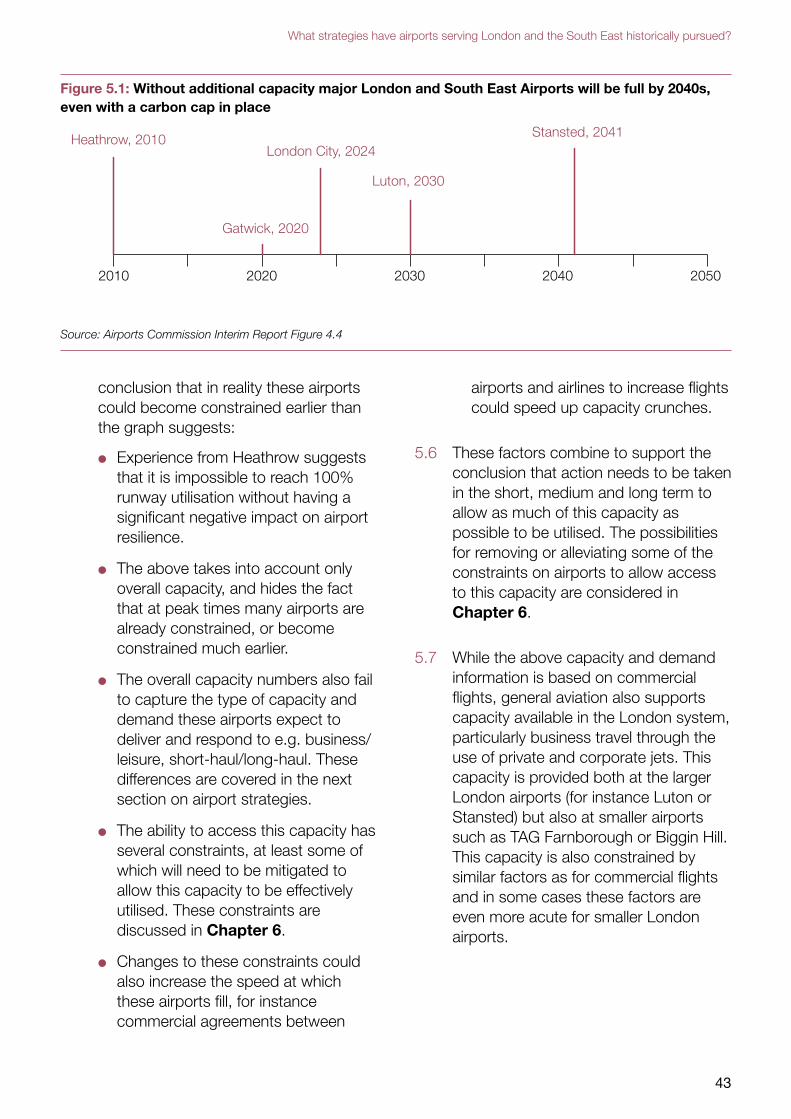
43
What strategies have airports serving London and the South East historically pursued?
Figure 5.1: Without additional capacity major London and South East Airports will be full by 2040s, even with a carbon cap in place
Heathrow, 2010London City, 2024
Stansted, 2041
Luton, 2030
Gatwick, 2020
2010 2020 2030 2040 2050
Source: Airports Commission Interim Report Figure 4.4
conclusion that in reality these airports could become constrained earlier than the graph suggests:
●● Experience from Heathrow suggests that it is impossible to reach 100% runway utilisation without having a significant negative impact on airport resilience.
●● The above takes into account only overall capacity, and hides the fact that at peak times many airports are already constrained, or become constrained much earlier.
●● The overall capacity numbers also fail to capture the type of capacity and demand these airports expect to deliver and respond to e.g. business/leisure, short-haul/long-haul. These differences are covered in the next section on airport strategies.
●● The ability to access this capacity has several constraints, at least some of which will need to be mitigated to allow this capacity to be effectively utilised. These constraints are discussed in Chapter 6.
●● Changes to these constraints could also increase the speed at which these airports fill, for instance commercial agreements between
airports and airlines to increase flights could speed up capacity crunches.
5.6 These factors combine to support the conclusion that action needs to be taken in the short, medium and long term to allow as much of this capacity as possible to be utilised. The possibilities for removing or alleviating some of the constraints on airports to allow access to this capacity are considered in Chapter 6.
5.7 While the above capacity and demand information is based on commercial flights, general aviation also supports capacity available in the London system, particularly business travel through the use of private and corporate jets. This capacity is provided both at the larger London airports (for instance Luton or Stansted) but also at smaller airports such as TAG Farnborough or Biggin Hill. This capacity is also constrained by similar factors as for commercial flights and in some cases these factors are even more acute for smaller London airports.
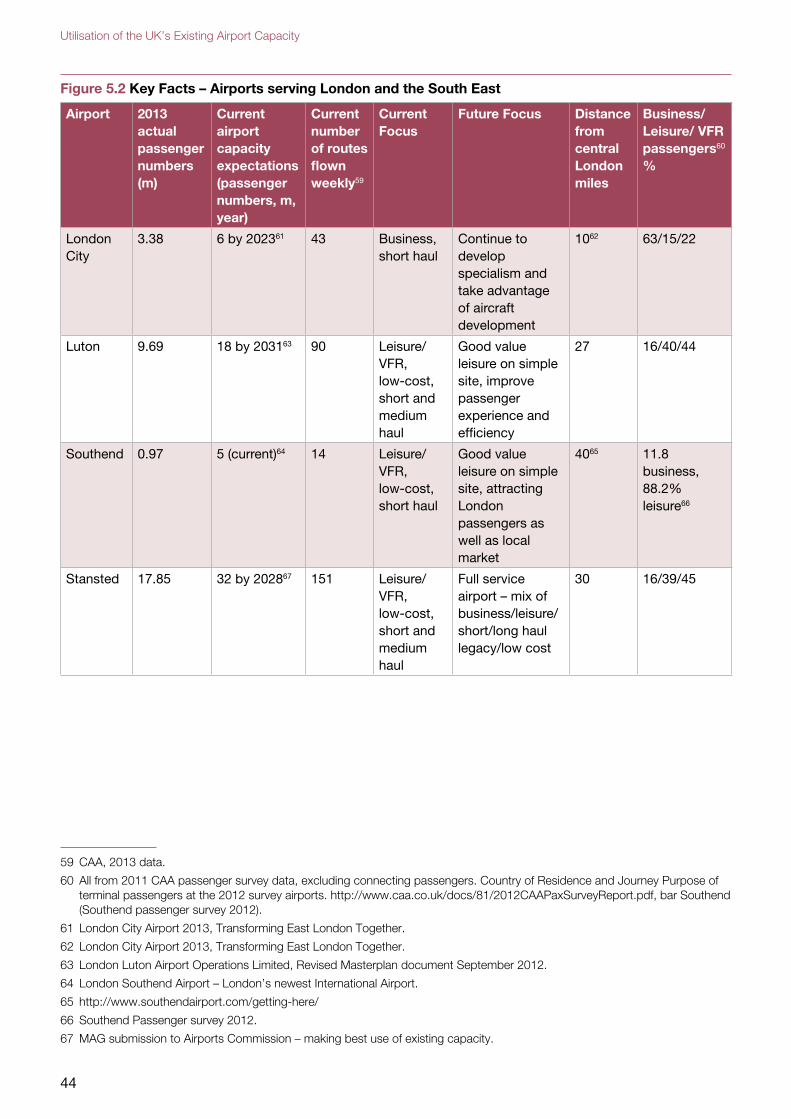
44
Utilisation of the UK’s Existing Airport Capacity
Figure 5.2 Key Facts – Airports serving London and the South East
Airport 2013 actual passenger numbers (m)
Current airport capacity expectations (passenger numbers, m, year)
Current number of routes flown weekly59
Current Focus
Future Focus Distance from central London miles
Business/Leisure/ VFR passengers60 %
London City
3.38 6 by 202361 43 Business, short haul
Continue to develop specialism and take advantage of aircraft development
1062 63/15/22
Luton 9.69 18 by 203163 90 Leisure/VFR, low-cost, short and medium haul
Good value leisure on simple site, improve passenger experience and efficiency
27 16/40/44
Southend 0.97 5 (current)64 14 Leisure/VFR, low-cost, short haul
Good value leisure on simple site, attracting London passengers as well as local market
4065 11.8 business, 88.2% leisure66
Stansted 17.85 32 by 202867 151 Leisure/VFR, low-cost, short and medium haul
Full service airport – mix of business/leisure/ short/long haul legacy/low cost
30 16/39/45
59 CAA, 2013 data.
60 All from 2011 CAA passenger survey data, excluding connecting passengers. Country of Residence and Journey Purpose of terminal passengers at the 2012 survey airports. http://www.caa.co.uk/docs/81/2012CAAPaxSurveyReport.pdf, bar Southend (Southend passenger survey 2012).
61 London City Airport 2013, Transforming East London Together.
62 London City Airport 2013, Transforming East London Together.
63 London Luton Airport Operations Limited, Revised Masterplan document September 2012.
64 London Southend Airport – London’s newest International Airport.
65 http://www.southendairport.com/getting-here/
66 Southend Passenger survey 2012.
67 MAG submission to Airports Commission – making best use of existing capacity.
45
What strategies have airports serving London and the South East historically pursued?
Airport strategies
5.8 The competition between London airports, and the legacy impact of BAA’s operating model, mean that several London airports currently focus on particular types of passenger, with different airports looking to shore up their competitive advantage, or change and develop their strategy. The strategies of the London airports are set out broadly below.
London City Airport
Current focus
5.9 London City Airport (City Airport) had 3.4 million passengers in 2013, to 44 weekly destinations. City Airport has specialised in providing business travel, normally short-haul to European business destinations, but also a single long-haul flight to JFK.
5.10 The percentage of business passengers at City Airport changes year to year but the airport’s working average is 65%. The airport’s geographical location to the west of Docklands and good transport links allow easy access from both the City and Canary Wharf. These business travellers need flights at peak times to allow them to attend meetings during the working day and then return to their home base. As such the airport has available capacity during the day and this off peak capacity is used for some flights to holiday destinations, such as Ibiza.
Proposed developments
5.11 City Airport currently has a live planning application to develop terminal facilities and on airfield developments. These are intended to improve reliability, customer experience and to enable the use of larger aircraft. This would allow the airport to increase ATMs to their
planning limit of 120,000 by 2023. The airport currently expect these changes to deliver 6m passengers per annum from 3.4m currently.
Future plans
5.12 City Airport’s future strategy is still focused on its core market, with the extra capacity not expected to change its business/leisure split (remaining at roughly 65/35). City Airport expects capacity to split relatively evenly between developing new routes (both to their current business markets and to new leisure destinations) and thickening current routes.
5.13 A key change for City Airport in the next 20 years will be the availability of new aircraft technology, for instance the Bombardier C Series, the first of which are expected to be in service next year. These planes could land on the short runway at City Airport and have a range of 5,500 km, which would bring the eastern seaboard of the United States within scope for City Airport flights (the current JFK flight needs to refuel in Shannon on the flight out), along with middle eastern destinations. The planes also have more capacity, increasing passenger numbers and improving the business case for these routes.
London Luton
Current focus
5.14 London Luton (Luton) had 9.7 million passengers in 2013, to 88 weekly destinations. Luton currently focuses on low-cost and charter flights to holiday or VFR destinations (currently 86% of Luton passengers are on low cost flights), with EasyJet, the Hungarian airline Wizz Air and Ryanair operating a large number of flights. Luton forecasts that 10.4 million passengers will use the
46
Utilisation of the UK’s Existing Airport Capacity
airport in 2014, which is near to the capacity of the current facilities.
Proposed developments
5.15 A recently approved (1 May 2014) development at Luton Airport would allow Luton to achieve a capacity of 18m passengers per annum by 2025 (up from 11.5m passengers per annum currently). The construction, over three phases, will: expand, modernise and remodel the terminal building, increase the numbers of stands, improve and develop road access, build a new parallel taxiway, improve access to the runway and build a new multi-storey car park. Along with the increase in capacity Luton is also focusing on improving the passenger experience and passenger and aircraft flow around its site.
5.16 The site also has the potential to be expanded further onto land in the control of the main shareholder, to provide more capacity, although the airport has no current plans to do so.
Future plans
5.17 Development of infrastructure at the site has been limited in recent years by different expectations from LLAL (the owner of the asset, whose major shareholder is Luton Borough Council) and LLAOL (the concessionaire appointed by LLAL to operate the airport day-to-day), which led to the two organisations publishing distinct masterplans for the airport in 2012. The airport’s current masterplan and associated planning application has now been agreed by both companies, setting out a common view of the medium-term business strategy of the airport.
5.18 The airport’s infrastructure plans are intended to enable it to increase capacity in its core market and deliver
a ‘good value’ rather than low cost proposition to passengers – in common with the ongoing brand development of easyJet and their ‘Generation easyJet’ proposition68. Luton will also continue to build on its private jet capacity and small business market in addition to this core ‘good value’ focus.
London Southend
Current focus
5.19 London Southend (Southend) had nearly 1 million passengers in 2013, to 15 weekly destinations. Southend has only recently re-developed as a fully functional commercial airport, after many years focused on the aeronautical maintenance and repair companies at its site. A majority of the routes from the airport are focused on low-cost, point-to-point travel with carriers such as easyJet and Aer Lingus Regional. The Aer Lingus Regional routes allow passengers travelling to several US destinations to connect through Dublin (and clear US customs in Ireland, with associated time saving on landing in the US) while easyJet’s Amsterdam route enables connections to worldwide routes from that hub.
Recent developments
5.20 Southend Airport was acquired by the Stobart group in 2008. Over £150m of investment from the new owners has given Southend the facilities for both a business jet and commercial flight operation. A new terminal was opened in 2012 which was extended to more than double its size in 2014, the runway has been extended, a new control tower built, and a rail station (owned and operated by Stobart) has been built along with a hotel.
68 http://www.easyjet.com/en/generationeasyjet
47
What strategies have airports serving London and the South East historically pursued?
5.21 Planning permission for these facilities includes conditions which limit and mitigate the environmental impact, with an overall limit of 53,300 aircraft movements. The facilities now in place can accommodate around 5.5 million passengers a year (provided that there is a reasonable spread of services throughout the day, week and year) within this current planning permission limit, but the physical capacity of the runway and major facilities could accommodate more than this.
Future plans
5.22 The majority of the routes from the airport will continue to be focused on low cost leisure and business point-to-point travel. With the existing routes to Dublin, Amsterdam and Berlin, plus new routes with FlyBe focused on secondary or tertiary destinations in Europe such as Münster Osnabrück and Antwerp having business and leisure traveller appeal.
5.23 The airport’s local demand is currently approximately 70% of passengers.69 The greatest area for further growth is likely to be to and from London (particularly the east of London such as Stratford). In seeking to increase the share of their market from London, Southend will be in increasing competition with Stansted. Given Stansted’s current focus on low-cost holiday routes Southend has developed a strategy differentiated from Stansted: fast check in times through a small and simple site, and flights to some destinations not served by other London airports. The intensity of this competition can be seen in the closure of Southend’s Cologne route even before it opened, in response to Ryanair’s announcement that it would be flying a much thicker route from Stansted.
69 Southend Passenger survey 2012
Figure 5.3: Demand and Capacity at London Southend Airport
During assessment for the Commission’s Interim Report London Southend Airport was not assessed as part of the ‘London Airport System’ in the Commission’s demand and capacity analysis. At that point London Southend had only very recently begun to operate as a commercial airport and predicting demand growth for such a newly developed airport is very difficult to do appropriately. Also, while Southend has grown rapidly over the past two years, its small scale (in 2013 just under 1m passengers compared to, for instance, Stansted’s nearly 18m) meant that including Southend in the London Airport system would not have had a significant impact on long-term London-wide demand and capacity analysis when considering maintaining the UK’s status as an international hub for aviation.
In this discussion paper the Commission is focusing on making best use of existing capacity in airports serving London and focusing on a key period of growth for Southend (from now until 2030). A Southend passenger survey in 2012 noted that 30% of the Airports passengers started their journey in a London Borough. As such it is more appropriate to consider Southend in line with other airports serving London, as opposed to with regional airports.
London Stansted
Current focus
5.24 Stansted served 18 million passengers in 2013, to 153 destinations across Europe and North Africa. Since the mid-1990s, Stansted has been a key base for low-cost leisure, point-to-point carriers such as easyJet and Ryanair.
48
Utilisation of the UK’s Existing Airport Capacity
Proposed developments
5.25 Stansted has recently begun an £80 million terminal redevelopment to improve the airport facilities. In December 2013, a new 22 lane security area was opened (to accommodate over 5,500 passengers per hour) and by summer 2016, the international departure lounge will double in size with new shopping and food and beverage facilities and a 70% increase in seating. These improvements are designed to enhance the passenger experience to meet the expectations of current airport users but also to prepare the airport for any future growth and to deliver the high-quality passenger experience that long haul full service schedule carriers want to offer.
Future plans
5.26 Stansted aims to grow its mix of airlines, attracting both short haul and long haul full service schedule carriers. Stansted’s strategy is to diversify, working to attract new airlines, new routes, particularly to medium-haul and long-haul destinations, while growing their strong commercial relationships with Ryanair and easyJet to service the low-cost, short-haul market. Stansted is unique compared to other airports serving London and the South East (bar Heathrow and Gatwick) in having the scale of runway and infrastructure capacity to support this strategy.
5.27 Since its acquisition by Manchester Airports Group in early 2013 Stansted has recently made commercial agreements with easyJet70 and Ryanair71
which will allow the airlines to increase
70 http://www.stanstedairport.com/about-us/media-centre/press-releases/easyjet-sign-long_term-deal-to-double-traffic-at-stansted
71 http://www.stanstedairport.com/about-us/media-centre/press-releases/mag-and-ryanair-sign-ten-year-growth-agreement-at-london-stansted
from 2.8m passengers to 6m passengers a year over the next five years, and from just over 13m a year to nearly 21m by 2023, respectively. The airport expects these deals to provide more destinations and increased frequency on current routes.
5.28 To complement this Stansted plans to develop new markets, in particular the airport is aiming to work with legacy carriers in Europe and carriers operating from middle-eastern hubs to attempt to provide connectivity from Stansted to these hubs and on to other long-haul destinations. The airport is also considering working with airlines to develop services to key cities in the USA. These flights could fit around the airports current short-haul peaks, providing a more uniform level of ATMs throughout the day.
5.29 Stansted is also currently one of the few London airports with some capacity still available at peak times (although this is quickly becoming constrained), which it intends to promote to business travellers who have a strong preference to travel at peak times.
Smaller airports serving London and the South East
Current focus
5.30 As well as the larger airports covered here, London’s aviation demand is also served by several smaller airports such as Biggin Hill and TAG Farnborough. Currently these airports are focused on general aviation (business aviation, private/recreational flying and other specialist air traffic – e.g. emergency services) and other airport related services, for instance flight training or engineering.
49
What strategies have airports serving London and the South East historically pursued?
5.31 Data on the capacity and connectivity provided by those airports that provide business aviation services is less available than for commercial flights, as most UK business aviation traffic is outside the scope of CAA traffic statistics and survey data. However, Eurocontrol’s Business Aviation in Europe briefing72 notes that there were 684,000 yearly business aviation movements in 201273 – representing 7.2% of air traffic movements in Europe. The smaller London Airports as well as strong business aviation capacity at Luton, Southend and Stansted contribute to this.
5.32 In contrast to commercial movements these are often very small planes carrying a handful of passengers which deliver flexibility in terms of timing that may not be possible on commercial services, or travel to destinations where no direct route exists, representing an often substantial time saving compared to transferring at major airports (Oxford Economics estimates that 96% of city pairs in Europe served by business aviation in 2011 had no scheduled connection74).
5.33 Business aviation flight numbers are, because of the nature of the business model, more susceptible to fast and deep reductions in response to economic downturns. As CAA analysis states: ‘business aviation adheres to no scheduled timetable, and so a downturn in demand is likely to result in an immediate decline in movements. For
72 Eurocontrol Briefing: Business Aviation in Europe in 2012.
73 Eurocontrol define business aircraft movements by type of aircraft – the 2012 briefing appendix shows which aircraft types they use to do so. This means that some movements included here may be small aircraft being used for leisure purposes, and other large business jets may not be included. This is a limitation in the accuracy of this data.
74 Oxford Economics for the EBAA, The Role of Business Aviation in the European Economy, October 2012.
commercial air transport, weakening demand may be reflected first in lower seat factors and yield reductions and only later in fewer flights.’75 Eurocontrol data on growth rates supports this analysis, with a year on year drop of nearly 30% after the financial crisis.76
5.34 Given the volatility of business flights many of the smaller London airports supplement their business in this area by providing other services. TAG Farnborough further develop their business aviation specialism with Business Jet engineering services and host a popular air show, while Biggin Hill focuses on developing on site businesses (see information on LoCATE below). Oxford Airport has one return commercial flight a week to Jersey in the 2014 summer season.77
Proposed developments
5.35 In common with the larger airports serving London and the South East, several smaller airports have developments planned:
●● TAG Farnborough have recently closed a public consultation to introduce new airspace design, with elements of controlled airspace – the airport expects this to offer all airspace users predictability and consistency of operation, with positive impacts on noise and CO2.
●● Biggin Hill is working to further develop LoCATE @ Biggin Hill: a cluster of aviation-related businesses located at and around the airport. It has been designated as a Strategic Outer London Development Centre (SOLDC) in the London Plan.
75 CAA, CAP796: Flying on Business 2009/10.
76 Eurocontrol STRATFOR.
77 http://www.oxfordairport.co.uk/airport_news/news_2013/oxford_jersey_flights_2014.htm
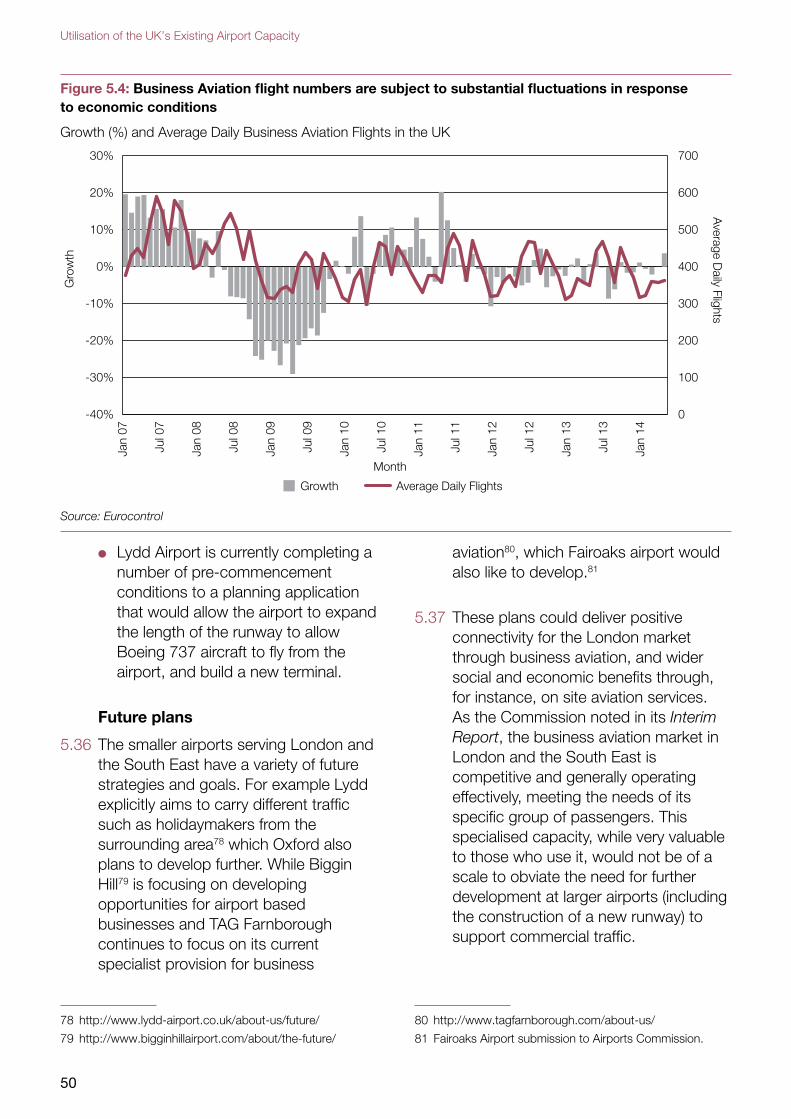
50
Utilisation of the UK’s Existing Airport Capacity
Figure 5.4: Business Aviation flight numbers are subject to substantial fluctuations in response to economic conditions
Growth (%) and Average Daily Business Aviation Flights in the UK
Source: Eurocontrol
●● Lydd Airport is currently completing a number of pre-commencement conditions to a planning application that would allow the airport to expand the length of the runway to allow Boeing 737 aircraft to fly from the airport, and build a new terminal.
Future plans
5.36 The smaller airports serving London and the South East have a variety of future strategies and goals. For example Lydd explicitly aims to carry different traffic such as holidaymakers from the surrounding area78 which Oxford also plans to develop further. While Biggin Hill79 is focusing on developing opportunities for airport based businesses and TAG Farnborough continues to focus on its current specialist provision for business
78 http://www.lydd-airport.co.uk/about-us/future/
79 http://www.bigginhillairport.com/about/the-future/
aviation80, which Fairoaks airport would also like to develop.81
5.37 These plans could deliver positive connectivity for the London market through business aviation, and wider social and economic benefits through, for instance, on site aviation services. As the Commission noted in its Interim Report, the business aviation market in London and the South East is competitive and generally operating effectively, meeting the needs of its specific group of passengers. This specialised capacity, while very valuable to those who use it, would not be of a scale to obviate the need for further development at larger airports (including the construction of a new runway) to support commercial traffic.
80 http://www.tagfarnborough.com/about-us/
81 Fairoaks Airport submission to Airports Commission.
-40%
-30%
-20%
-10%
0%
10%
20%
30%
Month
Gro
wth
Average D
aily Flights
Jan
07
Jul 0
7
Jan
08
Jul 0
8
Jan
09
Jul 0
9
Jan
10
Jul 1
0
Jan
11
Jul 1
1
Jan
12
Jul 1
2
Jan
13
Jul 1
3
Jan
14
Growth Average Daily Flights
0
100
200
300
400
500
600
700
51
What strategies have airports serving London and the South East historically pursued?
5.38 However, the varying fates of London Southend and Manston provide useful contrasting case studies on the possibilities for development of smaller airports. London Southend, under the new owners Stobart, successfully developed commercial relationships with easyJet and invested in airport infrastructure, to deliver a small but growing new commercial airport. In contrast, despite positive plans and the high profile experienced staff members joining, Manston airport closed on 15 May 2014, less than 12 months after its purchase by its new owner.82 Discussions are still ongoing about whether the airport can be reopened as an active airport, with a new buyer or support from the local council, or whether the land should be used for other purposes (for instance housing). The airports had very different starting points, different catchments and strategies, all of which contributed to the different outcomes.
Conclusion
5.39 The airports serving London and the South East are planning to pursue various strategies. Some, such as City, want to shore up their specialism and focus on their core demand and clients, while others, such as Stansted, wish to expand and develop from their historical role. The development of Southend has also added a new element to the London Airport market: it, like Luton, wants to develop the concept of ‘good-value’ and simple, small site low-cost travel to differentiate itself from other leisure providers. These developments will be supported by business aviation at the smaller airports, with some scheduled services. The various strategies of the airports give a positive picture of a system of airports with a
82 http://www.manstonairport.com/news-and-events/sale-statement.html
variety of sizes, geographical locations, passengers and flight types.
5.40 The capacity available in airports pursuing leisure customers seems to show that the demand in the leisure market should be relatively well served early in the period before any new runway, given leisure passengers’ relatively weaker preference for peak time slots and willingness to travel longer to find an airport that offers them the flights they need. However, as capacity becomes more and more constrained later in the period this leisure and VFR capacity reduces.
5.41 In contrast, the business sector is already constrained at peak times, and after City’s capacity is reached in the mid 2020s, the business sector’s strong preference for travel from Heathrow and City Airport could be frustrated. However, some increases at airports such as Stansted, Gatwick and Luton may pick up some of this, and specialist business aviation from the smaller London Airports may be an alternative for particularly time critical or high impact business travel.
5.42 It also seems that there will continue to be a competitive market for short and medium-haul routes from London airports – with all of the airports already delivering this sort of capacity. However, the opportunities for further long-haul travel is more uncertain. While several airports (for instance Stansted and London City) have plans to increase their long-haul routes, these are dependent on changes to aircraft technology and/or changes in airline behaviour, the long-term implications of which are not clear.
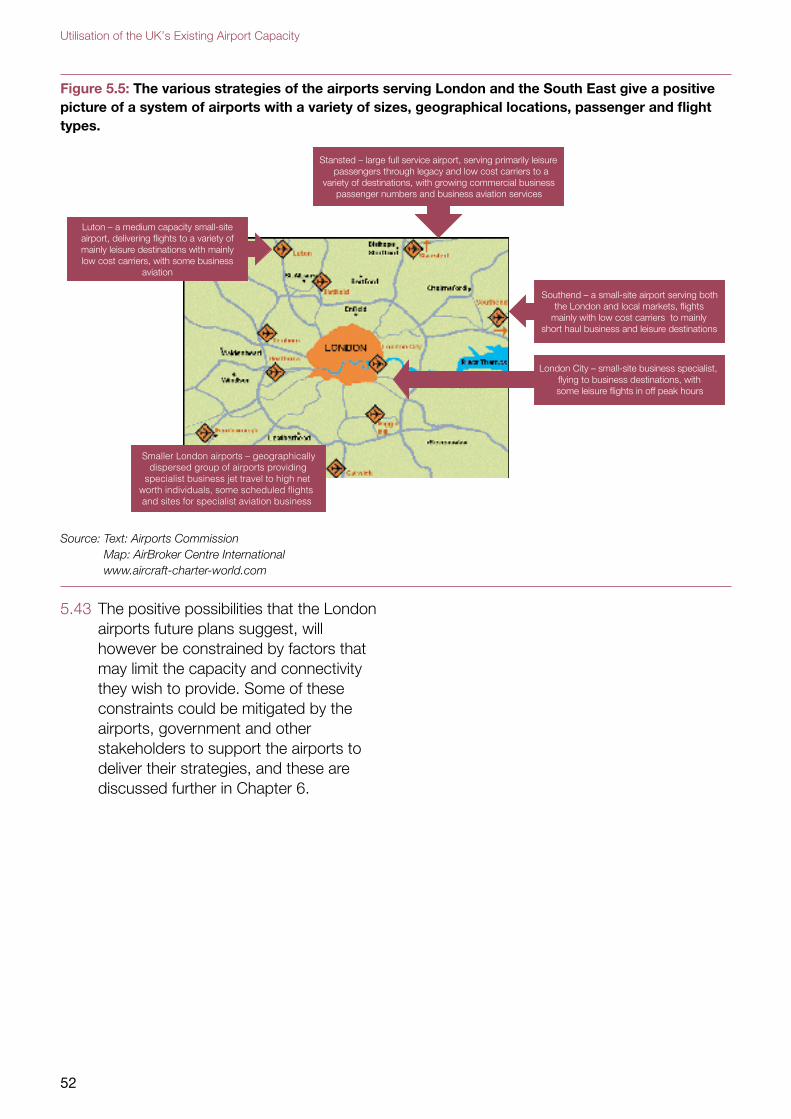
52
Utilisation of the UK’s Existing Airport Capacity
Figure 5.5: The various strategies of the airports serving London and the South East give a positive picture of a system of airports with a variety of sizes, geographical locations, passenger and flight types.
London City – small-site business specialist, flying to business destinations, with some leisure flights in off peak hours
Southend – a small-site airport serving both the London and local markets, flights
mainly with low cost carriers to mainly short haul business and leisure destinations
Luton – a medium capacity small-site airport, delivering flights to a variety of mainly leisure destinations with mainly low cost carriers, with some business
aviation
Stansted – large full service airport, serving primarily leisure passengers through legacy and low cost carriers to a
variety of destinations, with growing commercial business passenger numbers and business aviation services
Smaller London airports – geographically dispersed group of airports providing
specialist business jet travel to high net worth individuals, some scheduled flights and sites for specialist aviation business
Source: Text: Airports Commission Map: AirBroker Centre International www.aircraft-charter-world.com
5.43 The positive possibilities that the London airports future plans suggest, will however be constrained by factors that may limit the capacity and connectivity they wish to provide. Some of these constraints could be mitigated by the airports, government and other stakeholders to support the airports to deliver their strategies, and these are discussed further in Chapter 6.
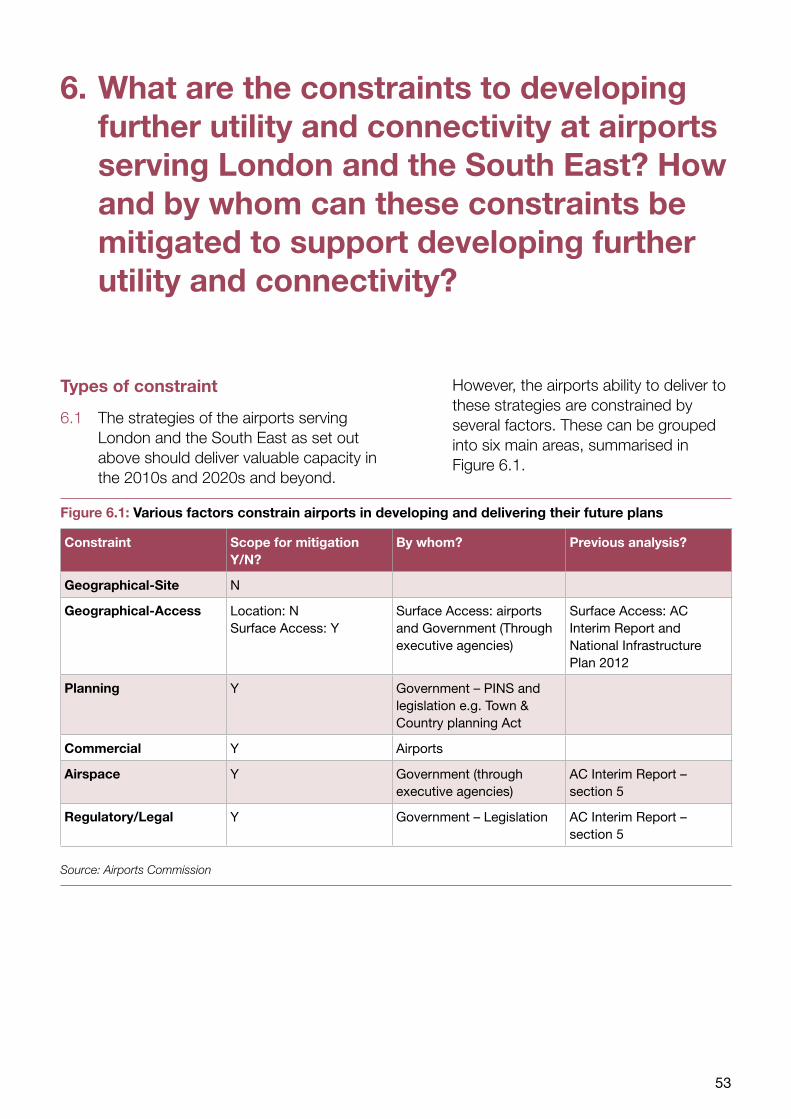
53
What are the constraints to developing further utility and connectivity at airports serving London and the South East?
6. What are the constraints to developing further utility and connectivity at airports serving London and the South East? How and by whom can these constraints be mitigated to support developing further utility and connectivity?
Types of constraint
6.1 The strategies of the airports serving London and the South East as set out above should deliver valuable capacity in the 2010s and 2020s and beyond.
However, the airports ability to deliver to these strategies are constrained by several factors. These can be grouped into six main areas, summarised in Figure 6.1.
Figure 6.1: Various factors constrain airports in developing and delivering their future plans
Constraint Scope for mitigation Y/N?
By whom? Previous analysis?
Geographical-Site N
Geographical-Access Location: N Surface Access: Y
Surface Access: airports and Government (Through executive agencies)
Surface Access: AC Interim Report and National Infrastructure Plan 2012
Planning Y Government – PINS and legislation e.g. Town & Country planning Act
Commercial Y Airports
Airspace Y Government (through executive agencies)
AC Interim Report – section 5
Regulatory/Legal Y Government – Legislation AC Interim Report – section 5
Source: Airports Commission
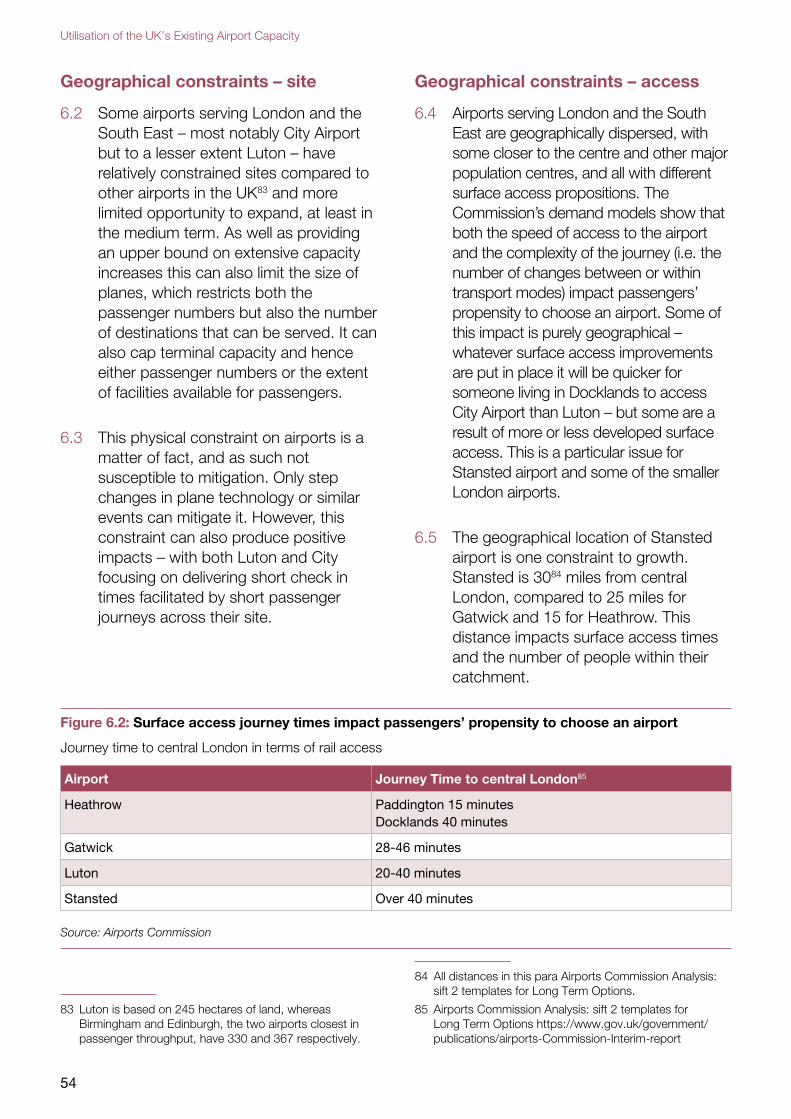
54
Utilisation of the UK’s Existing Airport Capacity
Geographical constraints – site
6.2 Some airports serving London and the South East – most notably City Airport but to a lesser extent Luton – have relatively constrained sites compared to other airports in the UK83 and more limited opportunity to expand, at least in the medium term. As well as providing an upper bound on extensive capacity increases this can also limit the size of planes, which restricts both the passenger numbers but also the number of destinations that can be served. It can also cap terminal capacity and hence either passenger numbers or the extent of facilities available for passengers.
6.3 This physical constraint on airports is a matter of fact, and as such not susceptible to mitigation. Only step changes in plane technology or similar events can mitigate it. However, this constraint can also produce positive impacts – with both Luton and City focusing on delivering short check in times facilitated by short passenger journeys across their site.
83 Luton is based on 245 hectares of land, whereas Birmingham and Edinburgh, the two airports closest in passenger throughput, have 330 and 367 respectively.
Geographical constraints – access
6.4 Airports serving London and the South East are geographically dispersed, with some closer to the centre and other major population centres, and all with different surface access propositions. The Commission’s demand models show that both the speed of access to the airport and the complexity of the journey (i.e. the number of changes between or within transport modes) impact passengers’ propensity to choose an airport. Some of this impact is purely geographical – whatever surface access improvements are put in place it will be quicker for someone living in Docklands to access City Airport than Luton – but some are a result of more or less developed surface access. This is a particular issue for Stansted airport and some of the smaller London airports.
6.5 The geographical location of Stansted airport is one constraint to growth. Stansted is 3084 miles from central London, compared to 25 miles for Gatwick and 15 for Heathrow. This distance impacts surface access times and the number of people within their catchment.
84 All distances in this para Airports Commission Analysis: sift 2 templates for Long Term Options.
85 Airports Commission Analysis: sift 2 templates for Long Term Options https://www.gov.uk/government/publications/airports-Commission-Interim-report
Figure 6.2: Surface access journey times impact passengers’ propensity to choose an airport
Journey time to central London in terms of rail access
Airport Journey Time to central London85
Heathrow Paddington 15 minutes Docklands 40 minutes
Gatwick 28-46 minutes
Luton 20-40 minutes
Stansted Over 40 minutes
Source: Airports Commission
55
What are the constraints to developing further utility and connectivity at airports serving London and the South East?
6.6 The regularity of service is also an important factor for airline passengers, along with reliability. Improvements in both of these areas could also enable better use of capacity, as well as a simple journey time reduction.
6.7 While the location of the airport is, in common with the limits of its site, not a constraint that can be addressed, surface access can be improved both through development of road and rail schemes, and also by the airports in improving their on-site facilities such as rapid transit systems linking rail stations to terminals, or the provision of quality parking facilities.
6.8 The Commission has set out in its Interim Report some possible improvements in mitigations to surface access constraints and in the 2013 National Infrastructure Plan the government committed to taking these forward.86 These included extending the scope of the East Anglian Mainline study to include access to Stansted.
Planning constraints
6.9 City Airport is currently going through the Town and Country planning process, while Luton received planning assent in May this year. Southend in April 2012 and Stansted withdrew its latest planning application in 2010. Heathrow airport has recently had a planning application turned down. It is clear that the planning process can be an appropriate constraint on airport development: both increases in capacity through new runways as well as on-airfield improvements such as developments to terminals and taxiways.
86 National Infrastructure Plan 2013, HM Treasury.
6.10 The planning system has a valuable part to play in ensuring that local communities and their elected representatives can be properly engaged in decisions that will have a significant impact on the local area and the quality-of-life of those living in the vicinity of the airport. In some cases it is entirely appropriate that an airport is constrained from taking action that would have an unacceptable negative impact on those living in the area. However, there have been examples, for instance Heathrow’s Terminal 5, where the process was lengthy, which can constrain airports ability to plan effectively, even if the planning process ultimately determines the application to be appropriate.
6.11 For those developments designated as Nationally Significant Infrastructure Projects (NSIPs) the Planning Act 2008 was introduced to streamline the decision-making process and allows the decision-maker to take into account the guidance in a National Policy Statement setting out the strategic benefits of development. The process for NSIPs now has set timescales for the planning authority to examine and report, and for the secretary of state to make a decision, giving developers more security about when a decision will be made. So far no airport developments have moved through this process.
6.12 As noted in Chapter 3, at present the Planning Act 2008 designates development at an airport as a Nationally Significant Infrastructure Project (and hence covered by the NSIP process) if ‘The effect is to increase by at least 10 million per year the number of passengers for whom the airport is capable of providing air passenger transport services, or to increase by at least 10,000 per year the number of air
56
Utilisation of the UK’s Existing Airport Capacity
transport movements of cargo aircraft for which the airport is capable of providing air cargo transport service’.
6.13 Those developments at airports that do not fall under the definition above need to seek planning consent through the Town & Country Planning process. This process allows local councils to determine which developments they feel are appropriate for the area, given the needs of the local community, and ensure that development in the area is in line with their Local Development Frameworks and other spatial development plans. In contrast to the NSIP process there are no set timelines that an application has to meet, but most councils have targets for how quickly they expect to make decisions.
6.14 Several airports serving London and the South East are currently constrained in their development by planning caps, for instance Stansted and City Airport. Partly because of the lengthy and contentious planning process, whether delivered through the Town and Country Planning process or as an NSIP, airports need to plan at least several years ahead to try and future-proof their strategies.
Commercial constraints
6.15 Airports operate in a competitive market, and are reliant on commercial agreements with airlines to drive traffic through their facilities. If an airport’s commercial offering to the airlines is not sufficiently attractive, because of the slot times available, the quality of the passenger service proposition for their customers, airport charges etc., then the airport cannot operate.
6.16 While many of these commercial constraints are a direct result of the other constraints mentioned above,
some are more subtle. For instance a legacy airline may only wish to run routes through airports that can deliver to their passengers a certain quality and availability of services and has positive “brand” recognition. In this case the commercial decisions by the airline, and ultimately the commercial decision of the airport to invest or not in their terminal services or brand status, can limit the demand for the airport.
6.17 Investing in improving relationships with airlines, promoting the airport’s brand, and developing customer service propositions that meet the needs of the airlines they work with, are all positive actions that airports can take in making better use of available capacity. All airports in the London system are taking forward work in this area, for instance Stansted’s long-term deal with EasyJet to increase passenger numbers to 6m passengers a year over five years87 or the multimillion pound investment in terminal facilities at Southend (see section 5.20).
Airspace constraints
6.18 The airspace over London is crowded, with the plurality of airports leading not only to congestion but an extremely complex system. Even if airports were entirely unconstrained to develop at ground level, the lack of airspace would continue to limit the number of ATMs possible.
6.19 As with the geographical access constraint some of this cannot be resolved, but the large number of stakeholders and complex testing needed has slowed down changes to airspace use that could simplify the
87 http://www.stanstedairport.com/about-us/media-centre/press-releases/easyjet-sign-long_term-deal-to-double-traffic-at-stansted
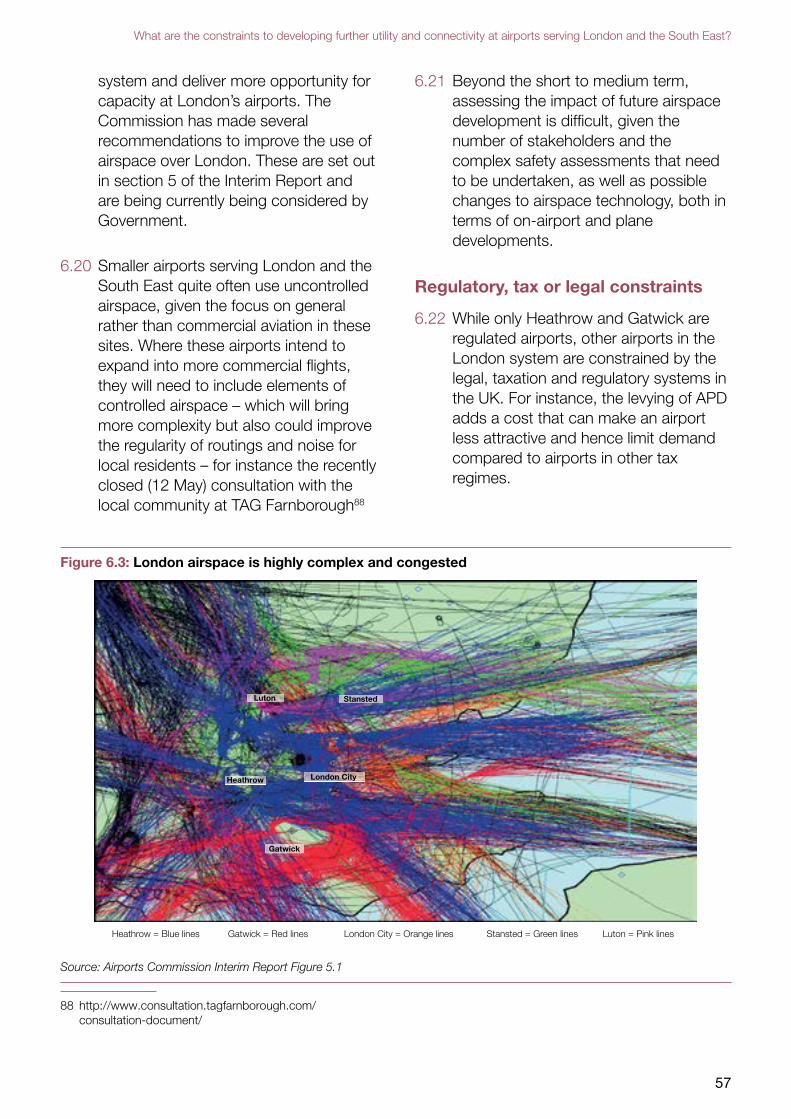
57
What are the constraints to developing further utility and connectivity at airports serving London and the South East?
system and deliver more opportunity for capacity at London’s airports. The Commission has made several recommendations to improve the use of airspace over London. These are set out in section 5 of the Interim Report and are being currently being considered by Government.
6.20 Smaller airports serving London and the South East quite often use uncontrolled airspace, given the focus on general rather than commercial aviation in these sites. Where these airports intend to expand into more commercial flights, they will need to include elements of controlled airspace – which will bring more complexity but also could improve the regularity of routings and noise for local residents – for instance the recently closed (12 May) consultation with the local community at TAG Farnborough88
88 http://www.consultation.tagfarnborough.com/consultation-document/
6.21 Beyond the short to medium term, assessing the impact of future airspace development is difficult, given the number of stakeholders and the complex safety assessments that need to be undertaken, as well as possible changes to airspace technology, both in terms of on-airport and plane developments.
Regulatory, tax or legal constraints
6.22 While only Heathrow and Gatwick are regulated airports, other airports in the London system are constrained by the legal, taxation and regulatory systems in the UK. For instance, the levying of APD adds a cost that can make an airport less attractive and hence limit demand compared to airports in other tax regimes.
Figure 6.3: London airspace is highly complex and congested
Heathrow
Gatwick
Luton Stansted
London City
Heathrow = Blue lines Gatwick = Red lines London City = Orange lines Stansted = Green lines Luton = Pink lines
Source: Airports Commission Interim Report Figure 5.1
58
Utilisation of the UK’s Existing Airport Capacity
6.23 The Commission reviewed a number of other possibilities for improving existing capacity through legal, tax or regulatory change, including a change to government policy on fifth freedoms; government intervention in the business jet sector; and APD holidays. The Commission determined that it would not propose them. The Commissions reasons for not taking these proposals forward are set out in section five of the Interim Report.
Impact of the Commission’s final report
6.24 The outcome of the Commission’s process will be a recommendation to government to increase capacity at Gatwick, Heathrow or an Inner Estuary site. The Commission has begun to analyse the strategic case for each of these possibilities (and the differences between the two Heathrow schemes). This will involve reviewing economic impacts, impacts on passenger demand, airline behaviour and possible developments in the aviation industry. Full details are set out in the Commission’s Appraisal Framework.
6.25 It is too early in the Commission’s process to draw any conclusions about what this would mean for the other airports serving London and the South East but in either scenario, airports and the airlines that fly from them will need to react to changes in the commercial environment, while continuing to manage the constraints on their operation set out above.
59
Questions and how to respond
7. Questions and how to respond
7.1 The focus of this paper is the connectivity and capacity provided by airports other than those short-listed by the Commission for further consideration as long-term capacity options. The Commission wishes to understand the long term strategic context within which the eventual expansion option is likely to sit, and any recommendations it could usefully make to shape this context. This paper is a call for evidence on that subject.
7.2 To inform those who would wish to prepare submissions on the issues raised in this paper we set out below a number of specific questions on areas of interest:
7.3 Questions on the role that non-London airports currently play in providing connectivity and utility to the UK.
●● Is the Commission correct to identify a reduction in air connectivity between the UK regions and the London airport network over the last decade? How do recent new routes to the capital, and the stabilisation in passenger numbers on domestic routes to and from London since 2010, affect this analysis?
●● How do respondents view these trends developing in the future?
●● Is the Commission’s analysis of the multiple factors influencing domestic air connectivity between London and the UK regions accurate? Of the factors outlined, which are the most significant or important for explaining how the market has developed?
What additional factors, if any, should the Commission be mindful of?
●● Is overall transport connectivity between London and the regions at an appropriate level? What are the social or economic consequences of changes to air connectivity? Can respondents provide any comparisons or other evidence to support their response?
●● What future trends do respondents envisage in domestic air connectivity excluding routes into London? How relevant are the factors explored in relation to London and the regions for these other domestic routes?
●● Is the Commission correct in its analysis of changing purposes of travel and routes types at non-London airports? What are the drivers and ramifications of this trend?
7.4 Questions on how the business models of these airports are changing, and how they can be expected to change further in time.
●● Is the Commission right to identify particular financial challenges for smaller airports? Can respondents corroborate or refute any of the Commission’s evidence on financial pressures at regional airports?
●● Is the Commission accurate in its analysis of the market dynamics affecting the non-London airports sector? Is the Commission correct to identify a broad trend, especially since 2007, in larger regional airports retaining or building their route
60
Utilisation of the UK’s Existing Airport Capacity
networks, whilst smaller regional airports’ route networks shrink? What explanations can respondents provide for this trend?
●● Can respondents provide any evidence to counter or support the Commission’s analysis of the UK population having quick access to relatively high numbers of airports, or to build on the Commission’s comparison between the UK and other countries’ airport networks?
●● What analysis ought the national or local Government undertake when faced with a potential airport closure?
●● In the longer term, what is an appropriate, adequate or ideal shape for the UK’s airport system? Is consolidation of the airport network desirable, inevitable, both or neither?
7.5 Questions on how the connectivity provided by these airports can be enhanced, and on the options to intervene in this sector.
●● Has the Commission correctly identified the major options to support or bolster the regional airports sector? Of the options here explored, which have the potential to be most beneficial?
7.6 Can respondents suggest means of bringing about positive change in the context of these options? What recommendations could the Commission make in these areas?
7.7 Questions on the constraints to developing further utility and connectivity at airports serving London and the South East, as well as how and by whom these constraints can be mitigated (Chapter 6):
Geographical Constraints
●● Are there longer-term or more extensive surface transport improvements and developments (beyond those committed to in the National Infrastructure Plan) that could support the other London airports to make best use of their capacity?
●● Are there any ways that government, or any other stakeholders, could improve airport site access? Are there any innovative ways that airports could resolve site access problems?
Planning Constraints
●● Are there particular pros and cons to airport developments moving through the NSIP or Town and Country Planning process for a) developers or b) communities?
●● Could either the NSIP or Town and Country planning process be improved, either the process itself or development of supporting policy, to support developers and meet the needs of local communities?
●● Is there a current case for lifting planning caps for any airports in London or the South East? If not now, when should these caps be reviewed?
Commercial Constraints
●● Are there any actions stakeholders could take to support airports in mitigating their commercial constraints?
●● Are there any examples of best practice in this area?
Airspace constraints
●● Are there any medium term airspace developments that could support
61
Questions and how to respond
making best use of capacity, beyond those set out in the Interim Report?
●● Are there any innovative long term airspace developments which could provide support beyond those set out in the Interim Report?
Regulatory, Tax or Legal Constraints
●● Are there any new data available that the Commission should review in reference to its conclusions on regulatory tax or legal changes that could alter our assessment of their usefulness in making best use of capacity?
●● Are there any areas of legal, tax or regulatory constraint, not considered by the Commission in its Interim Report, which merit further review?
Impact of Commission final report
●● Are there any topics or areas of further study beyond those set out in the Appraisal framework, that would allow the Commission to understand the impact of development at Heathrow or Gatwick on the other London Airports?
7.8 Submissions of evidence should be no longer than 15 pages and should be emailed to [email protected] clearly marked as a response to the ‘Utilisation of the UK’s Existing Airport Capacity discussion paper’. Evidence will be reviewed thereafter by the Commission. If further information or clarification is required, the Airports Commission secretariat will be in touch.
7.9 Please provide submission and evidence by Friday 25th July.
7.10 In exceptional circumstances we will accept submissions in hard copy. If you need to submit a hard copy, please
provide two copies to the Commission Secretariat at the following address:
Airports Commission 6th Floor Sanctuary Buildings 20 Great Smith Street London SW1P 3BT
7.11 We regret that we are not able to receive faxed documents.

Contact Information
Website: www.gov.uk/government/organisations/airports-commission Email: [email protected]