cost-push or demand pull? (capital market research
TRANSCRIPT

MOODY’S ANALYTICS CAPITAL MARKETS RESEARCH / WEEKLY MARKET OUTLOOK
1
Moody’s Analytics markets and distributes all Moody’s Capital Markets Research materials. Moody’s Analytics does not provide investment advisory services or products. For further detail, please see the last page.
Cost Push or Demand PullThe U.S. is experiencing cost-push inflation, which has historically proven to be more temporary than other causes, primarily demand pull. Part of the reason growth in the consumer price and PCE deflators has accelerated is because input costs have increased, including for many commodities.
When this occurs, a business can pass on all, but more often only some of the additional costs to the consumer. This is cost-push inflation. This is happening because of supply-chain disruptions from the pandemic and past closures of businesses, which have led to an imbalance between supply and demand. Production of many commodities is trying to catch up to demand, which it eventually will do, and that will relieve some of the pressure on input costs and by extension consumer prices.
Increases in global oil prices are raising input costs and factoring into cost-push inflation by accelerating transportation costs, which are also being driven up by a global shipping container shortage. Shortages are usually temporary, but some could be resolved more quickly than others. The global semiconductor shortage and container shortage could extend into next year, but they will be resolved eventually and their impact on inflation will fade.
Demand pull can be temporary and sticky Demand-pull inflation occurs when aggregate demand increases more quickly than supply, pushing prices higher. Some of this can be transitory, particularly as the pandemic and enormous fiscal stimulus have consumers sitting on a ton of excess savings.
Excess savings are the extra savings that households have accumulated as many sheltered in place and curtailed their spending, while others benefited from extraordinary government support. The excess savings are on top of what households would have saved if the pandemic had not occurred and their saving behavior had been the same as in 2019, before the pandemic. Excess savings were $2.46 trillion in April, up from $2.43 trillion in March.
WEEKLY MARKET OUTLOOK JUNE 10, 2021
Lead Author Ryan Sweet Senior Director-Economic Research 610-235-5213 [email protected]
Asia-Pacific Katrina Ell Economist Christina Zhu Economist Shahana Mukherjee Economist
Europe Ross Cioffi Economist
U.S. Adam Kamins Economist Steven Shields Economist Ryan Kelly Data Specialist
Editor Reid Kanaley
Contact Us Americas +1.212.553.1658 [email protected]
Europe +44.20.7772.5454 [email protected]
Asia (Excluding Japan) +85 2 2916 1121 [email protected]
Japan +81 3 5408 4100 [email protected]
Table of Contents
Top of Mind ...................................... 4
Week Ahead in Global Economy ... 6
Geopolitical Risks ............................ 7
The Long View U.S. ................................................................. 8 Europe ......................................................... 10 Asia-Pacific .................................................. 11
Ratings Roundup ........................... 12
Market Data ................................... 15
CDS Movers .................................... 16
Issuance .......................................... 18

MOODY’S ANALYTICS CAPITAL MARKETS RESEARCH / WEEKLY MARKET OUTLOOK 2
As excess savings is reduced, demand for services will increase, pulling prices for them higher. Prices for many of the consumer services hurt most by the pandemic remain depressed. After a good chunk of excess savings is reduced, the upward pressure on inflation will fade. This is also a big if. It’s possible the savings rate could be permanently higher going forward relative to the pre-pandemic trend.
The release of pent-up demand for consumer services is another example of demand-pull inflation, but again, this is temporary. It will provide a temporary boost to services prices, but it’s not sustainable. As the pent-up demand is worked off, it will provide less of a boost to services prices.
When it’s no longer temporary The current bout of inflation could turn into something worse if a wage-price spiral develops. The wage-price spiral suggests that rising wages increase disposable income, raising demand for goods and causing prices to rise. This is a type of demand-pull inflation that would worry the Fed, because it usually is not transitory and could cause long-term inflation expectations to rise above that consistent with the Fed’s 2% objective.
Nominal wage growth is key to set a wage-price spiral into motion. The first challenge is making sure you are looking at the right measure of wage growth. For this, the employment cost index is the most useful. Some argue that the Atlanta Fed median wage growth tracker is the best because it tracks growth for the same workers over time. However, this conflates experience-based pay raises with a general increase in wages. The ECI avoids this pitfall by tracking the same job instead of the same person over time.
One caveat with the ECI is that sometimes incentive occupations can influence nominal wage growth.
This has occurred recently as the gap between year-over-year growth in the ECI for private workers and the ECI for
private workers excluding incentive occupations has widened, with the latter falling behind the former. The gap is among the largest in the past several years.
Some prefer not to put too much weight on a single measure of nominal wage growth. Therefore, a few years ago we created a wage tracker, which is the “first principal component” of six wage measures: the employment cost index, average hourly earnings, unit labor costs, the Atlanta Fed Wage Growth Tracker, median usual weekly earnings, and our Current Population Survey-based wage estimate.
Our wage tracker was up 3.5% on a year-ago basis, among the highest since 2006. The U.S. wasn’t in the midst of a wage-price spiral then, and odds are that growth in our wage tracker will be kept in check given the amount of slack in the labor market.
Things can change, but for now, cost-push inflation will be the primary driver of inflation through the remainder of this year and into next. The Fed is betting on this, but if it is wrong, it will be because a wage-price spiral developed, although that is unlikely to occur until the economy has hit or exceeded full employment, something we don’t expect until the end of next year.
May CPI sticks to script The consumer price index rose 0.6% in May, in line with our forecast but stronger than the consensus expected. There was another sizable increase in used-car prices. Lean inventories for new cars are moving buyers into the used market, pushing prices higher. The reopening economy is contributing the large price increases in rental car/truck prices, up in excess of 10% again in May. Airfares posted a solid gain, while prices for other services tied to the reopening, including lodging away from home and admissions to sporting events and movies rose moderately. The core CPI rose 0.7%.
MOODY’S ANALYTICS CAPITAL MARKETS RESEARCH / WEEKLY MARKET OUTLOOK 3
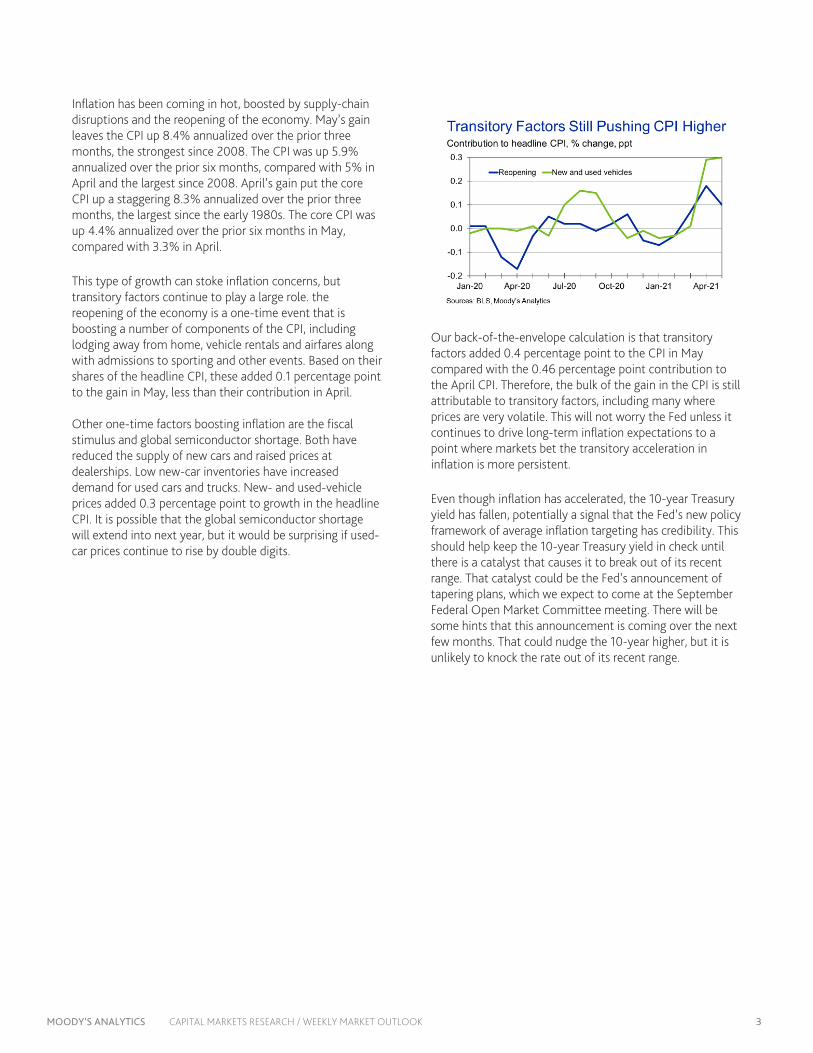
Inflation has been coming in hot, boosted by supply-chain disruptions and the reopening of the economy. May’s gain leaves the CPI up 8.4% annualized over the prior three months, the strongest since 2008. The CPI was up 5.9% annualized over the prior six months, compared with 5% in April and the largest since 2008. April’s gain put the core CPI up a staggering 8.3% annualized over the prior three months, the largest since the early 1980s. The core CPI was up 4.4% annualized over the prior six months in May, compared with 3.3% in April.
This type of growth can stoke inflation concerns, but transitory factors continue to play a large role. the reopening of the economy is a one-time event that is boosting a number of components of the CPI, including lodging away from home, vehicle rentals and airfares along with admissions to sporting and other events. Based on their shares of the headline CPI, these added 0.1 percentage point to the gain in May, less than their contribution in April. Other one-time factors boosting inflation are the fiscal stimulus and global semiconductor shortage. Both have reduced the supply of new cars and raised prices at dealerships. Low new-car inventories have increased demand for used cars and trucks. New- and used-vehicle prices added 0.3 percentage point to growth in the headline CPI. It is possible that the global semiconductor shortage will extend into next year, but it would be surprising if used-car prices continue to rise by double digits.
Our back-of-the-envelope calculation is that transitory factors added 0.4 percentage point to the CPI in May compared with the 0.46 percentage point contribution to the April CPI. Therefore, the bulk of the gain in the CPI is still attributable to transitory factors, including many where prices are very volatile. This will not worry the Fed unless it continues to drive long-term inflation expectations to a point where markets bet the transitory acceleration in inflation is more persistent.
Even though inflation has accelerated, the 10-year Treasury yield has fallen, potentially a signal that the Fed’s new policy framework of average inflation targeting has credibility. This should help keep the 10-year Treasury yield in check until there is a catalyst that causes it to break out of its recent range. That catalyst could be the Fed’s announcement of tapering plans, which we expect to come at the September Federal Open Market Committee meeting. There will be some hints that this announcement is coming over the next few months. That could nudge the 10-year higher, but it is unlikely to knock the rate out of its recent range.

MOODY’S ANALYTICS CAPITAL MARKETS RESEARCH / WEEKLY MARKET OUTLOOK 4
TOP OF MIND
Return to Normal…for Some BY ADAM KAMINS
The road to normalcy resembles the later stages of a marathon. All participants are making their way toward the finish line, but those at the front of the pack and those near the back seem to be running entirely different races. Florida and a handful of Plains and Mountain states have made it to the end of the course while many of their peers on the coasts are experiencing a much slower jog to pre-pandemic heights. With parts of the country surpassing 100 in the Moody's Analytics & CNN Business Back-to-Normal Index, a milestone more than a year in the making has been achieved. This provides an important window into both current and future conditions.
Heating up In recent days, Florida appears to have broken through in its quest to return to normalcy, making it the first large state to do so. Ask any resident or visitor to the Sunshine State and they would likely report that there has been little evidence of a global pandemic for months. But the lack of restrictions has been accompanied by hesitancy among vulnerable seniors and still-depressed tourism figures. Yet as vaccines make their way into more and more Americans’ arms, those headwinds have abated. This is especially evident in the restaurant industry. According to seated-diner data from OpenTable, Florida has spent all but one day since the beginning of May enjoying higher restaurant volumes than it did during an equivalent day in 2019. Only Nevada has performed better. Over the past year, those two states have shared little in common despite some structural similarities including favorable demographics and hot weather. Las Vegas was crippled by the pandemic’s impact on tourism, while most of Florida, with the notable exception of Orlando, received a partial boost as new residents and visitors at least temporarily hunkered down. But both of their recent surges reflect the return of tourists to popular markets. Although a full recovery will prove elusive until international visitors return and business travel picks up, even a partial rebound has been enough to propel some parts of the country back to prior heights.
Rocky Mountain high In smaller states, either the recovery has transitioned to expansion, normalcy has decisively taken hold, or both have occurred. Idaho regained its previous payroll employment peak in December, and Utah followed suit a few months later. Both remain the only states to achieve this milestone, with some of Utah’s smaller economies doing an especially impressive job of sustaining their strong pace of net hiring. This has helped push both states closer to normalcy, but the story does not end there. Hours worked tracked by Homebase reveal an increase in Idaho relative to the early days of the pandemic, while Utah remains a touch below. Perhaps this can be traced in part to politics; while both states are deep red, Idaho is even more Republican, likely making it marginally less cautious about the virus. In that vein, other states that have surpassed their previous highs at some point in the past month are generally rural and very Republican. South Dakota, which has been among the most aggressive about remaining open despite a severe autumn COVID-19 outbreak, has been the runaway leader in the Back-to-Normal Index for about a month. This is also reflected in the Homebase hours worked data, which are strongest in the nation by a wide margin.
Nebraska, Oklahoma and West Virginia have also been at or above 100 in the index for portions of the past month. Interestingly, those states are down slightly from their highs, but this likely owes at least in part to the Memorial
MOODY’S ANALYTICS CAPITAL MARKETS RESEARCH / WEEKLY MARKET OUTLOOK 5
Day holiday suppressing activity, including the amount of time spent in workplaces. The triumphant story being written in many states is balanced in part by the continued troubles of some harder-hit urban economies. New York remains the farthest state from normalcy, with Washington DC even farther back among places for which the index was calculated. This points to the frustratingly slow pace of recovery in large cities, where precautions have remained in effect more broadly and for longer than in the rest of the nation. Consumer industries remain depressed in both places, according to Homebase figures. Some of the other usual suspects that were hurt by stringent closures are lagging as well—such as California, Illinois and Massachusetts. But the story is not quite as simple as closures driving a lack of demand for consumer industry workers; some faster-opening states like Florida and Georgia are also near the bottom of the list. More broadly, though, other components have pushed the first group of states near the bottom of the Back-to-Normal Index rankings as of early June. With consumers remaining wary and many offices keeping their workforces remote, large coastal states in particular have had a difficult time making up their deficits. One modest exception is southern New England. Connecticut, Massachusetts and Rhode Island have all gained more ground than the nation as a whole over the past year, and a recent pickup may owe at least in part to some of the nation’s highest vaccination rates.
A shot at normalcy The promising developments in part of New England signal that perhaps vaccine uptake can be linked to growth in the Back-to-Normal Index. But when comparing vaccination rates to improvement in the index, the correlation coefficient is very close to zero, signaling that there is no meaningful relationship. This does not mean that the vaccine will not have a differential economic impact across states eventually, but
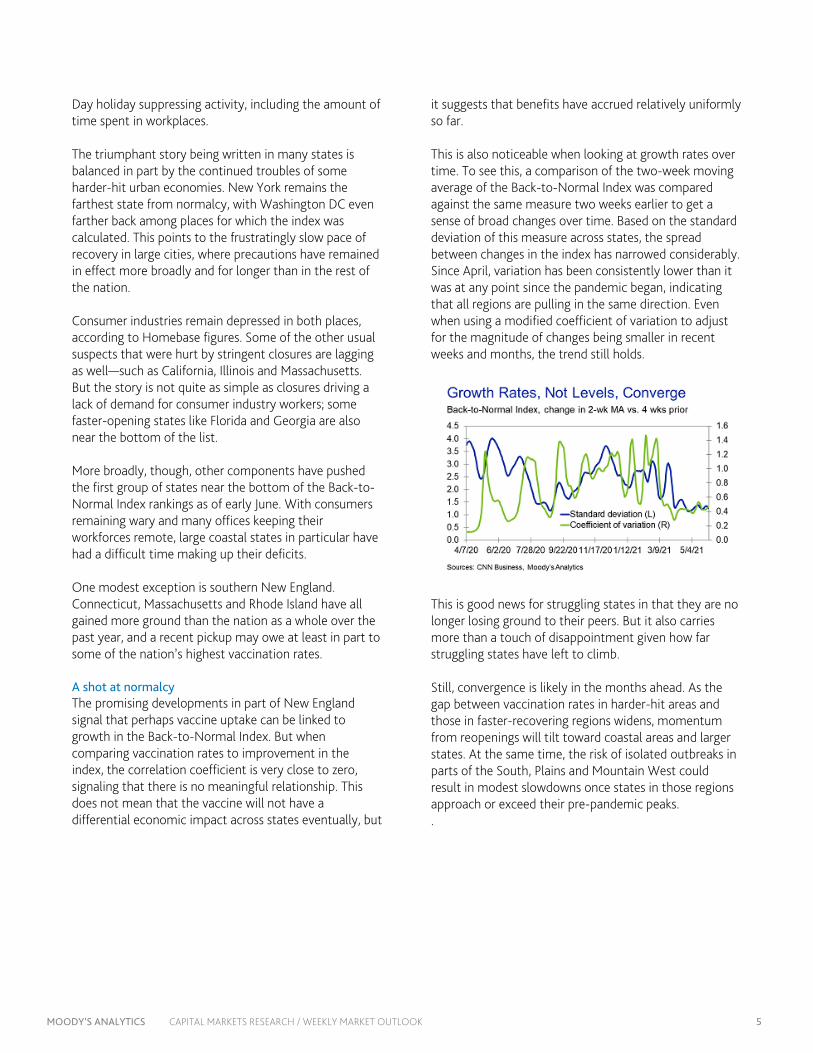
it suggests that benefits have accrued relatively uniformly so far. This is also noticeable when looking at growth rates over time. To see this, a comparison of the two-week moving average of the Back-to-Normal Index was compared against the same measure two weeks earlier to get a sense of broad changes over time. Based on the standard deviation of this measure across states, the spread between changes in the index has narrowed considerably. Since April, variation has been consistently lower than it was at any point since the pandemic began, indicating that all regions are pulling in the same direction. Even when using a modified coefficient of variation to adjust for the magnitude of changes being smaller in recent weeks and months, the trend still holds.
This is good news for struggling states in that they are no longer losing ground to their peers. But it also carries more than a touch of disappointment given how far struggling states have left to climb. Still, convergence is likely in the months ahead. As the gap between vaccination rates in harder-hit areas and those in faster-recovering regions widens, momentum from reopenings will tilt toward coastal areas and larger states. At the same time, the risk of isolated outbreaks in parts of the South, Plains and Mountain West could result in modest slowdowns once states in those regions approach or exceed their pre-pandemic peaks. .

MOODY’S ANALYTICS CAPITAL MARKETS RESEARCH / WEEKLY MARKET OUTLOOK 6
The Week Ahead in the Global Economy
U.S.
The U.S. economic calendar is packed. The key data include retail sales, industrial production, producer prices, housing starts, jobless claims and business inventories. A number of these data feed into our high-frequency GDP model’s estimate of second-quarter GDP, currently tracking 9.9% at an annualized rate. The Federal Open Market Committee meets, and we don’t anticipate any changes to its forward guidance on interest rates or asset purchases nor any announcement about plans to taper the asset purchases. The statement will likely strengthen the FOMC’s assessment of the acceleration in inflation and possibly mention the central bank has the tools to address inflation if needed. This would be an effort to keep long-term inflation expectations in check. We look for the Fed to nudge the interest on excess reserves higher. Normally, for the Fed to do this while operating in the zero lower bound, the effective fed funds rate would have hit 5 basis points for a period of time. The effective fed funds rate currently is at 6 basis points, tempering some expectations that a change to the IOER is coming next week. However, there are signs that the effective fed funds rate could fall to 5 basis points, or a touch lower based on the overnight bank funding rate, which is at 4 basis points. The Fed would also adjust the overnight reverse repo rate to put a stronger floor under the effective fed funds rate and to prevent money market rates from turning negative. Usage of the Fed’s ON RRP jumped recently and will continue to climb. There has been a significant increase in the usage of the Fed’s reverse repo facility. There are two factors behind this. First, in April the New York Fed announced that it was expanding the set of eligible RRP counterparties to include smaller money market funds and GSEs. Second, banks are flooded with reserves at a time with a dearth of attractive investment options for money market funds. As with past technical changes in the IOER and ON RRP, it doesn’t represent a change in the Fed’s stance on monetary policy. This technical change may not garner a lot of attention as markets are laser-focused on the Fed’s asset tapering debate, but we don’t anticipate significant developments on this front at the conclusion of next week’s meeting. There could be some interesting tidbits
in the minutes that are released several weeks later. Finally, these technical adjustments are Band-Aid fixes and don’t address the longer-term issues of the pressure on money market rates from the substantial amount of liquidity in the market. Europe
The euro zone’s industrial production and harmonized consumer price releases will be in focus. Industrial production likely increased by 0.8% m/m in May. While output has risen in countries like Italy, Spain and the Netherlands, we expect manufacturing was nonetheless held back at the euro zone level given the 0.3% fall in output in Germany and the 0.1% slip in France.
The Harmonized Index of Consumer Prices likely sped up to 2% y/y in May from 1.6% in April. Following the results of the preliminary estimate, base effects that pushed up energy price growth are behind the jump in inflation past the ECB’s target rate. By contrast, core inflation likely only sped up by 0.2 ppt to 0.9% y/y.
Russia’s first-quarter GDP growth is likely to be confirmed at 1.2% q/q. Consumer spending will have lagged given the persistence of the pandemic, social distancing, and ongoing weakness in the labor market. Accelerating consumer price inflation has also been eating away at purchasing power this year. Moreover, still-low oil production likely kept investments low as well.
Asia-Pacific
China’s May activity data will be a highlight on the economic release calendar. China’s monthly data will likely continue their cooling trend as base effects and pent-up demand eases. We look for retail trade to cool to 14% y/y in May, from the 17.7% expansion in April. Sales of automobiles, home appliances and consumer electronics have cooled as the global chip shortage continues to bite. In addition, gains in domestic tourism may have caused a shift away from goods spending to services. Fixed asset investment is expected to cool to 16.8% y/y YTD in May, from 19.9% in April. Abstracting from the low base, investment levels in the year to April are around 8% lower than 2019 values. Elevated commodity prices may discourage some government infrastructure spending heading into mid-2021. China’s private-sector investment growth continues to be comparable to that of state-owned enterprises.
MOODY’S ANALYTICS CAPITAL MARKETS RESEARCH / WEEKLY MARKET OUTLOOK 7
Geopolitical Calendar
Date Country Event Economic Importance Financial Market Risk
16-Jul Japan BOJ Monetary Policy meeting Medium Medium
23-Jul to 8-Aug Japan Summer Olympics, Tokyo Medium Low
5-Sep Hong Kong Legislative Council elections Low Medium
22-Oct Japan General elections Medium Medium
Oct/Nov ASEAN ASEAN summit Low Low
Nov Asia-Pacific Asia-Pacific Economic Cooperation forum Medium Low
Nov G-20 G-20 Summit Medium Low
7-Nov Nicaragua Presidential, congressional elections Low Low
14-Nov Argentina Legislative elections Medium Low
21-Nov Chile Presidential elections Low Low
28-Nov Honduras Presidential, congressional and municipal elections Low Low

MOODY’S ANALYTICS CAPITAL MARKETS RESEARCH / WEEKLY MARKET OUTLOOK 8
THE LONG VIEW: U.S.
The bout of Inflation could turn into something worse if a wage-price spiral develops. BY RYAN SWEET
CREDIT SPREADS Moody's long-term average corporate bond yield is 96 basis points, down 1 bp from this time last week. This is below the yield’s high over the past 12 months of 139 bp and a hair above its low of 95 bp. This spread may be no wider than 112 bp by year-end 2021.
The long-term investment grade corporate bond yield is 132 bp, down a touch from last week, a new low over the past 12 months, and well below its recent high of 222 basis points.
The recent composite high-yield option adjusted bond spread of 331 bp approximates what is suggested by the accompanying long-term Baa industrial company bond yield spread but is slightly wider than implied by the recent VIX of 16.6. The VIX has fallen over the past week.
DEFAULTS The global speculative-grade corporate default rate fell to 4.9% for the trailing 12 months ended in May, returning to where it stood a year earlier and down from 5.6% at the end of April. Among high-yield bond issuers, the U.S. default rate was 2.8% at the end of May when measured on a dollar-volume basis, down from 4.5% at the end of April. The decline reflects the exit of a few large defaults in 2020 from the trailing 12-month window.
According to the Moody’s Credit Transition Model, the trailing 12-month global speculative-grade default rate will fall to 1.8% by the end of the year under the MIS baseline scenario and remain little change through May 2022. To derive default-rate forecasts, Moody's CTM uses inputs, including ratings and rating transitions, as well as assumed future paths of high-yield bond spreads and changes in unemployment rates.
In the Moody’s Investors Service baseline scenario, the speculative-grade default rate will drop to 1.7% at the end of this year before creeping higher in April and May of next year, touching 1.9%. For Europe, the speculative-grade default rate will steadily decline over the next several months and end 2021 at 1.9%.
U.S. CORPORATE BOND ISSUANCE First-quarter 2020’s worldwide offerings of corporate bonds revealed annual advances of 14% for IG and 19%
for high-yield, wherein US$-denominated offerings increased 45% for IG and grew 12% for high yield.
Second-quarter 2020’s worldwide offerings of corporate bonds revealed annual surges of 69% for IG and 32% for high-yield, wherein US$-denominated offerings increased 142% for IG and grew 45% for high yield.
Third-quarter 2020’s worldwide offerings of corporate bonds revealed an annual decline of 6% for IG and an annual advance of 44% for high-yield, wherein US$-denominated offerings increased 12% for IG and soared upward 56% for high yield.
Fourth-quarter 2020’s worldwide offerings of corporate bonds revealed an annual decline of 3% for IG and an annual advance of 8% for high-yield, wherein US$-denominated offerings increased 16% for IG and 11% for high yield.
First-quarter 2021’s worldwide offerings of corporate bonds revealed an annual decline of 4% for IG and an annual advance of 57% for high-yield, wherein US$-denominated offerings sank 9% for IG and advanced 64% for high yield.
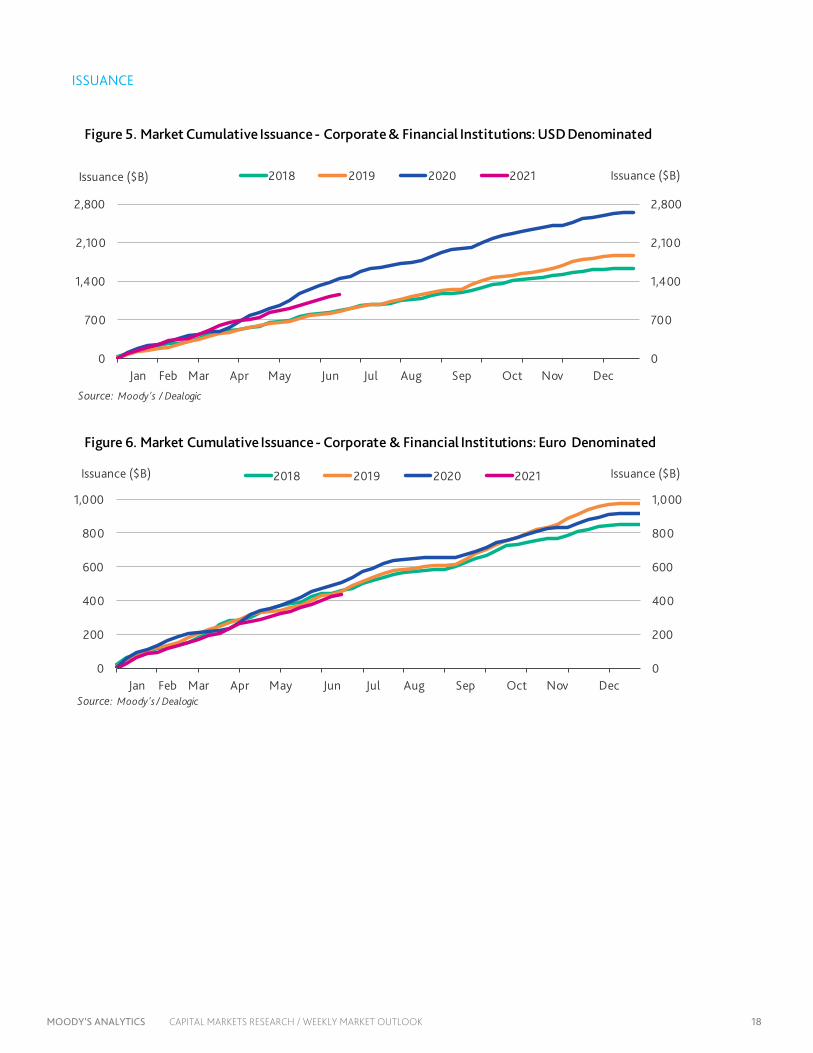
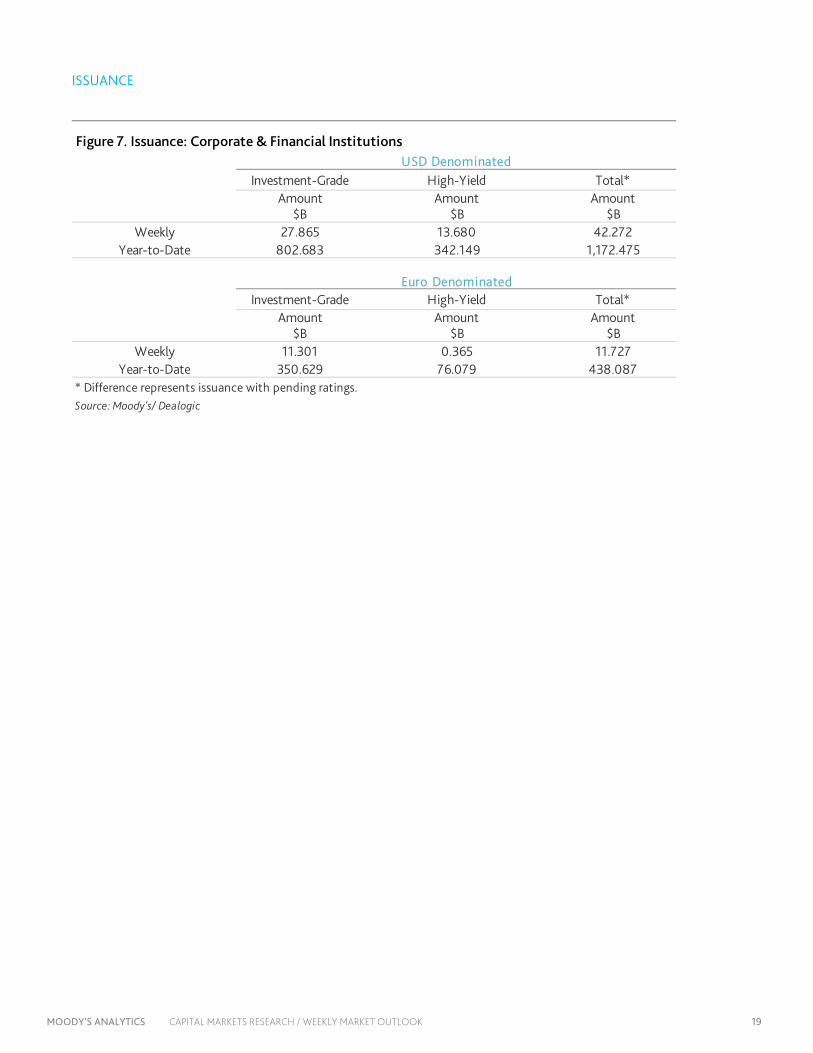
April and May corporate bond issuance came in a little lighter than expected. U.S. dollar-denominated corporate bond issuance has moderated, not surprising as issuance typically is slow this time of year.
In the week ending Wednesday, weekly dollar-denominated investment-grade issuance rose $27.87 billion, bringing the year-to-date total to $802.69 billion. High-yield issuance rose $13.68 billion in the latest week, bringing its year-to-date total to $342.15 billion.
U.S. ECONOMIC OUTLOOK The Moody’s Analytics June baseline now looks for real GDP to rise 6.9% this year, compared with the 6.8% in our May baseline. We have been consistently revising our forecast higher for GDP this year because of changes to our fiscal policy assumptions, but the adjustment in June

MOODY’S ANALYTICS CAPITAL MARKETS RESEARCH / WEEKLY MARKET OUTLOOK 9
is modest compared with prior forecast revisions. The June baseline incorporates the government’s second estimate of first-quarter GDP, but the top-line number was unrevised, still rising 6.4% at an annualized rate.
We raised our forecast for GDP growth in 2022 from 4.8% to 5%. Risks to the forecast are weighted to the upside because of the lack of inventory build this year. The global semiconductor shortage bit into inventories during the first quarter and will likely continue to do so through the remainder of this year. Inventories lend a downside risk to our forecast for GDP this year but are an upside for 2022 and 2023.
There is the potential that supply issues become a big problem, particularly for autos. Auto industrial production is trailing sales. Therefore, inventories could continue to decline. We didn’t alter our forecast for the change in private inventories over the next few years, but this may need to be revisited, since lean inventories need to be replenished, and that could add more to GDP growth next year than we expect.
The June baseline forecast has average monthly job growth this year of 510,000, in line with the May baseline. Similarly, there were no significant revisions to average monthly job growth next year, which will be 327,000.
The unemployment rate is expected to average 4.5% in the fourth quarter of this year, the same as in the May baseline. A 3.5% unemployment rate and an 80% prime-age employment-to-population ratio are consistent with an economy at full employment. We don’t have the
prime-age employment-to-population ratio in our model but we do a back-of-the-envelope estimate based on the other labor market variables we forecast.
There weren't any changes to our assumptions about monetary policy. We still expect the Fed to announce its tapering plans in September and a $15 billion reduction to occur at each Federal Open Market Committee meeting in 2022. The Fed has signaled that it wants tapering to be on autopilot. Once its monthly asset purchases have been reduced from $120 billion to zero, the Fed will reinvest proceeds from maturing assets to ensure its balance sheet doesn’t contract, which would be contractionary monetary policy.
The Fed will aim for inflation to exceed its 2% objective. How large of an overshoot is allowed before a rate liftoff will also be important in gauging the pace of tightening. If the Fed allows a larger overshoot, then the pace of tightening will likely be similar to a traditional tightening cycle, 25 basis points per quarter, because inflation should continue to accelerate even after the first rate hike. If the Fed doesn’t allow too much of an overshoot, then the tightening cycle will be less aggressive. The first hike for the target range for the fed funds rate occurs in early 2023 and the pace of tightening is expected to be similar to historical norms.
There were no significant changes to the forecast for the 10-year U.S. Treasury yield. The forecast is for the 10-year Treasury yield to end this year just north of 2% and near 2.4% next year.

MOODY’S ANALYTICS CAPITAL MARKETS RESEARCH / WEEKLY MARKET OUTLOOK 10
THE LONG VIEW: EUROPE
Euro Zone GDP Shrinks in Q1 BY ROSS CIOFFI
Detailed estimates found that euro zone GDP contracted by 0.3% q/q in the first quarter. This beat the preliminary estimate of a 0.6% q/q contraction. Unsurprisingly, the winter outbreak of COVID-19 that forced much of the euro zone back into lockdown was behind the quarter’s contraction. Private consumption, in particular, was the culprit, dropping 2.9% q/q and subtracting 1.2 ppt from the growth rate. By contrast, investments and the trade surplus contributed to growth. Despite the upside surprise in the GDP reading, the first quarter release still shows that the euro zone was not yet in recovery mode and that weakness persisted. Most of the growth in investments came from inventory building, while the trade surplus grew marginally.
The extension of lockdown and social distancing measures as well as the ongoing global supply shortage will curb growth potential in the first two-thirds of the second quarter. That said, we are optimistic about this summer. The euro zone economy should step firmly back into recovery mode as the economy opens up, boosting spending and investments and promoting the reabsorption of workers back into the labor force.
Industrial production was mixed in April. After seeing output increase by 1.2% m/m in Spain and decrease by 0.3% in Germany, Thursday’s releases report a 1.8% gain in Italy and a 0.1% contraction in France. The divergence between the four is likely due to the effects of the pandemic forcing Germany and France to tighten measures in April. Moreover, those two are more immediately exposed to global supply shortages of inputs given their position in European supply chains. Because of this sluggishness in Germany and France, we are tempering our estimate for next week’s release of the euro zone aggregate reading. We expect a 0.8% m/m increase in April for the euro zone as a whole.
We do have an upbeat view for the industrial sector as a whole this year. Despite being held back by supply bottlenecks this spring, it should be a motor of growth and of employment in the recovery. Supply shortages should ease as the pandemic abates and productive capacity returns.
The ECB keeps policy accomodative The European Central Bank’s interest rates and asset purchase programs remained unchanged at its June meeting.
The policy stance remains highly accommodative, given the -0.5% deposit rate and massive and flexible asset purchase under the bank’s Pandemic Emergency Purchase Program. As the language has not changed, we expect the pace of bond purchases to remain unchanged from the previous meeting. However, we expect the pace to slow later in the year.
Norway’s economy slips in first quarter Detailed estimates of Norway’s first quarter GDP revealed a contraction of 0.6% q/q, reversing the previous quarter’s 0.6% gain. The re-emergence of COVID-19 this winter, and the resulting need to enforce social distancing measures, is behind the decline in output. As happened across Europe, consumers were confined to their homes and cut down on their spending.
The oil sector remained weak during the quarter, but the shipping and oil platform and shipbuilding sectors expanded. This happened as the global economic recovery started to pick up thanks to growing momentum and confidence in the U.S. and Asia. We saw a large investment drive into foreign shipping as well as a jump in exports of ships, platforms and aircraft. Absent growth in these sectors, Norway’s mainland economy would have contracted by 1% q/q during the quarter.
The second quarter faces some of the same headwinds that the first quarter did. But as measures ease, we are expecting a strong rebound in spending as consumers vent pent-up demand and firms get back to investing. We are expecting this second rebound to lift GDP, and as a result we are penciling in a 0.7% q/q increase in our June baseline as growth accelerates further in the second half of the year.
Germany’s trade balance expands in April Germany’s trade surplus rose to €15.9 billion in April from €14 billion in March. The reason for the gain mostly came from the 1.7% m/m drop in imports; exports increased only slightly, by 0.3% m/m. The output is in line with the fact that Germany extended lockdown measures into April, therefore suppressing demand for imports. Looking out over the year, we expect Germany’s exporters to support the country’s recovery; however, we warn against reading too much into April’s surplus. Given the pandemic situation, it was a reflection of weakened internal demand.

MOODY’S ANALYTICS CAPITAL MARKETS RESEARCH / WEEKLY MARKET OUTLOOK 11
THE LONG VIEW: ASIA-PACIFIC
China’s CPI Will See Slight Rise Over the Year BY CHRISTINA ZHU AND SHAHANA MUKHERJEE
China’s consumer prices remained moderate in May, with prices rising by an average of 1.3% in yearly terms, largely driven by a 5.5% surge in transportation and communication prices. Not surprisingly, recovering global oil prices were a key factor behind this increase, as domestic gasoline rose by 1.7% and diesel prices were up 1.9% over the past month and sent yearly growth above 20%. At the same time, however, falling food prices continued to dampen the net increase. Significant declines in pork and fresh vegetable prices ensured that overall food prices slipped by another 0.2% in May.
Demand-driven price pressures are gaining some momentum. This is evident in the May reading, as core inflation inched up to 0.9% year over year, supported by recovering service prices. Domestic travel is picking up, with the number of trips made during the five-day Labor holiday exceeded the 2019 level. As a result, tourism prices rose by 1.9% month over month in May, and airfares are now 32% higher than a year ago. A reassuring trend is that prices for other goods and services also improved notably in monthly terms, although they remained below levels seen a year ago.
The near-term outlook remains fairly balanced, and China’s consumer prices should rise modestly in the coming months. The country’s highly competitive retail market, spurred by the rise of e-commerce, makes it challenging for sellers to raise prices by passing on the higher raw material costs to consumers. Although home appliances and electronics goods are expected to become costlier due to the global chip shortage, they only contribute a relatively small portion to the consumer basket. In contrast, food prices and rent, which account for more than half of the basket, will likely remain soft and partially offset the upward pressure during the coming months.
Given these considerations, we expect the headline CPI to rise moderately in the months ahead, but then settle below the 3% target by the end of the year, leaving little need for the central bank’s intervention to stabilize inflation.
On the trade front, foreign trade performed well in May, with the trade balance improving to $45.5 billion from $42.9 billion in April. Exports in dollar terms came in at
$263.9 billion, up by 27.9% from a year ago and unchanged from the previous month. In yearly terms, imports surged by 51.1%, partly inflated by the low base as China recorded exceptionally weak imports in May 2020. The yearly growth will normalize in the coming months as the base comes back on track. In monthly terms, imports were down by 1.2% as purchases for some raw materials continued to slide amid higher prices.
As more countries bring domestic COVID-19 outbreaks under control and join the global recovery, foreign demand for a broad range of consumer goods has surged. China’s exports of suitcases and handbags, garments and clothing accessories, footwear, and automobiles have each increased by around 10% compared with the previous months. Demand for textile and medical equipment remains high as some other countries continue to grapple with a high number of cases.
China’s steel exports dropped precipitously, with volumes declining by 33.9% and values falling by 18.7%. This is likely because of the government’s recent removal of the value-added tax rebate on steel exports, which aimed to boost demand amid global supply shortages and surging prices. China is also trying to limit domestic steel production to achieve its carbon emission pledge and address the overcapacity issue.
China’s imports softened further in May, driven by dwindling demand for raw materials. Iron ore, coal, plastics, rubber and copper products each recorded significant declines in their import volumes, though rising prices cushioned the blow. Rising input prices are weighing on China’s industrial sector, especially downstream manufacturers, causing some of them to reduce production.
Exports should remain robust in the coming months as the country benefits from the global rebound. A strong U.S. recovery powered by excessive saving and fiscal stimulus, followed by the U.K. and the EU, will boost demand for China’s manufactured consumer goods. The outlook for imports is more uncertain. Although domestic consumption is picking up, supply shortages and surging input prices may slow down manufacturing expansion and thus limit imports. Nevertheless, the overall trade performance is expected to hold steady.
MOODY’S ANALYTICS CAPITAL MARKETS RESEARCH / WEEKLY MARKET OUTLOOK 12
RATINGS ROUND-UP
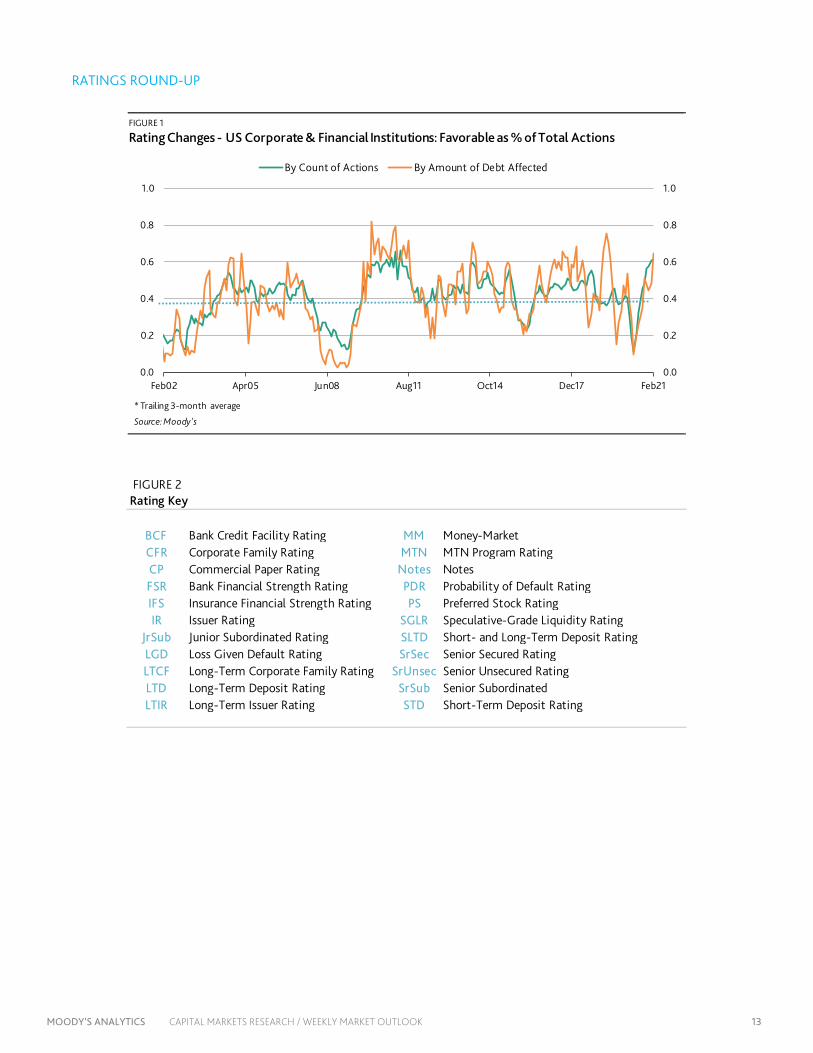
Positive Trend Continues for U.S. Rating Changes BY STEVEN SHIELDS
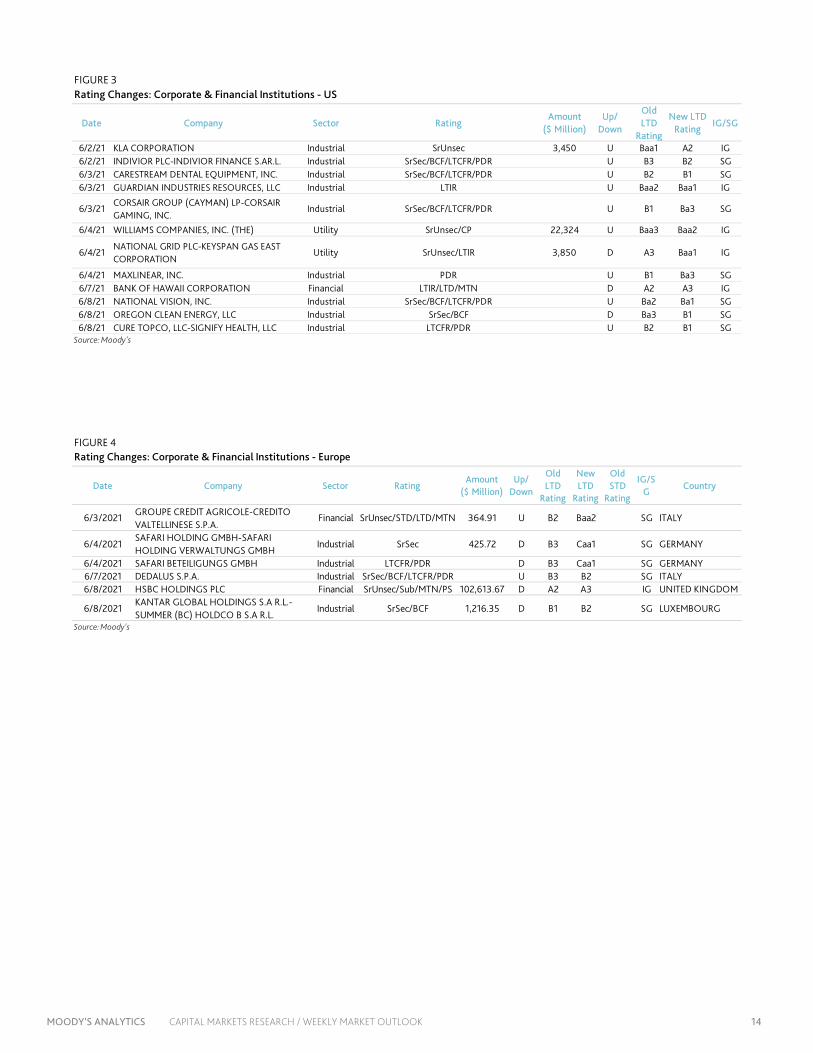
The positive trend in U.S. rating change activity continued in the latest period. Credit upgrades comprised more than three-quarters of ratings changes issued by Moody’s Investors Service and nearly 90% of the total affected debt. Three of the nine upgrades were issued to investment-grade firms. This week’s most notable upgrade was made to The Williams Companies Inc. with its senior unsecured debt ratings upgraded to Baa2 from Baa3. The upgrade, impacting approximately $22.3 billion in outstanding debt, reflects its significant and ongoing deleveraging, the consistency and stability of its considerable natural gas pipeline business, and free cash flow generation. Moody’s changed its outlook to stable from positive. KLA Corp. was the second largest upgrade in the week with Moody’s issuing a two-notch upgrade to its senior unsecured notes. According to Richard Lane, Moody’s senior vice president, “The rating action reflects Moody’s expectations that ongoing fundamental drivers for semiconductor industry capital expenditures will drive revenue and free cash flow over the next few years,
leading to stronger financial flexibility.” Keyspan Gas East Corp. received one of the three downgrades. On June 4, Moody’s lowered the gas distributor’s senior unsecured notes to Baa1 from A3. The change impacted approximately $3.9 billion in debt. European corporate credit quality weakened in the period. Credit downgrades accounted for four of the six changes. The downgrade issued to HSBC Holdings plc accounted for nearly all the debt affected in the region, totaling approximately $102.6 billion. Moody's Investors Services downgraded the firm’s senior unsecured debt rating to A3 from A2 and the outlook on its senior unsecured debt rating has been changed to stable from ratings under review. HSBCH’s Baseline Credit Assessment was also downgraded to A3 from A2, reflecting challenges the group will face in restoring profitability on a sustainable basis to levels in line with its main peers in the next 12-18 months.
MOODY’S ANALYTICS CAPITAL MARKETS RESEARCH / WEEKLY MARKET OUTLOOK 13
RATINGS ROUND-UP
FIGURE 1
Rating Changes - US Corporate & Financial Institutions: Favorable as % of Total Actions
0.0
0.2
0.4
0.6
0.8
1.0
0.0
0.2
0.4
0.6
0.8
1.0
Feb02 Apr05 Jun08 Aug11 Oct14 Dec17 Feb21
By Count of Actions By Amount of Debt Affected
* Trailing 3-month average
Source: Moody's
FIGURE 2
BCF Bank Credit Facility Rating MM Money-MarketCFR Corporate Family Rating MTN MTN Program RatingCP Commercial Paper Rating Notes NotesFSR Bank Financial Strength Rating PDR Probability of Default RatingIFS Insurance Financial Strength Rating PS Preferred Stock RatingIR Issuer Rating SGLR Speculative-Grade Liquidity Rating
JrSub Junior Subordinated Rating SLTD Short- and Long-Term Deposit RatingLGD Loss Given Default Rating SrSec Senior Secured Rating LTCF Long-Term Corporate Family Rating SrUnsec Senior Unsecured Rating LTD Long-Term Deposit Rating SrSub Senior SubordinatedLTIR Long-Term Issuer Rating STD Short-Term Deposit Rating
Rating Key
MOODY’S ANALYTICS CAPITAL MARKETS RESEARCH / WEEKLY MARKET OUTLOOK 14
FIGURE 3Rating Changes: Corporate & Financial Institutions - US
Date Company Sector RatingAmount
($ Million)Up/
Down
Old LTD
Rating
New LTD Rating
IG/SG
6/2/21 KLA CORPORATION Industrial SrUnsec 3,450 U Baa1 A2 IG6/2/21 INDIVIOR PLC-INDIVIOR FINANCE S.AR.L. Industrial SrSec/BCF/LTCFR/PDR U B3 B2 SG6/3/21 CARESTREAM DENTAL EQUIPMENT, INC. Industrial SrSec/BCF/LTCFR/PDR U B2 B1 SG6/3/21 GUARDIAN INDUSTRIES RESOURCES, LLC Industrial LTIR U Baa2 Baa1 IG
6/3/21CORSAIR GROUP (CAYMAN) LP-CORSAIR GAMING, INC.
Industrial SrSec/BCF/LTCFR/PDR U B1 Ba3 SG
6/4/21 WILLIAMS COMPANIES, INC. (THE) Utility SrUnsec/CP 22,324 U Baa3 Baa2 IG
6/4/21NATIONAL GRID PLC-KEYSPAN GAS EAST CORPORATION
Utility SrUnsec/LTIR 3,850 D A3 Baa1 IG
6/4/21 MAXLINEAR, INC. Industrial PDR U B1 Ba3 SG6/7/21 BANK OF HAWAII CORPORATION Financial LTIR/LTD/MTN D A2 A3 IG6/8/21 NATIONAL VISION, INC. Industrial SrSec/BCF/LTCFR/PDR U Ba2 Ba1 SG6/8/21 OREGON CLEAN ENERGY, LLC Industrial SrSec/BCF D Ba3 B1 SG6/8/21 CURE TOPCO, LLC-SIGNIFY HEALTH, LLC Industrial LTCFR/PDR U B2 B1 SG
Source: Moody's
FIGURE 4Rating Changes: Corporate & Financial Institutions - Europe
Date Company Sector RatingAmount
($ Million)Up/
Down
Old LTD
Rating
New LTD
Rating
Old STD
Rating
New F
IG/SG
Country
6/3/2021 GROUPE CREDIT AGRICOLE-CREDITO VALTELLINESE S.P.A.
Financial SrUnsec/STD/LTD/MTN 364.91 U B2 Baa2 SG ITALY
6/4/2021SAFARI HOLDING GMBH-SAFARI HOLDING VERWALTUNGS GMBH
Industrial SrSec 425.72 D B3 Caa1 SG GERMANY
6/4/2021 SAFARI BETEILIGUNGS GMBH Industrial LTCFR/PDR D B3 Caa1 SG GERMANY6/7/2021 DEDALUS S.P.A. Industrial SrSec/BCF/LTCFR/PDR U B3 B2 SG ITALY6/8/2021 HSBC HOLDINGS PLC Financial SrUnsec/Sub/MTN/PS 102,613.67 D A2 A3 IG UNITED KINGDOM
6/8/2021KANTAR GLOBAL HOLDINGS S.A R.L.-SUMMER (BC) HOLDCO B S.A R.L.
Industrial SrSec/BCF 1,216.35 D B1 B2 SG LUXEMBOURG
Source: Moody's

MOODY’S ANALYTICS CAPITAL MARKETS RESEARCH / WEEKLY MARKET OUTLOOK 15
MARKET DATA
0
200
400
600
800
0
200
400
600
800
2003 2004 2005 2006 2007 2008 2009 2010 2011 2012 2013 2014 2015 2016 2017 2018 2019 2020 2021
Spread (bp) Spread (bp) Aa2 A2 Baa2
Source: Moody's
Figure 1: 5-Year Median Spreads-Global Data (High Grade)
0
400
800
1,200
1,600
2,000
0
400
800
1,200
1,600
2,000
2003 2004 2005 2006 2007 2008 2009 2010 2011 2012 2013 2014 2015 2016 2017 2018 2019 2020 2021
Spread (bp) Spread (bp) Ba2 B2 Caa-C
Source: Moody's
Figure 2: 5-Year Median Spreads-Global Data (High Yield)
MOODY’S ANALYTICS CAPITAL MARKETS RESEARCH / WEEKLY MARKET OUTLOOK 16
CDS MOVERS
CDS Implied Rating Rises
Issuer Jun. 9 Jun. 2 Senior RatingsOracle Corporation A1 A2 Baa2General Motors Company Baa3 Ba1 Baa3Consolidated Edison Company of New York, Inc. Baa1 Baa2 Baa1Univision Communications Inc. B3 Caa1 Caa2Welltower Inc. Baa1 Baa2 Baa1Archer-Daniels-Midland Company A2 A3 A2Sherwin-Williams Company (The) Baa1 Baa2 Baa2Apache Corporation Ba2 Ba3 Ba1Republic Services, Inc. Baa1 Baa2 Baa2Ventas Realty, Limited Partnership Baa2 Baa3 Baa1
CDS Implied Rating DeclinesIssuer Jun. 9 Jun. 2 Senior RatingsToyota Motor Credit Corporation A1 Aa3 A1Walmart Inc. A1 Aa3 Aa2Raytheon Technologies Corporation A3 A2 Baa1NextEra Energy Capital Holdings, Inc. Baa2 Baa1 Baa1Lowe's Companies, Inc. A2 A1 Baa1Southern Company (The) Baa1 A3 Baa2Bank of America, N.A. Baa1 A3 Aa2Tyson Foods, Inc. Baa1 A3 Baa2NIKE, Inc. A1 Aa3 A1Sempra Energy A3 A2 Baa2
CDS Spread IncreasesIssuer Senior Ratings Jun. 9 Jun. 2 Spread DiffTalen Energy Supply, LLC B3 1,580 1,105 475Macy's Retail Holdings, LLC B1 324 307 16Gap, Inc. (The) Ba3 167 153 14Goodyear Tire & Rubber Company (The) B2 240 229 12Calpine Corporation B2 346 337 9Staples, Inc. Caa1 773 764 9Travel + Leisure Co. B1 166 158 8Kohl's Corporation Baa2 144 136 8NIKE, Inc. A1 30 25 6Liberty Interactive LLC B2 305 298 6
CDS Spread DecreasesIssuer Senior Ratings Jun. 9 Jun. 2 Spread DiffNabors Industries, Inc. Caa2 757 865 -108Apache Corporation Ba1 173 210 -36United States Steel Corporation Caa1 333 361 -28Occidental Petroleum Corporation Ba2 226 245 -18United Airlines, Inc. Ba3 352 369 -16Rite Aid Corporation Caa3 716 732 -16International Game Technology B3 216 232 -16SLM Corporation Ba1 308 323 -15Ventas Realty, Limited Partnership Baa1 57 67 -10BorgWarner Inc. Baa1 55 65 -10
Source: Moody's, CMA
CDS Spreads
CDS Implied Ratings
CDS Implied Ratings
CDS Spreads
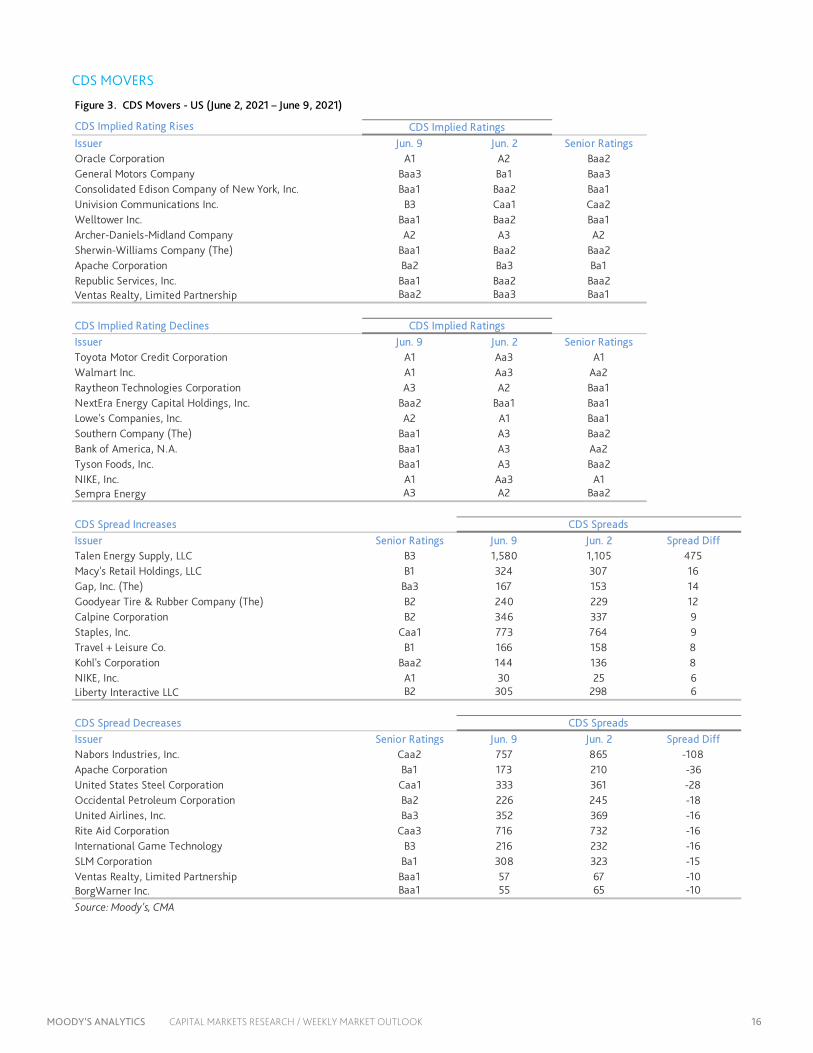
Figure 3. CDS Movers - US (June 2, 2021 – June 9, 2021)
MOODY’S ANALYTICS CAPITAL MARKETS RESEARCH / WEEKLY MARKET OUTLOOK 17
CDS Movers
CDS Implied Rating Rises
Issuer Jun. 9 Jun. 2 Senior RatingsCMA CGM S.A. B2 Caa1 B3Santander UK plc Baa1 Baa2 A1Landesbank Hessen-Thueringen GZ A2 A3 Aa3Bankinter, S.A. Baa1 Baa2 Baa1BAWAG P.S.K. AG Baa1 Baa2 A2Autoroutes du Sud de la France (ASF) A1 A2 A3Koninklijke KPN N.V. Baa3 Ba1 Baa3Ineos Group Holdings S.A. Ba3 B1 B2Italy, Government of Baa3 Baa3 Baa3France, Government of Aa2 Aa2 Aa2
CDS Implied Rating DeclinesIssuer Jun. 9 Jun. 2 Senior RatingsNatixis A2 A1 A1HSBC Holdings plc A3 A2 A3Credit Agricole S.A. A1 Aa3 Aa3ING Bank N.V. Aa3 Aa2 Aa3Electricite de France Baa1 A3 A3Orange A2 A1 Baa1Deutsche Telekom AG A2 A1 Baa1Bank of Ireland Baa2 Baa1 A2United Utilities PLC A2 A1 Baa1Novo Banco, S.A. Ba3 Ba2 Caa2
CDS Spread IncreasesIssuer Senior Ratings Jun. 9 Jun. 2 Spread Diffthyssenkrupp AG B1 267 253 14Novo Banco, S.A. Caa2 184 180 4Wm Morrison Supermarkets plc Baa2 109 105 4Leonardo S.p.A. Ba1 153 150 3HSBC Holdings plc A3 43 42 2Electricite de France A3 48 46 2Standard Chartered PLC A2 51 49 2Banco Comercial Portugues, S.A. Ba1 181 179 2Bayer AG Baa2 59 57 2Scottish Power UK plc Baa1 47 45 2
CDS Spread DecreasesIssuer Senior Ratings Jun. 9 Jun. 2 Spread DiffCMA CGM S.A. B3 311 355 -44Koninklijke KPN N.V. Baa3 74 107 -34Novafives S.A.S. Caa2 716 738 -22Piraeus Financial Holdings S.A. Caa3 511 530 -19Casino Guichard-Perrachon SA Caa1 513 530 -17TUI AG Caa1 662 675 -13Vue International Bidco plc Ca 595 606 -12Telecom Italia S.p.A. Ba2 153 164 -11Ziggo Bond Company B.V. B3 227 235 -7Virgin Media Finance PLC B2 246 253 -7
Source: Moody's, CMA
CDS Spreads
CDS Implied Ratings
CDS Implied Ratings
CDS Spreads
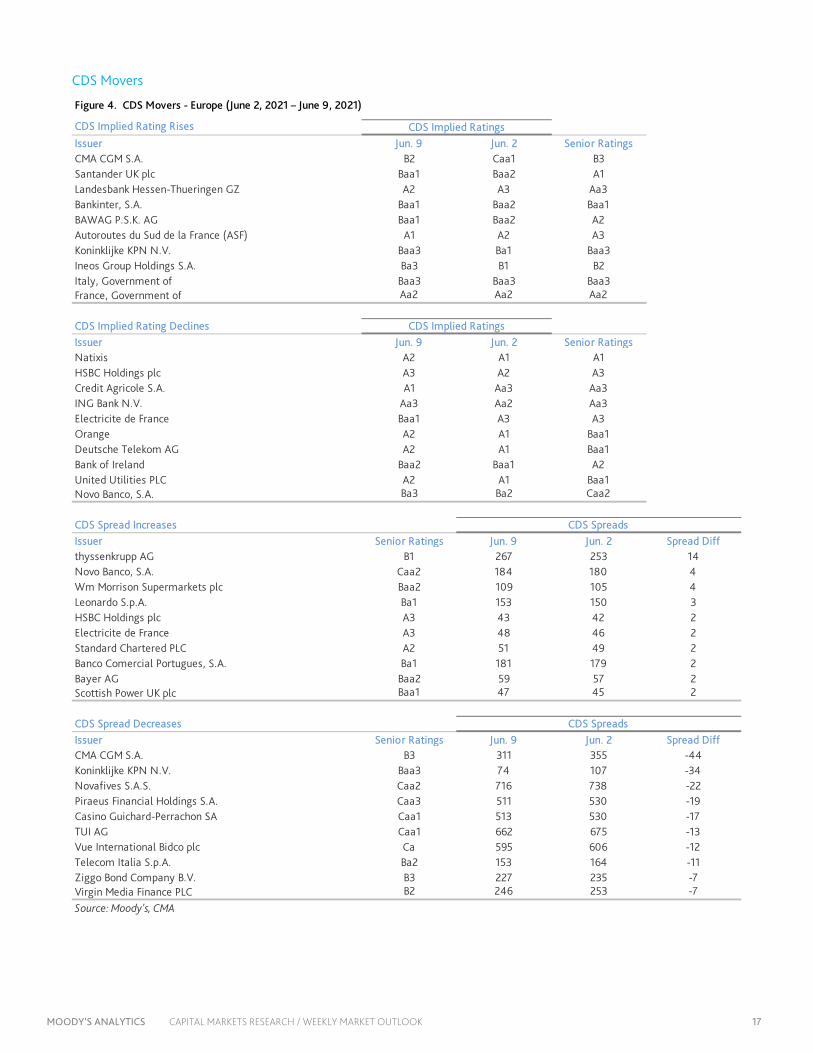
Figure 4. CDS Movers - Europe (June 2, 2021 – June 9, 2021)
MOODY’S ANALYTICS CAPITAL MARKETS RESEARCH / WEEKLY MARKET OUTLOOK 18
ISSUANCE
0
700
1,400
2,100
2,800
0
700
1,400
2,100
2,800
Jan Feb Mar Apr May Jun Jul Aug Sep Oct Nov Dec
Issuance ($B) Issuance ($B)2018 2019 2020 2021
Source: Moody's / Dealogic
Figure 5. Market Cumulative Issuance - Corporate & Financial Institutions: USD Denominated
0
200
400
600
800
1,000
0
200
400
600
800
1,000
Jan Feb Mar Apr May Jun Jul Aug Sep Oct Nov Dec
Issuance ($B) Issuance ($B)2018 2019 2020 2021
Source: Moody's / Dealogic
Figure 6. Market Cumulative Issuance - Corporate & Financial Institutions: Euro Denominated
MOODY’S ANALYTICS CAPITAL MARKETS RESEARCH / WEEKLY MARKET OUTLOOK 19
ISSUANCE
Investment-Grade High-Yield Total*Amount Amount Amount
$B $B $BWeekly 27.865 13.680 42.272
Year-to-Date 802.683 342.149 1,172.475
Investment-Grade High-Yield Total*Amount Amount Amount
$B $B $BWeekly 11.301 0.365 11.727
Year-to-Date 350.629 76.079 438.087* Difference represents issuance with pending ratings.Source: Moody's/ Dealogic
USD Denominated
Euro Denominated
Figure 7. Issuance: Corporate & Financial Institutions

MOODY’S ANALYTICS CAPITAL MARKETS RESEARCH / WEEKLY MARKET OUTLOOK 20
To order reprints of this report (100 copies minimum), please call 212.553.1658.
Report Number: 1290517 Contact Us
Editor Reid Kanaley [email protected]
Americas: 1.212.553.4399
Europe: +44 (0) 20.7772.5588
Asia: 813.5408.4131

MOODY’S ANALYTICS CAPITAL MARKETS RESEARCH / WEEKLY MARKET OUTLOOK 21
© 2021 Moody’s Corporation, Moody’s Investors Service, Inc., Moody’s Analytics, Inc. and/or their licensors and affiliates (collectively, “MOODY’S”). All rights reserved.
CREDIT RATINGS ISSUED BY MOODY'S CREDIT RATINGS AFFILIATES ARE THEIR CURRENT OPINIONS OF THE RELATIVE FUTURE CREDIT RISK OF ENTITIES, CREDIT COMMITMENTS, OR DEBT OR DEBT-LIKE SECURITIES, AND MATERIALS, PRODUCTS, SERVICES AND INFORMATION PUBLISHED BY MOODY’S (COLLECTIVELY, “PUBLICATIONS”) MAY INCLUDE SUCH CURRENT OPINIONS. MOODY’S DEFINES CREDIT RISK AS THE RISK THAT AN ENTITY MAY NOT MEET ITS CONTRACTUAL FINANCIAL OBLIGATIONS AS THEY COME DUE AND ANY ESTIMATED FINANCIAL LOSS IN THE EVENT OF DEFAULT OR IMPAIRMENT. SEE APPLICABLE MOODY’S RATING SYMBOLS AND DEFINITIONS PUBLICATION FOR INFORMATION ON THE TYPES OF CONTRACTUAL FINANCIAL OBLIGATIONS ADDRESSED BY MOODY’S CREDIT RATINGS. CREDIT RATINGS DO NOT ADDRESS ANY OTHER RISK, INCLUDING BUT NOT LIMITED TO: LIQUIDITY RISK, MARKET VALUE RISK, OR PRICE VOLATILITY. CREDIT RATINGS, NON-CREDIT ASSESSMENTS (“ASSESSMENTS”), AND OTHER OPINIONS INCLUDED IN MOODY’S PUBLICATIONS ARE NOT STATEMENTS OF CURRENT OR HISTORICAL FACT. MOODY’S PUBLICATIONS MAY ALSO INCLUDE QUANTITATIVE MODEL-BASED ESTIMATES OF CREDIT RISK AND RELATED OPINIONS OR COMMENTARY PUBLISHED BY MOODY’S ANALYTICS, INC. AND/OR ITS AFFILIATES. MOODY’S CREDIT RATINGS, ASSESSMENTS, OTHER OPINIONS AND PUBLICATIONS DO NOT CONSTITUTE OR PROVIDE INVESTMENT OR FINANCIAL ADVICE, AND MOODY’S CREDIT RATINGS, ASSESSMENTS, OTHER OPINIONS AND PUBLICATIONS ARE NOT AND DO NOT PROVIDE RECOMMENDATIONS TO PURCHASE, SELL, OR HOLD PARTICULAR SECURITIES. MOODY’S CREDIT RATINGS, ASSESSMENTS, OTHER OPINIONS AND PUBLICATIONS DO NOT COMMENT ON THE SUITABILITY OF AN INVESTMENT FOR ANY PARTICULAR INVESTOR. MOODY’S ISSUES ITS CREDIT RATINGS, ASSESSMENTS AND OTHER OPINIONS AND PUBLISHES ITS PUBLICATIONS WITH THE EXPECTATION AND UNDERSTANDING THAT EACH INVESTOR WILL, WITH DUE CARE, MAKE ITS OWN STUDY AND EVALUATION OF EACH SECURITY THAT IS UNDER CONSIDERATION FOR PURCHASE, HOLDING, OR SALE.
MOODY’S CREDIT RATINGS, ASSESSMENTS, OTHER OPINIONS, AND PUBLICATIONS ARE NOT INTENDED FOR USE BY RETAIL INVESTORS AND IT WOULD BE RECKLESS AND INAPPROPRIATE FOR RETAIL INVESTORS TO USE MOODY’S CREDIT RATINGS, ASSESSMENTS, OTHER OPINIONS OR PUBLICATIONS WHEN MAKING AN INVESTMENT DECISION. IF IN DOUBT YOU SHOULD CONTACT YOUR FINANCIAL OR OTHER PROFESSIONAL ADVISER.
ALL INFORMATION CONTAINED HEREIN IS PROTECTED BY LAW, INCLUDING BUT NOT LIMITED TO, COPYRIGHT LAW, AND NONE OF SUCH INFORMATION MAY BE COPIED OR OTHERWISE REPRODUCED, REPACKAGED, FURTHER TRANSMITTED, TRANSFERRED, DISSEMINATED, REDISTRIBUTED OR RESOLD, OR STORED FOR SUBSEQUENT USE FOR ANY SUCH PURPOSE, IN WHOLE OR IN PART, IN ANY FORM OR MANNER OR BY ANY MEANS WHATSOEVER, BY ANY PERSON WITHOUT MOODY’S PRIOR WRITTEN CONSENT.
MOODY’S CREDIT RATINGS, ASSESSMENTS, OTHER OPINIONS AND PUBLICATIONS ARE NOT INTENDED FOR USE BY ANY PERSON AS A BENCHMARK AS THAT TERM IS DEFINED FOR REGULATORY PURPOSES AND MUST NOT BE USED IN ANY WAY THAT COULD RESULT IN THEM BEING CONSIDERED A BENCHMARK.
All information contained herein is obtained by MOODY’S from sources believed by it to be accurate and reliable. Because of the possibility of human or mechanical error as well as other factors, however, all information contained herein is provided “AS IS” without warranty of any kind. MOODY'S adopts all necessary measures so that the information it uses in assigning a credit rating is of sufficient quality and from sources MOODY'S considers to be reliable including, when appropriate, independent third-party sources. However, MOODY’S is not an auditor and cannot in every instance independently verify or validate information received in the rating process or in preparing its Publications.
To the extent permitted by law, MOODY’S and its directors, officers, employees, agents, representatives, licensors and suppliers disclaim liability to any person or entity for any indirect, special, consequential, or incidental losses or damages whatsoever arising from or in connection with the information contained herein or the use of or inability to use any such information, even if MOODY’S or any of its directors, officers, employees, agents, representatives, licensors or suppliers is advised in advance of the possibility of such losses or damages, including but not limited to: (a) any loss of present or prospective profits or (b) any loss or damage arising where the relevant financial instrument is not the subject of a particular credit rating assigned by MOODY’S.
To the extent permitted by law, MOODY’S and its directors, officers, employees, agents, representatives, licensors and suppliers disclaim liability for any direct or compensatory losses or damages caused to any person or entity, including but not limited to by any negligence (but excluding fraud, willful misconduct or any other type of liability that, for the avoidance of doubt, by law cannot be excluded) on the part of, or any contingency within or beyond the control of, MOODY’S or any of its directors, officers, employees, agents, representatives, licensors or suppliers, arising from or in connection with the information contained herein or the use of or inability to use any such information.
NO WARRANTY, EXPRESS OR IMPLIED, AS TO THE ACCURACY, TIMELINESS, COMPLETENESS, MERCHANTABILITY OR FITNESS FOR ANY PARTICULAR PURPOSE OF ANY CREDIT RATING, ASSESSMENT, OTHER OPINION OR INFORMATION IS GIVEN OR MADE BY MOODY’S IN ANY FORM OR MANNER WHATSOEVER.
Moody’s Investors Service, Inc., a wholly-owned credit rating agency subsidiary of Moody’s Corporation (“MCO”), hereby discloses that most issuers of debt securities (including corporate and municipal bonds, debentures, notes and commercial paper) and preferred stock rated by Moody’s Investors Service, Inc. have, prior to assignment of any credit rating, agreed to pay to Moody’s Investors Service, Inc. for credit ratings opinions and services rendered by it fees ranging from $1,000 to approximately $5,000,000. MCO and Moody’s Investors Service also maintain policies and procedures to address the independence of Moody’s Investors Service credit ratings and credit rating processes. Information regarding certain affiliations that may exist between directors of MCO and rated entities, and between entities who hold credit ratings from Moody’s Investors Service and have also publicly reported to the SEC an ownership interest in MCO of more than 5%, is posted annually at www.moodys.com under the heading “Investor Relations — Corporate Governance — Director and Shareholder Affiliation Policy.”
Additional terms for Australia only: Any publication into Australia of this document is pursuant to the Australian Financial Services License of MOODY’S affiliate, Moody’s Investors Service Pty Limited ABN 61 003 399 657AFSL 336969 and/or Moody’s Analytics Australia Pty Ltd ABN 94 105 136 972 AFSL 383569 (as applicable). This document is intended to be provided only to “wholesale clients” within the meaning of section 761G of the Corporations Act 2001. By continuing to access this document from within Australia, you represent to MOODY’S that you are, or are accessing the document as a representative of, a “wholesale client” and that neither you nor the entity you represent will directly or indirectly disseminate this document or its contents to “retail clients” within the meaning of section 761G of the Corporations Act 2001. MOODY’S credit rating is an opinion as to the creditworthiness of a debt obligation of the issuer, not on the equity securities of the issuer or any form of security that is available to retail investors.
Additional terms for Japan only: Moody's Japan K.K. (“MJKK”) is a wholly owned credit rating agency subsidiary of Moody's Group Japan G.K., which is wholly owned by Moody’s Overseas Holdings Inc., a wholly owned subsidiary of MCO. Moody’s SF Japan K.K. (“MSFJ”) is a wholly owned credit rating agency subsidiary of MJKK. MSFJ is not a Nationally Recognized Statistical Rating Organization (“NRSRO”). Therefore, credit ratings assigned by MSFJ are Non-NRSRO Credit Ratings. Non-NRSRO Credit Ratings are assigned by an entity that is not a NRSRO and, consequently, the rated obligation will not qualify for certain types of treatment under U.S. laws. MJKK and MSFJ are credit rating agencies registered with the Japan Financial Services Agency and their registration numbers are FSA Commissioner (Ratings) No. 2 and 3 respectively.
MJKK or MSFJ (as applicable) hereby disclose that most issuers of debt securities (including corporate and municipal bonds, debentures, notes and commercial paper) and preferred stock rated by MJKK or MSFJ (as applicable) have, prior to assignment of any credit rating, agreed to pay to MJKK or MSFJ (as applicable) for credit ratings opinions and services rendered by it fees ranging from JPY125,000 to approximately JPY550,000,000.
MJKK and MSFJ also maintain policies and procedures to address Japanese regulatory requirements.