cost recovery for solid waste management...
TRANSCRIPT
REGIONAL SOLID WASTE MANAGEMENT PROJECT NATIONAL ACTIVITY IN LEBANON
TASK 4: APPLICATION OF THE REGIONAL GUIDELINES FOR SOLID WASTE MANAGEMENT FINANCING AND COST RECOVERY
MECHANISMS
COST RECOVERY FOR SOLID WASTE MANAGEMENT IN LEBANON
Final Report
July 2005
Prepared by:
Earth Links and Advanced Resources Development s.a.r.l. (ELARD)
In Association with: Tebodin Consultancy and Envirotech
This Project is executed by the World Bank, financed by the European Commission and hosted at ANPE
Republic of Lebanon
Ministry of Environment
Mediterranean Environmental
Technical Assistance Program

RSWMP – Task 4 Cost Recovery for Waste Management in Lebanon
ELARD in association with Tebodin Consultancy and Envirotech ii
ACKNOWLEDGEMENTS We would like to thank the Ministry of Environment especially the Director General, Dr. Berj Hatjian, and his team of solid waste experts: Ms. Lina Yammout, Mr. Bassam Sabbagh, Mr. Mohammad Baraki, and Ms. Maya Abi Zeid.
Special thanks are extended to the Ministry of Finance, especially the Director General, Mr. Alain Bifani, and financial expert Mr. Charbel Chedrawy, for their time and efforts.
We would also like to thank the International Consortium (GTZ, ERM, GKW) for their valuable input and assistance throughout this on-the-job training exercise, specifically Dr. Aziz Belherazem and Mr. Peter Rupert.
Last but not least, we are grateful for the support and dedication demonstrated by Mr. Jaafar Friaa and Dr. Ahmed Mostafa in guiding the “Regional Solid Waste Management Project – National Activity in Lebanon” towards success.

RSWMP – Task 4 Cost Recovery for Waste Management in Lebanon
ELARD in association with Tebodin Consultancy and Envirotech iii
TABLE OF CONTENTS
Acknowledgements................................................................................................................... ii
Table of Contents..................................................................................................................... iii
List of Tables .............................................................................................................................v
List of Figures .......................................................................................................................... vi
List of Abbreviations .............................................................................................................. vii
1 Introduction........................................................................................................................8
1.1 The Context of the Project .........................................................................................8
1.2 The Local Context......................................................................................................8
1.3 The Objectives of the Project.....................................................................................8
1.4 Objective of the Report..............................................................................................8
1.5 Structure of the Report...............................................................................................8
2 Methodology....................................................................................................................10
3 Estimated Costs of Waste Management in Lebanon .......................................................11
3.1 Cost of Existing SWM Services in Lebanon ...........................................................11
3.2 Projected Costs of SWM in Lebanon.......................................................................13
3.3 Affordability Analysis and Willingness to Pay .......................................................18
4 Sources of Cost Recovery in Lebanon – Current Situation .............................................19
4.1 National Treasury.....................................................................................................19
4.2 Municipal Budgets ...................................................................................................20
4.3 Independent Municipal Fund (IMF) ........................................................................23
5 Proposed Cost Recovery System .....................................................................................26
5.1 Specific Recommendations......................................................................................27
5.2 Excise Taxes ............................................................................................................28
5.3 Municipal Charge on Rental Value of Property ......................................................35
5.4 Municipal Charge on Utility Consumption..............................................................37
6 Discussion and Recommendations ..................................................................................39
6.1 Cumulative Cost Recovery Potential .......................................................................39
6.2 Acceptance By Lebanese Public.............................................................................44
6.3 Institutional Framework...........................................................................................44
References................................................................................................................................47
RSWMP – Task 4 Cost Recovery for Waste Management in Lebanon
ELARD in association with Tebodin Consultancy and Envirotech iv
Appendix A - Waste Generation in Lebanon
Appendix B – Solid Waste Management and Municipal Budgets
Appendix C - Financial Situation of the Government of Lebanon
Appendix D - Affordability Analysis
Appendix E – Revenues from Proposed Excise Taxation
Appendix F - Proposed Amendment to Customs Law
Appendix G - Proposed Amendment to Municipality Law – Rental Value of Property
Appendix H - Proposed Amendment to Municipality Law – Charges on Utility Bills
RSWMP – Task 4 Cost Recovery for Waste Management in Lebanon
ELARD in association with Tebodin Consultancy and Envirotech v
LIST OF TABLES Table 1. Estimated SWM Expenditures in METAP Countries (1998) ................................11
Table 2. SWM Costs on Municipalities of the Caza of Jbeil ...............................................12
Table 3. Municipal Solid Waste Generation in Lebanon (2004)..........................................13
Table 4. Estimated Existing and Projected Solid Waste Generation....................................15
Table 5. Projected Solid Waste Generation in Lebanon (2005-2014)..................................15
Table 6. Cost of SWM in Lebanon Based on Mohafaza Generation Rates .........................16
Table 7. Estimated Annual Costs of Rehabilitation of Open Dumps over a Ten Year Period....................................................................................................................16
Table 8. Projections of MSW Costs (2004- 2014) ...............................................................17
Table 9. Total Projected Cost s of SWM in Lebanon (2004 – 2014) ...................................17
Table 10. Comparison of the Costs of SWM with its Affordability by the Lebanese Public..............................................................................................................................18
Table 11. Revenue Classification of the Lebanese Government..........................................20
Table 12. Average Revenues and Expenses of Municipalities of the Caza of Jbeil ............22
Table 13. Revenues from the Rental Value of Real Estate for Various Municipalities in Lebanon ................................................................................................................23
Table 14. Distribution of the Independent Municipal Fund from 1997 to 2001 ..................25
Table 15. List of Commodities of the Harmonized System Code........................................30
Table 16. Commodities Subject to Excise Taxation Based on HS Code .............................31
Table 17. Annual Revenues from a 5% Supplemental Excise Tax......................................32
Table 18. Estimated Trend of Growth of Excise Tax Revenues ..........................................34
Table 19. Suggested Municipal Charges on Rental Value of Real Estate............................35
Table 20. Estimated Revenues from Municipal Charges on the Rental Value of Property.................................................................................................................36
Table 21. Estimated Revenue from the Suggested Municipal Fee on Utility Consumption Bills ................................................................................................37
Table 22. Collective Proceeds for the Recovery of Recurrent Costs ...................................39
Table 23. Projected Revenues for the Recovery of the Costs of SWM ...............................41
Table 24. Projected Recovery Revenues and Costs of SWM ..............................................43
Table 25. Summary of Recommendations ...........................................................................46

RSWMP – Task 4 Cost Recovery for Waste Management in Lebanon
ELARD in association with Tebodin Consultancy and Envirotech vi
LIST OF FIGURES
Figure 1. Municipal Solid Waste Generation in Lebanon by Mohafaza (2004) ..................14
Figure 2. Theoretical Distribution of the Independent Municipal Fund (Decree 1917/1979)..............................................................................................................................24
Figure 3. Graph of Revenues from Individual Commodities Subjected to a Supplemental 5% Excise Tax ......................................................................................................33
Figure 4. Trends of Import Values (2004-2014) ..................................................................34
Figure 5. Trend of Increase of the Revenues from Utility Service Consumption Bills .......38
Figure 6. Revenues from the Suggested Sources of Cost Recovery ....................................39
Figure 7. Projected Revenues for Suggested Sources of Cost Recovery .............................40
Figure 8. Projected Recovery Revenues and Costs for SWM..............................................42
Figure 9. Institutional Framework for FCR based on Draft Law on Integrated Waste Management .........................................................................................................44
RSWMP – Task 4 Cost Recovery for Waste Management in Lebanon
ELARD in association with Tebodin Consultancy and Envirotech vii
LIST OF ABBREVIATIONS
CAS Central Administration for Statistics
CDR Council for Development and Reconstruction
CoM Council of Ministers
FCR Finance and Cost Recovery
GBA Greater Beirut Area
GDP Gross Domestic Product
GoL Government of Lebanon
ISWM Integrated Solid Waste Management
IWM Integrate Waste Management
METAP Mediterranean Environmental Technical Assistance Program
MoE Ministry of Environment
MoF Ministry of Finance
MoIM Ministry of Interior and Municipalities
MU Municipal Unions
NERP National Emergency Reconstruction Plan
O&M Operation and Maintenance
PSP Private Sector Participation
RSWMP Regional Solid Waste Management Project in Mashreq and Maghreb
Countries
SWEMP Solid Waste Environmental Management Plan
SWM Solid Waste Management
WB The World Bank
WM Waste Management
WTO World Trade Organization
VAT Value Added Tax
RSWMP – Task 4 Cost Recovery for Waste Management in Lebanon
ELARD in association with Tebodin Consultancy and Envirotech 8
1 INTRODUCTION
1.1 THE CONTEXT OF THE PROJECT
The World Bank, as administrator of the Mediterranean Environment Technical Assistance Program (METAP), has mobilized a grant from the Euro-Med SMAP program for the implementation of a Regional Solid Waste Management Project in Mashreq and Maghreb Countries (RSWMP). The overall objective of the project is to promote the adoption of integrated solid waste management in the selected Mediterranean countries, among which Lebanon. The project will provide the necessary tools for designing, developing, and implementing the main elements of ISWM while promoting exchange of information and experiences within the Region in the field of solid waste management.
1.2 THE LOCAL CONTEXT
The Lebanese Ministry of Environment (MoE) has requested from the World Bank that the national activity in Lebanon be tailored towards the elaboration of a legal framework for ISWM in Lebanon while strengthening the capacities in selecting preferred SWM systems and in negotiating private sector contracts.
1.3 THE OBJECTIVES OF THE PROJECT
In this context, the objectives of the national activity are to : (1) develop a legal framework that supports the adoption of ISWM; (2) implement training modules at the national and municipal level for the application and enforcement of the legal framework with focus on capacity development in supervision and monitoring contracts; (3) develop an economic model with relevant implementing tools that assist municipal and national entities in selecting preferred SWM; and (4) assist concerned institutions in selecting and applying two of the World Bank Regional Guidelines for Solid Waste Management in METAP countries, developed by the International Consortium (GTZ – GKW - ERM), the regional consultants for the project.
Based on the needs assessment conducted with the MoE, the Regional Guidelines selected for application included: (i) Financing and Cost Recovery, and (ii) Private Sector Participation. The application of the above mentioned guidelines would take place through on-the-job training of the relevant national or local public authority.
1.4 OBJECTIVE OF THE REPORT
The objective of this report is to present the findings of the training-on-the job exercise conducted with the Ministry of Finance (MoF) aiming at developing a cost recovery system for waste management in the Republic of Lebanon. The exercise was based on the World Bank Regional Guidelines on Financing and Cost Recovery for Solid Waste Management.
1.5 STRUCTURE OF THE REPORT
In addition to this introduction, this report consists of three sections. Section 2 presents the methodology adopted in the on-the-job training exercise. Section 3 approximates the total

RSWMP – Task 4 Cost Recovery for Waste Management in Lebanon
ELARD in association with Tebodin Consultancy and Envirotech 9
costs of waste management in Lebanon and then estimates the recurrent costs that will need to be recovered annually. Section 4 lists and evaluates the current sources for cost recovery in Lebanon: i) the national treasury, ii) municipal budgets and iii) the independent municipal fund. Section 5 presents the potential funds that could be collected to recover the recurrent costs of waste management as was determined through the on-the-job training exercise with the Ministry of Finance. Finally, an evaluation of the cost recovery sources, as well as some recommendations are presented in Section 6.
RSWMP – Task 4 Cost Recovery for Waste Management in Lebanon
ELARD in association with Tebodin Consultancy and Envirotech 10
2 METHODOLOGY The on-the-job training exercise for developing a cost recovery system for WM with the MoF consisted of:
(i) Estimating the real costs of existing services in Section 3.1,
(ii) Evaluating and selecting preferred WM alternative based on the national strategy,
(iii) Estimating the costs of the preferred alternative projected for a period of ten years in Section 3.2, and
(iv) Review of the existing funding system in Section 4, and
(v) Determining the means through which the cost of the new system could be recovered from the service users in Sections 5 and 6.
The absence of national waste management (WM) strategy and plans, which are supported by a legal framework, rendered steps (ii) and (iii) ineffective. At present, the Government of Lebanon does not present decision-makers with guidance in their choices of WM service areas, service levels, or preferred technologies. This leads to a wide selection of alternatives - all of which have disparate associated costs.
Step (iii) was also deterred by the scarcity of reliable data on the municipal solid waste generation in the country, in addition to discrepancies amongst these few sources. Moreover, few if any sources distinguish between the investment costs and the O&M costs of WM, which reduces the grounds upon which assumptions can be made.
Accordingly, in its computations, this report relies on numerous approximations and assumptions. When no data was found (recent or otherwise), the report relied on benchmark figures for the region and assumptions.

RSWMP – Task 4 Cost Recovery for Waste Management in Lebanon
ELARD in association with Tebodin Consultancy and Envirotech 11
3 ESTIMATED COSTS OF WASTE MANAGEMENT IN LEBANON This chapter of the report comprises three sections all of which address the costs associated with Waste Management in Lebanon. Section 3.1 presents an overview of the adopted SWM systems and their associated costs based on geographic location. Due to the lack of a national strategy or plan, Section 3.2 attempts to estimate the costs a preferred SWM system for Lebanon and projects these costs for the next ten years (2004 - 2014). The computations used depend on reliable benchmarks, available data and basic assumptions when necessary. Finally, Section 3.3 investigates the scope of affordability of the Lebanese public for SWM services.
3.1 COST OF EXISTING SWM SERVICES IN LEBANON
A brief overview of the METAP region (Table 1, METAP, 2001) demonstrates that the per-capita expenditure on SWM in Lebanon exceeds that of all countries in the region. Also, the unit cost of WM (per capita and per tonne) in Lebanon is significantly higher than that of the other METAP countries.
Table 1. Estimated SWM Expenditures in METAP Countries (1998)
Lebanon Syria Jordan West Bank /Gaza Egypt Tunisia Morocco
Total Cost (Million $US) 69.00 30.10 -
39.00 21.76 -26.18 7.83-15.70 32.40-
37.26 33.38-44.94
96.92-127.94
Average Cost Per-Capita ($US/capita)
16.82 1.80 – 2.33
4.93 – 5.95 2.70 - 5.40 0.49 -
0.56 3.58 - 4.83 3.23 – 4.26
Average Cost Per Ton ($US/Ton)
50 9 – 11 17 – 20 8 – 17 2 – 3 19 – 25 16 – 21
Average Cost as % of Per Capita GDP
0.37 0.04 – 0.05
0.37 – 0.45 0.23 - 0.46 0.04 -
0.05 0.17 - 0.23 0.27 – 0.35
Source: METAP, “Regional Solid Waste Management Project: Current Situation Report”, March 2000
As for the methods of financing for SWM in Lebanon, initial investment costs have traditionally been financed by the central government through the national treasury or international loans and grants. To a considerably lesser extent, these costs were shouldered by municipalities through their individual budgets or their share of the Independent Municipal Fund (means through which the government distributes monies to municipalities).
On the other hand, the central government plays a more limited role in the recovery of recurrent costs (operation and maintenance costs, private sector contracts...) for SWM activities. It is the local authority - mainly the municipality - that supports this cost. Based on geographic location, municipalities can be grouped into two main categories regarding their means of cost recovery with few exceptions such as the cases of the Zahleh and Tripoli municipalities.
RSWMP – Task 4 Cost Recovery for Waste Management in Lebanon
ELARD in association with Tebodin Consultancy and Envirotech 12
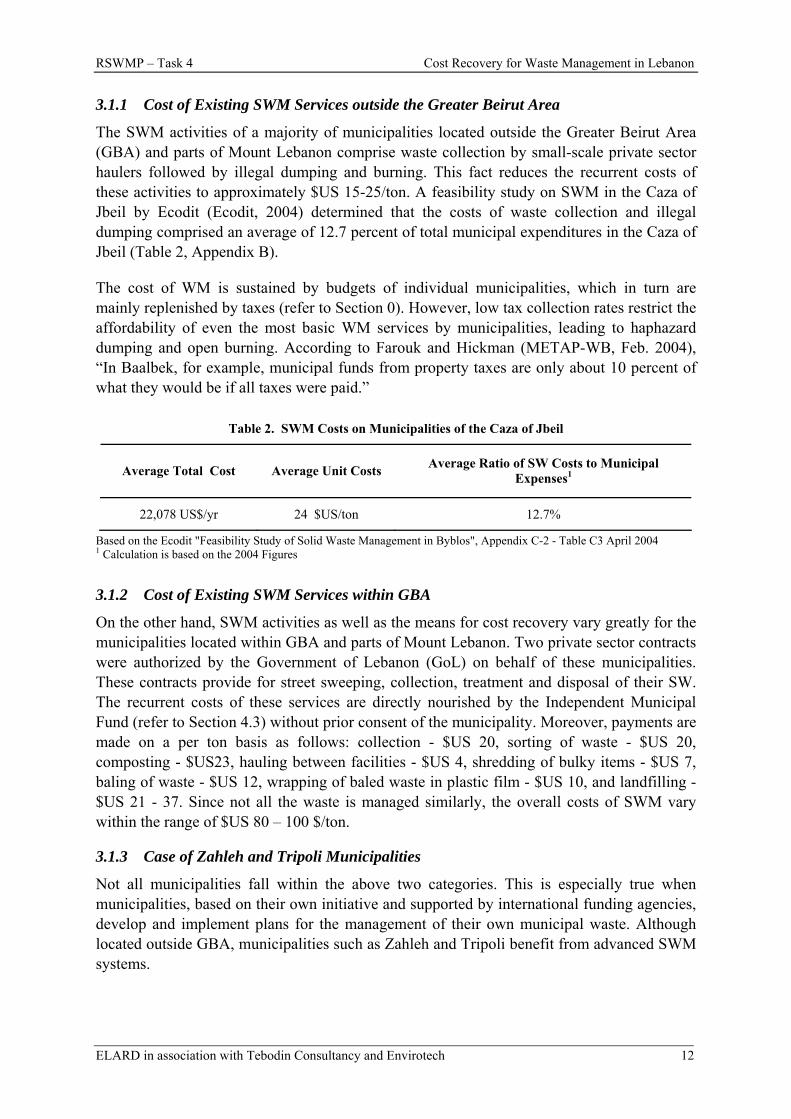
3.1.1 Cost of Existing SWM Services outside the Greater Beirut Area
The SWM activities of a majority of municipalities located outside the Greater Beirut Area (GBA) and parts of Mount Lebanon comprise waste collection by small-scale private sector haulers followed by illegal dumping and burning. This fact reduces the recurrent costs of these activities to approximately $US 15-25/ton. A feasibility study on SWM in the Caza of Jbeil by Ecodit (Ecodit, 2004) determined that the costs of waste collection and illegal dumping comprised an average of 12.7 percent of total municipal expenditures in the Caza of Jbeil (Table 2, Appendix B).
The cost of WM is sustained by budgets of individual municipalities, which in turn are mainly replenished by taxes (refer to Section 0). However, low tax collection rates restrict the affordability of even the most basic WM services by municipalities, leading to haphazard dumping and open burning. According to Farouk and Hickman (METAP-WB, Feb. 2004), “In Baalbek, for example, municipal funds from property taxes are only about 10 percent of what they would be if all taxes were paid.”
Table 2. SWM Costs on Municipalities of the Caza of Jbeil
Average Total Cost Average Unit Costs Average Ratio of SW Costs to Municipal Expenses1
22,078 US$/yr 24 $US/ton 12.7%
Based on the Ecodit "Feasibility Study of Solid Waste Management in Byblos", Appendix C-2 - Table C3 April 2004 1 Calculation is based on the 2004 Figures
3.1.2 Cost of Existing SWM Services within GBA
On the other hand, SWM activities as well as the means for cost recovery vary greatly for the municipalities located within GBA and parts of Mount Lebanon. Two private sector contracts were authorized by the Government of Lebanon (GoL) on behalf of these municipalities. These contracts provide for street sweeping, collection, treatment and disposal of their SW. The recurrent costs of these services are directly nourished by the Independent Municipal Fund (refer to Section 4.3) without prior consent of the municipality. Moreover, payments are made on a per ton basis as follows: collection - $US 20, sorting of waste - $US 20, composting - $US23, hauling between facilities - $US 4, shredding of bulky items - $US 7, baling of waste - $US 12, wrapping of baled waste in plastic film - $US 10, and landfilling - $US 21 - 37. Since not all the waste is managed similarly, the overall costs of SWM vary within the range of $US 80 – 100 $/ton.
3.1.3 Case of Zahleh and Tripoli Municipalities
Not all municipalities fall within the above two categories. This is especially true when municipalities, based on their own initiative and supported by international funding agencies, develop and implement plans for the management of their own municipal waste. Although located outside GBA, municipalities such as Zahleh and Tripoli benefit from advanced SWM systems.
RSWMP – Task 4 Cost Recovery for Waste Management in Lebanon
ELARD in association with Tebodin Consultancy and Envirotech 13
In Zahleh, the Solid Waste Environmental Management Project (SWEMP), financed by a loan from the World Bank, provided for the construction of a sanitary landfill and sorting facility within the municipality. Excluding the waste collection costs of $US 6.5/ton (WB-METAP, Feb. 2004), the recurrent costs of the SWM system amount to approximately $US 17 - 26 /ton (CDR, 2003; WB-METAP, Feb. 2004).
In Tripoli, MSW is collected and disposed of in the Tripoli landfill rehabilitated as part of the National Emergency Reconstruction Project (NERP). The management of the landfill, contracted to a private company, was costing the Federation of “Al-Fayha” Municipalities a sum of $US 18.7/ton according to the CDR Annual Report (CDR, 2003). Today the contract for collection and dumpsite management in Tripoli costs the Federation the equivalent of approximately $US 14/ton (WB-METAP, Feb. 2004).
3.2 PROJECTED COSTS OF SWM IN LEBANON
As was mentioned in the Methodology Section (Section 2), developing a cost recovery system for waste management consists of several steps. This section estimates the costs of the preferred SWM system and projects them for the next ten years (2005 – 2014). Section 3.2.1 calculates the quantity of MSW generated in Lebanon in 2004 and then projects these values for the following ten years (2005-2014). Next, based on the findings of Section 3.2.1 and WB benchmark figures for the region, the costs of WM are calculated and projected in Section 3.2.2.
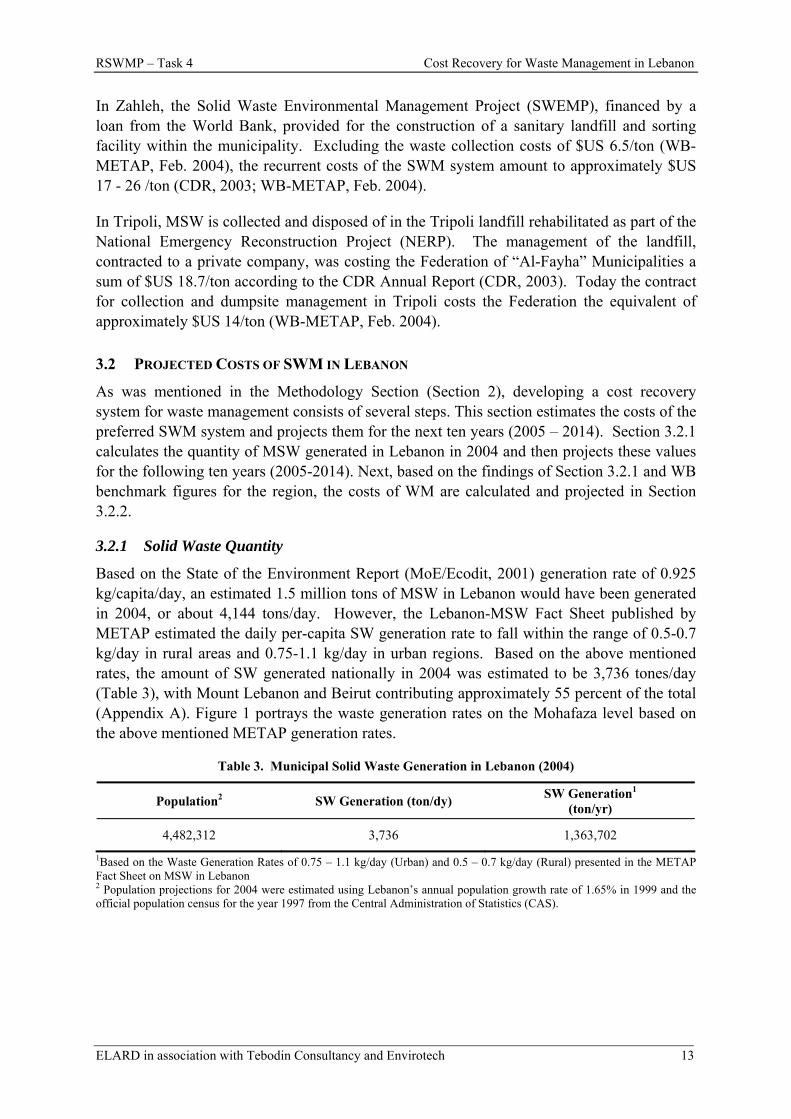
3.2.1 Solid Waste Quantity
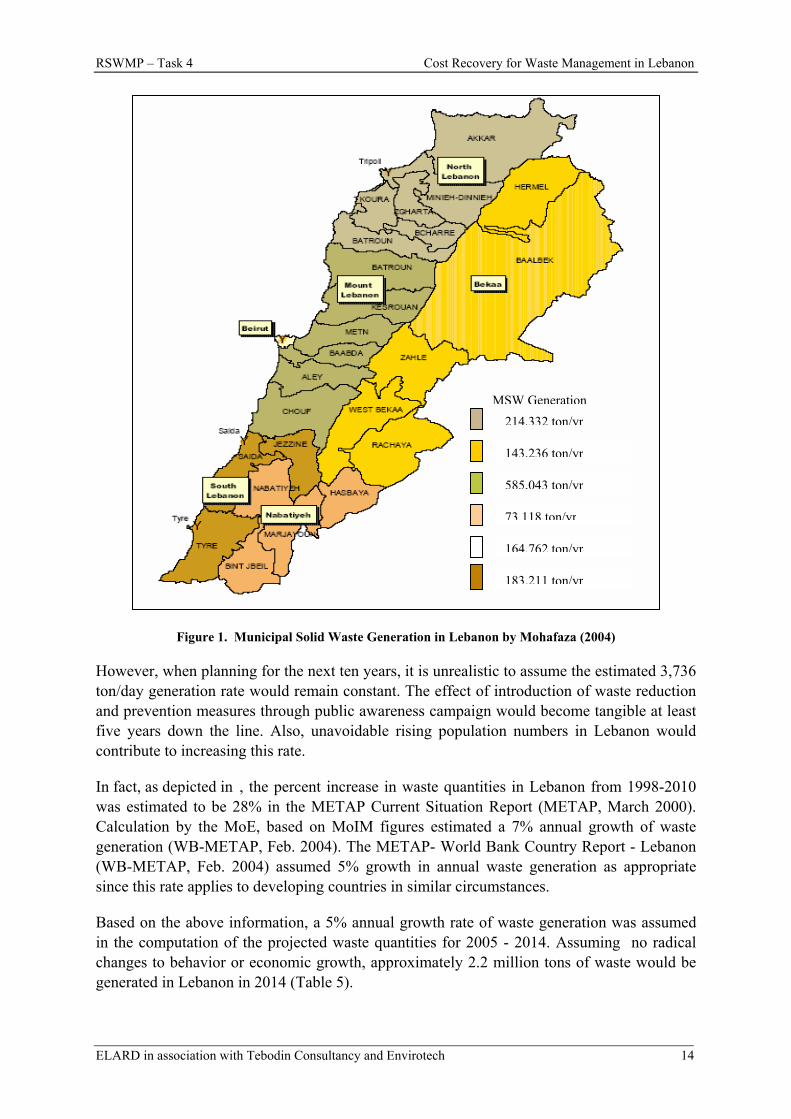
Based on the State of the Environment Report (MoE/Ecodit, 2001) generation rate of 0.925 kg/capita/day, an estimated 1.5 million tons of MSW in Lebanon would have been generated in 2004, or about 4,144 tons/day. However, the Lebanon-MSW Fact Sheet published by METAP estimated the daily per-capita SW generation rate to fall within the range of 0.5-0.7 kg/day in rural areas and 0.75-1.1 kg/day in urban regions. Based on the above mentioned rates, the amount of SW generated nationally in 2004 was estimated to be 3,736 tones/day (Table 3), with Mount Lebanon and Beirut contributing approximately 55 percent of the total (Appendix A). Figure 1 portrays the waste generation rates on the Mohafaza level based on the above mentioned METAP generation rates.
Table 3. Municipal Solid Waste Generation in Lebanon (2004)
Population2 SW Generation (ton/dy) SW Generation1 (ton/yr)
4,482,312 3,736 1,363,702 1Based on the Waste Generation Rates of 0.75 – 1.1 kg/day (Urban) and 0.5 – 0.7 kg/day (Rural) presented in the METAP Fact Sheet on MSW in Lebanon 2 Population projections for 2004 were estimated using Lebanon’s annual population growth rate of 1.65% in 1999 and the official population census for the year 1997 from the Central Administration of Statistics (CAS).
RSWMP – Task 4 Cost Recovery for Waste Management in Lebanon
ELARD in association with Tebodin Consultancy and Envirotech 14
Figure 1. Municipal Solid Waste Generation in Lebanon by Mohafaza (2004)
However, when planning for the next ten years, it is unrealistic to assume the estimated 3,736 ton/day generation rate would remain constant. The effect of introduction of waste reduction and prevention measures through public awareness campaign would become tangible at least five years down the line. Also, unavoidable rising population numbers in Lebanon would contribute to increasing this rate.
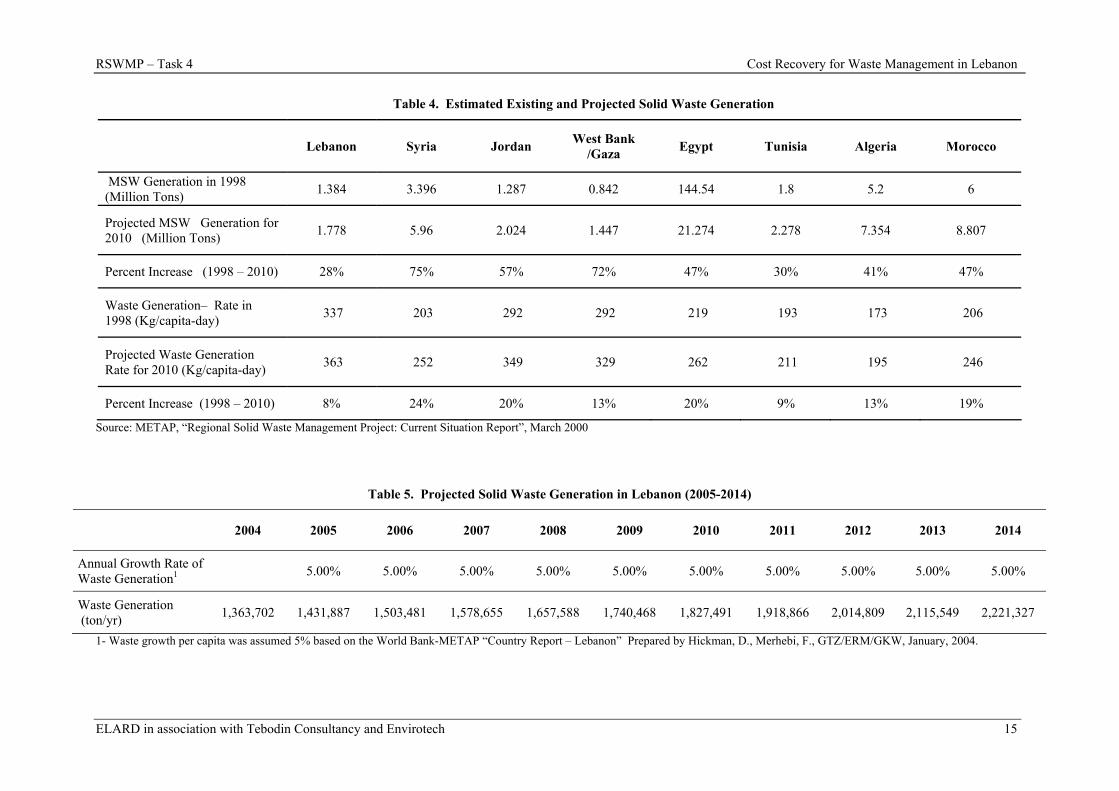
In fact, as depicted in , the percent increase in waste quantities in Lebanon from 1998-2010 was estimated to be 28% in the METAP Current Situation Report (METAP, March 2000). Calculation by the MoE, based on MoIM figures estimated a 7% annual growth of waste generation (WB-METAP, Feb. 2004). The METAP- World Bank Country Report - Lebanon (WB-METAP, Feb. 2004) assumed 5% growth in annual waste generation as appropriate since this rate applies to developing countries in similar circumstances.
Based on the above information, a 5% annual growth rate of waste generation was assumed in the computation of the projected waste quantities for 2005 - 2014. Assuming no radical changes to behavior or economic growth, approximately 2.2 million tons of waste would be generated in Lebanon in 2014 (Table 5).
MSW Generation214,332 ton/yr
143,236 ton/yr
585,043 ton/yr
73,118 ton/yr
164,762 ton/yr
183,211 ton/yr
RSWMP – Task 4 Cost Recovery for Waste Management in Lebanon
ELARD in association with Tebodin Consultancy and Envirotech 15
Table 4. Estimated Existing and Projected Solid Waste Generation
Lebanon Syria Jordan West Bank /Gaza Egypt Tunisia Algeria Morocco
MSW Generation in 1998 (Million Tons) 1.384 3.396 1.287 0.842 144.54 1.8 5.2 6
Projected MSW Generation for 2010 (Million Tons) 1.778 5.96 2.024 1.447 21.274 2.278 7.354 8.807
Percent Increase (1998 – 2010) 28% 75% 57% 72% 47% 30% 41% 47%
Waste Generation– Rate in 1998 (Kg/capita-day) 337 203 292 292 219 193 173 206
Projected Waste Generation Rate for 2010 (Kg/capita-day) 363 252 349 329 262 211 195 246
Percent Increase (1998 – 2010) 8% 24% 20% 13% 20% 9% 13% 19%
Source: METAP, “Regional Solid Waste Management Project: Current Situation Report”, March 2000
Table 5. Projected Solid Waste Generation in Lebanon (2005-2014)
2004 2005 2006 2007 2008 2009 2010 2011 2012 2013 2014
Annual Growth Rate of Waste Generation1 5.00% 5.00% 5.00% 5.00% 5.00% 5.00% 5.00% 5.00% 5.00% 5.00%
Waste Generation (ton/yr) 1,363,702 1,431,887 1,503,481 1,578,655 1,657,588 1,740,468 1,827,491 1,918,866 2,014,809 2,115,549 2,221,327
1- Waste growth per capita was assumed 5% based on the World Bank-METAP “Country Report – Lebanon” Prepared by Hickman, D., Merhebi, F., GTZ/ERM/GKW, January, 2004.
RSWMP – Task 4 Cost Recovery for Waste Management in Lebanon
ELARD in association with Tebodin Consultancy and Envirotech 16
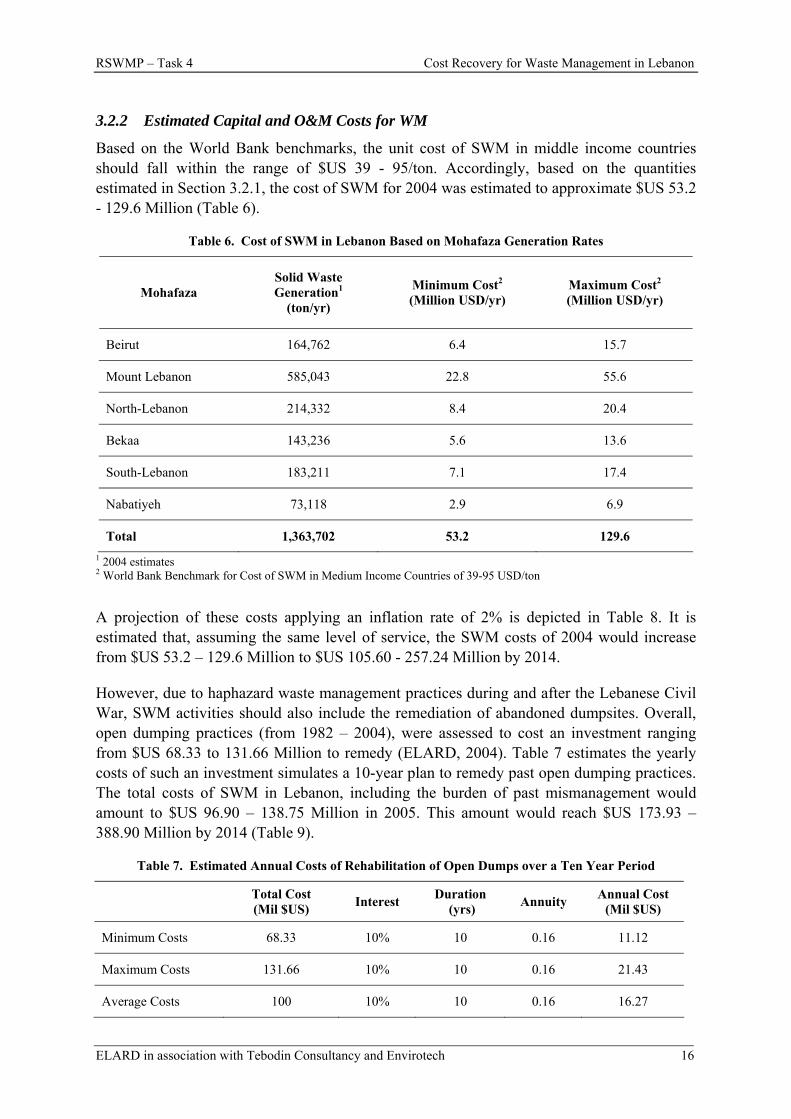
3.2.2 Estimated Capital and O&M Costs for WM
Based on the World Bank benchmarks, the unit cost of SWM in middle income countries should fall within the range of $US 39 - 95/ton. Accordingly, based on the quantities estimated in Section 3.2.1, the cost of SWM for 2004 was estimated to approximate $US 53.2 - 129.6 Million (Table 6).
Table 6. Cost of SWM in Lebanon Based on Mohafaza Generation Rates
Mohafaza Solid Waste Generation1
(ton/yr)
Minimum Cost2 (Million USD/yr)
Maximum Cost2 (Million USD/yr)
Beirut 164,762 6.4 15.7
Mount Lebanon 585,043 22.8 55.6
North-Lebanon 214,332 8.4 20.4
Bekaa 143,236 5.6 13.6
South-Lebanon 183,211 7.1 17.4
Nabatiyeh 73,118 2.9 6.9
Total 1,363,702 53.2 129.6 1 2004 estimates 2 World Bank Benchmark for Cost of SWM in Medium Income Countries of 39-95 USD/ton
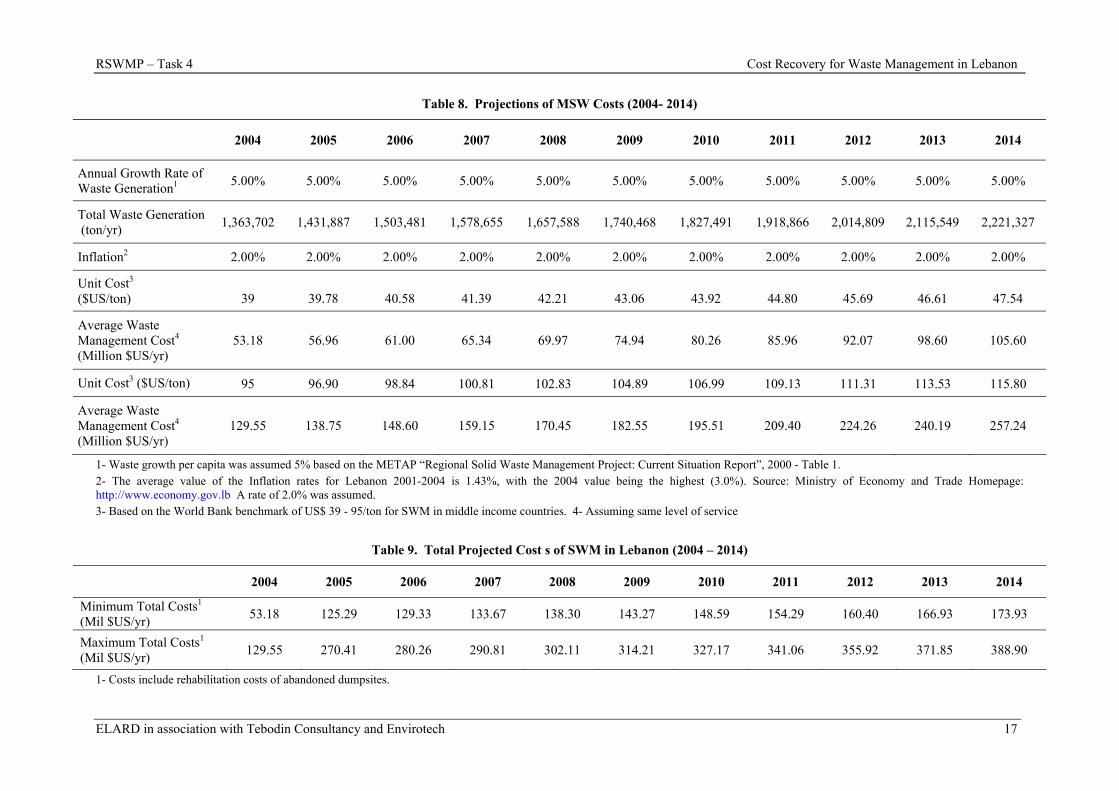
A projection of these costs applying an inflation rate of 2% is depicted in Table 8. It is estimated that, assuming the same level of service, the SWM costs of 2004 would increase from $US 53.2 – 129.6 Million to $US 105.60 - 257.24 Million by 2014.
However, due to haphazard waste management practices during and after the Lebanese Civil War, SWM activities should also include the remediation of abandoned dumpsites. Overall, open dumping practices (from 1982 – 2004), were assessed to cost an investment ranging from $US 68.33 to 131.66 Million to remedy (ELARD, 2004). Table 7 estimates the yearly costs of such an investment simulates a 10-year plan to remedy past open dumping practices. The total costs of SWM in Lebanon, including the burden of past mismanagement would amount to $US 96.90 – 138.75 Million in 2005. This amount would reach $US 173.93 – 388.90 Million by 2014 (Table 9).
Table 7. Estimated Annual Costs of Rehabilitation of Open Dumps over a Ten Year Period
Total Cost (Mil $US) Interest Duration
(yrs) Annuity Annual Cost (Mil $US)
Minimum Costs 68.33 10% 10 0.16 11.12
Maximum Costs 131.66 10% 10 0.16 21.43
Average Costs 100 10% 10 0.16 16.27
RSWMP – Task 4 Cost Recovery for Waste Management in Lebanon
ELARD in association with Tebodin Consultancy and Envirotech 17
Table 8. Projections of MSW Costs (2004- 2014)
2004 2005 2006 2007 2008 2009 2010 2011 2012 2013 2014
Annual Growth Rate of Waste Generation1 5.00% 5.00% 5.00% 5.00% 5.00% 5.00% 5.00% 5.00% 5.00% 5.00% 5.00%
Total Waste Generation (ton/yr) 1,363,702 1,431,887 1,503,481 1,578,655 1,657,588 1,740,468 1,827,491 1,918,866 2,014,809 2,115,549 2,221,327
Inflation2 2.00% 2.00% 2.00% 2.00% 2.00% 2.00% 2.00% 2.00% 2.00% 2.00% 2.00%
Unit Cost3 ($US/ton) 39 39.78 40.58 41.39 42.21 43.06 43.92 44.80 45.69 46.61 47.54
Average Waste Management Cost4 (Million $US/yr)
53.18 56.96 61.00 65.34 69.97 74.94 80.26 85.96 92.07 98.60 105.60
Unit Cost3 ($US/ton) 95 96.90 98.84 100.81 102.83 104.89 106.99 109.13 111.31 113.53 115.80
Average Waste Management Cost4 (Million $US/yr)
129.55 138.75 148.60 159.15 170.45 182.55 195.51 209.40 224.26 240.19 257.24
1- Waste growth per capita was assumed 5% based on the METAP “Regional Solid Waste Management Project: Current Situation Report”, 2000 - Table 1. 2- The average value of the Inflation rates for Lebanon 2001-2004 is 1.43%, with the 2004 value being the highest (3.0%). Source: Ministry of Economy and Trade Homepage: http://www.economy.gov.lb A rate of 2.0% was assumed. 3- Based on the World Bank benchmark of US$ 39 - 95/ton for SWM in middle income countries. 4- Assuming same level of service
Table 9. Total Projected Cost s of SWM in Lebanon (2004 – 2014)
2004 2005 2006 2007 2008 2009 2010 2011 2012 2013 2014
Minimum Total Costs1 (Mil $US/yr) 53.18 125.29 129.33 133.67 138.30 143.27 148.59 154.29 160.40 166.93 173.93
Maximum Total Costs1 (Mil $US/yr) 129.55 270.41 280.26 290.81 302.11 314.21 327.17 341.06 355.92 371.85 388.90
1- Costs include rehabilitation costs of abandoned dumpsites.
RSWMP – Task 4 Cost Recovery for Waste Management in Lebanon
ELARD in association with Tebodin Consultancy and Envirotech 18
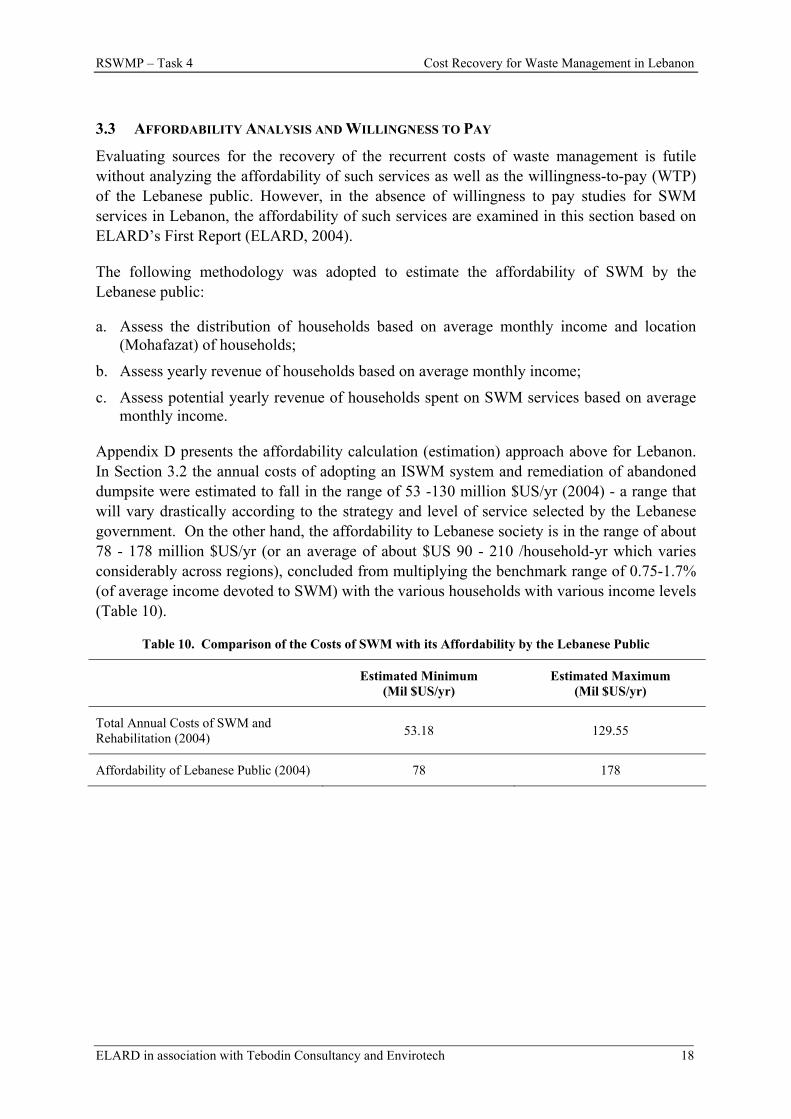
3.3 AFFORDABILITY ANALYSIS AND WILLINGNESS TO PAY
Evaluating sources for the recovery of the recurrent costs of waste management is futile without analyzing the affordability of such services as well as the willingness-to-pay (WTP) of the Lebanese public. However, in the absence of willingness to pay studies for SWM services in Lebanon, the affordability of such services are examined in this section based on ELARD’s First Report (ELARD, 2004).
The following methodology was adopted to estimate the affordability of SWM by the Lebanese public:
a. Assess the distribution of households based on average monthly income and location (Mohafazat) of households;
b. Assess yearly revenue of households based on average monthly income;
c. Assess potential yearly revenue of households spent on SWM services based on average monthly income.
Appendix D presents the affordability calculation (estimation) approach above for Lebanon. In Section 3.2 the annual costs of adopting an ISWM system and remediation of abandoned dumpsite were estimated to fall in the range of 53 -130 million $US/yr (2004) - a range that will vary drastically according to the strategy and level of service selected by the Lebanese government. On the other hand, the affordability to Lebanese society is in the range of about 78 - 178 million $US/yr (or an average of about $US 90 - 210 /household-yr which varies considerably across regions), concluded from multiplying the benchmark range of 0.75-1.7% (of average income devoted to SWM) with the various households with various income levels (Table 10).
Table 10. Comparison of the Costs of SWM with its Affordability by the Lebanese Public
Estimated Minimum (Mil $US/yr)
Estimated Maximum (Mil $US/yr)
Total Annual Costs of SWM and Rehabilitation (2004) 53.18 129.55
Affordability of Lebanese Public (2004) 78 178
RSWMP – Task 4 Cost Recovery for Waste Management in Lebanon
ELARD in association with Tebodin Consultancy and Envirotech 19
4 SOURCES OF COST RECOVERY IN LEBANON – CURRENT SITUATION After assessing the costs and affordability of SWM in Lebanon (Section 3), the sources that sustain the costs of the existing system will be evaluated. This section delves into these sources by explaining the funding mechanisms, supporting legislation and status quo of the three main sources: the national treasury (Section 4.1), municipal budgets (Section 0), and the independent Municipal Fund (Section 4.3).
4.1 NATIONAL TREASURY
4.1.1 Allocation of Funds from the National Treasury
In Lebanon, funds from the National Treasury are allocated according to the National Budget, prepared by the MoF. The process of preparing and adopting the budget is governed by relevant provisions of the Lebanese Constitution in addition to the Law on Public Accounting, implemented by Decree No. 14969/1963.
Every year, after reviewing the estimates prepared by the various Ministries, the Ministry of Finance has to propose a new budget for the following year. By September 1, the proposed budget has to be submitted to the Council of Ministers for review. The budget is then forwarded to the Parliament for final review and approval by October 15.
4.1.2 Status of the National Treasury
The government has reached its limits in national taxation and borrowing capacity. The former could be revealed by the current social situation and reaction(s) to any increases in taxes, and the latter is revealed by the already extensive public debt (exceeding 174 percent of 2003 GDP, or $US 32 billion). A summary of the financial situation of the GoL can be found in Appendix C. Furthermore, the government’s revenues are severely limited after taking into account debt service (around 50 percent of total government expenditure in 2003) and public salaries, wages, subsidies and transfers (42 percent of total government expenditure in 2003). In the 2004 Draft Budget Law, personnel costs (salaries, wages, related benefits, pensions, and end of service indemnities) represent 37 percent of the total funds, enumerated in the budget, and 47 percent to service the public debt. These fractions of the total government expenditure are not flexible and cannot be tampered with as long as they are present.
What is left for the government of Lebanon is only between 10 and 20 percent of its total revenues to spend on various infrastructure and environmental issues, or an average of 15 percent of total revenues (or around USD 660 to 670 million only in 2003). Given the wide range of requirement for infrastructure provision such as water and sewage networks (construction and maintenance, C&M), the Lebanese road network (C&M) and their respective land acquisitions, and hardware military expenditures among other spending, USD 660 to 670 million (or around 3.6-3.7 percent of GDP) may not be sufficient.
RSWMP – Task 4 Cost Recovery for Waste Management in Lebanon
ELARD in association with Tebodin Consultancy and Envirotech 20
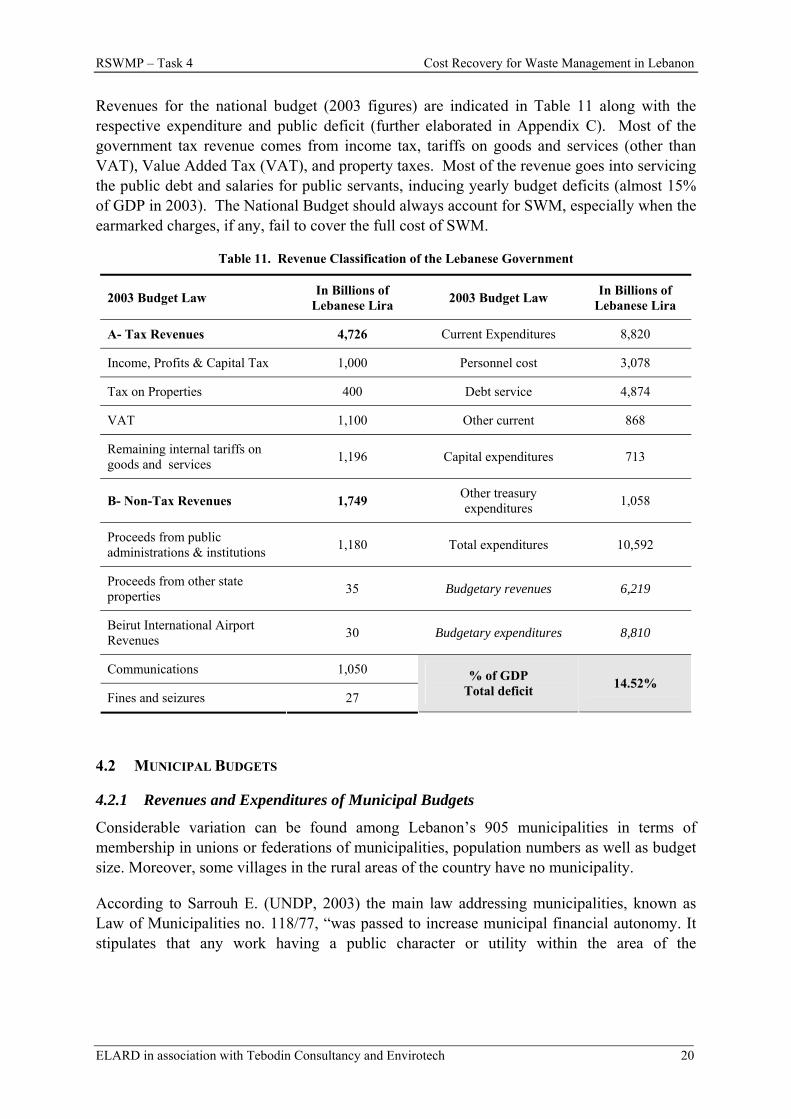
Revenues for the national budget (2003 figures) are indicated in Table 11 along with the respective expenditure and public deficit (further elaborated in Appendix C). Most of the government tax revenue comes from income tax, tariffs on goods and services (other than VAT), Value Added Tax (VAT), and property taxes. Most of the revenue goes into servicing the public debt and salaries for public servants, inducing yearly budget deficits (almost 15% of GDP in 2003). The National Budget should always account for SWM, especially when the earmarked charges, if any, fail to cover the full cost of SWM.
Table 11. Revenue Classification of the Lebanese Government
2003 Budget Law In Billions of Lebanese Lira 2003 Budget Law In Billions of
Lebanese Lira
A- Tax Revenues 4,726 Current Expenditures 8,820
Income, Profits & Capital Tax 1,000 Personnel cost 3,078
Tax on Properties 400 Debt service 4,874
VAT 1,100 Other current 868
Remaining internal tariffs on goods and services 1,196 Capital expenditures 713
B- Non-Tax Revenues 1,749 Other treasury expenditures 1,058
Proceeds from public administrations & institutions 1,180 Total expenditures 10,592
Proceeds from other state properties 35 Budgetary revenues 6,219
Beirut International Airport Revenues 30 Budgetary expenditures 8,810
Communications 1,050
Fines and seizures 27
% of GDP Total deficit 14.52%
4.2 MUNICIPAL BUDGETS
4.2.1 Revenues and Expenditures of Municipal Budgets
Considerable variation can be found among Lebanon’s 905 municipalities in terms of membership in unions or federations of municipalities, population numbers as well as budget size. Moreover, some villages in the rural areas of the country have no municipality.
According to Sarrouh E. (UNDP, 2003) the main law addressing municipalities, known as Law of Municipalities no. 118/77, “was passed to increase municipal financial autonomy. It stipulates that any work having a public character or utility within the area of the
RSWMP – Task 4 Cost Recovery for Waste Management in Lebanon
ELARD in association with Tebodin Consultancy and Envirotech 21
municipality falls under the jurisdiction of the municipal council.” The law specifies that municipalities can sustain their budgets from seven main sources1:
1. Direct charges collected by municipalities;
2. Funds collected by the state, private organizations or public institutions and re-distributed to each municipality;
3. Funds collected by the state for all municipalities (IMF);
4. Grants and loans;
5. Revenues from municipal property rentals;
6. Fines or penalties; and
7. Donations.
Additionally, Law no. 60/88 dated 12/08/1988 on Municipal Fees and Charges itemizes the types, values as well as the manner of collection of the various municipal charges. This law groups municipal fees into two main groups:
A. Fees and tariffs collected directly by the municipality - including: Fees on the rental value of property; Fees on residential and commercial rental contracts; Charges on construction permits; Fees for advertisements; Fees on classified industries; Fees on gas stations, gambling houses…; User-charge for sewage and pavement maintenance; Others… (not for solid waste management)
B. Funds collected by the state, public agencies or private entities on behalf of municipalities - including 10% tax on built real estate; 10% tax on profits of commercial, industrial and non-commercial professions; 10% tax on transfer of companies, bequests and grants; 3.5% of port authority collections; 3% on insurance premiums (private company); 10% VAT on utility service bills for cellular phones (private company); 10% VAT on water usage fees collected by the water authority; 10% VAT on electricity consumption collected by Electricité du Liban; and Others…
Municipal expenditures are either governed by the Law of Public Accounting or Decree 5595/822. In fact, Decree 2838/593 stipulates the conformance of fifty of Lebanon’s largest municipalities to the Law of Public Accounting and its stringent audit requirements. On the other hand, Decree 5595/82 governs the expenditures of the remaining municipalities and itemizes the following as valid municipal expenditures to be included in the municipal budget:
A. Administrative Expenses – including rent, salaries, telephone & electricity bills …
B. Maintenance and Public Cleanliness – such as street cleaning, road asphalting, street lighting, waste collection, pest control, setting up of road signs, maintenance of sewerage network, …
1 Article 86 of Law of Municipalities no. 118/77, dated 30/6/1977. 2 Decree 5595/82 on the Mechanisms of Budgeting for Municipalities and Unions of Municipalities Not Subject to the Law of Public Accounting, dated (22/09/1982) – Article 11 3 Decree 2838/59 dated 14/12/1959 on the Adherence of Select Municipalities to the Provisions of the Law of Public Accounting.
RSWMP – Task 4 Cost Recovery for Waste Management in Lebanon
ELARD in association with Tebodin Consultancy and Envirotech 22
C. Infrastructure Development – such as construction of sewage system, lighting system, pavement, roads, storm sewers, parks,
D. Services and Aid – such as help of the needy, charities, encouraging educational and cultural activities, scholarships…
E. Miscellaneous Expenses – such as festivals, celebrations, previous year’s expenses, legal expenses, union fees, debt payments…
F. Reserve
According to Sarrouh E., despite the expenditures assigned in the law, “in effect, the services provided by Lebanese municipalities are confined to marginal activities such as street cleaning, road asphalting, street lighting, setting up road signs, rehabilitating and extending the sewage and water drainage systems, etc,… There is, thus, a wide gap between what the municipalities are allowed to do by law, and what they are actually able to do, given their resources, ” (UNDP, 2003).
4.2.2 Status of Municipal Budgets
According to Shehadi K., approximately 50% of Lebanon’s municipalities have annual revenues and expenditures that range from US$6,000 to US$60,000 (Shehadi K., 1997). A brief survey of municipal finances in the Caza of Jbeil, based on 2001 – 2003 figures4, indicates that municipalities in that area have an average collection rate of 44.47%, average revenues amount to $US 372,420, and average expenditures amount to $US 311,000 (Table 12, Appendix B).
Table 12. Average Revenues and Expenses of Municipalities of the Caza of Jbeil
Average Collection Rates
(%)
Average Revenues ($US '000)
Average Expenses ($US '000)
Average Cost of SWM1
(US$'000/yr)
SW Cost / Municipal
Expenses (%)
44.47 372.42 311 22.08 12.7
Based on figures for 2000, 2001 and 2002, Source: Ecodit "Feasibility Study of Solid Waste Management in Byblos", Appendix C-2 - Table C3. April, 2004 1 Estimation based on population figures and per-capita waste generation rate of 0.83 kg/day.
Regarding SWM in developing countries, such as Lebanon, it is typical for municipalities to spend 20-50 % of their available budget on SWM (WB, Jan. 2004). In the case of the municipalities of Jbeil (Table 12, Appendix B), the average ratio of SWM costs to total expenditures reaches 12.7%, with a range of 3.3% - 27.9%. However it should be noted that the costs of SWM in Jbeil only include the costs of collection, transport and open dumping activities without the costs incurred from treatment and controlled disposal. Implementing proper ISWM practices would incur higher costs and therefore consume a higher portion of municipal budgets, and may well fall within the above mentioned range.
Moreover, out of all the sources of municipal income listed in Section 4.2.1, revenue from rental value of real estate constitutes approximately 40% of the total revenues for most
4 Source of the 2001-2003 Figures:
RSWMP – Task 4 Cost Recovery for Waste Management in Lebanon
ELARD in association with Tebodin Consultancy and Envirotech 23
municipalities (USAID, 2004). Figures of 2001 – 2003 municipal revenue from the rental value of real estate for different municipalities in Lebanon are displayed in Table 13.
Table 13. Revenues from the Rental Value of Real Estate for Various Municipalities in Lebanon
2001 2002 2003
Revenue from Rental Value Charge in Beirut (Mil $US) 26.0 31.1 38.6
Revenue from Rental Value Charge in Tripoli (Mil $US) 2.3 3.1 3.9
Revenue from Rental Value Charge in Jounieh (Mil $US) 0.57 1.2 1.3
Revenue from Rental Value Charge from 12 Municipalities from South Lebanon (Mil $US)
2.9 3.0 3.1
Revenue from Rental Value Charge from 12 Municipalities of Baalbek and Zahleh (Mil $US)
3.24 3.6
Source: University at Albany, State University of New York, Center for Legislative Development, “Lebanon Relief and Redevelopment Project: Government Institutions Strengthening Component – Local Government and Parliament Project – Annual Report”, United States Agency for International Development (USAID), June 2004
4.3 INDEPENDENT MUNICIPAL FUND (IMF)
4.3.1 Description of the IMF
Revenues collected by the central government on behalf of the municipalities are placed in the “Independent Municipal Fund” (IMF) within the Lebanese Central Bank. Proceeds from the IMF to the various municipalities is undertaken with the consultation of the Lebanese State Council, according to standards and criteria set by Decree 1917/79 from the Council of Ministers, specifically upon suggestions from the Ministers of Finance and Interior.
Most of the IMF proceeds are redistributed to municipalities according to standards and criteria set by Decree 1917/1979 as described below and depicted in Figure 2.
A. 25 percent of the stated IMF proceeds are allocated to Municipal Unions (MUs) in the following manner:
25 percent of the total allocated to MUs is given on the basis of or in correlation with population estimates within each union.
75 percent is allocated for specific developmental projects or earmarked.
B. 75 percent of total stated IMF money is allocated to the various Lebanese municipalities according to the following:
70 percent (of total IMF 75%) is given according to the following criteria:
o 60 percent given to all municipalities based on population estimates
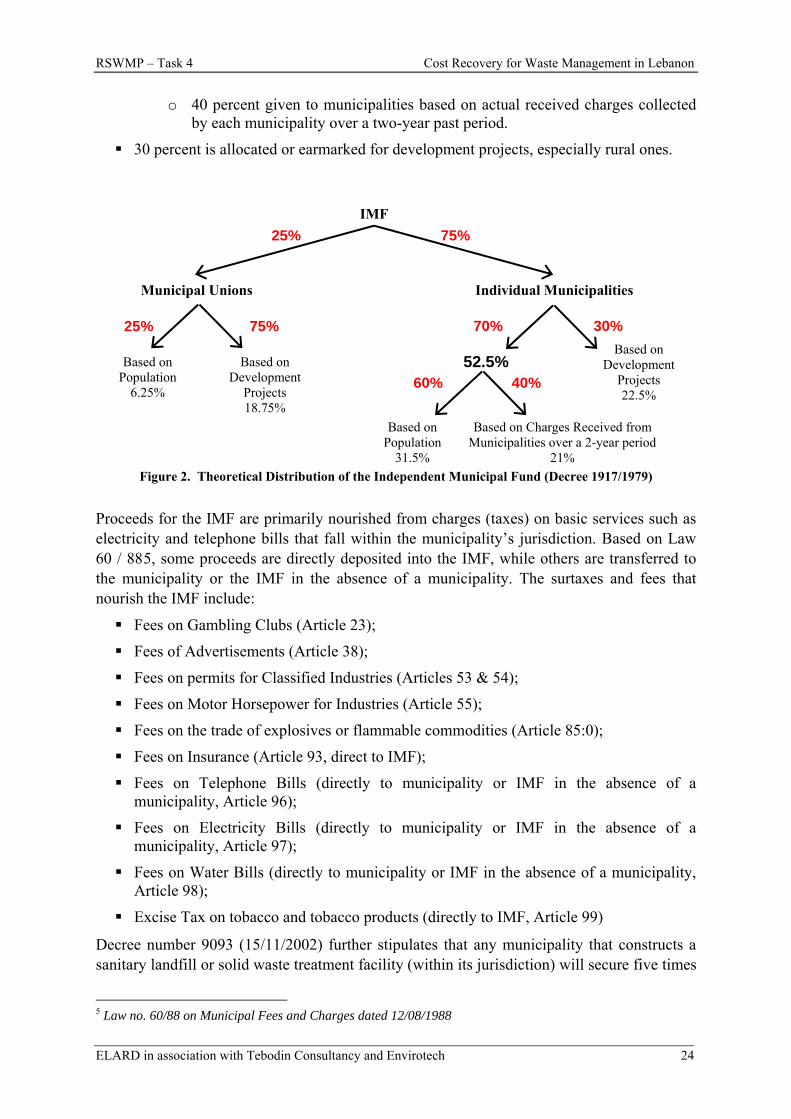
RSWMP – Task 4 Cost Recovery for Waste Management in Lebanon
ELARD in association with Tebodin Consultancy and Envirotech 24
o 40 percent given to municipalities based on actual received charges collected by each municipality over a two-year past period.
30 percent is allocated or earmarked for development projects, especially rural ones.
Figure 2. Theoretical Distribution of the Independent Municipal Fund (Decree 1917/1979)
Proceeds for the IMF are primarily nourished from charges (taxes) on basic services such as electricity and telephone bills that fall within the municipality’s jurisdiction. Based on Law 60 / 885, some proceeds are directly deposited into the IMF, while others are transferred to the municipality or the IMF in the absence of a municipality. The surtaxes and fees that nourish the IMF include:
Fees on Gambling Clubs (Article 23);
Fees of Advertisements (Article 38);
Fees on permits for Classified Industries (Articles 53 & 54);
Fees on Motor Horsepower for Industries (Article 55);
Fees on the trade of explosives or flammable commodities (Article 85:0);
Fees on Insurance (Article 93, direct to IMF);
Fees on Telephone Bills (directly to municipality or IMF in the absence of a municipality, Article 96);
Fees on Electricity Bills (directly to municipality or IMF in the absence of a municipality, Article 97);
Fees on Water Bills (directly to municipality or IMF in the absence of a municipality, Article 98);
Excise Tax on tobacco and tobacco products (directly to IMF, Article 99)
Decree number 9093 (15/11/2002) further stipulates that any municipality that constructs a sanitary landfill or solid waste treatment facility (within its jurisdiction) will secure five times
5 Law no. 60/88 on Municipal Fees and Charges dated 12/08/1988
IMF
Municipal Unions Individual Municipalities
Based on Population
31.5%
Based on Development
Projects 18.75%
Based on Development
Projects 22.5%
52.5% Based on Population
6.25%
Based on Charges Received from Municipalities over a 2-year period
21%
25% 75%
30% 70% 75% 25%
40% 60%
RSWMP – Task 4 Cost Recovery for Waste Management in Lebanon
ELARD in association with Tebodin Consultancy and Envirotech 25
its share from the IMF. Moreover, if any municipality constructs a sanitary landfill or solid waste treatment facility for itself and at least ten other municipalities will get ten times its share from the IMF proceeds. However, the decree is ambiguous in its formulation, and the proof is that so far no municipality was able to benefit from the said incentives.
4.3.2 Status of the IMF
Municipalities and Unions of Municipalities received transfers totaling USD 420 million for the years 1997, 1998, and 1999, or a yearly amount of around $US 140 million (MoE/Ecodit, 2001). Note that the total amount disbursed for municipalities and unions of municipalities from the years 1993 to 1996 was around $US 33 million only.
Table 14. Distribution of the Independent Municipal Fund from 1997 to 2001
Year(s) Decree IMF (Mil $US)
Funds for Municipalities
(Mil $US)
Funds for Unions
(Mil $US)
Civil Defense
(Mil $US)
Reserve (Mil $US)
1997 365/99 126.67 81.33 31.67 4.75 8.92
1998 & 1999 2574/00 266.67 171.73 66.67 10.00 18.27
266.67 171.73 66.67 10.00 18.27
2000 6512/01 66.67 60.17 3.33 3.17
2001 9354/02 133.33 114.00 13.33 6.00
Based on the revenues depicted in Table 14, municipalities received an average of $US 120 million/yr theoretically allocated as described in Figure 2. Funding municipalities sufficiently is of utmost importance in order to stimulate local economy, mitigate and reverse rural-urban migration and is at the heart of good governance. However, in reality the distribution of the IMF as stipulated by Law was not realized. Most of the revenues received by the IMF were used to fund Sukkar group’s waste management operations in the Greater Beirut Area consuming approximately $US 100 million/year.
RSWMP – Task 4 Cost Recovery for Waste Management in Lebanon
ELARD in association with Tebodin Consultancy and Envirotech 26
5 PROPOSED COST RECOVERY SYSTEM Several factors contribute to the success of a cost recovery system, the least of which include user satisfaction, an efficient collection system with high collection ratios, a national WM strategy and plans, and a legal framework to support all the mentioned components.
Regarding user satisfaction, users should be convinced that they are being charged fairly in view of the provided service, and that the collected fees are being spent wisely. Moreover, the users’ expectations of quality of the WM service should also be met in order to attain their approval. User satisfaction could be further enhanced through a system that takes into consideration the socio-economic background of the user and thus the affordability of the service. “Low-income members of society must be protected from paying unaffordable charge rates.” (WB-METAP, Jan. 2004).
Ideally, charge collection systems would be integrated with the existing collection systems of public authorities, thus requiring less investment and administrative costs. Moreover, according to the WB Regional Guidelines for Financing and Cost Recovery for SWM, the collection systems “must be straightforward, simple to implement and enforce, and should lead to high fee collection ratios,” (WB-METAP, Jan. 2004).
Ideally, ISWM principles, such as the polluter pays principle and the user pays principle should be applied in the cost recovery scheme for WM. That is, those who benefit directly from a SWM service should pay for this service. According to Merhebi F. and Hickman D. “Application of the "polluter pay" principle … would result in the introduction of new stakeholders … and the injection of new funds on a fair and equitable basis that could be applied to waste management financing and cost recovery” (WB-METAP, Feb. 2004). An advantage to applying these principles to the financing schemes is that they influence waste generation on the long term and encourage reduction and prevention practices.
However, when it comes to adopting such principles as the user pays, some difficulties arise. At the end of the day, waste management services fall within the box of “public services” and not private goods. Users can not be disconnected from the service without risking public health hazards. Therefore, integrating these principles within the cost recovery system is challenging.
Finally, the success of a cost recovery system is enhanced by the presence of waste management strategies and plans, as well as a legal framework for SWM setting the provisions for institutional responsibilities as well as financing and cost recovery mechanisms. A solid legal framework that organizes the sector would instigate a robust cost recovery system that can be enforced by the responsible authorities.
Section 3 estimated the costs of adopting an ISWM network in Lebanon, projected these costs to 2014 and then analyzed the affordability of these costs by the Lebanese public. An assessment of the existing funding sources for SWM in Lebanon followed in Section 4. This section, Section 5, presents and evaluates the recommended sources for the recovery of the recurrent costs for SWM in Lebanon based on the on-the-job training exercise conducted with the MoF. Section 5.1 lists recommendations specific to the case of Lebanon, as

RSWMP – Task 4 Cost Recovery for Waste Management in Lebanon
ELARD in association with Tebodin Consultancy and Envirotech 27
determined in the on-the-job training exercise with the MoF. Each of the three sections that follow introduces one suggested source for cost recovery: a 5% increase in excise taxes (Section 5.2), a 1.5% increase in municipal fees on the rental value of property (Section 5.3), and a return of 5% municipal charge on electricity, telephone and water consumption bills (Section 5.4).
5.1 SPECIFIC RECOMMENDATIONS
In addition to the cost recovery sources proposed in the subsequent sections, this section recommends measures that would boost the efficiency of charge collection systems specific to the Lebanese context.
A. Acknowledging the Socio-Economic Situation in Lebanon
The foremost recommendation of the MoF regarding a cost recovery system for SWM in Lebanon was to allow for the austere socio-economic conditions prevalent in the country. Accordingly, the MoF advised against introducing any novel taxes or fees which would be rejected by both the Lebanese Parliament as well as the general public. Hence, all suggestions for cost recovery relied on modifying existing taxes or charges or reinstating taxes or charges that had been withdrawn.
B. Improving the Tax Collection System
Although revenues from property taxation in Lebanon amounted to $US 266.7 million in 2003 and an estimated $US 233.3 million in 2004, it is acknowledged that the collection rate of property taxes in Lebanon is deficient. The country’s existing charge and tax systems are severely limited by low collection rates, which have a profound impact on the MSW sector (The WB-METAP, Feb. 2004). For example, the collection rates presented in Table 12 indicate an average collection rate of 44.47% for select municipalities in the Caza of Jbeil. Improving collection rates to ensure payment by all households will increase revenues from property taxes considerably hence increasing funds for SWM services.
In fact, the Lebanon Relief and Redevelopment Project6, which assists selected municipalities in modernizing their financial and administrative procedures, has demonstrated the effectiveness of adopting data management systems on dramatically increasing municipal revenue from property taxes. To illustrate, assistance efforts in the Municipality of Beirut increased the total revenue collected from the charge on the rental value from $26.0 million in 2001 to $31.1 million in 2002 to $38.6 million in 2003 (USAID, 2004).
The project also aims at enhancing municipal revenue through identifying neglected revenue sectors. In fact, “an important revenue area that the Municipality of Beirut has been unable to fully collect is that of taxes and fees due from licenses for billboards and signs. It is estimated that approximately 90% of the 70,000 - 80,000 signs and billboards in Beirut are not licensed representing up to $1.25 million annually in lost income,” (USAID, 2004).
6Lebanon Relief and Redevelopment Project: Government Institutions Strengthening Component – Local Government and Parliament Project - Funded by the United States Agency for International Development (USAID) and executed by the University at Albany, State University of New York, Center for Legislative Development.
RSWMP – Task 4 Cost Recovery for Waste Management in Lebanon
ELARD in association with Tebodin Consultancy and Envirotech 28
C. Non-compliance Fines as a means of Enforcement
Even though non-compliance fines should not be regarded as a source for cost recovery, the Lebanese government must begin to enforce its laws on public cleanliness. The fines mandated in the existing laws on public cleanliness as well as the proposed draft Law on Integrated Waste Management, prepared as part of the RSWMP, would serve as an additional source of revenue which would gradually diminish with the adaptation of behavior.
D. Adapting to the Existing Limitations of the System
The recovery of the recurrent cost of SWM had to adapt to the rigid limitations of the centralized financial structure of the country. In Lebanon, municipalities do not posses the legislative power to issue charges or taxes. In fact, taxes or charges have to be levied at a national level and are specified through law ratified by the Lebanese Parliament. Moreover, Lebanese legislation does not allow for earmarking taxes or fees for specific purposes. For example, revenue from municipal charges on the rental value of property can be used to fund any municipal expense. Hence, increasing the charge will not necessarily bring about an increase in funds for SWM, since the law does not allow for any such specification.
5.2 EXCISE TAXES
5.2.1 Current Situation
Excise Taxation, or consumption tax, is indirect taxation. Therefore, by nature it is independent of the consumer’s circumstances and directly linked to his / her behavior. Although local legislation does not specify these taxes to be used directly for environmental purposes, they, by nature, play an important role not only as a means for collecting revenue but also as an instrument to influence consumer behavior and, increasingly, to protect the environment. When substantial, as is the case with the approximately 100% total taxation of imported fuels in Lebanon7, excise taxes can serve as economic instruments giving industries and households valid incentives to adopt environmentally-friendly behavior and to develop new, cleaner technologies.
Moreover, excise taxes allow the consumer to be charged the full social and environmental cost of a commodity. Thereby these taxes serve as effective means to implement the “polluter pays principle” as is called for in Law 444/20028.
Excise taxation in Europe9, for instance is imposed on mineral oils, alcohol and alcoholic beverages, manufactured tobacco. In Lebanon, existing tax regulations allow for excise duties on alcoholic beverages10, vehicles, fuel, tobacco and other luxury goods.
7 Including custom duties, excise taxation and Value Added Taxation, Ministry of Finance, 2004 8 Law 444 on the Protection of the Environment, Article 4 (c), 08/08/2002 9 European Union, Council Directive 92/12/EEC of 25 February 1992 - On the general arrangements for products subject to excise duty and on the holding, movement and monitoring of such products. 10 Law dated 07/06/1967
RSWMP – Task 4 Cost Recovery for Waste Management in Lebanon
ELARD in association with Tebodin Consultancy and Envirotech 29
5.2.2 Proposed Supplemental Excise Tax on Specific Commodities
With Lebanon’s aspirations to join the World Trade Organization11 (WTO) and its Euro-Mediterranean partnership and Arab Free Trade Agreements, it is only a matter of time before custom duties and tariffs are gradually dissolved. Therefore, the 5% customs duty (before VAT) that is imposed on an overwhelming majority of imports is due to be rescinded.
As such, while keeping the environmental benefits of excise taxes in mind, the opportunity arises to introduce a supplemental 5% excise tax for certain commodities or increase the excise tax by 5% for commodities already subject to excise taxation.
5.2.2.1 Selection Criteria
Commodities subject to the supplemental 5% excise tax were selected based on the following criteria:
A. Hazardous material based on the National List of Hazardous Material12 - including items such as pesticides, hazardous chemicals, etc.
B. Commodities whose use needs to be restricted for environmental purposes - These items would either produce hazardous emissions upon use (ex: tobacco products, vehicles, fuel, etc.), or impact the environment negatively when used excessively (ex: fertilizers, )
C. Commodities that when discarded will require special waste management considerations: These items incur additional treatment and disposal costs (Ex: tires, electric and electronic equipment, batteries, vehicles, etc)
5.2.2.2 Commodities Subject to Excise Taxation
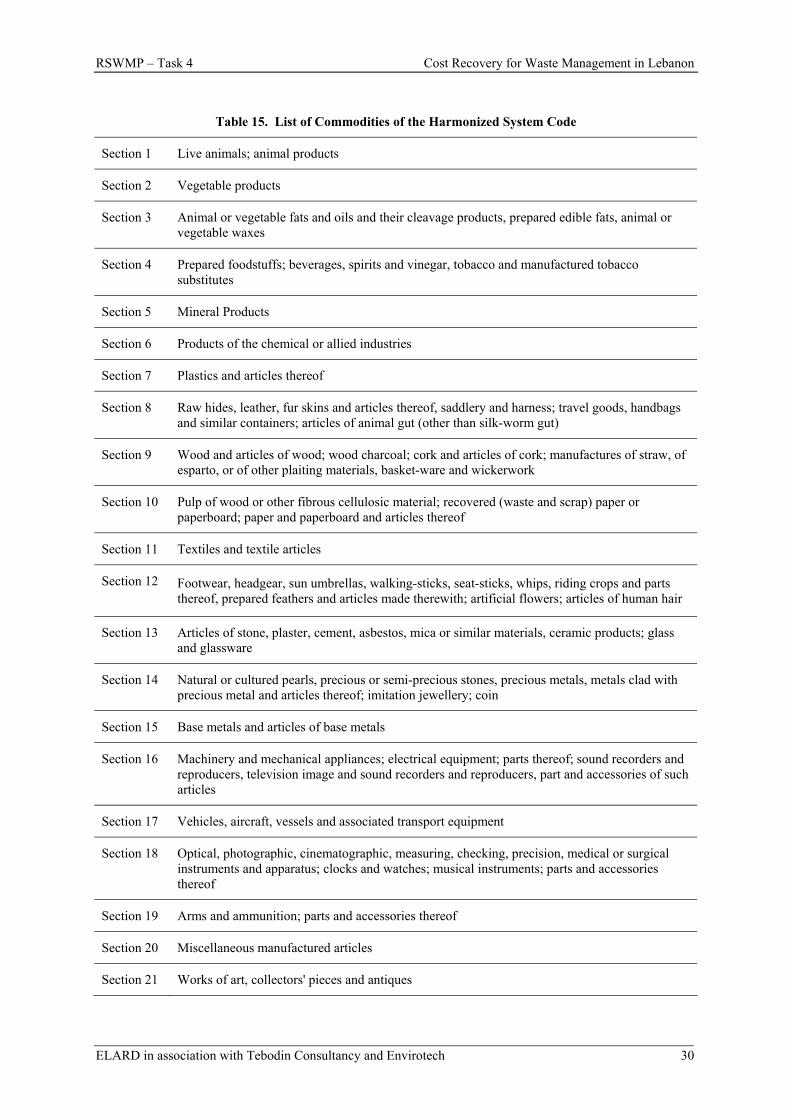
By applying the above criteria to a detailed review of the standard Harmonized System Code13 (HS Code) for imports (Table 15), the commodities proposed to be subjected to new or additional excise taxation were determined. These items are listed in Table 16. Any local production of these items will also be subject to the excise tax.
11 Lebanon applied for membership in the WTO and was granted observer status in April 1999 12 This list is currently being updated by the Ministry of Environment based on Law 387/94 on the Ratification of the Basel Convention (04/11/1994), and Law 64/88 on Protection of the Environment from Hazardous Wastes and Hazardous Materials (12/08/1988) 13 The Harmonized Tariff System Classification is an international standardized numerical method of classifying traded products. The identifying number assigned to each product is used by Customs officials around the world to determine the duties, taxes, and regulations that apply to the product.
RSWMP – Task 4 Cost Recovery for Waste Management in Lebanon
ELARD in association with Tebodin Consultancy and Envirotech 30
Table 15. List of Commodities of the Harmonized System Code
Section 1 Live animals; animal products
Section 2 Vegetable products
Section 3 Animal or vegetable fats and oils and their cleavage products, prepared edible fats, animal or vegetable waxes
Section 4 Prepared foodstuffs; beverages, spirits and vinegar, tobacco and manufactured tobacco substitutes
Section 5 Mineral Products
Section 6 Products of the chemical or allied industries
Section 7 Plastics and articles thereof
Section 8 Raw hides, leather, fur skins and articles thereof, saddlery and harness; travel goods, handbags and similar containers; articles of animal gut (other than silk-worm gut)
Section 9 Wood and articles of wood; wood charcoal; cork and articles of cork; manufactures of straw, of esparto, or of other plaiting materials, basket-ware and wickerwork
Section 10 Pulp of wood or other fibrous cellulosic material; recovered (waste and scrap) paper or paperboard; paper and paperboard and articles thereof
Section 11 Textiles and textile articles
Section 12 Footwear, headgear, sun umbrellas, walking-sticks, seat-sticks, whips, riding crops and parts thereof, prepared feathers and articles made therewith; artificial flowers; articles of human hair
Section 13 Articles of stone, plaster, cement, asbestos, mica or similar materials, ceramic products; glass and glassware
Section 14 Natural or cultured pearls, precious or semi-precious stones, precious metals, metals clad with precious metal and articles thereof; imitation jewellery; coin
Section 15 Base metals and articles of base metals
Section 16 Machinery and mechanical appliances; electrical equipment; parts thereof; sound recorders and reproducers, television image and sound recorders and reproducers, part and accessories of such articles
Section 17 Vehicles, aircraft, vessels and associated transport equipment
Section 18 Optical, photographic, cinematographic, measuring, checking, precision, medical or surgical instruments and apparatus; clocks and watches; musical instruments; parts and accessories thereof
Section 19 Arms and ammunition; parts and accessories thereof
Section 20 Miscellaneous manufactured articles
Section 21 Works of art, collectors' pieces and antiques

RSWMP – Task 4 Cost Recovery for Waste Management in Lebanon
ELARD in association with Tebodin Consultancy and Envirotech 31
Table 16. Commodities Subject to Excise Taxation Based on HS Code
Chapter 24 Tobacco and manufactured tobacco subsidies
Chapter 27 Mineral fuels, mineral oils and products of their distillation; bituminous substances; mineral waxes
Chapter 29 Organic chemicals
Chapter 30 Pharmaceutical products
Chapter 31 Fertilizers
Chapter 32 Tanning or dyeing extracts; tannins and their derivatives; dyes, pigments and other coloring matter; paints and varnishes; putty and other mastics; inks
Chapter 34 Soap, organic surface-active agents, washing preparations, lubricating preparations, artificial waxes, prepared waxes, polishing or scouring preparations, candles and similar articles, modeling pastes, "dental waxes" and dental preparations with a basis
Chapter 35 Albuminoidal substances; modified starched; glues; enzymes
Chapter 36 Explosives, pyrotech products; matches; pyrophoric alloys; certain combustible preparations
Chapter 37 Photographic or cinematographic goods
Chapter 38 Miscellaneous chemical products
Chapter 40 Rubber and articles thereof
40.11 - New pneumatic tires, of rubber.
Chapter 68 Articles of stone, plaster, cement, asbestos, mica or similar materials.
68.11 - Articles of asbestos-cement, of cellulose fiber-cement or the like.
68.12 - Fabricated asbestos fibers; mixtures with a basis of asbestos or with a basis of asbestos and magnesium carbonate; articles of such mixtures or of asbestos (for example, thread, woven fabric, clothing, headgear, footwear, gaskets), whether or not reinforced, other than goods of heading No. 68.11 or 68.13.
68.13 - Friction material and articles thereof (for example, sheets, rolls, strips, segments, discs, washers, pads), not mounted, for brakes, for clutches or the like, with a basis of asbestos, of other mineral substances or of cellulose, whether or not combined with textile or other materials.
68.14 - Worked mica and articles of mica, including agglomerated or reconstituted mica, whether or not on a support of paper, paperboard or other materials.
Chapter 84 Nuclear reactors, boilers, machinery and mechanical appliances; parts thereof.
Chapter 85 Electrical machinery and equipment and parts thereof; sound recorders and reproducers, television image and sound recorders and reproducers, and parts and accessories of such articles.
Chapter 87 Vehicles other than railway or tramway rolling-stock, and parts and accessories thereof.
Chapter 88 Aircraft, spacecraft, and parts thereof.
Chapter 89 Ships, boats and floating structures.
RSWMP – Task 4 Cost Recovery for Waste Management in Lebanon
ELARD in association with Tebodin Consultancy and Envirotech 32
5.2.2.3 Method of Collection
Excise taxes are charged on the consumer upon the purchase of the products listed in Table 16. Proceeds from these taxes would be collected by the customs authority for imported products and the other tax collection means of the central government for local production. The proceeds would then be deposited in the National Treasury and assigned to the Independent Municipal Fund in order to be redistributed to the municipalities as described in Section 4.3.
5.2.3 Estimated Revenue from the Proposed Excise Tax
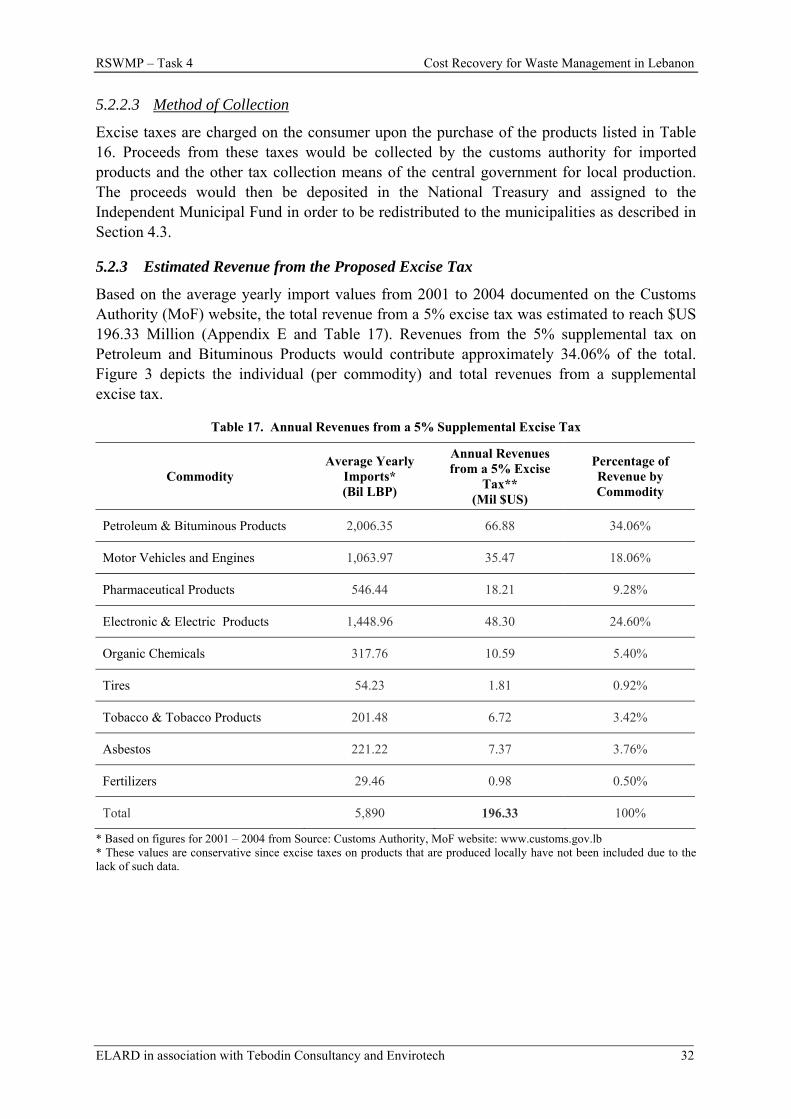
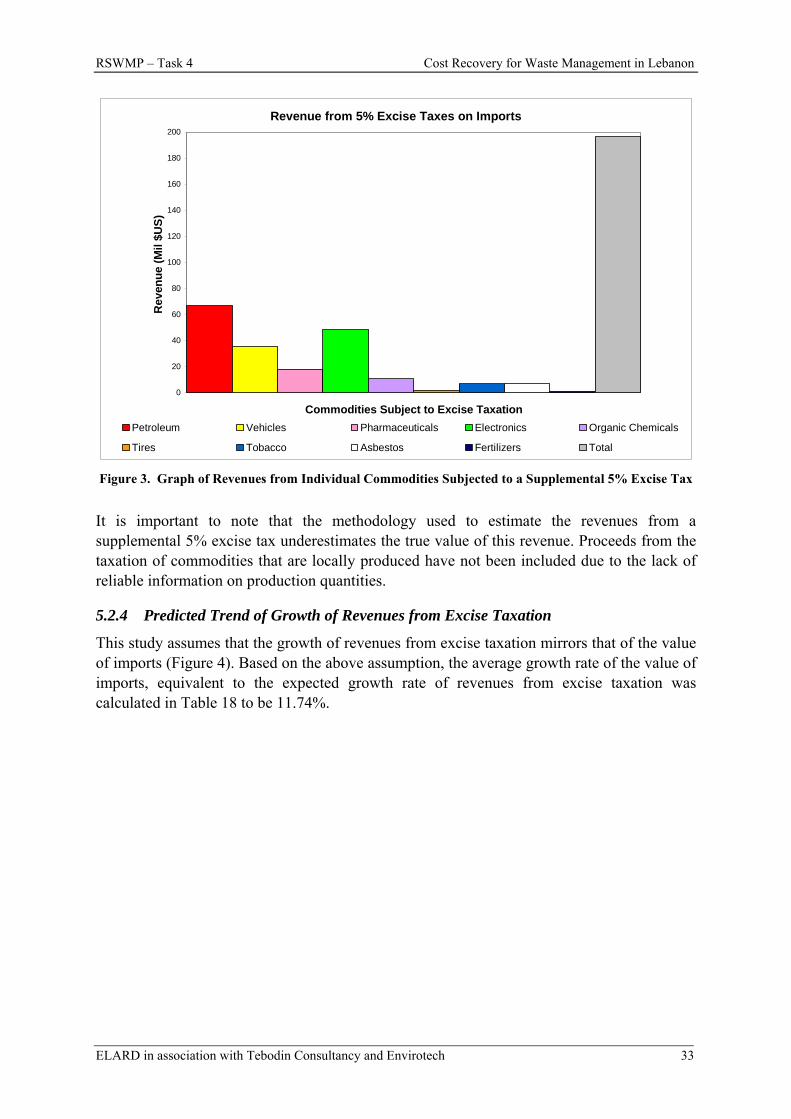
Based on the average yearly import values from 2001 to 2004 documented on the Customs Authority (MoF) website, the total revenue from a 5% excise tax was estimated to reach $US 196.33 Million (Appendix E and Table 17). Revenues from the 5% supplemental tax on Petroleum and Bituminous Products would contribute approximately 34.06% of the total. Figure 3 depicts the individual (per commodity) and total revenues from a supplemental excise tax.
Table 17. Annual Revenues from a 5% Supplemental Excise Tax
Commodity Average Yearly
Imports* (Bil LBP)
Annual Revenues from a 5% Excise
Tax** (Mil $US)
Percentage of Revenue by Commodity
Petroleum & Bituminous Products 2,006.35 66.88 34.06%
Motor Vehicles and Engines 1,063.97 35.47 18.06%
Pharmaceutical Products 546.44 18.21 9.28%
Electronic & Electric Products 1,448.96 48.30 24.60%
Organic Chemicals 317.76 10.59 5.40%
Tires 54.23 1.81 0.92%
Tobacco & Tobacco Products 201.48 6.72 3.42%
Asbestos 221.22 7.37 3.76%
Fertilizers 29.46 0.98 0.50%
Total 5,890 196.33 100%
* Based on figures for 2001 – 2004 from Source: Customs Authority, MoF website: www.customs.gov.lb * These values are conservative since excise taxes on products that are produced locally have not been included due to the lack of such data.
RSWMP – Task 4 Cost Recovery for Waste Management in Lebanon
ELARD in association with Tebodin Consultancy and Envirotech 33
Revenue from 5% Excise Taxes on Imports
0
20
40
60
80
100
120
140
160
180
200
Commodities Subject to Excise Taxation
Rev
enue
(Mil
$US)
Petroleum Vehicles Pharmaceuticals Electronics Organic Chemicals
Tires Tobacco Asbestos Fertilizers Total
Figure 3. Graph of Revenues from Individual Commodities Subjected to a Supplemental 5% Excise Tax
It is important to note that the methodology used to estimate the revenues from a supplemental 5% excise tax underestimates the true value of this revenue. Proceeds from the taxation of commodities that are locally produced have not been included due to the lack of reliable information on production quantities.
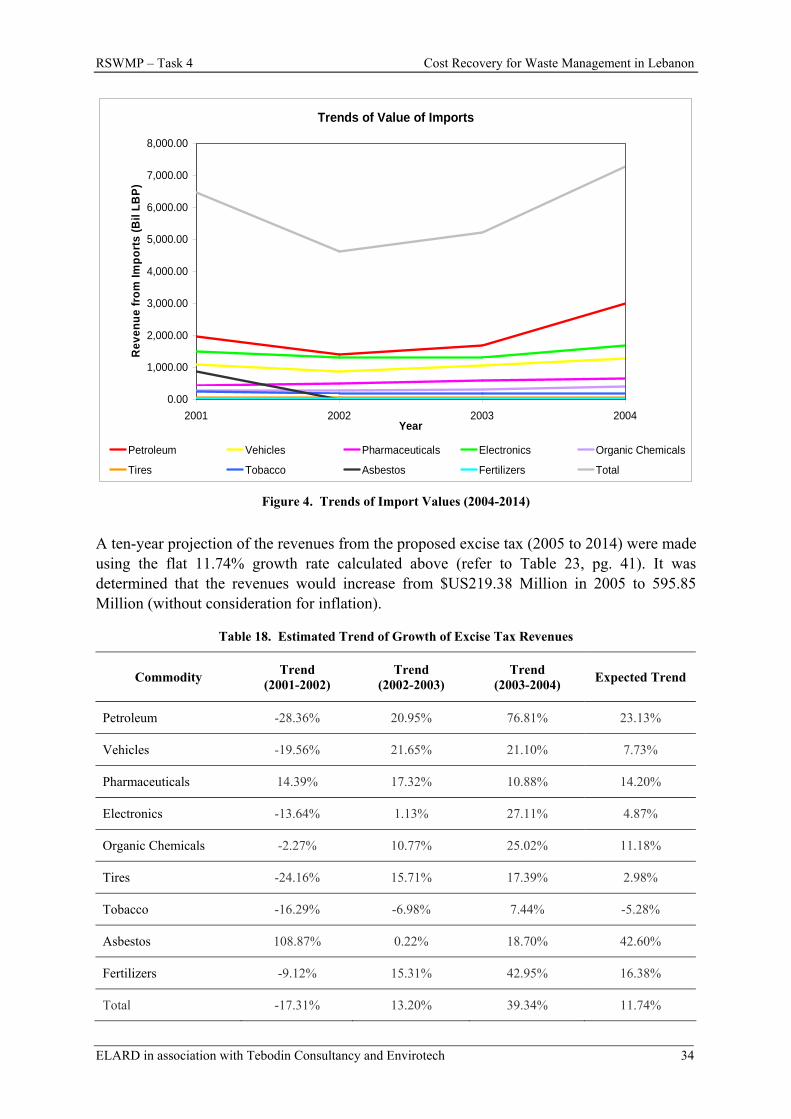
5.2.4 Predicted Trend of Growth of Revenues from Excise Taxation
This study assumes that the growth of revenues from excise taxation mirrors that of the value of imports (Figure 4). Based on the above assumption, the average growth rate of the value of imports, equivalent to the expected growth rate of revenues from excise taxation was calculated in Table 18 to be 11.74%.
RSWMP – Task 4 Cost Recovery for Waste Management in Lebanon
ELARD in association with Tebodin Consultancy and Envirotech 34
Trends of Value of Imports
0.00
1,000.00
2,000.00
3,000.00
4,000.00
5,000.00
6,000.00
7,000.00
8,000.00
2001 2002 2003 2004Year
Rev
enue
from
Impo
rts
(Bil
LBP)
Petroleum Vehicles Pharmaceuticals Electronics Organic Chemicals
Tires Tobacco Asbestos Fertilizers Total
Figure 4. Trends of Import Values (2004-2014)
A ten-year projection of the revenues from the proposed excise tax (2005 to 2014) were made using the flat 11.74% growth rate calculated above (refer to Table 23, pg. 41). It was determined that the revenues would increase from $US219.38 Million in 2005 to 595.85 Million (without consideration for inflation).
Table 18. Estimated Trend of Growth of Excise Tax Revenues
Commodity Trend (2001-2002)
Trend (2002-2003)
Trend (2003-2004) Expected Trend
Petroleum -28.36% 20.95% 76.81% 23.13%
Vehicles -19.56% 21.65% 21.10% 7.73%
Pharmaceuticals 14.39% 17.32% 10.88% 14.20%
Electronics -13.64% 1.13% 27.11% 4.87%
Organic Chemicals -2.27% 10.77% 25.02% 11.18%
Tires -24.16% 15.71% 17.39% 2.98%
Tobacco -16.29% -6.98% 7.44% -5.28%
Asbestos 108.87% 0.22% 18.70% 42.60%
Fertilizers -9.12% 15.31% 42.95% 16.38%
Total -17.31% 13.20% 39.34% 11.74%
RSWMP – Task 4 Cost Recovery for Waste Management in Lebanon
ELARD in association with Tebodin Consultancy and Envirotech 35
5.3 MUNICIPAL CHARGE ON RENTAL VALUE OF PROPERTY
5.3.1 Current Situation
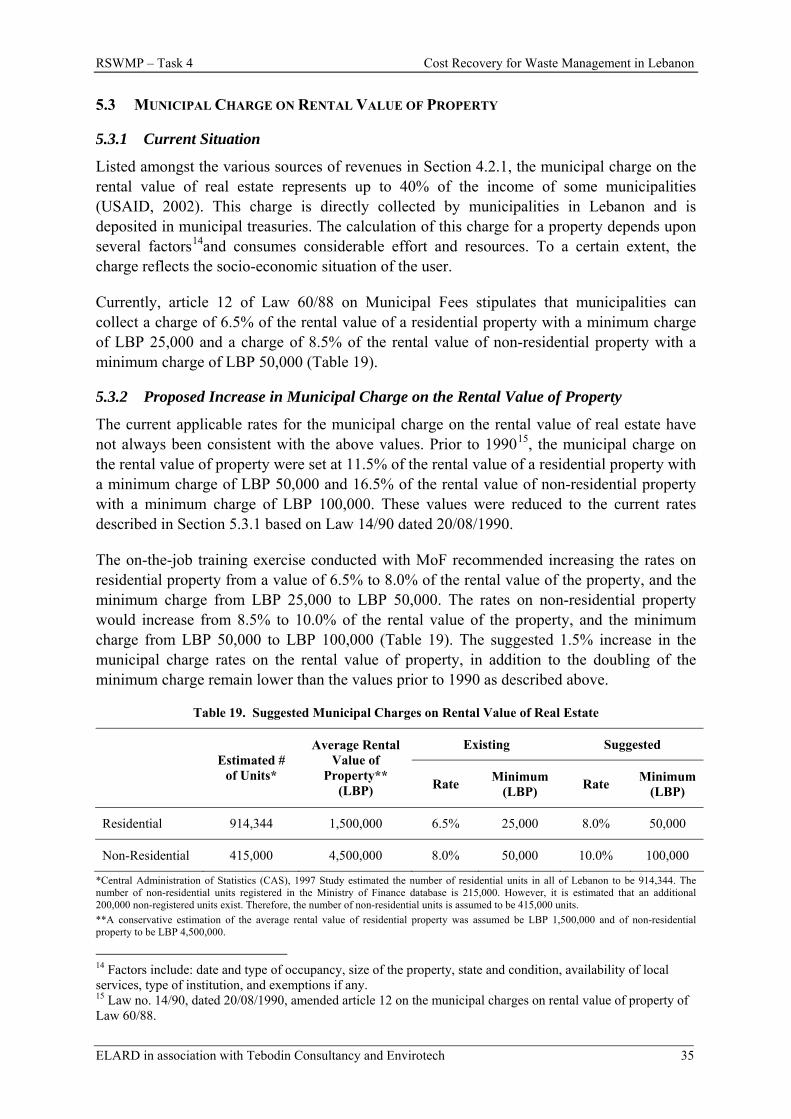
Listed amongst the various sources of revenues in Section 4.2.1, the municipal charge on the rental value of real estate represents up to 40% of the income of some municipalities (USAID, 2002). This charge is directly collected by municipalities in Lebanon and is deposited in municipal treasuries. The calculation of this charge for a property depends upon several factors14and consumes considerable effort and resources. To a certain extent, the charge reflects the socio-economic situation of the user.
Currently, article 12 of Law 60/88 on Municipal Fees stipulates that municipalities can collect a charge of 6.5% of the rental value of a residential property with a minimum charge of LBP 25,000 and a charge of 8.5% of the rental value of non-residential property with a minimum charge of LBP 50,000 (Table 19).
5.3.2 Proposed Increase in Municipal Charge on the Rental Value of Property
The current applicable rates for the municipal charge on the rental value of real estate have not always been consistent with the above values. Prior to 199015, the municipal charge on the rental value of property were set at 11.5% of the rental value of a residential property with a minimum charge of LBP 50,000 and 16.5% of the rental value of non-residential property with a minimum charge of LBP 100,000. These values were reduced to the current rates described in Section 5.3.1 based on Law 14/90 dated 20/08/1990.
The on-the-job training exercise conducted with MoF recommended increasing the rates on residential property from a value of 6.5% to 8.0% of the rental value of the property, and the minimum charge from LBP 25,000 to LBP 50,000. The rates on non-residential property would increase from 8.5% to 10.0% of the rental value of the property, and the minimum charge from LBP 50,000 to LBP 100,000 (Table 19). The suggested 1.5% increase in the municipal charge rates on the rental value of property, in addition to the doubling of the minimum charge remain lower than the values prior to 1990 as described above.
Table 19. Suggested Municipal Charges on Rental Value of Real Estate
Existing Suggested
Estimated # of Units*
Average Rental Value of
Property** (LBP) Rate Minimum
(LBP) Rate Minimum (LBP)
Residential 914,344 1,500,000 6.5% 25,000 8.0% 50,000
Non-Residential 415,000 4,500,000 8.0% 50,000 10.0% 100,000
*Central Administration of Statistics (CAS), 1997 Study estimated the number of residential units in all of Lebanon to be 914,344. The number of non-residential units registered in the Ministry of Finance database is 215,000. However, it is estimated that an additional 200,000 non-registered units exist. Therefore, the number of non-residential units is assumed to be 415,000 units. **A conservative estimation of the average rental value of residential property was assumed be LBP 1,500,000 and of non-residential property to be LBP 4,500,000.
14 Factors include: date and type of occupancy, size of the property, state and condition, availability of local services, type of institution, and exemptions if any. 15 Law no. 14/90, dated 20/08/1990, amended article 12 on the municipal charges on rental value of property of Law 60/88.
RSWMP – Task 4 Cost Recovery for Waste Management in Lebanon
ELARD in association with Tebodin Consultancy and Envirotech 36
5.3.3 Estimated Revenue from the Suggested Increase in the Municipal Taxes on Rental Value of Property
In the calculation of the expected revenue from the proposed municipal charge on the rental value of property, the following assumptions were made (Table 19):
Number of Residential Units in Lebanon: 914,344 based on the 1997 consensus of the Central Administration for Statistics
Number of Non-Residential Units in Lebanon: 415,000. The number of non-residential units registered in the MoF database is 215,000. However, it is estimated that an additional 200,000 non-registered units exist.
Average Rental Value of Residential Property: LBP 1,500,000/yr (conservative estimate).
Average Rental Value of Non-Residential Property: LBP 4,500,000/yr (conservative estimate).
Based on the above assumptions, the revenue from the increase in municipal charge on rental value of property was calculated as follows:
Increase in Estimated Revenue = # of Units * Increase in Rate (1.5%)* Average Rental Value of Property
Increase in Minimum Revenue = # of Units * Increase in Minimum Charge
The additional revenue that would result from an increase in municipal charges on the rental value of residential property was estimated to range from $US 15.24 - 13.72 Million, and that of non-residential property was estimated to range from $US 13.83 - 24.90 Million. The total additional revenue from the suggested increase in municipal charge, which can be dedicated to support SWM costs, ranges from $US 29.07 – 38.62 Million.
Table 20. Estimated Revenues from Municipal Charges on the Rental Value of Property
Estimated Revenue from the Increase in Municipal Charge on Rental Value of Property3
Average1 (Mil $US) Minimum2 (Mil $US)
Residential Units 13.72 15.24
Non-Residential Units 24.90 13.83
Total 38.62 29.07 1Average revenue values were calculated based on the following formula: Avrg Revenue= # of units * Rate * avrg rental value of property 2Minimum revenue values were calculated based on the equation: Min Revenue= # of units * minimum charge 3 Difference of Existing Revenue and Revenues based on the suggested rates.
5.3.4 Predicted Trend of Growth from the Suggested Increase in the Municipal Charges on Rental Value of Property
Assuming municipal charge collection rates improve at a flat rate of 2% starting from 2005 to 2014, the additional revenue from the suggested increase in municipal charges on rental value
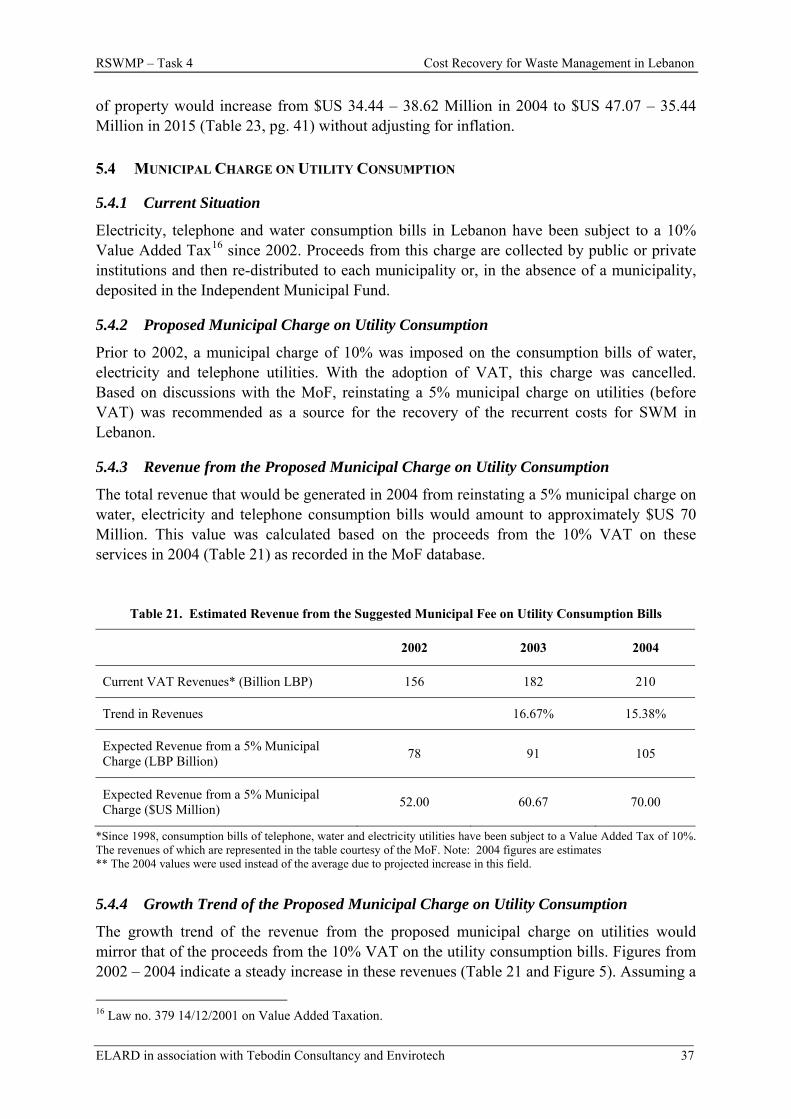
RSWMP – Task 4 Cost Recovery for Waste Management in Lebanon
ELARD in association with Tebodin Consultancy and Envirotech 37
of property would increase from $US 34.44 – 38.62 Million in 2004 to $US 47.07 – 35.44 Million in 2015 (Table 23, pg. 41) without adjusting for inflation.
5.4 MUNICIPAL CHARGE ON UTILITY CONSUMPTION
5.4.1 Current Situation
Electricity, telephone and water consumption bills in Lebanon have been subject to a 10% Value Added Tax16 since 2002. Proceeds from this charge are collected by public or private institutions and then re-distributed to each municipality or, in the absence of a municipality, deposited in the Independent Municipal Fund.
5.4.2 Proposed Municipal Charge on Utility Consumption
Prior to 2002, a municipal charge of 10% was imposed on the consumption bills of water, electricity and telephone utilities. With the adoption of VAT, this charge was cancelled. Based on discussions with the MoF, reinstating a 5% municipal charge on utilities (before VAT) was recommended as a source for the recovery of the recurrent costs for SWM in Lebanon.
5.4.3 Revenue from the Proposed Municipal Charge on Utility Consumption
The total revenue that would be generated in 2004 from reinstating a 5% municipal charge on water, electricity and telephone consumption bills would amount to approximately $US 70 Million. This value was calculated based on the proceeds from the 10% VAT on these services in 2004 (Table 21) as recorded in the MoF database.
Table 21. Estimated Revenue from the Suggested Municipal Fee on Utility Consumption Bills
2002 2003 2004
Current VAT Revenues* (Billion LBP) 156 182 210
Trend in Revenues 16.67% 15.38%
Expected Revenue from a 5% Municipal Charge (LBP Billion) 78 91 105
Expected Revenue from a 5% Municipal Charge ($US Million) 52.00 60.67 70.00
*Since 1998, consumption bills of telephone, water and electricity utilities have been subject to a Value Added Tax of 10%. The revenues of which are represented in the table courtesy of the MoF. Note: 2004 figures are estimates ** The 2004 values were used instead of the average due to projected increase in this field.
5.4.4 Growth Trend of the Proposed Municipal Charge on Utility Consumption
The growth trend of the revenue from the proposed municipal charge on utilities would mirror that of the proceeds from the 10% VAT on the utility consumption bills. Figures from 2002 – 2004 indicate a steady increase in these revenues (Table 21 and Figure 5). Assuming a
16 Law no. 379 14/12/2001 on Value Added Taxation.
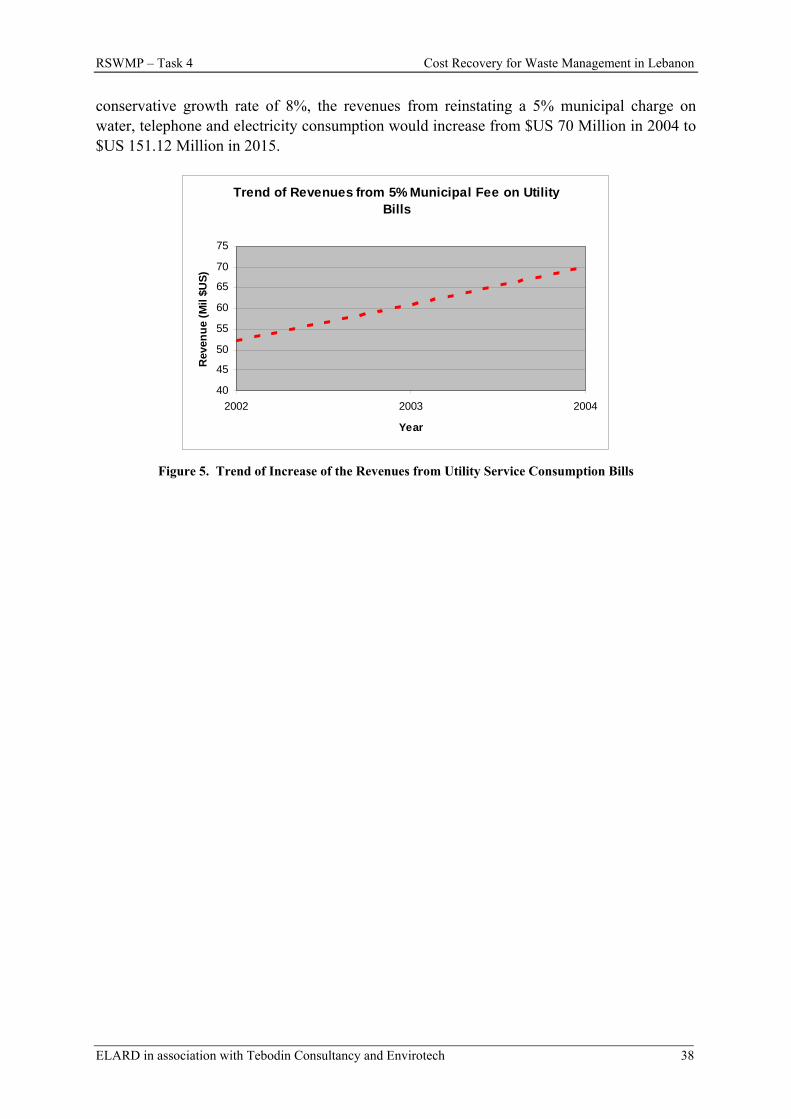
RSWMP – Task 4 Cost Recovery for Waste Management in Lebanon
ELARD in association with Tebodin Consultancy and Envirotech 38
conservative growth rate of 8%, the revenues from reinstating a 5% municipal charge on water, telephone and electricity consumption would increase from $US 70 Million in 2004 to $US 151.12 Million in 2015.
Trend of Revenues from 5% Municipal Fee on Utility Bills
40
45
50
55
60
65
70
75
2002 2003 2004
Year
Rev
enue
(Mil
$US)
Figure 5. Trend of Increase of the Revenues from Utility Service Consumption Bills
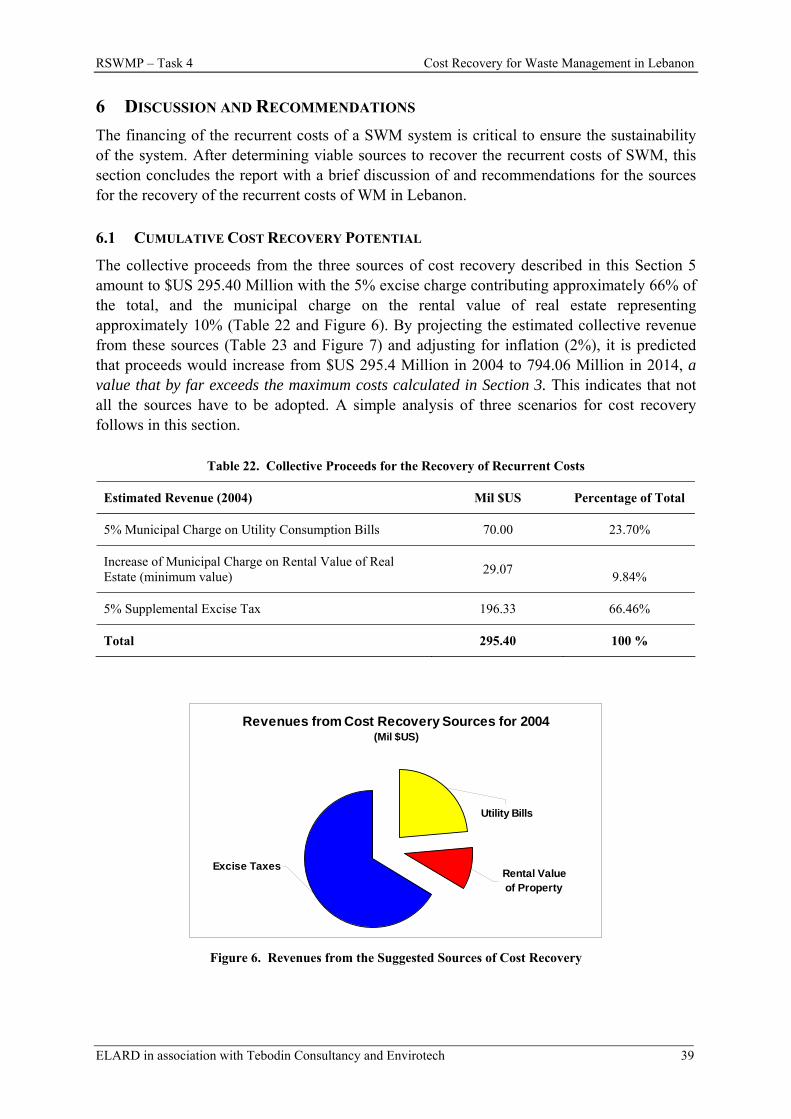
RSWMP – Task 4 Cost Recovery for Waste Management in Lebanon
ELARD in association with Tebodin Consultancy and Envirotech 39
6 DISCUSSION AND RECOMMENDATIONS The financing of the recurrent costs of a SWM system is critical to ensure the sustainability of the system. After determining viable sources to recover the recurrent costs of SWM, this section concludes the report with a brief discussion of and recommendations for the sources for the recovery of the recurrent costs of WM in Lebanon.
6.1 CUMULATIVE COST RECOVERY POTENTIAL
The collective proceeds from the three sources of cost recovery described in this Section 5 amount to $US 295.40 Million with the 5% excise charge contributing approximately 66% of the total, and the municipal charge on the rental value of real estate representing approximately 10% (Table 22 and Figure 6). By projecting the estimated collective revenue from these sources (Table 23 and Figure 7) and adjusting for inflation (2%), it is predicted that proceeds would increase from $US 295.4 Million in 2004 to 794.06 Million in 2014, a value that by far exceeds the maximum costs calculated in Section 3. This indicates that not all the sources have to be adopted. A simple analysis of three scenarios for cost recovery follows in this section.
Table 22. Collective Proceeds for the Recovery of Recurrent Costs
Estimated Revenue (2004) Mil $US Percentage of Total
5% Municipal Charge on Utility Consumption Bills 70.00 23.70%
Increase of Municipal Charge on Rental Value of Real Estate (minimum value) 29.07 9.84%
5% Supplemental Excise Tax 196.33 66.46%
Total 295.40 100 %
Revenues from Cost Recovery Sources for 2004 (Mil $US)
Utility Bills
Rental Value of Property
Excise Taxes
Figure 6. Revenues from the Suggested Sources of Cost Recovery
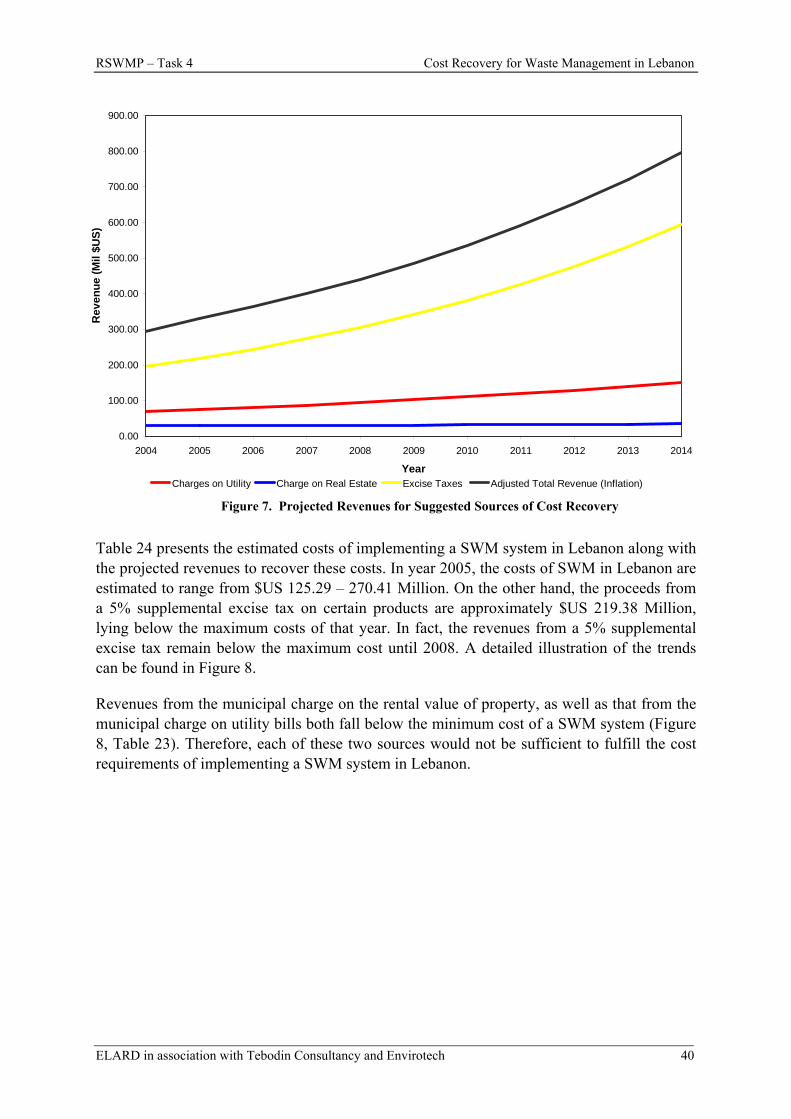
RSWMP – Task 4 Cost Recovery for Waste Management in Lebanon
ELARD in association with Tebodin Consultancy and Envirotech 40
Figure 7. Projected Revenues for Suggested Sources of Cost Recovery
Table 24 presents the estimated costs of implementing a SWM system in Lebanon along with the projected revenues to recover these costs. In year 2005, the costs of SWM in Lebanon are estimated to range from $US 125.29 – 270.41 Million. On the other hand, the proceeds from a 5% supplemental excise tax on certain products are approximately $US 219.38 Million, lying below the maximum costs of that year. In fact, the revenues from a 5% supplemental excise tax remain below the maximum cost until 2008. A detailed illustration of the trends can be found in Figure 8.
Revenues from the municipal charge on the rental value of property, as well as that from the municipal charge on utility bills both fall below the minimum cost of a SWM system (Figure 8, Table 23). Therefore, each of these two sources would not be sufficient to fulfill the cost requirements of implementing a SWM system in Lebanon.
0.00
100.00
200.00
300.00
400.00
500.00
600.00
700.00
800.00
900.00
2004 2005 2006 2007 2008 2009 2010 2011 2012 2013 2014
Year
Rev
enue
(Mil
$US)
Charges on Utility Charge on Real Estate Excise Taxes Adjusted Total Revenue (Inflation)

RSWMP – Task 4 Cost Recovery for Waste Management in Lebanon
ELARD in association with Tebodin Consultancy and Envirotech 41
Table 23. Projected Revenues for the Recovery of the Costs of SWM
2004 2005 2006 2007 2008 2009 2010 2011 2012 2013 2014
Revenue from a 5% Municipal Charge on Utility Bills (Mil $US) 70.00 75.60 81.65 88.18 95.23 102.85 111.08 119.97 129.57 139.93 151.12
Expected Trend of Revenue from Utility Bills 8.00% 8.00% 8.00% 8.00% 8.00% 8.00% 8.00% 8.00% 8.00% 8.00% 8.00%
Estimated Revenues from the Increase of Municipal Charge on Real Estate (Mil $US)
38.62 39.39 40.18 40.98 41.80 42.63 43.49 44.36 45.24 46.15 47.07
Minimum Revenues from the Increase of Municipal Charge on Real Estate (Mil $US)
29.07 29.65 30.25 30.85 31.47 32.10 32.74 33.40 34.06 34.74 35.44
Expected Trend of Revenue from Rental Value of Real Estate* 2.00% 2.00% 2.00% 2.00% 2.00% 2.00% 2.00% 2.00% 2.00% 2.00% 2.00%
Projected Revenues from Excise Taxes (Mil $US) 196.33 219.38 245.14 273.92 306.09 342.03 382.19 427.06 477.20 533.24 595.85
Expected Trend of Revenue from Excise Taxes** 11.74% 11.74% 11.74% 11.74% 11.74% 11.74% 11.74% 11.74% 11.74% 11.74% 11.74%
Total Expected Revenue without Inflation (Mil $US) 295.40 324.64 357.04 392.96 432.79 476.98 526.01 580.42 640.83 707.91 782.41
Inflation Corrector 2.00% 2.00% 2.00% 2.00% 2.00% 2.00% 2.00% 2.00% 2.00% 2.00%
Projected Revenues (Mil $US) 331.13 364.18 400.81 441.45 486.52 536.53 592.03 653.65 722.07 798.06

RSWMP – Task 4 Cost Recovery for Waste Management in Lebanon
ELARD in association with Tebodin Consultancy and Envirotech 42
As discussed in the previous section, the cumulative proceeds from the three proposed sources of cost recovery (scenario 1), would by far exceed the needs of the system. However, the proceeds from charging a supplemental 5% excise tax and from increasing the municipal charge on rental value of property (scenario 2) would satisfy the costs of the system. Moreover, since these two sources are more likely to be accepted by the Lebanese public, this scenario seems to be the optimum solution.
The proceeds from Scenario 3, comprising of the sum of proceeds from the supplemental excise tax and from the reinstatement of municipal charges on utility consumption bills, cover the recurrent costs of SWM. However, similar to Scenario 1, these proceeds by far outweigh
those required to support the recurrent costs of a SWM system in Lebanon.
Figure 8. Projected Recovery Revenues and Costs for SWM
0
100
200
300
400
500
600
700
800
900
2005 2006 2007 2008 2009 2010 2011 2012 2013 2014
Minimum Costs Maximum Costs Excise Taxation
Rental Value of Property Utility Bills Scenario 1: Cumu
Scenario 2: Excise + Rental Scenario 3: Excise + Utility
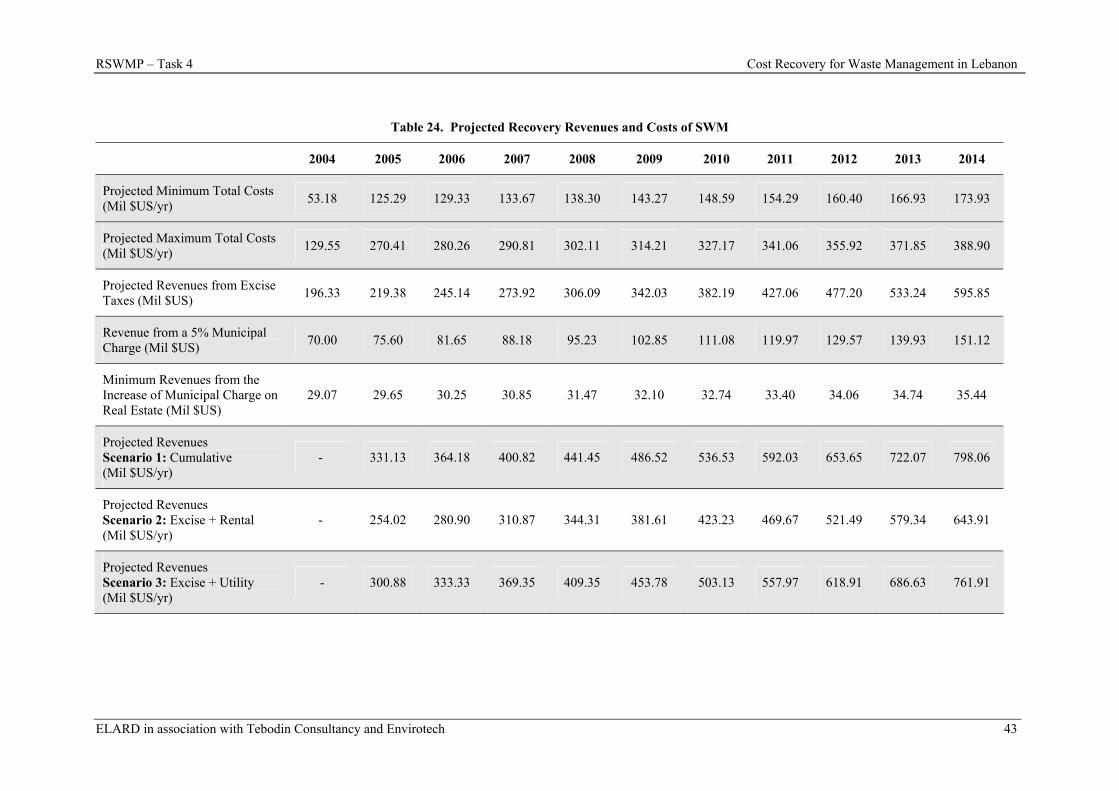
RSWMP – Task 4 Cost Recovery for Waste Management in Lebanon
ELARD in association with Tebodin Consultancy and Envirotech 43
Table 24. Projected Recovery Revenues and Costs of SWM
2004 2005 2006 2007 2008 2009 2010 2011 2012 2013 2014
Projected Minimum Total Costs (Mil $US/yr) 53.18 125.29 129.33 133.67 138.30 143.27 148.59 154.29 160.40 166.93 173.93
Projected Maximum Total Costs (Mil $US/yr) 129.55 270.41 280.26 290.81 302.11 314.21 327.17 341.06 355.92 371.85 388.90
Projected Revenues from Excise Taxes (Mil $US) 196.33 219.38 245.14 273.92 306.09 342.03 382.19 427.06 477.20 533.24 595.85
Revenue from a 5% Municipal Charge (Mil $US) 70.00 75.60 81.65 88.18 95.23 102.85 111.08 119.97 129.57 139.93 151.12
Minimum Revenues from the Increase of Municipal Charge on Real Estate (Mil $US)
29.07 29.65 30.25 30.85 31.47 32.10 32.74 33.40 34.06 34.74 35.44
Projected Revenues Scenario 1: Cumulative (Mil $US/yr)
- 331.13 364.18 400.82 441.45 486.52 536.53 592.03 653.65 722.07 798.06
Projected Revenues Scenario 2: Excise + Rental (Mil $US/yr)
- 254.02 280.90 310.87 344.31 381.61 423.23 469.67 521.49 579.34 643.91
Projected Revenues Scenario 3: Excise + Utility (Mil $US/yr)
- 300.88 333.33 369.35 409.35 453.78 503.13 557.97 618.91 686.63 761.91
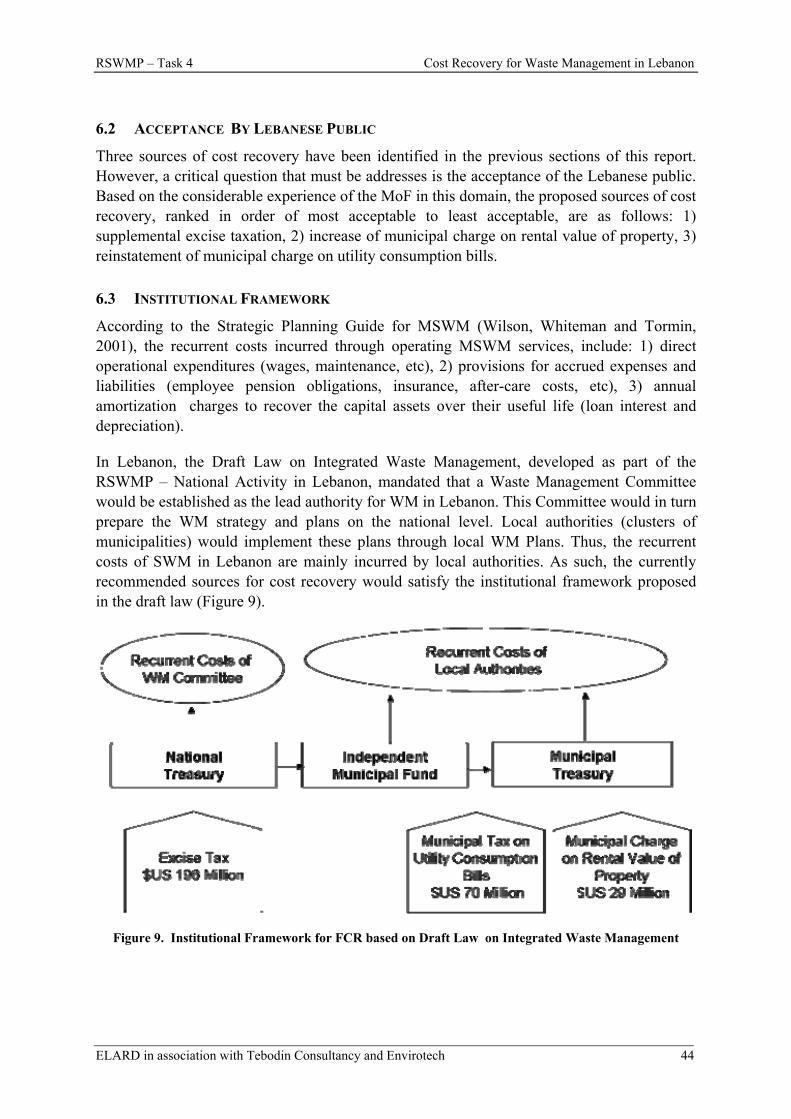
RSWMP – Task 4 Cost Recovery for Waste Management in Lebanon
ELARD in association with Tebodin Consultancy and Envirotech 44
6.2 ACCEPTANCE BY LEBANESE PUBLIC
Three sources of cost recovery have been identified in the previous sections of this report. However, a critical question that must be addresses is the acceptance of the Lebanese public. Based on the considerable experience of the MoF in this domain, the proposed sources of cost recovery, ranked in order of most acceptable to least acceptable, are as follows: 1) supplemental excise taxation, 2) increase of municipal charge on rental value of property, 3) reinstatement of municipal charge on utility consumption bills.
6.3 INSTITUTIONAL FRAMEWORK
According to the Strategic Planning Guide for MSWM (Wilson, Whiteman and Tormin, 2001), the recurrent costs incurred through operating MSWM services, include: 1) direct operational expenditures (wages, maintenance, etc), 2) provisions for accrued expenses and liabilities (employee pension obligations, insurance, after-care costs, etc), 3) annual amortization charges to recover the capital assets over their useful life (loan interest and depreciation).
In Lebanon, the Draft Law on Integrated Waste Management, developed as part of the RSWMP – National Activity in Lebanon, mandated that a Waste Management Committee would be established as the lead authority for WM in Lebanon. This Committee would in turn prepare the WM strategy and plans on the national level. Local authorities (clusters of municipalities) would implement these plans through local WM Plans. Thus, the recurrent costs of SWM in Lebanon are mainly incurred by local authorities. As such, the currently recommended sources for cost recovery would satisfy the institutional framework proposed in the draft law (Figure 9).
Figure 9. Institutional Framework for FCR based on Draft Law on Integrated Waste Management
RSWMP – Task 4 Cost Recovery for Waste Management in Lebanon
ELARD in association with Tebodin Consultancy and Envirotech 45
In conclusion, to summarize the recommendations of Section 6.1, Section 6.2, and Section 6.2 (Table 25):
− Introducing an additional excise tax of 5% would, in general, generate sufficient funds to recover the costs of SWM in Lebanon. Moreover, due to the expected decline of customs duties (average value of 5%) upon joining the WTO, such a tax would be more acceptable to the Lebanese Public. On the other hand, proceeds from this tax are collected by the central government and deposited in the National Treasury. Therefore, the funds are not directly accessible to municipalities since they have to be transferred to the IMF and then distributed to individual municipal treasuries – a process that had traditionally been prone to corruption.
− Reinstating a 5% municipal charge on telephone, water and electricity consumption bills does not recover the estimated recurrent costs of SWM in Lebanon. Moreover, the overall acceptance by the Lebanese public is predictably low. However, proceeds from this charge would be directly deposited in the individual accounts of municipalities based on registered inhabitants. In the absence of a municipal authority, proceeds from the 5% charge on utility consumption bills are deposited in the IMF. Moreover, the proceeds correspond with the institutional framework proposed in the Draft Law on Integrated Waste Management, developed under the RSWMP – National Activity in Lebanon.
− Increasing the municipal charge on the rental value of property does not recover the estimated recurrent costs of SWM in Lebanon. Moreover, the expected acceptance by the Lebanese public is acceptable. Proceeds from this charge are directly collected by municipalities and therefore correspond with the institutional framework proposed in the Draft Law on Integrated Waste Management, developed under the RSWMP – National Activity in Lebanon.
− Scenario 1, which comprises imposing all of the above mentioned charges, would generate proceeds that by far exceed those required. Such a scenario is expected to be opposed by the public. However, this scenario is in accord with the proposed institutional framework for SWM.
− Scenario 2, which entails increasing the charge on the rental value of property as well as excise taxation, would generate proceeds that generally satisfy those required. Such a scenario is expected to be reasonably accepted by the public. This scenario is fairly in par with the proposed institutional framework for SWM.
− Scenario 3, which involves imposing a municipal charge on utility consumption as well as excise tax, would generate proceeds that by far exceed those required. Such a scenario is anticipated to be generally opposed by the public. However, this scenario is in high agreement with the proposed institutional framework for SWM.
Based on the above evaluation, it is recommended to impose a supplemental 5% excise tax as described in Section 5.2, along with increasing the municipal charge on the rental value of property as depicted in Section 5.3 (Scenario 2) so as to recover the recurrent costs of SWM in Lebanon.
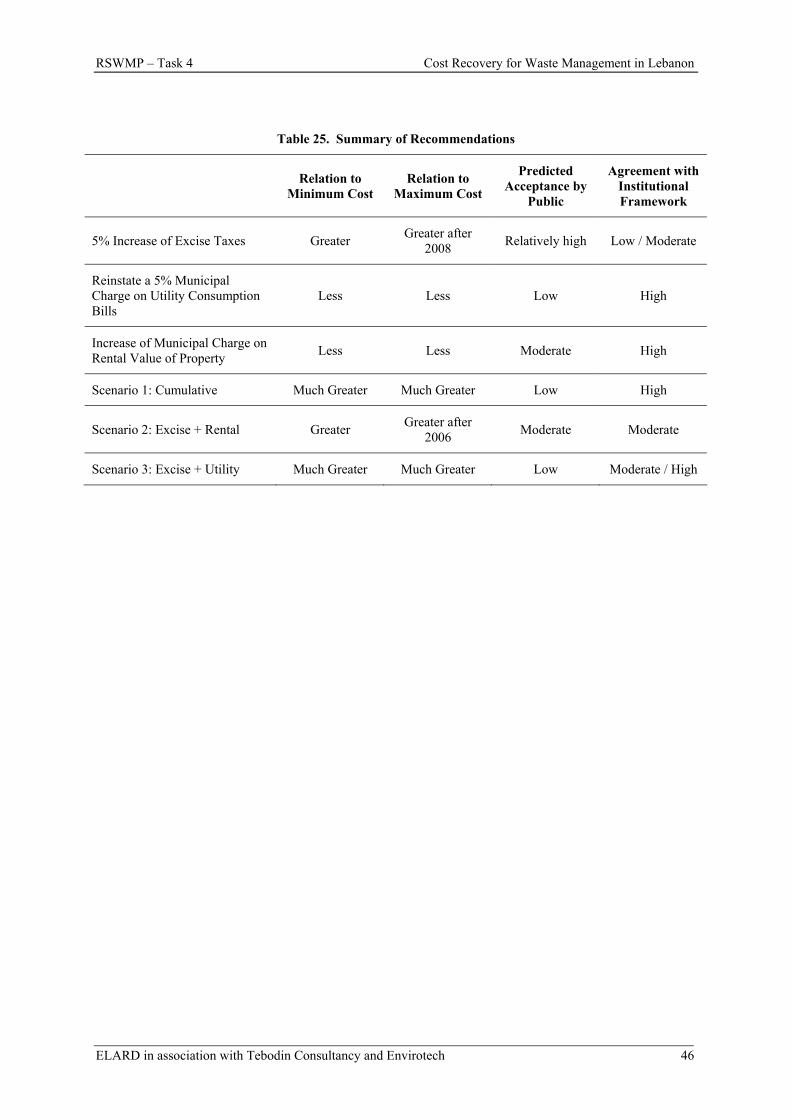
RSWMP – Task 4 Cost Recovery for Waste Management in Lebanon
ELARD in association with Tebodin Consultancy and Envirotech 46
Table 25. Summary of Recommendations
Relation to Minimum Cost
Relation to Maximum Cost
Predicted Acceptance by
Public
Agreement with Institutional Framework
5% Increase of Excise Taxes Greater Greater after 2008 Relatively high Low / Moderate
Reinstate a 5% Municipal Charge on Utility Consumption Bills
Less Less Low High
Increase of Municipal Charge on Rental Value of Property Less Less Moderate High
Scenario 1: Cumulative Much Greater Much Greater Low High
Scenario 2: Excise + Rental Greater Greater after 2006 Moderate Moderate
Scenario 3: Excise + Utility Much Greater Much Greater Low Moderate / High

RSWMP – Task 4 Cost Recovery for Waste Management in Lebanon
ELARD in association with Tebodin Consultancy and Envirotech 47
REFERENCES Council for Development and Reconstruction, Lebanon. “Annual Report.” 2003.
Devco, Issa Consulting, for Ministry of Municipalities and Rural Affairs (MMRA) & Council of Development and Reconstruction (CDR), “Presentation, Cost Recovery, Solid Waste/Environmental Management Project (SWEMP)”, 1999.
Ecodit, "Feasibility Study of Solid Waste Management in Byblos", Appendix C-2 - Table C3 April 2004
ELARD in association with Envirotech and Tebodin, “Legal Framework for Solid Waste Management in Lebanon – First Report Draft Version”, August 2004
Ministry of Environment (Lebanon) /Ecodit. “State of the Environment Report, Ministry of Environment, Lebanon.” 2001.
Ministry of Finance (Lebanon), Budget Law 2003-2004.
Mediterranean Environmental Technical Assistance Program (METAP), “Solid Waste Management Fact Sheet: Lebanon”
Mediterranean Environmental Technical Assistance Program (METAP), “METAP Regional Solid Waste Management Project - Current Situation Report” March, 2000
Office of Minister of State for Administrative Reform (OMSAR) Homepage, www.omsar.gov.lb.
Shehadi K., Houry R., “Municipalities in Lebanon” World Bank Mediterranean Development Forum I – Towards Competitive and Caring Societies in the Middle East and North Africa, Morocco, May 12 – 17, 1997.
The World Bank (WB) - METAP, “Country Report - Lebanon.” Prepared by Hickman, D., Merhebi, F., GTZ/ERM/GKW. February, 2004.
The World Bank (WB) - METAP, “Guidelines for Municipal Solid Waste Management in the Mediterranean Region.” Prepared by ISR/EWC and Medcities. May, 2003.
The World Bank (WB) - METAP, “Regional Guidelines for Solid Waste Management.” Prepared by the International Consortium (GTZ/ERM/GKW). Volumes 1-4. January, 2004.
The World Bank (WB) - METAP, “Regional Training Manuals on Integrated Solid Waste Management.” Prepared by the International Consortium (GTZ/ERM/GKW). September, 2004.
United Nations (UN), “Johannesburg Summit 2002, Lebanon Country Profile,” 2002.
United Nations Development Programme (UNDP), Ministry of Social Affairs, “Mapping of Living Conditions In Lebanon, Analysis of the Housing and Population Data Base”, 2nd Edition, 2001.
United Nations Development Programme (UNDP), “Decentralized Governance for Development in the Arab States: A Background Paper on Decentralization and Local Governance Policies, Legal Frameworks, Programmes, Lessons Learned and Good Practices”, Prepared by Sarrouh, E., December, 2003.
RSWMP – Task 4 Cost Recovery for Waste Management in Lebanon
ELARD in association with Tebodin Consultancy and Envirotech 48
United Nations Environmental Programme (UNEP) and CEDARE. “Policy and Institutional Assessment of Solid Waste Management in Five Countries - Lebanon.” 2000.
University at Albany, State University of New York, Center for Legislative Development, “Lebanon Relief and Redevelopment Project: Government Institutions Strengthening Component – Local Government and Parliament Project – Annual Report”, United States Agency for International Development (USAID), June 2004
Wilson D., Whiteman A., Tormin A., “Strategic Planning Guide for Municipal Solid Waste Management,” International Bank for Reconstruction and Development / The World Bank, 2001.
RSWMP – Task 4 Cost Recovery for Waste Management in Lebanon
ELARD in association with Tebodin Consultancy and Envirotech
APPENDIX A - WASTE GENERATION IN LEBANON
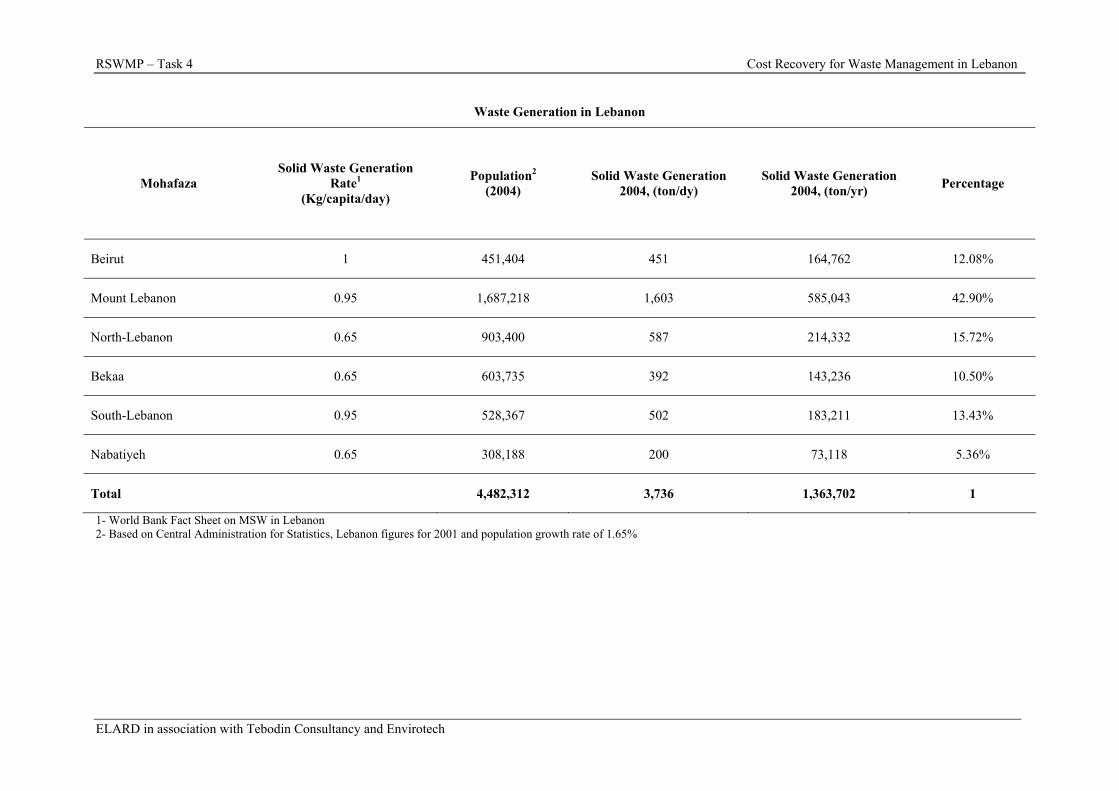
RSWMP – Task 4 Cost Recovery for Waste Management in Lebanon
ELARD in association with Tebodin Consultancy and Envirotech
Waste Generation in Lebanon
Mohafaza Solid Waste Generation
Rate1 (Kg/capita/day)
Population2 (2004)
Solid Waste Generation 2004, (ton/dy)
Solid Waste Generation 2004, (ton/yr) Percentage
Beirut 1 451,404 451 164,762 12.08%
Mount Lebanon 0.95 1,687,218 1,603 585,043 42.90%
North-Lebanon 0.65 903,400 587 214,332 15.72%
Bekaa 0.65 603,735 392 143,236 10.50%
South-Lebanon 0.95 528,367 502 183,211 13.43%
Nabatiyeh 0.65 308,188 200 73,118 5.36%
Total 4,482,312 3,736 1,363,702 1
1- World Bank Fact Sheet on MSW in Lebanon 2- Based on Central Administration for Statistics, Lebanon figures for 2001 and population growth rate of 1.65%
RSWMP – Task 4 Cost Recovery for Waste Management in Lebanon
ELARD in association with Tebodin Consultancy and Envirotech
APPENDIX B – SOLID WASTE MANAGEMENT AND MUNICIPAL BUDGETS
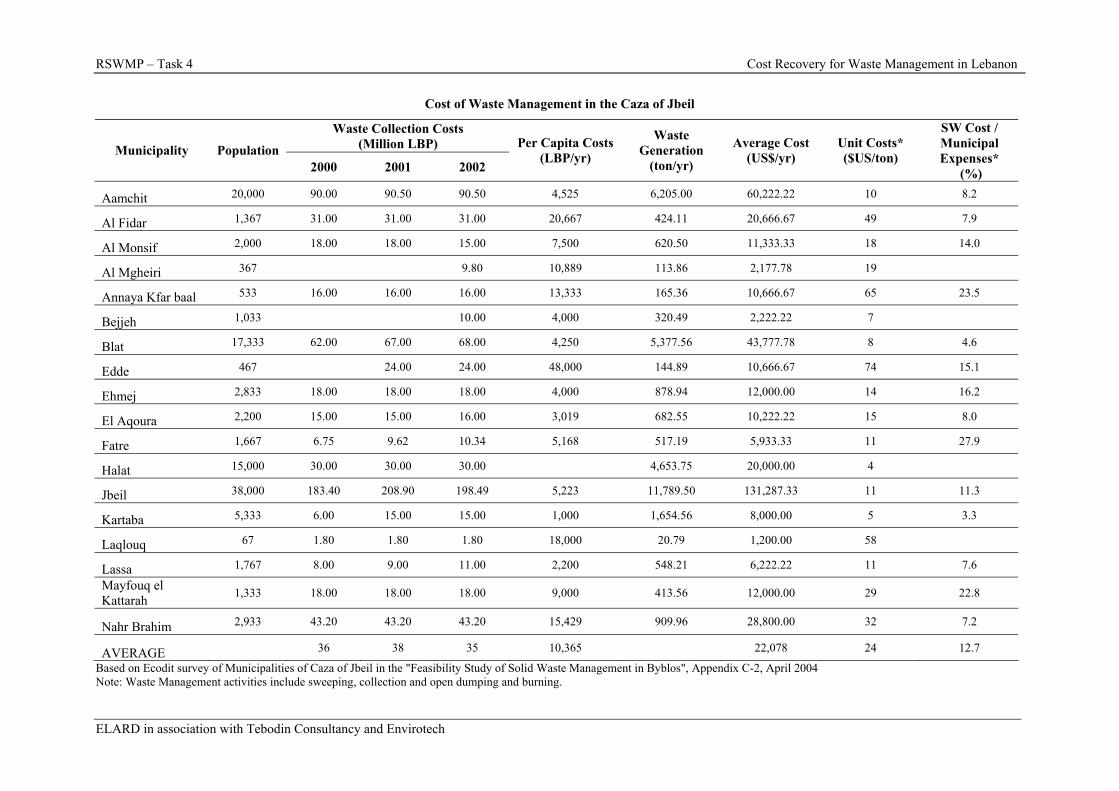
RSWMP – Task 4 Cost Recovery for Waste Management in Lebanon
ELARD in association with Tebodin Consultancy and Envirotech
Cost of Waste Management in the Caza of Jbeil
Waste Collection Costs (Million LBP) Municipality Population
2000 2001 2002
Per Capita Costs (LBP/yr)
Waste Generation
(ton/yr)
Average Cost (US$/yr)
Unit Costs* ($US/ton)
SW Cost / Municipal Expenses*
(%)
Aamchit 20,000 90.00 90.50 90.50 4,525 6,205.00 60,222.22 10 8.2
Al Fidar 1,367 31.00 31.00 31.00 20,667 424.11 20,666.67 49 7.9
Al Monsif 2,000 18.00 18.00 15.00 7,500 620.50 11,333.33 18 14.0
Al Mgheiri 367 9.80 10,889 113.86 2,177.78 19
Annaya Kfar baal 533 16.00 16.00 16.00 13,333 165.36 10,666.67 65 23.5
Bejjeh 1,033 10.00 4,000 320.49 2,222.22 7
Blat 17,333 62.00 67.00 68.00 4,250 5,377.56 43,777.78 8 4.6
Edde 467 24.00 24.00 48,000 144.89 10,666.67 74 15.1
Ehmej 2,833 18.00 18.00 18.00 4,000 878.94 12,000.00 14 16.2
El Aqoura 2,200 15.00 15.00 16.00 3,019 682.55 10,222.22 15 8.0
Fatre 1,667 6.75 9.62 10.34 5,168 517.19 5,933.33 11 27.9
Halat 15,000 30.00 30.00 30.00 4,653.75 20,000.00 4
Jbeil 38,000 183.40 208.90 198.49 5,223 11,789.50 131,287.33 11 11.3
Kartaba 5,333 6.00 15.00 15.00 1,000 1,654.56 8,000.00 5 3.3
Laqlouq 67 1.80 1.80 1.80 18,000 20.79 1,200.00 58
Lassa 1,767 8.00 9.00 11.00 2,200 548.21 6,222.22 11 7.6
Mayfouq el Kattarah 1,333 18.00 18.00 18.00 9,000 413.56 12,000.00 29 22.8
Nahr Brahim 2,933 43.20 43.20 43.20 15,429 909.96 28,800.00 32 7.2
AVERAGE 36 38 35 10,365 22,078 24 12.7
Based on Ecodit survey of Municipalities of Caza of Jbeil in the "Feasibility Study of Solid Waste Management in Byblos", Appendix C-2, April 2004 Note: Waste Management activities include sweeping, collection and open dumping and burning.
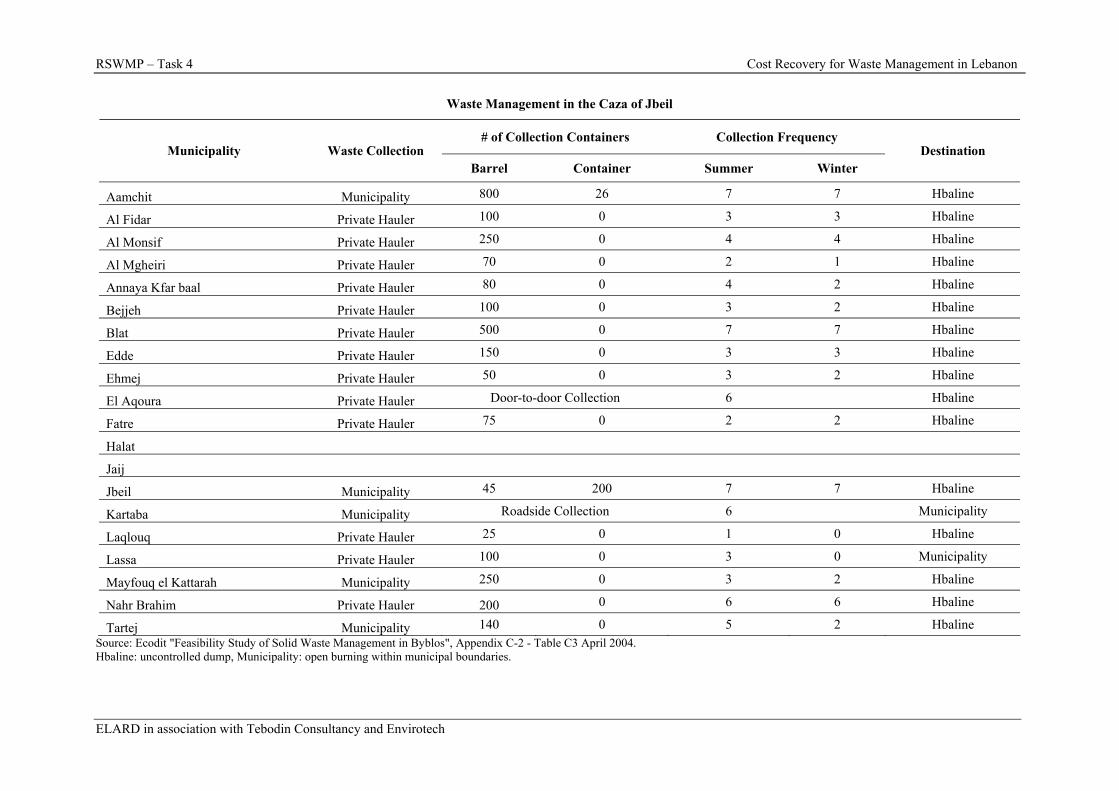
RSWMP – Task 4 Cost Recovery for Waste Management in Lebanon
ELARD in association with Tebodin Consultancy and Envirotech
Waste Management in the Caza of Jbeil
# of Collection Containers Collection Frequency Municipality Waste Collection
Barrel Container Summer Winter Destination
Aamchit Municipality 800 26 7 7 Hbaline
Al Fidar Private Hauler 100 0 3 3 Hbaline
Al Monsif Private Hauler 250 0 4 4 Hbaline
Al Mgheiri Private Hauler 70 0 2 1 Hbaline
Annaya Kfar baal Private Hauler 80 0 4 2 Hbaline
Bejjeh Private Hauler 100 0 3 2 Hbaline
Blat Private Hauler 500 0 7 7 Hbaline
Edde Private Hauler 150 0 3 3 Hbaline
Ehmej Private Hauler 50 0 3 2 Hbaline
El Aqoura Private Hauler Door-to-door Collection 6 Hbaline
Fatre Private Hauler 75 0 2 2 Hbaline
Halat
Jaij
Jbeil Municipality 45 200 7 7 Hbaline
Kartaba Municipality Roadside Collection 6 Municipality
Laqlouq Private Hauler 25 0 1 0 Hbaline
Lassa Private Hauler 100 0 3 0 Municipality
Mayfouq el Kattarah Municipality 250 0 3 2 Hbaline
Nahr Brahim Private Hauler 200 0 6 6 Hbaline
Tartej Municipality 140 0 5 2 Hbaline Source: Ecodit "Feasibility Study of Solid Waste Management in Byblos", Appendix C-2 - Table C3 April 2004. Hbaline: uncontrolled dump, Municipality: open burning within municipal boundaries.
RSWMP – Task 4 Cost Recovery for Waste Management in Lebanon
ELARD in association with Tebodin Consultancy and Envirotech
APPENDIX C - FINANCIAL SITUATION OF THE GOVERNMENT OF LEBANON
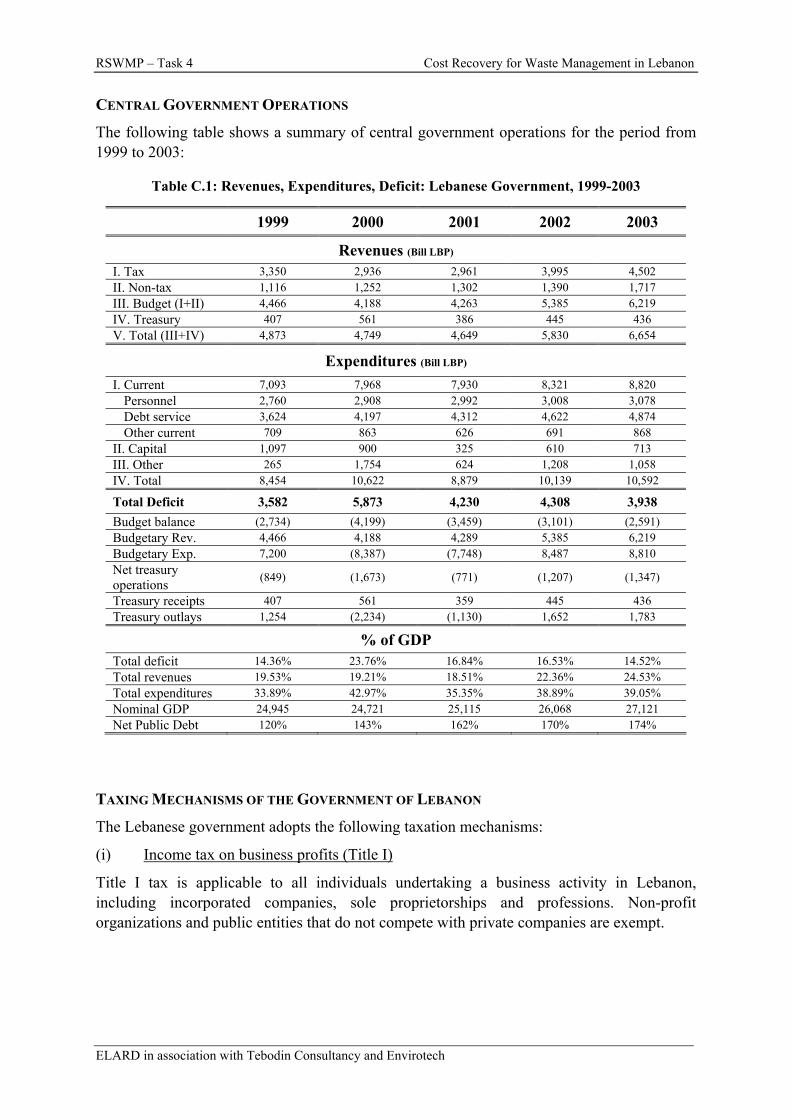
RSWMP – Task 4 Cost Recovery for Waste Management in Lebanon
ELARD in association with Tebodin Consultancy and Envirotech
CENTRAL GOVERNMENT OPERATIONS
The following table shows a summary of central government operations for the period from 1999 to 2003:
Table C.1: Revenues, Expenditures, Deficit: Lebanese Government, 1999-2003
1999 2000 2001 2002 2003
Revenues (Bill LBP)
I. Tax 3,350 2,936 2,961 3,995 4,502 II. Non-tax 1,116 1,252 1,302 1,390 1,717 III. Budget (I+II) 4,466 4,188 4,263 5,385 6,219 IV. Treasury 407 561 386 445 436 V. Total (III+IV) 4,873 4,749 4,649 5,830 6,654
Expenditures (Bill LBP) I. Current 7,093 7,968 7,930 8,321 8,820
Personnel 2,760 2,908 2,992 3,008 3,078 Debt service 3,624 4,197 4,312 4,622 4,874 Other current 709 863 626 691 868
II. Capital 1,097 900 325 610 713 III. Other 265 1,754 624 1,208 1,058 IV. Total 8,454 10,622 8,879 10,139 10,592
Total Deficit 3,582 5,873 4,230 4,308 3,938 Budget balance (2,734) (4,199) (3,459) (3,101) (2,591) Budgetary Rev. 4,466 4,188 4,289 5,385 6,219 Budgetary Exp. 7,200 (8,387) (7,748) 8,487 8,810 Net treasury operations (849) (1,673) (771) (1,207) (1,347)
Treasury receipts 407 561 359 445 436 Treasury outlays 1,254 (2,234) (1,130) 1,652 1,783
% of GDP
Total deficit 14.36% 23.76% 16.84% 16.53% 14.52% Total revenues 19.53% 19.21% 18.51% 22.36% 24.53% Total expenditures 33.89% 42.97% 35.35% 38.89% 39.05% Nominal GDP 24,945 24,721 25,115 26,068 27,121 Net Public Debt 120% 143% 162% 170% 174%
TAXING MECHANISMS OF THE GOVERNMENT OF LEBANON
The Lebanese government adopts the following taxation mechanisms:
(i) Income tax on business profits (Title I)
Title I tax is applicable to all individuals undertaking a business activity in Lebanon, including incorporated companies, sole proprietorships and professions. Non-profit organizations and public entities that do not compete with private companies are exempt.

RSWMP – Task 4 Cost Recovery for Waste Management in Lebanon
ELARD in association with Tebodin Consultancy and Envirotech
Table C.2: Title I Statutory Tax Rates on Business Income (1999)
Taxable Income Brackets (millions of LBP)
Statutory Tax Rates
Greater Less or Equal
Corporations & Limited Liability Companies 15% n.a. n.a.
4% 0 9
7% 9 24
12% 24 54
16% 54 104
Sole Proprietorships and Professions
21% 104 n.a.
(ii) Tax on salaries, wages and benefits (Title II)
Persons subject to Title II taxes are those who earn business income, or who have worked for more than one employer during the year.
Net income for Tax Title II is gross income less eligible expenses and family abatements (see Table B3 below) to arrive at taxable income:
Table C.3: Title II Statutory Tax Rates on Incomes from Salaries, Wages and Benefits: 1999, and Family Abatements, 1999
Taxable Income Brackets (millions of LBP) Statutory Tax Rates
Above Below Or Equal To
2% 0 6
4% 6 15
7% 15 30
11% 30 60
15% 60 120
20% 120 -
Family abatements 1999 Millions of LBP
Single individual 7.5
Married couple (spouse does not work) 10
Married couple (spouse works) 7.5
Children (up to 5 years of age) 0.5
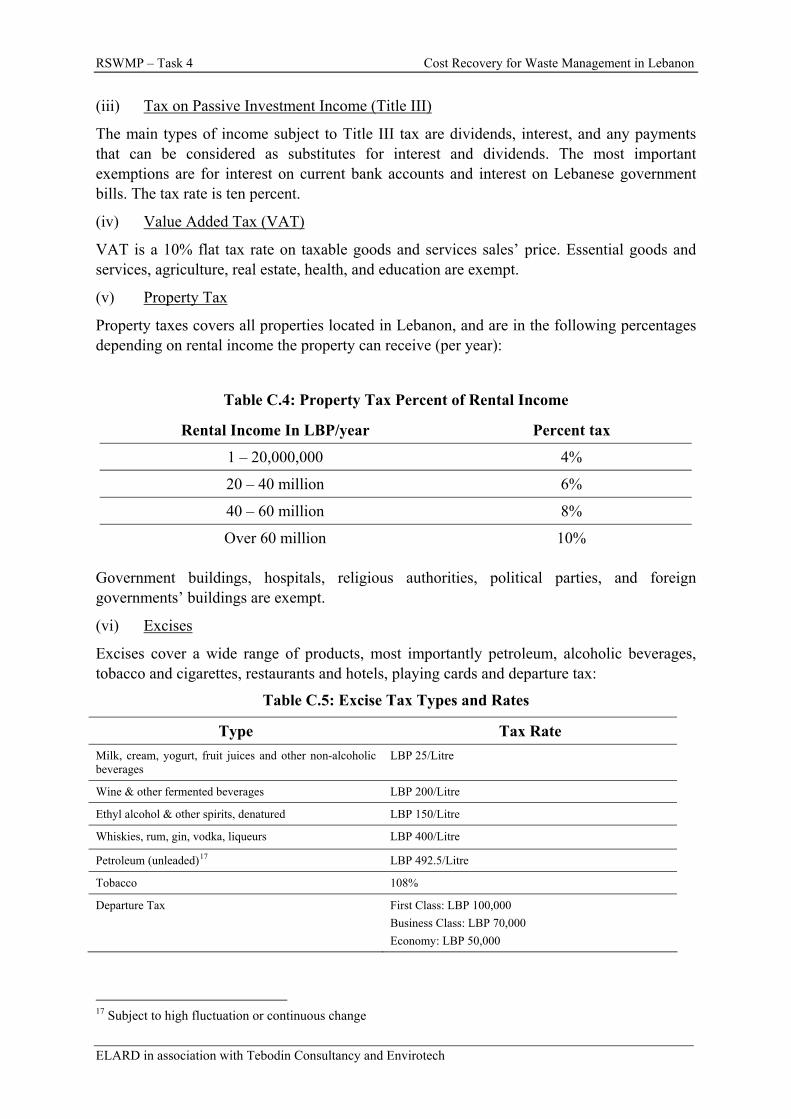
RSWMP – Task 4 Cost Recovery for Waste Management in Lebanon
ELARD in association with Tebodin Consultancy and Envirotech
(iii) Tax on Passive Investment Income (Title III)
The main types of income subject to Title III tax are dividends, interest, and any payments that can be considered as substitutes for interest and dividends. The most important exemptions are for interest on current bank accounts and interest on Lebanese government bills. The tax rate is ten percent.
(iv) Value Added Tax (VAT)
VAT is a 10% flat tax rate on taxable goods and services sales’ price. Essential goods and services, agriculture, real estate, health, and education are exempt.
(v) Property Tax
Property taxes covers all properties located in Lebanon, and are in the following percentages depending on rental income the property can receive (per year):
Table C.4: Property Tax Percent of Rental Income
Rental Income In LBP/year Percent tax
1 – 20,000,000 4%
20 – 40 million 6%
40 – 60 million 8%
Over 60 million 10%
Government buildings, hospitals, religious authorities, political parties, and foreign governments’ buildings are exempt.
(vi) Excises
Excises cover a wide range of products, most importantly petroleum, alcoholic beverages, tobacco and cigarettes, restaurants and hotels, playing cards and departure tax:
Table C.5: Excise Tax Types and Rates
Type Tax Rate Milk, cream, yogurt, fruit juices and other non-alcoholic beverages
LBP 25/Litre
Wine & other fermented beverages LBP 200/Litre
Ethyl alcohol & other spirits, denatured LBP 150/Litre
Whiskies, rum, gin, vodka, liqueurs LBP 400/Litre
Petroleum (unleaded)17 LBP 492.5/Litre
Tobacco 108%
Departure Tax First Class: LBP 100,000 Business Class: LBP 70,000 Economy: LBP 50,000
17 Subject to high fluctuation or continuous change

RSWMP – Task 4 Cost Recovery for Waste Management in Lebanon
ELARD in association with Tebodin Consultancy and Envirotech
(vii) Customs Duties
Customs duties is levied on all import, and ranges from 70% on agricultural products, to alcoholic products (mainly 15% tax), to LBP 6.5/Litre on octane gasoline among other things. With these taxes, and with other non-tax sources of revenues, the government of Lebanon is expecting revenues in 2004 to amount to the following (and compared to 2003):
Table C.6: Revenues, 2003 and expected 2004
(Bill LBP) 2003 Budget Law 2004 Draft Budget A- Tax Revenues 4,726 4,645 Income, Profits & Capital Tax 1,000 1,045 Tax on Properties 400 350 VAT + Internal Tariffs + Customs duties 3,076 3,049
VAT 1,100 1,200 Remaining internal tariffs on goods and services 1,196 1,299 Tariffs on trade and international exchange 780 550 Other tax revenues 250 201 B- Non-Tax Revenues 1,749 1,755 Proceeds from public administrations & institutions 1,180 1,296 Central Bank Revenues 20 0 Proceeds from other state properties 35 45 Casino du Liban Revenues 2 0 Beirut International Airport Revenues 30 35 Grottos, ancient & tourist sites 2 2
Beirut Port 10 10 National Lottery 25 47 Communications 1,050 1,150 Other revenues from public institution proceeds 6 7 Tariffs, administrative proceeds and sales 415 376 Fines and seizures 27 6 Miscellaneous Non-fiscal Revenues, including; 127 77 Pension slashes 75 77 Seafront properties settlement fees and construction violations
47 0
Postal proceeds 5 0
In the years 2002, 2003, the following expenditures by the Lebanese government were undertaken, based on the economic classification of expenditures:
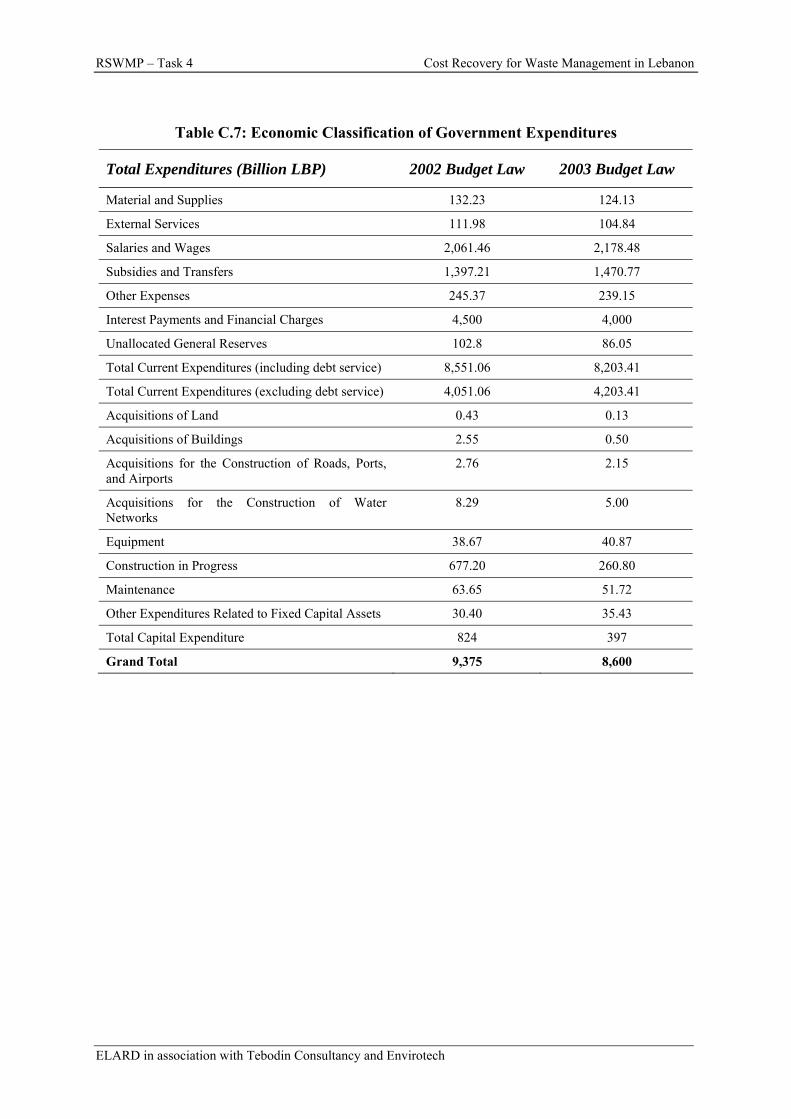
RSWMP – Task 4 Cost Recovery for Waste Management in Lebanon
ELARD in association with Tebodin Consultancy and Envirotech
Table C.7: Economic Classification of Government Expenditures
Total Expenditures (Billion LBP) 2002 Budget Law 2003 Budget Law
Material and Supplies 132.23 124.13
External Services 111.98 104.84
Salaries and Wages 2,061.46 2,178.48
Subsidies and Transfers 1,397.21 1,470.77
Other Expenses 245.37 239.15
Interest Payments and Financial Charges 4,500 4,000
Unallocated General Reserves 102.8 86.05
Total Current Expenditures (including debt service) 8,551.06 8,203.41
Total Current Expenditures (excluding debt service) 4,051.06 4,203.41
Acquisitions of Land 0.43 0.13
Acquisitions of Buildings 2.55 0.50
Acquisitions for the Construction of Roads, Ports, and Airports
2.76 2.15
Acquisitions for the Construction of Water Networks
8.29 5.00
Equipment 38.67 40.87
Construction in Progress 677.20 260.80
Maintenance 63.65 51.72
Other Expenditures Related to Fixed Capital Assets 30.40 35.43
Total Capital Expenditure 824 397
Grand Total 9,375 8,600
RSWMP – Task 4 Cost Recovery for Waste Management in Lebanon
ELARD in association with Tebodin Consultancy and Envirotech
APPENDIX D - AFFORDABILITY ANALYSIS
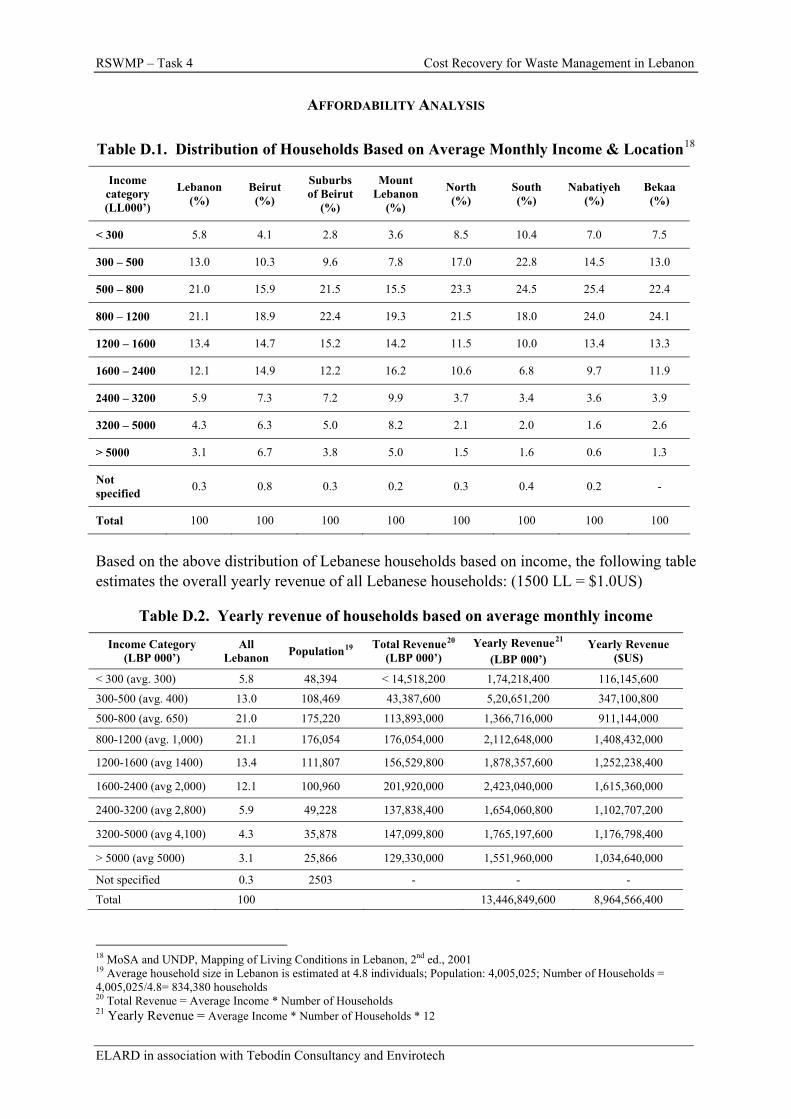
RSWMP – Task 4 Cost Recovery for Waste Management in Lebanon
ELARD in association with Tebodin Consultancy and Envirotech
AFFORDABILITY ANALYSIS
Table D.1. Distribution of Households Based on Average Monthly Income & Location18
Income category (LL000’)
Lebanon (%)
Beirut (%)
Suburbs of Beirut
(%)
Mount Lebanon
(%)
North (%)
South (%)
Nabatiyeh (%)
Bekaa (%)
< 300 5.8 4.1 2.8 3.6 8.5 10.4 7.0 7.5
300 – 500 13.0 10.3 9.6 7.8 17.0 22.8 14.5 13.0
500 – 800 21.0 15.9 21.5 15.5 23.3 24.5 25.4 22.4
800 – 1200 21.1 18.9 22.4 19.3 21.5 18.0 24.0 24.1
1200 – 1600 13.4 14.7 15.2 14.2 11.5 10.0 13.4 13.3
1600 – 2400 12.1 14.9 12.2 16.2 10.6 6.8 9.7 11.9
2400 – 3200 5.9 7.3 7.2 9.9 3.7 3.4 3.6 3.9
3200 – 5000 4.3 6.3 5.0 8.2 2.1 2.0 1.6 2.6
> 5000 3.1 6.7 3.8 5.0 1.5 1.6 0.6 1.3
Not specified 0.3 0.8 0.3 0.2 0.3 0.4 0.2 -
Total 100 100 100 100 100 100 100 100
Based on the above distribution of Lebanese households based on income, the following table estimates the overall yearly revenue of all Lebanese households: (1500 LL = $1.0US)
Table D.2. Yearly revenue of households based on average monthly income
Income Category (LBP 000’)
All Lebanon Population19 Total Revenue20
(LBP 000’) Yearly Revenue21
(LBP 000’) Yearly Revenue
($US)
< 300 (avg. 300) 5.8 48,394 < 14,518,200 1,74,218,400 116,145,600
300-500 (avg. 400) 13.0 108,469 43,387,600 5,20,651,200 347,100,800
500-800 (avg. 650) 21.0 175,220 113,893,000 1,366,716,000 911,144,000
800-1200 (avg. 1,000) 21.1 176,054 176,054,000 2,112,648,000 1,408,432,000
1200-1600 (avg 1400) 13.4 111,807 156,529,800 1,878,357,600 1,252,238,400
1600-2400 (avg 2,000) 12.1 100,960 201,920,000 2,423,040,000 1,615,360,000
2400-3200 (avg 2,800) 5.9 49,228 137,838,400 1,654,060,800 1,102,707,200
3200-5000 (avg 4,100) 4.3 35,878 147,099,800 1,765,197,600 1,176,798,400
> 5000 (avg 5000) 3.1 25,866 129,330,000 1,551,960,000 1,034,640,000
Not specified 0.3 2503 - - -
Total 100 13,446,849,600 8,964,566,400
18 MoSA and UNDP, Mapping of Living Conditions in Lebanon, 2nd ed., 2001 19 Average household size in Lebanon is estimated at 4.8 individuals; Population: 4,005,025; Number of Households = 4,005,025/4.8= 834,380 households 20 Total Revenue = Average Income * Number of Households 21 Yearly Revenue = Average Income * Number of Households * 12
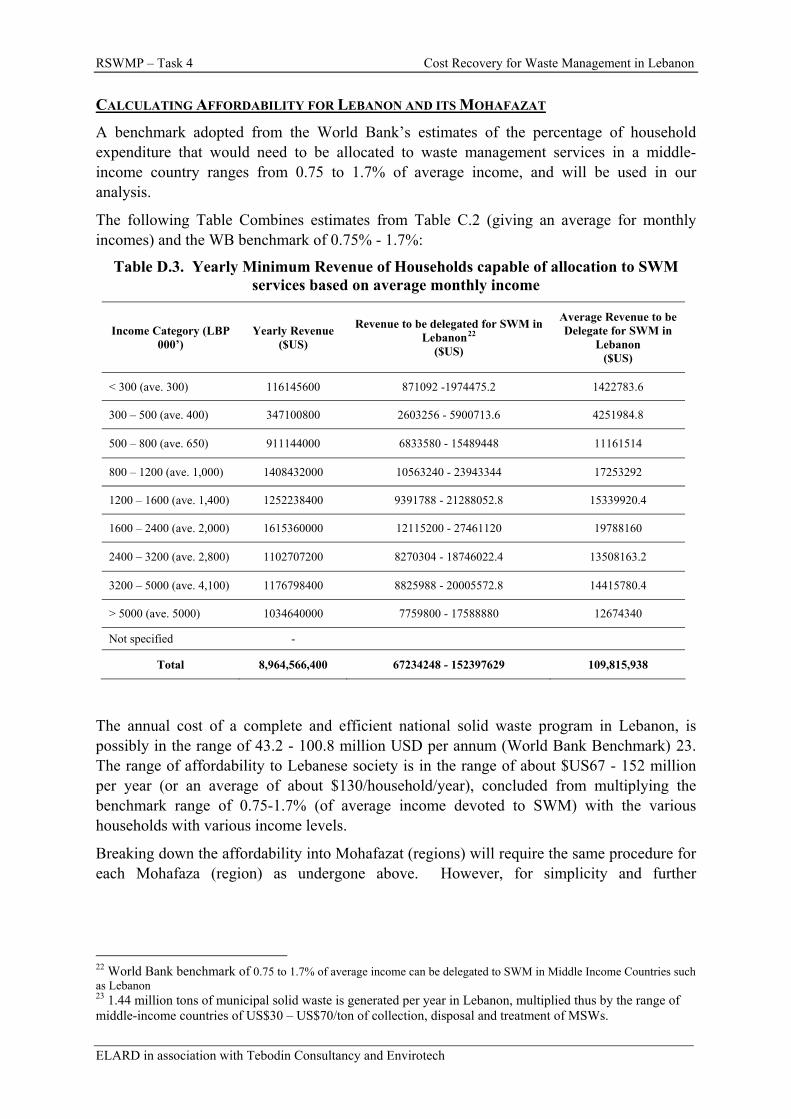
RSWMP – Task 4 Cost Recovery for Waste Management in Lebanon
ELARD in association with Tebodin Consultancy and Envirotech
CALCULATING AFFORDABILITY FOR LEBANON AND ITS MOHAFAZAT
A benchmark adopted from the World Bank’s estimates of the percentage of household expenditure that would need to be allocated to waste management services in a middle-income country ranges from 0.75 to 1.7% of average income, and will be used in our analysis.
The following Table Combines estimates from Table C.2 (giving an average for monthly incomes) and the WB benchmark of 0.75% - 1.7%:
Table D.3. Yearly Minimum Revenue of Households capable of allocation to SWM services based on average monthly income
Income Category (LBP 000’)
Yearly Revenue ($US)
Revenue to be delegated for SWM in Lebanon22
($US)
Average Revenue to be Delegate for SWM in
Lebanon ($US)
< 300 (ave. 300) 116145600 871092 -1974475.2 1422783.6
300 – 500 (ave. 400) 347100800 2603256 - 5900713.6 4251984.8
500 – 800 (ave. 650) 911144000 6833580 - 15489448 11161514
800 – 1200 (ave. 1,000) 1408432000 10563240 - 23943344 17253292
1200 – 1600 (ave. 1,400) 1252238400 9391788 - 21288052.8 15339920.4
1600 – 2400 (ave. 2,000) 1615360000 12115200 - 27461120 19788160
2400 – 3200 (ave. 2,800) 1102707200 8270304 - 18746022.4 13508163.2
3200 – 5000 (ave. 4,100) 1176798400 8825988 - 20005572.8 14415780.4
> 5000 (ave. 5000) 1034640000 7759800 - 17588880 12674340
Not specified -
Total 8,964,566,400 67234248 - 152397629 109,815,938
The annual cost of a complete and efficient national solid waste program in Lebanon, is possibly in the range of 43.2 - 100.8 million USD per annum (World Bank Benchmark) 23. The range of affordability to Lebanese society is in the range of about $US67 - 152 million per year (or an average of about $130/household/year), concluded from multiplying the benchmark range of 0.75-1.7% (of average income devoted to SWM) with the various households with various income levels.
Breaking down the affordability into Mohafazat (regions) will require the same procedure for each Mohafaza (region) as undergone above. However, for simplicity and further
22 World Bank benchmark of 0.75 to 1.7% of average income can be delegated to SWM in Middle Income Countries such as Lebanon 23 1.44 million tons of municipal solid waste is generated per year in Lebanon, multiplied thus by the range of middle-income countries of US$30 – US$70/ton of collection, disposal and treatment of MSWs.
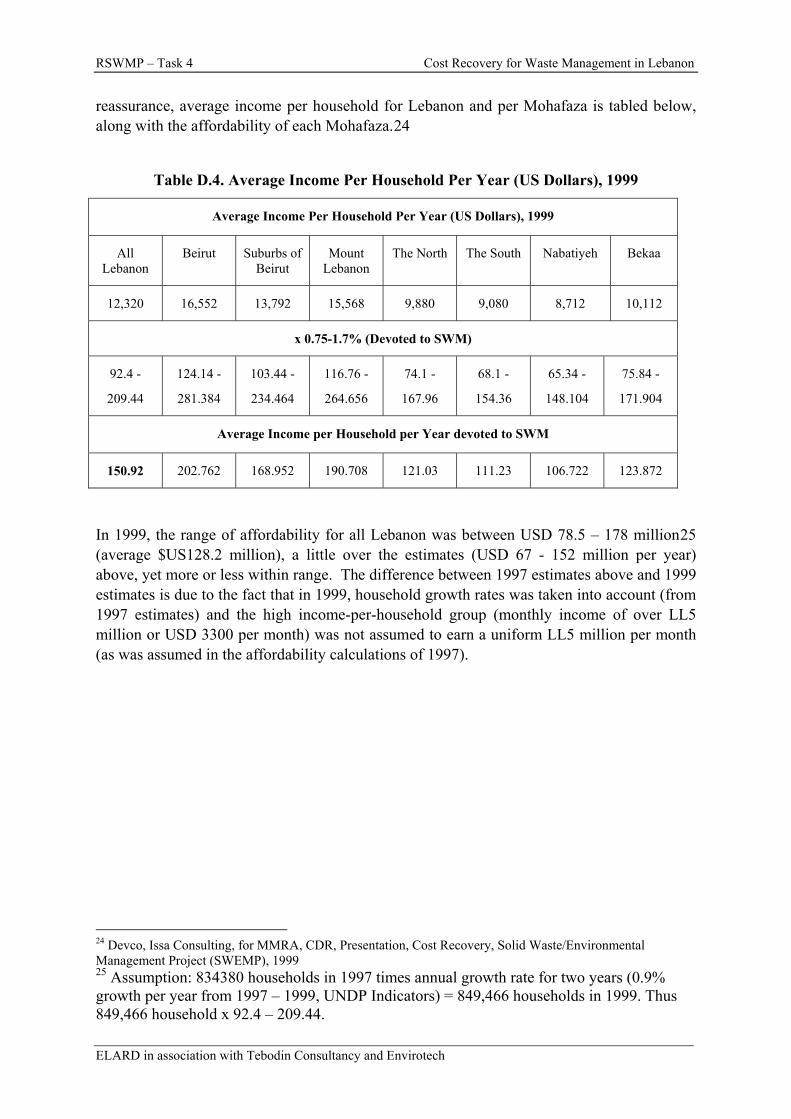
RSWMP – Task 4 Cost Recovery for Waste Management in Lebanon
ELARD in association with Tebodin Consultancy and Envirotech
reassurance, average income per household for Lebanon and per Mohafaza is tabled below, along with the affordability of each Mohafaza.24
Table D.4. Average Income Per Household Per Year (US Dollars), 1999
Average Income Per Household Per Year (US Dollars), 1999
All Lebanon
Beirut Suburbs of Beirut
Mount Lebanon
The North The South Nabatiyeh Bekaa
12,320 16,552 13,792 15,568 9,880 9,080 8,712 10,112
x 0.75-1.7% (Devoted to SWM)
92.4 -
209.44
124.14 -
281.384
103.44 -
234.464
116.76 -
264.656
74.1 -
167.96
68.1 -
154.36
65.34 -
148.104
75.84 -
171.904
Average Income per Household per Year devoted to SWM
150.92 202.762 168.952 190.708 121.03 111.23 106.722 123.872
In 1999, the range of affordability for all Lebanon was between USD 78.5 – 178 million25 (average $US128.2 million), a little over the estimates (USD 67 - 152 million per year) above, yet more or less within range. The difference between 1997 estimates above and 1999 estimates is due to the fact that in 1999, household growth rates was taken into account (from 1997 estimates) and the high income-per-household group (monthly income of over LL5 million or USD 3300 per month) was not assumed to earn a uniform LL5 million per month (as was assumed in the affordability calculations of 1997).
24 Devco, Issa Consulting, for MMRA, CDR, Presentation, Cost Recovery, Solid Waste/Environmental Management Project (SWEMP), 1999 25 Assumption: 834380 households in 1997 times annual growth rate for two years (0.9% growth per year from 1997 – 1999, UNDP Indicators) = 849,466 households in 1999. Thus 849,466 household x 92.4 – 209.44.
RSWMP – Task 4 Cost Recovery for Waste Management in Lebanon
ELARD in association with Tebodin Consultancy and Envirotech
APPENDIX E – REVENUES FROM PROPOSED EXCISE TAXATION

RSWMP – Task 4 Cost Recovery for Waste Management in Lebanon
ELARD in association with Tebodin Consultancy and Envirotech
Revenues from a Supplemental Excise Tax of 5% on Imports
Commodity Value of
Imports 2001 (Bil LBP)
Value of Imports 2002
(Bil LBP)
Value of Imports 2003
(Bil LBP)
Value of Imports 2004
(Bil LBP)
Average Yearly
Imports (Bil LBP)
Revenue from 5% Excise Tax
(Bil LBP)
Revenue from 5% Excise
Tax Mil $US*
Petroleum / Bituminous Products 1,950.29 1,397.20 1,689.91 2,987.98 2,006.35 100.32 66.88
Motor Vehicles and Engines 1,072.53 862.77 1,049.55 1,271.05 1,063.97 53.20 35.47
Pharmaceutical Products 439.45 502.68 589.74 653.90 546.44 27.32 18.21
Electronic and Electric Products 1,506.49 1,301.03 1,315.78 1,672.54 1,448.96 72.45 48.30
Organic Chemicals: Dyes, pigments, pesticides, … 288.00 281.46 311.78 389.80 317.76 15.89 10.59
Tires 59.17 44.88 51.93 60.96 54.23 2.71 1.81
Tobacco and Tobacco Products 233.45 195.41 181.78 195.30 201.48 10.07 6.72
Asbestos 879.00 1.84 1.84 2.18 221.22 11.06 7.37
Fertilizers 26.46 24.04 27.73 39.63 29.46 1.47 0.98
Total 6,455 4,611 5,220 7,273 5,890 294.49 196.33
Source: Customs Authority, MoF website: www.customs.gov.lb , based on 2001 – 2004 figures
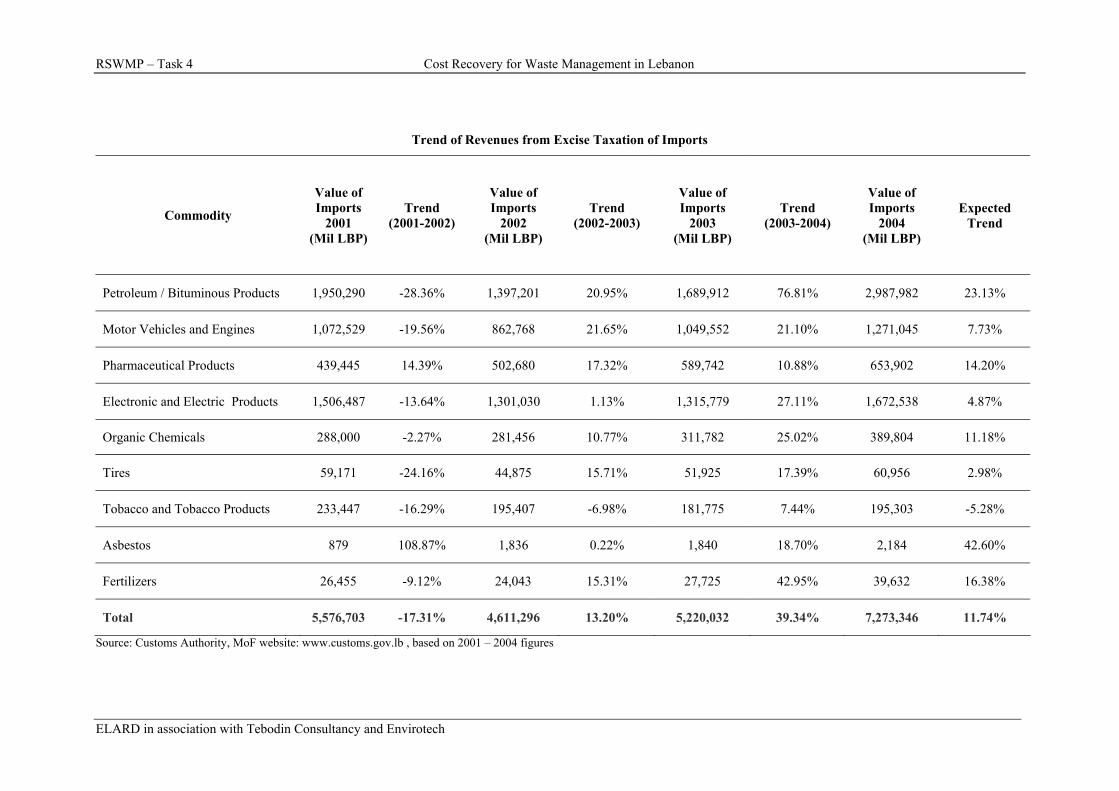
RSWMP – Task 4 Cost Recovery for Waste Management in Lebanon
ELARD in association with Tebodin Consultancy and Envirotech
Trend of Revenues from Excise Taxation of Imports
Commodity
Value of Imports
2001 (Mil LBP)
Trend (2001-2002)
Value of Imports
2002 (Mil LBP)
Trend (2002-2003)
Value of Imports
2003 (Mil LBP)
Trend (2003-2004)
Value of Imports
2004 (Mil LBP)
Expected Trend
Petroleum / Bituminous Products 1,950,290 -28.36% 1,397,201 20.95% 1,689,912 76.81% 2,987,982 23.13%
Motor Vehicles and Engines 1,072,529 -19.56% 862,768 21.65% 1,049,552 21.10% 1,271,045 7.73%
Pharmaceutical Products 439,445 14.39% 502,680 17.32% 589,742 10.88% 653,902 14.20%
Electronic and Electric Products 1,506,487 -13.64% 1,301,030 1.13% 1,315,779 27.11% 1,672,538 4.87%
Organic Chemicals 288,000 -2.27% 281,456 10.77% 311,782 25.02% 389,804 11.18%
Tires 59,171 -24.16% 44,875 15.71% 51,925 17.39% 60,956 2.98%
Tobacco and Tobacco Products 233,447 -16.29% 195,407 -6.98% 181,775 7.44% 195,303 -5.28%
Asbestos 879 108.87% 1,836 0.22% 1,840 18.70% 2,184 42.60%
Fertilizers 26,455 -9.12% 24,043 15.31% 27,725 42.95% 39,632 16.38%
Total 5,576,703 -17.31% 4,611,296 13.20% 5,220,032 39.34% 7,273,346 11.74%
Source: Customs Authority, MoF website: www.customs.gov.lb , based on 2001 – 2004 figures
RSWMP – Task 4 Cost Recovery for Waste Management in Lebanon
ELARD in association with Tebodin Consultancy and Envirotech
APPENDIX F - PROPOSED AMENDMENT TO CUSTOMS LAW
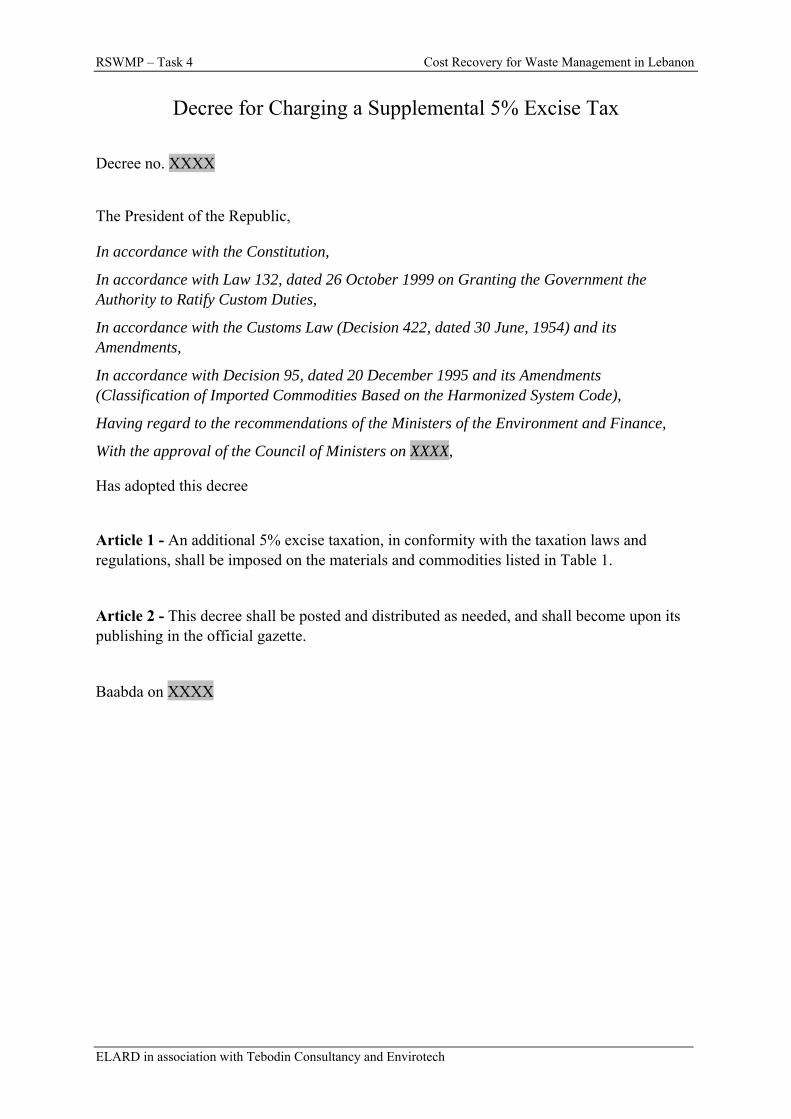
RSWMP – Task 4 Cost Recovery for Waste Management in Lebanon
ELARD in association with Tebodin Consultancy and Envirotech
Decree for Charging a Supplemental 5% Excise Tax
Decree no. XXXX
The President of the Republic,
In accordance with the Constitution,
In accordance with Law 132, dated 26 October 1999 on Granting the Government the Authority to Ratify Custom Duties,
In accordance with the Customs Law (Decision 422, dated 30 June, 1954) and its Amendments,
In accordance with Decision 95, dated 20 December 1995 and its Amendments (Classification of Imported Commodities Based on the Harmonized System Code),
Having regard to the recommendations of the Ministers of the Environment and Finance,
With the approval of the Council of Ministers on XXXX,
Has adopted this decree
Article 1 - An additional 5% excise taxation, in conformity with the taxation laws and regulations, shall be imposed on the materials and commodities listed in Table 1.
Article 2 - This decree shall be posted and distributed as needed, and shall become upon its publishing in the official gazette.
Baabda on XXXX

RSWMP – Task 4 Cost Recovery for Waste Management in Lebanon
ELARD in association with Tebodin Consultancy and Envirotech
:مرسوم رقم
إن رئيس الجمهورية، بناء على الدستور،
م انون رق ى الق اء عل اريخ 132بن شرين 26 ت ل (1999األول ت ي الحق شريع ف ق الت ة ح نح الحكوم م ،)الجمرآي
،) وتعديالته1954 حزيران 30 تاريخ 422القرار رقم (بناء على قانون الجمارك ا للنظام ( وتعديالته 1995 آانون األول 20 تاريخ 95بناء على القرار رقم ة وفق تعريفة الرسوم الجمرآي
، )المنسق الية والبيئة،بناء على اقتراح وزراء الم
...وبعد موافقة مجلس الوزراء في جلسته المنعقدة بتاريخ
:يرسم ما يأتي
م – المادة األولى سلع المحددة في الالئحة رق واد وال ى الم ي عل ة ( ) يفرض رسم استهالك داخل المرفق .وفقا للمعدالت المثبتة تجاه آل منها
. تدعو الحاجة ويعمل به فور نشره بالجريدة الرسمية ينشر هذا المرسوم ويبلغ حيث– المادة الثانية
بعبدا في
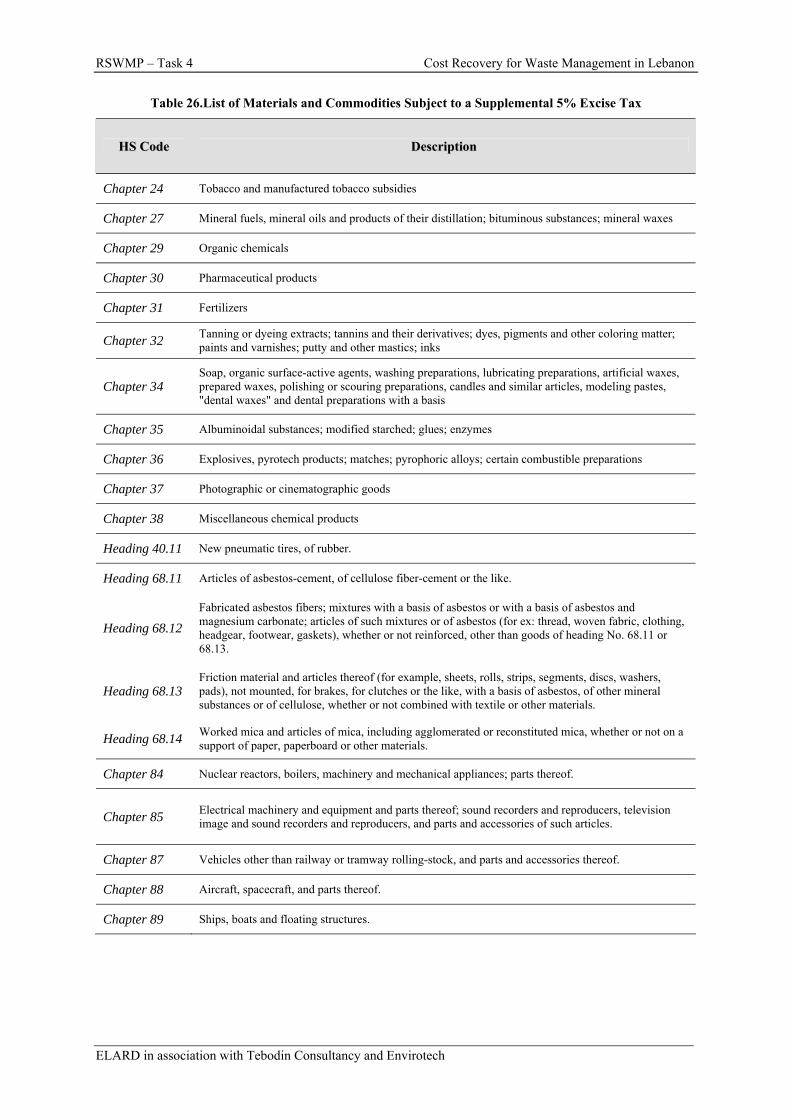
RSWMP – Task 4 Cost Recovery for Waste Management in Lebanon
ELARD in association with Tebodin Consultancy and Envirotech
Table 26.List of Materials and Commodities Subject to a Supplemental 5% Excise Tax
HHSS CCooddee DDeessccrriippttiioonn
Chapter 24 Tobacco and manufactured tobacco subsidies
Chapter 27 Mineral fuels, mineral oils and products of their distillation; bituminous substances; mineral waxes
Chapter 29 Organic chemicals
Chapter 30 Pharmaceutical products
Chapter 31 Fertilizers
Chapter 32 Tanning or dyeing extracts; tannins and their derivatives; dyes, pigments and other coloring matter; paints and varnishes; putty and other mastics; inks
Chapter 34 Soap, organic surface-active agents, washing preparations, lubricating preparations, artificial waxes, prepared waxes, polishing or scouring preparations, candles and similar articles, modeling pastes, "dental waxes" and dental preparations with a basis
Chapter 35 Albuminoidal substances; modified starched; glues; enzymes
Chapter 36 Explosives, pyrotech products; matches; pyrophoric alloys; certain combustible preparations
Chapter 37 Photographic or cinematographic goods
Chapter 38 Miscellaneous chemical products
Heading 40.11 New pneumatic tires, of rubber.
Heading 68.11 Articles of asbestos-cement, of cellulose fiber-cement or the like.
Heading 68.12 Fabricated asbestos fibers; mixtures with a basis of asbestos or with a basis of asbestos and magnesium carbonate; articles of such mixtures or of asbestos (for ex: thread, woven fabric, clothing, headgear, footwear, gaskets), whether or not reinforced, other than goods of heading No. 68.11 or 68.13.
Heading 68.13 Friction material and articles thereof (for example, sheets, rolls, strips, segments, discs, washers, pads), not mounted, for brakes, for clutches or the like, with a basis of asbestos, of other mineral substances or of cellulose, whether or not combined with textile or other materials.
Heading 68.14 Worked mica and articles of mica, including agglomerated or reconstituted mica, whether or not on a support of paper, paperboard or other materials.
Chapter 84 Nuclear reactors, boilers, machinery and mechanical appliances; parts thereof.
Chapter 85 Electrical machinery and equipment and parts thereof; sound recorders and reproducers, television image and sound recorders and reproducers, and parts and accessories of such articles.
Chapter 87 Vehicles other than railway or tramway rolling-stock, and parts and accessories thereof.
Chapter 88 Aircraft, spacecraft, and parts thereof.
Chapter 89 Ships, boats and floating structures.

RSWMP – Task 4 Cost Recovery for Waste Management in Lebanon
ELARD in association with Tebodin Consultancy and Envirotech
APPENDIX G - PROPOSED AMENDMENT TO MUNICIPALITY LAW – RENTAL VALUE OF PROPERTY

RSWMP – Task 4 Cost Recovery for Waste Management in Lebanon
ELARD in association with Tebodin Consultancy and Envirotech
Amendment to Law of the Municipalities to Increase Municipal Charge on the Rental Value of Property
Decree no. XXXX
Concerning Municipal Charge on the Rental Value of Property:
Article 12 of Law of the Municipalities no. 60/1988, dated 8/12/1988, is amended as follows:
Article 12 - The values of the municipal charges on the rental value of property are as follows:
− A charge of 6.5% for residential property, with a minimum yearly value of LBP 50,000.
− A charge of 8.5% for non-residential property, with a minimum yearly value of LBP 100,000.
:مرسوم رقم
:في الرسم على القيمة التأجيرية
:، ويصبح آما يلي)60/1988قانون رقم ( من قانون الرسوم البلدية 12يعدل نص المادة
: تحدد معدالت الرسم على القيمة التأجيرية آما يلي– 12المادة
.لالماآن المستعملة للسكن % 6.5 .لالماآن المستعملة لغير السكن% 8.5
سنوي المفروض في آل تكليف عن على دار الرسم ال رة . ل.ل/ 50.000/ أن ال يقل مق خمسين ألف لي
ستعملة . ل.ل/ 100.000/ لبنانية في األماآن المستعملة للسكن وعن اآن الم ة في األم رة لبناني مئة ألف لي .لغير السكن
RSWMP – Task 4 Cost Recovery for Waste Management in Lebanon
ELARD in association with Tebodin Consultancy and Envirotech
APPENDIX H - PROPOSED AMENDMENT TO MUNICIPALITY LAW – CHARGES ON UTILITY BILLS
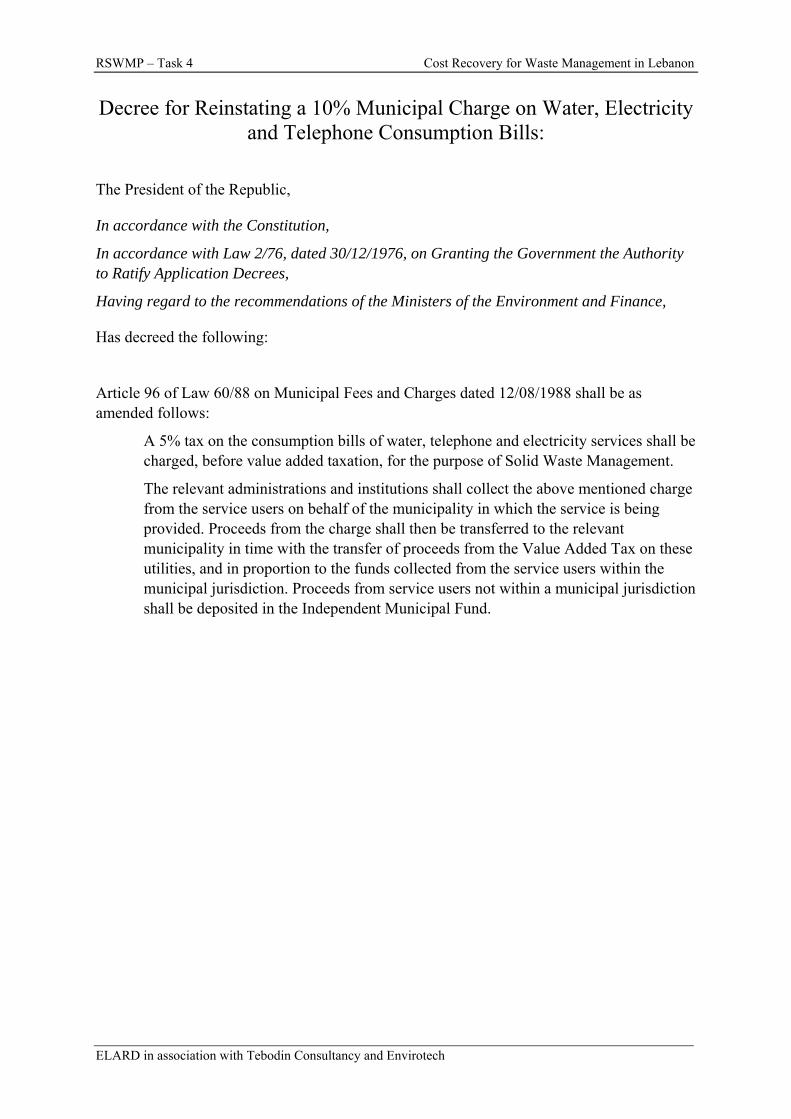
RSWMP – Task 4 Cost Recovery for Waste Management in Lebanon
ELARD in association with Tebodin Consultancy and Envirotech
Decree for Reinstating a 10% Municipal Charge on Water, Electricity and Telephone Consumption Bills:
The President of the Republic,
In accordance with the Constitution,
In accordance with Law 2/76, dated 30/12/1976, on Granting the Government the Authority to Ratify Application Decrees,
Having regard to the recommendations of the Ministers of the Environment and Finance,
Has decreed the following:
Article 96 of Law 60/88 on Municipal Fees and Charges dated 12/08/1988 shall be as amended follows:
A 5% tax on the consumption bills of water, telephone and electricity services shall be charged, before value added taxation, for the purpose of Solid Waste Management.
The relevant administrations and institutions shall collect the above mentioned charge from the service users on behalf of the municipality in which the service is being provided. Proceeds from the charge shall then be transferred to the relevant municipality in time with the transfer of proceeds from the Value Added Tax on these utilities, and in proportion to the funds collected from the service users within the municipal jurisdiction. Proceeds from service users not within a municipal jurisdiction shall be deposited in the Independent Municipal Fund.
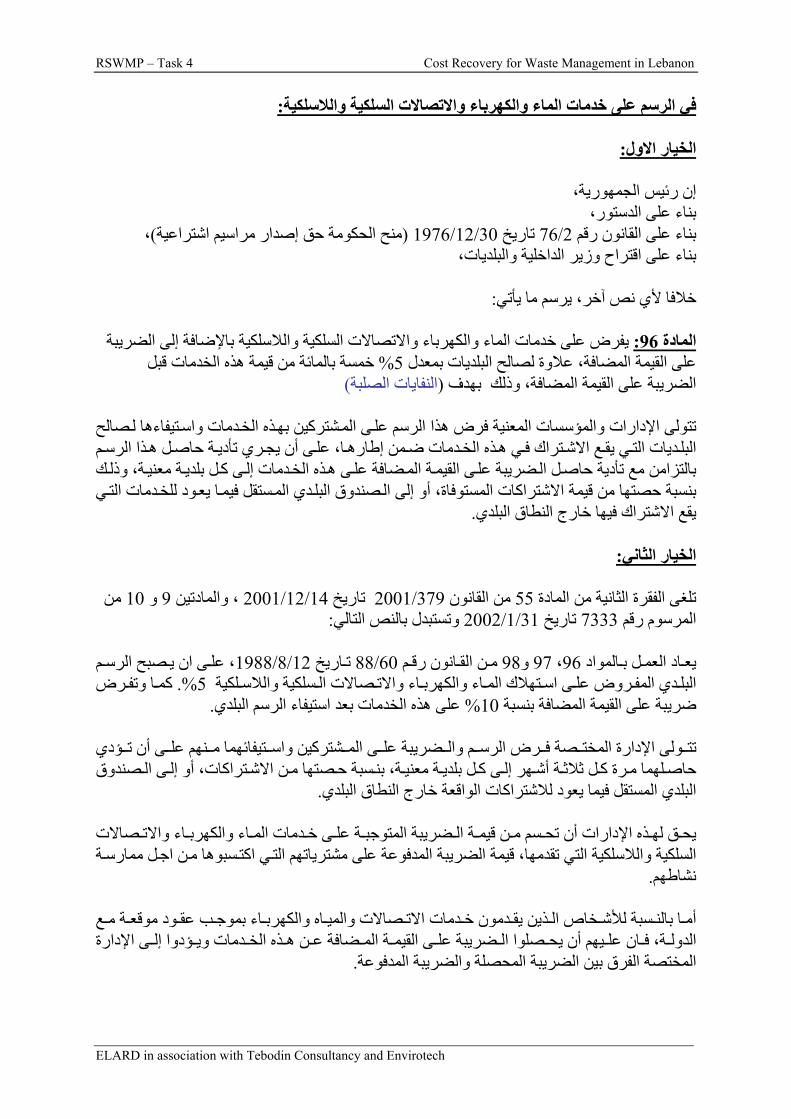
RSWMP – Task 4 Cost Recovery for Waste Management in Lebanon
ELARD in association with Tebodin Consultancy and Envirotech
:الكهرباء واالتصاالت السلكية والالسلكيةفي الرسم على خدمات الماء و
:الخيار االول
إن رئيس الجمهورية، بناء على الدستور،
،)منح الحكومة حق إصدار مراسيم اشتراعية (30/12/1976 تاريخ 2/76بناء على القانون رقم بناء على اقتراح وزير الداخلية والبلديات،
:يرسم ما يأتيخالفا ألي نص آخر،
خدمات الماء والكهرباء واالتصاالت السلكية والالسلكية باإلضافة إلى الضريبة يفرض على :96دة الما
خمسة بالمائة من قيمة هذه الخدمات قبل % 5على القيمة المضافة، عالوة لصالح البلديات بمعدل )النفايات الصلبة(الضريبة على القيمة المضافة، وذلك بهدف
صالح تتولى اإلدارات والمؤس تيفاءها ل ذه الخدمات واس شترآين به ى الم سات المعنية فرض هذا الرسم عل
م ذا الرس ة حاصل ه ى أن يجري تأدي ا، عل ذه الخدمات ضمن إطاره ي ه تراك ف ع االش ي يق ديات الت البلك ة، وذل ة معني ى آل بلدي ذه الخدمات إل ى ه ة المضافة عل ى القيم ضريبة عل بالتزامن مع تأدية حاصل ال
ود للخدمات التي بنسبة حص ا يع ستقل فيم دي الم صندوق البل تها من قيمة االشتراآات المستوفاة، أو إلى ال .يقع االشتراك فيها خارج النطاق البلدي
:الخيار الثاني
من 10 و 9 ، والمادتين 14/12/2001 تاريخ 379/2001 من القانون 55تلغى الفقرة الثانية من المادة
: وتستبدل بالنص التالي31/1/2002خ تاري7333المرسوم رقم
المواد ل ب اد العم م 98 و97، 96يع انون رق ن الق اريخ 60/88 م م 12/8/1988 ت صبح الرس ى ان ي ، عللكية سلكية والالس صاالت ال اء واالت اء والكهرب تهالك الم ى اس روض عل دي المف رض %. 5البل ا وتف آم
.مات بعد استيفاء الرسم البلديعلى هذه الخد% 10ضريبة على القيمة المضافة بنسبة
ؤدي ى أن ت نهم عل تيفائهما م شترآين واس ى الم ضريبة عل م وال رض الرس صة ف ولى اإلدارة المخت تتصندوق ى ال تراآات، أو إل ن االش سبة حصتها م ة، بن ة معني ل بلدي ى آ ة أشهر إل ل ثالث رة آ حاصلهما م
.اق البلديالبلدي المستقل فيما يعود لالشتراآات الواقعة خارج النط
صاالت اء واالت اء والكهرب دمات الم ى خ ة عل ضريبة المتوجب ة ال ن قيم سم م ذه اإلدارات أن تح ق له يحسبوها من اجل ممارسة السلكية والالسلكية التي تقدمها، قيمة الضريبة المدفوعة على مشترياتهم التي اآت
.نشاطهم
صاالت وا دمات االت دمون خ ذين يق خاص ال سبة لألش ا بالن ع أم ة م ود موقع اء بموجب عق اه والكهرب لميى اإلدارة ؤدوا إل دمات وي ذه الخ ن ه ضافة ع ة الم ى القيم ضريبة عل صلوا ال يهم أن يح ان عل ة، ف الدول
.المختصة الفرق بين الضريبة المحصلة والضريبة المدفوعة
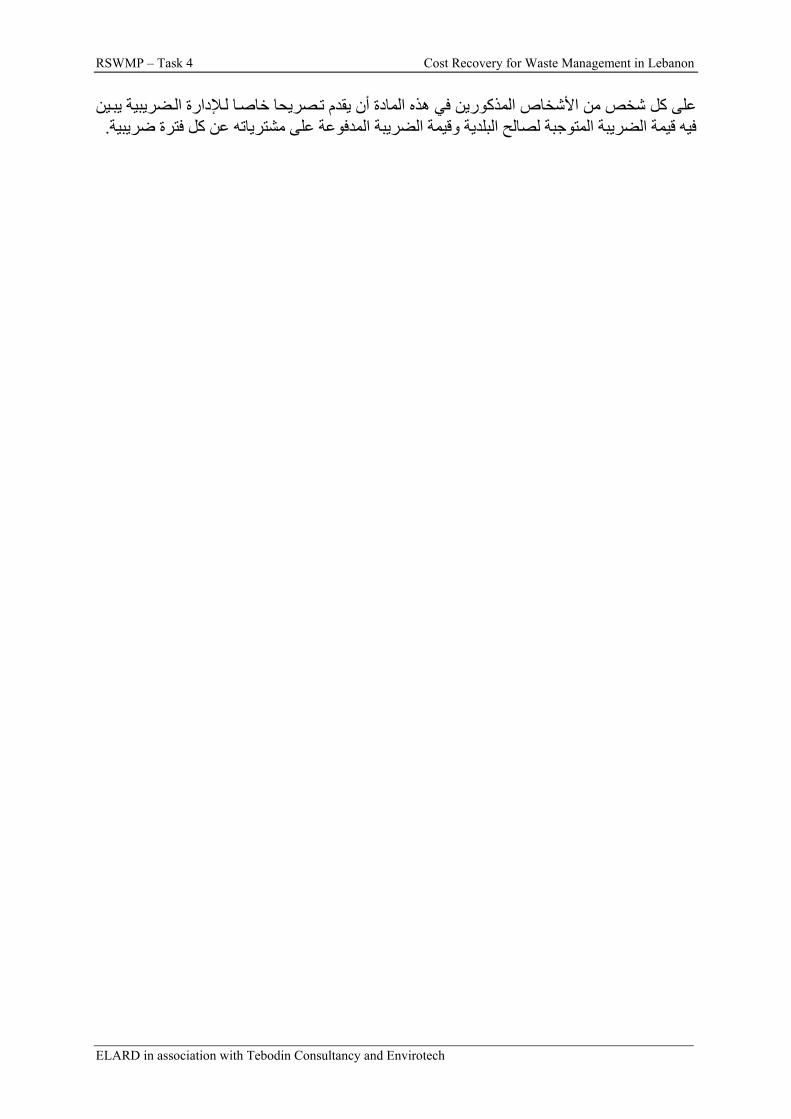
RSWMP – Task 4 Cost Recovery for Waste Management in Lebanon
ELARD in association with Tebodin Consultancy and Envirotech
إلدارة الض ين على آل شخص من األشخاص المذآورين في هذه المادة أن يقدم تصريحا خاصا ل ريبية يب .فيه قيمة الضريبة المتوجبة لصالح البلدية وقيمة الضريبة المدفوعة على مشترياته عن آل فترة ضريبية