cost-sharing and use of health services in italy: evidence ...ftp.iza.org/dp9772.pdf · health...
TRANSCRIPT

Forschungsinstitut zur Zukunft der ArbeitInstitute for the Study of Labor
DI
SC
US
SI
ON
P
AP
ER
S
ER
IE
S
Cost-Sharing and Use of Health Services in Italy:Evidence from a Fuzzy Regression Discontinuity Design
IZA DP No. 9772
February 2016
Michela PonzoVincenzo Scoppa
Cost-Sharing and Use of Health Services
in Italy: Evidence from a Fuzzy Regression Discontinuity Design
Michela Ponzo University of Naples “Federico II”
Vincenzo Scoppa
University of Calabria and IZA
Discussion Paper No. 9772 February 2016
IZA
P.O. Box 7240 53072 Bonn
Germany
Phone: +49-228-3894-0 Fax: +49-228-3894-180
E-mail: [email protected]
Any opinions expressed here are those of the author(s) and not those of IZA. Research published in this series may include views on policy, but the institute itself takes no institutional policy positions. The IZA research network is committed to the IZA Guiding Principles of Research Integrity. The Institute for the Study of Labor (IZA) in Bonn is a local and virtual international research center and a place of communication between science, politics and business. IZA is an independent nonprofit organization supported by Deutsche Post Foundation. The center is associated with the University of Bonn and offers a stimulating research environment through its international network, workshops and conferences, data service, project support, research visits and doctoral program. IZA engages in (i) original and internationally competitive research in all fields of labor economics, (ii) development of policy concepts, and (iii) dissemination of research results and concepts to the interested public. IZA Discussion Papers often represent preliminary work and are circulated to encourage discussion. Citation of such a paper should account for its provisional character. A revised version may be available directly from the author.

IZA Discussion Paper No. 9772 February 2016
ABSTRACT
Cost-Sharing and Use of Health Services in Italy: Evidence from a Fuzzy Regression Discontinuity Design*
We use a Regression Discontinuity Design (RDD) to evaluate the impact of cost-sharing on the use of health services. In the Italian health system, individuals reaching age 65 and earning low incomes are given total exemption from cost-sharing for health services consumption. Since the probability of exemption changes discontinuously at age 65, we use a Fuzzy RDD in which the age threshold is used as an instrument for exemption. We find that prescription drug consumption, specialist visits and diagnostic checks remarkably increase with exemption. However, using several measures of health outcomes we do not find any change in individual health. JEL Classification: I10, I13, I11, I18, C26 Keywords: health insurance, healthcare demand, cost-sharing, moral hazard,
health outcomes, fuzzy regression discontinuity design, instrumental variables Corresponding author: Vincenzo Scoppa Department of Economics, Statistics and Finance University of Calabria Via Ponte Bucci 87036 Arcavacata di Rende (CS) Italy E-mail: [email protected]
* We would like to thank Guido de Blasio, Giuliana De Luca, Maria De Paola, Sabrina Giordano, Tullio Jappelli, Luca Mo Costabella, Marco Sisti, for useful comments and suggestions.

2
1. Introduction
The problem of moral hazard in health insurance has a long tradition, starting from Arrow (1963),
Zeckhauser (1970) and Feldstein (1973). When individuals are insured they tend to consume more of
the health services than they would if they had to pay the whole price (“overconsumption”). Cost-
sharing is the typical instrument used to tackle the problem of overconsumption, leading to a classical
trade-off between appropriate incentives and risks borne by agents.
Estimating empirically the effect of insurance coverage and cost-sharing on medical utilization
and on health outcomes is a thorny issue, since the extent of insurance coverage of individuals is not
randomly assigned and typically in observational studies individuals with different coverage differ
along observable and unobservable characteristics that also determine the demand for health services
and their health outcomes.
To overcome these problems, in this paper we aim to provide evidence on the effects of cost-
sharing on prescription drug consumption, specialist visits and diagnostic checks exploiting a
discontinuity, based on age, for the access to exemption from cost-sharing in the Italian National
Health System.
The National Health System in Italy provides universal, largely subsidized, health care
coverage to all residents. To address individuals’ moral hazard some system of cost-sharing – in the
form of copayment – is used for prescription drugs, specialist visits and diagnostic checks. However,
individuals aged 65 or more, with an income below a threshold level, are entitled, for equity reasons,
to complete exemption from cost-sharing. Therefore, to evaluate the extent of moral hazard problems
in Italy we compare the demand of health services of individuals exempted from cost-sharing with
individuals not exempted from cost-sharing and then we carry out the same comparison as regards
some health outcomes. To avoid estimation biases arising from the possible correlation of the
exemption status with some determinants of the demand of health services, we adopt an Instrumental
Variables estimation strategy using as an instrument for exemption the threshold of 65 years that in
Italy allow most individuals to be exempted. The estimation strategy corresponds to a Fuzzy
Regression Discontinuity Design (Angrist and Pischke, 2009).
While in general individuals with different insurance coverage could differ for many
characteristics, in our context individuals slightly above or below the age of 65 are very similar in
terms of health and other characteristics and, therefore, any jump in the relationship linking utilization
of health services and age close to the cutoff can be taken as evidence of a treatment effect. Along the
same line, jumps in the relationship between health outcomes and age can be seen as the effect of
exemption on health.
Our paper is related to a large body of research trying to evaluate, mainly for the US, how the
demand for health care services is responsive to prices and then how different levels of health services
are associated to health outcomes.

3
The most rigorous evidence comes from two very well-known experiments conducted in the
US. The RAND Health Insurance Experiment (HIE) is a randomized experiment conducted in the
mid-1970s. It involved almost 4,000 individuals and randomly assigned families to one of 14 different
insurance plans that differed in cost sharing and out-of-pocket limit and provided convincing evidence
that health care demand is sensitive to the price (with an elasticity of about –0.2) and that individuals’
health does not improve when health care increases (Manning et al., 1987; Newhouse, 1993).1 In
another famous and more recent experiment, carried out in Oregon in 2008, a group of uninsured low-
income individuals were selected randomly and given public health insurance as Medicaid (Finkelstein
et al., 2012). The treatment group with access to public health insurance showed significantly higher
health care utilization (emergency department visits, prescription drugs, hospitalization) than the
control group. The greater utilization of health services led to marginally better self-reported physical
health and considerably improved mental health for the treated.
A few natural experimental studies have tried to evaluate how demand for health care services
depend on prices. Cherkin, Grothaus and Wagner (1989) analyze a natural experiment consisting in
the introduction of a $5 copayment rate for state employees in Washington in the mid-1980s, while no
change occurred for federal employees. The authors find a considerable reduction in primary and
specialty care visits for treated. Similarly, Selby, Fireman and Swain (1996) find a significant drop
(–15%) in the use of the emergency department after the introduction of a copayment for some
employees relative to a control group of employees for whom the copayment did not increase.
Goldman et al. (2004), Landsman et al. (2005) and Tamblyn et al. (2001) Gaynor, Li and Vogt (2007)
find that prescription drug use is price sensitive, with elasticities ranging from –0.1 (for essential drugs
or drugs related to chronic conditions) to –0.4.
Some studies have tried to verify the effects on health of a reduction in demand for health
care: Hiesler et al. (2004) and Piette et al. (2004) show that health is worse for individuals using less
prescription drugs because of their high costs, while Schoen et al. (2001) find that poor patients have
better health thanks to the provision of free prescription drugs. Tamblyn et al. (2001) find that, after
the introduction of cost-sharing, hospitalizations for the elderly increased significantly.
While many of previous studies focused on non-elderly, Chandra, Gruber, and McKnight
(2010) study the effects of copayment increases for prescription drugs and physician visits on retired
public employees in California and find a reduction in prescriptions and visits. However, an adverse
effect emerged on the health of chronically ill individuals, with a subsequent rise in hospital care.2
1 However, the small treatment groups make hard to statistically compare outcomes and the high number of drop-outs and large differences in attrition rates between groups undermine the internal validity of the experiment (Angrist and Pischke, 2015). 2 The consumption of public and private health services for Italy in relation to their costs and substitutability have been examined in Fabbri and Monfardini (2009) and Atella and Deb (2008). Fabbri and Monfardini (2009) investigate the role of waiting times and charges on the consumption of public and private specialist visits. Although they find that waiting times and charges, respectively, reduce the demand for public and private specialist care, the cross-elasticities are not statistically significant and hence there is no substitution effect between the demand for public and private specialists. Charges only act as a deterrent to consumption in the

4
Recently, some studies use Regression Discontinuity Designs to estimate the impact of
insurance coverage on the use of emergency departments and hospitals. Anderson, Dobkin and Gross
(2012) exploit the threshold of individuals aged 19 “aging out” of their parents’ insurance plans,
while Anderson, Dobkin and Gross (2014) compare individuals just younger and older than 23, the
threshold after which students are no longer eligible for their parents’ health insurance. In both papers
the authors find that the uninsured drastically reduce emergency department visits and hospital
admissions.
Two recent papers of Card, Dobkin and Maestas (2008; 2009) – which are closely related to
our work – carry out RD analyses for the US exploiting the fact that at age 65 people become eligible
for Medicare. Insurance coverage jumps from 90% to 98% at age 65 for the population as a whole and
people transit from private to public insurance. Card, Dobkin and Maestas (2008) analyze hospital
admissions in three American states and find large increases in hospitalization rates at age 65 but with
heterogeneous responses across socioeconomic groups and type of service. Doctor visits increase more
for groups that previously lacked insurance, while hospital admissions for expensive procedures
increase more for previously insured groups with supplementary coverage. Card, Dobkin and Maestas
(2009) find that admission rates in hospitals and comorbidities of severely ill individuals below or
above age 65 are similar, but patients older than 65 receive a significantly higher number of services in
the hospital. Furthermore, the mortality rate of individuals aged 65 eligible for Medicare is also
significantly lower.3
Almost all of the randomized and natural experimental studies have been conducted in the US
while other health systems suffer from a lack of rigorous empirical evidence. The Italian National
Health System is very different from the US system and it is interesting to analyze the effects of cost-
sharing on healthcare demand in this context. In fact, while healthcare services are costly to patients
even under Medicare (prescription drugs and routine checks were not exempted until recently), some
categories of individuals in the Italian system are given complete exemption from health services
costs. Therefore, we are able to investigate how the demand for several health services is affected by
variations in the copayment, with no other change in the insurance status.
Using the described Fuzzy RDD, we find that individuals with exemption from cost-sharing –
because they are just above the threshold of 65 – use significantly more health care services than
individuals just below the threshold: specialist visits and diagnostic checks increase by more than 50
percent, while the use of prescription drugs raises of about 15-20 percent. However, we show that
private sector which is not substituted for more public care. Atella and Deb (2008) examine the relationships between health care visits to general practitioners or public and private sector specialists. General practitioners and public and private specialists are found to be substitute sources of medical care. 3 Other works finding that Medicare leads to an increase in the use of health services are Dow (2004) – who compares changes in hospitalization rates from the period before the introduction of Medicare to the period after its introduction finding an increase among individuals older than 65 – and McWilliams et al. (2007) – who show an increase of hospitalizations and doctor visits among previously uninsured individuals with previous health problems. See Carrieri (2010) for a review of the literature.

5
health outcomes do not differ for people around the threshold in terms of the probability of incurring
serious health problems, subjective perceived health and probability of going to the hospital.
The evidence on the high responsiveness of health services demand is relevant from a policy
point of view to tackle the problem of an excessive growth of health spending, especially if the recent
trends of increasing life expectancy, ageing population and supply of new pharmaceuticals and new
tests will continue in the future.
The paper is organized as follows. In Section 2 we briefly describe the Italian National Health
System and the dataset used in the empirical analysis. Section 3 presents the estimation strategy
adopted and the estimation results for specialist visits and diagnostic checks. Section 4 examines the
impact on prescription drug consumption, distinguishing the effects among regions applying the
copayment and those not applying it. Section 5 presents the RD analysis to investigate the effects on
health outcomes. Section 6 concludes.
2. The Italian National Health System and the Data
The Italian National Health system (NHS) provides universal and largely free health care coverage to
all residents. Specifically, the NHS entitles residents to visit a General Practitioner (called “family
doctor”) and a pediatrician. This allows patients to undergo free outpatient and in-home medical
examinations and to obtain prescriptions for drugs, specialist medical services and diagnostic tests.
Residents are allowed to undergo free hospital accommodation and treatments (including tests, surgery
and medication during hospitalization), and other services at a local health unit (“Consultorio”). The
NHS is mostly under the control of the 20 regional governments, although the general framework is
designed at the national level.
Drugs are strongly subsidized when prescribed by a General Practitioner (GP). Individuals are
required to pay as a copayment only a small fraction of the price – the so called “Ticket”. Currently,
the cost to the patient is based on a rather complex structure and differ from one region to another. In
most of the regions, the copayment is required for everyone except for those who are entitled to
complete exemption, that is, patients with disabilities, chronic diseases, older than 65 years with low
income, unemployed. The amount – which depends on the type of medicine and on clinical
effectiveness – is on average 2€ for each prescription and 4€ for each drug package. In some other
regions – which we call “Regions without Copayment” (Valle d’Aosta, Friuli Venezia Giulia, Emilia
Romagna, Toscana, Marche, Umbria, Basilicata, Sardegna) – under the prescription of a GP drugs are
completely free for all.
Specialist visits can be typically prescribed by a GP and require a copayment of around €36
for visit, applied in all the regions with small variations on the amount – except in the cases of
exemption based on age, income and health status described above. The same mechanism is applied
for diagnostic tests, for whom copayment depends on the type of test.

6
Surgeries and hospitalization provided by any public or private accredited hospitals are
completely free of charge for everyone. Hospital admission occurs when prescribed by a GP. Patients
are given free choice about the preferred structure. Emergency care expenses are also on charge of the
NHS (a copayment is required for cases judged as not urgent).
Cost-sharing schemes – extensively applied since 1978 when the NHS was introduced – were
aimed at introducing the principle of universality and equitable access to primary care to all residents,
but at the same time they represent an instrument to protect against moral hazard and discourage
overconsumption of health services and a way to raise public revenues.
The specific rule that we exploit for our empirical analysis is that as individuals get 65 or older
and the (gross) income level of their family does not exceed 36,150 euros in the last year, they become
exempted by the copayment for prescription drug consumption, specialist visits and diagnostic tests. It
is worthwhile to note that the exemption is not a deterministic function of age, since from one hand
individuals can be exempted before age 65 in case of permanent health problems or unemployment
status and, on the other hand, are not entitled to the exemption after 65 if their family income is above
the threshold level.
For specialist visits and diagnostic tests we run a standard Fuzzy RDD consisting in an IV
analysis using as an instrument for the exemption status the 65 age threshold. To identify the effect of
exemption from cost-sharing on prescription drug consumption, we exploit an additional characteristic
of the Italian system: copayment is used in some regions but not in others. We carry out our RD
analyses on the two sets of regions and we find that the threshold of age 65 for exemption – as
expected – affects drug consumption in regions with copayment but has no effect in regions without
copayment. This reassures us that the effect of age 65 is the result of exemption and is not related to
some spurious correlation of age with some unobservable factor.
The dataset we use for our empirical analysis is the latest available wave (conducted between
2012 and 2013) of the Survey “Italian Health Conditions and Use of Health Services” provided by the
Italian National Statistical Office (ISTAT). This survey is conducted on a nationally representative
sample of 49,811 households for a total of 119,073 individuals and collects a wide range of
information on individual demographic and socio-economic characteristics – age, gender, education,
marital status, citizenship, main activity, region of residence, etc. – health conditions and use of health
services.
We restrict our sample to individuals aged between 25 and 84 years. This leaves us with a
sample of 87,685 observations. However, we estimate all our regressions on three symmetric windows
across the threshold of age 65:
1) Window 1: age between 50 to 79 (43,934 obs.);
2) Window 2: age between 55 to 74 (29,618 obs.);
3) Window 3: age between 60 to 69 (15,004 obs.).
7
Our main variables are built as follows. Age65 is a dummy equal to one if an individual is
aged 65 or older. Prescription Drug Consumption is a dummy variable taking the value of one if an
individual made use of prescription drugs in the latest two weeks prior to the interview and zero
otherwise. Specialist Visits is a dummy variable taking the value of one if an individual undertook at
least one specialist medical visit in the latest four weeks and zero otherwise.4 Diagnostic Tests
represents the number of laboratory diagnostic tests (blood tests, urine tests, pap tests, etc.) carried out
in the latest four weeks.
Exemption is a dummy equal to one if an individual declares to have total exemption from the
copayment or “Ticket” (no costs for health services).
Serious Health Problems is a dummy equal to one if an individual had some health problems
that limited daily activities in the latest four weeks. Health Status is a variable taking values from 1
(“very bad”) to 5 (“very good”) indicating self-evaluated health status.
Descriptive statistics are reported in Table 1. About 18% of individuals in the main sample are
completely exempted from cost-sharing; 56% used prescription drugs recently; 16% visited a
specialist; 0.30 are the average diagnostic tests carried out. 12.6% had serious health problems; Health
status has a mean of 3.7, almost 8% report to have a bad health while about 64% has a good or very
good health.
Among individual characteristics, we take into account Age (52.9 is the average age; 26.8%
are 65 or older), gender (females are 52%), Education 5 (10 years on average); Married (if the
respondent is currently married or cohabiting, 65%); Immigrant (if foreign citizen, 5.6%); dummies
for the main activity: Employed, Unemployed, Retired, Other Non-Labor Force; 20 dummies for
region of residence (42% are from Northern regions; 18% from Center and 40% from South); BMI is
the Body Mass Index (mean: 25.4); Disability is equal to one if the individual suffers for some
disabilities (blindness, deafness, impaired mobility, and so on).
The dataset does not provide objective measures of family income but has a self-evaluation of
economic resources on a four level scale (very good, adequate, poor, insufficient) and we control for
the corresponding dummies. Finally, we control for quarterly dummies to take into account seasonal
effects.
4 The specialist visits that we consider are: cardiology; orthopedics; gastroenterology; otolaryngology; eye exam; geriatrics; endocrinology; psychiatry and psychotherapy; dermatological; venereology; obstetrics and gynecology; neurology; urology. 5 Following a common practice, we use education as a discrete variable and recode education considering the years necessary to attain a given educational level. Education is set at zero for no educational qualification; 3 for some primary school; 5 for primary school; 8 for middle school; 11 for some High School; 13 for High School; 16 for First Level Degree, 18 for Second Level Degree and 21 for postgraduate qualification.

8
Table 1. Descriptive Statistics
Variable Mean Std. Dev. Min Max Obs Exemption 0.180 0.385 0 1 87685 Prescription Drug Consumption 0.560 0.496 0 1 87685 Specialist Visits 0.163 0.370 0 1 87685 Diagnostic Tests 0.302 0.854 0 5 87685 Serious Health Problems 0.126 0.332 0 1 87685 Health Status 3.693 0.848 1 5 87685 Age 52.928 15.723 25 84 87685 Age>=65 0.268 0.443 0 1 87685 Female 0.522 0.500 0 1 87685 Education 10.056 4.280 0 21 87685 Married 0.648 0.478 0 1 87685 Immigrant 0.055 0.227 0 1 87685 Employed 0.462 0.498 0 1 87685 Retired 0.246 0.431 0 1 87685 Unemployed 0.093 0.290 0 1 87685 Other Non-Labor Force 0.199 0.399 0 1 87685 BMI 25.365 4.424 12.457 163.966 87685 Disability 0.066 0.249 0 1 87685 Dataset: Survey “Italian Health Conditions and Use of Health Services” (2012-2013) ISTAT.
3. Cost-Sharing Exemption and the Demand for Healthcare Services
3.1. The Estimation Strategy
To deal with endogeneity problems, as is standard in the literature, we follow an Instrumental Variable
estimation strategy. Thanks to the cutoff rule adopted in the NHS to give exemption from cost-sharing
it is possible to evaluate the effects of exemption by using a Fuzzy Regression Discontinuity Design
and by considering the dummy Age65 as an instrument for the exemption. Therefore, in our
framework the treatment status is probabilistically determined as a discontinuous function of age (Lee
and Lemieux, 2010; Angrist and Pischke, 2009).
Following most of the papers in the literature, we use a parametric approach. Formally, we
estimate the following model:
[1] iiiii XAgefExemptionY 210
[2] iiiii XAgegAgeExemption 210 65
where iY is a measure of health services utilization (specialist visits, diagnostic checks, prescription
drug consumption) of individual i; as explained above, iExemption is a dummy variable representing
complete exemption from cost-sharing; iAgef and iAgeg are two flexible functional forms
relating Age, respectively, to health services usage and iExemption ; iX is a vector of individual
characteristics (gender, years of education, immigrant, marital status, region of residence, working

9
conditions, subjective evaluations of economic resources, disabilities, etc.), that we use to increase the
precision of estimates; i and i are random error terms.
Equation [2] represents the first stage of the relationship between the probability of receiving
exemption from cost-sharing and Age. The parameter 1 estimates the effect of Age65 on the effective
Exemption.
Equation [1] assumes that health services demand is related to Age, since individuals at
different age tend to use different amounts of health services. However, the relationship between
health services consumption and age can be estimated by using a smooth function. Under the
assumption that the relationship between the outcome variables and Age is continuous in a
neighborhood of the cutoff point, any jump in the dependent variable due to exemption in proximity to
the cutoff point can be interpreted as evidence of a treatment effect. Therefore, the parameter 1
measures the causal impact of Exemption on health care use.
3.2. Impact of Cost-Sharing Exemption on Specialist Visits
We first examine the impact of exemption on the probability of undertaking a specialist visit. As
explained above, we use a parametric approach and run several IV regressions, controlling for
different polynomial of age and for a number of variables that could affect the probability of health
services usage.
In column (1) of Table 2 we control only for Age, while in columns (2) and (3) we control,
respectively, for a quadratic and cubic polynomial of Age. Starting from column (4) we control for a
number of variables that could be both correlated to the exemption status and affecting health services
demand: in column (4) we control for Female, years of Education, Married, Immigrant. In addition,
we include 20 regional dummies, to take into account regional differences in health and health
services, and dummies for quarters to capture seasonal effects. In column (5) we add controls for
employment condition (Retired, Unemployed, Other Non-Labor Force, leaving as reference category
Employed) and three dummies for income levels, subjectively evaluated (the lowest category of
income is the reference). Finally, in column (6) we add controls for BMI and for Disability.
In all the regressions we run Standard Errors are robust to heteroskedasticity and allowed for
clustering at the Age level (Lee and Card, 2008). All the regressions are weighted by sampling
weights.
First Stage Results
Let us consider First Stage results, reported in Panel B of Table 2. We show that reaching age 65
increases the probability of exemption of about 23 percentage points. The magnitude of the effect is
10
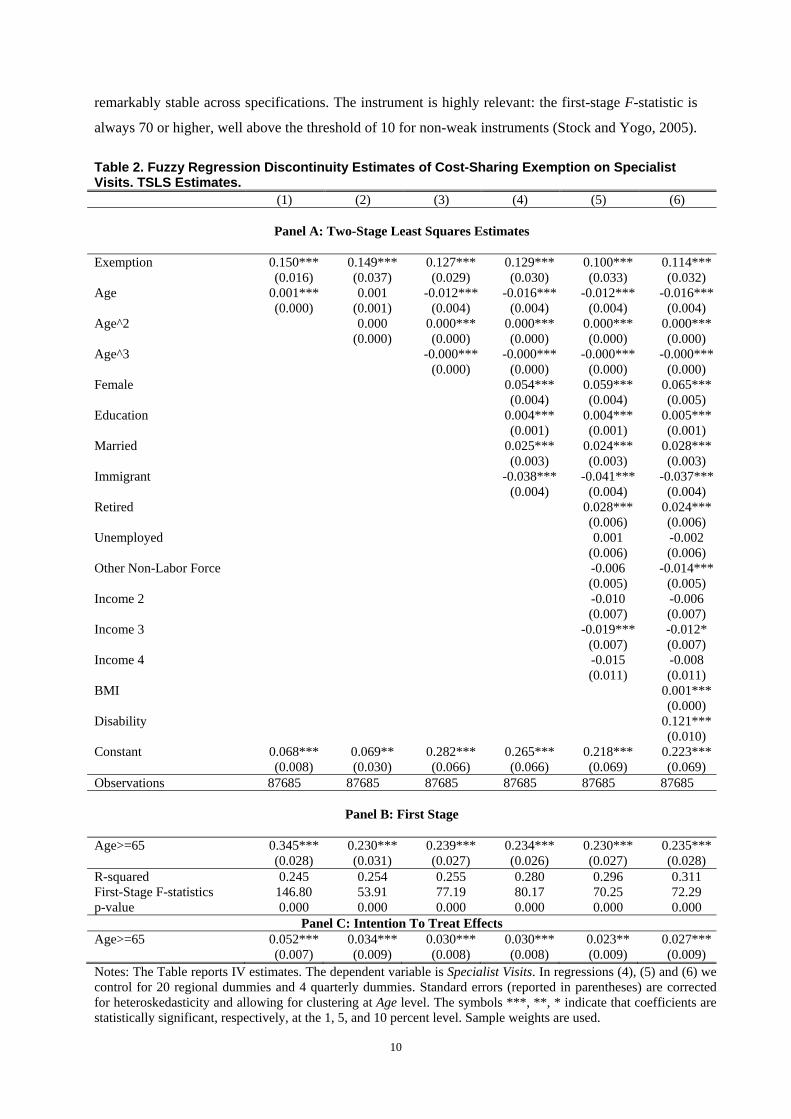
remarkably stable across specifications. The instrument is highly relevant: the first-stage F-statistic is
always 70 or higher, well above the threshold of 10 for non-weak instruments (Stock and Yogo, 2005).
Table 2. Fuzzy Regression Discontinuity Estimates of Cost-Sharing Exemption on Specialist Visits. TSLS Estimates.
(1) (2) (3) (4) (5) (6)
Panel A: Two-Stage Least Squares Estimates
Exemption 0.150*** 0.149*** 0.127*** 0.129*** 0.100*** 0.114*** (0.016) (0.037) (0.029) (0.030) (0.033) (0.032) Age 0.001*** 0.001 -0.012*** -0.016*** -0.012*** -0.016*** (0.000) (0.001) (0.004) (0.004) (0.004) (0.004) Age^2 0.000 0.000*** 0.000*** 0.000*** 0.000*** (0.000) (0.000) (0.000) (0.000) (0.000) Age^3 -0.000*** -0.000*** -0.000*** -0.000*** (0.000) (0.000) (0.000) (0.000) Female 0.054*** 0.059*** 0.065*** (0.004) (0.004) (0.005) Education 0.004*** 0.004*** 0.005*** (0.001) (0.001) (0.001) Married 0.025*** 0.024*** 0.028*** (0.003) (0.003) (0.003) Immigrant -0.038*** -0.041*** -0.037*** (0.004) (0.004) (0.004) Retired 0.028*** 0.024*** (0.006) (0.006) Unemployed 0.001 -0.002 (0.006) (0.006) Other Non-Labor Force -0.006 -0.014*** (0.005) (0.005) Income 2 -0.010 -0.006 (0.007) (0.007) Income 3 -0.019*** -0.012* (0.007) (0.007) Income 4 -0.015 -0.008 (0.011) (0.011) BMI 0.001*** (0.000) Disability 0.121*** (0.010) Constant 0.068*** 0.069** 0.282*** 0.265*** 0.218*** 0.223*** (0.008) (0.030) (0.066) (0.066) (0.069) (0.069) Observations 87685 87685 87685 87685 87685 87685
Panel B: First Stage
Age>=65 0.345*** 0.230*** 0.239*** 0.234*** 0.230*** 0.235*** (0.028) (0.031) (0.027) (0.026) (0.027) (0.028) R-squared 0.245 0.254 0.255 0.280 0.296 0.311 First-Stage F-statistics 146.80 53.91 77.19 80.17 70.25 72.29 p-value 0.000 0.000 0.000 0.000 0.000 0.000
Panel C: Intention To Treat Effects Age>=65 0.052*** 0.034*** 0.030*** 0.030*** 0.023** 0.027*** (0.007) (0.009) (0.008) (0.008) (0.009) (0.009) Notes: The Table reports IV estimates. The dependent variable is Specialist Visits. In regressions (4), (5) and (6) we control for 20 regional dummies and 4 quarterly dummies. Standard errors (reported in parentheses) are corrected for heteroskedasticity and allowing for clustering at Age level. The symbols ***, **, * indicate that coefficients are statistically significant, respectively, at the 1, 5, and 10 percent level. Sample weights are used.

11
In Figure 1 we show the estimated relationship between Age and the probability of exemption
(the continuous line) based on a quadratic relationship while the red dots represent the effective rate of
exemption by age levels (local averages). The vertical line shows the threshold of age 65. It is
remarkable clear the jump of about 20 p.p. in the probability of being “treated” (i.e. obtaining
exemption) at age 65.
Figure 1. First Stage relationship: Cost-Sharing Exemption and Age
Second Stage Results
We now consider our Second Stage Estimates reported in Panel A of Table 2. In column (1),
controlling only for Age, we find that the exemption due to the reaching of age 65 is causing an
increase of the probability of undertaking a specialist visit of about 15 percentage points.
In the following specifications, with a number of control variables, we show that exemption is
causing a jump in the probability of a specialist visit from 10 to 15 percentage points according to the
specification (the coefficients are always highly statistically significant): this is a very strong impact
ranging from 60% to almost 100%, considering that the average probability of a specialist visit is
about 16%. As regards control variables, we find that females, more educated people, married and
retired tend to undertake more visits, while immigrants do fewer.

12
In Panel C of Table 2 we report Intention-To-Treat (ITT) effects, that is, the coefficient on
Age65 of the reduced form of the model of equations (1)-(2). Reaching the age of 65 rises the
probability of undertaking a specialist visit of about 3 p.p..
Discontinuity Samples (Local Linear Regressions)
Following Imbens and Lemieux (2008), we next consider only data in a neighborhood around the
discontinuity. The comparison of average outcomes in a small enough neighborhood to the left and to
the right of the threshold value should estimate our effect of interest in a way that does not depend on
the correct specification of the model for the conditional expected function.
In Table 3 are reported estimation results obtained from our local linear regressions. In these
specifications, Age is considered only in linear form. We experiment focusing on three different
windows: the first considering 15 years before and after 65 (age from 50 to 79) (columns 1-3); the
second considering 10 years before and after 65 (age from 55 to 74) (columns 4-6) and the last
focusing on a window 5 years before and 5 years after the threshold (age from 60 to 69) (columns 7-
9). In regressions (1), (4) and (7) we control only for Age. In regressions (2), (5) and (8) we control
for Age, Female, Education, Married, Immigrant, 20 regional dummies and 4 quarterly dummies. In
regressions (3), (6) and (9) we control for all the variables in column (6) of Table 2.
The first stage results for these local windows are shown in Panel B of Table 3: the impact of
Age65 on Exemption is quite strong also on these restricted samples, with an increase of 15-20 p.p. at
the cutoff.
As regards second stage estimates, in all specifications, the exemption determines a strong
increase of the probability of a specialist visit (from 10 to 16 p.p.) and the effect becomes even larger
in magnitude as the window is shortened. The coefficients are in line with the estimates on the whole
sample and are always highly statistically significant.

13
Table 3. Local Linear Regressions. Estimates of Cost-Sharing Exemption on Specialist Visits. TSLS Estimates.
(1) (2) (3) (4) (5) (6) (7) (8) (9)
Panel A: Two-Stage Least Squares Estimates
Exemption 0.108*** 0.115*** 0.113*** 0.115*** 0.116*** 0.126*** 0.150*** 0.141** 0.157** (0.032) (0.034) (0.034) (0.043) (0.043) (0.044) (0.054) (0.059) (0.062) Window 50Age79 55Age74 60Age69 Obs. 43934 43934 43934 29618 29618 29618 15004 15004 15004
First Stage
Age>=65 0.226*** 0.218*** 0.222*** 0.191*** 0.189*** 0.194*** 0.155** 0.154*** 0.160***
(0.042) (0.039) (0.039) (0.045) (0.044) (0.044) (0.048) (0.046) (0.047) Notes: The Table reports IV estimates on specific windows (Local Linear Regressions). The dependent variable is Specialist Visits. In regressions (1), (4) and (7) we control only for Age. In regressions (2), (5) and (8) we control for Age, Female, Education, Married, Immigrant, 20 regional dummies and 4 quarterly dummies. In regressions (3), (6) and (9) we control for all the variables in column (6) of Table 2. Standard errors (reported in parentheses) are corrected for heteroskedasticity and allowing for clustering at Age level. The symbols ***, **, * indicate that coefficients are statistically significant, respectively, at the 1, 5, and 10 percent level. Sample weights are used.
As a robustness check, in order to avoid to impose any restriction on the underlying
conditional form, we also include among controls an interaction term between Age and Exemption and
use as instrumental variables Age65 and the interactions between the latter and Age. This procedure
corresponds to estimating separate functions on either side of the cutoff point. The impact of
Exemption is substantially unchanged (not reported to save space).
To confirm the impact of exemption on specialist visits we consider a related outcome. In the
Survey that we are using individuals are asked if they have given up undertaking a specialist visit for
its costs. We build a dummy variable Giving Up Specialist Visits and we run the same IV regressions
of Table 2 using as a dependent variable the latter dummy. We show that the probability of giving up
visits reduces from 4 to 8 p.p. (the effects are highly statistically significant) when individuals are
given exemption from cost-sharing because they turn 65 (estimates not reported). Similar effects of
exemption are found when we focus on linear regressions on local windows.
3.3. Cost-Sharing and Diagnostic Tests
In this section we carry out the same analysis conducted above for specialist visits, investigating if the
exemption from cost-sharing due to the reaching of the age 65 affects the number of diagnostic tests
undertaken by individuals.
We run the same IV regressions of Table 2 and report the estimates in Table 4 (we report only
the coefficient on Exemption to save space).6 We find that the exemption increases by about 0.15-0.25
6 The first stage estimates are the same of Table 2.

14
the number of diagnostic checks that corresponds to a rise of more than 50%, given that the average
number of tests is 0.30.
Table 4. Fuzzy Regression Discontinuity Estimates of Cost-Sharing Exemption on Diagnostic Tests. TSLS Estimates (1) (2) (3) (4) (5) (6) Exemption 0.261*** 0.248*** 0.191*** 0.193*** 0.127** 0.156*** (0.039) (0.085) (0.057) (0.060) (0.062) (0.060) Observations 87685 87685 87685 87685 87685 87685 Notes: The Table reports IV estimates. The dependent variable is Diagnostic Tests See Notes of Table 2.
Furthermore, we carry out linear regressions on local windows and the estimates are reported
in Table 5. Our results are confirmed in the local window regressions: the exemption causes an
increase of diagnostic tests of 0.14-0.22.
Table 5. Local Linear Regressions. Estimates of Cost-Sharing Exemption on Diagnostic Tests. Two-Stage Least Squares Estimates (1) (2) (3) (4) (5) (6) (7) (8) (9) Window 50Age79 55Age74 60Age69 Exemption 0.140** 0.148** 0.152** 0.164** 0.159** 0.178*** 0.203** 0.194** 0.224** (0.060) (0.062) (0.060) (0.070) (0.070) (0.067) (0.086) (0.091) (0.088) Obs. 43934 43934 43934 29618 29618 29618 15004 15004 15004 Notes: The Table reports IV estimates on specific windows (Local Linear Regressions). The dependent variable is Diagnostic Tests. See Notes of Table 3.
4. Cost-Sharing Exemption and Prescription Drug Consumption
In Section 3 we have shown the strong impact of exemption from cost-sharing on the probability of
undertaking a specialist visit and on the number of diagnostic tests. In this Section we analyze the
impact of exemption on the probability of consuming prescription drugs in the latest two weeks.
In this case, we can exploit an additional identification strategy since in some Italian regions
the copayment (“Ticket”) for buying prescription drugs is applied for individuals less than 65 but not
for those older than 65 (similarly to the other health services such as specialist visits and diagnostic
tests), whereas in the remaining regions no copayment is applied for anyone. Therefore, if the
exemption status is really causing the increase of prescription drug consumption at age 65, using the
same RD framework we should observe this effect for “Regions with copayment” but we should not
find the same impact for “Regions without copayment”.
We run separately our IV regressions for regions with and without copayment.7 In Table 6 we
show our TSLS estimates for regions with copayment (using the whole range of age), with about
60,000 observations. We run the same regressions as in Table 2 but we report only the coefficients on
7 Preliminarily, in a simple regression with a bunch of controls (female, age, education, immigrant, married, income, occupational status, and so on) we find that individuals living in regions without copayment consume significantly more prescription drugs than individuals living in regions requiring the copayment. Obviously, this represents only a suggestive correlation and not a causal effect, since the compared regions could differ for a number of unobservable factors.
15
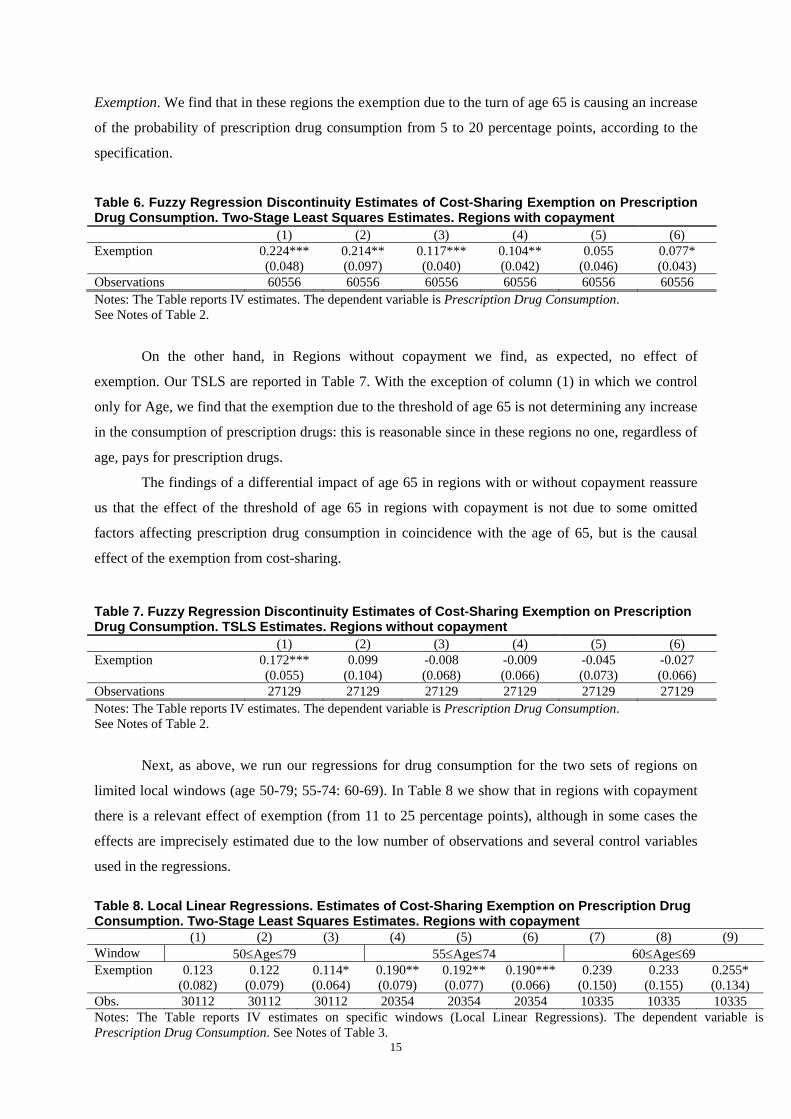
Exemption. We find that in these regions the exemption due to the turn of age 65 is causing an increase
of the probability of prescription drug consumption from 5 to 20 percentage points, according to the
specification.
Table 6. Fuzzy Regression Discontinuity Estimates of Cost-Sharing Exemption on Prescription Drug Consumption. Two-Stage Least Squares Estimates. Regions with copayment (1) (2) (3) (4) (5) (6) Exemption 0.224*** 0.214** 0.117*** 0.104** 0.055 0.077* (0.048) (0.097) (0.040) (0.042) (0.046) (0.043) Observations 60556 60556 60556 60556 60556 60556 Notes: The Table reports IV estimates. The dependent variable is Prescription Drug Consumption. See Notes of Table 2.
On the other hand, in Regions without copayment we find, as expected, no effect of
exemption. Our TSLS are reported in Table 7. With the exception of column (1) in which we control
only for Age, we find that the exemption due to the threshold of age 65 is not determining any increase
in the consumption of prescription drugs: this is reasonable since in these regions no one, regardless of
age, pays for prescription drugs.
The findings of a differential impact of age 65 in regions with or without copayment reassure
us that the effect of the threshold of age 65 in regions with copayment is not due to some omitted
factors affecting prescription drug consumption in coincidence with the age of 65, but is the causal
effect of the exemption from cost-sharing.
Table 7. Fuzzy Regression Discontinuity Estimates of Cost-Sharing Exemption on Prescription Drug Consumption. TSLS Estimates. Regions without copayment (1) (2) (3) (4) (5) (6) Exemption 0.172*** 0.099 -0.008 -0.009 -0.045 -0.027 (0.055) (0.104) (0.068) (0.066) (0.073) (0.066) Observations 27129 27129 27129 27129 27129 27129 Notes: The Table reports IV estimates. The dependent variable is Prescription Drug Consumption. See Notes of Table 2.
Next, as above, we run our regressions for drug consumption for the two sets of regions on
limited local windows (age 50-79; 55-74: 60-69). In Table 8 we show that in regions with copayment
there is a relevant effect of exemption (from 11 to 25 percentage points), although in some cases the
effects are imprecisely estimated due to the low number of observations and several control variables
used in the regressions.
Table 8. Local Linear Regressions. Estimates of Cost-Sharing Exemption on Prescription Drug Consumption. Two-Stage Least Squares Estimates. Regions with copayment (1) (2) (3) (4) (5) (6) (7) (8) (9) Window 50Age79 55Age74 60Age69 Exemption 0.123 0.122 0.114* 0.190** 0.192** 0.190*** 0.239 0.233 0.255* (0.082) (0.079) (0.064) (0.079) (0.077) (0.066) (0.150) (0.155) (0.134) Obs. 30112 30112 30112 20354 20354 20354 10335 10335 10335 Notes: The Table reports IV estimates on specific windows (Local Linear Regressions). The dependent variable is Prescription Drug Consumption. See Notes of Table 3.

16
In Table 9 we run the same regressions as in Table 8 but for regions without copayment. In all
the specifications, we find a null effect of exemption due to age 65.
Table 9. Local Linear Regressions. Estimates of Cost-Sharing Exemption on Prescription Drug Consumption. Two-Stage Least Squares Estimates. Regions without copayment (1) (2) (3) (4) (5) (6) (7) (8) (9) Window 50Age79 55Age74 60Age69 Exemption 0.029 0.025 0.034 -0.014 -0.027 0.009 0.023 0.012 0.046 (0.103) (0.104) (0.091) (0.147) (0.147) (0.134) (0.250) (0.238) (0.225) Obs. 13822 13822 13822 9264 9264 9264 4669 4669 4669 Notes: The Table reports IV estimates on specific windows (Local Linear Regressions). The dependent variable is Prescription Drug Consumption. See Notes of Table 3.
5. Cost-Sharing Exemption and Health Outcomes
We have seen in the previous empirical analyses that the exemption from cost-sharing leads to a
remarkable increase in specialist visits, diagnostic tests and consumption of prescription drugs. An
important issue that we need to tackle is whether these rises in the use of health services determine an
improvement in the health of individuals.
As measures of health outcomes a number of studies in the literature have focused on the
mortality of people, on self-reported health status, or on specific indicators such as blood pressure or
cholesterol. For example, Finkelstein (2007) find that the introduction of Medicare did not reduce the
relative mortality of people over 65 and Card, Dobkin and Maestas (2008) show that the age profiles
of self-reported health status are smooth around age 65. On the other hand, Card, Dobkin and Maestas
(2009) show a reduction of mortality rates for people admitted to the hospital.
Using the same empirical strategies presented above, we investigate if the exemption from
cost-sharing – through a rise in the use of health services – leads to better health outcomes looking at
the probability of incurring some health problems limiting daily activities (Serious Health Problems)
and considering a self-evaluated Health Status (on a scale from 1 to 5).
In this exercise we follow the existing literature but admittedly this evidence is only
suggestive since health problems could take long periods of time to be solved when health services are
used more intensely because of the exemption and the RDD strategy has difficulties in identifying an
effect developing over time.
In Table 10 we run our IV regressions using as a dependent variable the dummy Serious
Health Problems and instrumenting, as usual, Exemption with Age65. We find that Exemption (with
the exception of the first column) has no impact on the probability of having health problems. The
coefficient on Exemption is almost zero (sometimes even positive) and it is always far from being
statistically significant.

17
Table 10. Fuzzy Regression Discontinuity Estimates of Cost-Sharing Exemption on Serious Health Problems. TSLS Estimates. (1) (2) (3) (4) (5) (6) Exemption 0.074*** -0.041 -0.013 -0.015 0.006 0.027 (0.022) (0.047) (0.036) (0.037) (0.036) (0.033) Age 0.002*** -0.004*** 0.012*** 0.012*** 0.010*** 0.004* (0.000) (0.001) (0.003) (0.003) (0.003) (0.003) Age^2 0.000*** -0.000*** -0.000*** -0.000*** -0.000 (0.000) (0.000) (0.000) (0.000) (0.000) Age^3 0.000*** 0.000*** 0.000*** 0.000** (0.000) (0.000) (0.000) (0.000) Female 0.040*** 0.037*** 0.043*** (0.003) (0.003) (0.003) Education -0.002*** -0.001 0.000 (0.001) (0.001) (0.000) Married -0.005 -0.000 0.006** (0.003) (0.003) (0.003) Immigrant -0.022*** -0.033*** -0.028*** (0.005) (0.005) (0.005) Retired -0.014** -0.020*** (0.006) (0.006) Unemployed -0.008 -0.011* (0.006) (0.006) Other Non-Labor Force 0.005 -0.007 (0.006) (0.005) Income 2 -0.028*** -0.022*** (0.006) (0.006) Income 3 -0.067*** -0.058*** (0.006) (0.006) Income 4 -0.072*** -0.061*** (0.011) (0.011) BMI 0.001*** (0.000) Disability 0.176*** (0.009) Constant 0.013 0.146*** 0.000 -0.092* -0.025 0.002 (0.009) (0.031) (0.000) (0.055) (0.047) (0.044) Observations 87685 87685 87685 87685 87685 87685 Notes: The Table reports IV estimates. The dependent variable is Serious Health Problems. In regressions (4), (5) and (6) we control for 20 regional dummies and 4 quarterly dummies. Standard errors (reported in parentheses) are corrected for heteroskedasticity and allowing for clustering at Age level. The symbols ***, **, * indicate that coefficients are statistically significant, respectively, at the 1, 5, and 10 percent level. Sample weights are used.
In Table 11 we present the estimates of our linear regressions on local windows. Again, we
find that the greater use of health services through exemption does not lead to a reduction of health
problems.
Table 11. Local Linear Regressions. Estimates of Cost-Sharing Exemption on Serious Health Problems. Two-Stage Least Squares Estimates (1) (2) (3) (4) (5) (6) (7) (8) (9) Window 50Age79 55Age74 60Age69 Exemption 0.017 0.013 0.038 0.035 0.032 0.050 0.017 0.019 0.058 (0.056) (0.055) (0.043) (0.065) (0.062) (0.053) (0.071) (0.066) (0.062) Obs. 43934 43934 43934 29618 29618 29618 15004 15004 15004 Notes: The Table reports IV estimates on specific windows (Local Linear Regressions). The dependent variable is Serious Health Problems. See Notes of Table 3.

18
In Table 12 we analyze the impact of Exemption on subjectively evaluated Health Status (we
rescaled the original variable from 1 to 5: in our setting 1 represents “Very Bad” and 5 is “Very
Good”) running our main specifications. We do not find any significant impact of exemption on this
measure of health. In Table 13 we run local linear regressions and we do not find positive effects of
exemption on Health Status (in some specifications we tend to find negative effects).
Table 12. Fuzzy Regression Discontinuity Estimates of Cost-Sharing Exemption on Health Status. Two-Stage Least Squares Estimates (1) (2) (3) (4) (5) (6) Exemption -0.214*** 0.080 0.068 0.111 0.087 -0.008 (0.043) (0.072) (0.069) (0.070) (0.075) (0.060) Observations 87685 87685 87685 87685 87685 87685 Notes: The Table reports IV estimates. The dependent variable is Health Status. See Notes of Table 2. Table 13. Local Linear Regressions. Estimates of Cost-Sharing Exemption on Health Status. Two-Stage Least Squares Estimates (1) (2) (3) (4) (5) (6) (7) (8) (9) Window 50Age79 55Age74 60Age69 Exemption -0.142 -0.105 -0.177** -0.150* -0.131 -0.207** -0.214 -0.195 -0.301* (0.099) (0.089) (0.070) (0.086) (0.085) (0.081) (0.148) (0.168) (0.169) Obs. 43934 43934 43934 29618 29618 29618 15004 15004 15004 Notes: The Table reports IV estimates on specific windows (Local Linear Regressions). The dependent variable is Health Status. See Notes of Table 3.
Finally, we analyze the effect of Exemption on the probability of being admitted to the
hospital: we do not find any effect of exemption on hospitalization (estimates not reported to save
space).
6. Concluding Remarks
With increasing health spending in most advanced countries from a policy point of view it is important
to evaluate how demand for healthcare services respond to cost-sharing in order to deal with the trade-
off between moral hazard problems and risk-sharing. However, on this issue there is a lack of rigorous
experimental evidence outside US.
In this paper we exploit a natural experiment based on the rule established in the Italian
National Health System that individuals aged 65 or more with low incomes are completely exempted
from cost-sharing for the use of a number of healthcare services.
We use the discontinuity in age to implement a Fuzzy Regression Discontinuity Design (since
the probability of exemption changes discontinuously at age 65) – corresponding to an Instrumental
Variables estimation strategy – and investigate the effects of cost-sharing on prescription drug
consumption, specialist visits and diagnostic tests.

19
To avoid any estimation biases we control for a large number of variables that could affect the
demand for health services and be correlated to the age threshold. We also use a number of polynomial
forms for age. In addition, we estimate our regressions both on the whole range of age and on three
restricted windows (age 50-79; 55-74: 60-69).
In all the specifications and samples used, we find that specialist visits and diagnostic tests
increase a lot – approximately by more than 50% – when individuals are given exemption from cost-
sharing because of the reaching of age 65. Similar effects are found for the consumption of
prescription drugs, although the magnitude is more contained (around 20%). As regards prescription
drugs, our findings are strengthened by the fact that the effect is found only in regions with copayment
whereas no effect at all emerges in regions in which no copayment is applied. This reassures us that
the uncovered effects are due to the age threshold rather than to some confounding variables related to
age.
However, when we analyze the impact of the exemption on several measures of health status
(the probability of having serious health problems or of going to the hospital, the individual’s
perceived health) using the same empirical strategy we do not find any effect of greater consumption
of health services on health outcomes. The latter findings is suggestive evidence of an overuse of
medical services but cannot be considered a rigorous proof that complete exemption gives rise to
moral hazard – since the RDD strategy might not identify properly effects on health that takes time to
develop.
Considering that in developed countries life expectancy continues to increase, population is
ageing and technological progress will offer new drugs, new tests and new therapies, the evidence on
the price response of the demand of healthcare services is particularly relevant for policy makers to
face the risks of an explosion of health spending.
References
Anderson, M., Dobkin, C., and Gross, T. (2012), “The Effect of Health Insurance Coverage on the Use of Medical Services, American Economic Journal: Economic Policy, 4(1), 1-27.
Anderson, M., Dobkin, C., and Gross, T. (2014). “The effect of health insurance on emergency department visits: Evidence from an age-based eligibility threshold”, Review of Economics and Statistics, 96(1), 189-195.
Angrist, J., Pischke, J., (2009), Mostly Harmless Econometrics, Princeton University Press. Angrist, J., Pischke, J., (2015), Mastering ‘Metrics, Princeton University Press. Arrow, K. (1963), “Agency and the welfare economics of medical care”, American Economic Review,
53(5), 941973. Atella V. - Deb P. (2008), “Are Primary Care Physicians, Public and Private Sector Specialists
Substitutes or Complements? Evidence from a Simultaneous Equations Model for Count Data”, Journal of Health Economics, vol. 27, no. 3, pp. 770-785.
Card, D., Dobkin, C., and Maestas, N., (2008),. “The Impact of Nearly Universal Insurance Coverage on Health Care Utilization: Evidence from Medicare.” American Economic Review, 98, 5, 2242–58.

20
Card, D., Dobkin, C., and Maestas, N., (2009), “Does Medicare Save Lives?” Quarterly Journal of Economics, 124, 2, 597–636.
Carrieri, V. (2010), “The Effects of Cost-Sharing in Health Care: What Do We Know from Empirical Evidence?”, Economia Politica, 2.
Chandra, A., Gruber, J. and McKnight, R. (2010). “Patient Cost-Sharing and Hospitalization Offsets in the Elderly.” American Economic Review, 100(1): 193–213.
Cherkin, D., Grothaus, L. and Wagner, E. (1989). “The Effect of Office Visit Copayments on Utilization in a Health Maintenance Organization,” Medical Care, 27, 1036-1045.
Dow, W. (2004), “The Introduction of Medicare: Effects on Elderly Health. University of California”, Berkeley, Unpublished Working Paper.
Fabbri D., Monfardini C. (2009), “Rationing the Public Provision of Healthcare in the Presence of Private Supplements: Evidence from the Italian NHS”, Journal of Health Economics, vol. 28, no. 2, pp. 290-304.
Feldstein, M., (1973) “The Welfare Loss of Excess Health Insurance.” Journal of Political Economy, 81 (March–April): 251–80.
Finkelstein et al., 2012 , “The Oregon Health Insurance Experiment: Evidence from the First Year”, Quarterly Journal of Economics, 127, 3, 1057-1106.
Finkelstein, A. (2007). “The Aggregate Effects of Health Insurance: Evidence from the Introduction of Medicare.” Quarterly Journal of Economics,122(1): 1–37.
Gaynor, M., Li, J., and Vogt, B. (2007), “Substitution, spending offsets, and prescription drug benefit design”, in Forum for Health Economics & Policy (Vol. 10, No. 2).
Goldman, D. et al. (2004). “Pharmacy Benefits and the Use of Drugs by the Chronically Ill,” Journal of the American Medical Association, 291, 2344-2350.
Hiesler, M. et al. (2004). “The Health Effects of Restricting Prescription Medication Use Because of Cost,” Medical Care, 42, 626-634.
Imbens G., Lemieux T. (2008), “Regression Discontinuity designs: A guide to practice”, Journal of Econometrics 142 (2): 615–635.
Landsman et al. (2005). “Impact of 3-Tier Pharmacy Benefit Design and Increased Consumer Cost-Sharing on Drug Utilization”, American Journal of Managed Care, 11, 621-628.
Lee, D., and Card, D. (2008), “Regression discontinuity inference with specification error”, Journal of Econometrics, 142, pp. 655-674.
Lee, D., and Lemieux, T., (2010), “Regression Discontinuity Designs in Economics”, Journal of Economic Literature, 48(2), pp. 281-355.
Manning, G., Newhouse, P., Duan, N., Keeler, B., and Leibowitz, A. (1987). “Health insurance and the demand for medical care: evidence from a randomized experiment”, American Economic Review, 251-277.
McWilliams, M.; Zaslavsky, A.; Ayanian, J. (2007), “Use of Health Services by Previously Uninsured Medicare Beneficiaries”, New England Journal of Medicine 2007;357:143–153.
Newhouse, J. and the Insurance Experiment Group (1993), Free For All? Lessons from the RAND Health Insurance Experiment. Cambridge, MA: Harvard University Press.
Piette, J., Wagner, T. Potter, M. and Schillinger, D. (2004). “Health Insurance Status, Cost-Related Medication Underuse, and Outcomes Among Diabetes Patients in Three Systems of Care,” Medical Care, 42, 102-109.
Schoen, M. et al. (2001). “Impact of the Cost of Prescription Drugs on Clinical Outcomes in Indigent Patients with Heart Disease,” Pharmacotherapy, 12, 1455-1463.
Selby, J., Fireman F. and Swain, B. (1996). “Effect of a Copayment on use of the Emergency Department in a Health Maintenance Organization,” New England Journal of Medicine, 334, 635-641.
Stock, J., and Yogo, M. (2005). “Testing for weak instruments in linear IV regression. Identification and inference for econometric models”, Essays in honor of Thomas Rothenberg.
Tamblyn, R. et al. (2001). “Adverse Events Associated with Prescription Drug Cost-Sharing Among Poor and Elderly Persons,” Journal of the American Medical Association, 285, 421-429.
Zeckhauser, R., (1970), “Medical insurance: a case study of the tradeoff between risk spreading and the appropriate incentives”, Journal of Economic Theory, 2,10-26.