costing an enhanced decent homes standard
TRANSCRIPT

Costing an enhanceddecent homes standardFinal report | 19 January 2011Document revision 1.2
3 St Peter’s Court
Bedminster Parade
Bristol BS3 4AQ
0117 934 1400
We are a national charity that sharesour knowledge and experience to helppeople change the way they think andact on energy.
www.cse.org.uk
reg charity 298740company 2219673
Centre for Sustainable Energy

2

Costing an enhanced Decent Homes Standard
Centre for Sustainable Energy 3
Table of Contents
EXECUTIVE SUMMARY ........................................................................................................................ 4 1 INTRODUCTION ............................................................................................................................. 9 2 BACKGROUND .............................................................................................................................. 9 3 METHODOLOGY .......................................................................................................................... 12
3.1 BACKGROUND RESEARCH, SURVEY AND DATA PREPARATION .................................................... 12 3.2 SCENARIO DEVELOPMENT ........................................................................................................ 13 3.3 MODELLING OF OPTIONS .......................................................................................................... 16
4 DEVELOPING A TYPOLOGY FOR SOCIAL HOUSING IN LONDON ....................................... 17 5 MODELLING OF SCENARIOS .................................................................................................... 19
5.1 SUSTAINABLE ENERGY MEASURES ........................................................................................... 19 5.2 WATER EFFICIENCY MEASURES ................................................................................................ 23 5.3 SUMMER OVERHEATING ........................................................................................................... 28
6 SUMMARY OF COSTS AND POTENTIAL DEPLOYMENT STRATEGY ................................... 30 6.1 TOTAL COSTS FOR ALL MEASURES ........................................................................................... 30 6.2 DEPLOYMENT STRATEGY FOR MEASURES ................................................................................. 31
7 IMPLEMENTATION OF MEASURES – KEY ISSUES................................................................. 32 7.1 TECHNICAL BARRIERS TO MEASURES ....................................................................................... 32 7.2 LIAISON WITH TENANTS AND BEHAVIOURAL CHANGE ................................................................. 33 7.3 MONITORING OF RESULTS ........................................................................................................ 34 7.4 PHASING OF MEASURES ........................................................................................................... 35 7.5 FUNDING ................................................................................................................................. 35 7.6 IMPROVEMENT PRIORITIES ....................................................................................................... 36
8 CONCLUSIONS ............................................................................................................................ 37 9 BIBLIOGRAPHY ........................................................................................................................... 38 ANNEX A: SCOPE OF MEASURES CONSIDERED IN ANALYSIS .................................................. 39 ANNEX B: SUMMARY OF COSTS ACROSS TOP 20 TYPOLOGIES FOR EACH SCENARIO ...... 41 ANNEX C: SUMMARY OF COSTS AND MEASURES INSTALLED FOR DIFFERENT HOME TYPES FOR EACH SCENARIO .......................................................................................................... 44 ANNEX D: WATER EFFICIENCY MEASURES .................................................................................. 51 ANNEX E: CASE STUDIES ................................................................................................................ 52

Costing an enhanced Decent Homes Standard
Centre for Sustainable Energy 4
Executive summary
Introduction The Government’s Decent Homes Programme was launched in 2001 and aimed to provide a minimum standard of housing for the social rented sector. Implementation of the standard over the last decade has fallen short of original targets, but the programme is currently on-going and in the case of London, around 80% of council-owned housing is projected to meet the standard by April 2011. The Decent Homes Standard, however, sets a low basic minimum standard for heating and insulation; well below what is needed to significantly reduce fuel poverty. Neither does it sufficiently address the environmental performance of homes, particularly in relation to climate change mitigation and adaptation. This study therefore aims to estimate the total cost of delivering an enhanced Decent Homes Standard by identifying the best technical options for delivering improvements relating to sustainable energy (energy efficiency and low/zero carbon generation), water efficiency and summer overheating within London’s social housing stock. The work has been undertaken by the Centre for Sustainable Energy (CSE), in conjunction with the Metropolitan Housing Partnership (MHP). The project has involved a typology analysis of London’s social housing stock and the modelling of a set of three scenarios based on Standard Assessment Procedure (SAP) targets to illustrate a range of levels for an enhanced standard. A review of relevant projects and programmes both inside and outside of London was undertaken and the opinions and experiences of local authorities, housing associations and other stakeholders were assessed in terms of sustainable energy measures, refurbishment strategies, costs, funding, and monitoring issues. London has a unique social housing profile with a high proportion of low and high rise flats. The typology analysis indicated that properties built between 1946-1980 are most common, with flats being the most prevalent; 264,268 (or 37%) of London’s social properties are flats built between 1946 and 1980 with less than 4 bedrooms. The top 20 Primary Generic Types for London’s social rented sector together represent around 90% of the 710,435 social housing properties in London.
Scenarios tested The sustainable energy scenarios described below are primarily based on achieving a defined SAP standard as modelled for social rented homes. The SAP targets aim to reflect the most recent publications and Government policy announcements and are defined as follows:
• Scenario 1 SAP 70, least cost with community heating will provide a modelled energy standard based on packages of measures, at least cost, that meet a target SAP of 70.
• Scenario 2 SAP 70, maximised carbon savings with community heating will provide a modelled energy standard based on packages of measures, with the highest carbon saving for the investment (£ per tC), that meet a target SAP of 70.
• Scenario 3 SAP 81, least cost with community heating will provide a modelled energy standard based on packages of measures, at least cost, that meet a target SAP of 81.
Scenarios for water efficiency were drawn from several recently conducted studies and were selected to model a reduction in consumption levels to 130, 100 and 80 litres/person/day. The

Costing an enhanced Decent Homes Standard
Centre for Sustainable Energy 5
summer overheating scenarios were selected to represent low, medium and high impact (and cost) scenarios.
Analysis of sustainable energy measures The table below provides an overview of the costs resulting from the Improvement Prophet1 modelling of all three scenarios for London’s social housing sector. It shows scenarios distinguished by the source of data: London data within the English House Condition Survey (EHCS) and an alternative estimate which incorporates London Heat Map data to allow refinement for the use of community heating. The mid-point costs for each scenario represent the mid-point between the Improvement Prophet-based EHCS cost and those derived from incorporating London Heat Map data.
Modelled costs for sustainable energy measures
Data source Total costs [£m] Mid-point [£m]
Scenario 1 (EHCS) 2,654 2,907
Scenario 1 (London Heat Map) 3,160
Scenario 2 (EHCS) 3,236 3,539
Scenario 2 (London Heat Map) 3,842
Scenario 3 (EHCS) 4,408 5,235
Scenario 3 (London Heat Map) 6,062
As internal wall insulation can cause significant disruption to tenants during installation, the additional costs of delivering the scenarios without this measure i.e. in the majority of cases substituting internal with external wall insulation, was also assessed. This increases the cost by a minimum of £200m (for Scenario 2) to a maximum of £1.1bn (for Scenario 3). Reductions in carbon dioxide emissions likely to result from the scenarios are shown in the table below (allowing for the Mayor’s specific target for the future decarbonisation of electricity). Compared to the results from the same analysis on London’s private housing stock and for England as a whole, the estimated emissions reduction for social housing in London are lower. Social housing is on average more efficient than the private sector stock and as such receives fewer measures under the various scenarios.
Total carbon dioxide emissions reduction in housing by scenario (measures and projected Mayor’s emissions factors)
Remit Scenario 1 Scenario 2 Scenario 3
England (all tenures) 48.4% 49.4% 60.2%
London (social) 42.6% 42.7% 58.6%
London (private) 48.8% 49.2% 63.9%
Analysis of water efficiency measures The table below summarises the estimated costs and emissions saving resulting from each scenario. There is a substantial increase in the cost of reducing water consumption to 80 litres/person/day from 100 litres/person/day, and the total costs should not be assumed to have a linear relationship. A significant proportion of the difference between the two costs is from the use of a rainwater harvesting
1 Improvement Prophet project profile http://www.cse.org.uk/projects/view/1144

Costing an enhanced Decent Homes Standard
Centre for Sustainable Energy 6
system. It is unlikely that the more demanding target could be reached without the use of such as system. The emissions saving resulting reduced consumption from water efficiency measures takes account of both the savings at the point of use and in the supply and treatment of water.
Modelled costs for water efficiency measures
Scenario 1:
130 litres per
head per day
Scenario 2:
100 litres per
head per day
Scenario 3:
80 litres per head
per day
Cost (£m) £218.7 £382.9 £695.3
Emissions saving 34% 42% 44%
Analysis of summer overheating The overheating of homes during the summer months can be tackled using a wide range of technical, construction and behavioural measures. When considering the possible measures to include, this study has focused primarily on those that are most suitable for installation in social housing, and has limited the choice of measures to those of a technical nature rather than behavioural interventions. The modelled costs for summer overheating measures were estimated to be £739m for Scenario 1 (a low cost and low intervention scenario), £1.97bn for Scenario 2 and £3.8bn for Scenario 3 (a comprehensive package of measures). These scenarios represent an average reduction in mean internal temperature of 1.2 (Scenario 1) to 5.1oC (Scenario 3).
Summary of costs Combining all the modelled scenarios for sustainable energy, water efficiency and summer overheating gives a total of 18 possible combinations of measures. The cost of each of these is provided in the table below.
Total costs for all modelled scenario combinations, £m
Summer overheating
scenarios
Water efficiency
scenarios
Sustainable energy
Scenario 1 Scenario 2 Scenario 3
Low
Low 3,938 4,528 5,615
Med 4,074 4,664 5,752
High 5,160 5,750 6,837
Mod
Low 5,165 5,755 6,843
Med 5,301 5,891 6,979
High 6,387 6,977 8,064
High
Low 6,983 7,573 8,660
Med 7,119 7,709 8,797
High 8,205 8,795 9,882
A breakdown of the costs for the low, medium and high total cost scenarios for each of the three areas is shown in the figure below. For the lowest total cost scenario, the cost of improving the

Costing an enhanced Decent Homes Standard
Centre for Sustainable Energy 7
energy efficiency of the housing stock dominates. However, for the highest cost scenarios the cost of implementing summer overheating measures becomes more significant. For example, sustainable energy measures account for approximately 75% of the total cost in the low cost scenario, whilst summer overheating measures account for 19%. For the high cost scenario, these figures shift to 47% and 38%, respectively. The costs of water efficiency measures contribute between 6-15% of the total cost. Total costs for all modelled scenario combinations
Conclusions It is widely accepted that the existing Decent Homes Standard does not go far enough in improving environmental performance and quality within housing, particularly with regard to alignment to current national targets for carbon reduction within the built environment. An enhanced Decent Homes Standard is therefore felt by many to be a priority requirement – indeed many housing organisations and partnerships are now experimenting with measures beyond the current standard, with some implementing localised Decent Homes ‘Plus’ programmes. However, there are many different packages of measures that can be considered and each category of social housing type will be suited to certain measures over others due to the many technical, financial and organisational issues around refurbishment projects. This is particularly relevant to London, which is unique in having a large proportion of low and high rise social housing. This study has therefore attempted to estimate the costs of applying packages of measures across the London social housing stock to meet a set of scenarios which may reflect the ambitions of an enhanced Decent Homes Standard. The results have shown that a wide range of costs apply to the scenarios tested and that the packages of measures, and the strategy for their implementation, can be complex. A key theme arising from the surveys conducted during this study indicated that funding concerns were very prominent across the sector, and that the recent economic situation has impacted strategic planning within organisations. There was general uncertainty about where funding might come from in the near future and a number of those contacted were delaying decisions until facts and figures were clearer.
£‐
£2,000
£4,000
£6,000
£8,000
£10,000
Low Medium High
Total Costs, £M
Sustainable energy Summer overheating
Water efficiency Total

Costing an enhanced Decent Homes Standard
Centre for Sustainable Energy 8
Other feedback suggested that technical barriers are still apparent, particularly in relation to achieving the higher standards considered in this report. Synergies and tensions between the installation of multiple measures often do not become apparent until late in the process and hence sharing experiences and lessons learned can be a valuable activity. Other notable issues included the importance of adequate liaison with tenants and awareness-raising of energy issues during work programmes, and the challenges encountered in designing a suitable monitoring regime.

Costing an enhanced Decent Homes Standard
Centre for Sustainable Energy 9
1 Introduction The Centre for Sustainable Energy (CSE), in conjunction with the Metropolitan Housing Partnership (MHP) has been commissioned by the Greater London Authority to deliver research into the technical options and costs of delivering an enhanced Decent Homes Standard. The types of measures associated with such a standard will help deliver long term improvements to the quality and environmental performance of London’s social rented sector. The Government’s Decent Homes Programme was launched in 2001 and aimed to provide a minimum standard of housing for the social rented sector. Implementation of the standard over the last decade has fallen short of original targets, but the programme is currently on-going and in the case of London, around 80% of council-owned housing is projected to meet the standard by April 2011.2 The Decent Homes Standard, however, makes no account of the immediate environment or neighbourhood and, more pointedly for the context of this study, sets a low basic minimum standard for heating and insulation; well below what is needed to significantly reduce fuel poverty. Neither does it sufficiently address the environmental performance of homes, particularly in relation to climate change mitigation and adaptation. The key aim of this study is to therefore estimate the total cost of delivering an enhanced Decent Homes Standard by identifying the best technical options for delivering improvements relating to sustainable energy (energy efficiency and low/zero carbon generation), water efficiency and summer overheating within London’s social housing stock. There have already been a number of activities on scoping an enhanced Decent Homes Standard both in London and elsewhere, and many social housing refurbishment projects that go beyond Decent Homes measures are currently being delivered. The study therefore also draws on the experiences gained and lessons learned in order to explore opportunities and constraints associated with the range of measures considered. This report describes the methodology used to model a chosen set of target scenarios and presents the results of the analysis. It also comments on issues likely to be encountered when implementing the range of measures that may make up an enhanced Decent Homes Standard and includes a number of brief case studies to illustrate the scope of work being undertaken and the lessons learned. It is important to note that the purpose of this study is not to specifically define and recommend an enhanced Decent Homes Standard, but rather to develop and test a number of scenarios by researching the costs and impacts associated with the various measures that such a standard may comprise.
2 Background The Government’s Decent Homes Programme is due to come to an end in 2010. By this time 92% of London’s local authority homes are expected to meet the Decent Homes standard by:
• Having reasonably modern facilities
• Meeting the current standard for fitness
• Providing a reasonable state of repair 2 Source: 2010 BPSA local authority returns to CLG.

Costing an enhanced Decent Homes Standard
Centre for Sustainable Energy 10
However, for the reasons stated above, there is now an urgent need to consider an enhanced Decent Homes Standard for London’s social housing, which goes well beyond the current standard in terms of quality and environmental performance. BRE’s 2009 report, ‘Towards a Successor Standard to Decent Homes’3, considers the scope of measures that should be taken forward in a new standard. As this report highlights, a large proportion of London’s social housing stock does not conform to the standard house with cavity walls; around 60% of London’s 756 thousand social rented homes falling into the category of ‘hard to treat’. This makes the prospect of improving standards in this sector particularly challenging in terms of cost and the practicalities of implementation. Greater London has been at the forefront of the development of urban sustainable energy policy in the UK since the Greater London Authority was established in 2000. In the intervening period a significant amount of research has been undertaken, and this has supported an increasingly sophisticated set of sustainable energy policies and targets, culminating most recently in the Draft Replacement London Plan (2009) and the Draft Climate Change Mitigation and Energy Strategy (2010). The latter proposes to explore opportunities to install decentralised energy generation across publicly owned land including social housing. There is now an overwhelming evidence base to support large scale heat distribution as an essential component of any viable long term strategy to reduce London’s carbon dioxide emissions, particularly for social housing developments. There have recently been both national and regional programmes and initiatives which will have an impact on a potential enhanced Decent Homes Standard for London’s social rented homes. A overarching context has been set by the Mayor’s pledge of achieving a 60% cut in London’s carbon emissions by 2025. In September 2009, the Mayor subsequently launched ten pilot Low Carbon Zones within the capital to achieve long-term change. Each selected zone is receiving between £200,000 and £400,000 to fund carbon reduction initiatives, as well as public support and programme management from the Greater London Authority. Each of the ten Low Carbon Zones aims to deliver at least 20.12% carbon dioxide savings by 2012, with a longer-term plan to bring about a 60% reduction by 2025. Local authorities will lead private and public sector partners as well as community organisations to develop a range of models for the delivery of carbon saving measures across and beyond London. At the national level, the Government announced in March 2010 a new ‘Warm Homes’ standard for social housing, which will see all social tenants receiving free energy upgrades for their homes from energy companies, including fitted smart meters, leading to savings of up to £300 a year on bills. In London a significant amount of delivery is also already taking place through a range of existing programmes such as Warm Zones, the Community Energy Saving Programme (CESP), the Social Housing Energy Saving Programme (SHESP), the Mayor’s Targeted Funding Stream, Low Carbon Zones, RE:NEW (formerly the Homes Energy Efficiency Programme (HEEP)) and decentralised energy programmes. RE:NEW is a pan-London homes retrofitting scheme aimed at reducing carbon dioxide emissions from the residential sector. Through initial trials and demonstration projects practical energy efficiency activities will be delivered and these will inform the design of a model that will enable roll-out into a wider homes retrofit programme for London.
3 Towards a Successor Standard to Decent Homes, BRE, April 2009

Costing an enhanced Decent Homes Standard
Centre for Sustainable Energy 11
The Home and Communities Agency’s SHESP is a two-year programme for Registered Social Landlords which funds cavity wall and loft insulation programmes in harder to treat properties. London will receive funding of £76.9 million out of the total programme budget of £84 million, because of the much higher proportion of hard-to-treat flats in the capital. The Mayor’s London Housing Strategy (February 2010) pledged that where existing homes are retrofitted and the building fabric allows, a SAP rating of at least 65 should be achieved. The aim is to ensure that all homes retrofitted with funding from the Home and Communities Agency and other public housing funding meet or exceed this standard. There are already a number of small scale initiatives striving to go beyond the Decent Homes Standard (see Annex D for case study examples). In London, the Metropolitan Housing Trust’s (MHT) Neighbourhood Investment Unit is targeting Victorian properties, through its Neighbourhood Investment Programme4. The scheme aims to reduce carbon dioxide emissions, and simultaneously address fuel poverty, by tackling some 600 hard-to-treat homes in the London Borough of Haringey. Properties undergo extensive ‘whole house’ refurbishment to a Decent Homes ++ Standard. Measures include, (as and where appropriate): loft insulation; floor insulation; double glazing; low energy lighting; electrical rewiring; new bathrooms and kitchens; central heating upgrades; TRV’s; and room thermostats. Tenants are temporarily re-housed whilst work is underway and receive energy efficiency advice and support. Refurbished homes are expected to achieve some 45% reduction in carbon dioxide emissions and fuel costs. An example outside of London is the Sustainable Housing Action Partnership (SHAP) in the West Midlands, which has established its own Beyond Decent Homes Standard (2009)5. The aim of the Standard is two-fold: to deliver carbon dioxide emissions reductions in line with the Government’s Low Carbon Transition Plan targets, adopting the ‘whole house package’ model of home improvements; and to improve the quality of living standards for all social housing tenants and reduce fuel poverty. The Standard is linked to Energy Performance Certificate ratings and sets out a three stage approach to go beyond national targets for carbon reduction. An initial minimum standard for all stock is set at a 42% reduction in emissions on 1990 levels by 2016 (SAP 75, EPC rating C, stage 1). This progresses to a minimum of an 80% reduction by 2025 in 90% of stock (SAP 85, EPC rating B). A number of programmes are also focusing on adaptation measures to tackle the impacts of climate change. This work predominantly involves improving the resilience and protection of properties and neighbourhoods from flooding and summer overheating. Reports such as ‘Your Home in a Changing Climate’6 provide an assessment of the issues, suitable measures and indicative costs of such work, and have provided a useful foundation for several London Boroughs. Whilst flood risk is a serious issue for social housing, measures to tackle it are considered beyond the scope for this study. Many measures are behavioural (e.g. registering with the Environment Agency flood warming scheme), while others are external measures that aim to reduce run-off and allow flood water to drain, or they overlap with water efficiency and summer overheating measures (e.g. rainwater harvesting and green roofs). Finally, the Thames Barrier is a city-wide flood defence scheme that offers the majority of London homes a significant level of protection against tidal flooding. Measures to reduce summer overheating are discussed in Section 5.3.
4 http://www.mht.co.uk/news/2010/06/mht-london-named-winner-of-the-24housing-retrofit-best-practice-award-2010/ 5 SHAP, 2009. Moving Beyond Decent Homes Standard 2009. Creating the low carbon standard for social housing. http://www.shap.uk.com/assets/userfiles/Beyond_Decent_Homes/Beyond_Decent_Homes_v1_Standard_document.pdf 6 Your Home in a Changing Climate, Retrofitting Existing Homes for Climate Change Impacts, A report for policymakers, ARUP 2008.

Costing an enhanced Decent Homes Standard
Centre for Sustainable Energy 12
3 Methodology The following provides a brief overview of the study methodology, which comprised desk-based analysis and research, and included consultation with a number of local authorities, housing associations and other interested organisations.
3.1 Background research, survey and data preparation 3.1.1 Background research An initial desk based review was undertaken to identify studies and projects which have scoped the opportunities and limitations for an enhanced Decent Homes Standard. The findings were then used to refine a set of assumptions around the suitability and costs of measures involving energy efficiency, low/zero carbon generation, water efficiency and mitigation of summer overheating.
3.1.2 Developing a typology for London’s social housing The Centre for Sustainable Energy defined the ‘typology’ of London’s social rented housing stock through analysis of its own major research tool, Improvement Prophet (created in partnership with Dr Richard Moore and the Association for Conservation of Energy - see Section 4). The typology classifies properties according to their age, built form, size and tenure.
3.1.3 Potential for community heating The potential for community heating was evaluated by using the London Heat Map7 (see Figure 1) as developed by the Centre for Sustainable Energy on behalf of the Greater London Authority. This helped to identify sites in London where community heating systems would be more likely to be viable. A common typology was used to capture those postcodes most suitable for community heating by considering the top decile of heat density from the London Heat Map. These were then mapped to cases in the English House Condition Survey, with subsequent results being refined to model community heating in London’s social housing. Figure 1: Example image of London Heat Map
7 www.londonheatmap.org.uk

Costing an enhanced Decent Homes Standard
Centre for Sustainable Energy 13
3.1.4 Case studies A review of relevant projects and programmes both inside and outside of London was undertaken to identify and prepare a number of suitable case studies which could illustrate the scope of work being implemented and the lessons learned. To assist in this task, and to gauge the opinions and experiences of relevant organisations to inform the study as a whole, a number of local authorities, housing associations and other stakeholders were invited to complete a questionnaire asking for information on the implementation of sustainable energy measures, refurbishment strategies, costs and funding, and monitoring issues. The following organisations either responded to the questionnaire or provided input to the case studies: • London Borough of Barking and Dagenham • London Borough of Croydon • London Borough of Islington • London Borough of Camden • Brent Housing Partnership • National Housing Federation • Metropolitan Housing Partnership • Gentoo Group Ltd. • Sandford Housing Co-operative • Wherry Housing Association • Hackney Homes • Urbed Ltd. • Worthing Homes
3.2 Scenario development In order to illustrate the likely range of measures and costs of an enhanced Decent Homes Standard, a number of scenarios were developed around sustainable energy (energy efficiency and low/zero carbon energy generation), water efficiency and mitigation of summer overheating. These are described below.
3.2.1 Sustainable energy measures The sustainable energy scenarios described below are primarily based on achieving a defined SAP8 standard as modelled for social rented homes. The SAP targets themselves were defined in the original study proposal to the Greater London Authority and reflect the most recent publications and Government policy announcements at the time of writing. The SAP target of 70 proposed in Scenarios 1 and 2 represents the possible level of intervention required to meet the Governments proposed Warm Homes standard. The Household Energy Management Strategy states a desire to develop a new “Warm Homes” standard for social housing, to supplement the Decent Homes Standard. Furthermore, the strategy states: “The new Warm Homes standard will help to raise the energy efficiency of social housing from around SAP 59 to at least 70, radically reduce emissions, and make a real impact to reduce energy bills for tenants. It will also enable industry to develop the capacity to roll out these technologies
8 The Standard Assessment Procedure (SAP) is the national (UK) methodology in calculating the energy performance of buildings.

Costing an enhanced Decent Homes Standard
Centre for Sustainable Energy 14
across the residential sector more widely, and make a significant contribution to job creation over the period.”9 The SAP target of 81 represents the standard used in several recent reports on alleviating fuel poverty10 and installing the measures required to reduce emissions to a safe level i.e. 80% by 205011. In the case of the Home Truths report, the study recommended an average SAP 80 by 2050 to reduce emissions by 80%; however, for the purposes of this research the SAP target has been increased to 81 as this represents Energy Performance Certificate Band B12. Initial discussions with the Project Steering Group were held to review the typology analysis, scenario development and approach to modelling the opportunities for community heating. The following summarises the three final scenarios used in the analysis:
• Scenario 1 SAP 70, least cost with community heating will provide a modelled energy standard based on packages of measures, at least cost, that meet a target SAP of 70.
• Scenario 2 SAP 70, maximised carbon savings with community heating will provide a modelled energy standard based on packages of measures, with the highest carbon saving for the investment (£ per tC), that meet a target SAP of 70.
• Scenario 3 SAP 81, least cost with community heating will provide a modelled energy standard based on packages of measures, at least cost, that meet a target SAP of 81.
Given that half of London’s social housing is concentrated in a quarter of its wards13, which suggests there are areas of high heat density within social housing developments, there should be considerable scope for community heating opportunities. The three Scenarios were first modelled to determine the measures required to achieve a SAP target of 70 or 81. The results were then reviewed to implement community heating where appropriate. CSE used the data underpinning the London Heat Map to establish the scale of opportunity for community heating in social housing. Postcodes were selected from the London-wide heat maps that fall within the top decile of heat demand for all sectors. The domestic housing in these postcodes was then profiled to identify their Primary Generic Types (PGT) i.e. matching those used for the English House Condition Survey analysis discussed in Section 3. The frequencies of Primary Generic Types that occur in areas of high heat demand by tenure were then analysed to ascertain those properties in the English House Condition Survey that would be most suitable for community heating. Those records in the English House Condition Survey that were deemed suitable for community heating were then flagged and the applied measure packages were subsequently revised to reflect any cost implications14. For the purpose of the analysis, where a property was deemed suitable for community heating, it was assumed that the measure would replace any incidence of solid wall insulation i.e. if a property were to receive external or internal insulation then this would be removed in favour of community heating. The tension between these two measures stems from the fact that the reduction in heat demand provided by solid wall insulation tends to reduce the business case for community heating (especially with Combined Heat and Power) and hence it is often not cost-effective to do both.
9 DECC 2010, Warm Homes, Greener Homes: A Strategy for Household Energy Management, p28 10 e.g. Consumer Focus 2010, Raising the SAP, Association for the Conservation of Energy and the Centre for Sustainable Energy 11 Friends of the Earth 2009, Home Truths, Brenda Boardman 12 SAP 80 would represent Band C and as such is less desirable than 81 13 Communities and Local Government, Housing Live Table 514, 2009 14 Costs for infrastructure and connection were taken from DECC 2009, the Potential and Costs of District Heat Networks, POYRY and AECOM
Costing an enhanced Decent Homes Standard
Centre for Sustainable Energy 15
It is recognised that the installation of internal wall insulation results in significant disruption to the occupants of a home and is therefore not always a feasible option. In addition to the modelling of community heating, the analysis was therefore also run separately with first internal then external wall insulation. The results in Section 5 indicate the significant extra cost where external wall insulation is considered over internal wall insulation. Therefore, as internal space and / or occupant issues may make internal wall insulation impossible and conversely planning constraints may make external unacceptable, the analysis of costs by primary generic type has been revised to ensure the maximum range is shown.
3.2.2 Water efficiency The Consultation Draft Replacement London Plan15 states that, currently, the average Londoner consumes 161litres/day of water, 7% above the national average of 150litres/day. The Mayor of London’s Water Strategy (2010) concurs with the London Plan, which states that in planning decisions, development should minimise the use of treated water by meeting water consumption targets of 105litres/person/day in new build residential development. In addition, national planning policy states that all new social housing must be built to the Code for Sustainable Homes Level 3 target of 105litres per person per day (l/p/d) and from April 2011, all new private housing must be built to achieve 125l/p/d. The Mayor’s Supplementary Planning Guidance on Sustainable Design and Construction encourages developers to aim for 80l/p/d, while the London Plan 2008 recommends that the standard be set at “80 litres per person per day by 2016 at the latest”. These targets are explicitly for new build properties. Whilst the cost of retrofitting existing housing to these standards is considerably greater than installing measures during construction, they have nonetheless been used as a guide to the modelling in this study. The water efficiency scenarios were designed based on findings from several recently conducted studies. These primarily included BRE’s ‘Towards a Successor Standard to Decent Homes’, which examined three different sets of measures each designed to reduce water consumption to a level of 105litres/person/day, and the Environment Agency work to cost compliance with the Code for Sustainable Homes16. Additional sources of information are described in Section 5.2. As a result of reviewing these studies, and using the policy targets for new build properties as guidance, three water efficiency scenarios were modelled as follows:
• Water Efficiency Scenario 1: 130litres/head/day: involving low flush toilets, coupled basin taps, mixer and low flow showers.
• Water Efficiency Scenario 2: 100litres/head/day: involving low flush toilets, low flow taps, showers and low volume baths.
• Water Efficiency Scenario 3: 80litres/head/day: including the measures from scenario 1, with additional reduction in water consumption from low use appliances and the harvesting of rainwater for internal use.
Available literature was reviewed to determine the extent of water efficiency measures that have already been installed as part of various programmes and initiatives. This was then taken into account when calculating the total number of installations required under the three scenarios. 15 Chapter 5 – London’s Response to Climate Change 16 Assessing the cost of compliance with the Code for Sustainable Homes; Environment Agency, 2007

Costing an enhanced Decent Homes Standard
Centre for Sustainable Energy 16
The emissions reductions of each scenario were estimated, based on emissions savings from the water supply and treatment industry plus the reduction in consumption of hot water from different heating fuels (gas, oil, electricity and communal). The impact of emissions from the use of electric showers is included in the savings calculations.
3.2.3 Summer overheating In evaluating the potential for the mitigation of summer overheating, a combination of measures currently available to reduce overheating in the summer months (June, July and August) were considered. These were limited to measures of a technical nature rather than behavioural interventions. Low, medium and high impact scenarios have been included in the study, based on two indicators: the assessment of the internal temperatures based on Appendix P of SAP 2005; and the effectiveness of measures to reduce the number of hours internal temperatures are above CIBSE comfort levels, as modelled by Porritt et al17. The low impact scenario is considered a minimum implementation scenario, which provides a minimum reduction in internal temperatures during summer months, whilst the high impact scenario is a robust combination to significantly reduce overheating across the entire social housing stock.
• Overheating Scenario A: (lower cost) – including a combination of the lowest cost measures that will provide a minimum level of protection to all homes.
• Overheating Scenario B: (medium cost) – provides a significant level of protection through a complementary selection of measures in all types of home.
• Overheating Scenario C: (higher cost) – assumes a whole-house approach, providing maximum reduction of solar gain and includes measures for all floors, walls, roofs and windows where suitable.
It should be noted that some energy efficiency measures that are included in the previous section will reduce the propensity for some houses to overheat. For example wall, roof and floor insulation will help reduce the amount of heat absorbed by buildings, and thus reduce internal temperatures. However, for this section of the study measures have only been included that specifically target summer overheating. The measures selected for the three scenarios are passive measures and as such will not have any meaningful impact on emissions, except where air conditioning may exist in the home. However, for the purposes of this study, it has been assumed that social housing in London has not been fitted with any air conditioning units or energy intensive ventilation systems. These measures are likely to have substantial negative impacts on the bills of tenants and the emissions of homes.
3.3 Modelling of options The Improvement Prophet package18 provides a sophisticated energy efficiency and fuel poverty model for the existing housing stock in England. This has been adapted and developed to provide a unique model of the building typology of the social housing stock in London. The model was successfully deployed to evaluate fuel poverty in London on behalf of the GLA in 2009. A bespoke Microsoft SQL query was developed for each of the scenarios in this study, to specify the energy
17 Building orientation and occupancy patterns and their effect on interventions to reduce overheating in homes during heat waves, Porritt et al, May 2010. 18 Improvement Prophet project profile http://www.cse.org.uk/projects/view/1144
Costing an enhanced Decent Homes Standard
Centre for Sustainable Energy 17
efficiency improvements for social housing, i.e. determining the packages selected in the Energy Improvement Model of Improvement Prophet. The scope of measures considered and their descriptions are included in Annex A.
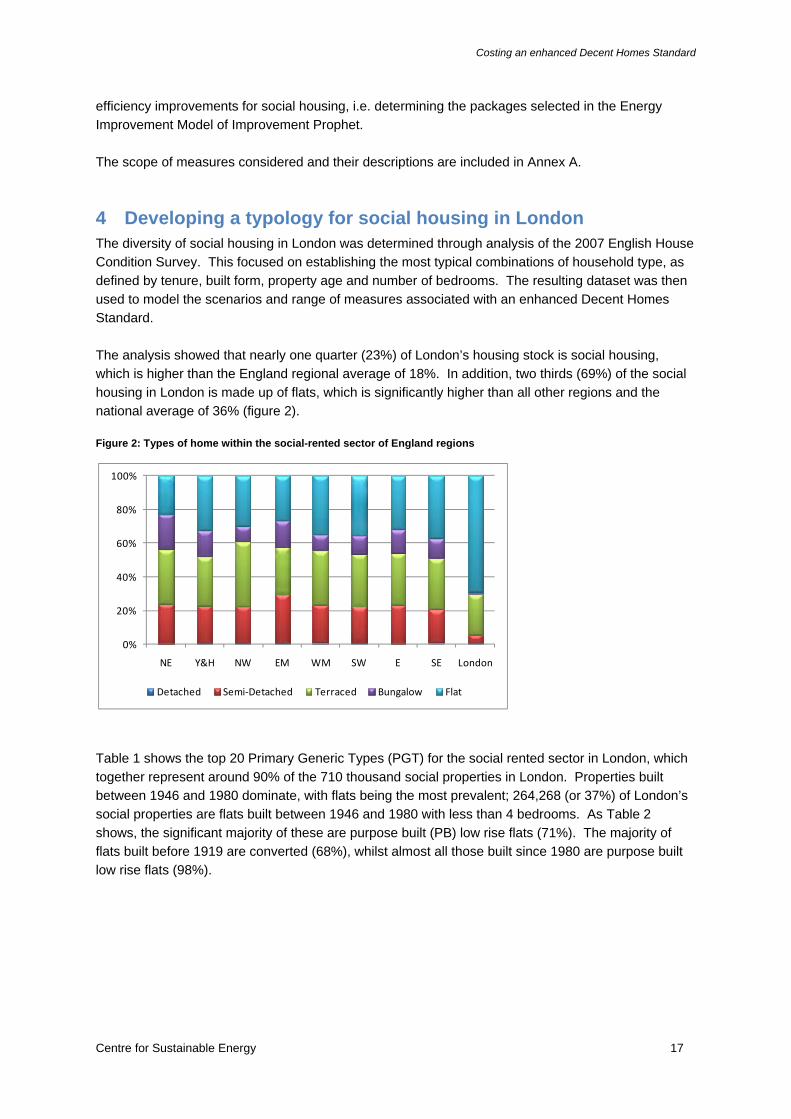
4 Developing a typology for social housing in London The diversity of social housing in London was determined through analysis of the 2007 English House Condition Survey. This focused on establishing the most typical combinations of household type, as defined by tenure, built form, property age and number of bedrooms. The resulting dataset was then used to model the scenarios and range of measures associated with an enhanced Decent Homes Standard. The analysis showed that nearly one quarter (23%) of London’s housing stock is social housing, which is higher than the England regional average of 18%. In addition, two thirds (69%) of the social housing in London is made up of flats, which is significantly higher than all other regions and the national average of 36% (figure 2). Figure 2: Types of home within the social-rented sector of England regions
Table 1 shows the top 20 Primary Generic Types (PGT) for the social rented sector in London, which together represent around 90% of the 710 thousand social properties in London. Properties built between 1946 and 1980 dominate, with flats being the most prevalent; 264,268 (or 37%) of London’s social properties are flats built between 1946 and 1980 with less than 4 bedrooms. As Table 2 shows, the significant majority of these are purpose built (PB) low rise flats (71%). The majority of flats built before 1919 are converted (68%), whilst almost all those built since 1980 are purpose built low rise flats (98%).
0%
20%
40%
60%
80%
100%
NE Y&H NW EM WM SW E SE London
Detached Semi‐Detached Terraced Bungalow Flat

Costing an enhanced Decent Homes Standard
Centre for Sustainable Energy 18
Table 1: Top 20 typologies for London social housing in the EHCS
Rank Count
% of total
social
housing
stock
Built
form Age Bedrooms
Purpose built
flats- low rise
Purpose
built flats-
high rise
1 105,741 14.9% Flat 1946 to 1980 1 bed 81% 19%
2 103,546 14.6% Flat 1946 to 1980 2 bed 63% 37%
3 54,981 7.7% Flat 1946 to 1980 3 bed 67% 33%
4 45,854 6.5% Flat pre-1919 1 bed 26% 6%
5 36,440 5.1% Flat 1980+ 1 bed 100% 0%
6 33,940 4.8% Flat 1920 to 1945 2 bed 89% 4%
7 28,966 4.1% Terraced 1946 to 1980 3 bed - -
8 26,395 3.7% Flat pre-1919 2 bed 30% 0%
9 26,305 3.7% Flat 1980+ 2 bed 96% 4%
10 23,450 3.3% Terraced 1980+ 2 bed - -
11 19,082 2.7% Terraced 1920 to 1945 2 bed - -
12 18,293 2.6% Terraced 1980+ 3 bed - -
13 17,657 2.5% Terraced 1920 to 1945 3 bed - -
14 16,449 2.3% Semi-Det. 1946 to 1980 3 bed - -
15 14,871 2.1% Terraced 1946 to 1980 2 bed - -
16 14,649 2.1% Flat 1920 to 1945 1 bed 89% 0%
17 14,426 2.0% Terraced pre-1919 3 bed - -
18 14,405 2.0% Flat pre-1919 3 bed 37% 0%
19 11,977 1.7% Flat 1920 to 1945 3 bed 100% 0%
20 10,629 1.5% Terraced 1980+ 4 bed - -
Total 638,056 89.8% – – – 52% 13%
Note – low rise < 6 floors above ground; high rise >= 6 floors above ground (where floor 1 = ground level)
Table 2: Summary of social rented flats in London (all bedroom counts)
Age Count Not purpose built % Low rise % High rise %
1946 to 1980 270,295 0.0% 71.4% 28.6%
pre-1919 88,817 67.8% 29.2% 3.0%
1980+ 69,343 0.0% 98.4% 1.6%
1920 to 1945 61,197 6.5% 91.5% 2.1%
Total flats 489,652 13.1% 70.1% 16.8%

Costing an enhanced Decent Homes Standard
Centre for Sustainable Energy 19
5 Modelling of scenarios
5.1 Sustainable energy measures 5.1.1 Overall costs The Improvement Prophet tool was used to model three alternative scenarios for sustainable energy measures i.e. energy efficiency and low/zero carbon energy generation technologies. The scenarios represent different aspirations for an enhanced Decent Homes Standard. Table 3 shows the starting efficiency of social housing in London as an average SAP of 59.3. Following the installation of measures, the average SAP of London’s social homes exceeds the target threshold for all three scenarios, namely SAP 70 for Scenarios 1 and 2 and SAP 81 for Scenario 3.
Table 3: Average SAP ratings for social housing
Average SAP rating
English House Condition Survey 2007
(London data) 59.3
Energy Scenario 1 74.0
Energy Scenario 2 74.0
Energy Scenario 3 81.7
Table 4 provides an overview of the costs for all three scenarios for London’s social housing sector. The table contains a set of costs from the Improvement Prophet modelling (as based on London data within the English House Condition Survey) and an alternative estimate based on the London Heat Map (to determine a range and allow refinement for the use of community heating). The costs shown for the London Heat Map are based on the average costs for the typology discussed in Section 4, i.e. the average costs are derived for each typology and these are then applied to the postcode dataset where a common typology exists19.
Table 4: Modelled costs for sustainable energy measures
Data source Total costs [£m] Mid-point [£m]
Scenario 1 (EHCS) 2,654 2,907
Scenario 1 (London Heat Map) 3,160
Scenario 2 (EHCS) 3,236 3,539
Scenario 2 (London Heat Map) 3,842
Scenario 3 (EHCS) 4,408 5,235
Scenario 3 (London Heat Map) 6,062
The mid-point costs for each scenario shown in Table 4 represent the mid-point between the Improvement Prophet-based EHCS cost and those derived from the London Heat Map. These costs include the installation of community heating where appropriate, with the necessary adjustment to the previous package of measures i.e. where the package previously included solid wall insulation this is removed to maximise the economics for community heating (see Section 3).
19 It is important to note the average costs for each typology are applied where a sufficient number of cases exist in the EHCS. The model therefore first derives the costs by region, tenure, property age, built form and size. If insufficient cases are available then an England version is applied i.e. tenure, property age, built form and size. For social housing the costs for the most common typologies are based on London averages.

Costing an enhanced Decent Homes Standard
Centre for Sustainable Energy 20
5.1.2 Adjusted costs (excluding internal wall insulation) Internal wall insulation can cause significant disruption to tenants during installation and some housing associations are likely to have concerns over the logistics of implementing this measure on a large scale. In order to reflect this, Table 5 shows the additional costs of delivering the scenarios without internal wall insulation i.e. substituting the measure with external wall insulation in the majority of cases. This increases the cost by £200m for Scenario 2 and £1.1bn for Scenario 3. Scenario 2 included a higher proportion of solid wall insulation from the outset relative to the other scenarios, therefore reducing the additional expense. A summary of sustainable energy measure costs for the top 20 typologies is shown in Annex B.
Table 5: Adjusted costs for packages that include CHP and exclude internal wall insulation
Scenario Total cost [£m] Total cost [£m] with CHP Total cost [£m] with no IWI
Scenario 1 (EHCS) 2,654 2,953 3,667
Scenario 2 (EHCS) 3,236 3,543 3,724
Scenario 3 (EHCS) 4,408 4,630 5,738
5.1.3 RE:NEW programme and delivery costs The additional costs to cover staff time for asset management and delivery of these scenarios is assumed to be £90 per property, based on findings from the RE:NEW programme’s delivery model20 (see section 2). This adds a maximum additional cost of £63.9m to the costs shown in Table 4.
5.1.4 Distribution of measures across scenarios Table 6 shows the measures installed under each scenario, with Scenario 3 delivering notably higher numbers of solid wall insulation, solar water heating and photovoltaics. Notably, the number of air source heat pumps has been reduced as additional measures such as solid wall insulation is needed to achieve a SAP of 81. Table 7 below shows a further breakdown of the sustainable energy measures by scenario for flats built between 1946 and 1980 with less than 4 bedrooms i.e. the three most common typologies discussed earlier representing 37% of London’s social housing stock.
Table 6: Installed measures by scenario for social housing in London
Measure Scenario 1 Scenario 2 Scenario 3
Insulation (walls, draught proofing or lofts) 530,760 554,963 654,519
Loft insulation to 270mm 147,617 204,842 251,822
Solid wall insulation 168,893 172,798 294,401
Heating system replaced or improved 388,210 403,065 624,181
Gas boiler fitted 268,850 280,361 509,499
Air source heat pump 49,092 49,092 18,438
Solar water heating 82,607 82,607 109,997
Photovoltaics 66,153 66,153 77,061
Micro wind turbine 9,642 9,642 8,966
Renewables of any sort 124,537 124,537 265,540
Communal heating from central boiler / CHP 67,697 71,041 96,244
20 RE:NEW – Homes Energy Efficiency for Tomorrow, London Development Agency. http://www.lda.gov.uk/projects/renew/index.aspx (formally the Homes Energy Efficiency Programme (HEEP))

Costing an enhanced Decent Homes Standard
Centre for Sustainable Energy 21
Table 7: Installed measures by scenario for flats built between 1946-1980 with <4 bedrooms
Measure Scenario 1 Scenario 2 Scenario 3
Insulation (walls, draught proofing or lofts) 165,645 170,740 230,832
Loft insulation to 270mm 40,631 45,160 49,902
Solid wall insulation 56,863 58,433 88,247
Heating system replaced or improved 114,724 119,381 208,844
Gas boiler fitted 34,267 36,185 130,845
Air source heat pump 26,001 26,001 9,644
Solar water heating 9,610 9,610 17,729
Photovoltaics 8,420 8,420 13,618
Micro wind turbine 6,782 6,782 6,773
Renewables of any sort 13,014 13,014 24,450
Communal heating from central boiler / CHP 54,456 57,195 68,355
5.1.5 Emissions reduction Table 8 compares the emissions savings from each of the scenarios implemented in London’s social housing, compared to the private sector and England as a whole. The estimated emissions reduction for social housing in London is significantly lower because, on average, social housing is more efficient than the private sector stock and as such receives lower numbers of measures under the various scenarios.
Table 8: Total carbon dioxide emissions reduction in housing by scenario (measures and projected LCTP emissions factors)
Remit Scenario 1 Scenario 2 Scenario 3
England (all tenures) 43.6% 45.4% 56.3%
London (social) 37.1% 37.5% 52.9%
London (private) 44.0% 44.8% 59.5%
The Mayor has made a commitment to reduce London’s emissions by 60% by 2025 to set London on a faster trajectory to the UK’s 80% target by 2050. Appendix C in the Draft Climate Change Mitigation and Energy Strategy contains a number of key goals for the following sectors:
• Energy supply21 – the GLA has identified the potential for 25% of London's energy (heat and electricity) to be supplied by decentralised energy in 2025. In addition to the grid decarbonisation included in the Government’s Low Carbon Transition Plan22, the GLA has an aspiration to support additional measures that provide low carbon electricity generation (i.e. an increase in nuclear, Carbon Capture and Storage (CCS) and renewable energy capacity than is currently planned by 2025, as recommended by the Climate Change Committee with a grid carbon intensity of 200gCO2/kWh)
• Homes (4.84MtCO2/yr) – by 2025 there is an aspiration for the Homes Energy Efficiency Programme (HEEP) to approach 2.4 million homes to provide them with easy to treat
21 Energy supply savings captured in other sectors 22 Grid carbon intensity of 300 g CO2/kWh in 2025

Costing an enhanced Decent Homes Standard
Centre for Sustainable Energy 22
measures i.e. all homes have cavity and loft insulation installed, with over 400,000 homes having solid wall insulation installed.
• Homes (2.82MtCO2/yr) – savings as outlined in UK Low Carbon Transition Plan, which only includes the proportion of these schemes that would be delivered in London without enabling Mayoral programmes.
The savings presented in Table 8 provide a significant contribution to the Mayor’s own commitment to a 60% cut in London’s carbon emissions by 2025. The decarbonisation of electricity and the sustainable energy measures themselves would need to be complimented by additional savings from behavioural change and the market transformation programme i.e. improved appliance efficiency. The savings from these additional measures have not been quantified above. However, based on the detailed analysis performed by CSE and ACE for the WWF UK report ‘How Low?23’, a further 5% reduction in residential emissions (i.e. housing only) from behavioural change and approximately 20% from improved appliance efficiency could be expected.
Table 9: Total carbon dioxide emissions reduction in housing by scenario (measures and projected Mayor’s emissions factors)
Remit Scenario 1 Scenario 2 Scenario 3
England (all tenures) 48.9% 49.9% 60.6%
London (social) 43.4% 43.5% 59.0%
London (private) 49.3% 49.7% 64.2%
Table 9 above shows the emissions reductions associated with each scenario allowing for the Mayor’s higher target for the decarbonisation of electricity. If behavioural change and appliance efficiency deliver a further 25% reduction in emissions then the three scenarios may all achieve the Mayor’s 60% target by 2025. The Mayor’s 60% target covers all sectors, with the Draft Climate Change Mitigation and Energy Strategy defining the potential savings in 2025 from homes as 9.2MtCO2/yr, work places as 11.9MtCO2/yr and transport 2.57MtCO2/yr. Homes are therefore expected to provide a higher proportion of the overall savings compared with transport i.e. 38% vs. 11%. The 2007 London Climate Change Action Plan defined emissions from homes in 1990 as 15.8MtCO2/yr, work places 19.7MtCO2/yr and transport 9.5MtCO2/yr. The emissions reduction for transport again represents a far lower proportion of the 1990 total when compared to homes or work places (27%). The 2025 target is therefore likely to require a more challenging scenario for homes i.e. as defined by Scenario 3 with community heating. Table 10 shows the modelled carbon reduction for social housing as a result of each scenario.
Table 10: Total carbon dioxide emissions reduction in housing by scenario (measures and projected Mayor’s emissions factors)
Remit Scenario 1 Scenario 2 Scenario 3
London (social) 1.39 1.40 1.98
London (social) 200gCO2/kWh 1.62 1.63 2.21
23 http://www.cse.org.uk/downloads/file/how_low_report%20%282%29.pdf

Costing an enhanced Decent Homes Standard
Centre for Sustainable Energy 23
5.2 Water efficiency measures 5.2.1 Existing data Approximately 23% of domestic carbon dioxide emissions are from hot water usage. Saving water at point of use therefore reduces domestic hot water requirements and the emissions associated with its heating. Reducing water use will also achieve further emissions savings from the water treatment and supply process. For existing buildings, the opportunities to install water efficient appliances can be less due to the plumbing, structure of the building, and the types of existing appliances, although the impacts of behavioural change is similar to that for new build. Information on water efficiency measures and consumption behaviour was drawn from a number of sources including: BRE24; Environment Agency25; Waterwise26; ARUP27; the Market Transformation Programme28; and the Energy Savings Trust29. Figure 3 below illustrates typical domestic water consumption from an older non metered property, and shows that the biggest use of water is from flushing toilets and use of taps. Personal washing accounts for approximately a quarter of all water used in the home. Figure 3: Domestic water consumption by end usage for unmetered properties built before 1989 26
The BRE work focused on three different scenarios to reduce consumption to 105litres/person/day, whilst the Environment Agency investigated costs of various measures to reduce water consumption to comply with four levels of the Code for Sustainable Homes (130, 120, 100 and 80litres/person/day). Detailed sources of information behind the BRE scenarios, the costing methodology or the chosen
24 Towards a Successor Standard to Decent Homes, BRE, April 2009 25 Assessing the cost of compliance with the Code for Sustainable Homes; Environment Agency, 2007 26 Evaluation of the water saving potential of social housing stock in the Greater London Area, September 2009 27 Your Home in a Changing Climate, Retrofitting Existing Homes for Climate Change Impacts, Report for Policy Makers, ARUP, February 2008. 28 BNWAT28: Water consumption in new and existing homes 29 Measurement of Domestic Hot Water Consumption in Homes, EST, 2008.
Bath, 16.5%
Shower, 8.6%
Internal tap, 23.5%
Toilet, 29.2%
Washing Machine, 12.5%
Dishwasher, 1.5%
Other internal, 0.6%
External tap, 7.3%
Water softener, 0.3%

Costing an enhanced Decent Homes Standard
Centre for Sustainable Energy 24
reduction target were not available. Furthermore, two scenarios included equipment that has yet to be released on the market and therefore represents an uncertainty in terms of performance and cost. The Environment Agency work examined data from WRc’s Identiflow microcomponent studies, Market Transformation Programme (MTP) sources and Water Technology List as well as specifically commissioned research to investigate water use information, i.e. typical shower duration and consumption per use, frequency and average flush volume of dual flow toilets and fill volume of different baths. The work assessed products that were available on the market, approved by the Water Regulations Advisory Scheme (WRAS) and listed in the Water Fittings and Materials Directory. In its methodology, the Environment Agency (EA) prioritised products that required no change in user behaviour to produce the required water efficiencies. Such examples include low/dual flow toilets or spray patterned taps. Measures that impact more directly on consumers include the use of water butts to provide water for the garden or lower volume baths. As part of the review of relevant literature, work by Waterwise was used as guidance and in water savings calculations. Findings from ‘Evaluation of the water saving potential of social housing stock in the Greater London Area’30 suggest that electric showers are likely to have negative impacts on resource (i.e. energy) consumption, carbon emissions and domestic utility bills. However, to reduce consumption to 100litres/person/day, electric showers are deemed necessary in the scenarios. Despite the associated increase in energy consumption, total carbon emissions are still reduced due to the overall reduction in hot water demand. The current study has used the premise of the EA work and focused on water efficiency measures that reduce water consumption in all social housing to three levels: 130, 100 and 80 litres/person/day. These targets approximately correspond to national planning policy which states that all new private housing must be built to 125l/p/d, plus the Mayor of London’s Water Strategy (2010), the London Plan and Code for Sustainable Homes Level 3 target of 105 litres/person/day for (social) new build residential development. In addition, the Mayor’s Supplementary Planning Guidance on Sustainable Design and Construction encourages developers to aim for 80l/p/d, while the London Plan 2008 recommends that the standard be set at “80 litres per person per day by 2016 at the latest”. The choice of measures from each scenario was supported by work reported in ‘Your Home in a Changing Climate’27. Accurately quantifying consumption of water will always be subject to errors due to problems associated with different system designs and how people use them. For example, the range of shower designs and spray patterns, droplet pressure on skin and heat losses through plumbing all effect individual behaviour; precise estimates of average water consumption of such equipment is therefore difficult to determine. Data collection for this report has endeavoured to capture the most recent thinking and findings from the most relevant studies. A proportion of social housing in London will have already received measures and upgrades through past initiatives. The results from a number of surveys and reports have been collated and the following assumptions have been made about London’s social housing:
• The majority of homes have baths and 21% of these are low volume (BRE);
30 Waterwise, Sept 2009

Costing an enhanced Decent Homes Standard
Centre for Sustainable Energy 25
• 30% of homes have mixer showers, either in stand alone cubicles or over baths (BRE and Waterwise);
• No homes have had electric showers installed, therefore 70% of homes have no shower (BRE and Waterwise). In reality, some electric showers will have been installed in social housing in London, despite reports and studies suggesting otherwise. However, the true figure is probably under 5% of all stock and will not have a significant impact on the costing calculations.
• Half of London’s social housing is suitable for rainwater harvesting (BRE);
• 25% of homes have toilets with a maximum flush flow of 6 litres (the remaining 75% having higher flush volumes) (BRE).
5.2.2 Cost of measures Costing of measures was determined from the Environment Agency study which has the most transparent methodology. The study used a combination of manufacturers’ and suppliers’ literature and websites, water efficiency and green building products websites and the Home Builders Federation. Independent verification of these costs was also obtained through manufacturers’ websites. A large programme of co-ordinated work from large housing providers or borough councils is likely to result in a bulk buy discounts, although as this cannot be guaranteed such a discount has not been included in the final costs. However, the costs provided are VAT free. Table 11 below provides a breakdown of the measures used in each water efficiency scenario, along with the percentage of social housing receiving each measure. There is a substantial increase in the cost of reducing water consumption to 80 litres/person/day from 100 litres/person/day, and the total costs should not be assumed to have a linear relationship. A significant proportion of the difference between the two costs is from the use of a rainwater harvesting system. It is unlikely that the more demanding target could be reached without the use of such as system. A list of all measures considered for the study are provided in Table D1 in the Annex, with data on frequency of use and average water consumption of each water using device. The total water savings across the whole housing stock for each scenario are provided in Table 12. Reducing the water consumption level to 80 litres per person per day could save 158 million litres a day or 58 million cubic metres of water a year.

Costing an enhanced Decent Homes Standard
Centre for Sustainable Energy 26
Table 11: A breakdown of the fittings and product types for water efficiency scenarios
Scenario Fitting Product % homes receiving
measure Costs (£M)
Scenario 1:
130 litres per
head per day
Toilets 6/4 l or 5 l toilet 75.0 £65.30 Coupled Basin taps – two sets in house 2.5 l/min 99.9 £24.16
Kitchen taps 3 l/min 99.9 £36.24 Mixer shower with low flow shower head 31.34 l/use 70.0 £88.46
low flow showerhead only 30.0 £4.53
Total £218.69
Scenario 2:
100 litres per
head per day
Toilets 3.75 l or 4.5/3 l toilet 100 £87.07 Basin taps – two sets in house 1.7 l/min 99.9 £72.48
Kitchen taps 3.0 l/min 99.9 £36.24
Electric Shower 7.5 kw 100 £85.86
Bath Small 79 £94.58
RWH Water butt 50 £6.65
Total £382.87
Scenario 3:
80 litres per
head per day
Toilets 3.75 l or 4.5/3 l toilet 100 £87.07 Basin taps – two sets in house 1.7 l/min 99.9 £72.48
Kitchen taps 1.7 l/min 99.9 £36.24
Electric Shower 8.5 kW 100 £94.93
Bath Small 79 £94.58
Washing machine Low use 100 £169.30
Dishwasher Low use 100 £211.62
RWH Water butt 50 £6.65 Rainwater harvesting System 50 £695.32
Total £1,468.18
Table 12: Total water savings from different water efficiency scenarios
Scenario Daily water consumption
(litres/head/day)
Total annual water savings
(cubic metres)
Scenario 1 130 26,200,000
Scenario 2 100 39,400,000
Scenario 3 80 57,700,000
5.2.3 Emissions saving Estimating the emissions saving from water efficiency measures involves two separate stages. Firstly, the supply and treatment of water and the industry’s buildings and transport are responsible for carbon emissions. A reduction in the consumption of water therefore results in an associated decrease in water supply related emissions. The average reduction in the water consumption of each

Costing an enhanced Decent Homes Standard
Centre for Sustainable Energy 27
home was calculated assuming an average domestic water consumption of 150 litres/person/day and average occupancy for social housing in London as provided by the English House Condition Survey (2.56). These reductions were then combined with Defra’s conversion factors31 for emissions of greenhouse gases from supply and treatment of water to calculate the annual emissions saving per home. Secondly, the installation of measures such as efficient showers, baths and basin taps will reduce the volume of hot water generated in homes. The Environment Agency has compiled data from a number of sources on the average use of water of different appliances plus the frequency of use per property. By comparing the before and after hot water consumption of such installations, annual reductions in hot water were determined. A report by the Energy Saving Trust for DECC32 provides details on the average energy use in UK homes, including the average energy consumption per litre of hot water in standard and combi boilers. Based on this information, the reduction in energy use associated with reduced water consumption in a property could to be calculated. Defra conversion factors and projected electricity carbon factors where then used to determine the emissions savings for different boiler fuels, and multiplied by the number of properties with each fuel type. Finally, the emissions from electric showers were determined and subtracted from the previous total to arrive at a final annual emissions savings per property for different heating fuels. Table 13 outlines the carbon emissions saving for the three scenarios. The two lower consumption scenarios include electric showers but a higher powered shower is used in the 80 litres/person/day scenario. The extra associated emissions from higher powered showers negate a large proportion of the additional savings from reduction in total water use. This supports the findings of Waterwise and the advice not to use electric showers in place of mixer showers. An electricity carbon factor of 0.3kgCO2 per kWh has been used for the ‘after’ calculation, as predicted by the Low Carbon Transition Programme for 2025. However, the Mayor’s Draft Climate Change Mitigation and Energy Strategy (Appendix C) specifies a target electricity carbon factor of 0.2kgCO2 per kWh and using this value increases the total emissions saving by a further 0.02, 0.03 and 0.04Mt CO2 for the 130, 100 and 80 litres/person/day scenarios respectively.
Table 13: Carbon emissions saving for water efficiency scenarios
130 litres per head per day 100 litres per head per day 80 litres per head per day
Source of savings Emissions
savings (Mt CO2)
Emissions savings
(%) (Mt CO2)
Emissions savings
(%)
Emissions savings (Mt CO2)
Emissions savings
(%)
Reduced total water consumption 0.013 2% 0.035 5% 0.047 7%
Reduced hot water consumption 0.220 33% 0.311 46% 0.316 47%
Emissions from Electric showers 0.0 0% 0.060 -9% 0.069 -10%
TOTAL EMISSIONS SAVINGS 0.233 34% 0.286 42% 0.295 44%
31 http://www.defra.gov.uk/environment/business/reporting/conversion-factors.htm 32 Measurement of Domestic Hot Water Consumption in Homes, EST, 2008.
Costing an enhanced Decent Homes Standard
Centre for Sustainable Energy 28
5.3 Summer overheating 5.3.1 Existing data The overheating of homes during the summer months can be tackled using a wide range of technical, construction and behavioural measures. Examples of such measures can be found in a number of recently published reports by the TPCA33, the EST34, the London Climate Change Partnership35, BRE36 and the European Solar Shading Organisation37. When considering the possible measures to include, this study has focused primarily on those that are most suitable for installation in social housing, and has limited the choice of measures to those of a technical nature rather than behavioural interventions. Furthermore, a number of refurbishments that enhance the thermal performance of a building (e.g. wall and roof insulation, double glazing) will also reduce the extent of summer overheating. However, as these are primarily meant to increase energy efficiency they have been not been included in the modelling. Finally, measures that are likely to have a negative impact in other respects have also been excluded. For example, desk, standing or ceiling fans are likely to increase electricity consumption and therefore reduce the efficiency performance of a home and increase carbon emissions. In addition, they will also increase the electricity bills for inhabitants. The remaining interventions available are not all suitable for all homes. For example, installation of external blinds on high rise flats will be prohibitively expensive due to installation costs, i.e. scaffolding. As a result, the impact of each measure was multiplied by a relevance factor to arrive at an average impact over the entire London social housing stock. Different measures will have different effects on reducing overheating in the home. The team have used two separate indicators to determine the different impact of measures. The first method was to use the calculations described in ‘Appendix P’ of the SAP 2005 calculation, based on the main housing typology as described in Section 4. The calculation takes into account the typical ventilation heat losses, the solar gains and mean external temperature during summer months. The calculation also includes a solar shading factor and the thermal mass parameter of the building. Size and performance specifications of different possible measures (e.g. reduction in solar gains) were obtained from website searches and discussions with manufacturers. These were then used to investigate the impact on the internal temperature of buildings using the SAP calculation. In addition, a recent study by researchers at De Montfort University38 explored the reduction of degree hours (temperature in °C multiplied by time in hours) spent above CIBSE comfort temperatures39 during heat waves. The paper asserts that measuring the number of degree hours is a more accurate representation of the overheating situation in a home, than simply monitoring the time internal temperature remains above a certain temperature. The study measures the reduction in degree hours that each measure had from a base case scenario (no measures). This data was used in this study as a secondary indicator of the impact of such interventions.
33 Shaw, R., Colley, M., and Connell, R. (2007) Climate change adaptation by design: a guide for sustainable communities. TCPA, London. 34 CE129 - Energy Efficiency Best Practice in Housing Reducing overheating – a designer’s guide, EST. 35 Your Home in a Changing Climate, Retrofitting Existing Homes for Climate Change Impacts, A report for policymakers, ARUP 2008. 36 Towards a successor standard to Decent Homes – scoping report, BRE, 2008. 37 Energy saving and CO2 reduction potential from solar shading systems and shutters in the EU-25, ESSO, 2006. 38 S. M. Porritt, L. Shao, P. C. Cropper, and C. I. Goodier (2010) Building orientation and occupancy patterns and their effect on interventions to reduce overheating in dwellings during heat waves, Energy and Sustainable Development Conference proceedings, Leicester, UK, 21st May 2010 39 26°C for bedrooms, 28°C for all other living areas.

Costing an enhanced Decent Homes Standard
Centre for Sustainable Energy 29
The results were then used to determine three possible scenarios. These represent low, medium and high impact (and cost) scenarios. The costs of individual measures have been obtained from various sources, including recent research (see previously mentioned publications), discussions with suppliers and quotation requests. The lowest cost scenario, Scenario 1, represents a selection of the lowest cost measures and a minimum level of intervention. This scenario includes:
• Fitting solar film on all windows;
• Internal shutters to high rise flats;
• Providing solar reflective paint on the smaller proportion of the social housing in London that has flat roofs. (This has the additional benefit of prolonging the durability of roof coverings, as extremes of temperature can speed the rate of degradation.)
The second scenario provides an additional level of protection against summer overheating to the majority of social housing. This medium cost scenario includes measures from Scenario 1 with additional investment for:
• Fitting all low rise flats and houses with Brise Soleil (a term referring to a variety of permanent sun-shading techniques where typically a horizontal projection extends from the façade of a building);
• Fitting all low rise flats and houses with internal shutters.
The final scenario models the cost of a comprehensive approach to reducing summer overheating and includes measures for all walls, roofs and windows where possible. This includes all the measures from Scenario 2 plus the application of light coloured/reflective paint on the external walls of all homes. This is deemed to be a highly effective, but high cost solution to reducing temperature. As a result Scenario 3 is a high cost, high impact scenario.
5.3.2 Cost of measures Table 14 presents the costs for the three proposed scenarios. The total expenditure ranges from £738m for a low cost and low intervention scenario to £3.8bn for a comprehensive package of measures.

Costing an enhanced Decent Homes Standard
Centre for Sustainable Energy 30
Table 14: Measures, impacts and costs of summer overheating scenarios
Average reduction in
mean internal temp
(°C)
Reduction in degree hours above 26deg
- south facing (%)
Reduction in degree hours above 26deg
- north facing (%)
Total Cost £m
SCENARIO 1
Internal Shutters - High Rise Only
1.2 7% 9% £738.8 All housing fitted with Solar Film
Upgrading flat roofs (light colouring)
SCENARIO 2
All Low Rise Housing Fitted with External Shutters
3.2 42% 39% £1,966.0
All Low Rise Housing Fitted with Brise Soleil
Internal Shutters - High Rise Only
All housing fitted with Solar Film
Upgrading flat roofs (light colouring)
SCENARIO 3
Light coloured façade paint
5.1 57% 56% £3,783.8
All Low Rise Housing Fitted with External Shutters
All Low Rise Housing Fitted with Brise Soleil
All housing fitted with Solar Film
Upgrading flat roofs (light colouring)
6 Summary of costs and potential deployment strategy
6.1 Total costs for all measures All the scenarios modelled in this study combine to give 18 possible different combinations of measures. The total combined costs are provided below in Table 15. The figures in bold represent the total costs for all low, medium (medium assuming the low scenario for water is delivered alongside the medium scenarios for energy and summer overheating) or all high cost scenarios for the three areas. For example, for an overall scenario which uses a low cost summer overheating scenario, a low cost water efficiency scenario and ‘Scenario 1 SAP 70’ for sustainable energy measures, the total estimated cost of upgrading London social housing will be £4.1bn.
Table 15: Total costs for all modelled scenario combinations, £m
Summer
overheating
Water efficiency Sustainable energy
Scenario 1 Scenario 2 Scenario 3
Low
Low 3,938 4,528 5,615
Med 4,074 4,664 5,752
High 5,160 5,750 6,837
Mod
Low 5,165 5,755 6,843
Med 5,301 5,891 6,979
High 6,387 6,977 8,064
High
Low 6,983 7,573 8,660
Med 7,119 7,709 8,797
High 8,205 8,795 9,882

Costing an enhanced Decent Homes Standard
Centre for Sustainable Energy 31
A breakdown of the costs for the low, medium and high total cost scenarios for each of the three areas is shown in Figure 4. For the lowest total cost scenario, the cost of improving the energy efficiency of the housing stock dominates. However, for the highest cost scenarios the cost of implementing summer overheating measures becomes more significant. For example, sustainable energy measures account for approximately 75% of the total cost in the low cost scenario, whilst summer overheating measures account for 19%. For the high cost scenario, these figures shift to 47% and 38%, respectively. The costs of water efficiency measures contribute between 6-15% of the total cost, depending on the scenario. Figure 4: Total costs for all modelled scenario combinations
6.2 Deployment strategy for measures Figure 5 below shows the potential deployment strategy for sustainable energy measures. The generous subsidy provided by the feed-in-tariff results in a higher prioritisation of photovoltaics. The funding for loft and cavity wall insulation is likely to decrease significantly after the CERT extension, post 2013. Consequently the funding regime for solid wall insulation is likely to improve as a result of the Supplier Obligation or equivalent from 2014 onwards. Although Figure 5 suggests a general strategic approach when adopting sustainable energy measures, in any individual package of measures the sequencing of works needs careful planning to maximise synergies and minimise negative interactions, especially where a mix of measures can be undertaken without external funding as part of replacement programmes. Examples include the use of the same scaffolding for multiple measures and ensuring that replacement heating systems are appropriate sized bearing in mind the likelihood of future insulation works, which may change heat demand. Further points around deployment and phasing are discussed in Section 7.
£‐
£2,000
£4,000
£6,000
£8,000
£10,000
Low Medium High
Total Costs, £M
Sustainable energy Summer overheating
Water efficiency Total

Costing an enhanced Decent Homes Standard
Centre for Sustainable Energy 32
Figure 5: Potential deployment strategy for sustainable energy measures
7 Implementation of measures – key issues Improvement works to social housing of the kind that may be associated with an enhanced Decent Homes Standard can often be highly disruptive due to the physical work required and time taken to implement measures. There may also be unforeseen technical challenges which emerge in certain situations. The organisations consulted during the course of this study have reported a range of issues largely around technical implementation and tenant management. A summary of the key themes is given below.
7.1 Technical barriers to measures The list of technical challenges faced by project managers and installers in implementing sustainable energy measures is long and will not be documented here. However, a few specific issues have been reported by some organisations – particularly in relation to achieving the higher standards considered in this report. Often, what would appear to be a simple measure with the potential for wide application may in fact not be suitable in some instances. For example, one housing provider reported encountering problems with fitting low flow shower heads on electric showers – in some cases this resulted in an inadequate flow causing the unit to over-heat. Respondents working for one London Borough commented on their experience of using the standard industry insulation material. The width of the cavity in many of the walls in the housing stock meant that after installing insulation, an unexpected problem of thermal bridging arose, especially where buildings had structural features like concrete ring beams. The problem only became evident with the development of dampness and mould after the work had been completed. Investigations with thermal imaging reveal that the insulation was also unevenly distributed, possibly due to its poor structural properties, and was wicking water between the cavities. As a result, the borough investigated other forms of possible insulation material and chose a hydrophobic mineral polyester bead.40 However, since a significant amount of insulation had been completed, tackling the problem of cold or thermal bridging (including dampness and mould growth) is now a major priority for the borough.
40 Bristol City Council also use bead for this reason (a carbon bead as this saves slightly more energy)
YearMeasures 2010 2011 2012 2013 2014 2015 2016 2017 2018 2019 2020 2021 2022 2023 2024 2025InsulationDraught proofing (dp)Cavity wall insulation (cwi)Loft insulation (l i)Internal wall insulation (iwi)External wall insulation (ewi)GlazingDouble glazingHeatingGas condensing boiler (ccb)Air source heap pump (ashp)Solar hot water (shw)PowerSolar photo‐voltaics (spv)
Begin ramping up‐ratesSignificant numbers going inBegin scaling down installations

Costing an enhanced Decent Homes Standard
Centre for Sustainable Energy 33
Solar technologies are often perceived as one of the easier renewable energy measures to implement. However, in some cases the structural capacity of the roof may be insufficient to support the weight of the panels or collectors. New hot water storage tanks installed with solar water heating systems also carry a significant weight and floors on which they will be located may require strengthening. This highlights the importance of detailed pre-installation surveys to identify these and other issues such as the actual roof area available and the risk of shading from nearby obstacles. These kinds of issues can often be resolved by ensuring thorough research from the outset and by establishing a good working relationship with suppliers and installers. To help achieve this, a number of housing associations have arranged training sessions with installers to identify and solve technical problems and to help them understand tenant’s concerns and needs during refurbishment projects. Another respondent stated that by working with a variety of contractors, greater flexibility was enabled resulting in an improvement in the effectiveness of programming. A particularly novel approach to insulating cavity walls of high rise (and therefore expensive and hard-to-treat properties) was revealed during discussions with stakeholders. Several London Borough’s had trained teams of abseilers to fill cavity walls of high rise tower blocks, negating the need for scaffolding and saving approximately 40% of the costs. Some concerns were also expressed about the difficultly of obtaining planning permission for several measures, specifically the external summer overheating installations. For example, several housing providers suggested that it could be extremely difficult, if not impossible, to obtain permission to paint the exterior of homes white. Although not yet widely implemented, much has been learnt on the issues around heat networks and combined heat and power. Particular issues raised included phasing i.e. connecting houses in sequence. An energy plant designed for an entire neighbourhood may only be connected to a relatively small number of homes in the early phases and hence may be working at far less than design efficiency for a significant amount of time. The range of costs also needs to be fully considered from the start to include elements such as heat metering equipment and meter reading operations.
7.2 Liaison with tenants and behavioural change Major improvement works such as internal wall insulation, floor insulation or new heating systems can be highly disruptive to tenants, often requiring daily access to properties for an extended period and frequent rearrangement of furniture and fittings. Project managers have successfully tackled these issues by ensuring adequate communication with tenants before, during and after works are implemented. In some cases the varied expectations of residents have been addressed via tools such as new resident refurbishment guides and customer satisfaction surveys. This is especially important where major works necessitate the ‘decanting’ of residents into temporary accommodation, often for several weeks. The involvement of tenants from day one enables them to feel involved and to know that they are fully engaged in the process. Several survey respondents commented on problems faced with the decanting of tenants. The majority of those preferred to use money available to implement as many measures as possible rather than fund the decanting of residents. Measures that required empty homes were usually held off until houses were naturally unoccupied and before re-letting. A few felt that there was a perceived difference between a maintenance programme and an improvement programme, something that was

Costing an enhanced Decent Homes Standard
Centre for Sustainable Energy 34
often difficult to relate to tenants. For example, conducting works such as dry lining of walls was often misinterpreted as a full interior redecoration. In addition, one respondent reported that a proportion of loft insulation work had not been conducted due to the storage of tenants’ belongings. Although they had received financial support for the installation work, without the necessary funds to assist with loft clearance, the work was often not completed. Such cases highlight the need for clear and regular communication regarding timescales and the nature and scope of works. This needs to be well-managed from the outset. Certain energy efficiency measures will also require a deeper understanding by the tenant as benefits are often only fully realised through ensuring that appropriate behavioural measures are adopted relating to the way in which energy is used in the household, such as correct operation of heating control systems and appliance use. Attitudes to environmental issues before and after refurbishment work were found to change in some cases following the installation of measures, but not in other cases. However, there was evidence to show that where sustainable behaviour makes life easier, such as the provision of showers, occupants will take more sustainable action, such as showering rather than bathing. Smart meter technology can potentially incentivise to make energy saving lifestyle changes by allowing residents to understand, in real terms, the actual cost of certain actions (e.g. difference in cost between using an electric steamer compared with hob steaming). However, the ‘novelty factor’ associated with smart meter technology can also wear off over time. Some refurbishment projects found that the greatest potential for reduced energy consumption is among residents who had least knowledge / awareness and benefited the most from education. In some cases behaviour change was shown to have the largest single impact and was therefore essential to reach the higher carbon reduction standards required. A specific barrier to affecting behavioural change to reduce water consumption was that tenants were aware of significant leakages from Thames Water’s distribution network. In light of this knowledge they were reluctant to reduce their water consumption as they perceived such efforts to be ‘a drop in the ocean’.
7.3 Monitoring of results Calculating the costs and savings of measures can be complex and tend to rely on the SAP or RdSAP41 calculation, which has certain limitations when considering a ‘whole house’ package e.g. SAP does not take into account energy use by appliances. Therefore additional information is usually required – usually by taking assumptions from the Code for Sustainable Homes or from actual billing data. One project reported significant differences in predicted household energy use compared to billed energy use before any measures were implemented. This variation was found to be due to several factors including differences in predicted-to-actual occupancy, fuel costs and local weather patterns. Lower than expected savings after the implementation of measures were also apparent, again mainly due to SAP calculations in some cases not reflecting actual situations such as people using less energy than expected or not using heating controls correctly.
41 The Reduced Data Standard Assessment Procedure (RdSAP) is the Government's official procedure for the Energy Rating of Homes. It is a part of the national (UK) methodology in calculating the energy performance of buildings.

Costing an enhanced Decent Homes Standard
Centre for Sustainable Energy 35
A further example of this is Camden’s Low Energy Victorian House (included as a case study in this report). The renovations and retrofit work was designed in order to bring about a 90% reduction in CO2 emissions, and the house performed well during tests such as thermal monitoring and air pressure checks immediately after the works were complete. However, once the tenants had moved in, they purchased a number of energy intensive consumer goods and their energy behaviour meant that actual reduction in CO2 was closer to 65%. Calculations can be a useful way of predicting general trends but cannot account for people’s behaviour or ability to pay for energy. Using meter readings and bills to check predictions is an essential part of the process but was found to involve a lot of time and effort, with bills often lacking information. The use of intelligent metering or remotely accessed data loggers was suggested as a potential solution. Evidence to support this can be found from results using heat meters by one London Borough. They received funding to provide heat meters to 2,500 homes (approximately £4m). The programme was aimed at fairer distribution of bills in communally heated flats based on accurate consumption data. Previously, bills were based on pooled consumption, but addition of meters enabled energy monitoring of individual properties. The properties had upgraded heating controls installed and using the heat meters residents could monitor energy use and reduce wastage. Initial trials found that in comparison to properties with pooled heating charges, bills were reduced by between £200-600 per property per annum depending on the size (1-4 bedrooms) of each property.
7.4 Phasing of measures As demonstrated in this report, there are many combinations of measures that can be used to achieve a certain target, which will depend on many factors including the nature of the target itself, the house type and house condition. In rolling out a package of measures on individual properties several organisations have taken the approach of implementing measures all at once to the highest specification, which has the obvious advantage of future proofing and maximising synergy between works e.g. using the same scaffolding for building fabric works and for a solar panel installation. Where packages cannot be undertaken in one go, adequately planning a phased roll-out of measures is essential to avoid future problems. For example, communal heating systems can be complex to install and need to be well-designed – particularly where the energy plant is supplying Combined Heat and Power (CHP). Knowledge of annual heat loads and the way they change over the course of a year is vital in correctly specifying a viable system. Current or future refurbishment works involving energy efficiency measures will therefore need to be taken into account as heat loads may change and may impact the economic viability of the heat supply system. As seen in Section 6.2, the external funding environment including initiatives such as the feed-in tariff, CERT/Supplier Obligation and the Green Deal will also have an impact on general deployment strategies.
7.5 Funding In canvassing the opinions of those working to improving London’s social housing, it was clear that concerns about funding were by far the greatest and most widespread. There was also evidence to

Costing an enhanced Decent Homes Standard
Centre for Sustainable Energy 36
suggest that better financial planning, including the overlap of work from different programmes42 could alleviate some pressure and enable more improvements to be carried out. However, human resources and financial expertise varies across the organisations involved. As such the capacity to be more financially savvy varies considerably across the Boroughs of London. It is undeniable that the recent economic situation has affected the strategic planning of stakeholders. There was general uncertainty about where funding might come from in the near future and a number of those contacted were delaying decisions until facts and figures were clearer. There was also a fear that financial constraints could also have an impact on human resources and management of programmes. Whilst some felt that funding from existing programmes may already be guaranteed, the presence of staff to oversee works wasn’t certain. At least one borough of London has set itself some ambitious targets for carbon emissions reductions. They are now concerned that whilst existing work has tackled the more straightforward interventions, a significant future challenge was to meet these targets using more expensive interventions but with potentially less funding.
7.6 Improvement priorities Several of those contacted during the course of the study felt that the previous Decent Homes Standard was somewhat rigid in its remit. Works such as modernising kitchens and bathrooms was not considered the best approach and it was felt that measures such as solid wall insulation, water efficiency measures or new boilers would have been a better focus. In addition, there was a lack of available funds to carry out remedial work on some of the measures installed as part of the standard. However, it should be noted that there is often a clash between the perceived priorities of residents and the desire to increase the sustainability of the housing stock. Many residents responded positively to having modernised amenities and such measures can be a high priority for tenants. Meanwhile, some sustainability teams feel that maintenance and environmental performance of the housing stock is more pressing. For example, when tenants in a series of high rise flats were surveyed by one housing provider, the main concern was one of safety and better external lighting. Once installed, the electricity consumption and related emissions rose considerably. It can be difficult to get tenants to understand some of the measures that have a less obvious impact on their lives, but will both reduce their bills and emissions. This can be illustrated from experience with communally heated buildings: “as communal heating can be so much cheaper than individual heating people may not feel the impact of rising energy prices as much as they would if paying for their own individual heating.”
42 For example, keeping scaffolding that had been funded by one funding stream on a property long enough to allow insulation or wet rendering to be carried out as part of a second programme. This particular example is highly relevant for high rise flats, where many such works are otherwise prohibitively expensive.
Costing an enhanced Decent Homes Standard
Centre for Sustainable Energy 37
8 Conclusions It is widely accepted that the existing Decent Homes Standard does not go far enough in improving environmental performance and quality within housing, particularly with regard to alignment to current national targets for carbon reduction within the built environment. An enhanced Decent Homes Standard is therefore felt by many to be a priority requirement – indeed many housing organisations and partnerships are now experimenting with measures beyond the current standard, with some implementing localised Decent Homes ‘Plus’ programmes. However, there are many different packages of measures that can be considered and each category of social housing type will be suited to certain measures over others due to the many technical, financial and organisational issues around refurbishment projects. This is particularly relevant to London, which is unique in having a large proportion of low and high rise social housing. This study has therefore attempted to estimate the costs of applying packages of measures across the London social housing stock to meet a set of scenarios which may reflect the ambitions of an enhanced Decent Homes Standard. The results have shown that a wide range of costs apply to the scenarios tested and that the packages of measures, and the strategy for their implementation, can be complex. A key theme arising from the surveys conducted during this study indicated that funding concerns were very prominent across the sector, and that the recent economic situation has impacted strategic planning within organisations. There was general uncertainty about where funding might come from in the near future and a number of those contacted were delaying decisions until facts and figures were clearer. Other feedback suggested that technical barriers are still apparent, particularly in relation to achieving the higher standards considered in this report. Synergies and tensions between the installation of multiple measures often do not become apparent until late in the process and hence sharing experiences and lessons learned can be a valuable activity. Other notable issues included the importance of adequate liaison with tenants and awareness-raising of energy issues during work programmes, and the challenges encountered in designing a suitable monitoring regime.

Costing an enhanced Decent Homes Standard
Centre for Sustainable Energy 38
9 Bibliography
• Assessing the cost of compliance with the Code for Sustainable Homes, Environment Agency, 2007 • BNWAT28: Water consumption in new and existing homes, Market Transformation Programme, March 2008. • S. M. Porritt, L. Shao, P. C. Cropper, and C. I. Goodier (2010) Building orientation and occupancy patterns and their effect
on interventions to reduce overheating in dwellings during heat waves, proceedings from “Energy and Sustainable Development”, Leicester, UK, 21st May 2010.
• CE129 - Energy Efficiency Best Practice in Housing Reducing overheating – a designer’s guide, Energy Efficiency Best Practice in Housing, EST, 2005.
• Shaw, R., Colley, M., and Connell, R. (2007) Climate change adaptation by design: a guide for sustainable communities. TCPA, London, 2007.
• Communities and Local Government’s live tables on housing, Table 514: Simple average house prices, mortgage advances and incomes of borrowers, by new/other dwellings, type of buyer and region, United Kingdom, from 1992 (quarterly), 2009. http://www.communities.gov.uk/housing/housingresearch/housingstatistics/housingstatisticsby/housingmarket/livetables/
• Energy saving and CO2 reduction potential from solar shading systems and shutters in the EU-25, European Solar Shading Organisation (ESSO), 2006.
• English House Condition Survey, 2007, Communities and Local Government, May 2010. SN: 6449. [distributor] UK Data Archive, Colchester, Essex.
• Evaluation of the water saving potential of social housing stock in the Greater London Area, Waterwise, 2009. • Home Truths: A low-carbon strategy to reduce uk carbon emissions by 80% by 2050, A report for The Co-operative Bank
and Friends of the Earth, Brenda Boardman, University of Oxford’s Environmental Change Institute, November 2007. • Improvement Prophet, Centre for Sustainable Energy. Project profile: http://www.cse.org.uk/projects/view/1144 • The London Heat Map, LDA. www.londonheatmap.org.uk • The London Housing Strategy, GLA, February 2010. • The London Plan: Supplementary Planning Guidance on Sustainable Design and Construction, Mayor of London, May
2006. • The London Water Strategy, GLA, 2010. • The Major’s London Plan, Chapter 5 – London’s Response to Climate Change, GLA, 2008 • Measurement of Domestic Hot Water Consumption in Dwellings, EST and the Energy Monitoring Company, 2008. • Moving Beyond Decent Homes Standard 2009: Creating the low carbon standard for social housing, Sustainable Action
Housing Partnership (SHAP), April 2009. • The Potential and Costs of District Heat Networks, A report to the Department of Energy and Climate Change, POYRY and
Faber Maunsell|AECOM, April 2009. • Raising the SAP: Tackling fuel poverty by investing in energy efficiency, Report to Consumer Focus by the Association for
the Conservation of Energy (ACE) and the Centre for Sustainable Energy (CSE), November 2009. • RE:NEW – Homes Energy Efficiency for Tomorrow, London Development Agency (formally the Homes Energy Efficiency
Programme (HEEP)). http://www.lda.gov.uk/projects/renew/index.aspx • The Standard Assessment Procedure (SAP), Government methodology for assessing and comparing the energy and
environmental performance of dwellings, DECC/BRE. • Towards a Successor Standard to Decent Homes, BRE, December 2008. • Warm Homes Standard (in preparation), Department for Energy and Climate Change, Communities and Local Government,
the Homes and Communities Agency and Tenant Services Authority. • Warm Homes, Greener Homes: A Strategy for Household Energy Management, DECC 2010. • Your Home in a Changing Climate, Retrofitting Existing Homes for Climate Change Impacts, A report for policymakers,
ARUP 2008.
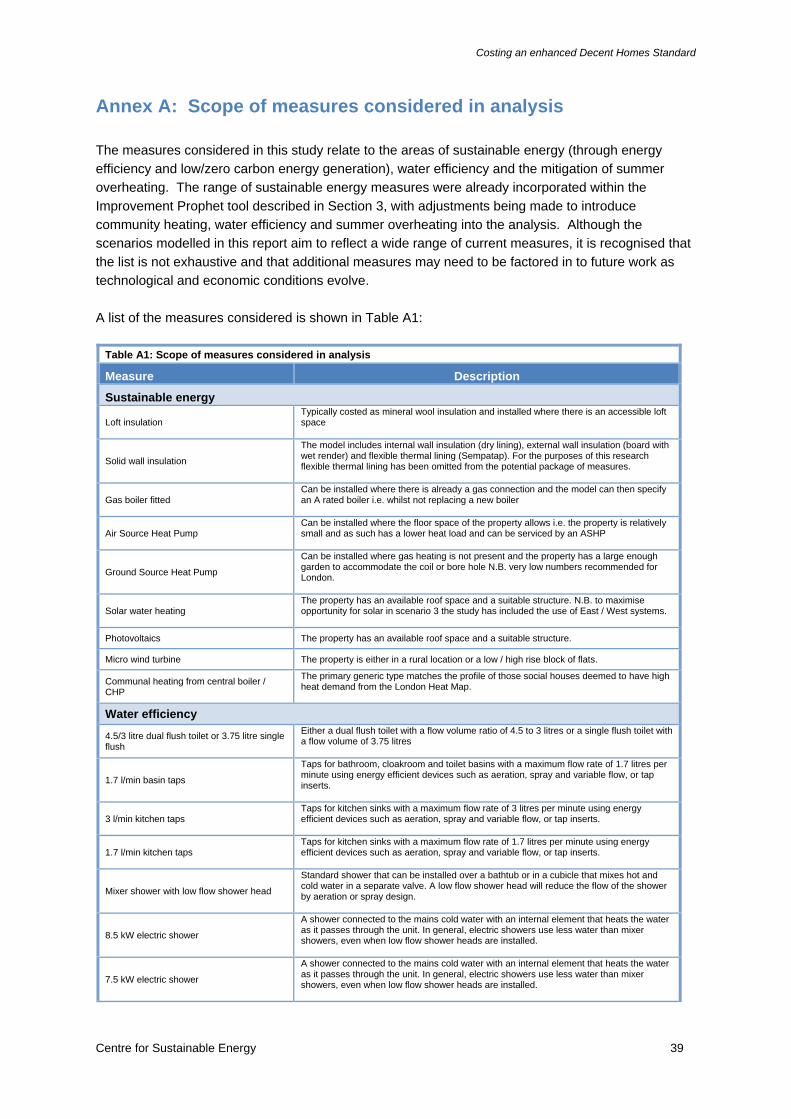
Costing an enhanced Decent Homes Standard
Centre for Sustainable Energy 39
Annex A: Scope of measures considered in analysis The measures considered in this study relate to the areas of sustainable energy (through energy efficiency and low/zero carbon energy generation), water efficiency and the mitigation of summer overheating. The range of sustainable energy measures were already incorporated within the Improvement Prophet tool described in Section 3, with adjustments being made to introduce community heating, water efficiency and summer overheating into the analysis. Although the scenarios modelled in this report aim to reflect a wide range of current measures, it is recognised that the list is not exhaustive and that additional measures may need to be factored in to future work as technological and economic conditions evolve. A list of the measures considered is shown in Table A1:
Table A1: Scope of measures considered in analysis
Measure Description
Sustainable energy
Loft insulation Typically costed as mineral wool insulation and installed where there is an accessible loft space
Solid wall insulation
The model includes internal wall insulation (dry lining), external wall insulation (board with wet render) and flexible thermal lining (Sempatap). For the purposes of this research flexible thermal lining has been omitted from the potential package of measures.
Gas boiler fitted Can be installed where there is already a gas connection and the model can then specify an A rated boiler i.e. whilst not replacing a new boiler
Air Source Heat Pump Can be installed where the floor space of the property allows i.e. the property is relatively small and as such has a lower heat load and can be serviced by an ASHP
Ground Source Heat Pump
Can be installed where gas heating is not present and the property has a large enough garden to accommodate the coil or bore hole N.B. very low numbers recommended for London.
Solar water heating The property has an available roof space and a suitable structure. N.B. to maximise opportunity for solar in scenario 3 the study has included the use of East / West systems.
Photovoltaics The property has an available roof space and a suitable structure.
Micro wind turbine The property is either in a rural location or a low / high rise block of flats.
Communal heating from central boiler / CHP
The primary generic type matches the profile of those social houses deemed to have high heat demand from the London Heat Map.
Water efficiency
4.5/3 litre dual flush toilet or 3.75 litre single flush
Either a dual flush toilet with a flow volume ratio of 4.5 to 3 litres or a single flush toilet with a flow volume of 3.75 litres
1.7 l/min basin taps
Taps for bathroom, cloakroom and toilet basins with a maximum flow rate of 1.7 litres per minute using energy efficient devices such as aeration, spray and variable flow, or tap inserts.
3 l/min kitchen taps Taps for kitchen sinks with a maximum flow rate of 3 litres per minute using energy efficient devices such as aeration, spray and variable flow, or tap inserts.
1.7 l/min kitchen taps Taps for kitchen sinks with a maximum flow rate of 1.7 litres per minute using energy efficient devices such as aeration, spray and variable flow, or tap inserts.
Mixer shower with low flow shower head
Standard shower that can be installed over a bathtub or in a cubicle that mixes hot and cold water in a separate valve. A low flow shower head will reduce the flow of the shower by aeration or spray design.
8.5 kW electric shower
A shower connected to the mains cold water with an internal element that heats the water as it passes through the unit. In general, electric showers use less water than mixer showers, even when low flow shower heads are installed.
7.5 kW electric shower
A shower connected to the mains cold water with an internal element that heats the water as it passes through the unit. In general, electric showers use less water than mixer showers, even when low flow shower heads are installed.
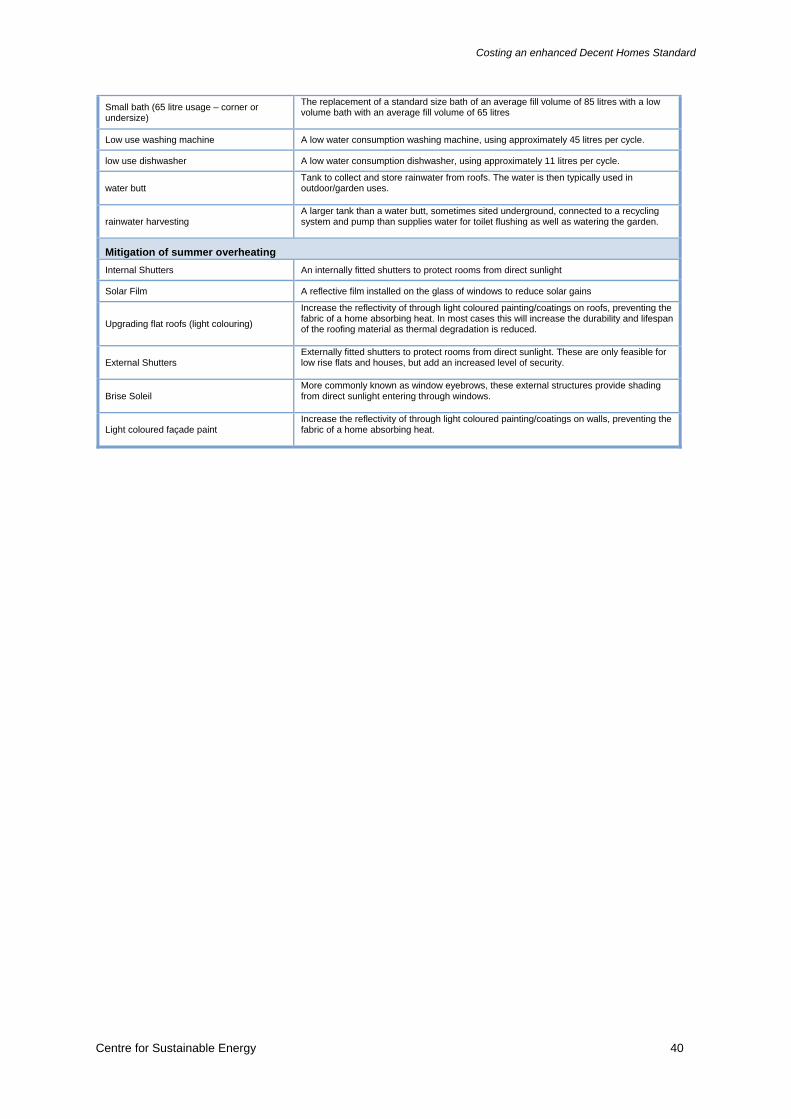
Costing an enhanced Decent Homes Standard
Centre for Sustainable Energy 40
Small bath (65 litre usage – corner or undersize)
The replacement of a standard size bath of an average fill volume of 85 litres with a low volume bath with an average fill volume of 65 litres
Low use washing machine A low water consumption washing machine, using approximately 45 litres per cycle.
low use dishwasher A low water consumption dishwasher, using approximately 11 litres per cycle.
water butt Tank to collect and store rainwater from roofs. The water is then typically used in outdoor/garden uses.
rainwater harvesting A larger tank than a water butt, sometimes sited underground, connected to a recycling system and pump than supplies water for toilet flushing as well as watering the garden.
Mitigation of summer overheating Internal Shutters An internally fitted shutters to protect rooms from direct sunlight
Solar Film A reflective film installed on the glass of windows to reduce solar gains
Upgrading flat roofs (light colouring)
Increase the reflectivity of through light coloured painting/coatings on roofs, preventing the fabric of a home absorbing heat. In most cases this will increase the durability and lifespan of the roofing material as thermal degradation is reduced.
External Shutters Externally fitted shutters to protect rooms from direct sunlight. These are only feasible for low rise flats and houses, but add an increased level of security.
Brise Soleil More commonly known as window eyebrows, these external structures provide shading from direct sunlight entering through windows.
Light coloured façade paint Increase the reflectivity of through light coloured painting/coatings on walls, preventing the fabric of a home absorbing heat.

Costing an enhanced Decent Homes Standard
Centre for Sustainable Energy 41
Annex B: Summary of costs across top 20 typologies for each scenario Table B1: Summary of Scenario 1 costs for the top 20 PGT’s in London’s social housing sector DESCRIPTION OF PGT
Count Table N %
Scenario 1 package cost no CHP with IWI Scenario 1 package cost with CHP SAP
Rank Built form Age Bedrooms Mean Max
Sum
(millions)
% of total
cost Mean Max
Sum
(millions)
% of total
cost Before After
1 Flat 1946 to 1980 1 bed 105,741 14.9% £2,414 £17,269 £255.3 9.6% £3,722 £17,269 £393.6 13.3% 63 75
2 Flat 1946 to 1980 2 bed 103,546 14.6% £3,203 £21,193 £331.7 12.5% £3,802 £21,193 £393.6 13.3% 61 74
3 Flat 1946 to 1980 3 bed 54,981 7.7% £3,614 £15,806 £198.7 7.5% £4,377 £15,806 £240.6 8.1% 58 74
4 Flat pre-1919 1 bed 45,854 6.5% £5,287 £15,329 £242.4 9.1% £5,287 £15,329 £242.4 8.2% 53 73
5 Flat 1980+ 1 bed 36,440 5.1% £1,963 £9,153 £71.5 2.7% £2,919 £9,153 £106.4 3.6% 73 77
6 Flat 1920 to 1945 2 bed 33,940 4.8% £2,989 £10,645 £101.4 3.8% £3,081 £10,645 £104.6 3.5% 56 74
7 Terraced 1946 to 1980 3 bed 28,966 4.1% £5,254 £15,181 £152.2 5.7% £5,254 £15,181 £152.2 5.2% 57 72
8 Flat pre-1919 2 bed 26,395 3.7% £5,079 £17,125 £134.1 5.1% £5,079 £17,125 £134.1 4.5% 50 73
9 Flat 1980+ 2 bed 26,305 3.7% £4,133 £9,984 £108.7 4.1% £4,249 £9,984 £111.8 3.8% 71 76
10 Terraced 1980+ 2 bed 23,450 3.3% £1,158 £7,279 £27.2 1.0% £1,158 £7,279 £27.2 0.9% 69 76
11 Terraced 1920 to 1945 2 bed 19,082 2.7% £3,183 £10,731 £60.7 2.3% £3,183 £10,731 £60.7 2.1% 59 72
12 Terraced 1980+ 3 bed 18,293 2.6% £2,249 £16,877 £41.1 1.6% £2,249 £16,877 £41.1 1.4% 71 75
13 Terraced 1920 to 1945 3 bed 17,657 2.5% £6,537 £15,181 £115.4 4.3% £6,537 £15,181 £115.4 3.9% 54 72
14 Semi-Det 1946 to 1980 3 bed 16,449 2.3% £4,024 £19,826 £66.2 2.5% £4,024 £19,826 £66.2 2.2% 51 73
15 Terraced 1946 to 1980 2 bed 14,871 2.1% £4,304 £14,350 £64.0 2.4% £4,304 £14,350 £64.0 2.2% 53 72
16 Flat 1920 to 1945 1 bed 14,649 2.1% £3,347 £12,418 £49.0 1.8% £3,723 £12,418 £54.5 1.8% 56 74
17 Terraced pre-1919 3 bed 14,426 2.0% £6,503 £15,181 £93.8 3.5% £6,503 £15,181 £93.8 3.2% 45 71
18 Flat pre-1919 3 bed 14,405 2.0% £4,618 £10,825 £66.5 2.5% £5,106 £10,825 £73.6 2.5% 51 73
19 Flat 1920 to 1945 3 bed 11,977 1.7% £5,395 £15,806 £64.6 2.4% £5,395 £15,806 £64.6 2.2% 50 73
20 Terraced 1980+ 4 bed 10,629 1.5% £1,936 £5,727 £20.6 0.8% £1,936 £5,727 £20.6 0.7% 73 77
Total 638,056 89.8% £2,265 85.4% £2,561 86.7%

Costing an enhanced Decent Homes Standard
Centre for Sustainable Energy 42
Table B2: Summary of Scenario 2 costs for the top 20 PGT’s in London’s social housing sector DESCRIPTION OF PGT
Count Table N %
Scenario 1 package cost no CHP with IWI Scenario 1 package cost with CHP SAP
Rank Built form Age Bedrooms Mean Max
Sum
(millions)
% of total
cost Mean Max
Sum
(millions)
% of total
cost Before After
1 Flat 1946 to 1980 1 bed 105,741 14.9% £2,835 £17,269 £299.8 9.3% £4,189 £17,269 £442.9 12.5% 63 75
2 Flat 1946 to 1980 2 bed 103,546 14.6% £4,351 £21,193 £450.5 13.9% £4,928 £21,193 £510.3 14.4% 61 74
3 Flat 1946 to 1980 3 bed 54,981 7.7% £4,790 £20,142 £263.3 8.1% £5,605 £20,142 £308.1 8.7% 58 74
4 Flat pre-1919 1 bed 45,854 6.5% £6,312 £16,832 £289.4 8.9% £6,312 £16,832 £289.4 8.2% 53 73
5 Flat 1980+ 1 bed 36,440 5.1% £1,963 £9,153 £71.5 2.2% £2,919 £9,153 £106.4 3.0% 73 77
6 Flat 1920 to 1945 2 bed 33,940 4.8% £4,739 £14,692 £160.8 5.0% £4,831 £14,692 £164.0 4.6% 56 74
7 Terraced 1946 to 1980 3 bed 28,966 4.1% £5,733 £20,112 £166.1 5.1% £5,733 £20,112 £166.1 4.7% 57 72
8 Flat pre-1919 2 bed 26,395 3.7% £6,287 £21,173 £165.9 5.1% £6,287 £21,173 £165.9 4.7% 50 73
9 Flat 1980+ 2 bed 26,305 3.7% £4,202 £9,984 £110.5 3.4% £4,318 £9,984 £113.6 3.2% 71 76
10 Terraced 1980+ 2 bed 23,450 3.3% £1,192 £7,279 £28.0 0.9% £1,192 £7,279 £28.0 0.8% 69 76
11 Terraced 1920 to 1945 2 bed 19,082 2.7% £4,463 £15,201 £85.2 2.6% £4,463 £15,201 £85.2 2.4% 59 72
12 Terraced 1980+ 3 bed 18,293 2.6% £2,502 £23,248 £45.8 1.4% £2,502 £23,248 £45.8 1.3% 71 75
13 Terraced 1920 to 1945 3 bed 17,657 2.5% £8,253 £20,112 £145.7 4.5% £8,253 £20,112 £145.7 4.1% 54 72
14 Semi-Det 1946 to 1980 3 bed 16,449 2.3% £4,770 £30,322 £78.5 2.4% £4,770 £30,322 £78.5 2.2% 51 73
15 Terraced 1946 to 1980 2 bed 14,871 2.1% £5,657 £18,323 £84.1 2.6% £5,657 £18,323 £84.1 2.4% 53 72
16 Flat 1920 to 1945 1 bed 14,649 2.1% £5,077 £12,418 £74.4 2.3% £5,453 £12,418 £79.9 2.3% 56 74
17 Terraced pre-1919 3 bed 14,426 2.0% £7,392 £21,252 £106.6 3.3% £7,392 £21,252 £106.6 3.0% 45 71
18 Flat pre-1919 3 bed 14,405 2.0% £4,618 £10,825 £66.5 2.1% £5,106 £10,825 £73.6 2.1% 51 73
19 Flat 1920 to 1945 3 bed 11,977 1.7% £8,435 £20,142 £101.0 3.1% £8,435 £20,142 £101.0 2.9% 50 73
20 Terraced 1980+ 4 bed 10,629 1.5% £1,936 £5,727 £20.6 0.6% £1,936 £5,727 £20.6 0.6% 73 77
Total 638,056 89.8% £2,814.3 87.0% £3,115.6 87.9%

Costing an enhanced Decent Homes Standard
Centre for Sustainable Energy 43
Table B3: Summary of Scenario 3 costs for the top 20 PGT’s in London’s social housing sector DESCRIPTION OF PGT
Count Table N %
Scenario 1 package cost no CHP with IWI Scenario 1 package cost with CHP SAP
Rank Built form Age Bedrooms Mean Max.
Sum
(millions)
% of total
cost Mean Max.
Sum
(millions)
% of total
cost
Before After
1 Flat 1946 to 1980 1 bed 105,741 14.9% £3,410 £15,356 £360.6 8.2% £3,965 £17,771 £419.3 9.1% 63 82
2 Flat 1946 to 1980 2 bed 103,546 14.6% £4,235 £19,246 £438.5 9.9% £4,902 £19,246 £507.5 11.0% 61 82
3 Flat 1946 to 1980 3 bed 54,981 7.7% £4,351 £15,802 £239.2 5.4% £4,550 £15,802 £250.2 5.4% 58 82
4 Flat pre-1919 1 bed 45,854 6.5% £6,362 £17,333 £291.7 6.6% £6,492 £17,333 £297.7 6.4% 53 82
5 Flat 1980+ 1 bed 36,440 5.1% £2,356 £11,370 £85.9 1.9% £3,576 £11,370 £130.3 2.8% 73 82
6 Flat 1920 to 1945 2 bed 33,940 4.8% £5,714 £11,630 £193.9 4.4% £5,713 £11,630 £193.9 4.2% 56 82
7 Terraced 1946 to 1980 3 bed 28,966 4.1% £9,379 £18,853 £271.7 6.2% £9,388 £18,853 £271.9 5.9% 57 81
8 Flat pre-1919 2 bed 26,395 3.7% £7,978 £15,133 £210.6 4.8% £7,986 £15,133 £210.8 4.6% 50 82
9 Flat 1980+ 2 bed 26,305 3.7% £3,641 £12,683 £95.8 2.2% £4,617 £12,683 £121.5 2.6% 71 81
10 Terraced 1980+ 2 bed 23,450 3.3% £5,596 £11,436 £131.2 3.0% £5,620 £11,436 £131.8 2.8% 69 81
11 Terraced 1920 to 1945 2 bed 19,082 2.7% £6,703 £17,409 £127.9 2.9% £6,736 £17,409 £128.5 2.8% 59 81
12 Terraced 1980+ 3 bed 18,293 2.6% £8,160 £23,701 £149.3 3.4% £8,160 £23,701 £149.3 3.2% 71 81
13 Terraced 1920 to 1945 3 bed 17,657 2.5% £10,550 £18,853 £186.3 4.2% £10,560 £18,853 £186.5 4.0% 54 81
14 Semi-Det 1946 to 1980 3 bed 16,449 2.3% £11,795 £24,079 £194.0 4.4% £11,795 £24,079 £194.0 4.2% 51 81
15 Terraced 1946 to 1980 2 bed 14,871 2.1% £8,999 £26,064 £133.8 3.0% £9,013 £26,064 £134.0 2.9% 53 81
16 Flat 1920 to 1945 1 bed 14,649 2.1% £4,794 £7,255 £70.2 1.6% £5,170 £10,975 £75.7 1.6% 56 83
17 Terraced pre-1919 3 bed 14,426 2.0% £13,269 £28,941 £191.4 4.3% £13,298 £28,941 £191.8 4.1% 45 81
18 Flat pre-1919 3 bed 14,405 2.0% £9,084 £15,230 £130.8 3.0% £9,046 £15,546 £130.3 2.8% 51 82
19 Flat 1920 to 1945 3 bed 11,977 1.7% £8,056 £12,229 £96.5 2.2% £7,998 £12,544 £95.8 2.1% 50 83
20 Terraced 1980+ 4 bed 10,629 1.5% £5,013 £7,397 £53.3 1.2% £5,040 £7,397 £53.6 1.2% 73 81
Total 638,056 89.8% £3,652.6 82.9% £3,874.4 83.7%

Costing an enhanced Decent Homes Standard
Centre for Sustainable Energy 44
Annex C: Summary of costs and measures installed for different home types for each scenario The tables in this section summarise the costs and main measures installed under each scenario. For the purpose of this analysis, the top 20 PGT’s in London’s social housing sector have been
combined based on building type and age (i.e. properties are no longer differentiated by number of bedrooms), as shown in the table below. The most common property type – 1946 to 1980 flats
with less than 4 bedrooms – was further broken down by wall type and high/low rise, to ensure sufficient distinction between the measures installed.
Table C1: Grouping the top 20 PGTs for exploring measures installed under each scenario PGT
CODE43
Built form Age Bedrooms Count % ‘Property type’ for summarising measures
3531 Flat 1946 to 1980 1 bed 105,741 14.9%1946-1980 flats with <=3 bedrooms
Further split by wall type & high/low rise 3532 Flat 1946 to 1980 2 bed 103,546 14.6%
3533 Flat 1946 to 1980 3 bed 54,981 7.7%
3511 Flat pre-1919 1 bed 45,854 6.5%
Pre-1919 flats <=3 bedrooms 3512 Flat pre-1919 2 bed 26,395 3.7%
3513 Flat pre-1919 3 bed 14,405 2.0%
3541 Flat 1980+ 1 bed 36,440 5.1%Post-1980 flats with <=2 bedrooms
3542 Flat 1980+ 2 bed 26,305 3.7%
3522 Flat 1920 to 1945 2 bed 33,940 4.8%
1920 to 1945 flats with <= 3 bedrooms 3521 Flat 1920 to 1945 1 bed 14,649 2.1%
3523 Flat 1920 to 1945 3 bed 11,977 1.7%
3333 Terraced 1946 to 1980 3 bed 28,966 4.1%1946 to 1980 terraced with 2 or 3 bedrooms
3332 Terraced 1946 to 1980 2 bed 14,871 2.1%
3342 Terraced 1980+ 2 bed 23,450 3.3%
Post-1980 terraced with 2-4 bedrooms 3343 Terraced 1980+ 3 bed 18,293 2.6%
3344 Terraced 1980+ 4 bed 10,629 1.5%
3322 Terraced 1920 to 1945 2 bed 19,082 2.7%1920 to 1945 terraced with 2 or 3 bedrooms
3323 Terraced 1920 to 1945 3 bed 17,657 2.5%
3233 Semi-Detached 1946 to 1980 3 bed 16,449 2.3% 1946 to 1980 semi-detached with 3 bedrooms
3313 Terraced pre-1919 3 bed 14,426 2.0% Pre-1919 terraced with 3 bedrooms
43 The ‘Primary Generic Types’ considered the following categories for social housing in the analysis – Built form (detached, semi-detached, terrace, bungalow, flat); Age (pre-1919, 1919-1944, 1945-1980, post 1980) and Number of bedroom (1, 2, 3, 4, 5).

Costing an enhanced Decent Homes Standard
Centre for Sustainable Energy 45
Table C2: 1946-1980 social rented flats with <=3 bedrooms (i.e. the top 3 PGTs) broken down by wall type and high/low rise: Scenario 1
Flat
type Wall type Count
% of
total*
Scenario 1 package cost no CHP
with internal wall insulation
Scenario 1 package cost with
CHP SAP Summary of main measures44
Mean Sum (m) Max Mean Sum (m) Max Before After Insulation45 Heating Heating with
CHP
Renewables
Low
rise
Cavity with
insulation 34,927 5% £993 £34.7 £9,984 £1,857 £64.9 £9,984 66 77 17% LI
21% UCH
11% GCB
4% ASHP
21% CHP
11% GCB
4% ASHP
3% SWH
Cavity
uninsulated 97,696 14% £2,242 £219.0 £17,269 £2,949 £288.1 £17,269 62 74
44% CWI
25% LI
17% GCB
16% UCH
5% ASHP
17% CHP
16% GCB
5% ASHP
8% SWH
7% 1kW PV
6% MWT
Solid wall 54,866 8% £3,558 £195.2 £15,806 £3,864 £212.0 £15,806 60 75 55% SWI
27% UCH
7% UCH
5% ASHP
27% GCB
7% CHP
5% ASHP
1% SWH
1% 1kW PV
High
Rise
Cavity with
insulation 753 0% £9,984 £7.5 £9,984 £9,984 £7.5 £9,984 54 71
100% ASHP 100% ASHP None
Cavity
uninsulated 30,460 4% £2,150 £65.5 £21,193 £4,090 £124.6 £21,193 65 75 32% CWI
24% UCH
17% GCB
11% ASHP
41% CHP
11% ASHP
2% SWH
2% 1kW PV
2% MWT
Solid wall 45,566 6% £5,788 £263.8 £15,806 £7,259 £330.8 £15,806 54 74 54% SWI
27% ASHP
17% UCH
14% GCB
31% CHP
27% ASHP
1% 1kW PV
2% MWT
Total 264,268 37%
44 UCH = Upgraded communal heating; GCB = new gas condensing boiler; SWI = solid wall insulation; SWH = solar water heating; MWT = micro-wind turbine; ASHP = air source heat pump 45 Also some draught proofing and double glazing where required

Costing an enhanced Decent Homes Standard
Centre for Sustainable Energy 46
Table C3: Summary of measures for the remaining top 20 PGT’s (grouped by age and built form): Scenario 1
PGT (compressed) Count % of
total*
Scenario 1 package cost no CHP
with solid wall insulation
Scenario 1 package cost with
CHP SAP Summary of main measures
Mean Sum (m) Max Mean Sum (m) Max Before After Insulation Heating Heating
with CHP Renewables
Flats pre-1919
<4 bed 86,654 12% £5,112 £443.0 £17,125 £5,193 £450.0 £17,125 51 73
59% SWI 12% LI
36% GCB 8% ASHP 3% UCH
35% GCB 8% ASHP 2% UCH 2% CHP
6% SWH 12% 1kW PV 11% MWT
Flats post 1980
<3 bed 62,745 9% £2,873 £180.3 £9,984 £3,476 £218.1 £9,984 72 77 7% LI
19% GCB 23% ASHP 13% UCH
18% GCB 23% ASHP 14% CHP
5% SWH
Flats 1920 to 1945 <4
bed 60,566 9% £3,551 £215.1 £15,806 £3,694 £223.7 £15,806 55 74
50% SWI 6% LI
36% GCB 3% ASHP 1% UCH
34% GCB 3% ASHP 3% CHP
4% SWH 2% 1kW PV 2% MWT
Terraced post-1980
<5 bed 52,372 7% £1,697 £88.9 £16,877 £1,697 £88.9 £16,877 70 76 18% LI 81% GCB 81% GCB
5% SWH 3% 1kw PV
Terraced 1946-1980
<4 bed 43,837 6% £4,931 £216.2 £15,181 £4,931 £216.2 £15,181 56 72
43% LI 10% SWI 6% CWI
73% GCB 3% OCB
73% GCB 3% OCB
29% SWH 30% 1kW PV
Terraced 1920-1945
<4 bed 36,739 5% £4,795 £176.2 £15,181 £4,795 £176.2 £15,181 57 72
50% LI 27% SWI 17% CWI
41% GCB 41% GCB 30% SWH 20% 1kW PV
Terraced pre-1919
3 bed 14,426 2% £6,503 £93.8 £15,181 £6,503 £93.8 £15,181 45 71
51% LI 23% SWI 86% GCB 86% GCB
53% SWH 25% 1kW PV
Semi-Det 1946-1980
3 bed 16,449 2% £4,024 £66.2 £19,826 £4,024 £66.2 £19,826 51 73 90% LI 82% GCB
3% OCB 82% GCB 3% OCB
27% SWH 14% 1kW PV
Total 373,788 53%
* Percentage of all London social housing stock

Costing an enhanced Decent Homes Standard
Centre for Sustainable Energy 47
Table C4: 1946-1980 social rented flats with <=3 bedrooms (i.e. the top 3 PGTs) broken down by wall type and high/low rise: Scenario 2
Flat
type Wall type Count
% of
total*
Scenario 2 package cost no CHP
with internal wall insulation
Scenario 2 package cost with
CHP SAP Summary of main measures46
Mean Max Sum (m) Mean Max Sum (m) Before After Insulation47 Heating Heating with
CHP
Renewables
Low
rise
Cavity with
insulation 34,927 5% £1,013 £9,984 £35.4 £1,944 £9,984 £67.9 66 77 23% LI 22% UCH
11% GCB 22% CHP 11% GCB 3% SWH
Cavity
uninsulated 97,696 14% £2,313 £17,269 £225.9 £3,020 £17,269 £295.1 62 74
44% CWI 28% LI
18% GCB 16% UCH
17% CHP 18% GCB 5% ASHP
8% SWH 7% 1kW PV 6% MWT
Solid wall 54,866 8% £5,713 £20,142 £313.5 £5,890 £20,142 £323.2 60 75 4% SWI 28% GCB 5% ASHP 7% UCH
28% GCB 5% ASHP 7% CHP
1% SWH 1% 1kW PV
High
Rise
Cavity with
insulation 753 0% £9,984 £9,984 £7.5 £9,984 £9,984 £7.5 54 71 - 100% ASHP 100% ASHP -
Cavity
uninsulated 30,460 4% £2,340 £21,193 £71.3 £4,456 £21,193 £135.7 65 75 32% CWI
26% UCH 19% GCB 11% ASHP
45% CHP 11% ASHP
2% SWH 2% 1kW PV 2% MWT
Solid wall 45,566 6% £7,902 £20,142 £360.1 £9,480 £20,142 £432.0 54 74 3% SWI
27% ASHP 19% UCH 14% GCB
34% CHP 27% ASHP
1% 1kW PV 2% MWT
Total 264,268 37%
46 UCH = Upgraded communal heating; GCB = new gas condensing boiler; SWI = solid wall insulation; SWH = solar water heating; MWT = micro-wind turbine; ASHP = air source heat pump 47 Also some draught proofing and double glazing where required

Costing an enhanced Decent Homes Standard
Centre for Sustainable Energy 48
Table C5: Summary of measures for the remaining top 20 PGT’s (grouped by age and built form): Scenario 2
PGT (compressed) Count % of
total*
Scenario 2 package cost no CHP
with solid wall insulation
Scenario 2 package cost with
CHP SAP Summary of main measures
Mean Sum (m) Max Mean Sum (m) Max Before After Insulation Heating Heating
with CHP Renewables
Flats pre-1919
<4 bed 86,654 12% £6,023 £521.9 £21,173 £6,104 £528.9 £21,173 51 73
36% SWI 15% LI
37% GCB 8% ASHP 3% UCH
36% GCB 8% ASHP 2% UCH 2% CHP
6% SWH 12% 1kW PV 2% MWT
Flats post 1980
<3 bed 62,745 9% £2,902 £182.1 £9,984 £3,505 £219.9 £9,984 72 77 22% LI
19% GCB 23% ASHP 13% UCH
18% GCB 23% ASHP 14% CHP
5% SWH
Flats 1920 to 1945 <4
bed 60,566 9% £5,551 £336.2 £20,142 £5,694 £344.9 £20,142 55 74 7% LI
36% GCB 3% ASHP 1% UCH
34% GCB 3% ASHP 3% CHP
4% SWH 2% 1kW PV 2% MWT
Terraced post-1980
<5 bed 52,372 7% £1,801 £94.3 £23,248 £1,801 £94.3 £23,248 70 76 46% LI 82% GCB 82% GCB
5% SWH 3% 1kW PV
Terraced 1946-1980
<4 bed 43,837 6% £5,707 £250.2 £20,112 £5,707 £250.2 £20,112 56 72
58% LI 6% CWI 79% GCB 79% GCB
29% SWH 30% 1kW PV
Terraced 1920-1945
<4 bed 36,739 5% £6,285 £230.9 £20,112 £6,285 £230.9 £20,112 57 72
62% LI 17% CWI 47% GCB 47% GCB
30% SWH 20% 1kW PV
Terraced pre-1919
3 bed 14,426 2% £7,392 £106.6 £21,252 £7,392 £106.6 £21,252 45 71
65% LI 11% SWI 94% GCB 94% GCB
53% SWH 25% 1kW PV
Semi-Det 1946-1980
3 bed 16,449 2% £4,770 £78.5 £30,322 £4,770 £78.5 £30,322 51 73 57% LI 93% GCB 93% GCB
27% SWH 14% 1kWPV
Total 373,788 53%
* Percentage of all London social housing stock

Costing an enhanced Decent Homes Standard
Centre for Sustainable Energy 49
Table C6: 1946-1980 social rented flats with <=3 bedrooms (i.e. the top 3 PGTs) broken down by wall type and high/low rise: Scenario 3
Flat
type Wall type Count
% of
total*
Scenario 3 package cost no CHP
with internal wall insulation Scenario 3 package cost with CHP SAP Summary of main measures48
Mean Max Sum (m) Mean Max Sum (m) Before After Insulation49 Heating Heating with
CHP
Renewables
Low
rise
Cavity with
insulation 34,927 5% £1,961 £13,574 £68.5 £2,555 £13,574 £89.2 66 82 17% LI
71% GCB 2% ASHP 11% UCH
69% GCB 2% ASHP 14% CHP
4% SWH 7% 1pW PV 3% MWT
Cavity
uninsulated 97,696 14% £3,034 £19,246 £296.4 £3,320 £19,246 £324.4 62 81
44% CWI 30% LI
69% GCB 2% ASHP 3% UCH
65% GCB 2% ASHP 8% CHP
15% SWH 9% 1kW PV 5% MWT
Solid wall 54,866 8% £5,269 £11,534 £289.1 £5,324 £11,534 £292.1 60 83 84% SWI 14% LI
82% GCB 2% ASHP 3% UCH
79% GCB 8% CHP
3% SWH 1% 1kW PV
High
Rise
Cavity with
insulation 753 0% £4,255 £4,255 £3.2 £8,955 £8,955 £6.7 54 81 - 100% GCB 100% CHP -
Cavity
uninsulated 30,460 4% £2,261 £12,978 £68.9 £4,227 £12,978 £128.8 65 81
34% CWI 10% LI
54% GCB 8% ASHP 7% UCH
61% CHP 8% ASHP -
Solid wall 45,566 6% £6,852 £17,225 £312.2 £7,369 £17,225 £335.8 54 82 86% SWI 8% LI
65% GCB 10% ASHP 2% UCH
70% CHP 10% ASHP
4% PV 2% MWT
Total 264,268 37%
* Percentage of all London social housing stock
48 UCH = Upgraded communal heating; GCB = new gas condensing boiler; SWI = solid wall insulation; SWH = solar water heating; MWT = micro-wind turbine; ASHP = air source heat pump 49 Also some draught proofing and double glazing where required
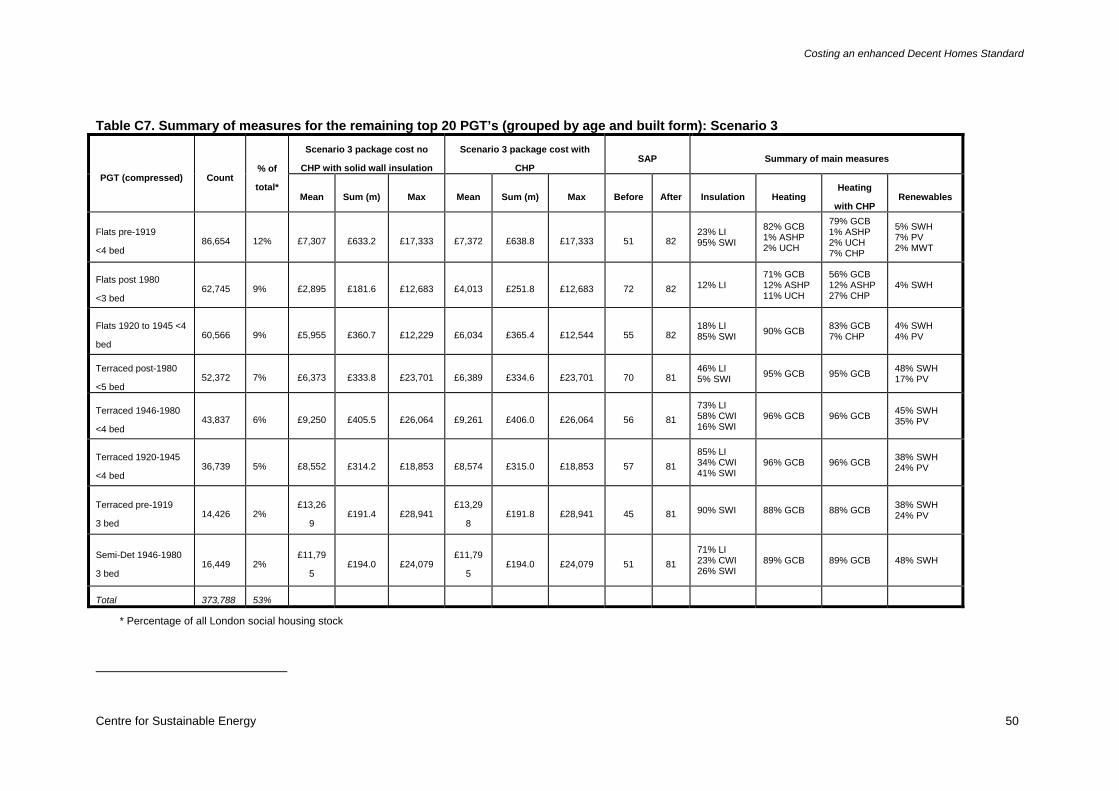
Costing an enhanced Decent Homes Standard
Centre for Sustainable Energy 50
Table C7. Summary of measures for the remaining top 20 PGT’s (grouped by age and built form): Scenario 3
PGT (compressed) Count % of
total*
Scenario 3 package cost no
CHP with solid wall insulation
Scenario 3 package cost with
CHP SAP Summary of main measures
Mean Sum (m) Max Mean Sum (m) Max Before After Insulation Heating Heating
with CHP Renewables
Flats pre-1919
<4 bed 86,654 12% £7,307 £633.2 £17,333 £7,372 £638.8 £17,333 51 82
23% LI 95% SWI
82% GCB 1% ASHP 2% UCH
79% GCB 1% ASHP 2% UCH 7% CHP
5% SWH 7% PV 2% MWT
Flats post 1980
<3 bed 62,745 9% £2,895 £181.6 £12,683 £4,013 £251.8 £12,683 72 82 12% LI
71% GCB 12% ASHP 11% UCH
56% GCB 12% ASHP 27% CHP
4% SWH
Flats 1920 to 1945 <4
bed 60,566 9% £5,955 £360.7 £12,229 £6,034 £365.4 £12,544 55 82
18% LI 85% SWI 90% GCB 83% GCB
7% CHP 4% SWH 4% PV
Terraced post-1980
<5 bed 52,372 7% £6,373 £333.8 £23,701 £6,389 £334.6 £23,701 70 81
46% LI 5% SWI 95% GCB 95% GCB 48% SWH
17% PV
Terraced 1946-1980
<4 bed 43,837 6% £9,250 £405.5 £26,064 £9,261 £406.0 £26,064 56 81
73% LI 58% CWI 16% SWI
96% GCB 96% GCB 45% SWH 35% PV
Terraced 1920-1945
<4 bed 36,739 5% £8,552 £314.2 £18,853 £8,574 £315.0 £18,853 57 81
85% LI 34% CWI 41% SWI
96% GCB 96% GCB 38% SWH 24% PV
Terraced pre-1919
3 bed 14,426 2%
£13,26
9 £191.4 £28,941
£13,29
8 £191.8 £28,941 45 81 90% SWI 88% GCB 88% GCB 38% SWH
24% PV
Semi-Det 1946-1980
3 bed 16,449 2%
£11,79
5 £194.0 £24,079
£11,79
5 £194.0 £24,079 51 81
71% LI 23% CWI 26% SWI
89% GCB 89% GCB 48% SWH
Total 373,788 53%
* Percentage of all London social housing stock

Costing an enhanced Decent Homes Standard
Centre for Sustainable Energy 51
Annex D: Water Efficiency Measures Table D1. Volume and flow rates of water measures and frequency of use data
Measure Volume per use (l) / flow rate (l/m) frequency of use
Toilets - 6 litre 6.0 11.52
Toilets - 6/4 litre 5.0 11.52
Toilets - 6/3 litre 4.5 11.52
Toilets - 4.5/3 litre 3.75 11.52
Basin taps - 6 litre/min max flow 3.1 17.1625
Basin taps - 2.5 litre/min max flow 1.85 17.1625
Basin taps - 1.7 litre/min max flow 1.7 17.1625
Kitchen taps - 6 litre/min max flow 3.1 24.31
Kitchen taps - 3 litre/min max flow 2.13 24.31
Kitchen taps - 1.7 litre/min max flow 1.7 24.31
Outdoor taps 18.0 0.89
Mixer Shower 48.7 1.46
Mixer Shower with low flow showerhead 31.3 1.46
Power Shower 7.5 kW 21.3 1.46
Power Shower 8.5 kW 24.7 1.46
Bath Standard 88 0.95
Bath Small 65 0.95
Washing machine (standard) 65 0.81
Washing machine (efficient) 45 0.81
Dishwasher (standard) 20 0.71
Dishwasher (efficient) 13 0.71
Rainwater harvesting water butt 1
Rainwater harvesting System 1

Costing an enhanced Decent Homes Standard
Centre for Sustainable Energy 52
Annex E: Case studies The following case studies are intended to demonstrate the range of sustainable energy initiatives that many housing associations and their partners have recently implemented. These vary in terms of the scale of project and scope of measures considered, but illustrate the typical barriers encountered in dealing with different housing types, available technologies and tenant issues. The case studies also include examples of how some organisations are looking beyond Decent Homes standards by aligning their refurbishment programmes with national targets on carbon reduction.
1. Neighbourhood Investment Unit (Metropolitan Housing Trust) 2. Retrofit Reality (Gentoo Group Ltd) 3. Carbon 60 (Sandford Housing Co-operative) 4. Greening the Box (Wherry Housing Association) 5. Shoreditch District Heat Network (Hackney Homes) 6. Victorian House Retrofit (Camden Council) 7. Beyond Decent Homes Standard 2009 (Sustainable Housing Action Partnership) 8. Relish (Worthing Homes) 9. Retrofit for the Future - Beckton (East Thames Group) 10. Redbrick Estate (London Borough of Islington)
Many other social housing case studies can be viewed on the Retrofit for the Future database available at: http://www.retrofitforthefuture.org

Costing an enhanced Decent Homes Standard
Centre for Sustainable Energy 53
1. Neighbourhood Investment Unit (Metropolitan Housing Trust)
General description
Metropolitan Housing Trust London (MHT) developed a programme for refurbishing 62 ‘hard to treat’ Victorian street properties in the London Borough of Haringey to a standard that goes well beyond the Government’s Decent Homes standard, with a whole house approach that involves decanting the householders into alternative accommodation for 14 weeks. Over 20% of MHT homes in Haringey are street properties, requiring a more complex refurbishment solution than for more typical estate based schemes.
The programme started in 2005. There are approximately 600 street properties in the borough. To date we have completed nearly 400, gradually increasing the number completed each year.
Project lead and partners
Metropolitan Housing Trust (lead), London Borough of Haringey, Enterprise Managed Services Ltd (Contractor), MITIE Property Services Ltd (Contractor)
Specific objectives
The main objectives were to undertake whole-house street property refurbishment that dramatically cuts carbon emissions, maximise the opportunities for residents to be engaged and to create more welcoming and energy efficient affordable homes.
The project was initiated in response to very high responsive repairs. It was intended as an enhanced decent homes project, driven not by a commitment to carbon reduction, but rather a pragmatic view to complete, as a one off, as much to the house in the one visit, recognising – due to the dispersed nature of the stock, that a return for any other major works is extremely unlikely in any foreseeable future.
Energy efficiency measures
• Replacement of central heating system with A-rated condensing combi boiler • Removal of any existing wall hung gas fires and electric heaters • Individually controllable radiators (TRV’s) and room thermostat • Double glazed windows (refitting timber sash double glazed windows in conservation
areas) • 300mm loft insulation • 100mm floor insulation (ground level timber suspended floors) • 60mm K18 Kingspan Kooltherm internal wall Insulation • At least 3 low energy light fittings (kitchen, bathroom & hall) • Fitting of a rotary drier in rear gardens • Advice and support from the resident liaison officer
Water efficiency measures
• Low flow dual flush toilet
Other measures related to carbon saving or climate change adaptation
n/a
Funding/cost details
It is a capital funded programme, with a mix of reserves, RCGF and grant. Typical cost per home is about £40,000 (for all works, not just enhanced measures).
What was achieved?
The scheme has met and continues to meet all its key objectives including showing that whole house retrofit of old street properties can be achieved and that residents can be fully engaged. Sixty-two fully refurbished properties were completed with typical carbon emissions reduction in excess of 45 per cent per home with an uplift in the Energy Performance Certificate energy efficiency rating to about 80. Subsequently residents are

Costing an enhanced Decent Homes Standard
Centre for Sustainable Energy 54
able to halve their fuel costs and are being supported to make changes in their behaviour, greatly reducing their risk of being in fuel poverty.
A typical mid-terrace home achieved: • Energy use: 164 kWh/m2 per year • Carbon dioxide emissions: 2.3 tonnes per year • Estimated fuel costs: £457 per year
Key learning points
Having an in-house team including a resident liaison officer and 3 building surveyors, overseen by the head of unit, ensures a consistency in service delivery and confidence in running a complex regeneration project. This is supported by working with a variety of contractors that has enabled greater flexibility and an improvement in the effectiveness of the programming. As a result more people and homes could be reached.
This approach to refurbishment of properties, involving the decanting of resident into temporary accommodation, requires significant inconvenience for the household. It is crucial that expectations about the timescales, the scope of works and service expectations, is well managed from the outset. Through experience MHT is now better able to manage the varied expectations of residents via tools such as a new resident refurbishment guide, customer charter and an amended customer satisfaction survey to improve feedback and customisation of the service.
Having established this programme, MHT is seeking cost effective ways to further develop the energy efficiency elements of the programme in line with the new government aims of near carbon neutrality in homes by 2050.
Further information
Matthew Bush (Sustainability Manager), Metropolitan Housing Partnership
http://www.mhp-online.co.uk/news/2010/06/metropolitan-housing-trust-london-awarded-for-pioneering-approach-to-retrofit/
2. Retrofit Reality (Gentoo Group Ltd)
General description
The aim of the project was to test products that are meant to make homes more sustainable. Solar thermal panels, A rated condensing combination boilers, energy efficient showers, solid wall insulation and double glazing were installed in different combinations into 139 of Gentoo’s homes to find out their effect on energy consumption, bills, and carbon emissions.
Project lead and partners
Gentoo Group is a people and property business and is made up of various subsidiaries including Gentoo Sunderland which looks after a housing stock of around 29,500 and Gentoo Construction, a ‘one-stop-shop’, incorporating a wide range of design, construction and maintenance services all under one roof. Retrofit Reality is a TSA Innovation and Good Practice supported project.
Specific objectives
As well as looking at reductions in energy consumption and bills, the project team wanted to find out: • How difficult the products were to put into a house • How easy the products were to use

Costing an enhanced Decent Homes Standard
Centre for Sustainable Energy 55
• What the benefits were to people living in the house • How much maintenance the products would require
Gentoo’s stock generates around 180,000 tonnes of CO2 per annum with associated fuel costs of about £30m. Gentoo met the Decent Homes standard in 2005 and is now looking at ways to improve the efficiency of the stock further and reduce CO2 emissions, whilst helping customers reduce their fuel bills.
Energy efficiency measures
• A rated condensing combination boilers • Double glazing • Energy- and water- efficient showers • External insulation
Water efficiency measures
• Energy- and water- efficient showers
Other measures related to carbon saving or climate change adaptation
• Solar thermal panels
Funding/cost details
The Tenant Services Authority (TSA) and the Low Carbon Buildings Programme together provided over £115,000 worth of support for the project, with £100,000 coming from the TSA’s Innovation and Good Practice Grant programme. Gentoo allocated £255,000 to the project from its own funds. In addition, Gentoo are working in partnership with Northumbria University and are funding two PhD students for a period of three years to assist with the technical and behavioural aspects of the project.
The TSA funding was used to manage the project and to help disseminate the findings. Gentoo’s investment has predominantly funded the installation of the energy efficiency measures, with the average spend per household being £5,250. Of this over £3,000 was programmed in.
Gentoo received tenders from suppliers of micro-generation technology who were eligible to obtain 50% Government funding under the Low Carbon Buildings Programme framework and from other suppliers who were not eligible. Gentoo found that some suppliers who were not eligible for grant funding gave better value for money than companies who were eligible for grant funding.
What was achieved?
• The measures increased the average SAP from 56 to 71. • Implementation of the Retrofit Reality standard resulted on average a 26% reduction in
carbon emissions. Energy consumption was reduced by 25%overall. • 87% of customers said they felt happier as a result of the improvements.
Key learning points
RD SAP was used to predict energy use, costs and carbon emissions before and after the refit. Real data for energy use before and after the refit was then gathered and compared with the values predicted by the SAP calculations. This revealed some interesting differences between the assumptions used by SAP and the reality for Gentoo’s customers.
On average, before the refit, Gentoo’s customers were using 40% less energy than the SAP calculations had predicted, while actual carbon emissions were only 20% lower and bills were higher than expected. This was because: • There were fewer people per household than assumed by SAP, and so initial energy
use was lower than predicted. • People were only using the energy they could afford, even if this meant being cold. • Customers were using 34% less gas but 20% more electricity after the measures were
installed. • SAP assumes that people are not at home during the day, but social housing residents
are more likely to be retired or unemployed and so spend more time at home.
Due to this, although the average saving per home was predicted by SAP to be £213, it turned out to be £105, a 12% reduction in energy costs. Actual energy consumption was reduced by 25%. The research found that many people who depend on benefits are likely to be in fuel poverty, even after the improvements. 29% of customers who had seen a reduction in their bills said that it was due to increased environmental awareness as well as the measures themselves. Discussions between staff and customers worked better when staff dealing with the project could clearly communicate the technical detail of how the products worked and what the benefits were. In conclusion, there was an 18% reduction in CO2 for £5,250. The cost saving per household

Costing an enhanced Decent Homes Standard
Centre for Sustainable Energy 56
was £105, and an average 25% reduction in energy consumption per property was achieved
Further information
Paul Burns (Green Operations Manager), Gentoo Group Ltd.
[email protected] http://assets.gentoogroup.com/assets/Downloads/Retrofit%20Reality%203%20final.pdf
3. Carbon 60 (Sanford Housing Co-operative)
General description
Sanford Walk is a self contained street of 14 shared houses (housing between 8 to 10 people in each) and 6 self contained flats, organised as a Housing Co-operative. Essentially this means that the tenant members are also the collective landlord and therefore own, control and manage the estate themselves. There are 129 residents living at this high density community. Sanford was founded and built by student activists in the early 1970’s with the aim of providing affordable housing in London for ‘young, single, mobile’ people. By 2001 the buildings were over 30 years old and in need of some refurbishment.
The nature of the community meant there was already a good awareness of environmental issues and the idea was floated that the buildings should be refurbished in as ‘green’ a way as possible. The Centre for Sustainable Energy were approached and carried out a feasibility study in 2003 which suggested ways the estate could be refurbished while at the same time cutting its carbon emissions by 60%. This included both refurbishing the properties and educating the residents in energy use.
The refurbishment was carried out between September 2006 and February 2008.
Project lead and partners
Sanford Housing Co-operative was the project lead. Sanford is a democratic organisation, and as such the residents were closely involved in the project. CDS Co-operatives provides tenant and housing management for Sanford Housing Co-operative. It provided overall project management for the C60 project through the Co-operative Support Officer, Mark Langford.
The Centre for Sustainable Energy (CSE) acted as initial consultant to the project and carried out the original feasibility study in 2003. CSE worked with residents to develop a training and awareness programme. The London Borough of Lewisham gave advice to the co-operative and assisted with the planning application for the C60 project.
J3 Building Futures is a sustainable, environmental design, green construction and ecological living consultancy concerned with developing the built environment in a socially, environmentally and economically sustainable manner. J3 assisted CDS and SHC in project managing the implementation phase of the C60 project.
Specific objectives
• To refurbish and modernise 1-20 Sanford Walk in order to improve residents’ quality of life and to increase the longevity of the buildings themselves.
• To carry this out in a sustainable manner and specifically to reduce Sanford’s carbon footprint by 60% in line with Government targets.
• To help educate residents and others in the housing sector about sustainable energy issues and related areas by introducing a sustainable energy strategy for the co-operative.
• To create an exemplar of good practice in order to spread the message amongst other social housing providers, the local community and if possible, the general population of the UK. It is hoped that others will, in turn, be inspired to reduce their carbon emissions.

Costing an enhanced Decent Homes Standard
Centre for Sustainable Energy 57
Energy efficiency measures
• Replacement of 14 gas fired combination boilers in the houses with 7 mini biomass boilers.
• 14 new thermostatically controlled roof windows to improve ventilation by way of passive stack ventilation and to improve natural lighting. Further improved ventilation by renewal of bathroom and kitchen extractor fans.
• Upgrades to the building fabric by way of insulation of lofts to 270mm and cavity wall insulation.
Water efficiency measures
n/a
Other measures related to carbon saving or climate change adaptation
• Installation of a solar hot water system • Production of a Sustainable Energy Strategy • Training courses for residents so that they can deliver the sustainable energy
message in the wider community
Funding/cost details
Energy Saving Trust Innovation programme grant of £48,177 (awarded in 2004) and an EDF Energy grant of £23,168 towards the £100,000 cost of the boilers and associated building works. The remainder came from Sanford’s reserves and through a rent increase.
What was achieved?
Due to the works and resident behavioural changes Sanford has reduced its carbon dioxide emissions from 228 tons in 2003 to 91 tons in 2008, an overall reduction of 60%.
Of the 136 tons saved the Biomass has contributed 118 tons annually and is therefore far and away the most important contributor to the savings.
The residents are much more environmentally aware. The Co-operative will continue to operate and benefit from the installations. There is a Boilers Officer and Environmental Officer who will continue to liaise with residents and help to develop understanding of the installations among existing and future residents.
At the end of the project Sanford put together a press release about the project and generated publicity in several diverse media publications.
Key learning points
The Co-op found it difficult to find project managers and contractors who had some experience in the new technologies that they wanted to use. There were teething problems with the biomass boilers and the solar hot water. The boilers were installed and commissioned in December and January and initially there was a very high rate of boiler breakdown. When the pellet supplier was changed, the functioning of the boilers improved. The Co-op found that there was a dearth of pellet suppliers in the area, and in addition a lack of biomass and solar engineers has meant that there is almost a monopoly situation regarding the upkeep of systems.
There were delays with some items which were out of supply or had to be ordered from abroad. Due to these delays the bulk of the work took place in the winter months, which led to further delays due to inclement weather. The timing of the biomass installation was also unfortunate as the boilers were installed and commissioned in December and January.
The Co-op found that it was important to involve residents fully in the decision making process so they feel they have a stake in the project and are more likely to be supportive and understanding when things go wrong.
The Co-op found that the elements vital to the project’s success were resident involvement and finance in the form of a bank loan as well as the Co-op’s financial reserves, as it was not possible to obtain as much grant funding as was originally hoped.
The budget was constantly changing as the Co-op received conflicting information about cost estimates of the various measures available and possible grant funding. During the planning stage this made things very uncertain. As a result the implementation action plan of the project had to be altered three times and formal time extensions for the Energy Saving Trust grant were sought and granted.
Further information
Mark Langford (CDS Co-operatives’ Support Officer), CDS Co-operatives [email protected] www.sanford.coop/C60.shtml

Costing an enhanced Decent Homes Standard
Centre for Sustainable Energy 58
4. Greening the Box (Wherry Housing Association)
General description
This was a low-tech adaptation of an existing Wherry Housing Association dwelling in the Norfolk village of Ringland. The works took 16 weeks and were completed in June 2009.
The property was chosen as it was typical of Wherry’s ‘hard to heat, hard to treat’ properties, being a solid walled, 1920’s construction which is not on the gas network.
Project lead and partners
Wherry Housing Association (lead), Sustainable Ecological Architecture (SEArch), Broadland District Council.
Wherry Housing Association was formed following the transfer of 3,715 homes from Broadland District Council on 4th April 1990, and it currently owns and manages almost 7,000 homes in Norfolk, Suffolk and Cambridgeshire.
Greening-the-Box (GTB) is an initiative introduced by SEArch (Sustainable Ecological Architecture Ltd), adopted by Wherry Housing Association in partnership with Broadland District Council for the environmentally responsible adaptation of an existing dwelling to standards fit for a low carbon future
Specific objectives
• Reduce residents’ fuel bills • Reduce the dwelling’s CO2 emissions by at least 60%
Energy efficiency measures
• The south facing windows were re-arranged and enlarged to optimise passive solar gain.
• The north facing windows were reduced by 50% in size, to minimise heat losses. • 24mm low-E double glazing was installed. • The thermal mass was only increased marginally, but its effectiveness was greatly
increased. Prior to refit, heat was lost from the building due to the lack of insulation on the solid external walls and below the ground floor slab. Following the refit, the externally insulated walls and floor now act as a heat reservoir, moderating internal temperatures throughout the year.
• External insulation has reduced the average U-value by 83% from 2.24W/m2K to 0.39W/m2K.
• A thermostatically controlled, low-grade electric underfloor heating system is embedded in the concrete floor slab. Apart from this and a wood fire, there is no other heating system.
• 600mm of quilted recycled plastic roof insulation was installed.
Water efficiency measures • Rainwater is collected from the roof and stored in a tank with 1,100 litres capacity
Other measures related to carbon saving or climate change adaptation
• A flat-plate solar water heating collector (5.2m2) was installed, providing an estimated 1,433kWhrs of heat annually.
• Passive stack vents were installed in the kitchen, utility room, and bathroom, for natural ventilation.
• 7.2m2 of monocrystalline PV panels have been installed which supply an estimated 1,050kWhrs of electricity per year.

Costing an enhanced Decent Homes Standard
Centre for Sustainable Energy 59
Funding/cost details
Solar water heater £4,910 Roof inspection and insulation £2,170 Roof strengthening £600 Wood burning stove £1,970 Break out ground floor slab and reduce levels £1,250 Lay new reinforced concrete slab, DPM and insulation £750 Remove existing ceilings and fit insulation, plasterboard and skim £990 Electric underfloor heating £1,370 Passive ventilation £1,680 Photovoltaics £11,720 External cladding £13,210 Scaffold £1,350 Rainwater harvesting £2,720 Adapting window openings £2,700
Total: £47,390 The refurbishment of Greening the Box cost a total of £104,000. However much of this was spent on work to correct the initial poor state of the property, for example installing a new kitchen and bathroom. The energy related works amounted to less than half of the total cost (£ 47,930). The key elements are detailed above.
What was achieved?
The key objectives have been surpassed. SAP calculations estimate that, on average, annual household energy consumption and CO2 emissions have been reduced by around 80%. Insulation measures have significantly reduced heat loss from the home, reducing the heating bill by over £1,800. • Energy use: 200kWh/m2 per year (down from 968) • CO2 emissions: 2.1t/yr (down from 11) • Lighting: £39/yr (down from £77) • Heating: £307/yr (down from £2,169) • Hot water: £103/yr (down from £640) Qualitative feedback from tenants suggests their living environment has improved dramatically.
Key learning points
The property is heated by under floor heating on the ground floor. Whilst the lack of a central heating system means maintenance costs are avoided, the system in place offer comparatively low levels of control over indoor temperature: the responsiveness of the heating system and the need to leave doors open to ensure heat can reach upstairs rooms, may not be appropriate or acceptable in all circumstances.
A wood burning stove provides a low carbon form of secondary heating, which offers a greater level of control and responsiveness. The tenants are satisfied with this form of heating, but again, it may not be appropriate in all circumstances given the labour involved.
Ventilation has been significantly improved by the passive stack ventilation system. Extractor fans are no longer needed in the kitchen and bathroom.
There were some initial problems with the solar water heating which affected the quality of water from the taps. The issue highlights the need for installer training.
The project provides a real success story of cost-effective low-tech retrofitting of a hard-to-treat home. It not only significantly reduced direct emissions, but also took account of embodied energy in materials used, work carried out and long-term maintenance and replacement. Wherry Housing Association aim s to make this level of evaluation more common place in future investment decisions.
The tenants were very satisfied with the improvements, noticing benefits in terms of bills and their living environment and health, and would accept a rent increase in light of the improvements.
Wherry Housing aim to replicate the approach adopted here across its wider hard to treat social housing stock. An important aspect was the face-to-face advice and support the tenants received.
Further information
Mark Jones (Managing Director), Wherry Housing Association [email protected] www.greeningthebox.co.uk
www.circleanglia.org/corporate/development/showcaseschemes/greening-the-box-ringland,487,LA.html

Costing an enhanced Decent Homes Standard
Centre for Sustainable Energy 60
5. Shoreditch District Heat Network (Hackney Homes)
General description
The Shoreditch District Heat Network project was started in 2001, with a review of opportunities and the formation of a Project Team that encompassed the Hackney Technical Team, Housing Officers, Shoreditch Trust and residents. In 2002 the design was completed and funding obtained from the Shoreditch Trust for the installation of a district heating main set within the Cranston Estate in Hackney.
The project has been phased in such a way so as to minimise disruption to residents but also to ensure each phase is financially viable.
The purposes of the project are to reduce carbon, bring controllable affordable heat and energy to the residents of Hackney, and to reduce costs to LBH.
Phase 1 of the work was undertaken by Lovell with Orchard Partners (Design) and Invicta (installation) as their specialist contractors. The current phase (2) was also carried out by Lovell with Vital Energi as their specialist contractors. • Phase 1 – Cranston Estate heating main installation • Phase 2 – Cranston Estate Riser installation Oct 2010 and whole
scheme design. • Phase 3 - Internal works to individual properties March/April 2011 • Phase 4 – Pipe network extended to 25-196 Cropley Court and CHP plant installed • Phase 5 – Pipe network extended to Fairbank Estate, Thaxted Court and Halstead
Court
Project lead and partners
• Hackney Homes/Urban Life • Lovell/Vital EnergiLondon Development Agency • Homes & Community Agency • LBH • TMO, Cranston • TMO Wenlock • TRA Fairbank
Specific objectives
To develop a major heating network serving the Cranston, Fairbank and Wenlock Barn Estates (Cropley Blocks). In doing so, future proofing the centralised energy centre to enable other buildings to link up to the network. Specific objectives included: • To reduce the carbon footprint by 1282 tCO2 per annum with new plant installation • To reduce heating plant generating costs • To significantly reduce heating fuel consumption for Hackney residents • To eliminate the use of oil fired boilers currently in use
Energy efficiency measures
• Heat main with centralized boiler plant • Each property will be fitted with a Heat Meter in order to self monitor their energy
usage and adopt a more efficient pattern of usage.. • Each room will have TRVs on radiators
Water efficiency measures n/a
Other measures related to carbon saving or climate change adaptation
n/a
Funding/cost details
• Phase 1 – New Deal for Communities £1.2m • Phase 2 - HCA (LCIF) £500,000; Hackney Homes £400,000 • Phase 3 – Hackney Homes £1.4m (for internals)
The properties are located in council blocks which does provide for a mix of archetypes, however the cost variance for each archetype is minimal and dependant on bedroom numbers and any adaptations which may have been carried out. The main issue is surrounding design and layout of pipe work and location of heat exchangers within the individual properties. Costs will be confirmed on completion.
What was achieved?
• Phase 1 – District Heating Main set within the grounds of the Cranston Estate, terminated above ground for phase 2 connection.
• Phase 2 – The internal installation of risers and laterals connecting to the DH main and terminating at the front doors to each property.

Costing an enhanced Decent Homes Standard
Centre for Sustainable Energy 61
• Phase 3 – Funding is in place to proceed with the internal works. The client team are working towards the procurement of this next phase. This will involve the installation of a new wet heating system into each property and the necessary heat exchanger. It is envisaged that this will precede internal kitchen and bathroom works for the Year 5 Decent Homes programme on the estate, minimising disruption to the resident. During this time funding will be sought for the next 2 Phases.
A resident consultation ‘drop-in’ event to update and inform the residents of progress and future plans (subject to funding) was also held. If funding is not obtained for the next phase, the residents of Cranston will have at least the benefit of new heating pipe work which is better insulated and easier to maintain than existing. This has already reduced significantly management and maintenance costs. Cranston had an operative from the boiler section permanently located on site prior to the works.
Lovell Partnerships were commissioned, along with Vital Energi to undertake the phase 2 design and installation but also to deliver a whole scheme design to enable Hackney Homes to apply for further funding for the future phases, to go out to tender and to maximise cost certainty.
Key learning points
Funding and a clear and concise brief are vital to the project. The client team need to have sufficient knowledge of CHP or have access to this knowledge. This will enable pertinent questions to be asked and contractor ideas to be tested. This ensures the client is not “blinded by the science” and the brief can be achieved. Sufficient time should be allocated in procuring sub-contractors to ensure a thorough understanding of the brief. Other key elements include developing the contractor’s relationship with residents, good management and monitoring on client and contractor sides and clarity on planning requirements (relating to chimney/flue location). From the consultation event indications are that residents are pleased to see investment in their estate and improved heating efficiency and reduced billing costs. Some residents (leaseholders) expressed concerns as to how much it was going to cost them. At present the work completed has not interfered with individual properties – however, the next phase will do so and we anticipate a larger number of resident issues (as with most internal works programmes). A technical issue arose where the phase 1 works terminated to the rear of the property when in fact the phase 2 works required the DH main to the front of the block. Additional costs were subsequently incurred for the rerouting of a small section of the DH main and also riser routes.
Further information James Oubridge (Contract Administrator), Hackney Homes
6. Victorian House Retrofit (Camden Council)
General description
Over 50% of housing in the Borough of Camden is within conservation zones. This project aims to demonstrate a series of measures that enhance the energy performance (and thereby reduce the carbon emissions) of Victorian age property, while at the same time maintaining the characteristic heritage features of such housing. It is also testing out innovative works to minimise the cost and disruption of carrying out solid wall insulation thus allowing tenants to remain in situ.
The project started at the end of June 2010, and the build phase is now nearing completion.
Project lead and partners
• Sustainable Energy Academy • United House • London Borough of Camden • Parity Projects

Costing an enhanced Decent Homes Standard
Centre for Sustainable Energy 62
Specific objectives
• To reduce carbon emissions by ~80% • All work to the property will respect the building's heritage and that of the local area. • Prototype a Whole House in Situ Carbon and Energy Reduction Solution
(WHISCERS) using a Laser measuring system, innovative software and off site cutting of insulation to enable the residents to remain in situ during the works..
• Costs savings will be gained (1) by reducing work carried out on site (e.g. Cutting and creating dust), tenants can remain in situ which therefore reduces significant decanting costs, (2) by efficient cutting of the boards which will substantially reduce waste and (3) by time and rework savings on site.
Energy efficiency measures
• Internal solid wall insulation (using the WHISCERS prototype software*) • Loft insulation • Vacuum glazing in original sashes (draught proofed) • Installation of a new shower • Draught proofing • Mechanical Ventilation and Heat Recovery from kitchen and bathroom * Accurate measurements of the internal dimensions of the external walls of the property are taken, without having to move any obstructions (e.g. radiators or cupboards). The specifications are then fed into the software, which removes such obstructions and designs the shape of each section of insulation, minimising the amount of material used. The insulation is then cut off site and arranged in packages for each room. Target times for unpacking and fitting the installation are 30 minutes, although further time and work are required to allow the dot and dab to set and for mechanical fittings to be installed.
Water efficiency measures • Installation of a low water use shower
Other measures related to carbon saving or climate change adaptation
• Solar Thermal (water heating) panels • Solar Photovoltaic panels
Funding/cost details
The project received £150,000 from Retrofit for the Future. This has covered all costs, including research and development of the insulation software and off site insulation cutting techniques, training where necessary and management costs, as well as the measures listed above.
The opportunity was also taken to modernise the kitchen, bathroom and WC. These works were paid for under Camden Council’s “Better Homes” scheme.
What was achieved?
Monitoring of the performance of the house is yet to be conducted. However, the majority of measures have been successfully installed within the timeframe and whilst the residents have been living in the property. Both the tenants and the project team are pleased with the work and the quality of the installations.
Key learning points
The work, by its nature, involved some disruption to the tenants. Special measures were implemented to ensure the health and safety of the residents during the project. The works were scheduled to minimise disruption, and the project team maintained good communication, keeping the residents up-to-date with developments and forthcoming works. However, it was not always clear what the impacts of the works would be on the tenants, for example, the number of people who would be on site and the number of rooms taken out of use during the works.
Further information Charlie Acton (Energy & Sustainability Project Officer), London Borough of Camden

Costing an enhanced Decent Homes Standard
Centre for Sustainable Energy 63
7. Beyond Decent Homes Standard 2009 (Sustainable Housing Action Partnership)
General description
The vision of the Sustainable Housing Partnership (SHAP) is “To provide leadership in Sus-tainable Housing in the West Midlands by promoting, researching and disseminating best practice in the Environmental Social and Economic aspects of Sustainable Housing”.
In recognising that the Decent Homes Standard could be enhanced to establish a new environmental standard for existing housing, the SHAP partners made the decision to prepare and publish the Beyond Decent Homes Standard. The Standard is designed to set social housing on a course to support delivery of the UK’s Low Carbon Transition Plan in which the Government expects the domestic sector to deliver a greater share of emissions reductions, of at least 29% on 2008 levels by 2020, with proposals that all homes undergo a ‘whole house package’ of improvements by 2030.
The Standard is also designed to be a practical tool for use by social landlords and the SHAP partners have committed to the inclusion of the Standard in their Development Briefs and Asset Management Strategies, subject to appropriate funding.
Project lead and partners
URBED (lead) with support from Faithful+Gould and Bates Wood.
Commissioned and funded by the SHAP partners:
• Accord Housing Group • Birmingham City Council Housing Services • Family Housing Association • Renew North Staffordshire Housing Market Renewal Pathfinder • Sandwell Homes • Sandwell Metropolitan Borough Council • Shropshire Housing Group • Urban Living Housing Market Renewal Pathfinder • Wates Living Space • Wolverhampton Homes
Specific objectives
The Beyond Decent Homes Standard is designed to set social housing on a course to support delivery of the UK’s Low Carbon Transition Plan in which the Government expects the domestic sector to deliver a greater share of emissions reductions, of at least 29% on 2008 levels by 2020, with proposals that all homes undergo a ‘whole house package’ of improvements by 2030.
The Standard looks to achieve stretch targets ahead of national commitments for carbon re-duction, to be achieved in three stages linked to Energy Performance Certificate ratings:
• Stage 1: Minimum Standard – all stock to achieve a minimum 42% reduction on 1990 levels by 2016 (SAP 75, Energy Performance Certificate rating C);
• Stage 2: Work in progress – asset management plans to achieve the 2025 target (Step 3) to be in place and substantial initial progress to have been made by 2020;
• Stage 3: Approaching completion – over 90% of stock to have achieved a minimum 80% reduction on 1990 levels by 2025 (SAP 85, Energy Performance Certificate rating B).
A mix of measures can be used to meet the Standard, adapted to the specific conditions and requirements of each property, and the replacement schedule for building elements. Four discrete categories are used to specify detailed improvements:

Costing an enhanced Decent Homes Standard
Centre for Sustainable Energy 64
• Building fabric performance – based on target u-value specifications • Fit-out – use of fittings that improve the energy efficiency of domestic hot water use
and fixed lighting, with all households having access to an affordable means of upgrading to A+ rated appliances
• Energy supply – supply of an affordable and low carbon source of heat, using renewables where possible
• Monitoring and awareness – all households will be provided with an induction into how to get the most from their home, monitor their energy use, and identify where in their home they use energy.
Energy efficiency measures
A range of measures for a variety of housing types including:
• External wall insulation • Replacement double/triple glazing • Floor insulation • Door replacement • Communal gas boilers • Heating control upgrade • Ventilation heat recovery • Low energy light bulbs • A+ rated washing machines and fridge/freezers • Advanced heat and power metering
Water efficiency measures
A range of measures for a variety of housing types including:
• Replacement of tap fittings to spray taps • Tap flow restrictors • Low flow shower heads
Other measures related to carbon saving or climate change adaptation
• Solar water heating • Communal biomass heating
Funding/cost details
The evidence base for the Beyond Decent Homes Standard suggests that it will cost between £15,000 and £32,000 per property to achieve the 80% (EPC B/SAP 85) carbon reduction target. Some of this could be integrated into planned improvement and replacement programmes. A breakdown of costs for case studies considered is available at:
http://www.shap.uk.com/assets/userfiles/Beyond_Decent_Homes/Beyond_Decent_Homes_v1_Detailed_cost_estimates.pdf
What was achieved?
The Beyond Decent Homes Standard has been developed using three components, each of which have been designed and tested in conjunction with the project partners in order to take them ‘beyond decent homes’: the Standard for Improvement, the Framework of Benefits and the Implementation Plan.
The Standard is supported by an evidence base consisting of eight hypothetical but real case study properties which were surveyed and tested. Each case study was used to test and develop the overall approach and is available as a technical datasheet and Specification Digest. The SHAP partners are now taking forward real pilots to validate the costs/performance predictions.
Key learning points
Although the programme is in its early stages, the case studies have provided realistic cost implications of the standard whilst exploring the technical issues around implementation. The development of the Delivery Framework has been vital in capturing the wider benefits of the standard to both tenant and landlord, and the local economy.
The key to delivering the standard as a staged investment programme will be to put in place a low carbon asset management plan which fully considers the phasing of measures and the implications of time lags between them.
Other important learning points include:
• The importance of demonstration projects – to pilot new or unfamiliar specifications • RDSAP is too simplistic for validating proposed upgrade programmes – better to use
detailed SAP assessments • The importance of monitoring – to verify the benefits • The full range of measures identified by the Standard is likely to require additional
capital outlay over and above provision through, for ALMO’s, the current Major Repairs Allowance, Housing Improvement Programme and, for Housing Associations, their

Costing an enhanced Decent Homes Standard
Centre for Sustainable Energy 65
medium to long-term business plans. SHAP and the HCA are currently taking this forward in the form of the 'Community Green Deal' financing mechanism for area-based investment programmes.
Further information
Nick Dodd (Principal Director, Sustainability) Urbed
[email protected] http://www.shap.uk.com/projects/20091016091553
8. RELISH (Residents for Low Impact Sustainable Homes), Worthing Homes
General description
The Relish project aims to demonstrate how a cost effective approach to retrofitting, alongside close resident involvement, can both support the ‘decent home’ standard and contribute to the government’s sustainability and fuel poverty agendas.
The initial stage is a 12 month pilot, which started in June 2009 and is detailed here, but the project has medium and long term objectives. The pilot scheme is using standard, traditional housing stock, specifically four 1950s 3-bedroom semi-detached homes. In addition the following parameters have been set:
• Work has been conducted with residents in-situ, to be applicable to as many other homes as possible
• Maximum spend is £6,500* per property • Physical retrofits are combined with a residents’ awareness and support programme. • Outcomes are monitored over a 12 month period using quantitative data from smart
meters and qualitative data from residents’ feedback • Pilot scheme data will inform wider rollout programme • Outcomes fed back to residents as a rating, which reflects the energy efficiency of
their household. * As an extra-over, the ‘normal’ expenditure on planned maintenance and lifecycle reinvestment in social housing properties.
Project lead and partners
• Worthing Homes • Rydon • Faithorn Farrell Timms • University of Brighton (KTP)
Specific objectives
The aims of the pilot programme are to determine the following:
• the impact of sensible low-carbon refurbishment techniques; • the specific impact of tailored residential advice/education; • the percentage improvement achieved by undertaking sensible low carbon
refurbishment and/or tailored residential advice, compare against: o the government’s 80% CO2 reduction target; o historic bill data for each household (fuel poverty); o RdSAP predictions;
• reduce the incidences of fuel poverty across the UK;

Costing an enhanced Decent Homes Standard
Centre for Sustainable Energy 66
• share best practice when carrying out retrofit works to occupied homes; • develop a cost efficient list of ‘best in class’ energy improvements; • demonstrate the benefits of energy monitoring and targeted energy efficient advice; • develop a “Relish™ Rating” (a household energy rating system).
Energy efficiency measures
Measures installed since 1990: • double glazed PVCu windows, • cavity filled insulation • Non-condensing gas boilers (SEDBUK G rated). New measures (modelling with RdSAP): • top-up loft insulation to 270mm; • installation of SEDBUK A rated condensing boiler; • new low-energy lighting to all fittings; • effective boiler controls including thermostat and TRVs; • sealing of open fires places / chimneys. New measures (not modelling with RdSAP): • insulate loft access hatch using 50mm PIR insulation; • draught proof loft access frame; • insulate flat roof of bay window ceilings; • if redundant, remove any airbricks, insulate cavity and block up openings; • check and seal around kitchen waste pipes, boiler flue, soil penetrations etc to
prevent air leakage; • filling gaps between floor and skirting board; • overhaul existing double glazed windows – ensure casements close correctly, seal
draughts by insulating gaps behind trims, repair any trickle ventilators, etc; • if redundant, remove cat flaps within doors and provide new insulated panel; • install reflective radiator panels behind radiators; • check heating load and ensure any undersized radiators are replaced; • provide TV/Audi Visual Intellipanel for lounge and all bedrooms to power down all TV
points; • provide Smart Meter to monitor electric consumption; • replace standard kitchen/ bathroom extract fan with 'Vent Axia Low Carbon Centra’
duel speed fans; • remove electric shower and replace with new mixer shower served from central gas
boiler plant; • plaster any exposed brickwork and extend new sub floor (plywood or latex) to entire
floor area of bathroom, including under bath; • install tidi-dry over bath; • install ‘chimney balloon’ to fireplace.
Water efficiency measures
n/a
Other measures related to carbon saving or climate change adaptation
n/a
Funding/cost details
The maximum expenditure of £6,500 (which is the same as that identified by Government as suitable investment for existing homes) was provided by Worthing Homes and was considered by the project to be affordable for registered providers to consider for their own housing stock.
What was achieved?
The emissions of the measures were monitored by RdSAP modelling of the properties. In 1990, all four properties had a SAP rating of 39 and omitted 6.90 tonnes of CO2 per year. After installing the basic measures, the SAP rating increased to 61 and they now omit only 4.00 tonnes of CO2 per year.
With the additional measures the SAP rating increased further to 72. These homes will now emit just 2.6 tonnes of CO2 per year, representing a further reduction of 1.4 tonnes

Costing an enhanced Decent Homes Standard
Centre for Sustainable Energy 67
and a total CO2 reduction of 4.3 tonnes. This also represents a 62.3% reduction compared with 1990 levels – a fair way towards the ultimate target of 80%.
After the first nine months of the project the following savings have been made on energy bills:
• Works and education has saved £277.36. • Works only has saved £73.48. • Educating a ‘Good Energy User’ has saved £8.16. • Educating a ‘Poor energy User’ has saved £194.24.
Key learning points
• Outcomes are monitored through smart meters and regular residents’ reviews (diaries and questionnaires). Participants were incentivised to make energy saving lifestyle changes by understanding, in real terms, the actual cost of certain actions (e.g. difference in cost between using an electric steamer compared with hob steaming). However, the ‘Novelty factor’ associated with smart meter technology wears off over time
• Behaviour change was shown to have the largest single impact and therefore essential to reach the desired 80% reduction target. The involvement of the tenants from day 1 seems to have been appreciated and tenants have felt involved and that they were a significant part of the process: “it’s good that my views are important – I feel like I’m part of things.”
• Most significant savings were made in electricity consumption but savings realised on gas fuel (heating) were not as great as expected
• Education and support post works has a positive effect on energy reduction • Energy improvement works alone do not necessarily reduce fuel consumption and
carbon emissions • Greatest potential for reduced energy consumption is among residents who had least
knowledge / awareness and benefited the most from education • Means of paying fuel bills influences energy use (results more immediate with pre-
payment method despite higher unit costs) • Some residents unwilling to change behaviour regardless of cost and potential
financial benefits
The next stage of the programme includes: • 156 flats in the Worthing area to undergo refurbishment/education and advice • Carrying out post pilot resident surveys to evaluate the longer term impact of the
Relish programme (e.g. How do residents realise the financial benefits? Do they enjoy improved standards of living/health/life chances?).
Further information Robin Roberts (Property Services Director), Worthing Homes
9. Retrofit for the Future: post-Decent Homes properties - East Thames Group
General description
Retrofit for the Future is a project run by the Technology Strategy Board (TSB) to provide improvement measures to reduce CO2 emissions in Britain’s social housing. East Thames

Costing an enhanced Decent Homes Standard
Centre for Sustainable Energy 68
Group received funding from TSB under this programme to retrofit three of its properties with new technologies to reduce energy consumption, fuel costs and carbon emissions. One of the properties undergoing the retrofit is an east-west facing, brick cavity construction, mid- terrace house built in 1992, located in Beckton. The project started in October 2010. Work is expected to be completed towards the end of December 2010.
Project lead and partners
East Thames Group (social landlord); Lakehouse (contractor); Penoyre and Prasad (architect); XCO2 Energy (mechanical & electrical, and energy consultant); Rajat Gupta Oxford Brookes University (energy consultant)
Specific objectives
The aim is to reduce household carbon emissions by at least 80%. Measures will include a combination of existing technologies and new, innovative solutions. The objective is to develop a strategy to reduce heating, hot water and electricity use that can be replicated across all similar housing stock throughout the UK, to help meet overall government targets on carbon reduction. The project also aims to avoid decanting the existing tenants whilst the work takes place, by ensuring ‘considerate’ construction practices. This is an important feature of the project in the context of scalability.
Energy efficiency measures
• External wall insulation (150mm external rigid insulation with a new render finish) to rear and internal wall insulation to front
• Ground floor insulation (vacuum insulated panels fitted over the current beam and block floor)
• Loft insulation (125mm mineral fibre between joists and 350mm above) • Party walls insulated with additional insulation to the loft space side of the wall to
address the bridge through the roof • Existing glazing to be replaced with high performance triple glazing • Front door to be replaced with a composite insulated version • Appliances replaced with current best energy performing models (to include tumble
dryer, fridge freezer, oven, and induction hobs). • Automatic standby power savers and a bespoke real time electricity meter will be
installed to try to reduce base load by 100w. • The kitchen and bathroom extract systems incorporate heat recovery to reduce heat
loss from ventilated air. • Waste water heat recovery (WWHRS) will be installed beneath the shower with a
vertical heat exchanger where the heat in the waste water is transferred to the incoming cold water.
• A flue gas heat recovery system (FGHRS) will be installed which recovers heat from the exhaust gases by transferring the energy to incoming cold water.
Water efficiency measures
The purpose of the Retrofit for the Future funding was to reduce CO2 emissions and although some water efficiencies will be obtained through the use of new technologies installed it has not been a direct focus for this project. Nonetheless there will be additional savings in water due to the A+rated and thus efficient washing machine due to be installed.
Other measures related to carbon saving or climate change adaptation
• A small (0.99kW) photovoltaic array • Secure operable louvers/vents to be installed for use during winter and when
unoccupied in summer. • The current property already includes high levels of thermal mass within the solid
internal walls and wet plaster lining system. Through appropriate secure natural ventilation this thermal mass can be better used to regulate internal temperatures during peak summer periods.
• Daylight levels will be improved through the installation of the 'solar ventilation chimney’ and skylight in the roof to project daylight to the first floor landing area
• Internal ventilated drying space will be incorporated to avoid use of the tumble dryer. • Bespoke package of feedback meters will relate real time heat and electricity usage
to cost. The displays will also feature information on internal and external temperature; windows left open, extract fans on and hot water use.
• Evacuated tube solar thermal system with solar divert valve allowing preheated water to be used by the existing efficient combi boiler

Costing an enhanced Decent Homes Standard
Centre for Sustainable Energy 69
Funding/cost details
All measures are fully funded under the project Retrofit for the Future, led by the Government-funded Technology Strategy Board (TSB). Total Budget £150,000 inc VAT Building Works Approx £82,000 Consultancy and testing/monitoring approx £60,000
What was achieved?
The measures being installed (listed above) were modelled using SAP and when combined should achieve the overall target of an 80% reduction in emissions. Key achievements include: • The central roof area has been opened up to provide more natural light to the centre
of the house and a naturally ventilated clothes drying facility. A new mezzanine floor in this area also provides better access to the loft space and a small study area below on the landing.
• Solar thermal and photovoltaic panels fitted to the front and back roof. • Insulation levels increased in the floor, roof, external walls and party walls. • U-values achieved with new insulation measures significantly beyond the levels
expected of Part L compliant new dwellings. • The ‘breathing’ roof uses natural insulation with good moisture vapour diffusion, good
thermal mass, low embodied energy and CO2 sequestration. The loft insulation is 85mm existing fibrous insulation topped up with 300mm hemp-flax quilt. The roof insulation is 100mm rigid wood fiber slabs laid on top of rafters, with 85mm hemp-flax quilt between rafters and 225mm hemp-flax quilt below rafters.
• An innovative insulation material is used for the ground floor (thin vacuum insulation panels) and roof (rigid wood fibre and hemp-flax quilt) which are locally sourced - VIPs manufactured in UK and hemp and flax grown in East Anglia.
Key learning points
Detailed monitoring of energy use within the property for a period of at least 12 months prior to and post the retrofit will enable the team to determine the success of the refurbishment in meeting the 80% target. The strategy for carbon reduction focussed on energy efficiency, using renewable technologies sparingly. The effectiveness of each measure will be assessed both in isolation and combination as a whole house retrofit solution. The monitoring will include energy metering as well as analysis of internal comfort conditions. Questionnaires and analysis will be conducted with the tenant to determine the impact of the retrofit on residents.
Further information East Thames Group [email protected]
10. REDBRICK ESTATE – London Borough of Islington
General description
The Redbrick estate is a medium rise estate comprised of flats and maisonettes up to four stories. In total there are 111 units on the estate in three blocks: Bartholomew Court, Steadman Court and Vickery Court. 53 are leasehold and 58 are tenanted. The estate was built in the mid-1970s and is located in the Old Street area in the South of Islington.

Costing an enhanced Decent Homes Standard
Centre for Sustainable Energy 70
Between 2005 and 2012 the estate will undergo a series of improvements including, and beyond, the Decent Homes standard. The improvements include: • 2005/06: Double glazing UPVC window replacements • 2005/06: Cavity wall insulation • 2007/08: Decent Homes works (kitchen replacements) • 2010/11: Solar photovoltaic installation • 2010/11: Boiler control improvements • 2010/11: Energy efficient lighting upgrades • 2010/11: Environmental bio-diversity works • 2011/12: Connection to a local CHP plant
Project lead and partners
Islington Council is the freeholder of all of the properties and they are managed by Redbrick Tenant Management Organisation. All of the contracts for improvement works were let and cliented by the council’s ALMO, Homes for Islington, on the council’s behalf. The contractors for each of the works are as follows: • Window replacements – Piper windows. • Decent homes works – Murphy • Cavity wall insulation – Kershaw • Solar photo-voltaic installation - Solarcentury • Boiler control improvements - EPS • Energy efficient lighting upgrades – Mission Environmental • Environmental bio-diversity works – The Green Firm • Connection to a local CHP plant – yet to be procured
Specific objectives
There were three key motivations behind the improvement works: • bringing the properties up to the Decent Homes standard • helping the council to achieve its target of reducing carbon emissions by 15% by
2010/11 • Reducing fuel poverty
Energy efficiency measures
• Double glazing uPVC window replacements - all properties received uPVC double glazing
• Decent homes works (kitchen replacements) - all tenanted properties that qualified under the Decent Homes criteria received new kitchens
• Cavity wall insulation - all properties received cavity wall insulation • Boiler control improvements - there are two boiler houses on the estate that supply the
communal heating and hot water demands of all the residents and a connecting Health Centre. Both boiler houses received BMS controls for their communal heating systems
• Energy efficient lighting upgrades - the underground car parking area on the estate received energy efficient lighting improvements
• Connection to a local CHP plant - the estate will be heated by a local CHP plant owned and operated by the council
Water efficiency measures None
Other measures related to carbon saving or climate change adaptation
• Environmental bio-diversity works - the communal areas on the estate received biodiversity improvements, helping the estate to adapt to climate change.
• Solar photovoltaic installation - two blocks, Batholomew Court and Steadman Court, received photovoltaic systems
Funding/cost details
The costs for each aspect of the improvements works are shown in the table below. As all of the properties are of the same construction there is no variation between properties apart from property size.
Works Funding sources
Estimated works cost
Final works cost Variance
Cost per
home Works/fees
split
Double glazing
Council’s capital programme
n/a
£758,275 (leaseholder costs: £6,831)
n/a £6,831 11% fees on top of works costs.
Decent homes
Council’s capital programme
£919,995 £753,336 £166,658 £6,787 11% fees on top of works costs.
Cavity wall EEC (Energy £20,000 £19,356 £644 £174 11% fees on top

Costing an enhanced Decent Homes Standard
Centre for Sustainable Energy 71
Efficiency Commitment)
of works costs.
Boiler controls
Regional housing pot
£44,187 n/a n/a £546 11% fees on top
of works costs
Energy efficient lighting
Carbon management plan (council’s capital programme)
Total scheme costs: £7,759
£7,759 £0 £6.61 No fees as incorporated elsewhere.
CHP
Regional housing pot and growth area funding
Total scheme costs: £4.2m (inclusive of fees)
To be procured n/a
£5775 (per property costs may reduce in future phases)
13% inclusive of all development and design costs
PV cells
Low carbon buildings programme and the council’s climate change fund (council’s capital programme)
£65,550
£65,550 £0 £809
6.5% fees on top of works costs
Landscaping Regional housing post
£15,262
£15,262 £0 £138 11% fees on top
of works costs
What was achieved?
The cost and carbon savings of each of the improvements are shown in the table below. The carbon savings will help the council achieve its target of 15% reduction in carbon emissions by 2010/11 and reduce fuel poverty.
Works Annual carbon saving (tonnes)
Cost per tonne carbon saved
Annual fuel bill saving for each resident
Double glazing* 17% reduction compared to previous
n/a Up £120 Cavity wall insulation*
Decent homes n/a n/a n/a
Boiler controls 76 £581 Approx. £80
Energy efficient lighting 41.7 £186 n/a
CHP 2,000 £2,100 Up to 40% of current heating and hot water costs)
PV cells 5.311 £4,668 n/a
Landscaping n/a n/a n/a
*Please note that an exercise was carried out to assess the impact on carbon reductions of the cavity wall insulation and windows combined - this is why the savings are combined.
Key learning points
Each element of the works has been vital in combating carbon emissions reduction and to ensure residents are made aware of the measures necessary. Ensuring information on this is available to all residents helps to change people’s behaviour on this subject and makes them more conscious of their day-to-day decisions.
The tenant management organisation has stated that they are thrilled with the solar works and the landscaping. The insulation was welcome, particularly as it was grant-funded.
There were no hidden costs.
There were no technical issues or problems with monitoring.
We would have carried out more consultation prior to major works if we were to do the work again.
If feasible it would be good to install solar on Vickery Court as well – whether PV or thermal – to benefit from the feed-in tariff and/or the renewable heat incentive when it has commenced.