costs, returns and problems in production of...
TRANSCRIPT

CHAPTER III
COSTS, RETURNS AND PROBLEMS IN PRODUCTION OF ONION
3.1 INTRODUCTION India is the world’s second largest producer of vegetables next only to China.
Number of vegetables grown in the country is quite large, but vegetable crops occupy
only 2.5 per cent of the total cultivated land. Observed yield and area under vegetables
indicate that the production of vegetable in India is inadequate to meet the needs of the
country. Vegetable culture being of short duration, generally labour intensive and more
number of crops can be taken from unit area in a season or year, it is suitable for
increasing the income of small farmers and make more effective use of land and labour
resources for agricultural development1.
Onion (Allium Cepa) is an important and indispensable item in every kitchen as
condiment and vegetables in India. It is an important crop in all continents and commercially
cultivated in various countries. However, about three-fourth of global production is
accounted for by 24 countries in the world, the important countries are China, India,
USA, Russia, Spain, Iran, Turkey, Brazil and Japan. The demand for onion is world-wide
and is not limited to any particular climate and nationality. Highly industrialized nations
such as United Kingdom and Germany are leading importers of onion. China ranks first
in area and second in onion production in the world.
Onion is one of the most important vegetables cum condiment crops of the
Liliaceous family grown in India. It ranks second only to tomato in terms of total annual
production in world. Besides the traditional Rabi crop (winter season), the kharif crop
(summer season) now being grown successfully in the Northern and Eastern parts of the
country has revolutionised onion production in India. Onion can be kept for a fairly long
time and can safely withstand hazards of rough handling including long distance transport.
Onion can be kept for a fairly long time and can safely withstand hazards of rough
handling including long distance transport. The edible portion of onion is a modified stem
1 Maitry, S.K., Banerjee, B.N., and Maiti, A.K., “Marketing Efficiency – A Case Study of Kakrol”,
Agricultural Marketing, Vol.XLVI., No.4, 2003, p.28
Please purchase PDF Split-Merge on www.verypdf.com to remove this watermark.

79
bulb i.e. 38.40 per cent and used throughout the year in the form of salad, condiments and
for cooking with other vegetables. Onion is also used in soups, sauces, curries, pickles,
for flavouring and seasoning foods. Onion bulbs are rich sources of calories, vitamins,
proteins, carbohydrates, iron, minerals, and ascorbic acid. Onion bulbs having medicinal
properties are recommended for the person suffering from high cholesterol, asthma,
weakness, lethargy and lack of vitality. It is also useful in curing hay fever, dropsy,
catarrh diabetes and chronic bronchitis.2
To meet the food requirements of the increasing population several strategies
have been adopted by our planners. Revolutions and special missions helped to meet the
needed requirements e.g., Green Revolution brought about self-sufficiency in wheat and
rice, White Revolution helped India to become the largest producer of milk in the world,
Yellow Revolution helped increase production of oilseeds, and the Blue Revolution
resulted in high production and marketing of fish and marine products. In the same way,
the Pink Revolution placed India on the world map for increasing productivity and
production of onion in the country. Likewise National Horticulture Mission aims at
enhancing the production of fruits and vegetables in the country.
Some of the horticulture products have 'political' potentials and overtones. They
serve as bombshells and, at times, serve as handles to beat the political opponents with.
Several mighty governments in the Asian region had to kiss the earth because there was
shortage of onion. The ruling political parties in the region have always been conscious that
at no time, especially during the political turmoil, there should be a shortage of onion3.
This chapter presents the results of production analysis of onion. These results
have been obtained by applying number of analytical techniques using primary data for
defining the production environment of onion in Erode District of Tamil Nadu. The following
sections include broader view of onion production and its production environment, results
2 Malik, D. P., Kumar, Sanjay and Hooda, B. K., “An Economic Analysis of Production and Export of
onion in India”, Ibid, Vol. XLVII, No.1, 2004, p.12 3 Daman Prakash and Shrotriya, GC., “Enhancing the Pungency through "Pink Revolution -Marketing of
Onion in India”, Agribusiness Management for Marketing Onions in Cooperatives of India, Rural Development and Management Centre Article, 2008, p.1
Please purchase PDF Split-Merge on www.verypdf.com to remove this watermark.

80
of cost-returns, factors influencing the farmers to cultivate onion, opinion of the farmers
about the availability of factors for cultivating onion and problems in cultivation of onion.
The study is based on the primary data collected from 580 sample farmers, who
are cultivating onion, through interview schedule constructed in this regard.
3.2 ONION CULTIVATION PRACTICES
A farmer produces many products on farm and uses many inputs to produce each of
his products. His object is to maximize the profits from farming. And in this connection, we
should note that only a particular combination of products and a particular combination
of inputs used to produce each of the product included in the product basket will yield
maximum profits4.
In Erode district, the cropping season for onions begins in the months of
September-October. Most farmers choose to cultivate small onion (multiplier) in their
field during Rabi season in order to get good returns during winter. The following
methods of production practices are followed.
3.2.1 LAND PREPARATION Land preparation forms an important activity in the cultivation of onion. Tractor
is commonly used to perform the land preparation practices for onion in the study area.
The first activity in land preparation is tilling or ploughing of land. The farmers use
tractor and bullocks for ploughing, spacing and row setting for sowing. Finally, human
labour is used for leveling the row setting. In comparison with other local crops, such as
maize, the tilling and planting requirements for onions are much more labour intensive.
3.2.2 SOWING OF ONION Onion plants are usually grown by various means like transplanting of seedlings,
planting bulbs, direct sowing of seed in the main field, crop by sets etc. Among all those,
the cultivation of onion through planting of bulb in the wet field is more commonly
practiced by farmers in the study area.
4 Soni, R.N., “Leading issues in Agricultural economics”, Vishal Publishing Company, 2007, p.207
Please purchase PDF Split-Merge on www.verypdf.com to remove this watermark.

81
3.2.3 IRRIGATION After the planting of onion has been completed, the farmers must monitor field
conditions cautiously. Timely irrigation of the early crop is essential. Irrigation is depending
on soil and climate. Water requirement of the crop at initial growth period is less.
It depends on crop growth, soil type and planting season. Nearly 10 times of irrigation is
made to onion as frequent irrigation delays maturity. Irrigation is mostly made by direct
watering into the rows. Only few of the farmers are using sprinkler method of irrigation.
Irrigation is stopped 15-20 days before attaining maturity for improving the keeping
quality of onion.
3.2.4 MANURING AND FERTILIZATION
The soil for onion growing should be liberally manured and fertilized. Since most
of the farmers have their own cattle, they tend to use their own farmyard manure and
others use manures by buying from outside farms. In addition to farmyard manure, farmers
apply chemical fertilizers for their farm for getting good growth of onion. They mostly
depend upon private fertilizer shops.
3.2.5 WEED CONTROL
Two weeks after planting, the farmers begin the first important weeding operation. Onion
is closely planted and a rooted crop. Thus manual hand weeding is mostly used by farmers in the
study area. Only limited farmers use chemical weedicides along with hand weeding at critical
stage. Nearly three to four times of weeding is required until onion is harvested.
3.2.6 HARVESTING
As onion bulbs increase in size, the onion leaves begin to collapse. This occurs
80 to 120 days after planting. In the study area, onion is harvested only by human labour
by pulling. Once the harvesting started, they are kept in farm field and brought to labour
households for shed curing. This operation is one of the very labour-intensive activities in
onion production.
3.2.7 CULTIVATION OF IMPROVED VARIETIES OF ONION
In the study area, only very few farmers are cultivating improved varieties of onion
such as Co 4 and Co (on) 5. Though the farmers are aware of other improved varieties
Please purchase PDF Split-Merge on www.verypdf.com to remove this watermark.

82
such as Co1, Co2, Co3 and Bangalore rose, majority of farmers are cultivating only local
(nattu) variety of small onion. Because of poor demand, highly perishable nature and
failure in transplantation than in direct sowing, farmers do not prefer to cultivate the improved
varieties of onion.
3.2.8 ADVICE FROM AGRICULTURAL AND HORTICULTURAL DEPARTMENTS
FOR ONION CULTIVATION
Most of the farmers in the study area are having the habit of cultivating onion as
per their traditional practices. They are of the opinion that there is no response from the
officers of the Agricultural and Horticultural departments of the Government whenever
they seek help for arresting the pest attack. This is mainly due to non-availability of
sufficient officers and assistants to them.
3.2.9 SOURCE OF FINANCE FOR CULTIVATION OF ONION
The major problem being faced by farmers in India is insufficiency of finance.
Majority (302) of the sample respondents are using short term borrowed finance. They
borrow money from friends and relatives, from cooperative Bank in the form of interest
free jewel loan, from commercial banks as crop loan and from local money lenders. Some
times, farmers depend on commission agents for finance for cultivating onion.
3.2.10 SOURCES OF SEED PURCHASE
Being onion a seasonal crop, farmers cultivate onion in two season’s viz. Kharif
and Rabi seasons. Most of the farmers prefer to cultivate onion in Rabi season for
favourable moisture climate prevailing from November to February. Some farmers use
onion produced as an intercrop during Kharif season as seeds while others depend on
local farmers and markets for the purchase of onion seeds. Punjaipuliyampatti market is
the important market place for the purchase of onion seed followed by Modachur market,
Bootha padi market and Erode market
3.3 FACTORS MOTIVATING THE FARMERS TO CULTIVATE ONION The success of farming is judged by the amount of profit gained in it. In the area of
study, sample Farmers are interviewed to disclose the factors which motivate them to
cultivate onion. According to trade sources, small onion is mainly cultivated in three
Please purchase PDF Split-Merge on www.verypdf.com to remove this watermark.

83
seasons, but now the produce is available in the market throughout the year in Tamil Nadu.
Farmers are of the opinion that the crop duration, lesser cost of cultivation, storability and
better profits compared to other crops lead them to prefer cultivation of onion after onion5.
To examine the motivating factors, ten factors such as suitability of soil, availability
of limited water, quick returns, less risk, traditional practices, less cost of cultivation, less
fertilizer consumption, less application of plant protection chemicals, availability of
human labour, easy marketability have been considered. Simple Ranking analysis has
been applied to identify the factors motivating onion cultivation.
3.3.1 SIMPLE RANKING ANALYSIS
The following Table 3.1 shows the factors motivating the farmers to cultivate
onion and the rank assigned to each of them.
TABLE 3.1
FACTORS MOTIVATING THE FARMERS TO CULTIVATE ONION:
SIMPLE RANKING ANALYSIS
S.No. Factors Total Score Mean Score Rank
1 Suitability of soil 3847 6.63 III
2 Availability of limited water 3898 6.72 II
3 Quick returns 3082 5.31 VII
4 Less risk 3169 5.46 IV
5 Traditional practices 4680 8.07 I
6 Less cost of cultivation 2577 4.44 VIII
7 Less fertilizer consumption 3132 5.40 V
8 Less plant protection chemicals 2173 3.75 X
9 Availability of human labour 3115 5.37 VI
10 Easy marketability 2227 3.84 IX
5 TNAU’s crop Report (2008), p.2
Please purchase PDF Split-Merge on www.verypdf.com to remove this watermark.

84
The above Table 3.1 shows that the traditional practices is the main factor which
motivated the farmers to cultivate onion with the mean score of 8.07 followed by
availability of limited water (6.72), suitability of soil (6.63), less risk (5.46), less fertilizer
consumption (5.40), availability of human labour (5.37), quick returns (5.31), less cost of
cultivation (4.44), easy marketability (3.84) and less plant protection chemicals (3.75).
Hence, it is concluded that the Traditional practices is the main factor which
motivated the sample farmers to cultivate onion in their farm.
In order to assess the effective ranking method, Garrett Ranking has been used to
examine the factors motivating the farmers for onion cultivation.
3.3.2 GARRETT RANKING
Scale values as per Garrett ranking technique for first to ten ranks are: 81, 70, 63,
57, 52, 47, 42, 36, 29 and 18 respectively.
The percentage position of each rank is made into score by referring factors and
summed up for assigning rank.
The Table 3.2 shows the factors motivating the farmers to cultivate onion as per
Garrett Ranking analysis.
Please purchase PDF Split-Merge on www.verypdf.com to remove this watermark.

85
TABLE 3.2
FACTORS MOTIVATING THE FARMERS TO CULTIVATE ONION: GARRET RANKING ANALYSIS
S. No. Factors
SCALE AND SCORE VALUES OF RANKS Total score
Mean score Rank Ranks I II III IV V VI VII VIII IX X
Scale value(x) 81 70 63 57 52 47 42 36 29 18
1 Suitability of soil F 75 82 67 100 88 67 30 25 19 27 580 56.31 III Fx 6075 5740 4221 5700 4576 3149 1260 900 551 486 32658
2 Availability of limited water
F 30 87 115 83 138 61 26 13 11 16 580 56.39 II Fx 2430 6090 7245 4731 7176 2867 1092 468 319 288 32706
3 Quick returns F 55 47 88 99 27 16 35 36 78 99 580 48.10 VII Fx 4455 3290 5544 5643 1404 752 1470 1296 2262 1782 27898
4 Less risk F 82 23 38 31 59 84 101 94 56 12 580 49.82 IV Fx 6642 1610 2394 1767 3068 3948 4242 3384 1624 216 28895
5 Traditional practices F 187 145 67 76 15 43 22 8 3 14 580 65.87 I Fx 15147 10150 4221 4332 780 2021 924 288 87 252 38202
6 Less cost of cultivation F 23 24 41 20 76 81 92 86 39 98 580 42.90 VIII Fx 1863 1680 2583 1140 3952 3807 3864 3096 1131 1764 24880
7 Less fertilizer consumption
F 29 87 78 49 39 39 80 83 35 61 580 49.08 V Fx 2349 6090 4914 2793 2028 1833 3360 2988 1015 1098 28468
8 Less plant protection chemicals
F 10 27 30 50 20 47 64 72 153 107 580 38.50 X Fx 810 1890 1890 2850 1040 2209 2688 2592 4437 1926 22332
9 Availability of human labour
F 58 44 28 47 82 84 70 81 32 54 580 48.60 VI Fx 4698 3080 1764 2679 4264 3948 2940 2916 928 972 28189
10 Easy marketability F 31 14 28 25 36 58 60 82 154 92 580 39.43 IX Fx 2511 980 1764 1425 1872 2726 2520 2952 4466 1656 22872 TOTAL N 580 580 580 580 580 580 580 580 580 580
Source: Primary Data
Note: Scale value, f= No. of Respondents, fx=Score value
Please purchase PDF Split-Merge on www.verypdf.com to remove this watermark.

86
The Table 3.2 also shows that the Traditional practices is the main factor which
motivated the farmers to cultivate onion followed by availability of limited water,
suitability of soil, less risk, less fertilizer consumption, availability of human labour,
quick returns, less cost of cultivation, easy marketability and less plant protection chemicals.
Hence, it is concluded that the Traditional practices is the main factor which
motivated the sample farmers to cultivate onion in their farm.
3.4 COST OF PRODUCTION OF ONION
Agricultural production is a complex process particularly for vegetable production.
The production of onion is associated with number of variables used in production
process. The production of this vegetable depends on natural environment, input use and
combination of inputs and management practices.
Onion is seasonal during their production period so issues related with their
production cost accountability are few. To work out production costs of the onion, all
the financial activity carried out during the production period have been considered.
The cost of production of onion is classified into fixed cost including land input and
variable costs including labour and capital inputs. Land input is fixed cost in the sense
that rent of land for the period of production and cultivation is not subject of frequent
variation as in case of materials and labour. The prevalent rent of land in the study
areas are collected on annual basis and distributed in the crop standing period including
own land. The labour input cost includes all those cost incurred on field operations
and production practices starting from land preparation up to harvesting which is
performed by human, animal and machinery. The main labour costs include the cost of
land preparation, sowing, irrigation, weeding and harvesting and shed curing. The capital
cost accounts the cost of seed, fertilizers and farm yard manures, pesticides and herbicides
and interest on input charges. The onion producing farmers have been categorized for the
purpose of study as small (below 2 acres), medium (2-4 acres) and large (4.1 acre and
above), based on the extent of land used for onion production. Following is the
mechanics of the calculation of major cost items of onion production.
Analysis of cost of cultivation of onion per acre on the basis of different sizes of
farms has been given in the Table 3.3
Please purchase PDF Split-Merge on www.verypdf.com to remove this watermark.

87
TABLE 3.3
ANALYSIS OF COST OF PRODUCTION OF ONION FOR DIFFERENT SIZE OF FARMS
(Rs. per Acre)
S. No. Type of Expenditure Size of Different Farms
Average Small Medium Large
1 Cost of seeds 5,091.87 (20.44)
5,219.93 (20.12)
5,246.97 (19.77)
5,207.54 (20.17)
2 Labour on land preparation 1,086.88 (4.36)
1,178.74 (4.54)
1,204.20 (4.54)
1,171.82 (4.54)
3 Machine Labour 1,456.66 (5.85)
1,511.47 (5.83)
1,550.38 (5.84)
1515.04 (5.87)
4 Cost of Bullock Labour 944.78 (3.79)
835.15 (3.22)
967.29 (3.65)
896.16 (3.47)
5 Labour for planting 687.09 (2.75)
871.94 (3.36)
859.24 (3.24)
837.27 (3.24)
6 Weeding 674.61 (2.71)
828.18 (3.19)
778.82 (2.93)
735.76 (2.85)
7 Labour for irrigation 827.44 (3.32)
889.01 (3.43)
852.35 (3.21)
815.92 (3.16)
8 Fertilizers and Farm Yard Manure
678.17 (2.72)
818.13 (3.15)
819.62 (3.09)
744.47 (2.88)
9 Plant Protecting Chemicals 3,427.44 (13.76)
3,678.35 (14.18)
3,508.06 (13.22)
3,581.61 (13.88)
10 Harvesting Charges 1,040.48 (4.17)
1,120.78 (4.32)
1,087.17 (4.09)
1,096.60 (4.25)
11 Labour on Shed curing 4,928.30 (19.78)
4,803.71 (18.52)
5,406.01 (20.37)
5,019.79 (19.45)
Sub Total(A) Variable Cost 20,843.72(83.65)
21,755.39 (83.86)
22,280.11 (83.95)
21,621.98 (83.76)
12 Rental value of Land 3,239.53 (13.00)
3,327.81 (12.83)
3,368.56 (12.69)
3,326.45 (12.89)
13 Interest of input charges 833.75 (3.35)
858.22 (3.31)
891.20 (3.36)
864.89 (3.35)
Sub Total (B) Fixed charges 4,073.28 (16.35)
4,186.03 (16.14)
4,259.76 (16.05)
4,191.34 (16.24)
Total Cost of Production (A+B)24,917.00(100.00)
25,941.42 (100.00)
26,539.87 (100.00)
25,813.32 (100.00)
Figures in parentheses are percentages to total
Please purchase PDF Split-Merge on www.verypdf.com to remove this watermark.

88
The Table 3.3 shows that, on an average, the cost of cultivation of onion per acre
for over all farms amounts to Rs. 25,813.32, whereas the average cost in small, medium
and large farms are Rs.24,917.00, Rs.25,941.42 and Rs. 26,539.87 respectively. Cost of
cultivation of onion per acre showed an increasing trend with the increase in the size of
farms. Among various components of operational costs, cost of seed accounted for
20.17 per cent of total cost followed by labour on shed curing 19.45 per cent, plant protection
chemicals 13.88 per cent, machine labour 5.87 per cent, labour on land preparation
4.54 per cent, Harvesting charges 4.25 per cent, bullock labour 3.47 per cent, Labour for
planting 3.24 per cent, irrigation charges 3.16 per cent, and cost of fertilizers and farm
yard manures 2.88 per cent and weeding charges 2.85 per cent. A size group-wise comparison
showed that large farms have made higher investment per acre than small farms. It is due
to their investment capacity for different inputs. It varied from Rs. 26,539.87 per acre on
large farms to Rs.24, 917.00 on small farms.
Therefore, it is concluded that the average cost of production of onion of large
farms is higher than the small and medium size of farms and over all farm size. The cost
of seed is the major portion on the total cost of production of onion.
3.5 PRODUCTION FUNCTION
Production is a process whereby some goods and service, called inputs are transformed
into other goods and services called output. The production function refers to the
relationship between the input and the resultant output. The production function is based
on the idea that the amount of output in a production process depends upon the amount of
inputs used in the process. Further, it is assumed that, an input or a set of inputs can
produce only one unique amount of output, which is termed as production function.
The farmer as producer has a given goal clearly to cut out with the inputs/ resources,
at his disposal. These resources are put into a process call production. This production
process may pertain to using of the resources or inputs viz., seed, fertilizer, irrigation,
human labour etc., to produce a given quantity of output of crop.
For assessment of on-farm production efficiency and returns, production function
analysis has been carried out. The production function has been estimated through input
and output relationship of the vegetables produced.
Please purchase PDF Split-Merge on www.verypdf.com to remove this watermark.

89
Production function is a technical and mathematical relationship describing the
manner and the extent to which a particular product depends upon the quantities of inputs
or services of inputs, used at a given level of technology and in a given period of time.
It shows the quantity of output or income that can be produced using different levels of
inputs6. A Cobb-Douglas type production function is used to estimate input-income
relationship in vegetable production.
3.5.1 COBB-DOUGLAS PRODUCTION FUNCTION
Cobb- Douglas production function model is a widely used model to estimate
resource use efficiency and return to scale in crop farms. The Cobb-Douglas production
function which has the best fit was selected to establish the input-output relations7.
In Cobb-Douglas production function, returns per farm is taken as dependent variable and
seven inputs viz., land in acres, machine labour, bullock labour, cost of seeds, total cost of
labour, fertilizer, and pesticides as independent variables. The regression coefficients of
different input used in the production function were estimated separately for each size
group sample farms. In order to get an optimum cost return model, cost of labour on land
preparation, planting, irrigation, weeding and shed curing are grouped into a single
category as human labour.
The Cobb-Douglas type of production function has been used to study the effect
of various input expenses on return of onion. On account of its well known properties like
its computational simplicity, it is widely applied in analysing production relations.
The form of Cobb-Douglas production function used in the present study is as
follows.
6 Soni, R.N., op cit., pp.207-208 7 Verma, A.R., Rajput, A.M. and Patidar, R.S., “Economic Analysis of Production, Resource Use
Efficiency and Constraints of Onion in Indore District of Madhyapradesh”, Agricultural Marketing, Jan-Mar., Vol. XLVI, No.4, 2004, p.23
Please purchase PDF Split-Merge on www.verypdf.com to remove this watermark.

90
The general form of the function is as follows:
Y = aX1b1X2
b2X3b3 X4
b4 X5b5X6
b6 X7b7eu
Where
Y = gross return of onion in rupees
A = constant
X1= area under crop in acres
X2= value of machine labour in rupees
X3= value of bullock labour in rupees
X4= value of seeds in rupees
X5= value of total labour
X6= value of fertilizer in rupees
X7=value of pesticides in rupees
eu = Error term
bi= the regression coefficient of the i (th) independent variable ( i = 1 to 7)
The Cobb- Douglas type production function has been converted into log linear
form and the parameters have been estimated by using ordinary least square technique.
The seven regressions fitted to data, log-linear regression is found to be best fit on the
basis of R2 value of standard error of the regression coefficients. The regression
coefficient of production of onion for different sizes of farms in Erode District have been
worked out in the following Table 3.4
Please purchase PDF Split-Merge on www.verypdf.com to remove this watermark.

91
TABLE 3.4
REGRESSION COEFFICIENT OF PRODUCTION FUNCTIONS OF ONION
FOR DIFFERENT SIZES OF FARMS
Particulars Size of Farms All
Farms Small Medium Large
Constant 4.323 (0.691)
3.065 (0.320)
3.724 (0.378)
1.486 (0.319)
Area of Land 0.444** (0.038)
0.042 (0.039)
0.205 (0.133)
0.0498**(0.044)
Seeds 0.332***(0.089)
0.283***(0.062)
0.143*** (0.049)
0.141***(0.050)
Total Human Labour -0.213** (0.104)
0.317***(0.082)
0.348*** (0.094)
0.433***(0.070)
Machine Labour -0.132* (0.085)
-0.002 (0.050)
0.029 (0.061)
0.108** (0.047)
Bullock Labour 0.062 (0.086)
0.082 (0.064)
-0.023* (0.145)
0.0582* (0.054)
Fertilizer and Manures 0.060 (0.075)
0.088* (0.053)
0.179 (0.124)
0.0418* (0.042)
Plant Protection chemicals 0.148** (0.056)
0.181***(0.050)
0.129 (0.076)
0.129***(0.042)
Coefficient of Determination R 0.915 0.948 0.950 0.939
Coefficient of Multiple Determination R2 0.832 0.899 0.903 0.882
Adjusted R2 0.830 0.896 0.896 0.880
F – Value 135.048 353.012 123.619 609.577
Number of Samples 193 286 101 580
Note: Figures in parentheses are standard errors of the regression coefficients.
* Significant at 10 per cent level.
** Significant at 5 per cent level.
*** Significant at 1 per cent level.
Please purchase PDF Split-Merge on www.verypdf.com to remove this watermark.

92
The Table 3.4 reveals that in the all farms, seven variables included in the analysis
has explained 88.20 per cent of the variation in gross returns by the coefficient of
multiple determinations (R2). The value of R2 is low in small farms (83.20 per cent)
followed by medium farms (89.90 per cent) and quite high in large farms (90.30 per cent).
In order to analyse the elasticity of production with respect to all farms, students ‘t’ test
has been applied. The regression coefficients of the cost items such as seed, total human
labour and plant protection chemicals are 0.141, 0.433 and 0.129 respectively. This implies
that 1 per cent increase in seed, labour and plant protection chemical would increase the
gross returns of onion by 0.141, 0.433 and 0.129 per cent. The regression coefficients of
area of land and machine labour are 0.0498 and 0.108 respectively and significant at
5 per cent level. The regression coefficients of fertilizers and manures and bullock labour
are 0.0418 and 0.0582, respectively and significant at 10 per cent level. Therefore, an
increase in fertilizers and manures and bullock labour by 10 per cent would increase the
gross returns by 0.0418 per cent and 0.0582 per cent respectively.
The positive but less than unity production elasticities of seed, manures and
fertilizers, human labour, machine labour and plant protection chemicals indicates the use
of these variables stood in the rational zone of the production surface. The coefficients of
expenditure on manures and fertilizers, seeds and plant protection chemicals are positive
and statistically significant for small and medium farms. Hence, it may be inferred that
seeds and plant protection chemicals are the important inputs which significantly increase
farm returns of small and large farms. The production coefficient of human labour is
positive and statistically significant for medium and large farms. In case of small farms,
the production elasticities of total human labour and machine labour turned out to be
negative indicating excessive use in small farms. The gross returns of land are positive in
small, medium and large farms but it is statistically significant in small farms. Bullock
labour has a negative elasticity coefficients indicating a decrease in gross returns due to
increase in the use of this resource on large farms. When the use of all other resources
kept constant, the regression coefficients of machine labour is also found to be negative
in the case of medium farms indicating excessive use of machine labour in the farms.
The results revealed that the farmers could increase the gross returns in onion by applying
Please purchase PDF Split-Merge on www.verypdf.com to remove this watermark.

93
more seeds, human labour, machine power, fertilizers and manures and plant protection
chemicals. The coefficients of other variables are not statistically significant, showing
that any increase in their application would not increase the gross returns of onion.
The calculated value of ‘F’ for small size land holding, medium size land holding,
large size land holding and overall farm sizes are 135.048, 353.012, 123.619 and 609.577
respectively, which are higher than the theoretical values of ‘F’ at 1 per cent level of significance
in all farms.
Hence, it is concluded that the relationship between cost and return of onion is
statistically significant at 1 per cent level in all size of farms according to ‘F’ Test.
3.6 COSTS-RETURN AND INPUT-OUTPUT RATIO OF ONION PRODUCTION
AMONG THE DIFFERENT SIZE OF FARMS
The per acre yield, cost of production, gross returns, net returns, cost-return ratio
in onion production among the farms of different size groups on the basis of cost
concepts have been given in the Table 3.5.
TABLE 3.5
PER FARM YIELD, COST OF CULTIVATION, GROSS RETURNS, NET
RETURNS, AND COST-RETURN RATIO IN ONION PRODUCTION
AMONG THE FARMS OF DIFFERENT SIZES
S.No. Particulars Size of Farms Over all
Farms Small Medium Large
1 Average Area of Land Holding 1.53 3.12 5.73 3.07
2 Average Output of onion per acre (in Kgs) 4857.58 4821.46 4762.44 4808.26
3 Gross Returns 58,451.94 57,245.44 58,156.63 57,740.57
4 Cost of production 24,917.00 25,941.42 26,539.87 25,813.32
5 Net Return 33,534.94 31,304.02 31,616.76 31,927.25
Cost-Return Ratio 1:2.35 1:2.21 1:2.19 1:2.24
Kgs=Kilograms Source: Primary Data
Please purchase PDF Split-Merge on www.verypdf.com to remove this watermark.

94
The Table 3.5 exhibits that average output of onion per acre on small sized farms
(4857.58 kgs) is higher followed by Medium (4821.46 kgs) and large (4762.44 kgs) and
is also higher than the overall farm size (4808.26). The gross and net return per acre is
also higher in the small farms. The input output ratio for small, medium, large and total
farms are 1:2.35, 1:2.21, 1.2.19 and 1:2.24 respectively.
Therefore, it is concluded that the farmers cultivating onion in the small size of
farms in the study area are receiving better return when compared to farmers holding
other size of farms.
3.7 CULTIVATION OF ONION AS AN INTER CROP
Onion is produced as a main crop as well as an inter crop among other crops.
An attempt has also been made to obtain information from the sample farmers regarding
the cultivation of onion as an inter crop. The following Table 3.6 shows that the number
of farmers cultivating onion as an inter crop and crops in which onion is cultivated as an
inter crop.
TABLE 3.6
CULTIVATION OF ONION AMONG OTHER CROPS
S.No. Name of the crop Number of farmers Percentage
1 Turmeric 78 43.58
2 Tobacco 42 23.46
3 Sugarcane 29 16.20
4 Banana 17 9.50
5 others 13 7.26
Total 179 100.00
The Table 3.6 reveals that among 580 sample farmers, only 179 farmers are
cultivating onion as an intercrop. Majority (43.58 per cent) of the farmers cultivate onion
as an inter-crop among turmeric, followed by tobacco, sugarcane, banana and others like
maize, cotton etc.
Please purchase PDF Split-Merge on www.verypdf.com to remove this watermark.
95
3.7.1 REASONS FOR CULTIVATING ONION AS AN INTER CROP
Among 179 farmers, more than 50 per cent (94) are cultivating onion as an inter
crop for seeds. Others are cultivating for their home purpose and short term returns. The average
yield of onion per acre when it is cultivated as an inter-crop would be around 2,000
kilograms. The sample farmers have a strong opinion that intercropping of onion would
certainly reduce the cost of cultivation of the main crop.
The cost of cultivation of onion while intercropping would be only cost of seeds
and labour. Application of fertilizer and plant protection chemicals to main crop would
reduce the pest attacks and the requirements of fertilizers to onion. Therefore, inter
cropping of onion is an additional source of income to the farmers.
3.8 QUANTIFICATION AND MEASUREMENT OF FARMERS OPINION ABOUT
THE FACTORS AVAILABLE FOR PRODUCTION OF ONION
These days farming has not remained specialised because of more risk and
uncertainty in the output as well as in prices. Farmers have diverted their efforts towards
growing vegetables rather than any other crops. It fetches them continuous flow of income
either throughout the year or atleast in the season. Income so received depends upon
various factors in production process. Price, Availability and Quality of seeds, Availability
and price of fertilizer, Availability of labourers and Finance for cultivation are some of
the important factors which influence the satisfaction level of the farmers in the way of
cost and return. Socio economic factors are the most responsible for not only cropping
patterns but also for production, efficient selection and application of factors available for
production of onion. The socio economic background has been defined and described in
the following section in order to understand the opinion / satisfaction of the sample
farmers about the factors available for production of onion.
Sample respondents have been asked to answer six questions regarding the factors
available for production of onion. When a respondent is highly satisfied with a factor, a
score of 5 has been allotted, like wise 4 for satisfied, 3 for neutral, 2 for dissatisfied and
1 for highly dissatisfied. As such, the maximum score that is assigned by a farmer from
all the six factors would be 30 and minimum score of 6. The respondent who scored
Please purchase PDF Split-Merge on www.verypdf.com to remove this watermark.

96
below 18 has been classified as dissatisfied and those who scored equal to above 18 has
been classified as satisfied about the factors available for production of onion. Likert’s
five point scale has been used in this regard.
According to the above, opinion of sample farmers (580) about the factors
available for cultivation of onion is classified and shown in the following Table 3.7.
TABLE 3.7
DISTRIBUTION OF SAMPLE FARMERS BY THEIR LEVEL OF OPINION
ABOUT THE AVAILABILITY OF FACTORS IN CULTIVATION OF ONION
Level of Satisfaction
Number of Sample Farmers
Total opinion score
Average opinion score
Satisfied (≥ 18) 248 (42.8) 4812 19.403
Dissatisfied (<18) 332 ( 57.2) 5160 15.542
Total 580 (100) 9972 17.193
Figures in the parentheses are percentages
The Table 3.7 lists out that an average opinion scores of all the sample farmers is
17.193. Among 580 sample farmers 57.2 per cent (332) of the respondents are dissatisfied
with the factors available for the production of onion while only 42.8 per cent (248) are
satisfied with the factors available for the production of onion.
Therefore, it is concluded that majority (57.2 per cent) of the sample farmers are
dissatisfied with the factors available for cultivation of onion.
3.9 RELATIONSHIP BETWEEN PERSONAL AND SOCIO ECONOMIC
VARIABLES AND THE OPINION OF FARMERS ABOUT THE
AVAILABILITY FACTORS IN CULTIVATION OF ONION
The identified personal and socio economic variables, which might influence the
level of opinion of the sample farmers about the availability factors in cultivation of
onion, are as follows:
Please purchase PDF Split-Merge on www.verypdf.com to remove this watermark.

97
1. Age
2. Education
3. Occupation
4. Family Income
5. Family Members engaged in agriculture
6. Area of land holding
7. Farm experience
8. Experience in onion cultivation
9. Extent of land used for onion cultivation
Significance of the relationship among the above variables with the availability of
factors for the cultivation of onion have been analysed by applying the statistical techniques
such as ‘Chi-Square’ test, ‘Z’- test and ‘Analysis of Variance’ (F-test).
3.9.1 AGE AND OPINION
Farmer’s age is expected to have influence on the productivity and output of onion
as it affects the mental and manual abilities. Thoughts, cultivation pattern, implementation
of modern technologies in farming of aged farmers may differ from young farmers.
For the purpose of analysis, age groups of farmers’ have been grouped into three
categories, viz., Young (Up to 35 years), Middle (Between 36-50 years) and Old (51
years and above). The following hypothesis has been framed to assess the farmers’
satisfaction about the availability of factors for the cultivation of onion.
H0 : There is no significant association between the age and opinion of the
farmers about the availability of factors for the cultivation of onion.
The findings relating to the opinion of the sample farmers along with their age
group are presented in the Table 3.8. The information presented in this Table is subjected
to Chi-Square Test.
Please purchase PDF Split-Merge on www.verypdf.com to remove this watermark.

98
TABLE 3.8
DISTRIBUTION OF SAMPLE FARMERS BY AGE GROUPS AND THEIR
OPINION: CHI-SQUARE TEST
Age group Satisfied Dissatisfied Total Young 18 (28.6) 45(71.4) 63 (100) Middle 126 (41.9) 175 (58.1) 301 (100)
Old 104 (48.1) 112 (51.9) 216(100) Total 248 (42.8) 332(57.2) 580 (100)
(Figures in Parentheses are percentages) D.f:2 χ2 = 7.843 ‘C’=0.116
The Table 3.8 reveals that, among the three age groups of the sample farmers, a
high percentage (71.4%) of Young age group farmers is dissatisfied with the availability
of factors for cultivation of onion as compared to middle age group and old age groups of
farmers.
It is found that calculated value of χ2 (7.843) is greater than the theoretical value
of χ2 (i.e., 5.991) for 2 degrees of freedom at 5 per cent level of significance. This implies
that the null hypothesis is rejected. Hence, it is evident that age groups of farmers
influence their satisfaction about the availability of factors for cultivation of onion.
Contingency coefficient 0.116 shows that there is a low degree of association between the
age groups and the farmers’ satisfaction about availability of factors for the cultivation of
onion.
The farmers’ age groups along with their opinion scores are given in the Table 3.9.
TABLE 3.9
DISTRIBUTION OF SAMPLE FARMERS BY AGE GROUPS AND THEIR
OPINION SCORES
Age group No. of Farmers Total score Mean score Young 63(10.86) 1044.00 16.571 Middle 301 (51.90) 5125.00 17.027
Old 216 (37.24) 3803.00 17.607 Total 580 (100) 9972.00 17.193
(Figures in Parentheses are percentages)
Please purchase PDF Split-Merge on www.verypdf.com to remove this watermark.


106
TABLE 3.18
DISTRIBUTION OF SAMPLE FARMERS BY THEIR FAMILY INCOME AND
OPINION SCORES
Family income No. of Farmers Total scores Mean scores
Below 2 lakhs 110 1979.00 17.991
Between 2 lakhs to 5 lakhs 304 5353.00 17.609
Above 5 lakhs 166 2640.00 15.904
Total 580 9972.00 17.193
(Figures in Parentheses are percentages)
The Table 3.18 exhibits that the sample respondents with more than Rs.5 lakhs as
their family income have the lowest mean scores (15.904) than the other categories of
respondents having below Rs.2 lakhs and between Rs.2 lakhs to Rs.5 lakhs. Therefore,
the test of significance is applied to find out the significant of the difference in mean
score of different category of farmers having different income level of the family.
TABLE 3.19
DISTRIBUTION OF SAMPLE FARMERS BY THEIR FAMILY INCOME AND
OPINION: F-TEST
Sources of variation
Sum of square
Degrees of freedom
Mean squares F-value Result
Between samples 398.505 2 199.253
11.332 Significant at 1% level Within samples 10145.867 577 17.584
Total 10544.372 579
It can be inferred from the Table 3.19 that there is a significant difference in the
mean score of farmers having different size of income people.
Please purchase PDF Split-Merge on www.verypdf.com to remove this watermark.

107
3.9.5 NUMBER OF FAMILY MEMBERS ENGAGED IN AGRICULTURE AND
THEIR OPINION
The family members engaged in agriculture is an important source of the labour
force for the farmer. Availability of labour is very limited in the present days. If a farmer
has more number of members in his family, he can do farming without any hurdle of non
availability of labourers. For the purpose of analysis, number of members involved in
agriculture has been grouped in to two categories viz., upto 2 and above 2 members.
The following hypothesis has been framed to test the significance.
H0 : There is no significant association between the number of family members and
opinion of the farmers about the availability of factors for the cultivation of onion.
The findings relating to the opinion of the sample farmers’ along with number of
family members engaged in agriculture are presented in the Table 3.20. The information
presented in this Table is subjected to Chi-Square Test.
TABLE 3.20
DISTRIBUTION OF SAMPLE FARMERS BY NUMBER OF FAMILY
MEMBERS ENGAGED IN AGRICULTURE AND THEIR
OPINION: CHI-SQUARE TEST
Number of Family members Engaged in
Agriculture Satisfied Dissatisfied Total
Upto 2 108 (33.8) 212 (66.3) 320 (100)
Above 2 140 (53.8) 120 (46.2) 260 (100)
Total 248 (42.8) 332(57.2) 580 (100)
(Figures in Parentheses are percentages) D.f :2 χ2 = 23.699 ‘C’=0.198
Among the two categories of farmers, a high percentage (66.3) of farmers with
two family members engaged in agriculture are not satisfied with the factors available for
cultivation of onion as compared to the category of farmers with above two family
members engaged in agriculture.
Please purchase PDF Split-Merge on www.verypdf.com to remove this watermark.

108
It is found that calculated value of χ2 (23.699) is greater than the theoretical value
of Chi-Square (i.e. 6.635) for 1 degree of freedom at 1 per cent level significance.
This implies that the null hypothesis is not accepted. Hence, it is evident that number of
members engaged in agriculture influence their opinion about the availability factors in
cultivation of onion. Contingency co-efficient 0.198 shows that there is a low degree of
association between the educational status and the farmers’ opinion about the availability
of factors in cultivation of onion. The number of family members of sample farmers
engaged in agriculture along with their opinion scores are given in the Table 3.21.
TABLE 3.21
DISTRIBUTION OF SAMPLE FARMERS BY NUMBER OF FAMILY
MEMBERS ENGAGED IN AGRICULTURE AND THEIR OPINION SCORE
Number of Family members Engaged in
Agriculture No. of Farmers Total score Mean score
Upto 2 320 (55.77) 5326.00 16.644
Above 2 260 (44.83) 4646.00 17.869
Total 580 (100) 9972.00 17.193
(Figures in parentheses are percentage)
The Table 3.21 points out that the mean score (16.644) of farmers with upto
2 persons engaged in agriculture is the lowest. The test of significance is applied to find
out the significance of the difference in the mean score of different categories of farmers
having number of persons in their family engaged in agriculture is tested by ‘Z’ test.
TABLE 3.22
DISTRIBUTION OF SAMPLE FARMERS BY NUMBER OF FAMILY
MEMBERS ENGAGED IN AGRICULTURE AND THEIR OPINION: ‘Z’ TEST
Mean – I X1
Mean – II X2
Mean difference
X1 - X2
Standard deviation S.E ‘Z’
value Result
16.6438 17.8692 -1.4546 0.056 0.4483 -3.245 Significant at 1% level
Please purchase PDF Split-Merge on www.verypdf.com to remove this watermark.

109
As the calculated value of ‘z’ is greater than the 2.58 S.E, it is concluded that
there is a significant difference in the mean scores of two groups based on number of
family members engaged in agriculture.
3.9.6 AREA OF LAND HOLDING AND OPINION
Area of landholding is important to examine how resources are managed, and
resulting impact on productivity and sustainability. The empirical literature indicated that,
small farmers have an advantage in labour supervision than large farmers. Therefore, the
quantity of labour inputs is likely to be higher on small farms. Second, small farmers
can have restricted access to modern inputs, and this can hold back their productivity.
Third, small and large farmers may differ in their attitude to risk and uncertainty.
The large farmers may be more willing and able to carry greater risk. The following
hypothesis has been framed in this regard.
H0 : There is no significant association between the area of landholding and opinion
of the farmers about the availability of factors for the cultivation of onion.
The findings relating to the opinion of the sample farmers’ along with their area
of land holding are presented in the Table 3.23. The information presented in the Table 3.23
is subjected to Chi-Square Test.
TABLE 3.23
DISTRIBUTION OF SAMPLE FARMERS BY AREA OF LAND HOLDING AND
THEIR OPINION: CHI-SQUARE TEST
Area of Land holding Satisfied Dissatisfied Total
Below 2.5 acres 41 (27.0) 111 (73.0) 152 (100)
Between 2.5 acres to 5 acres 108 (45.0) 132 (55.0) 240 (100)
Above 5 acres 99 (52.7) 89(47.3) 188 (100)
Total 248 (42.8) 332 (57.1) 580 (100)
(Figures in Parentheses are percentages) D.f :2 χ2 = 23.496 ‘C’=0.197
Please purchase PDF Split-Merge on www.verypdf.com to remove this watermark.

110
Among the three groups of sample farmers, a high percentage (73.0) of farmers
having below 2.5 acres are not satisfied with the availability of factors in cultivation of
onion as compared to farmers having between 2.5 acres to 5 acres and above 5 acres of
land.
It is found that calculated value of χ2 (23.496) is greater than the theoretical value
of Chi-Square (i.e. 9.210) for 2 degrees of freedom at 1 per cent level of significance.
This implies that the null hypothesis is not accepted. Hence, it is evident that the area of
land holding of the farmers influences their opinion about the availability of factors in
cultivation of onion. Contingency co-efficient 0.197 shows that there is a low degree of
association between the size of land holding and the farmers’ opinion about the availability
of factors in cultivation of onion. The farmers’ size of land holding along with opinion
scores are given in the Table 3.24.
TABLE 3.24
DISTRIBUTION OF SAMPLE FARMERS BY AREA OF LAND HOLDING AND
THEIR OPINION SCORE
Area of Land holding No. of Farmers Total scores Mean scores
Below 2.5 acres 152 (26.2) 2498.00 16.434
Between 2.5 acres to 5 acres 240 (41.4) 4111.00 17.129
Above 5 acres 188 (32.4) 3363.00 17.888
Total 580 (100) 9972.00 17.193
(Figures in Parentheses are percentages)
The Table 3.24 points that the category of farmers with below 2.5 acres of land is
having the lowest (16.434) mean score. The test of significance is applied to find out the
significance of the difference in mean score of different category of farmers having
different size of land holdings.
Please purchase PDF Split-Merge on www.verypdf.com to remove this watermark.

111
TABLE 3.25
DISTRIBUTION OF SAMPLE FARMERS BY AREA OF LAND HOLDING AND
THEIR OPINION: F-TEST
Sources of variation
Sum of square
Degrees of freedom
Mean squares F-value Result
Between samples 179.380 2 89.690
4.993 Significant at 1% level Within samples 10364.992 577 17.964
Total 10544.372 579
It can be inferred from the Table 3.25 that there is a significant difference in the
mean score of the farmers having different area of land holdings.
3.9.7 FARM EXPERIENCE AND THEIR OPINION
In agriculture, experience is the key element for optimum use of resources. Since
agriculture involves numerous process, experience form an important factor. The application,
awareness and selection of inputs such as seeds, fertilizers, pesticides etc. may vary on
the basis of farm experience of the farmers. For the purpose of analysing the farmers’
opinion about the factors in cultivation of onion, the following hypothesis is framed.
H0 : There is no significant association between the farm experience and opinion about
availability of factors for the cultivation of onion.
The findings relating to the opinion of the sample farmers’ with different farm
experience are presented in the Table 3.26. The information presented in this Table is
subjected to Chi-Square Test.
Please purchase PDF Split-Merge on www.verypdf.com to remove this watermark.

112
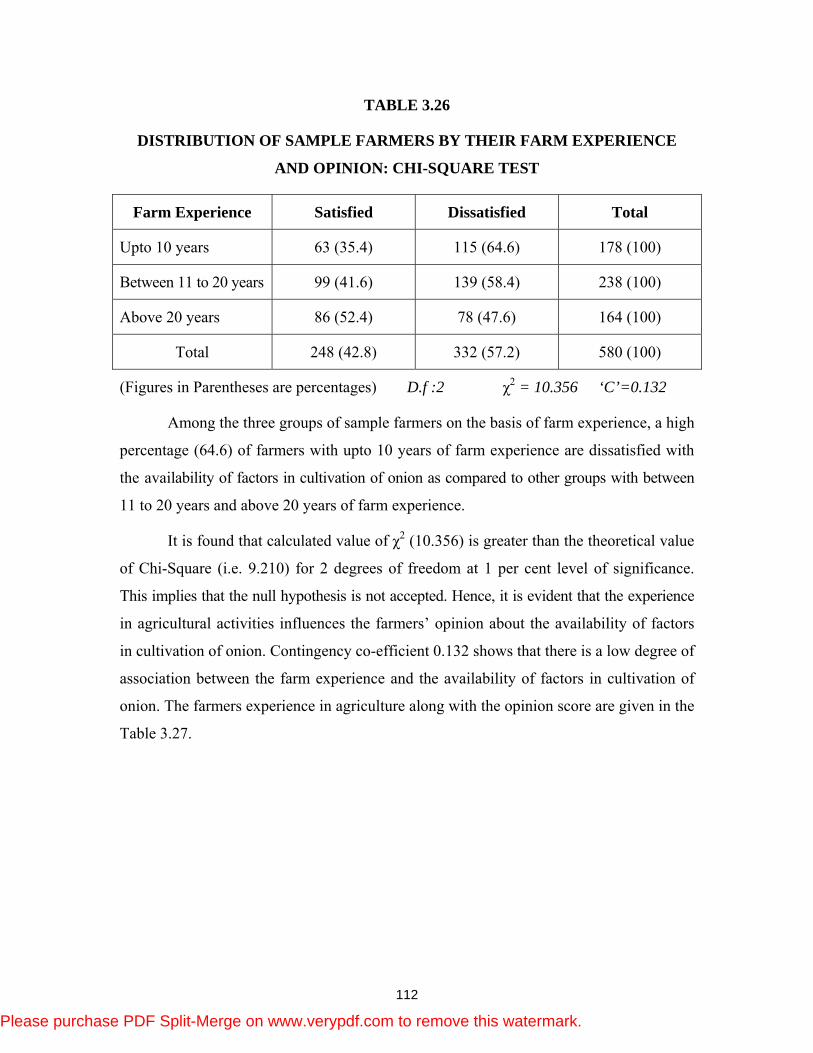
TABLE 3.26
DISTRIBUTION OF SAMPLE FARMERS BY THEIR FARM EXPERIENCE
AND OPINION: CHI-SQUARE TEST
Farm Experience Satisfied Dissatisfied Total
Upto 10 years 63 (35.4) 115 (64.6) 178 (100)
Between 11 to 20 years 99 (41.6) 139 (58.4) 238 (100)
Above 20 years 86 (52.4) 78 (47.6) 164 (100)
Total 248 (42.8) 332 (57.2) 580 (100)
(Figures in Parentheses are percentages) D.f :2 χ2 = 10.356 ‘C’=0.132
Among the three groups of sample farmers on the basis of farm experience, a high
percentage (64.6) of farmers with upto 10 years of farm experience are dissatisfied with
the availability of factors in cultivation of onion as compared to other groups with between
11 to 20 years and above 20 years of farm experience.
It is found that calculated value of χ2 (10.356) is greater than the theoretical value
of Chi-Square (i.e. 9.210) for 2 degrees of freedom at 1 per cent level of significance.
This implies that the null hypothesis is not accepted. Hence, it is evident that the experience
in agricultural activities influences the farmers’ opinion about the availability of factors
in cultivation of onion. Contingency co-efficient 0.132 shows that there is a low degree of
association between the farm experience and the availability of factors in cultivation of
onion. The farmers experience in agriculture along with the opinion score are given in the
Table 3.27.
Please purchase PDF Split-Merge on www.verypdf.com to remove this watermark.

113
TABLE 3.27
DISTRIBUTION OF SAMPLE FARMERS BY THEIR FARM EXPERIENCE
AND OPINION SCORES
Farm Experience No. of Farmers Total scores Mean scores
Upto 10 years 178 (30.7) 3008.00 16.899
Between 11 to 20 years 238 (41.0) 4030.00 16.933
Above 20 years 164 (28.3) 2934.00 17.890
Total 580 (100) 9972.00 17.193
(Figures in Parentheses are percentages)
The Table 3.27 points out that the group of farmers with upto 10 years of experience in
agriculture has the lowest (16.899) mean score. The test of significance is applied to find
out the significant difference in the mean score of farmers having different level of
experience in farming.
TABLE 3.28
DISTRIBUTION OF SAMPLE FARMERS BY THEIR FARM EXPERIENCE
AND OPINION: F-TEST
Sources of Variation
Sum of Square
Degrees of Freedom
Mean Squares F-value Result
Between groups 111.243 2 55.622
3.076 Significant at 5% level Within groups 10433.129 577 18.082
Total 10544.372 579
It can be inferred from the Table 3.28 that there is a significant difference in the
means score of farmers having different level of farm experience.
Please purchase PDF Split-Merge on www.verypdf.com to remove this watermark.

114
3.9.8 EXPERIENCE IN ONION CULTIVATION AND OPINION
Onion is a seasonal and short term crop, which requires some experience in order
to get good return from it. Most farmers in the study area are cultivating onion in a
tradition. So their style of farming may differ from new farmers or those who are having
less experience. In this regard, the following hypothesis is framed to analyse the farmers’
opinion about the availability of factors in cultivation of onion.
H0 : There is no significant association between the experience in cultivation of onion
and opinion about the availability of factors for the cultivation of onion.
The findings relating to the opinion of the sample farmers’ about the availability
of factors along with their experience in onion cultivation are presented in the Table 3.29.
The information presented in this Table is subjected to Chi-Square Test.
TABLE 3.29
DISTRIBUTION OF SAMPLE FARMERS BY THEIR EXPERIENCE IN ONION
CULTIVATION AND OPINION: CHI-SQUARE TEST
Experience in onion cultivation Satisfied Dissatisfied Total
Below 5 years 28 (27.2) 75 (72.8) 103 (100)
5 to 10 years 78 (41.7) 109 (58.3) 187 (100)
Above 10 years 142 (49.0) 148 (51.0) 290 (100)
Total 248 (42.8) 332 (57.2) 580 (100)
(Figures in Parentheses are percentages) D.f :2 χ2 = 14.856 ‘C’=0.158
Among the three groups of farmers having different periods of experience in onion
cultivation, the farmers with below 5 years of experience are not satisfied with the availability
of factors in cultivation of onion compared to other groups of farmers with 5 to 10 years
of experience and above 10 years of experience in onion cultivation.
It is found that calculated value of χ2 (14.856) is greater than the theoretical value
of Chi-Square (i.e. 9.210) for 2 degree of freedom at 1 per cent level of significance.
This implies that the null hypothesis is not accepted. Hence, it is evident that farmers
Please purchase PDF Split-Merge on www.verypdf.com to remove this watermark.

115
experience in cultivation of onion influence their opinion about the availability of factors
in cultivation of onion. Contingency co-efficient 0.158 shows that there is a low degree of
association between the farmers experience in onion cultivation and the farmers’ opinion
about the availability of factors in cultivation of onion. The farmers’ experience in onion
cultivation along with the opinion score are given in the Table 3.30.
TABLE 3.30
DISTRIBUTION OF SAMPLE FARMERS BY THEIR EXPERIENCE IN ONION
CULTIVATION AND OPINION SCORES
Experience in onion cultivation
No. of farmers Total score Mean score
Below 5 years 103 (17.8) 1674.00 16.252 5 to 10 years 187 (32.2) 3200.00 17.112
Above 10 years 290 (50.0) 5098.00 17.579 Total 580 (100) 9972.00 17.193
(Figures in Parentheses are percentages)
The Table 3.30 represents that group of farmers with the below 5 years of experience
in cultivation of onion has the lowest (16.252) mean score. The test of significance is
applied to find out the significance of the difference in mean scores of different category
of farmers having different experience in onion cultivation.
TABLE 3.31
DISTRIBUTION OF SAMPLE FARMERS BY THEIR EXPERIENCE IN ONION
CULTIVATION AND OPINION: F-TEST
Sources of variation
Sum of square
Degrees of freedom
Mean squares
F-value Result
Between samples 135.618 2 67.809
3.759 Significant at 5% level Within samples 10408.754 577 18.039
Total 10544.372 579
Please purchase PDF Split-Merge on www.verypdf.com to remove this watermark.

116
It can be inferred from the Table 3.31 that there is a significant difference in the
opinion of farmers having different experience in onion cultivation.
3.9.9 EXTENT OF LAND USED FOR ONION CULTIVATION AND OPINION:
The extent of land used is an important factor which requires the consumption of
inputs for cultivation of onion. In order to analyse the farmers’ opinion about the
availability of factors in cultivation of onion the following hypothesis has been framed.
For the purpose of analysis the sample farmers have been grouped into three categories
on the basis of the extent of land used for onion cultivation as (i) below 2 acres (ii) 2 to 4
acres and above 4 acres.
H0 : There is no significant association between the extent of land used for onion
cultivation and opinion about the availability of factors for the cultivation of onion.
The findings relating to the opinion of the sample farmers along with the extent of
land used for onion is presented in the Table 3.32. The information presented in this table
is subjected to Chi-Square Test.
TABLE 3.32
DISTRIBUTION OF SAMPLE FARMERS BY THE EXTENT OF LAND USED
FOR ONION CULTIVATION AND THEIR OPINION: CHI-SQUARE TEST
Extent of Land used Satisfied Dissatisfied Total
Below 2 acres 71(36.8) 122(63.2) 193(100) From 2 to 4 acres 125(43.7) 161(56.3) 286(100)
Above 4 acres 52(51.5) 49(48.5) 101(100) Total 248(42.8) 332(57.2) 580(100)
(Figures in parentheses are percentages) D.F:2, χ2 =6.059 “C”= 0.102
Among the three groups of sample farmers, a high percentage (63.2) of farmers
having below 2 acres of land are not satisfied with the availability of factors in cultivation
of onion as compared to other groups of farmers cultivating onion with 2 to 4 acres and
above 4 acres.
It is found that the calculated value of χ2 (6.059) is greater than the critical value
of Chi-Square (i.e.5.991) for 2 degrees of freedom at 5 per cent level of significance.
Please purchase PDF Split-Merge on www.verypdf.com to remove this watermark.

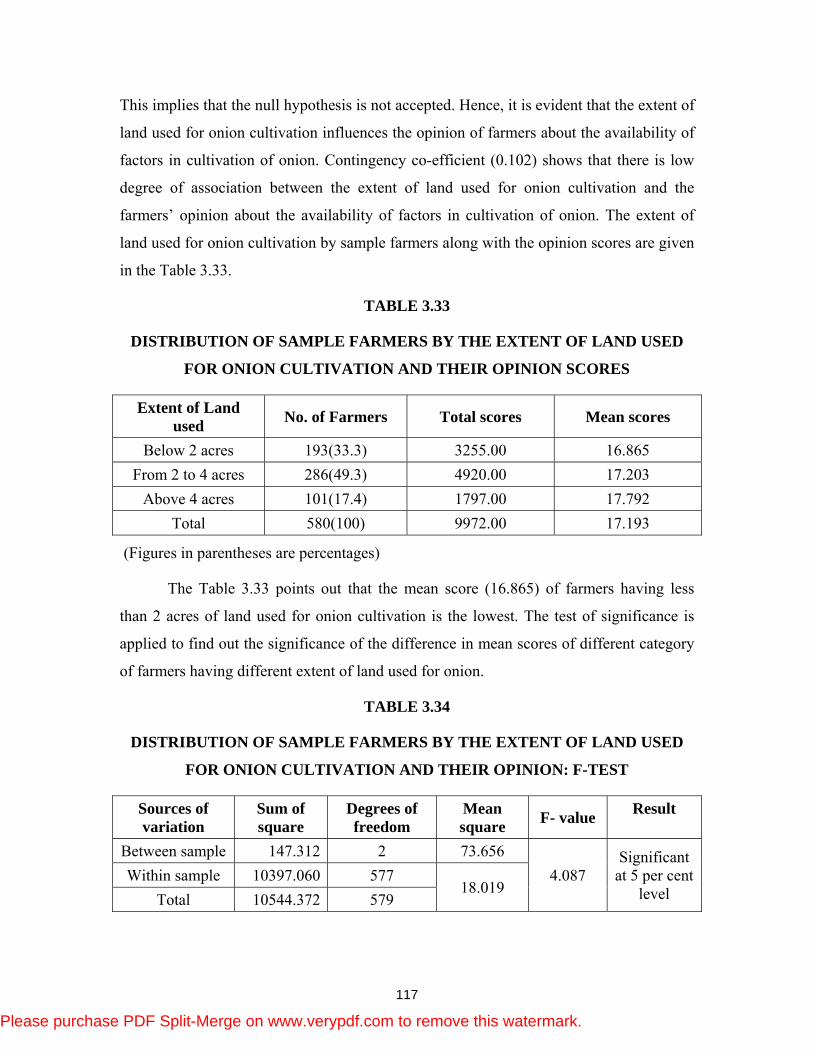
117
This implies that the null hypothesis is not accepted. Hence, it is evident that the extent of
land used for onion cultivation influences the opinion of farmers about the availability of
factors in cultivation of onion. Contingency co-efficient (0.102) shows that there is low
degree of association between the extent of land used for onion cultivation and the
farmers’ opinion about the availability of factors in cultivation of onion. The extent of
land used for onion cultivation by sample farmers along with the opinion scores are given
in the Table 3.33.
TABLE 3.33
DISTRIBUTION OF SAMPLE FARMERS BY THE EXTENT OF LAND USED
FOR ONION CULTIVATION AND THEIR OPINION SCORES
Extent of Land used No. of Farmers Total scores Mean scores
Below 2 acres 193(33.3) 3255.00 16.865 From 2 to 4 acres 286(49.3) 4920.00 17.203
Above 4 acres 101(17.4) 1797.00 17.792 Total 580(100) 9972.00 17.193
(Figures in parentheses are percentages)
The Table 3.33 points out that the mean score (16.865) of farmers having less
than 2 acres of land used for onion cultivation is the lowest. The test of significance is
applied to find out the significance of the difference in mean scores of different category
of farmers having different extent of land used for onion.
TABLE 3.34
DISTRIBUTION OF SAMPLE FARMERS BY THE EXTENT OF LAND USED
FOR ONION CULTIVATION AND THEIR OPINION: F-TEST
Sources of variation
Sum of square
Degrees of freedom
Mean square F- value Result
Between sample 147.312 2 73.656 4.087
Significant at 5 per cent
level Within sample 10397.060 577
18.019 Total 10544.372 579
Please purchase PDF Split-Merge on www.verypdf.com to remove this watermark.
118
It can be inferred from the Table 3.34 that there is a significant difference in the mean
scores of different groups of farmers on the basis of land used for cultivation of onion.
3.10 CULTIVATION PROBLEMS OF ONION GROWERS
Agriculture is associated with nature to a large extent even today. The climatic
conditions and rainfall have a decisive influence of production on agricultural products.
The fertility of land is not constant over time when repeated cultivation takes place on the
same land. The prices and production are subject to severe fluctuation owing to the
change in seasons and the operation of trade cycles, besides, farm sector is associated
with problems of organization of finance, marketing and others8.
ONION CULTIVATION PROBLEMS: SIMPLE RANKING ANALYSIS
To identify the relative importance of the problems in onion cultivation, Simple
Ranking Technique has been applied. Ten problems relating to onion cultivation are
identified and given in the final interview schedule. All the 580 sample farmers were asked
to assign ranks to all these problems in the order of importance. Each farmer was instructed
to indicate the importance of the problem by giving rank I to the most important problem,
rank II to the second important one and so on.
To examine the problems in cultivation of onion, ten factors are taken into consideration.
They are Shortage and High cost of labour, Lack of finance, High cost of seeds,
Unavailability of Hybrid seeds, Lack of support from government, unfavourable climate,
problems due to pest, Lack of technical Know how, Cost of input materials and Low
level of output.
In order to find the most important problem in cultivation of onion, simple
ranking analysis is used. The following Table 3.35 shows the problems in cultivation of
onion by farmers using simple ranking analysis
8 Benjamin R.E, Hariharan S.V and Karunagaran M, “Economics of Agriculture”, New Delhi : S. Chand
and Company Ltd., Ram Nagar, 2000, p. 178
Please purchase PDF Split-Merge on www.verypdf.com to remove this watermark.

119
TABLE 3.35
PROBLEMS IN CULTIVATION OF ONION: SIMPLE RANKING ANALYSIS
S.No. Factors Total score Mean score Rank 1 Shortage and High cost of labour 3692 6.37 I 2 Lack of finance 3511 6.05 V 3 High cost of seeds 3678 6.34 II 4 Un availability of Hybrid seeds 3559 6.14 IV 5 Lack of support from government 3567 6.15 III 6 Unfavourable climate 3296 5.68 VI 7 Problems due to pests 3120 5.38 VII 8 Lack of technical Know how 2314 3.99 IX 9 Cost of input materials 2224 3.83 X 10 Low level of output 2939 5.07 VIII
The Table 3.35 reveals that the Shortage and High cost of Labour is the main
problem faced by the farmers in cultivation of onion with the Mean score of 6.37,
followed by High cost of seeds, Lack of support from government, Unavailability of
hybrid seeds, Lack of finance, Unfavourable climate, Problems due to pest, Low level of
output, Lack of technical know how, and Cost of input materials.
Hence, it is concluded that the Shortage and High cost of labour is the major
problem in cultivation of onion.
ONION CULTIVATION PROBLEMS: GARRETT RANKING ANALYSIS
Garrett Ranking has been used to trace out the cultivation problems faced by the
onion growers.
Scale values as per Garrett ranking technique for first to ten ranks are: 81, 70, 63,
57, 52, 47, 42, 36, 29 and 18 respectively.
The percentage position of each rank is made into score by referring factors and
summed up for assigning rank.
The Table 3.36 shows that the cultivation problems faced by the onion growers:
Garrett Ranking Analysis.
Please purchase PDF Split-Merge on www.verypdf.com to remove this watermark.

120
TABLE 3.36
PROBLEMS IN CULTIVATION OF ONION: GARRETT RANKING ANALYSIS
S. No. Factors
SCALE AND SCORE VALUES OF RANKS Total score
Mean score RankRanks I II III IV V VI VII VIII IX X
Scale value(x) 81 70 63 57 52 47 42 36 29 18
1 Shortage and High cost of labour
F 76 111 16 89 69 89 42 20 27 41 580 54.79 I Fx 6156 7770 1008 5073 3588 4183 1764 720 783 738 31783
2 Lack of finance F 34 88 113 80 46 24 91 26 47 31 580 53.08 V Fx 2754 6160 7119 4560 2392 1128 3822 936 1363 558 30792
3 High cost of seeds F 57 30 189 77 60 24 30 10 54 49 580 54.06 II Fx 4617 2100 11907 4389 3120 1128 1260 360 1566 882 31329
4 Un availability of Hybrid seeds
F 31 83 77 89 51 22 52 51 99 25 580 50.47 IV Fx 2511 5810 4851 5073 2652 1034 2184 1836 2871 450 29272
5 Lack of support from government
F 78 117 39 66 29 44 70 30 89 18 580 53.84 III Fx 6318 8190 2457 3762 1508 2068 2940 1080 2581 324 31228
6 Unfavourable climate
F 80 61 40 67 85 94 38 54 18 43 580 53.04 VI Fx 6480 4270 2520 3819 4420 4418 1596 1944 522 774 30763
7 Problems due to pests
F 70 46 34 32 66 91 78 74 36 53 580 49.14 VII Fx 5670 3220 2142 1824 3432 4277 3276 2664 1044 954 28503
8 Lack of technical Know how
F 16 22 58 32 48 52 42 75 92 143 580 39.59 IX Fx 1296 1540 3654 1824 2496 2444 1764 2700 2668 2574 22960
9 Cost of input materials
F 57 9 4 22 36 47 43 162 78 122 580 39.53 X Fx 4617 630 252 1254 1872 2209 1806 5832 2262 2196 22930
10 Low level of output
F 81 13 10 26 90 93 94 78 40 55 580 47.48 VIII Fx 6561 910 630 1482 4680 4371 3948 2808 1160 990 27540TOTAL N 580 580 580 580 580 580 580 580 580 580
Source: Primary Data
Note: Scale value, f= No. of Respondents, fx=Score value
Please purchase PDF Split-Merge on www.verypdf.com to remove this watermark.

121
The Table 3.36 reveals that Shortage and High cost of Labour with the Garrett
Mean score of 54.79 as the main problem in cultivation of onion, followed by High cost
of seeds, Lack of support from government, Unavailability of hybrid seeds, Lack of
finance, Unfavourable climate, Problems due to pest, Low level of output, Lack of
technical know how, and Cost of input materials.
3.11 CONCLUSION
This chapter presents the results of production analysis of onion. These results
are obtained by applying number of analytical techniques using primary data for
defining the production environment of onion in Erode District of Tamil Nadu. This Chapter
is organized in the following sections include broader view of onion production and its
production environment, results of returns to scale, factors influencing the farmers to
cultivate onion, opinion of the farmers about the availability of factors in cultivation of
onion and problems in cultivation of onion.
The study is based on the primary data collected from 580 sample farmers, who
are cultivating onion through an interview schedule constructed in this regard.
FACTORS MOTIVATING FARMERS TO CULTIVATE ONION
To examine the motivating factors, ten factors like suitability of soil, availability
of limited water, quick returns, less risk, traditional practices, less cost of cultivation, less
fertilizer consumption, less application of plant protection chemicals, availability of
human labour, easy marketability have been considered. Simple ranking and garret
ranking analyses have been applied in this regard.
Both of the ranking analysis revealed that the traditional practices is the main factor
which motivated the farmers to cultivate onion followed by availability of limited water,
suitability of soil, less risk , less fertilizer consumption, availability of human labour, quick
returns, less cost of cultivation, easy marketability and less plant protection chemicals.
COST OF PRODUCTION OF ONION
In order to analyse the cost of production of onion, the cost is classified into fixed
cost including land input and variable costs including labour and capital inputs. The fixed
cost of production of onion is classified as land input which includes rent of land.
Please purchase PDF Split-Merge on www.verypdf.com to remove this watermark.

122
The prevalent rent of land in the study areas were collected on annual basis and distributed in
the crop standing period including own land. The labour input cost includes all those cost
incurred on field operations and production practices starting from land preparation upto
harvesting and performed by human, animal and machinery. The main labour costs
include the cost of land preparation, sowing, irrigation, weeding and harvesting and shed
curing. The capital cost accounts the cost of seed, fertilizers and farm yard manures,
pesticides and herbicides and interest on input charges. The onion producing farmers
were categorized as small (below 2 acres), medium (2-4 acres) and large (4.1 acre and
above), based on landholding size of the farmers.
It is found that on an average, the cost of cultivation of onion per acre over all
farms, small farms, medium farms and large farms were worked out to Rs. 25,813.32
Rs.24,917, Rs.25,941.42, and Rs.26,539.87 respectively. Among the thirteen input costs,
cost of seed forms the major portion on the total cost of production of onion.
PRODUCTION FUNCTION ANALYSIS
The Cobb-Douglas type of production function is used to study the effect of
various input expenses on return of onion. In Cobb-Douglas production function, returns
per farm is taken as dependent variable and seven inputs like land in acres, machine labour,
bullock labour, cost of seeds, total cost of labour, fertilizer, and pesticides as independent
variables. The regression coefficients of different input used in the production function
were estimated separately for each size group of sample farms. In order to get an optimum
cost return model, cost of labour on land preparation, planting, irrigation, weeding and
shed curing are grouped into a single category as human labour.
Multiple regression analysis has revealed that in all farms, seven variables included in
the analysis explained 88.20 per cent of the variation in gross returns by the coefficient of
multiple determinations (R2). The value of R2 were low in small (83.20 per cent) followed by
medium (89.90 per cent) and quite high in large (90.30 per cent) farms. To analyse
elasticity of production with respect to all farms, students ‘t’ test has been applied. Seed,
total human labour and plant protection chemicals were 0.141, 0.433 and 0.129 respectively.
This implied that 1 per cent increase in seed, labour and plant protection chemical would
increase in gross returns of onion by 0.141, 0.433 and 0.129 per cent evaluated at the
Please purchase PDF Split-Merge on www.verypdf.com to remove this watermark.
123
geometric mean level. The regression coefficients of area of land and machine labour
were 0.0498 and 0.108 respectively and significant at 5 per cent level. Fertilizers and
manures and bullock labour were 0.0418 and 0.0582, respectively and significant at
10 per cent level. Therefore, an increase in fertilizers and manures and bullock labour by
10 per cent evaluated at the geometric mean level would increase the gross returns by
0.0418 per cent and 0.0582 per cent respectively.
The positive but less than unity production elasticities of seed, manures and
fertilizers, human labour, machine labour and plant protection chemicals indicated the use of
these variables stood in the rational zone of the production surface. The coefficients of
expenditure on manures, seeds and plant protection chemicals were positive and
statistically significant for small and medium farms. Hence, it may be inferred that seeds
and plant protection chemicals were the important inputs which significantly increased
farm returns on small and large farms. The production coefficient of human labour was
positive and statistically significant for medium and large farms. In case of small farms,
the production elasticities of total human labour and machine labour turned out to be
negative indicating excessive use of small farms. The gross returns of land were positive
on small, medium and large farms but it was statistically significant on small farms.
Bullock labour has a negative elasticity coefficient indicating a decrease in gross returns
due to increase in the use of this resource on large farms. When the use of all other
resources were kept constant at their respective geometric mean levels, the regression
coefficients of machine labour was also found to be negative in the case of medium
farms indicating excessive use of machine labour on the farms. The results revealed that
the farmers could increase the gross returns in onion by applying more seeds, human labour,
machine power, fertilizers and manures and plant protection chemicals. The coefficients of
other variables were not statistically significant, showing that any increase in their
application would not increase in gross returns of onion.
The calculated value of ‘F’ for small size land holding, medium, large and overall
form sizes were 135.048, 353.012, 123.619 and 609.577 respectively were higher than
the theoretical values of ‘F’ at 1 per cent level of significance in all farms.
Please purchase PDF Split-Merge on www.verypdf.com to remove this watermark.

124
COSTS-RETURN AND INPUT-OUTPUT RATIO OF ONION PRODUCTION ON
THE DIFFERENT SIZE OF FARMS
It is found that average output of onion per acre on small sized farms (4857.58 kgs) is
higher followed by Medium (4821.46 kgs) and large (4762.44 kgs) and is also higher
than the overall farm size (4808.26 kgs). The gross and net return per acre is also higher
in the small farms. The input output ratio for small, medium, large and total farms are
1:2.35, 1:2.21, 1.2.19 and 1:2.24 respectively.
CULTIVATING ONION AS AN INTER CROP
It is found that among 580 sample farmers, only 179 farmers are cultivating onion as
an inter crop. Majority (43.58 per cent) of the farmers cultivate onion as an inter crop among
Turmeric, followed by Tobacco, Sugarcane, Banana and others like Maize, Cotton etc.
Among 179 farmers, more than 50 per cent (94) are cultivating onion as an inter crop
for seeds. Others are cultivating for their home purpose and short term returns. The average
yield of onion per acre when it is cultivated as an inter crop would be around 2,000
kilograms. The sample farmers have a strong opinion that inter cropping of onion would
certainly reduce the cost of cultivation of the main crop.
The cost of cultivation of onion while inter cropping would be only cost of seeds
and labours. Application of fertilizer and plant protection chemicals to main crop would
reduce the pest attacks and the requirements of fertilizers to onion. Therefore, inter
cropping of onion is an additional source of income to the farmers.
MEASUREMENT OF FARMERS OPINION ABOUT THE FACTORS AVAILABLE
FOR THE PRODUCTION OF ONION
Sample respondents have been asked to answer six questions regarding the factors
available for production of onion. When a respondent is highly satisfied with a factor, a score
of 5 was allotted, like wise 4 for satisfied, 3 for neutral, 2 for dissatisfied and 1 for highly
dissatisfied. As such, the maximum score that assigned by a farmer from all the six factors
would be 30 and a minimum score of 5. The respondent who scored below 15 were classified
as dissatisfied and those who scored equal to and above 15 were classified as satisfied about the
factors available for production of onion. Likert’s five point scale has been used in this regard.
Please purchase PDF Split-Merge on www.verypdf.com to remove this watermark.

125
It is found that an average opinion score of all the sample farmers is 17.193.
Among 580 sample farmers 57.2 per cent (332) of the respondents are dissatisfied with
the factors available for production of onion while only 42.8 per cent (248) are satisfied
with the factors available for production of onion.
SOCIO ECONOMIC VARIABLES AND THE OPINION ABOUT AVAILABILITY
OF FACTORS IN CULTIVATION OF ONION
All the identified personal and socio economic variables, which might influence
the level of opinion about the availability factors in cultivation of onion, are Age,
Education, Occupation, Family Income, Number of Family member engaged in
agriculture, Area of land holding, Farm experience, Experience in onion cultivation and
Extent of land used for onion cultivation.
Significance of the relationship of all the above variables with the availability
factors in cultivation of onion have been analysed by applying the statistical techniques
such as ‘Chi-Square’ Test, ‘Z’- Test and ‘Analysis of Variance’ (F-test).
The ‘Chi-Square’ Test applied has revealed that there exists significant
relationship between the opinions about the availability of factors for cultivation of
onion and the different groups of farmers based on Age, Education, Occupation, Family
Income, Area of land holding, Farm experience, Experience in onion cultivation and
Extent of land used for onion cultivation.
The ‘Z’ Test applied has revealed that there exists significant relationship
between the opinions about the availability of factors in cultivation of onion and the
different groups of farmers based on the number of person engaged in agriculture.
The ‘F’ Test applied has revealed that there exists significant relationship
between the opinions about the availability of factors in cultivation of onion and the
different groups of farmers based on Age, Education, Occupation, Family Income, Area
of land holding, Farm experience, Experience in onion cultivation and Extent of land
used for onion cultivation.
Please purchase PDF Split-Merge on www.verypdf.com to remove this watermark.

126
PROBLEMS IN CULTIVATION OF ONION
To examine the problems in cultivation of onion, ten factors viz., Shortage and
High cost of labour, Lack of finance, High cost of seeds, Unavailability of Hybrid seeds,
Lack of support from government, Unfavourable climate, Problems due to pest, Lack of
technical Know how, Cost of input materials and Low level of output have been considered.
Simple Ranking and Garret Ranking analysis have been applied in this regard.
Among the ten problems, Shortage and High cost of Labour is ranked as the
major problem in cultivation of onion under both Simple and Garret Ranking analyses.
Please purchase PDF Split-Merge on www.verypdf.com to remove this watermark.