cote 2018 dutch disease and premature deindustrialization
TRANSCRIPT
COTE 2018
Dutch Disease and Premature Deindustrialization in
Small Island Developing States (SIDS) with resource abundance
Leera Boodram
Supervisor: Dr. Roger Hosein
1
Deindustrialization and Premature Deindustrialization
Deindustrialization has been occurring in advanced economies whereby these countries experience a decline in manufacturing employment with no severe declines in their manufacturing output and an increase in their standards of living.(Rowthorn and Ramaswamy, 1997; Sachs, Shatz Deardoff and Hall, 1994; Saeger, 1997; Škuflić and Družić, 2016).
For middle and low income developing countries, there has been a decline in both manufacturing employment and output. This occurrence has been demarcated as premature deindustrialization by Rodrik (2015) which increases the chances for income equality amongst countries (Hamid and Khan, 2015).
Empirical evidence has revealed that premature deindustrialization has been occurring in countries such Brazil, Mexico, India, Pakistan, countries in Sub-Saharan Africa (excluding Mauritius) and Latin American countries (Kahkonen, 2014; Chaudhari, 2015; Hamid and Khan, 2015; Rodrik 2015; Gabrowski, 2017 ).
However, limited literature exists on the impact of premature deindustrialization and Small Island Developing States (SIDS).
2
Effects of Premature Deindustrialization
Economic implications of premature deindustrialization were found to be
over-valued exchange rates
which can lead to foreign currency shortages and rationing
inequitable distribution of income
high interest rates
enlarged informal sector
overall economic stagnation
limited prospects to propel growth as less investment is made in the manufacturing sector and development ends prematurely
3
Dutch Disease and Premature Deindustrialization
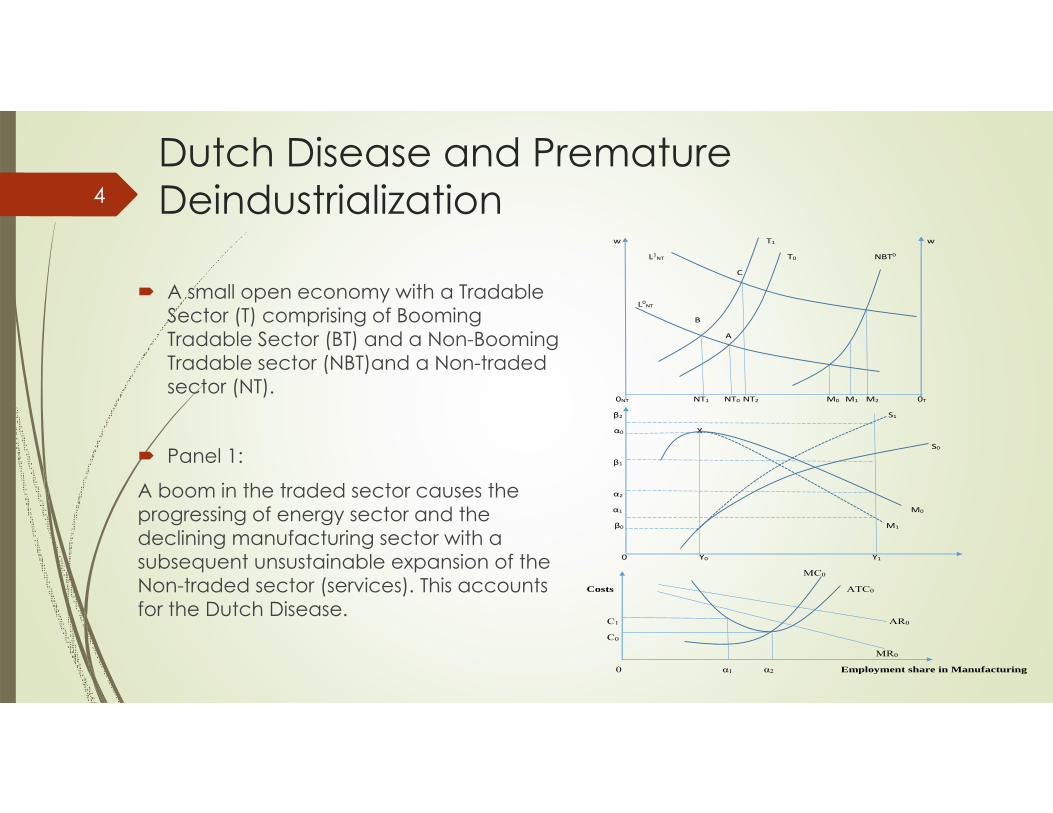
A small open economy with a Tradable Sector (T) comprising of Booming Tradable Sector (BT) and a Non-Booming Tradable sector (NBT)and a Non-traded sector (NT).
Panel 1:
A boom in the traded sector causes the progressing of energy sector and the declining manufacturing sector with a subsequent unsustainable expansion of the Non-traded sector (services). This accounts for the Dutch Disease.
w T1 w
L1NT T0 NBT0
C
L0NT
B
A
0NT NT1 NT0 NT2 M0 M1 M2 0T
β2 S1
α0 X
S0
β1
α2
α1 M0
β0 M1
0 Y0 Y1
MC0
Costs ATC0
C1 AR0
C0
MR0
0 α1 α2 Employment share in Manufacturing
4
Linking the Dutch Disease to Premature Deindustrialization w T1 w
L1NT T0 NBT0
C
L0NT
B
A
0NT NT1 NT0 NT2 M0 M1 M2 0T
β2 S1
α0 X
S0
β1
α2
α1 M0
β0 M1
0 Y0 Y1
MC0
Costs ATC0
C1 AR0
C0
MR0
0 α1 α2 Employment share in Manufacturing
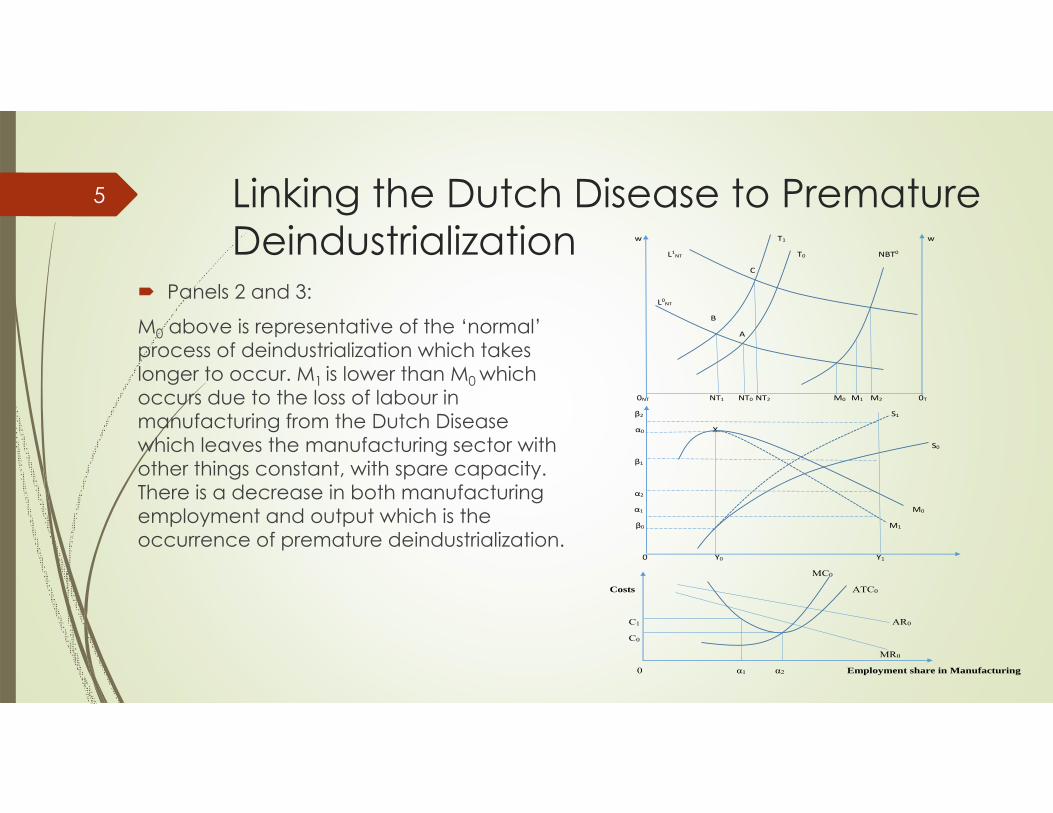
Panels 2 and 3:
M0 above is representative of the ‘normal’ process of deindustrialization which takes longer to occur. M1 is lower than M0 which occurs due to the loss of labour in manufacturing from the Dutch Disease which leaves the manufacturing sector with other things constant, with spare capacity. There is a decrease in both manufacturing employment and output which is the occurrence of premature deindustrialization.
5
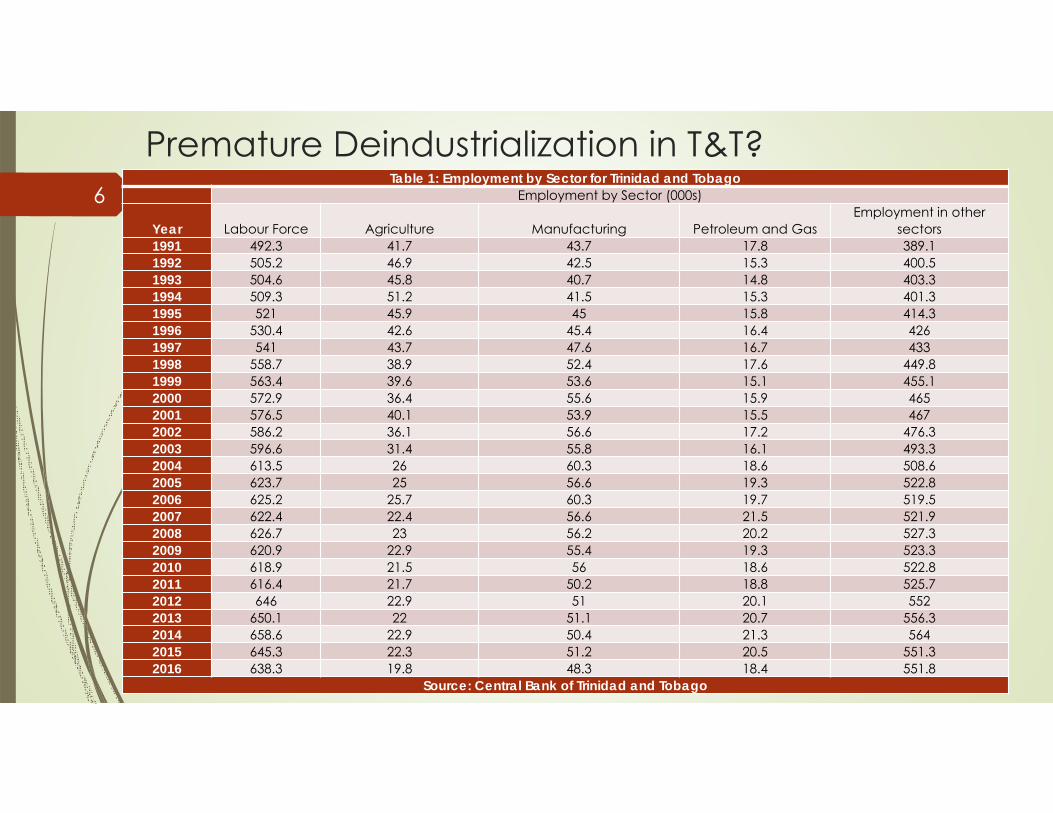
Premature Deindustrialization in T&T? Table 1: Employment by Sector for Trinidad and Tobago
Employment by Sector (000s)
Year Labour Force Agriculture Manufacturing Petroleum and GasEmployment in other
sectors1991 492.3 41.7 43.7 17.8 389.11992 505.2 46.9 42.5 15.3 400.51993 504.6 45.8 40.7 14.8 403.31994 509.3 51.2 41.5 15.3 401.31995 521 45.9 45 15.8 414.31996 530.4 42.6 45.4 16.4 4261997 541 43.7 47.6 16.7 4331998 558.7 38.9 52.4 17.6 449.81999 563.4 39.6 53.6 15.1 455.12000 572.9 36.4 55.6 15.9 4652001 576.5 40.1 53.9 15.5 4672002 586.2 36.1 56.6 17.2 476.32003 596.6 31.4 55.8 16.1 493.32004 613.5 26 60.3 18.6 508.62005 623.7 25 56.6 19.3 522.82006 625.2 25.7 60.3 19.7 519.52007 622.4 22.4 56.6 21.5 521.92008 626.7 23 56.2 20.2 527.32009 620.9 22.9 55.4 19.3 523.32010 618.9 21.5 56 18.6 522.82011 616.4 21.7 50.2 18.8 525.72012 646 22.9 51 20.1 5522013 650.1 22 51.1 20.7 556.32014 658.6 22.9 50.4 21.3 5642015 645.3 22.3 51.2 20.5 551.32016 638.3 19.8 48.3 18.4 551.8
Source: Central Bank of Trinidad and Tobago
6
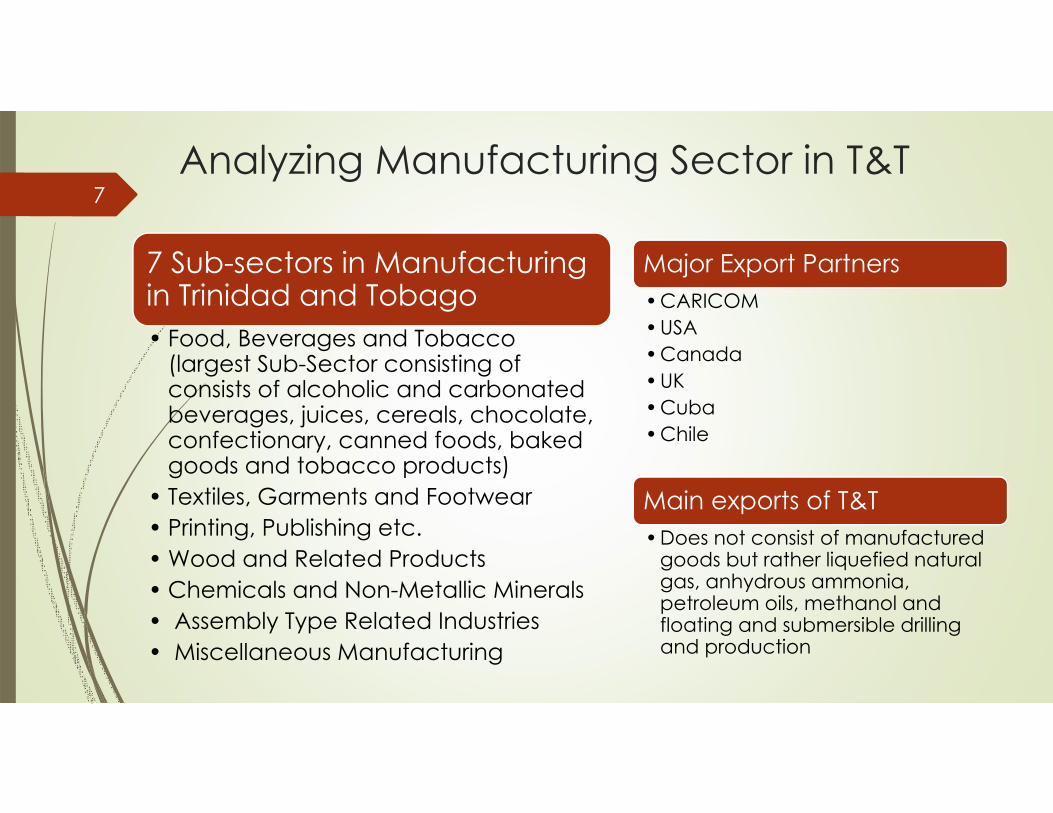
Analyzing Manufacturing Sector in T&T
7 Sub-sectors in Manufacturing in Trinidad and Tobago• Food, Beverages and Tobacco
(largest Sub-Sector consisting of consists of alcoholic and carbonated beverages, juices, cereals, chocolate, confectionary, canned foods, baked goods and tobacco products)
• Textiles, Garments and Footwear• Printing, Publishing etc.• Wood and Related Products• Chemicals and Non-Metallic Minerals• Assembly Type Related Industries• Miscellaneous Manufacturing
Major Export Partners• CARICOM• USA• Canada• UK• Cuba• Chile
Main exports of T&T• Does not consist of manufactured
goods but rather liquefied natural gas, anhydrous ammonia, petroleum oils, methanol and floating and submersible drilling and production
7
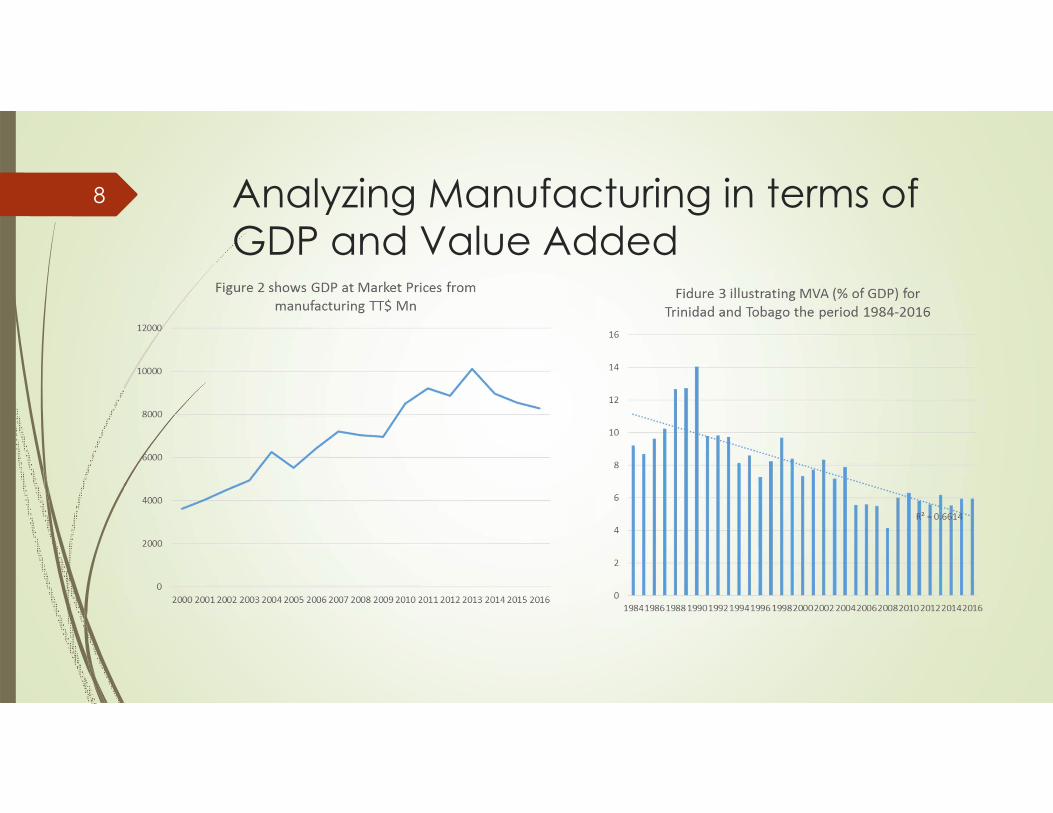
Analyzing Manufacturing in terms of GDP and Value Added
8
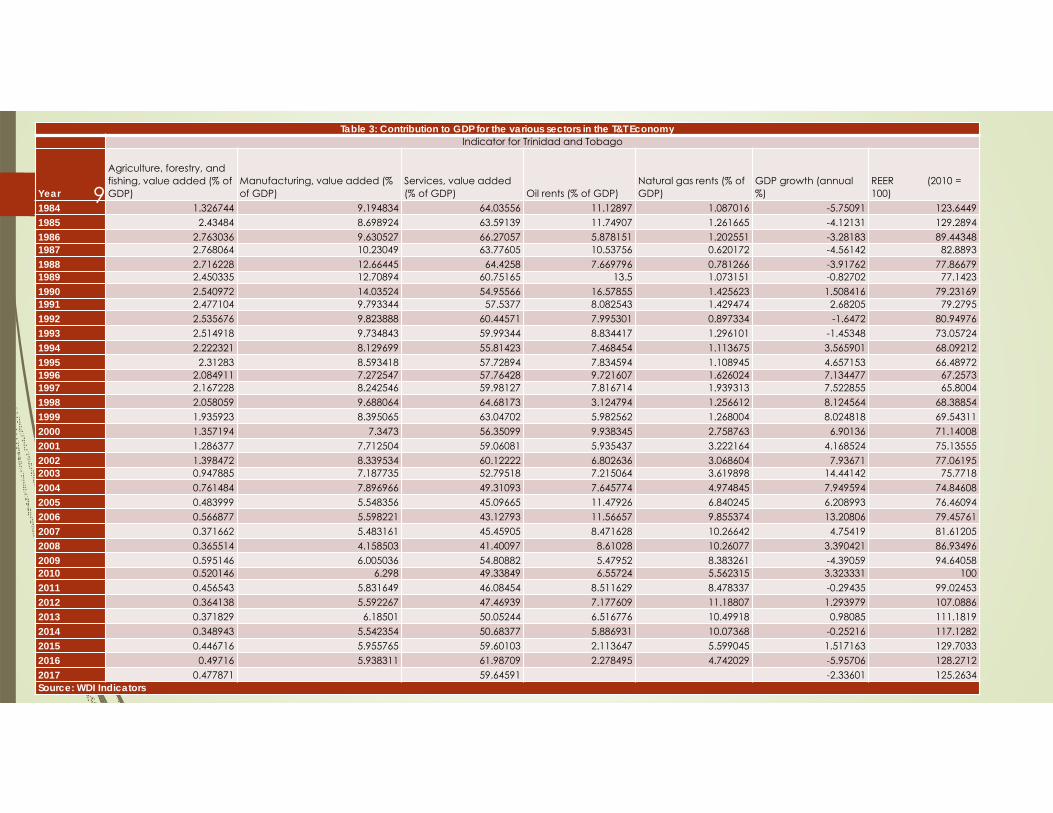
Table 3: Contribution to GDP for the various sectors in the T&T EconomyIndicator for Trinidad and Tobago
Year
Agriculture, forestry, and fishing, value added (% of GDP)
Manufacturing, value added (% of GDP)
Services, value added (% of GDP) Oil rents (% of GDP)
Natural gas rents (% of GDP)
GDP growth (annual %)
REER (2010 = 100)
1984 1.326744 9.194834 64.03556 11.12897 1.087016 -5.75091 123.64491985 2.43484 8.698924 63.59139 11.74907 1.261665 -4.12131 129.28941986 2.763036 9.630527 66.27057 5.878151 1.202551 -3.28183 89.443481987 2.768064 10.23049 63.77605 10.53756 0.620172 -4.56142 82.88931988 2.716228 12.66445 64.4258 7.669796 0.781266 -3.91762 77.866791989 2.450335 12.70894 60.75165 13.5 1.073151 -0.82702 77.14231990 2.540972 14.03524 54.95566 16.57855 1.425623 1.508416 79.231691991 2.477104 9.793344 57.5377 8.082543 1.429474 2.68205 79.27951992 2.535676 9.823888 60.44571 7.995301 0.897334 -1.6472 80.949761993 2.514918 9.734843 59.99344 8.834417 1.296101 -1.45348 73.057241994 2.222321 8.129699 55.81423 7.468454 1.113675 3.565901 68.092121995 2.31283 8.593418 57.72894 7.834594 1.108945 4.657153 66.489721996 2.084911 7.272547 57.76428 9.721607 1.626024 7.134477 67.25731997 2.167228 8.242546 59.98127 7.816714 1.939313 7.522855 65.80041998 2.058059 9.688064 64.68173 3.124794 1.256612 8.124564 68.388541999 1.935923 8.395065 63.04702 5.982562 1.268004 8.024818 69.543112000 1.357194 7.3473 56.35099 9.938345 2.758763 6.90136 71.140082001 1.286377 7.712504 59.06081 5.935437 3.222164 4.168524 75.135552002 1.398472 8.339534 60.12222 6.802636 3.068604 7.93671 77.061952003 0.947885 7.187735 52.79518 7.215064 3.619898 14.44142 75.77182004 0.761484 7.896966 49.31093 7.645774 4.974845 7.949594 74.846082005 0.483999 5.548356 45.09665 11.47926 6.840245 6.208993 76.460942006 0.566877 5.598221 43.12793 11.56657 9.855374 13.20806 79.457612007 0.371662 5.483161 45.45905 8.471628 10.26642 4.75419 81.612052008 0.365514 4.158503 41.40097 8.61028 10.26077 3.390421 86.934962009 0.595146 6.005036 54.80882 5.47952 8.383261 -4.39059 94.640582010 0.520146 6.298 49.33849 6.55724 5.562315 3.323331 1002011 0.456543 5.831649 46.08454 8.511629 8.478337 -0.29435 99.024532012 0.364138 5.592267 47.46939 7.177609 11.18807 1.293979 107.08862013 0.371829 6.18501 50.05244 6.516776 10.49918 0.98085 111.18192014 0.348943 5.542354 50.68377 5.886931 10.07368 -0.25216 117.12822015 0.446716 5.955765 59.60103 2.113647 5.599045 1.517163 129.70332016 0.49716 5.938311 61.98709 2.278495 4.742029 -5.95706 128.27122017 0.477871 59.64591 -2.33601 125.2634Source: WDI Indicators
9
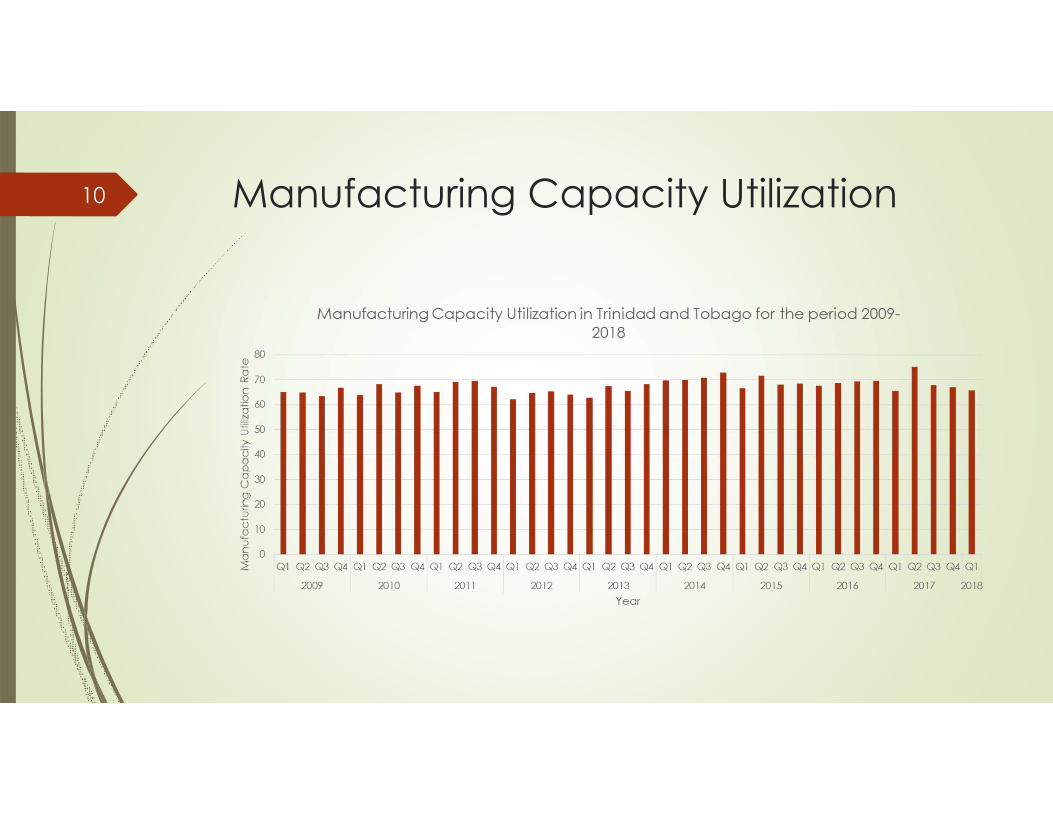
Manufacturing Capacity Utilization10
Potential for Import Substitution Industrialization for T&T (2017)
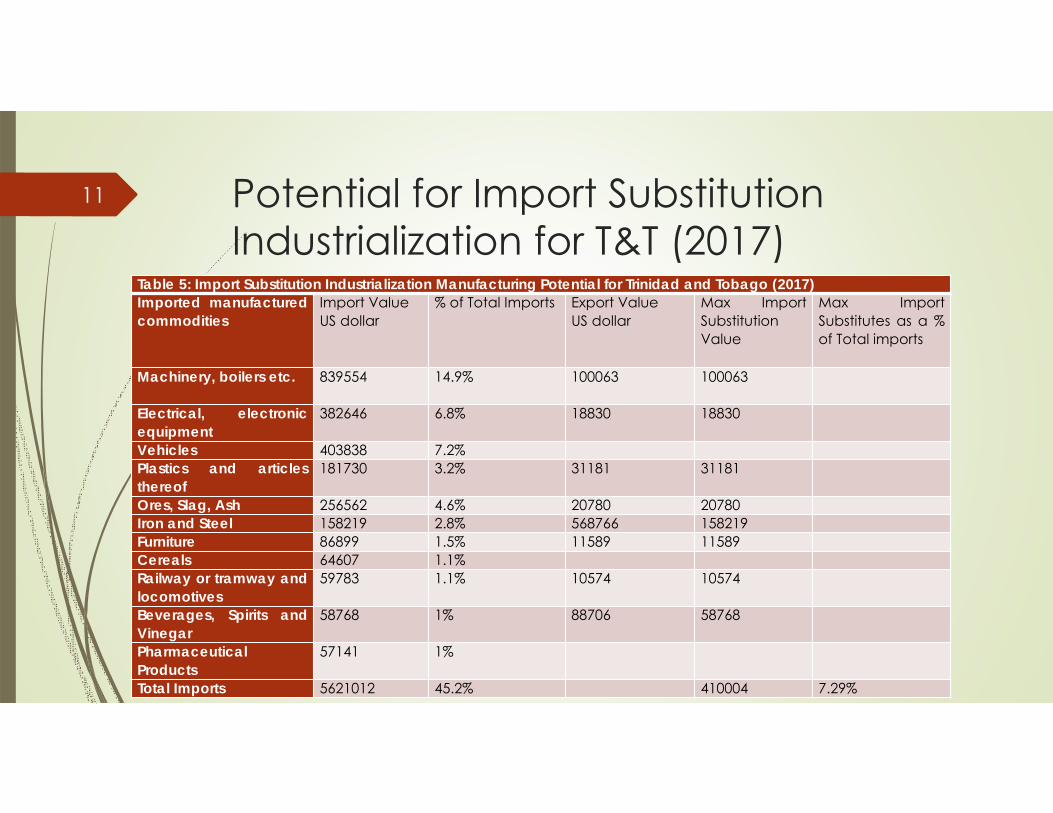
Table 5: Import Substitution Industrialization Manufacturing Potential for Trinidad and Tobago (2017)Imported manufacturedcommodities
Import ValueUS dollar
% of Total Imports Export ValueUS dollar
Max ImportSubstitutionValue
Max ImportSubstitutes as a %of Total imports
Machinery, boilers etc. 839554 14.9% 100063 100063
Electrical, electronicequipment
382646 6.8% 18830 18830
Vehicles 403838 7.2%Plastics and articlesthereof
181730 3.2% 31181 31181
Ores, Slag, Ash 256562 4.6% 20780 20780Iron and Steel 158219 2.8% 568766 158219Furniture 86899 1.5% 11589 11589Cereals 64607 1.1%Railway or tramway andlocomotives
59783 1.1% 10574 10574
Beverages, Spirits andVinegar
58768 1% 88706 58768
PharmaceuticalProducts
57141 1%
Total Imports 5621012 45.2% 410004 7.29%
11
Trends in Corruption, Crime, Ease of Doing Business and Global Competitiveness12
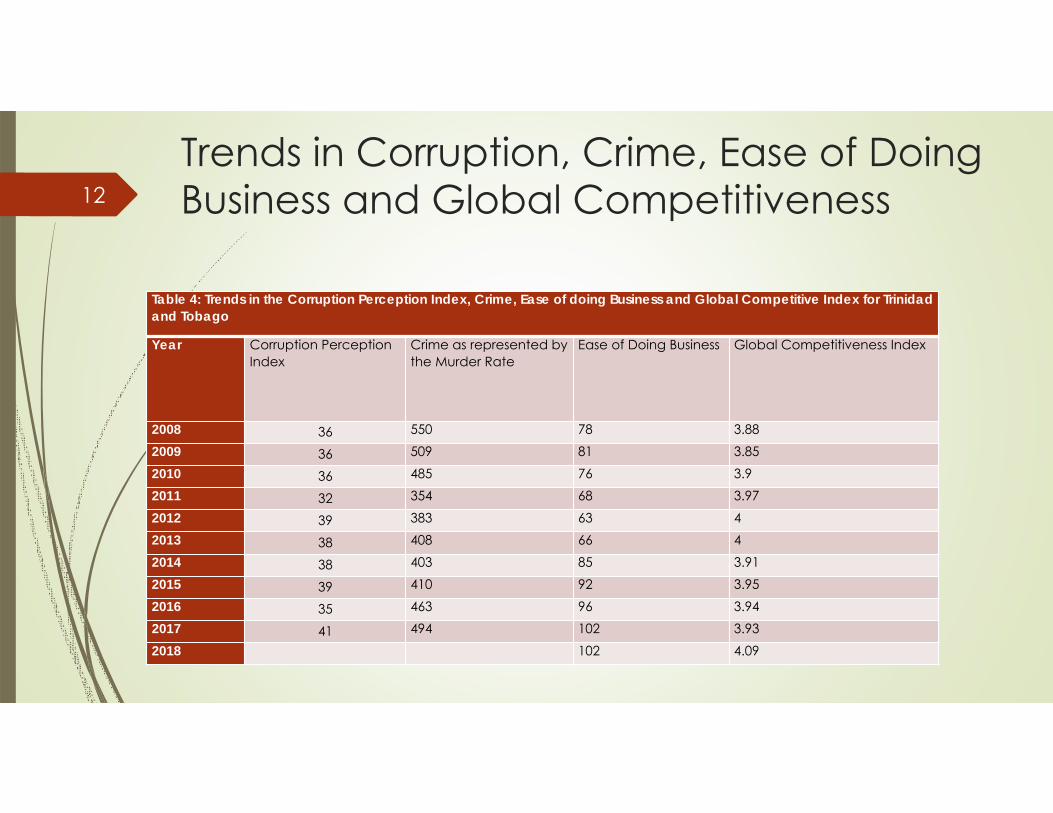
Table 4: Trends in the Corruption Perception Index, Crime, Ease of doing Business and Global Competitive Index for Trinidad and Tobago
Year Corruption Perception Index
Crime as represented by the Murder Rate
Ease of Doing Business Global Competitiveness Index
2008 36 550 78 3.882009 36 509 81 3.852010 36 485 76 3.92011 32 354 68 3.972012 39 383 63 42013 38 408 66 42014 38 403 85 3.912015 39 410 92 3.952016 35 463 96 3.942017 41 494 102 3.932018 102 4.09
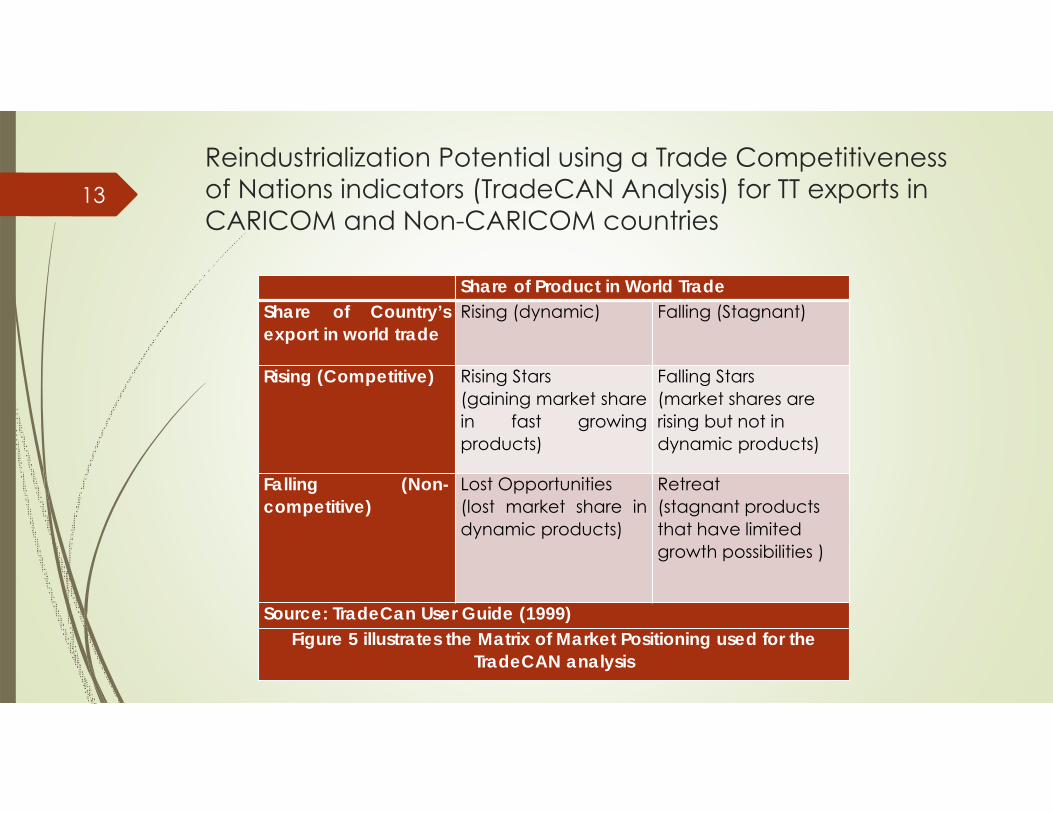
Reindustrialization Potential using a Trade Competitiveness of Nations indicators (TradeCAN Analysis) for TT exports in CARICOM and Non-CARICOM countries
Share of Product in World TradeShare of Country’sexport in world trade
Rising (dynamic) Falling (Stagnant)
Rising (Competitive) Rising Stars(gaining market sharein fast growingproducts)
Falling Stars(market shares are rising but not in dynamic products)
Falling (Non-competitive)
Lost Opportunities(lost market share indynamic products)
Retreat(stagnant products that have limited growth possibilities )
Source: TradeCan User Guide (1999)Figure 5 illustrates the Matrix of Market Positioning used for the
TradeCAN analysis
13
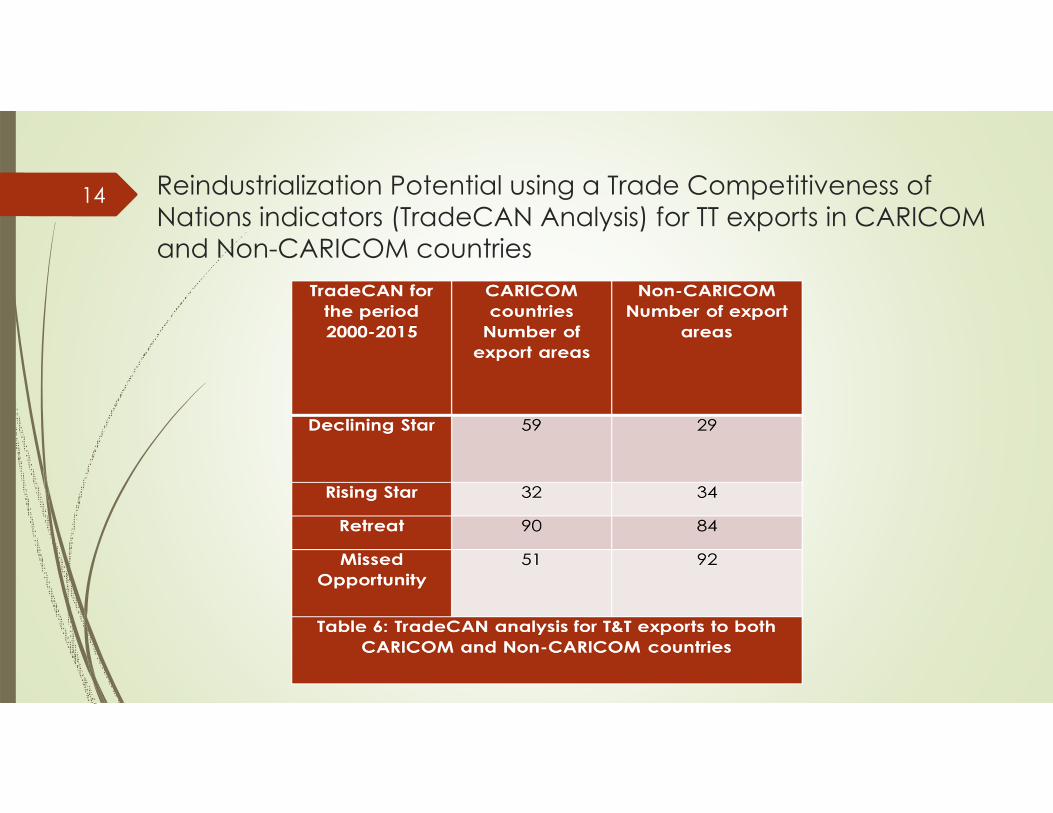
Reindustrialization Potential using a Trade Competitiveness of Nations indicators (TradeCAN Analysis) for TT exports in CARICOM and Non-CARICOM countries
14
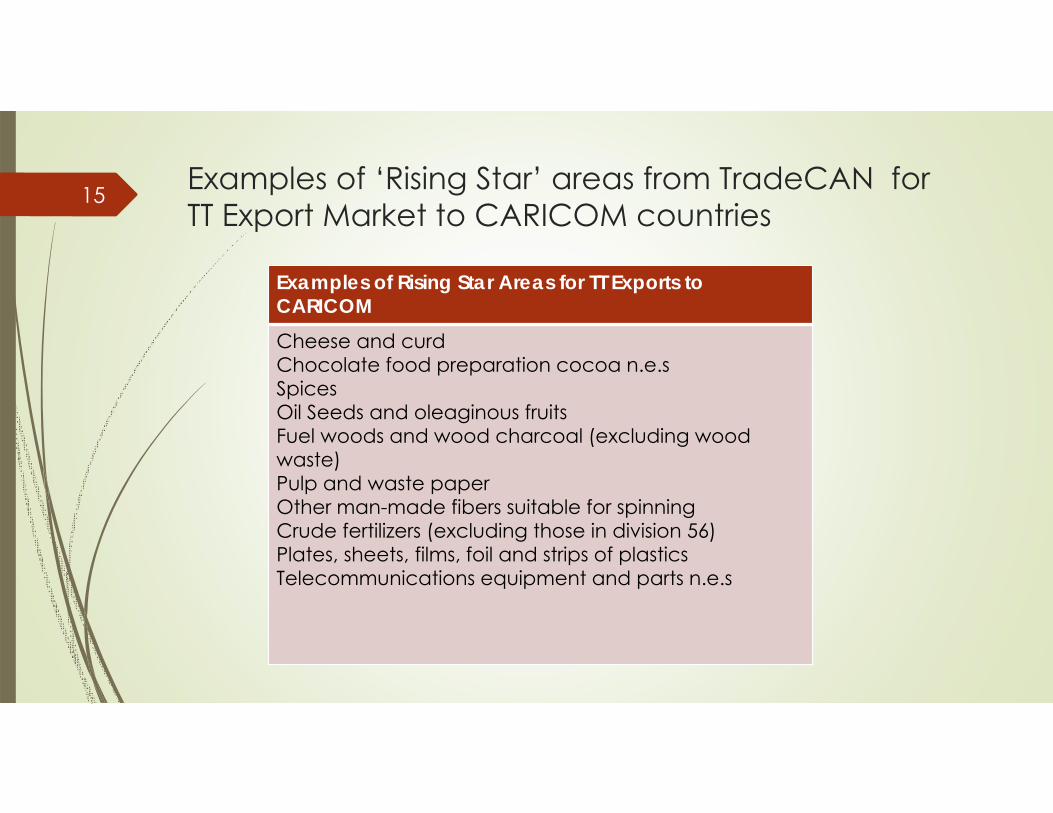
Examples of ‘Rising Star’ areas from TradeCAN for TT Export Market to CARICOM countries
Examples of Rising Star Areas for TT Exports to CARICOMCheese and curdChocolate food preparation cocoa n.e.sSpicesOil Seeds and oleaginous fruitsFuel woods and wood charcoal (excluding wood waste)Pulp and waste paperOther man-made fibers suitable for spinning Crude fertilizers (excluding those in division 56)Plates, sheets, films, foil and strips of plasticsTelecommunications equipment and parts n.e.s
15
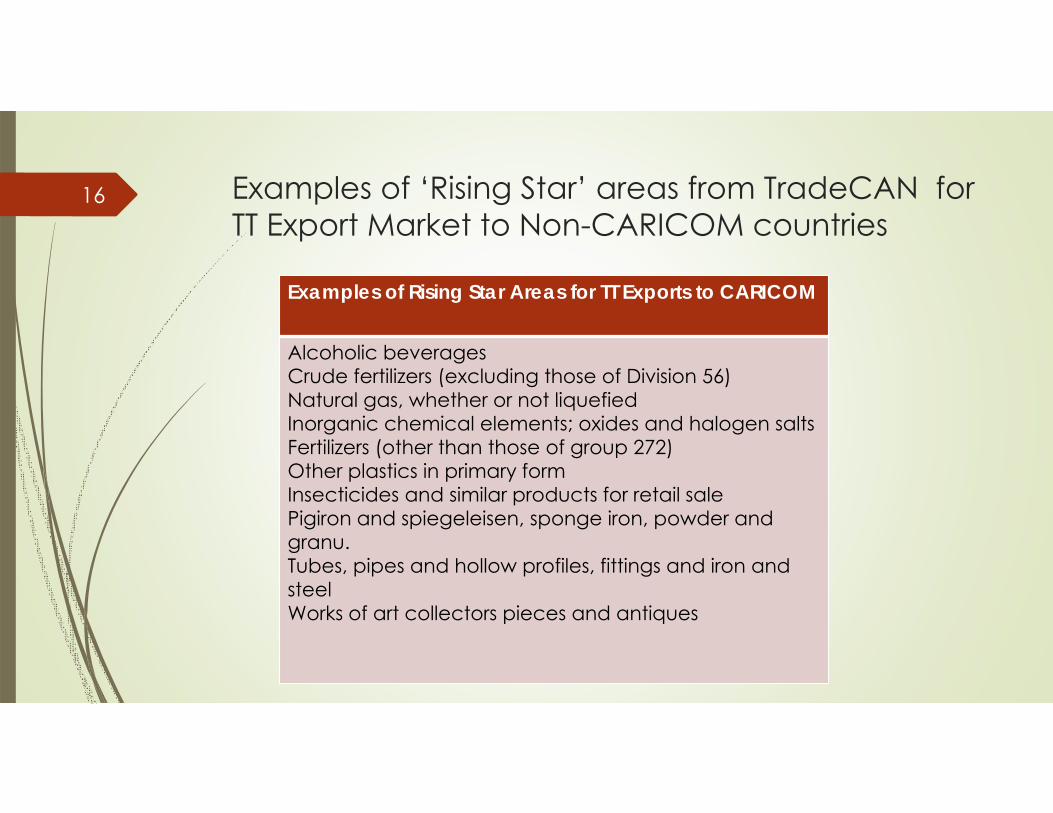
Examples of ‘Rising Star’ areas from TradeCAN for TT Export Market to Non-CARICOM countries
16
Examples of Rising Star Areas for TT Exports to CARICOM
Alcoholic beveragesCrude fertilizers (excluding those of Division 56)Natural gas, whether or not liquefiedInorganic chemical elements; oxides and halogen saltsFertilizers (other than those of group 272)Other plastics in primary formInsecticides and similar products for retail salePigiron and spiegeleisen, sponge iron, powder and granu.Tubes, pipes and hollow profiles, fittings and iron and steelWorks of art collectors pieces and antiques
Facilitation of increasing Manufacturing Potential: Specialized Economic Zones (SEZ’s)
Wang (2009) postulates that a specialized economic zone (SEZ) is a geographical area in a country that is used for industry, manufacturing and services for export that benefit from more liberal and economic laws than that of the country itself.
SEZ’s are said to increase per capita foreign direct investment, prevent overcrowding of domestic industries and capital stock, increases total factor productivity growth, introduce advanced technology and capital to a country.
SEZ’s allow for the development of infrastructure, currency exchange, technological development, increased investment, employment and economic growth in a country (Pakdeenurit et al, 2014)
17
SEZ’s and relation to T&T: E-TecK Parks
It was identified that 135 countries across Asia, Africa, Latin America and Europe utilized over 3000 SEZ’s to increase foreign capital, exports, employment, stimulate industry and improve infrastructure.
Zeng (2015) states that SEZ’s can be effective in promoting industrialization referencing to developing East Asian countries.
EtecK initiative is “to drive the non-energy sectors for the sustainable long-term growth and development of diversified and knowledge-based economy that contributes to the creation of high quality jobs.” Following 2013, e TecK would be refocused on asset management and the development and facilitation of economic zones.
The company also has the responsibility improving the infrastructure of existing economic zones, commercialize existing industrial parks.
There are currently 19 E-TecK parks throughout T&T.
18
Conclusion
Trinidad and Tobago shows evidence of experiencing both the Dutch Disease and Premature Deindustrialization.
There has been a decline in manufacturing output and employment, the existence of spare capacity based the manufacturing capacity utilization rate and there is limited potential for import substitution industrialization currently in Trinidad and Tobago.
Investments in manufacturing sector may also be affected from areas such as increasing crime, as well as decreasing ease of doing business and global international competitiveness. Therefore, the development of this sector may end prematurely if measures to curb these issues are not put into place.
TradeCAN analysis provided ‘rising star’ areas in which the country can in crease the potential for the reindustrialization of the manufacturing sector.
19
Policy Recommendations
Policy implementation can be made to boost export areas in relation to areas in the TradeCAN analysis which narrow export areas that are considered ‘rising star’ which aims to increase market share for fast growing products.
A boost in these areas can be actively propelled by further policy implementation and streamlining of resources in the E-Teck Parks designated for manufacturing in the country given the many benefits and successes of SEZ’s around the world in promoting manufacturing.
20