cotton, biotechnology, and economic development · cotton, biotechnology, and economic development...
TRANSCRIPT

Policy Research Working Paper 5896
Cotton, Biotechnology, and Economic Development
John Baffes
The World BankDevelopment EconomicsDevelopment Prospects GroupDecember 2011
WPS5896P
ublic
Dis
clos
ure
Aut
horiz
edP
ublic
Dis
clos
ure
Aut
horiz
edP
ublic
Dis
clos
ure
Aut
horiz
edP
ublic
Dis
clos
ure
Aut
horiz
edP
ublic
Dis
clos
ure
Aut
horiz
edP
ublic
Dis
clos
ure
Aut
horiz
edP
ublic
Dis
clos
ure
Aut
horiz
edP
ublic
Dis
clos
ure
Aut
horiz
ed

Produced by the Research Support Team
Abstract
The Policy Research Working Paper Series disseminates the findings of work in progress to encourage the exchange of ideas about development issues. An objective of the series is to get the findings out quickly, even if the presentations are less than fully polished. The papers carry the names of the authors and should be cited accordingly. The findings, interpretations, and conclusions expressed in this paper are entirely those of the authors. They do not necessarily represent the views of the International Bank for Reconstruction and Development/World Bank and its affiliated organizations, or those of the Executive Directors of the World Bank or the governments they represent.
Policy Research Working Paper 5896
During the past decade, cotton prices remained considerably below other agricultural prices (although they recovered toward the end of 2010). Yet, between 2000–04 and 2005–09 world cotton production increased 13 percent. This paper conjectures that biotechnology-induced productivity improvements increased supplies by China and India, which, in addition to keeping cotton prices low, aided these countries to cap-ture market share from (and cause losses to) non-users of biotechnology. By contrast, with a single
This paper is a product of the Development Economics, Development Prospects Group. It is part of a larger effort by the World Bank to provide open access to its research and make a contribution to development policy discussions around the world. Policy Research Working Papers are also posted on the Web at http://econ.worldbank.org. The author may be contacted at [email protected].
exception, Africa has not adopted biotechnology and, not coincidentally, its cotton output declined by more than 20 percent between the first and second half of the past decade. The paper concludes that the development implications of biotechnology go beyond cotton and Africa. High energy prices have been an important driver of the recent commodity price boom. Therefore, investment and policy strategy responses to a cost-driven boom should be consistent with cost-saving alternatives. Biotechnology clearly meets this challenge.

Cotton, Biotechnology, and Economic Development
John Baffes
THE WORLD BANK
KEY WORDS: Biotech cotton, cotton prices, agriculture prices
This was prepared under auspices of the UK-supported Global Trade and Financial Ar-
chitecture project. The views expressed are personal and should not be attributed to the
World Bank. I would like to thank Ataman Aksoy, Jock Anderson, Armelle Gruère, Tas-
sos Haniotis, Bernard Hoekman, Melinda Smale, and Terry Townsend for comments
and suggestions on earlier drafts. Comments by seminar participants at the International
Monetary Fund (March 01, 2011) and a meeting with staff of the International Food Poli-
cy Research Institute (March 17, 2011) are greatly appreciated.
— 2 —
Cotton, Biotechnology, and Economic Development
Although agricultural commodity prices may diverge from each other for short
periods of time, they are expected to converge over the longer term since they
respond to the same fundamentals and exogenous shocks. Moreover, when
supply and demand conditions force prices to deviate, producers will shift land
and other resources from lower- to higher-priced crops while consumers will
shift from higher- to lower-priced products, thus balancing the market and in-
ducing price convergence. Yet, during the past decade, the cotton market defied
that logic. Between 2000-04 and 2005-09, the real agricultural commodity price
index increased by 38 percent while real cotton prices declined 4 percent (figure
1). More surprisingly, world cotton production increased 13 percent. That is, de-
spite declining cotton prices and sharply increasing prices of competing crops,
growers supplied more cotton. Why?
The cotton market has been subjected to considerable domestic support
which encouraged more production, thus exerting downward pressure on world
prices. While the effect of subsidies has been a hotly debated subject, the litera-
ture review discussed in Appendix A reveals that such effect is in the order of 10
percent; that is, cotton prices are 10 percent lower than what they would have
been in the absence of domestic support. This is a relatively small impact which
by no means accounts for the large deviations between cotton and other agricul-
tural prices—especially if one takes into account the fact that other commodity
sectors have been subjected to policy distortions as well.
For the most part, the gap between cotton and other agricultural prices is
explained by the use of biotechnology. Indeed, econometric evidence presented
in Appendix B shows that the historical strong co-movement between cotton and
other agricultural prices began weakening during the early part of the past dec-
ade and such weakening is explained by the use of biotechnology, especially by
China and India. In other words, biotechnology-induced productivity improve-
ments by China and India generated supply response which was large enough to
keep cotton prices in check.
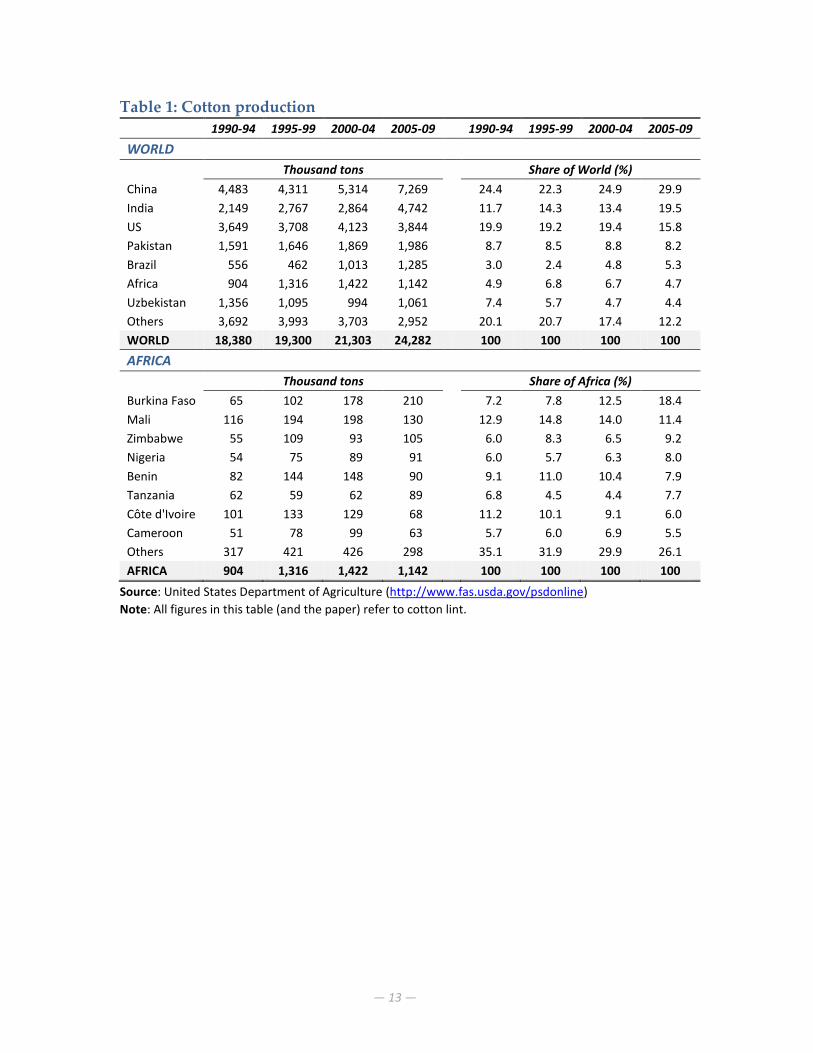
Between the first and second half of the past decade, China and India in-
creased their combined cotton production by 47 percent (table 1). During the
same period, cotton production in the rest of the world declined 7 percent while
it declined 22 percent in Africa—not coincidentally, Africa did not adopt biotech
cotton varieties. In short, early (and heavy) users of biotech cotton increased their
market share at the expense of—and causing welfare losses to—non-users of bio-
technology.
This paper examines the deeper reasons behind the uneven adoption of

— 3 —
biotechnology in the cotton market. The next section places biotechnology in the
context of the global cotton market and reaches the following conclusions. First,
some countries have reached full conversion to biotech cotton while others have
not introduced the necessary legal and regulatory framework. Second, when cot-
ton biotechnology is introduced, conversion takes place quickly. Third, the bene-
fits appear to be relatively large, especially in developing countries where be-
tween 15 and 20 percent yield increases and 50 percent reduction in insecticide
use have been observed. Section 2 discusses the reasons surrounding the biotech
controversy and notes that opposition to biotechnology not only has blocked its
adoption in Africa and other low-income countries, but also may have slowed
down the development of second generation technologies. Section 3 explains
how Africa missed the opportunity to embrace the technology. The last section
concludes and discusses policy implications and lessons that go beyond cotton
and Africa.
1. Biotechnology and the cotton market
As in most aspects of life, the rules of allocating non-free resources are dictated
by market forces or battles. Crops, including cotton, are no exception. Humans
grow cotton for clothing while insects use it for food. Cotton growers win the
battle by spraying the cotton plant with toxins. When the insects attempt to eat
the plant (and, hence, the toxin), they die before inflicting irreversible damage.
Here is where biotechnology comes in handy. Instead of the grower spraying the
cotton plant, the toxin is inserted in the plant by genetically modifying the
seed—a process similar to human vaccination.
Early stages of biotechnology made use of a family of soil organisms
called Bacillus thuringiensis (Bt) that produced certain toxins. Research by several
public and private institutions in the early 1980s focused on inserting the Bt gene
into tobacco plants. While initial results had limited success, a major break-
through was achieved in 1988 by Monsanto—a biotechnology company—and by
1990 the first Bt cotton varieties were commercialized (see Tripp 2009 for an ex-
tensive discussion of the development of biotech cotton varieties).
Biotech cotton was introduced commercially in 1996 in Australia, Mexico,
and the United States. China followed suit a year later and so did Argentina and
South Africa in 1998. As of 2009, 10 countries have used the technology, account-
ing for more than half of world cotton area and 55 percent of production, a figure
that may be higher if one accounts for illegal use of biotech varieties—illegal bio-
tech is widespread in Pakistan as it was the case in India a few years ago.
At least three countries have adopted fully biotech cotton (Australia,
South Africa, and the United States). Argentina, China, Colombia, India, and

— 4 —
Mexico are heavy users as well where biotechnology accounts for two-thirds of
cotton area. Brazil, which introduced the technology in 2006, currently allocates
20 percent of cotton area to biotech varieties. In Burkina Faso, almost one-third of
its cotton area was under biotech varieties in the first year of its commercial re-
lease (table 2). At a global level, James (2009) reported that as of 2009, 29 coun-
tries had used biotechnology. Soybeans accounted more than half of global bio-
tech area (52 percent), followed by maize (31 percent), cotton (12 percent), and
canola (5 percent). Several other commodities are also using biotech seeds but
their share in total biotech area is very small.
Because of high R&D expenditures, biotech seeds are more expensive than
conventional ones. At the outset, if the costs of buying these seeds are lower than
the savings realized due to fewer chemical applications, biotechnology will dis-
place conventional seed technology. Otherwise, the technology will be aban-
doned. So far, it appears that the former is the case.
While the costs of the biotechnology are straightforward in the sense that
they only reflect the costs of purchasing seeds, the benefits are more complex to
evaluate because they are affected by several factors that go beyond the reduc-
tion in the number of chemical applications. To see this consider the following,
purely hypothetical, scenarios (table 3). Suppose that growing one hectare of cot-
ton requires 10 chemical applications at a cost of $50 each or a total of $500. As-
suming yield of one ton of lint per hectare priced at $1.50/kg, it would imply rev-
enue of $1,500 and a profit of $1,000. If the use of biotech seeds (at the cost of,
say, $150 per hectare) reduces the number of chemical applications to 5, it in-
creases the grower’s profit to $1,100, associated with an incremental net gain of
$100 (the difference between $1,100 and $1,000), which is the incentive to switch
to biotechnology. Assume now another scenario whereby the use of insecticides
is sub-optimal, with an effectiveness-equivalent of say, 5 applications per season,
in turn achieving half the yield compared to the 10-application scenario, generat-
ing revenue of $750 per hectare, with a profit of $500.1 If biotech seeds are used,
in which case the 5 applications per season become optimal, the profit increases
to $1,100 (same as in the earlier scenario), generating an incremental net gain of
$600 (the difference between $1,100 and $500).
Thus, the adoption of biotechnology can be viewed as a move along the
production possibilities frontier (scenario I) or a move to the production possibil-
ities frontier (scenario II) depending on whether optimal or sub-optimal use of
1 The notion of sub-optimality used here is much broader than fewer chemical applications. It
could include other aspects such as use of low quality chemicals, not spraying the right time, the
proper amount, or the required type. These are common problems in developing countries due to
poor research and extension services.
— 5 —
chemical applications took place prior to its introduction. In some respects, these
two scenarios can be mapped to developed and developing countries where the
input intensity may roughly correspond to the numbers used in this hypothetical
experiment. Thus, the difference in incremental profit under the two scenarios
($100 versus $600), which reflects productivity increases, can be seen as the driv-
ing force behind China’s and India’s adoption of biotechnology and subsequent
increase in cotton production.
The pros and cons of biotech cotton (and biotechnology in general) have
been discussed extensively in a broad context and in terms of specific costs and
benefits, the latter mostly from survey-based research. Despite early signs re-
garding the benefits of biotechnology, institutions were at first reluctant to en-
gage in the debate (or take an ‚official position‛), not only in terms of policy or
financial assistance but also in terms of a general policy discussion. Such reluc-
tance reflected, most likely, the controversial nature of the subject.
Perhaps, the first institutional study to discuss and explicitly acknowledge
the broader benefits of biotechnology in developing countries was FAO’s 2004
The State of Food and Agriculture report, which showed that on balance, biotech
cotton growers were better off than growers of conventional seed varieties. Indi-
vidual authors followed suit. Baffes (2005) argued that in addition to subsidy
elimination and domestic policy reforms, adoption of biotech varieties should
have been a priority among policymakers in low-income cotton producing coun-
tries. Falck-Zepeda, Horna, and Smale (2007) and Anderson, Valenzuela, and
Jackson (2008) warned that the downward pressure on world cotton prices
caused by the large-scale adoption of biotech cotton is likely to force other coun-
tries to adopt the technology in order to compete in the global market.
Numerous survey-based country-specific papers have evaluated the costs
and benefits of biotech cotton. An earlier review by Smale, Zambrano, and Cartel
(2006) surveyed 47 peer-reviewed articles published between 1996 and mid-2006.
While they concluded that the evidence is promising in the sense that biotech-
nology is beneficial to producers, they also noted that it was too early to reach
definite conclusions, in part due to methodological limitations and in part be-
cause the longer term economic impact is often shaped by institutional and polit-
ical considerations the effects of which cannot be discerned within a limited
timeframe.
Later reviews, however, reached more definite conclusions. Qaim (2009)
summarized the evidence from 11 studies representing seven countries (table 4).
The results show that, on average, introduction of biotech cotton varieties is con-
sistent with a 50 percent reduction in insecticide use, 19 percent increase in effec-
tive yield and 160 percent increase in gross margin (measured in $US/hectare).
Although insecticide reduction varies little among the cases reviewed, there was
— 6 —
considerable variation in yield increase (from no change in Australia to 37 per-
cent increase in India). Large variation was reported in the gross margin as well
(from a low of $US 23 per hectare in Argentina to a high of $US 470 per hectare
in India).
A more extensive review undertaken by Tripp (2009) covered six countries
but was based on broader survey coverage (table 5). His results are remarkably
similar to those of Qaim (2009). For example, the average reduction in insecticide
costs is 41 percent, with relatively little variation among countries. The average
change in yields is 15 percent, ranging from a 2 percent reduction in Australia to
a 35 percent increase in South Africa.
Gruère and Sengupta (2011) reviewed 51 estimates based on 23 studies
that focused exclusively on India and found even larger benefits. They concluded
that, on average, use of biotech cotton reduces the number of chemical applica-
tions and pesticide costs by 36 percent each, increases yields by 34 percent, raises
net returns by 84 percent, while it increases the costs of production by 15 per-
cent.2
Numerous other models have evaluated the welfare gains from biotech
cotton varieties. Depending on assumptions regarding adoption rates and me-
thodology, global welfare gains range from a low of $1.5 to a high of $3.6 billion
annually (see Bouët and Gruère 2011). Welfare gains in Africa vary from a low of
$20 million annually (Bouët and Gruère 2011) to a high of $214 million (Ander-
son, Valenzuela, and Jackson 2008). Again, such range depends on numerous fac-
tors including modeling framework, country composition, and more important-
ly, price assumptions.
2. The biotechnology controversy
Despite its benefits, biotechnology remains a highly controversial subject which
becomes evident when considering how unevenly countries responded. Some
have fully embraced the technology while others have not even introduced the
necessary legal and regulatory framework. From the perspective of high-income
countries, the United States and Europe have taken different stances with the
United States being the leader in both development and use of biotechnology
and Europe taking a cautious approach. Other countries fall into one or the other
camp with most African countries taking the precautionary approach.
Graff, Hochman, and Zilberman (2009) argued that adoption of biotech-
nology has been affected by the alignment of rent seeking behavior that influ-
ences the policy-making process. They also note that because companies in the
2 It should be noted that some studies appear in more than one review.
— 7 —
United States have a relative advantage in biotech innovation while Europe has
dominance in agricultural pest-control markets, biotechnology advanced in the
United States while conventional seed technology (which requires higher use of
pesticides) dominated Europe. Paarlberg (2008, p. 119) argued that initially, ‚Eu-
rope’s precautionary principle had honorable origins‛ and reflected sensitivities
related to environmental problems that took place during the 1970s and 1980s.3
However, the public opinion in Europe shifted against biotechnology—more so
than North America—in part because of pressure by the NGO community (see
below). Paarlberg (2008) also noted that, instead of using existing laws and regu-
lations, Europe created a new and very demanding regulatory regime, thus erect-
ing obstacles rather than creating opportunities for development and use of bio-
technology.
At the time that governments were engaging in the debate of whether to
adopt and how to regulate biotechnology, a strong anti-biotech movement
emerged in developed and developing countries alike. For example, following
FAO’s publication of 2004 State of Food and Agriculture, a coalition of 670 NGOs
and 816 individuals sent a letter (‚FAO Declares War on Farmers not on Hun-
ger‛) to FAO’s Director General expressing their disagreement with the findings
of the report and their dissatisfaction because they were not consulted (GRAIN
2004). Interestingly, a year later the American Agricultural Economics Association
honored a key contributor of FAO’s publication with its 2005 Quality of Com-
munication award.
A telling illustration is how opposition to biotech cotton has unfolded in
India. Its logic is based on the following arguments. In order for growers to buy
biotech seeds they often borrow funds from financial institutions. If the crop
fails, they will not have the money to pay back the funds and thus the financial
institutions will not lend them again. Then, they turn to private moneylenders. If
the crop fails again, the growers will not repay the private lenders, who, in turn,
will exert a lot of pressure on the growers. Some growers cannot take such pres-
sure and commit suicide.4
Various media outlets argued, often with graphic illustrations, that bio-
technology has been the key cause of suicides in the cotton growing areas of In-
dia. The issue was picked up by western media outlets as well. The New York
3 The Forward of Paarlberg’s book, Starved for Science: How Africa Biotechnology Is Being Kept out of
Africa, was written by Norman E. Borlaug (agricultural scientist, often called the father of the
green revolution) and Jimmy Carter (former President of the United States). They are both Nobel
Peace Prize Laureates (1970 and 2002).
4 Although the logic of these arguments is correct, the probability of each event occurring (condi-
tional on occurrence of the previous event) becomes progressively low, especially in view of the
spectacular performance of the Indian cotton sector during the relevant period.

— 8 —
Times published the article ‚On India’s Farms, a Plague of Suicide‛ on September
19, 2006 while the TV channel PBS aired the episode ‚The Dying Fields‛ on Au-
gust 28, 2008. On the more sensational side, reports have gone as far as naming
India’s cotton growing region the ‚suicide belt‛ (a term borrowed from the ‚cot-
ton belt‛ in the United States). Gruère, Mehta-Bhatt, and Sengupta (2008) re-
viewed the Indian cotton biotechnology industry in detail and focused on the
suicide issue. They concluded as follows (p. 38): ‚Therefore, it is not only inaccurate
but simply wrong to blame the use of Bt cotton as the primary cause of farmer suicides in
India. In fact, our overview of the evidence suggests that Bt cotton has been quite success-
ful in most states and years in India, contributing to an impressive leap in average cotton
yields, as well as a decrease in pesticide use.‛
Herring (2008) argued that biotechnology has been subjected to framing
by its opponents for at least two reasons. The first reason has to do with the pos-
sibility that biotech seeds may, in the future, incorporate ‚terminator technolo-
gy‛. In other words, plants from biotech seeds will not be able to reproduce thus
raising fears that the entire food system would be dominated by multinational
corporations which may manipulate the biotech seed market. Second, biotech-
nology has been stigmatized because the introduction of the insect-resistant trait
into plants involved genetic engineering.
The logic behind the first argument is, at best, weak and, at worse, flawed
simply because the ‚terminator technology‛ concern can be applied to all aspects
of modern agriculture (or any other sector of the economy for that matter). Most
of today’s agricultural production depends on commercial inputs such as irriga-
tion equipment, fertilizers, chemicals, fuel, electricity, tractors, and trucks, which
certainly do not have the ability to reproduce—in fact, most of these inputs have
been instrumental for the success of the green revolution. If some (or, even one)
of those inputs are not available, output from commercial agriculture will disap-
pear. While there may be imperfections in the way in which some of these mar-
kets function, there are plenty of companies willing and able to supply these in-
puts and no concerns have been expressed that the markets of, say, fertilizers or
tractors have been subjected to manipulation. It is unclear why the biotechnology
industry will act any differently compared to all other input-supply industries.
But, even if the industry acted in a worrisome manner, regulation to ensure that
anticompetitive behavior does not take place or funding of public research insti-
tutions to supplement private research would prevent likely problems.
Yet, the framing has been successful, in large part because of the way in
which biotechnology was marketed. Biotechnology was commercialized in the
mid-1990s as a genetically-engineered technology with the stated objective of in-
creasing yields and generating higher profits for farmers in developed countries.
However, at that time consumers were becoming more sensitive to food health
— 9 —
and environmental considerations, they were shifting to organic products, and
they were becoming aware of the negative impact of OECD agricultural subsi-
dies on producers of low-income countries—the latter became apparent during
the failed attempt to launch what would have been the Seattle-round of trade ne-
gotiations in December 1999. In short, a ‚transgenic‛, ‚genetically modified‛, or
‚genetically engineered‛ product was promoted at a time when consumers were
already tuned to ‚organic‛, ‚fair trade‛ and ‚environmentally sustainable‛
products.5 Indeed, in 2004, the author met with two senior managers of a seed
company, one of whom strongly believed that the negative reaction against bio-
technology reflected, for the most part, its name. He argued: ‚Unfortunately, the
name [transgenic crops] was left up to the engineers. In retrospect, it appears that cul-
tural anthropologists or sociologists could have assisted the industry with a much better
choice of name.‛ He further noted that ‚biotech cotton‛ or ‚enhanced seed tech-
nology‛ would have been much better alternatives.
3. The collateral damage
Despite organized opposition, India’s use of biotech cotton increased every sin-
gle year since its introduction in 2002 and by 2009 had reached 80 percent adop-
tion rate. Biotech cotton was initially used in India on an illegal basis. And, ac-
cording to Herring (2007), it was the illegal use of biotech seeds that pushed the
Indian government to put the legal and regulatory framework in place and even-
tually approve cotton biotechnology. In China, biotech cotton’s share reached 70
percent in 2009. Between the first and second half of the past decade cotton pro-
duction in China increased 31 percent with similar contributions from yield in-
creases and area expansion (figure 2). India experienced a 51 percent output in-
crease during this period, with yield increases contributing almost three-quarters
to that expansion. These yield increases are in line with the ones reported in the
literature reviews. Today, these two countries dominate the global cotton market,
accounting for half of world’s cotton output, up from one-third during the 1990s.
Cotton production in Africa declined 22 percent (17 percent due to area
contraction and 5 percent due to yield losses). It was only in 2008 that Burkina
Faso introduced the technology and the second year almost 30 percent of its cot-
ton area was under biotech varieties. James (2009) estimated that biotech cotton
in Burkina Faso is likely to generate economic benefits of about US$100 million
per annum, based on yield increases and reductions in chemical applications ex-
perienced elsewhere. Again, these gains are very much in line with the benefits
5 Not surprisingly, opponents of biotechnology took the name issue to extremes by calling bio-
technology products ‚death seeds‛, ‚seeds of suicide‛, ‚frankencrops‛, and ‚frankenfoods‛.
— 10 —
reported in the literature discussed earlier. Anderson and Valenzuela (2007)
showed that the benefits from full adoption of biotech cotton varieties by African
cotton-producing countries could be even greater than the benefits of the remov-
al of all cotton subsidies by the United States and the European Union.
In view of these gains, a simple (and relevant) question is what if Africa
had matched India’s and China’s cotton expansion record during the past dec-
ade? Africa’s output would have been 2.1 million tons instead of 1.1 million tons.
Even at the past decade’s low prices of $US 1.30/kg, that would have generated
an additional $US 1.3 billion in export revenues per year. Moreover, if the rea-
lignment of cotton prices with other agricultural commodities that began during
the second half of 2010 persists, the additional revenue could top $US 2.0 billion.6
While such gains would have required other policies and investments to have
taken place as well, they are so large that officials and policy makers in charge of
agricultural policies and investment strategies should take notice.
Yet, concerns regarding biotechnology have been expressed at high levels
of policy making in many African countries. For example, Uganda’s Cotton De-
velopment Organization—the regulatory body of the cotton industry—chose to
proceed cautiously by examining the pros and cons of this technology despite
Cotton Research Institute’s repeatedly emphasis on the need to venture into the
area of biotechnology (Baffes 2009). Similarly, Zambia’s cotton development trust
attempted to set up the institutional structure and eventually introduce biotech
cotton but the President of the country halted its activities, in response to pres-
sure by various groups, including the Council of Churches. It was only in 2010
that the subject of biotechnology re-emerged in the public policy making arena
(Yagci and Aksoy 2011).
Many authors have noted that Africa’s precaution with biotechnology re-
flects more external influence rather than domestic concerns. For example, Paarl-
berg (2008) argued that the views regarding biotechnology of some African coun-
tries and their subsequent actions have been influenced directly or indirectly by
many European governments or their citizens through mechanisms which in-
clude financial and technical assistance, activities through international organiza-
tions, NGO activity campaigns, and import marketing arrangements.
Regardless of the nature, origins, and degree of the opposition to biotech-
nology, commodity markets—and, perhaps, development—have been affected in
at least two ways. First, because of the opposition, biotechnology adoption by
developing countries was limited; ironically, that is where the technology turned
6 To put these gains into perspective, consider that during 2009 IDA (International Development
Association) net inflows to Africa were $US 3.2 billion while ODA (Official Development Assis-
tance) flows reached $US 28 billion.
— 11 —
out to be most effective and is most needed. Second, the opposition may have
slowed down the development of second-generation biotechnology since private
companies are unwilling to invest in relevant R&D technologies because of un-
certainty while publicly-funded (national and international) institutions limit
their engagement in biotechnology-related research due to inadequate funding.
4. Conclusions and Policy Implications
During the second half of the past decade, commodity prices experienced the
broadest and most sustained post-WWII boom. However, cotton prices remained
stagnant—though they recovered towards the end of 2010. This paper conjec-
tured that cotton prices were kept in check in large part due to biotechnology-
induced expansion of supplies by China and India. Yet, Africa has a poor record
not only in terms of biotech adoption but also in terms of having the necessary
legal and regulatory framework in place. Only one African country—Burkina Fa-
so—had utilized biotechnology as of 2011. Not coincidentally, the region’s cotton
industry has performed poorly. Between the first and second half of the past
decade Africa’s cotton output declined 22 percent. World cotton output in-
creased 13 percent—India and China increased their production by 51 and 31
percent, respectively.
Against this background, this paper highlighted a number of stylized
facts. First, the use of the technology at a global level has increased on a conti-
nuous basis since it was first introduced 15 years ago—on average, each year an
additional 4 percent of global cotton area is converted to biotech varieties, and,
with a few exceptions, this has been the case at the country level as well. Such
adoption rates imply that biotechnology is cost-saving to producers (since they
adopt the technology), it is welfare improving to consumers (because they buy
cotton at lower prices), it is profitable to the seed companies (since they expand
their business), and it is beneficial to the environment (because of less chemical
applications). On a global basis, the use of biotech cotton varieties implies a 40-50
percent reduction in chemical applications and 15-20 percent increase in yields
with relatively larger benefits accruing to cotton growers of developing coun-
tries. Second, if historical trends continue, almost all cotton will come from bio-
tech varieties within a decade. Third, in addition to the legal and regulatory
framework, the largest obstacle to introduce the technology appears to be politi-
cal will. When the technology is introduced it takes off quickly, including in low-
income countries such as Burkina Faso—the only African country to embrace the
technology.
Despite such adoption rates and cost/benefit record, biotech cotton is still
surrounded by controversy. The most ferocious debate takes place in India
— 12 —
where numerous reports in the local (and international) press and other news
outlets have argued repeatedly and continuously that biotech cotton is the key
cause of suicides among cotton growers in the so-called ‚suicide belt‛, despite
strong evidence to the contrary. While such opposition did not prevent India
from utilizing the technology, it has caused irreversible damage elsewhere, espe-
cially in Africa.
Such outcomes not only expose a gap between developmental objectives
and results on the ground but also give some valuable lessons. On the one hand,
cotton growers in the United States and Europe received a considerable amount
of domestic support and, in the former, access to biotechnology. On the other
hand, emerging countries such as India and China gained access to biotechnolo-
gy (despite strong opposition in the former) and on some occasions support. At
the other end of the spectrum, African cotton growers not only did not use bio-
technology or support but also were not given the opportunity to evaluate the
technology (even worse, on some occasions they were taxed). All this has led to
the following paradox: African countries such as Uganda and Zambia with per
capita income of $US 1,000 not using biotechnology for a raw material destined
for exports and high-income countries such as Australia, Canada, and the United
States with per capita income of $US 40,000 using biotechnology for domestically
consumed food commodities.
The development implications of biotechnology extend beyond cotton. As
noted earlier, commodity prices are experiencing one of the broadest and most
sustained booms of the post-WWII period. Such increases, which were seen in-
itially as welcome developments, have alarmed government officials and policy
makers alike. It is becoming increasingly apparent that although a host of factors
fueled the boom, higher production costs due to increases in energy prices have
played a key—and, perhaps, the most important—role (Baffes 2011b).
High energy prices will present challenges and, perhaps, transform the
way in which agricultural commodities are produced, especially in view of envi-
ronmental sensitivities. Therefore, investment and policy strategies to a cost-
driven boom should be consistent with cost-saving alternatives. Biotechnology
clearly meets this challenge. Indeed, researchers (e.g., Thompson 2011) are in-
creasingly recognizing the role these technologies could play not only in alleviat-
ing temporary price pressures but also in shaping longer term price trends.
— 13 —
Table 1: Cotton production
1990-94 1995-99 2000-04 2005-09 1990-94 1995-99 2000-04 2005-09
WORLD
Thousand tons Share of World (%)
China 4,483 4,311 5,314 7,269 24.4 22.3 24.9 29.9
India 2,149 2,767 2,864 4,742 11.7 14.3 13.4 19.5
US 3,649 3,708 4,123 3,844 19.9 19.2 19.4 15.8
Pakistan 1,591 1,646 1,869 1,986 8.7 8.5 8.8 8.2
Brazil 556 462 1,013 1,285 3.0 2.4 4.8 5.3
Africa 904 1,316 1,422 1,142 4.9 6.8 6.7 4.7
Uzbekistan 1,356 1,095 994 1,061 7.4 5.7 4.7 4.4
Others 3,692 3,993 3,703 2,952 20.1 20.7 17.4 12.2
WORLD 18,380 19,300 21,303 24,282 100 100 100 100
AFRICA
Thousand tons Share of Africa (%)
Burkina Faso 65 102 178 210 7.2 7.8 12.5 18.4
Mali 116 194 198 130 12.9 14.8 14.0 11.4
Zimbabwe 55 109 93 105 6.0 8.3 6.5 9.2
Nigeria 54 75 89 91 6.0 5.7 6.3 8.0
Benin 82 144 148 90 9.1 11.0 10.4 7.9
Tanzania 62 59 62 89 6.8 4.5 4.4 7.7
Côte d'Ivoire 101 133 129 68 11.2 10.1 9.1 6.0
Cameroon 51 78 99 63 5.7 6.0 6.9 5.5
Others 317 421 426 298 35.1 31.9 29.9 26.1
AFRICA 904 1,316 1,422 1,142 100 100 100 100
Source: United States Department of Agriculture (http://www.fas.usda.gov/psdonline)
Note: All figures in this table (and the paper) refer to cotton lint.

— 14 —
Table 2: Area under biotech cotton varieties (percent of area allocated to cotton)
United States
Australia Mexico China South Africa
Argentina India Colombia Brazil Burkina
Faso WORLD
1996/07 12.7 7.7 0.8 — — — — — — — 2.0
1997/08 25.5 14.0 7.8 0.7 — — — — — — 4.4
1998/09 45.0 15.4 14.3 2.4 12.0 0.8 — — — — 6.6
1999/00 58.7 22.7 12.5 14.2 28.0 3.9 — — — — 12.1
2000/01 71.1 30.0 33.4 25.0 24.0 6.1 — — — — 15.7
2001/02 76.7 30.0 27.4 32.0 74.0 4.6 — — — — 18.1
2002/03 75.4 30.0 37.6 48.7 84.0 8.0 0.5 — — — 20.2
2003/04 75.1 60.0 41.4 51.6 86.0 10.0 1.1 0.5 — — 20.8
2004/05 78.0 60.0 60.6 59.1 75.0 10.0 6.1 23.0 — — 24.3
2005/06 81.0 90.0 57.4 62.2 84.0 20.0 14.1 40.0 — — 28.4
2006/07 85.4 90.0 59.0 66.6 91.0 25.0 41.5 44.0 0.5 — 36.5
2007/08 90.2 95.0 60.0 61.0 95.0 25.0 66.3 57.0 13.0 — 43.5
2008/09 92.6 95.0 65.0 65.7 95.0 25.0 74.0 71.0 20.0 1.6 47.1
2009/10 95.0 95.0 62.0 68.0 95.0 85.0 79.3 61.0 20.0 30.5 52.0
Source: International Cotton Advisory Committee
Notes: ‘—‘ indicates that no biotech cotton was used.

— 15 —
Table 3: A hypothetical experiment on the costs and benefits of biotech cotton
SCENARIO I Optimal use of chemicals
SCENARIO II Sub-optimal use of chemicals
Conventional Biotech Conventional Biotech
Number of sprays/hectare 10 5 5 5
Cost of chemicals, $50/spray 500 250 250 250
Cost of biotech seeds, $ 0 150 0 150
Yield, kgs/hectare 1,000 1,000 500 1,000
Revenue, $1.50/kg 1,500 1,500 750 1,500
Profit, $ 1,000 1,100 500 1,100
Incremental profit, $ 100 (=1,100 - 1,000) 600 (=1,100 – 500)
Source: Author’s calculations.
Table 4: The economic effects of biotech cotton
Insecticide
reduction (%)
Effective yield
increase (%)
Gross margin
increase ($US/ha) Number of surveys
Argentina 47 33 23 2
Australia 48 0 66 1
China 65 24 470 1
India 41 37 135 2
Mexico 77 9 295 1
South Africa 33 22 91 2
United States 36 10 58 2
AVERAGE/SUM 50 [53] 19 [31] 163 [303] 11
Source: Qaim (2009), p. 672, Table 1.
Note: The average reported in the last row has been calculated by the author. Numbers in square
brackets show the India/China average.
Table 5: Changes in yield and insecticide costs from biotech cotton
Insecticide cost reduction (%) Yield change (%) Number of surveys
Australia 51 -2 2
China 65 25 3
India 27 15 10
Mexico 77 10 2
South Africa 38 35 9
United States 47 9 1
AVERAGE/SUM 41 [46] 15 [20] 27
Source: Tripp (2009), p. 74, Table 4.1.
Note: The country averages reported in the last row have been calculated by the author. The orig-
inal table reports results from individual surveys. Numbers in square brackets show the In-
dia/China average.

— 16 —
Figure 1
Agriculture and cotton price indices (Real, MUV-deflated, 2000=100)
Figure 2
Production growth decomposition into yield and area, 2000-04 to 2005-09
50
100
150
200
250
300
1960 1965 1970 1975 1980 1985 1990 1995 2000 2005 2010
Source: World Bank
Cotton
-1%
16% 13%
-17%
14%
15%
38%
-5%
-30%
0%
30%
60%
WORLD China India Africa
Yield Area
13%
31%
51%
-22%
Source: Author’s calculations based on USDA data
Note: Growth decomposition has been calculated as: log(Q2005-09/Q2000-04) = log(A2005-09/A2000-04) + log(Y2005-09/Y2000-04), where Q, A, and Y denote production, area, and yield.
— 17 —
References
Ai, Chunrong, Arjun Chatrath, and Frank Song, 2006. ‚On the Co-movement of
Commodity Prices,‛ American Journal of Agricultural Economics 88: 574–588.
Aksoy, Ataman and John Beghin (2005). Global Agricultural Trade and Developing
Countries. Washington, DC: The World Bank.
Anderson, Kym (ed.) (2009). Distortions to Agricultural Incentives: A Global Perspec-
tive, 1955-2007. London: Palgrave Macmillan and Washington, DC: The World
Bank.
Anderson, Kym, Ernesto Valenzuela, and Lee Ann Jackson (2008). ‚Recent and
Prospective Adoption of Genetically Modified Cotton: A Global Computable
General Equilibrium Analysis of Economic Impacts.‛ Economic Development
and Cultural Change, 56: 265-96.
Anderson, Kym and Ernesto Valenzuela (2007). ‚The World Trade Organiza-
tion’s Doha Cotton Initiative: A Tale of Two Issues.‛ The World Economy, 30:
1281-1304.
Baffes, John (2011a). ‚Cotton Subsidies, the WTO, and the ‘Cotton Problem’.‛ The
World Economy, 34: 1534-1556.
Baffes, John (2011b). ‚The Energy/Non-Energy Price Link: Channels, Issues, and
Implications.‛ In Methods to Analyze Agricultural Commodity Price Volatility, pp.
31-44, ed. I. Piot-Petit and R. M’Barek. Springer Science.
Baffes, John (2009). ‚The ‘Full’ Potential of Uganda’s Cotton Industry.‛ Development
Policy Review, 27: 67-85.
Baffes, John (2007). ‚Oil Spills on other Commodities.‛ Resources Policy, 32: 126-134.
Baffes, John (2005). ‚The Cotton ‘Problem’.‛ World Bank Research Observer, 20: 109-
144.
Bouët, Antoine and Guillaume Gruère (2011). ‚Refining Opportunity Cost Esti-
mates of Not Adopting GM Cotton: An Application to Seven Countries in Sub-
Saharan Africa Countries.‛ Applied Economic Perspectives and Policy, 32: 260-279.
Cashin, Paul, C. John McDermott, and Alasdair Scott, 1999. The Myth of Co-moving
Commodity Prices. IMF Working Paper No. 169. Washington, DC: International
Monetary Fund.
Deb, Partha, Pravin K. Trivedi, and Panayotis Varangis, 1996. ‚The Excess Co-
movement of Commodity Prices Reconsidered,‛ Journal of Applied Econometrics
11: 275–91.
Dickey, David and Wayne A. Fuller (1979). ‚Distribution of the Estimators for Time
Series Regressions with Unit Roots.‛ Journal of the American Statistical Association,
74: 427-431.

— 18 —
Falck-Zepeda, Jose, Daniela Horna, and Melinda Smale (2007). ‚The Economic
Impact and the Distribution of Benefits and Risks from the Adoption of Insect
Resistant (Bt) Cotton in West Africa.‛ Discussion Paper No. 718. Washington,
DC: International Food Policy Research Institute.
Food and Agriculture Organization (FAO) (2004). The State of Food and Agricul-
ture—Agricultural Biotechnology: Meeting the Needs of the Poor? Rome: Food and
Agriculture Organization of the United Nations.
Genetic Resources Action International (GRAIN) (2005). ‚FAO Declares War on
Farmers not on Hunger.‛ An Open Letter to Mr. Jacques Diouf, Direction Gen-
eral of FAO. http://www.grain.org/front_files/fao-open-letter-june-2004-final-
en.pdf
Graff, Gregory D., Gal Hochman, and David Zilberman (2009). ‚The Political Econ-
omy of Agricultural Biotechnology Policies.‛ AgBioForum, 12: 34-46.
Gruère, Guillaume P. and Debdatta Sengupta (2011). ‚Bt Cotton and Farmer Sui-
cides in India: An Evidence-Based Assessment.‛ Journal of Development Studies,
47: 316-337.
Gruère, Guillaume P., Purvi Mehta-Bhatt, and Debdatta Sengupta (2008). ‚Bt
Cotton and Farmer Suicides in India: Reviewing the Evidence.‛ Discussion Pa-
per No. 808. Washington DC: International Food Policy Research Institute.
Herring, Ronald J. (2008). ‚Opposition to Transgenic Technologies: Ideology, Inter-
ests, and Collective Action Frames.‛ Nature Reviews Genetics, 9: 458-463.
Herring, Ronald J. (2007). ‚Stealth Seeds: Bioproperty, Biosafety, Biopolitics.‛
Journal of Development Studies, 43: 130-157.
International Cotton Advisory Committee (ICAC) (2010). ‚Government Support
to the Cotton Industry.‛ Washington, DC: International Cotton Advisory
Committee.
Jales, M{rio (2010). ‚How would a WTO Agreement on Cotton Affect Importing
and Exporting Countries?‛ ICTSD Programme on Agricultural Trade and Sus-
tainable Development, Issue Paper No. 26. Geneva, Switzerland: International
Centre for Trade and Sustainable Development.
James, Clive (2009). ‚Global Status of Biotech/GM Crops: 2009.‛ ISAAA Brief no.
41. Ithaca, NY: International Science for the Acquisition of Agri-Biotech Appli-
cations.
LeyBourne, Stephen J., Tim A. Lloyd, and Geoffrey V. Reed, 1994. ‚The Excess Co-
movement of Commodity Prices Revisited,‛ World Development 22: 1747-1758.
Paarlberg, Robert (2008). Starved for Science: How Africa Biotechnology Is Being Kept
out of Africa. US: Harvard University Press.
Pindyck, Robert S., and Julio J. Rotemberg, 1990. ‚The Excess Co-movement of

— 19 —
Commodity Prices,‛ Economic Journal 100: 1173–1189.
Smale, Melinda, Patricia Zmbrano, and Mélodie Cartel (2006). ‚Bales and Bal-
ance: A Review of the Methods Used to Assess the Economic Impact of Bt Cot-
ton on Farmers in Developing Economies.‛ AgBioForum, 9:195-212.
Qaim, Matin (2009). ‚The Economics of Genetically Modified Crops.‛ Annual Re-
view of Resource Economics, 1: 665-693.
Sumner, Daniel A. (2006). ‚Reducing Cotton Subsidies: The DDA Cotton Initia-
tive.‛ In Kym Anderson and Will Martin, eds., Agricultural Trade Reform and
the Doha Development Agenda. Washington, DC: World Bank.
Thompson, Robert L. (2011). ‚Proving Malthus Wrong: Sustainable Agriculture
to 2050.‛ http://scienceblogs.com/tomorrowstable May 13.
Tripp, Robert (2009). Biotechnology and Agricultural Development: Transgenic Cot-
ton, Rural Institutions and Resource-Poor Farmers. New York: Routledge, Taylor
and Francis Group.
World Bank (2011). Commodity Price Data. http://www.worldbank.org/ pros-
pects/commodities
Yagci, Fahrettin and Ataman Aksoy (2011). ‚Performance of Zambia’s Cotton
Sector under Partial Reforms.‛ Mimeo, World Bank. Washington, DC: World
Bank.

— 20 —
Appendix A
The determinants of the gap between cotton
and other agricultural prices
In addition to the biotechnology-induced supply response by China and India,
two other factors have contributed to the gap between cotton prices and the
broader index of agricultural prices. They are domestic support (with a negative
impact on cotton prices) and biofuels (with a positive impact on food commodi-
ties). Both are discussed in what follows.
The cotton market has been subjected to considerable domestic support
which encouraged more production, thus exerting downward pressure on world
prices. Distortions due to subsidies are not limited to the cotton market. Most
commodity sectors are affected by import tariffs and many also by domestic
supports, export subsidies and export taxes (Aksoy and Beghin 2005; Anderson
2009). During the first half of the past decade, the United States (which accounts
for one third of world exports) supported its cotton sector to the tune of $US 2 to
4 billion annually. The European Union provided considerable support as well—
around $US 1 billion annually—though applied to much less cotton and hence
lower impact on world prices. Numerous other countries subsidize their cotton
sectors as well. However, they have received less attention either because their
subsidies are small and indirect (e.g., India, Turkey, and some West and Central
African countries) or because the accuracy of the statistics has been questioned
(e.g., China). See ICAC (2010) for the latest update on cotton subsidies.
The effect of subsidies on the world price of cotton has been a hotly de-
bated subject and the estimates vary widely. After reviewing the literature,
Baffes (2005) concluded that a simple average over all models implied that world
cotton prices would have been 10 percent higher without support. Sumner (2006)
reached a remarkably similar conclusion. Based on evidence from various
sources, he found a 10 percent increase in the world price of cotton to be a rea-
sonable estimate if the cotton subsidy programs were removed under the cotton
initiative and other farm production subsidies were also reduced substantially.
Jales (2010) found that reforms consistent with the December 2008 DDA draft
modalities would imply world cotton prices 6 percent higher over 1998-2007
(ranging between a high of 10 percent in 2001 and a low of 2 percent in 2007). Re-
forms by the United States consistent with full implementation of DSB’s recom-
mendations would have increased cotton prices by 3.5 percent (ranging between
a high of 6.5 percent 2001 and a low of 1 percent in 2007). The Cotton Initiative
goes back to 2002 when four African cotton producers (Benin, Burkina Faso,
Chad, and Mali, the so-called C-4) argued that cotton subsidies caused world

— 21 —
prices to decline and reduced their export revenue. In turn, the C-4 asked for fi-
nancial compensation by bringing their case to the WTO. At about the same time,
Brazil brought a case against the United States on cotton subsidies (see Baffes
2011b).
The 2006-08 food price boom was partly aided by growth in demand for
biofuel production—albeit, much less than originally thought. Although the di-
rect impact of biofuel demand is felt only by maize, sugarcane, and some edible
oils, the indirect impact is felt by most agricultural crops, because of the strong
substitutability both on the input side and on the output side—especially in ani-
mal feed and vegetable oils which are highly substitutable commodities. Because
cotton is not a close substitute to any other commodity, there no substitutability
on the output side. There is substitutability only on the input side as land allo-
cated to cotton can be used for other crops. But even there, it is quite limited, at
least in the short term, because other inputs, primary processing facilities, pick-
ing machinery, and other equipement are cotton-specific. Thus, converting cotton
land to other crops and vice-versa takes more time compared to converting land
from, say, wheat to maize. Indeed, between 2000-04 and 2005-09 (two periods
that can be viewed as without and with biofuel as well), global area allocated to
cotton declined by less than one percent. For example, although cotton area in
the United States declined by almost 20 percent during these two periods, global
(non-US) cotton area increased by 3 percent. By contrast, maize area (both global-
ly and in the United States) increased more than 10 percent during this period.
Lastly, it should be noted that because cotton competes with synthetic fi-
bers, which are by-products of crude oil, it is often argued that crude oil prices
affect cotton prices above beyond the impact through production costs. Baffes
(2007) estimated transmission elasticities from crude oil price to the prices of oth-
er commodities, including food and cotton. The average elasticity for food com-
modities was 0.18 while that for cotton was 0.14. Therefore, on that count, cotton
does not respond any differently than food commodities.
— 22 —
Appendix B
The divergence between cotton and other commodity prices
Commodity price comovement has been discussed extensively in the literature.
Pindyck and Rotemberg (1990) analyzed price movements of seven seemingly
unrelated commodities (cocoa, copper, cotton, crude oil, gold, lumber, and
wheat) and concluded that these prices co-moved in excess of what the macroe-
conomic fundamentals could explain. Explanations given included incomplete
model, endogeneity, rejection of normality assumption, and bubbles or market
psychology. Subsequent research, however, challenged the excess co-movement
hypothesis on data and methodological grounds (see Ai, Chatrath, and Song
2006; Cashin, McDermott, and Scott 1999; Deb, Trivedi, and Varangis 1996; and
LeyBourne, Lloyd, and Reed 1994). Although historically cotton prices have
tracked other agricultural prices very closely, during the past decade, they di-
verged considerably from each other (figure 1). It is only during the second half
of 2010 that the two indices began re-converging.
To evaluate the degree of such divergence, the following regression is
used (see also Baffes 2011a):
log(PtC) = μ + β1log(PtAG) + β2log(MUVt) + β3t + εt. [1]
PtC and PtAG denote the price of cotton and the agricultural commodity price in-
dex in year t (both expressed in nominal dollar terms), MUVt denotes the defla-
tor, t is the time trend, and εt denotes the error term; μ, β1, β2, and β3 are parame-
ters to be estimated. The agricultural commodity price index consists of 24 com-
modities, including grains, edible oils, beverages, and raw materials. Cotton’s
weight in that index is 2.9%. Details regarding composition of indices, weights,
and price data can be found at World Bank (2011).
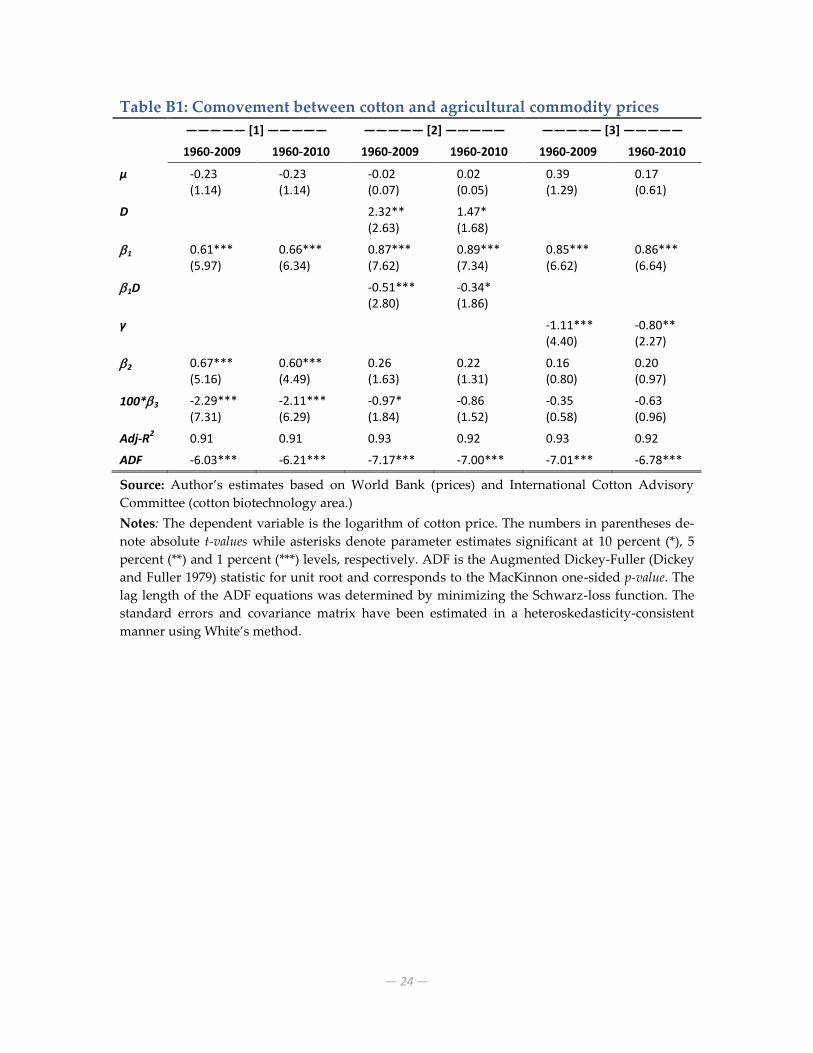
The first two columns of table B1 show estimates for the 1960-2009 and
1960-10 periods, respectively. The exclusion or inclusion of 2010 was motivated
by the desire the capture the effect of the recovery in cotton prices that took place
during the second half of 2010. The estimate of β1 is 0.61 (excluding 2010) and
0.66 (including 2010) are highly significant with adjusted-R2s equal to 0.91 and
ADF statistics of -6.03 and -6.21, respectively in turn implying strong co-
movement between cotton and other agricultural prices.
To examine the divergence between agriculture and cotton prices, [1] was
reformulated by introducing a dummy variable, D = 0, 1960-2001 and D = 1, 2002-
2010, applied to both µ and β1. The break is expected to capture the introduction
of biotech cotton in China and India. Hence, [1] becomes:
— 23 —
log(PtC) = μ + D + β1log(PtAG) + β1D*log(PtAG) + β2log(MUVt) + β3t + εt. [2]
Results from [2] are reported in columns 3 and 4 of table B1. The econometric
evidence shows that the long run relationship between the price of cotton and
the other agricultural commodities was even stronger up to the early 2000s, but it
weakened considerably during the past eight years. During 1960-2002 real agri-
cultural prices were 4 percent higher than real cotton prices (2000 = 100); during
2003-10 the gap widened to almost 60 percent. Even in 2010, when cotton prices
enjoyed a spectacular recovery, their annual average was 30 percent lower than
the overall agricultural price index. The estimates show that the recent recovery
of cotton prices induced some degree of convergence (β1D increased from -0.51 to
-0.34 when the observation for 2010 is included).
Lastly, [1] was re-estimated by adding biotech cotton area as a share of
global cotton area, BtSHARE, as follows.
log(PtC) = μ + β1log(PtAG) + γBtSHARE + β2log(MUVt) + β3t + εt. [3]
Results from [3] are reported in the last 2 columns of table B1. As in [1] and [2],
the adjusted-R2s are very high and the ADF statistics confirm stationarity of the
error term at 1% level of significance. The estimate of β1 is 0.85 and highly signifi-
cant, remarkably similar to the estimate of regression [2]. The parameter estimate
of the biotechnology share, γ, was negative and highly significant in both regres-
sions, implying that biotechnology accounts for the post-2000 gap between cot-
ton and other agricultural prices. Interestingly, the parameter estimate of the
time trend—used as a proxy of technical change differential between cotton and
other agricultural commodity sectors—is not significantly different from zero.
This should not be surprising because the share of land allocated to biotechnolo-
gy is, indeed, the best proxy for technical change.
To conclude, the econometric evidence shows that while for the 4 decades
staring in 1960 cotton and other agricultural prices moved in a synchronous
manner, they began diverging in the early part of the past decade. Such diver-
gence is accounted for by the use of biotech cotton. The next section places bio-
technology in the context of the global cotton market.
— 24 —
Table B1: Comovement between cotton and agricultural commodity prices
————— [1] ————— ————— [2] ————— ————— [3] —————
1960-2009 1960-2010 1960-2009 1960-2010 1960-2009 1960-2010
μ -0.23 (1.14)
-0.23 (1.14)
-0.02 (0.07)
0.02 (0.05)
0.39 (1.29)
0.17 (0.61)
D 2.32** (2.63)
1.47* (1.68)
1 0.61*** (5.97)
0.66*** (6.34)
0.87*** (7.62)
0.89*** (7.34)
0.85*** (6.62)
0.86*** (6.64)
1D -0.51*** (2.80)
-0.34* (1.86)
γ -1.11*** (4.40)
-0.80** (2.27)
2 0.67*** (5.16)
0.60*** (4.49)
0.26 (1.63)
0.22 (1.31)
0.16 (0.80)
0.20 (0.97)
100*3 -2.29*** (7.31)
-2.11*** (6.29)
-0.97* (1.84)
-0.86 (1.52)
-0.35 (0.58)
-0.63 (0.96)
Adj-R2
0.91 0.91 0.93 0.92 0.93 0.92
ADF -6.03*** -6.21*** -7.17*** -7.00*** -7.01*** -6.78***
Source: Author’s estimates based on World Bank (prices) and International Cotton Advisory
Committee (cotton biotechnology area.)
Notes: The dependent variable is the logarithm of cotton price. The numbers in parentheses de-
note absolute t-values while asterisks denote parameter estimates significant at 10 percent (*), 5
percent (**) and 1 percent (***) levels, respectively. ADF is the Augmented Dickey-Fuller (Dickey
and Fuller 1979) statistic for unit root and corresponds to the MacKinnon one-sided p-value. The
lag length of the ADF equations was determined by minimizing the Schwarz-loss function. The
standard errors and covariance matrix have been estimated in a heteroskedasticity-consistent
manner using White’s method.