cotton - cornell university › ... › qv33s5757 › cotton.pdf · cotton: world markets and...
TRANSCRIPT

For an email subscription, click here to register: https://public.govdelivery.com/accounts/USDAFAS/subscriber/ new.
Approved by the World Agricultural Outlook Board/USDA
Record World Consumption Helps Lower Stocks in 2019/20
USDA’s first detailed forecast for the 2019/20 marketing year shows world ending stocks forecast down for the sixth consecutive year. However, stocks outside of China will grow after declining in 2018/19 and reach a record of nearly 45 million bales. Apart from China, ending stocks are forecast to increase in nearly all major producing and consuming countries as global production remains high relative to consumption due to Brazil’s record crops and the large increase in U.S. production. In contrast, China’s ending stocks are forecast to fall for the fifth consecutive year and be less than half the level seen at the end of China’s reserve buying in 2014/15. Flat production, continued reserve sales, and consumption growth in China will combine to work stocks down. U.S. stocks will rise sharply due to a dramatically larger forecast crop and continued restrictions on U.S. exports to China.
Global consumption is forecast to grow to a record of just under 126 million bales. World consumption will have gained 16 million bales since the low following the 2009 global financial crisis. Growth is slightly above the long-term average and is expected in all of the top ten spinning countries except Indonesia, with continued strong growth forecast for Vietnam and Bangladesh. Consumption in China is expected up at near the world pace.
United States Department of Agriculture Foreign Agricultural Service May 2019
Cotton: World Markets and Trade
0102030405060708090
100
Mill
ion
Bale
s
World Ending Stocks Down 1.0%
Others -0.3%
Pakistan 0.9%
United States37.6%India 1.4%
Brazil 2.3%
China -8.6%0
20
40
60
80
100
120
140
Mill
ion
Bale
s
World Consumption Up 2.6%
Others 2.0%
Vietnam 8.6%
Bangladesh 5.0%
Pakistan 0.9%
India 2.0%
China 2.5%

Global production in 2019/20 is forecast nearly 6 percent higher. A sharply higher U.S. crop will provide well over half of the higher production with India accounting for most of the rest. Production in the Southern Hemisphere will be down sightly as expansion in Brazil takes a breather after seeing nearly 40 percent growth in 2018/19 and Australia continues to face serious water shortages. Production in China will remain stable.
In 2019/20, for the fourth consecutive year world trade is expected to expand. Both the United States and Brazil will have large exportables supplies: a record late-harvested 2018/19 Brazilan crop which will be followed shortly on the market by the sharply higher 2019/20 U.S. crop.
The expanded world trade will be driven by higher use in importing countries. Vietnam and Bangladesh imports will continue commensurate with their expansion in spinning. China’s imports are nearly 30 percent higher as a shift in its State Reserve policy – from reducing to rotating reserves – is bringing China back strongly into the global market.
0
10
20
30
40
50
2015/16 2016/17 2017/18 2018/19 2019/20
Mill
ion
Bale
s
World Exports Up 7.9%
United States 15.3% Brazil 41.4% India 7.1%
Australia -42.9% Benin 5.7% Others 0.8%
0
20
40
60
80
100
120
140
2015/16 2016/17 2017/18 2018/19 2019/20
Mill
ion
Bale
sWorld Production Up 5.9%
Others 3.4%
Pakistan 3.9%
Brazil -6.3%
United States19.8%
China 0.0%
India 11.8%
0
10
20
30
40
50
2015/16 2016/17 2017/18 2018/19 2019/20
Mill
ion
Bale
s
World Imports Up 7.9%
China 29.4% Bangladesh 5.0% Vietnam 7.0%
Indonesia 0.0% Turkey 0.0% Others -0.6%
Foreign Agricultural Service/USDA 2 May 2019Office of Global Analysis
Overview
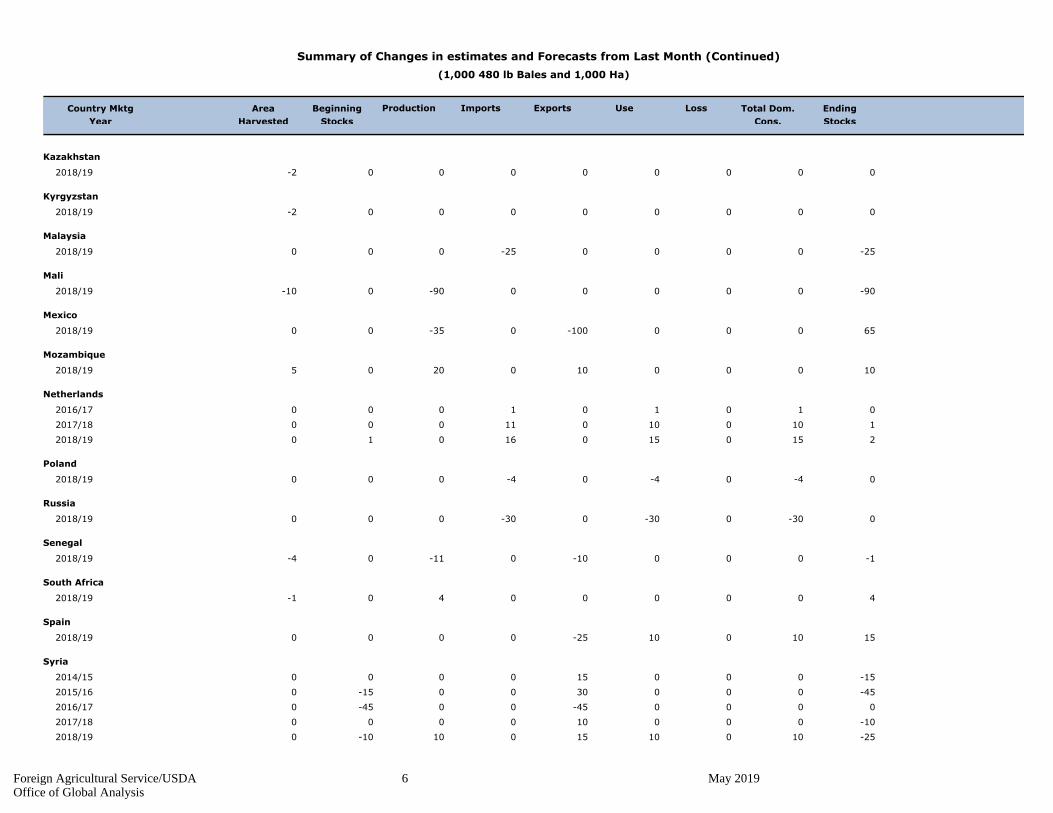
For 2019/20, the initial forecast shows higher global production, consumption, and trade compared to 2018/19. Stocks in China continue to decline while stocks elsewhere rise. However, total ending stocks will decline slightly. The U.S. forecast shows larger production, higher exports and ending stocks, with use unchanged. The U.S. season-average farm price is projected at 65 cents per pound, down 5 cents. Compared to last month, global production for 2018/19 is forecast down slightly, as smaller crops in India and the United States more than offset a larger crop in Brazil. Trade forecasts see only minor adjustments, notably lower exports for the United States and higher imports for China. U.S. stocks are up. The U.S. season-average farm price is unchanged at 70 cents/lbs. For current prices received by farmers click here; NASS farm price Prices
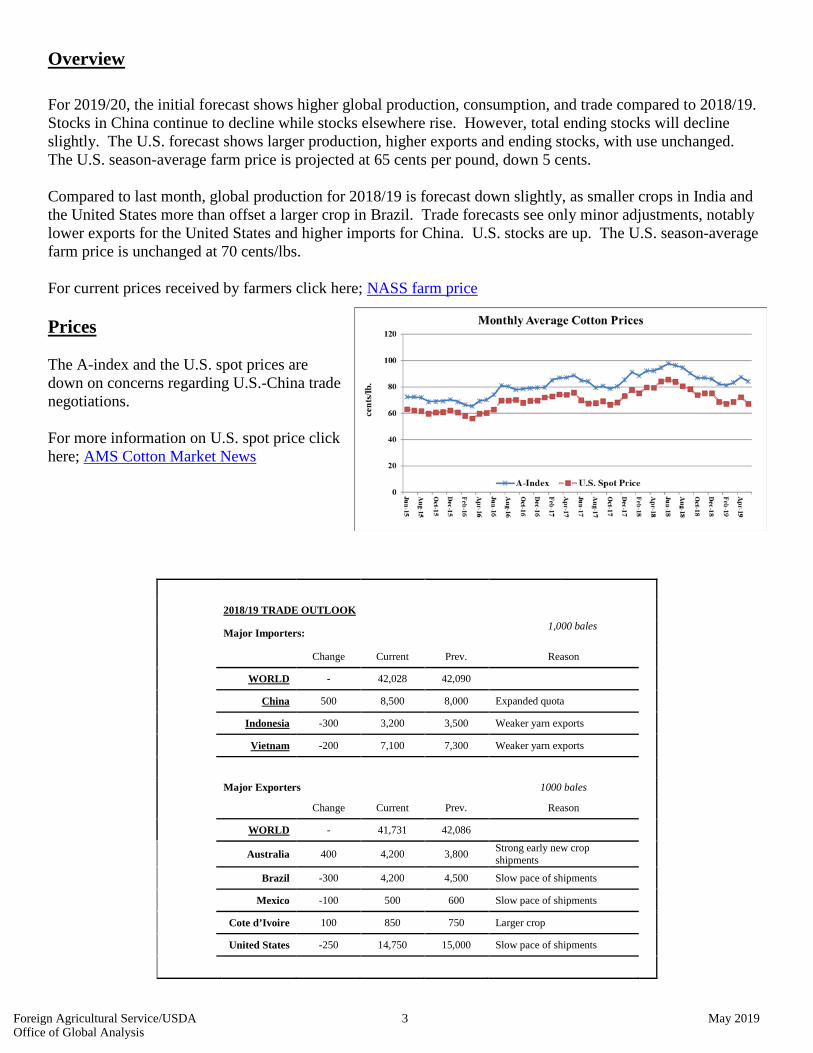
The A-index and the U.S. spot prices are down on concerns regarding U.S.-China trade negotiations. For more information on U.S. spot price click here; AMS Cotton Market News
2018/19 TRADE OUTLOOK
Major Importers: 1,000 bales
Change Current Prev. Reason
WORLD - 42,028 42,090
China 500 8,500 8,000 Expanded quota
Indonesia -300 3,200 3,500 Weaker yarn exports
Vietnam -200 7,100 7,300 Weaker yarn exports
Major Exporters 1000 bales
Change Current Prev. Reason
WORLD - 41,731 42,086
Australia 400 4,200 3,800 Strong early new crop shipments
Brazil -300 4,200 4,500 Slow pace of shipments
Mexico -100 500 600 Slow pace of shipments
Cote d’Ivoire 100 850 750 Larger crop
United States -250 14,750 15,000 Slow pace of shipments
Foreign Agricultural Service/USDA 3 May 2019Office of Global Analysis

The Foreign Agricultural Service (FAS) updates its production, supply and distribution (PSD) database for cotton, oilseeds, and grains at 12:00 p.m. on the day the World Agricultural Supply and Demand Estimates (WASDE) report is released. This circular is released by 12:15 p.m. FAS Reports and Databases:
Current World Market and Trade and World Agricultural Production Reports: https://apps.fas.usda.gov/psdonline/app/index.html#/app/downloads
Archives World Market and Trade and World Agricultural Production Reports: http://usda.mannlib.cornell.edu/MannUsda/viewTaxonomy.do?taxonomyID=7
Production, Supply and Distribution Database (PSD Online): https://apps.fas.usda.gov/psdonline/app/index.html#/app/home Global Agricultural Trade System (U.S. Exports and Imports):
http://apps.fas.usda.gov/gats/default.aspx Export Sales Report:
http://apps.fas.usda.gov/esrquery/ Global Agricultural Information Network (Agricultural Attaché Reports):
http://gain.fas.usda.gov/Pages/Default.aspx Other USDA Reports: World Agricultural Supply and Demand Estimates (WASDE):
http://www.usda.gov/oce/commodity/wasde/ Economic Research Service:
http://www.ers.usda.gov/topics/crops National Agricultural Statistics Service:
http://www.nass.usda.gov/Publications/
Questions may be directed to: James Johnson (202) 690-1546 [email protected] ([email protected]) Graham Soley (202) 772-4235 [email protected] ([email protected])
Foreign Agricultural Service/USDA 4 May 2019Office of Global Analysis

Summary of Changes in estimates and Forecasts from Last Month
(1,000 480 lb Bales and 1,000 Ha)
Country Mktg
Year
Area
Harvested
Beginning
Stocks
Production Imports Exports Use Loss Total Dom.
Cons.
Ending
Stocks
Australia
-4000004000000 2018/19
Benin
75000250100090 2018/19
Brazil
1,200000-20001,000025 2018/19
Bulgaria
0-40-40-4000 2018/19
Burkina
-8000000-8000 2018/19
Cameroon
2500050075020 2018/19
Chad
-5000000-500-60 2018/19
China
5000000500000 2018/19
Cote d'Ivoire
18000001800 2016/17
38000002018-39 2017/18
130001000753822 2018/19
Czech Republic
0-20-20-2000 2018/19
Egypt
00000000-4 2018/19
Germany
0-50-5-5-10000 2018/19
India
-1,50000000-1,50000 2018/19
Indonesia
0-3000-3000-300000 2018/19
Iran
00000000-5 2018/19
Foreign Agricultural Service/USDA 5 May 2019Office of Global Analysis
Summary of Changes in estimates and Forecasts from Last Month (Continued)
(1,000 480 lb Bales and 1,000 Ha)
Country Mktg
Year
Area
Harvested
Beginning
Stocks
Production Imports Exports Use Loss Total Dom.
Cons.
Ending
Stocks
Kazakhstan
00000000-2 2018/19
Kyrgyzstan
00000000-2 2018/19
Malaysia
-250000-25000 2018/19
Mali
-9000000-900-10 2018/19
Mexico
65000-1000-3500 2018/19
Mozambique
100001002005 2018/19
Netherlands
010101000 2016/17
110010011000 2017/18
215015016010 2018/19
Poland
0-40-40-4000 2018/19
Russia
0-300-300-30000 2018/19
Senegal
-1000-100-110-4 2018/19
South Africa
40000040-1 2018/19
Spain
1510010-250000 2018/19
Syria
-15000150000 2014/15
-450003000-150 2015/16
0000-4500-450 2016/17
-10000100000 2017/18
-251001015010-100 2018/19
Foreign Agricultural Service/USDA 6 May 2019Office of Global Analysis
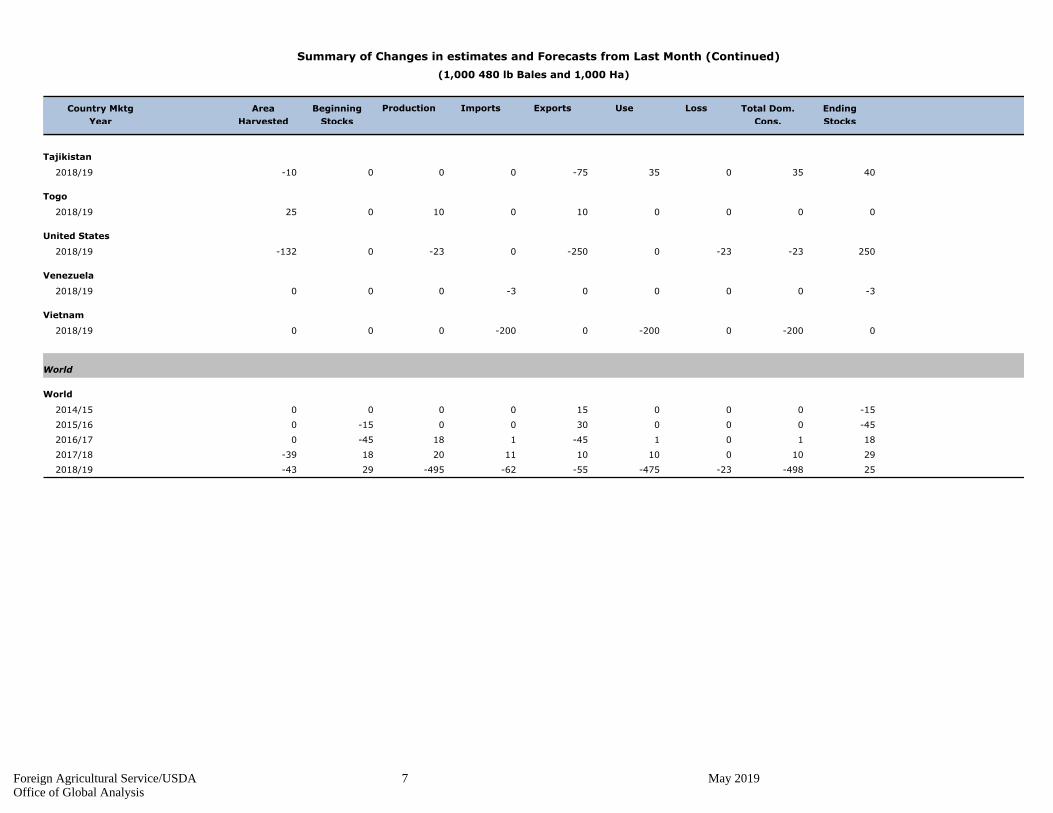
Summary of Changes in estimates and Forecasts from Last Month (Continued)
(1,000 480 lb Bales and 1,000 Ha)
Country Mktg
Year
Area
Harvested
Beginning
Stocks
Production Imports Exports Use Loss Total Dom.
Cons.
Ending
Stocks
Tajikistan
4035035-75000-10 2018/19
Togo
000010010025 2018/19
United States
250-23-230-2500-230-132 2018/19
Venezuela
-30000-3000 2018/19
Vietnam
0-2000-2000-200000 2018/19
World
World
-15000150000 2014/15
-450003000-150 2015/16
18101-45118-450 2016/17
291001010112018-39 2017/18
25-498-23-475-55-62-49529-43 2018/19
Foreign Agricultural Service/USDA 7 May 2019Office of Global Analysis

Table 01 Cotton World Supply, Use, and Trade (Season Beginning August 1)
(1000 MT)
2014/15 2015/16 2016/17 2017/18 2018/19
May
2019/20
Production none
6,423 India 5,639 5,879 6,314 5,552 6,205
6,532 China 4,790 4,953 5,987 6,042 6,042
3,553 United States 2,806 3,738 4,555 3,999 4,790
1,563 Brazil 1,289 1,528 2,007 2,787 2,613
2,308 Pakistan 1,524 1,676 1,785 1,676 1,742
697 Turkey 577 697 871 806 893
849 Uzbekistan 827 811 840 718 680
4,032 Other 3,483 3,944 4,589 4,206 4,350
25,957 Total 20,936 23,227 26,951 25,786 27,315
USE Dom. Consumption none
7,512 China 7,838 8,382 8,927 8,818 9,036
5,334 India 5,389 5,302 5,258 5,400 5,508
2,308 Pakistan 2,243 2,243 2,351 2,308 2,330
1,263 Bangladesh 1,372 1,481 1,633 1,742 1,829
893 Vietnam 980 1,176 1,459 1,524 1,655
1,393 Turkey 1,459 1,426 1,622 1,415 1,459
740 Brazil 675 697 740 762 784
4,993 Other 4,700 4,590 4,740 4,748 4,818
24,436 Total 24,655 25,296 26,730 26,717 27,418
Imports none
1,804 China 959 1,096 1,246 1,851 2,395
1,252 Bangladesh 1,388 1,481 1,655 1,742 1,829
931 Vietnam 1,002 1,197 1,524 1,546 1,655
728 Indonesia 640 738 762 697 697
800 Turkey 918 801 876 653 653
207 Pakistan 718 533 718 653 631
267 India 233 596 365 305 305
1,864 Other 1,858 1,765 1,791 1,704 1,709
7,852 Total 7,717 8,207 8,937 9,151 9,874
Exports none
2,449 United States 1,993 3,248 3,450 3,211 3,701
851 Brazil 939 607 909 1,263 1,785
914 India 1,255 991 1,128 914 980
523 Australia 616 812 852 914 523
163 Benin 142 174 218 288 305
254 Greece 209 221 234 272 299
185 Mali 218 239 283 283 294
2,475 Other 2,174 1,950 1,836 2,004 1,986
7,815 Total 7,544 8,243 8,911 9,151 9,873
Ending Stocks none
14,461 China 12,345 9,998 8,278 7,320 6,694
1,548 Brazil 1,243 1,509 1,885 2,658 2,718
2,305 India 1,534 1,716 2,009 1,551 1,573
795 United States 827 599 936 1,012 1,393
629 Pakistan 569 504 616 605 611
290 Bangladesh 330 355 404 431 458
347 Turkey 334 333 387 332 338
2,886 Other 2,477 2,497 3,138 2,739 2,694
23,262 Total 19,659 17,509 17,653 16,649 16,479
Foreign Agricultural Service/USDA 8 May 2019Office of Global Analysis
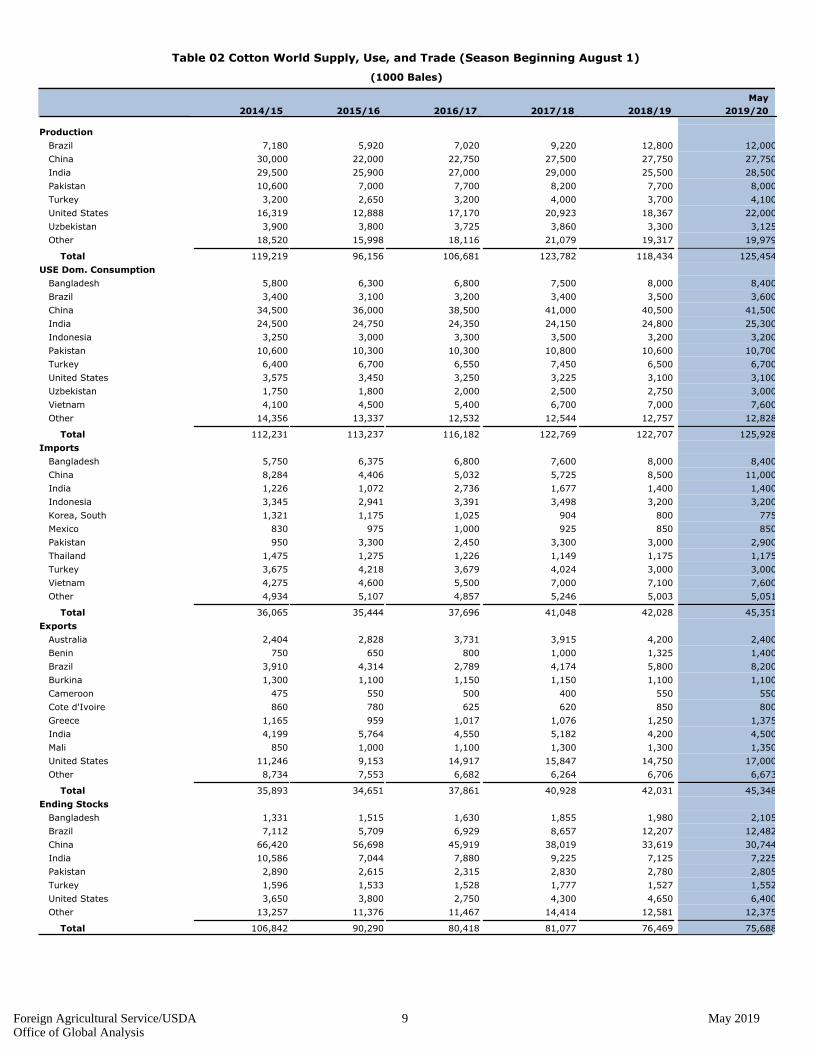
Table 02 Cotton World Supply, Use, and Trade (Season Beginning August 1)
(1000 Bales)
2014/15 2015/16 2016/17 2017/18 2018/19
May
2019/20
Production none
7,180 Brazil 5,920 7,020 9,220 12,800 12,000
30,000 China 22,000 22,750 27,500 27,750 27,750
29,500 India 25,900 27,000 29,000 25,500 28,500
10,600 Pakistan 7,000 7,700 8,200 7,700 8,000
3,200 Turkey 2,650 3,200 4,000 3,700 4,100
16,319 United States 12,888 17,170 20,923 18,367 22,000
3,900 Uzbekistan 3,800 3,725 3,860 3,300 3,125
18,520 Other 15,998 18,116 21,079 19,317 19,979
119,219 Total 96,156 106,681 123,782 118,434 125,454
USE Dom. Consumption none
5,800 Bangladesh 6,300 6,800 7,500 8,000 8,400
3,400 Brazil 3,100 3,200 3,400 3,500 3,600
34,500 China 36,000 38,500 41,000 40,500 41,500
24,500 India 24,750 24,350 24,150 24,800 25,300
3,250 Indonesia 3,000 3,300 3,500 3,200 3,200
10,600 Pakistan 10,300 10,300 10,800 10,600 10,700
6,400 Turkey 6,700 6,550 7,450 6,500 6,700
3,575 United States 3,450 3,250 3,225 3,100 3,100
1,750 Uzbekistan 1,800 2,000 2,500 2,750 3,000
4,100 Vietnam 4,500 5,400 6,700 7,000 7,600
14,356 Other 13,337 12,532 12,544 12,757 12,828
112,231 Total 113,237 116,182 122,769 122,707 125,928
Imports none
5,750 Bangladesh 6,375 6,800 7,600 8,000 8,400
8,284 China 4,406 5,032 5,725 8,500 11,000
1,226 India 1,072 2,736 1,677 1,400 1,400
3,345 Indonesia 2,941 3,391 3,498 3,200 3,200
1,321 Korea, South 1,175 1,025 904 800 775
830 Mexico 975 1,000 925 850 850
950 Pakistan 3,300 2,450 3,300 3,000 2,900
1,475 Thailand 1,275 1,226 1,149 1,175 1,175
3,675 Turkey 4,218 3,679 4,024 3,000 3,000
4,275 Vietnam 4,600 5,500 7,000 7,100 7,600
4,934 Other 5,107 4,857 5,246 5,003 5,051
36,065 Total 35,444 37,696 41,048 42,028 45,351
Exports none
2,404 Australia 2,828 3,731 3,915 4,200 2,400
750 Benin 650 800 1,000 1,325 1,400
3,910 Brazil 4,314 2,789 4,174 5,800 8,200
1,300 Burkina 1,100 1,150 1,150 1,100 1,100
475 Cameroon 550 500 400 550 550
860 Cote d'Ivoire 780 625 620 850 800
1,165 Greece 959 1,017 1,076 1,250 1,375
4,199 India 5,764 4,550 5,182 4,200 4,500
850 Mali 1,000 1,100 1,300 1,300 1,350
11,246 United States 9,153 14,917 15,847 14,750 17,000
8,734 Other 7,553 6,682 6,264 6,706 6,673
35,893 Total 34,651 37,861 40,928 42,031 45,348
Ending Stocks none
1,331 Bangladesh 1,515 1,630 1,855 1,980 2,105
7,112 Brazil 5,709 6,929 8,657 12,207 12,482
66,420 China 56,698 45,919 38,019 33,619 30,744
10,586 India 7,044 7,880 9,225 7,125 7,225
2,890 Pakistan 2,615 2,315 2,830 2,780 2,805
1,596 Turkey 1,533 1,528 1,777 1,527 1,552
3,650 United States 3,800 2,750 4,300 4,650 6,400
13,257 Other 11,376 11,467 14,414 12,581 12,375
106,842 Total 90,290 80,418 81,077 76,469 75,688
Foreign Agricultural Service/USDA 9 May 2019Office of Global Analysis
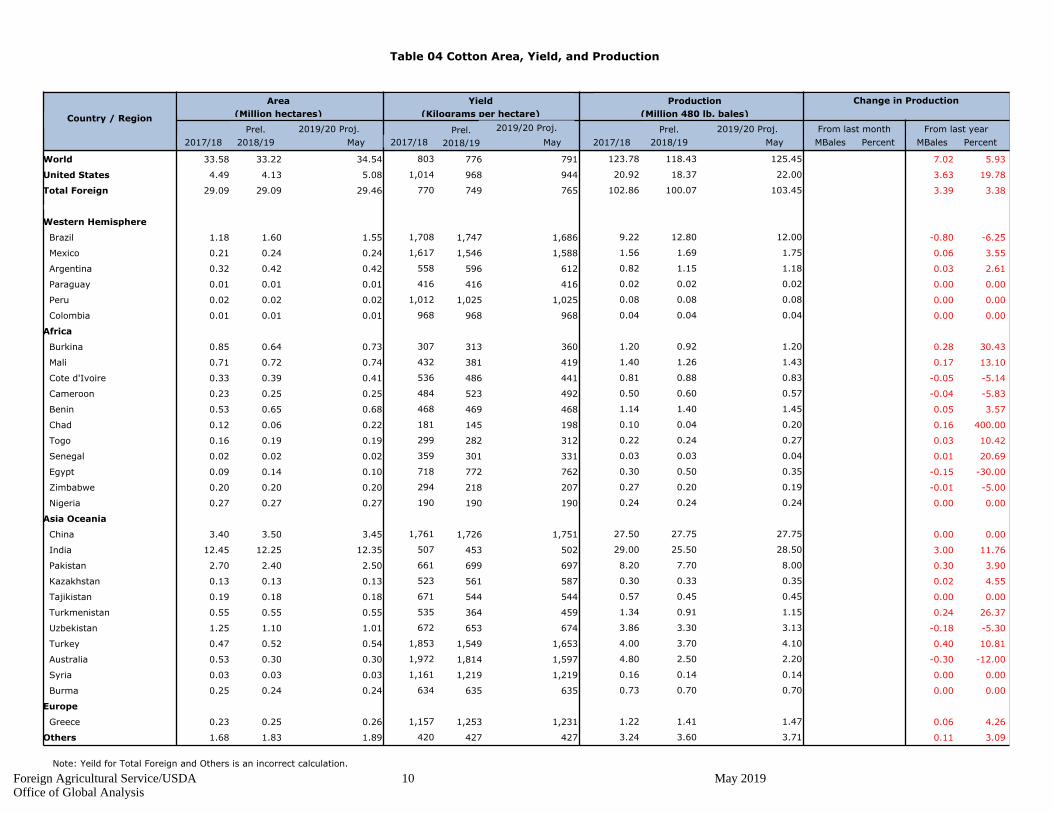
Table 04 Cotton Area, Yield, and Production
From last month From last year
MBalesPercent
Yield
(Kilograms per hectare)
May 2017/18 MBales
Country / Region
Area
(Million hectares)
Production
(Million 480 lb. bales)
Change in Production
2017/18
Prel.
2018/19
Prel.
2018/19 May
Prel.
2018/19 May Percent
2019/20 Proj.2019/20 Proj. 2019/20 Proj.
2017/18
33.58World 5.937.02125.4533.22 34.54 803 776 791 123.78 118.43
4.49United States 19.783.6322.004.13 5.08 1,014 968 944 20.92 18.37
29.09Total Foreign 3.383.39103.4529.09 29.46 770 749 765 102.86 100.07
none
Western Hemisphere
1.18 Brazil -6.25-0.8012.001.60 1.55 1,708 1,747 1,686 9.22 12.80
0.21 Mexico 3.550.061.750.24 0.24 1,617 1,546 1,588 1.56 1.69
0.32 Argentina 2.610.031.180.42 0.42 558 596 612 0.82 1.15
0.01 Paraguay 0.000.000.020.01 0.01 416 416 416 0.02 0.02
0.02 Peru 0.000.000.080.02 0.02 1,012 1,025 1,025 0.08 0.08
0.01 Colombia 0.000.000.040.01 0.01 968 968 968 0.04 0.04
Africa
0.85 Burkina 30.430.281.200.64 0.73 307 313 360 1.20 0.92
0.71 Mali 13.100.171.430.72 0.74 432 381 419 1.40 1.26
0.33 Cote d'Ivoire -5.14-0.050.830.39 0.41 536 486 441 0.81 0.88
0.23 Cameroon -5.83-0.040.570.25 0.25 484 523 492 0.50 0.60
0.53 Benin 3.570.051.450.65 0.68 468 469 468 1.14 1.40
0.12 Chad 400.000.160.200.06 0.22 181 145 198 0.10 0.04
0.16 Togo 10.420.030.270.19 0.19 299 282 312 0.22 0.24
0.02 Senegal 20.690.010.040.02 0.02 359 301 331 0.03 0.03
0.09 Egypt -30.00-0.150.350.14 0.10 718 772 762 0.30 0.50
0.20 Zimbabwe -5.00-0.010.190.20 0.20 294 218 207 0.27 0.20
0.27 Nigeria 0.000.000.240.27 0.27 190 190 190 0.24 0.24
Asia Oceania
3.40 China 0.000.0027.753.50 3.45 1,761 1,726 1,751 27.50 27.75
12.45 India 11.763.0028.5012.25 12.35 507 453 502 29.00 25.50
2.70 Pakistan 3.900.308.002.40 2.50 661 699 697 8.20 7.70
0.13 Kazakhstan 4.550.020.350.13 0.13 523 561 587 0.30 0.33
0.19 Tajikistan 0.000.000.450.18 0.18 671 544 544 0.57 0.45
0.55 Turkmenistan 26.370.241.150.55 0.55 535 364 459 1.34 0.91
1.25 Uzbekistan -5.30-0.183.131.10 1.01 672 653 674 3.86 3.30
0.47 Turkey 10.810.404.100.52 0.54 1,853 1,549 1,653 4.00 3.70
0.53 Australia -12.00-0.302.200.30 0.30 1,972 1,814 1,597 4.80 2.50
0.03 Syria 0.000.000.140.03 0.03 1,161 1,219 1,219 0.16 0.14
0.25 Burma 0.000.000.700.24 0.24 634 635 635 0.73 0.70
Europe
0.23 Greece 4.260.061.470.25 0.26 1,157 1,253 1,231 1.22 1.41
1.68Others 3.090.113.711.83 1.89 420 427 427 3.24 3.60
Note: Yeild for Total Foreign and Others is an incorrect calculation.
Foreign Agricultural Service/USDA 10 May 2019Office of Global Analysis

(1,000 HA and 1000 480-lb. Bales)
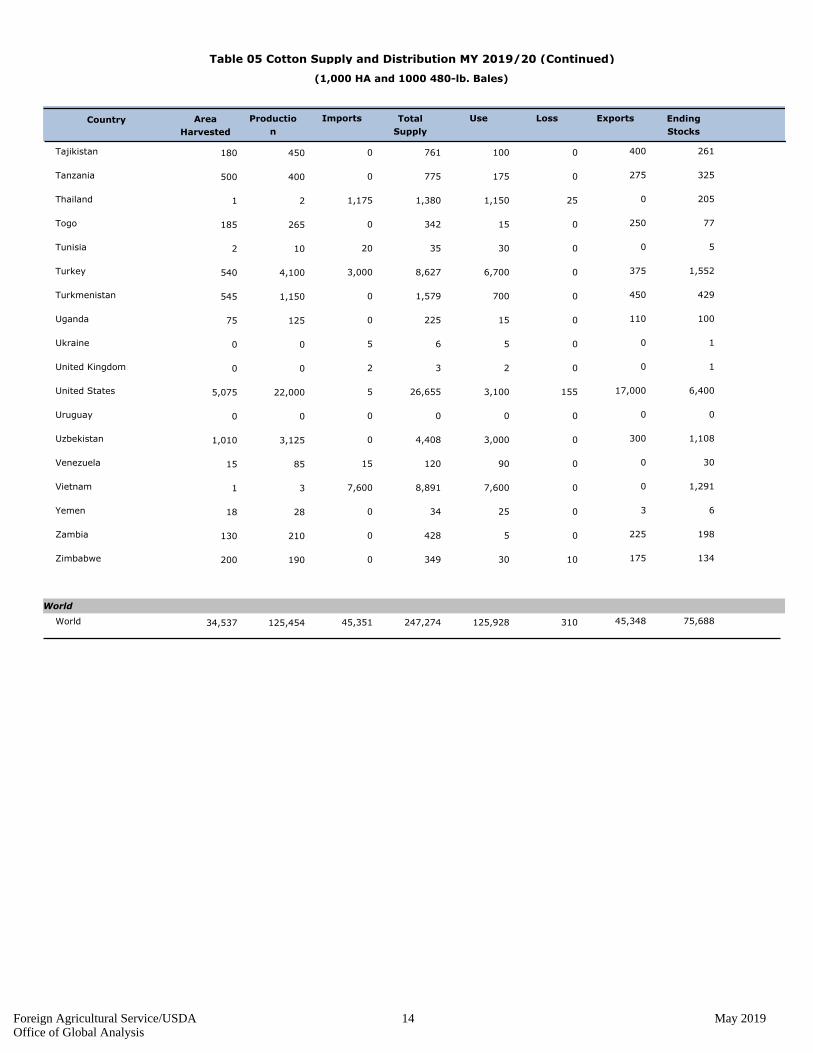
Table 05 Cotton Supply and Distribution MY 2019/20
Area
Harvested
Ending
Stocks
ExportsLossUseTotal
Supply
ImportsProductio
n
Country
0 35030826536 Afghanistan 17
0 001211 Albania 1
30 00303500 Algeria 5
10 00152252 Angola 7
15 52506251,8051,180420 Argentina 655
0 000000 Armenia 0
0 2,4000353,5042,200300 Australia 1,069
15 00151800 Austria 3
0 2500120520390135 Azerbaijan 150
40 00404800 Bahrain 8
8,400 0108,40010,51513544 Bangladesh 2,105
40 00404400 Belarus 4
30 100203600 Belgium-Luxembour 6
0 1,4000151,7531,450675 Benin 338
2 00101584 Bolivia 5
75 8,20003,60024,28212,0001,550 Brazil 12,482
25 003543102 Bulgaria 8
0 1,1000251,4201,200725 Burkina 295
75 50775994700240 Burma 214
1 001200 Cambodia 1
0 550020734565250 Cameroon 164
2 002200 Canada 0
0 3200443232 Central African Republic 12
0 175010261200220 Chad 76
0 000000 Chile 0
11,000 125041,50072,36927,7503,450 China 30,744
135 50170211409 Colombia 36
2 0017211530 Congo (Kinshasa) 4
42 00455711 Costa Rica 12
0 8000251,105830410 Cote d'Ivoire 280
0 000000 Croatia 0
10 00141644 Cuba 2
0 000000 Cyprus 0
7 007900 Czech Republic 2
0 000000 Denmark 0
Foreign Agricultural Service/USDA 11 May 2019Office of Global Analysis

(1,000 HA and 1000 480-lb. Bales)
Table 05 Cotton Supply and Distribution MY 2019/20 (Continued)
Area
Harvested
Ending
Stocks
ExportsLossUseTotal
Supply
ImportsProductio
n
Country
1 004534 Dominican Republic 1
75 008510693 Ecuador 21
525 225106501,109350100 Egypt 224
180 0018022411 El Salvador 44
10 00101200 Estonia 2
50 0025033820080 Ethiopia 88
40 50354800 France 8
110 2009013400 Germany 24
0 20010392816 Ghana 9
25 1,37550901,6091,470260 Greece 94
135 0013516432 Guatemala 29
0 1400171412 Guinea 3
5 00101157 Haiti 1
20 00242942 Honduras 5
0 000000 Hong Kong 0
3 300300 Hungary 0
1,400 4,500025,30037,02528,50012,350 India 7,225
3,200 503,2003,81633 Indonesia 611
300 0057572027580 Iran 145
35 0050731510 Iraq 23
0 000000 Ireland 0
2 500059456 Israel 9
170 5016519200 Italy 22
215 0021524900 Japan 34
0 275065473345128 Kazakhstan 133
15 0040582530 Kenya 18
95 001502055519 Korea, North 55
775 5077593200 Korea, South 152
0 1100013011018 Kyrgyzstan 20
7 106900 Latvia 2
5 005600 Lebanon 1
90 009011500 Lesotho 25
0 000000 Lithuania 0
5 005600 Macedonia 1
0 10020453020 Madagascar 15
Foreign Agricultural Service/USDA 12 May 2019Office of Global Analysis

(1,000 HA and 1000 480-lb. Bales)
Table 05 Cotton Supply and Distribution MY 2019/20 (Continued)
Area
Harvested
Ending
Stocks
ExportsLossUseTotal
Supply
ImportsProductio
n
Country
0 60051699080 Malawi 104
675 30003751,14000 Malaysia 465
0 1,3500251,9361,425740 Mali 561
120 0012014100 Mauritius 21
850 550252,0003,3201,750240 Mexico 745
70 00658200 Moldova 17
45 00505911 Morocco 9
0 11005200115125 Mozambique 85
15 00151700 Netherlands 2
0 90112104 Nicaragua 2
0 6031495 Niger 5
0 300200304235270 Nigeria 74
2,900 1502510,70013,6808,0002,500 Pakistan 2,805
0 000000 Panama 0
8 15012372111 Paraguay 10
250 503254138017 Peru 83
65 00658121 Philippines 16
12 00121500 Poland 3
180 0018021800 Portugal 38
1 001200 Romania 1
165 0017020600 Russia 36
0 3500403523 Senegal 5
8 0081000 Serbia 2
5 500700 Singapore 2
2 002300 Slovakia 1
6 006800 Slovenia 2
3 001011712 Somalia 1
30 125011044121545 South Africa 206
10 27504038530065 Spain 70
8 00131755 Sri Lanka 4
0 475075789600200 Sudan 239
0 000000 Sweden 0
2 002300 Switzerland 1
0 5006516414025 Syria 49
650 0065080200 Taiwan 152
Foreign Agricultural Service/USDA 13 May 2019Office of Global Analysis
(1,000 HA and 1000 480-lb. Bales)
Table 05 Cotton Supply and Distribution MY 2019/20 (Continued)
Area
Harvested
Ending
Stocks
ExportsLossUseTotal
Supply
ImportsProductio
n
Country
0 4000100761450180 Tajikistan 261
0 2750175775400500 Tanzania 325
1,175 0251,1501,38021 Thailand 205
0 250015342265185 Togo 77
20 003035102 Tunisia 5
3,000 37506,7008,6274,100540 Turkey 1,552
0 45007001,5791,150545 Turkmenistan 429
0 11001522512575 Uganda 100
5 005600 Ukraine 1
2 002300 United Kingdom 1
5 17,0001553,10026,65522,0005,075 United States 6,400
0 000000 Uruguay 0
0 30003,0004,4083,1251,010 Uzbekistan 1,108
15 00901208515 Venezuela 30
7,600 007,6008,89131 Vietnam 1,291
0 3025342818 Yemen 6
0 22505428210130 Zambia 198
0 1751030349190200 Zimbabwe 134
World
45,351 45,348310125,928247,274125,45434,537 World 75,688
Foreign Agricultural Service/USDA 14 May 2019Office of Global Analysis

(1000 MT and 1000 HA)
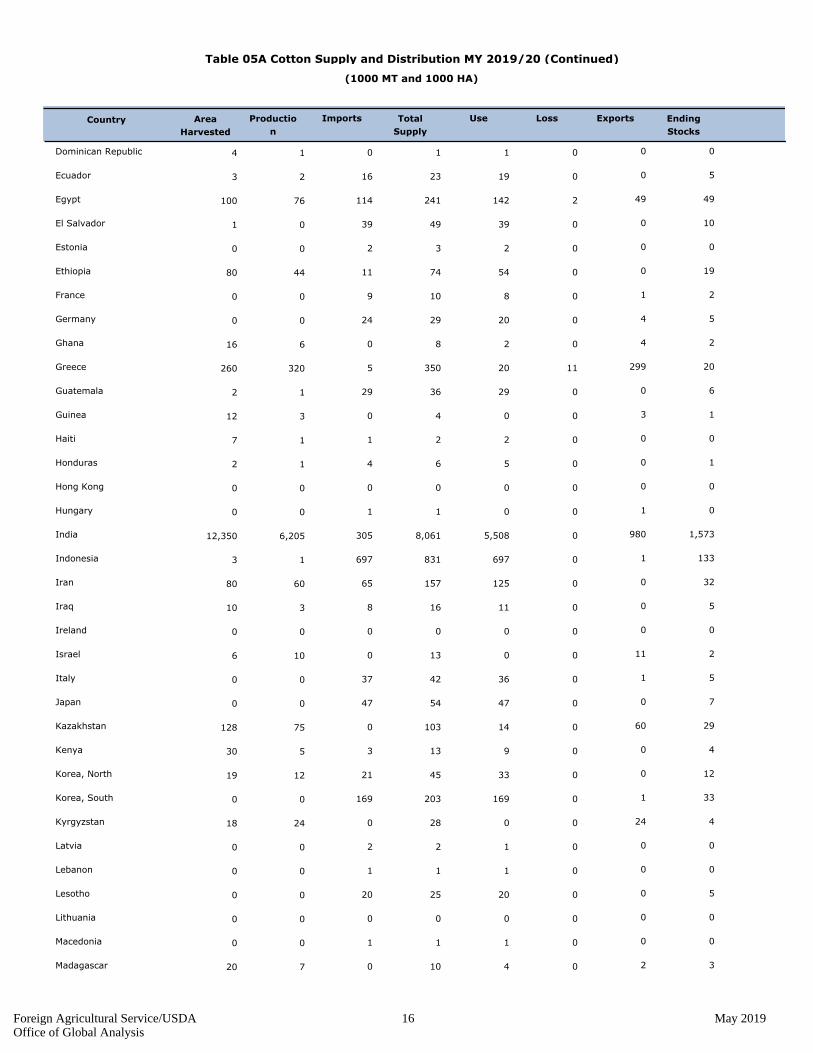
Table 05A Cotton Supply and Distribution MY 2019/20
Area
Harvested
Ending
Stocks
ExportsLossUseTotal
Supply
ImportsProductio
n
Country
0 807181436 Afghanistan 4
0 000001 Albania 0
7 007800 Algeria 1
2 003512 Angola 2
3 1140136393257420 Argentina 143
0 000000 Armenia 0
0 52308763479300 Australia 233
3 003400 Austria 1
0 5402611385135 Azerbaijan 33
9 0091000 Bahrain 2
1,829 021,8292,2892944 Bangladesh 458
9 0091000 Belarus 1
7 204800 Belgium-Luxembour 1
0 30503382316675 Benin 74
0 002324 Bolivia 1
16 1,78507845,2872,6131,550 Brazil 2,718
5 008922 Bulgaria 2
0 23905309261725 Burkina 64
16 10169216152240 Burma 47
0 000000 Cambodia 0
0 12004160123250 Cameroon 36
0 000000 Canada 0
0 70010732 Central African Republic 3
0 38025744220 Chad 17
0 000000 Chile 0
2,395 2709,03615,7576,0423,450 China 6,694
29 10374699 Colombia 8
0 0045330 Congo (Kinshasa) 1
9 00101201 Costa Rica 3
0 17405241181410 Cote d'Ivoire 61
0 000000 Croatia 0
2 003314 Cuba 0
0 000000 Cyprus 0
2 002200 Czech Republic 0
0 000000 Denmark 0
Foreign Agricultural Service/USDA 15 May 2019Office of Global Analysis
(1000 MT and 1000 HA)
Table 05A Cotton Supply and Distribution MY 2019/20 (Continued)
Area
Harvested
Ending
Stocks
ExportsLossUseTotal
Supply
ImportsProductio
n
Country
0 001114 Dominican Republic 0
16 00192323 Ecuador 5
114 49214224176100 Egypt 49
39 00394901 El Salvador 10
2 002300 Estonia 0
11 0054744480 Ethiopia 19
9 1081000 France 2
24 40202900 Germany 5
0 4028616 Ghana 2
5 2991120350320260 Greece 20
29 00293612 Guatemala 6
0 3004312 Guinea 1
1 002217 Haiti 0
4 005612 Honduras 1
0 000000 Hong Kong 0
1 100100 Hungary 0
305 98005,5088,0616,20512,350 India 1,573
697 1069783113 Indonesia 133
65 001251576080 Iran 32
8 001116310 Iraq 5
0 000000 Ireland 0
0 110013106 Israel 2
37 10364200 Italy 5
47 00475400 Japan 7
0 6001410375128 Kazakhstan 29
3 00913530 Kenya 4
21 0033451219 Korea, North 12
169 1016920300 Korea, South 33
0 2400282418 Kyrgyzstan 4
2 001200 Latvia 0
1 001100 Lebanon 0
20 00202500 Lesotho 5
0 000000 Lithuania 0
1 001100 Macedonia 0
0 20410720 Madagascar 3
Foreign Agricultural Service/USDA 16 May 2019Office of Global Analysis

(1000 MT and 1000 HA)
Table 05A Cotton Supply and Distribution MY 2019/20 (Continued)
Area
Harvested
Ending
Stocks
ExportsLossUseTotal
Supply
ImportsProductio
n
Country
0 1301372080 Malawi 23
147 6508224800 Malaysia 101
0 29405422310740 Mali 122
26 00263100 Mauritius 5
185 1205435723381240 Mexico 162
15 00141800 Moldova 4
10 00111301 Morocco 2
0 24014425125 Mozambique 19
3 003400 Netherlands 0
0 200324 Nicaragua 0
0 101325 Niger 1
0 70446651270 Nigeria 16
631 3352,3302,9781,7422,500 Pakistan 611
0 000000 Panama 0
2 3038511 Paraguay 2
54 1071901717 Peru 18
14 00141801 Philippines 3
3 003300 Poland 1
39 00394700 Portugal 8
0 000000 Romania 0
36 00374500 Russia 8
0 8009823 Senegal 1
2 002200 Serbia 0
1 100200 Singapore 0
0 000100 Slovakia 0
1 001200 Slovenia 0
1 0022212 Somalia 0
7 27024964745 South Africa 45
2 6009846565 Spain 15
2 003415 Sri Lanka 1
0 103016172131200 Sudan 52
0 000000 Sweden 0
0 000100 Switzerland 0
0 11014363025 Syria 11
142 0014217500 Taiwan 33
Foreign Agricultural Service/USDA 17 May 2019Office of Global Analysis

(1000 MT and 1000 HA)
Table 05A Cotton Supply and Distribution MY 2019/20 (Continued)
Area
Harvested
Ending
Stocks
ExportsLossUseTotal
Supply
ImportsProductio
n
Country
0 8702216698180 Tajikistan 57
0 6003816987500 Tanzania 71
256 0525030001 Thailand 45
0 54037458185 Togo 17
4 007822 Tunisia 1
653 8201,4591,878893540 Turkey 338
0 980152344250545 Turkmenistan 93
0 2403492775 Uganda 22
1 001100 Ukraine 0
0 000100 United Kingdom 0
1 3,701346755,8044,7905,075 United States 1,393
0 000000 Uruguay 0
0 6506539606801,010 Uzbekistan 241
3 0020261915 Venezuela 7
1,655 001,6551,93611 Vietnam 281
0 1057618 Yemen 1
0 49019346130 Zambia 43
0 38277641200 Zimbabwe 29
World
9,874 9,8736727,41853,83827,31534,537 World 16,479
Foreign Agricultural Service/USDA 18 May 2019Office of Global Analysis
(1,000 HA and 1000 480-lb. Bales)
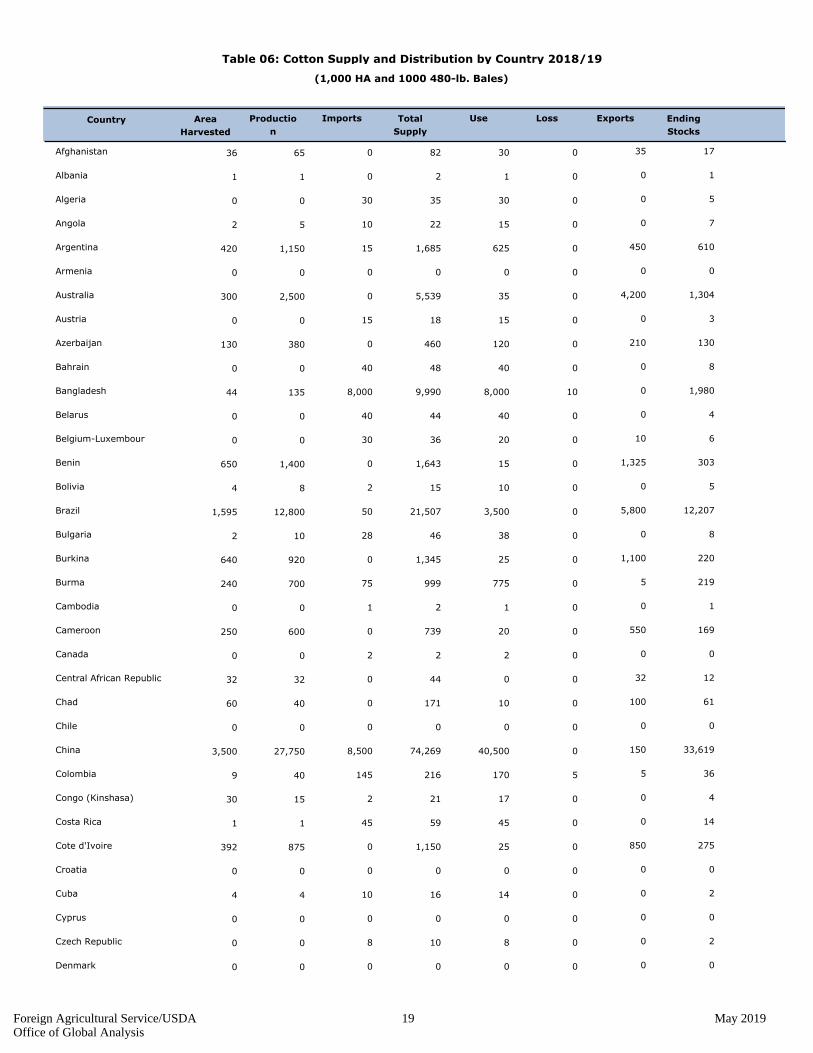
Table 06: Cotton Supply and Distribution by Country 2018/19
Area
Harvested
Ending
Stocks
ExportsLossUseTotal
Supply
ImportsProductio
n
Country
0 35030826536 Afghanistan 17
0 001211 Albania 1
30 00303500 Algeria 5
10 00152252 Angola 7
15 45006251,6851,150420 Argentina 610
0 000000 Armenia 0
0 4,2000355,5392,500300 Australia 1,304
15 00151800 Austria 3
0 2100120460380130 Azerbaijan 130
40 00404800 Bahrain 8
8,000 0108,0009,99013544 Bangladesh 1,980
40 00404400 Belarus 4
30 100203600 Belgium-Luxembour 6
0 1,3250151,6431,400650 Benin 303
2 00101584 Bolivia 5
50 5,80003,50021,50712,8001,595 Brazil 12,207
28 003846102 Bulgaria 8
0 1,1000251,345920640 Burkina 220
75 50775999700240 Burma 219
1 001200 Cambodia 1
0 550020739600250 Cameroon 169
2 002200 Canada 0
0 3200443232 Central African Republic 12
0 1000101714060 Chad 61
0 000000 Chile 0
8,500 150040,50074,26927,7503,500 China 33,619
145 55170216409 Colombia 36
2 0017211530 Congo (Kinshasa) 4
45 00455911 Costa Rica 14
0 8500251,150875392 Cote d'Ivoire 275
0 000000 Croatia 0
10 00141644 Cuba 2
0 000000 Cyprus 0
8 0081000 Czech Republic 2
0 000000 Denmark 0
Foreign Agricultural Service/USDA 19 May 2019Office of Global Analysis

(1,000 HA and 1000 480-lb. Bales)
Table 06: Cotton Supply and Distribution by Country 2018/19 (Continued)
Area
Harvested
Ending
Stocks
ExportsLossUseTotal
Supply
ImportsProductio
n
Country
1 004534 Dominican Republic 1
80 008510793 Ecuador 22
475 300106251,169500141 Egypt 234
175 0017021311 El Salvador 43
10 00101200 Estonia 2
60 0024032817565 Ethiopia 88
40 30405100 France 8
120 20010014400 Germany 24
0 15010362816 Ghana 11
25 1,25050901,5041,410245 Greece 114
130 0013516132 Guatemala 26
0 1400171412 Guinea 3
5 00101157 Haiti 1
20 00242942 Honduras 5
0 000000 Hong Kong 0
3 300300 Hungary 0
1,400 4,200024,80036,12525,50012,250 India 7,125
3,200 503,2003,81833 Indonesia 613
300 0057572027580 Iran 145
35 0050731510 Iraq 23
0 000000 Ireland 0
2 500466456 Israel 12
170 5016519200 Italy 22
225 0023026400 Japan 34
0 275065468330128 Kazakhstan 128
15 0040582530 Kenya 18
95 001502055519 Korea, North 55
800 5082598700 Korea, South 157
0 1000012010518 Kyrgyzstan 20
7 106900 Latvia 2
5 005600 Lebanon 1
85 008511000 Lesotho 25
0 000000 Lithuania 0
5 005600 Macedonia 1
0 10020453020 Madagascar 15
Foreign Agricultural Service/USDA 20 May 2019Office of Global Analysis

(1,000 HA and 1000 480-lb. Bales)
Table 06: Cotton Supply and Distribution by Country 2018/19 (Continued)
Area
Harvested
Ending
Stocks
ExportsLossUseTotal
Supply
ImportsProductio
n
Country
0 50051349070 Malawi 79
650 30003501,11500 Malaysia 465
0 1,3000251,8361,260720 Mali 511
120 0012014100 Mauritius 21
850 500251,9503,1951,690238 Mexico 720
60 00607200 Moldova 12
45 00455811 Morocco 13
0 11005200130125 Mozambique 85
16 00151700 Netherlands 2
0 90112104 Nicaragua 2
0 6031495 Niger 5
10 300200299235270 Nigeria 69
3,000 1252510,60013,5307,7002,400 Pakistan 2,780
0 000000 Panama 0
5 13012332111 Paraguay 8
250 503254138017 Peru 83
65 00657921 Philippines 14
12 00121500 Poland 3
180 3018022100 Portugal 38
1 001200 Romania 1
180 0018022100 Russia 41
0 2502322921 Senegal 5
8 0081000 Serbia 2
5 500700 Singapore 2
2 001200 Slovakia 1
6 006800 Slovenia 2
3 001011712 Somalia 1
35 110010541121944 South Africa 196
10 25004036530065 Spain 75
8 00131755 Sri Lanka 4
0 375075639500180 Sudan 189
0 000000 Sweden 0
2 002300 Switzerland 1
0 9006517914025 Syria 24
650 0065080200 Taiwan 152
Foreign Agricultural Service/USDA 21 May 2019Office of Global Analysis

(1,000 HA and 1000 480-lb. Bales)
Table 06: Cotton Supply and Distribution by Country 2018/19 (Continued)
Area
Harvested
Ending
Stocks
ExportsLossUseTotal
Supply
ImportsProductio
n
Country
0 350085746450180 Tajikistan 311
0 1250175675425500 Tanzania 375
1,175 0251,1501,37821 Thailand 203
0 210015302240185 Togo 77
20 003035102 Tunisia 5
3,000 45006,5008,4773,700520 Turkey 1,527
0 45006751,554910545 Turkmenistan 429
0 11001522512075 Uganda 100
5 005600 Ukraine 1
2 002300 United Kingdom 1
5 14,7501723,10022,67218,3674,130 United States 4,650
0 000000 Uruguay 0
0 80002,7504,8333,3001,100 Uzbekistan 1,283
12 001001208515 Venezuela 20
7,100 007,0008,28831 Vietnam 1,288
0 2025332818 Yemen 6
0 22505448200125 Zambia 218
0 1751030374200200 Zimbabwe 159
World
42,028 42,031332122,707241,539118,43433,215 World 76,469
Foreign Agricultural Service/USDA 22 May 2019Office of Global Analysis

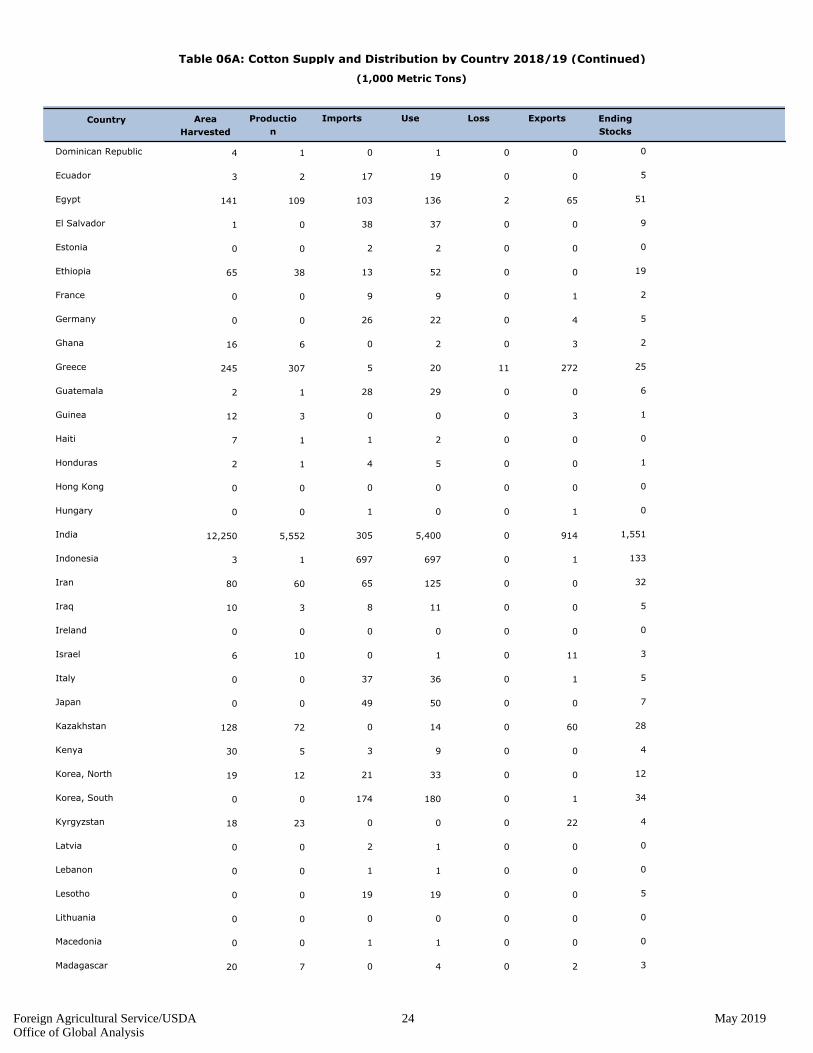
(1,000 Metric Tons)
Table 06A: Cotton Supply and Distribution by Country 2018/19
Area
Harvested
Ending
Stocks
ExportsLossUseImportsProductio
n
Country
0 48071436 Afghanistan
0 000001 Albania
7 100700 Algeria
2 200312 Angola
3 133980136250420 Argentina
0 000000 Armenia
0 28491408544300 Australia
3 100300 Austria
0 284602683130 Azerbaijan
9 200900 Bahrain
1,742 431021,7422944 Bangladesh
9 100900 Belarus
7 120400 Belgium-Luxembour
0 6628803305650 Benin
0 100224 Bolivia
11 2,6581,26307622,7871,595 Brazil
6 200822 Bulgaria
0 4823905200640 Burkina
16 4810169152240 Burma
0 000000 Cambodia
0 3712004131250 Cameroon
0 000000 Canada
0 3700732 Central African Republic
0 132202960 Chad
0 000000 Chile
1,851 7,3203308,8186,0423,500 China
32 8113799 Colombia
0 1004330 Congo (Kinshasa)
10 3001001 Costa Rica
0 6018505191392 Cote d'Ivoire
0 000000 Croatia
2 000314 Cuba
0 000000 Cyprus
2 000200 Czech Republic
0 000000 Denmark
Foreign Agricultural Service/USDA 23 May 2019Office of Global Analysis
(1,000 Metric Tons)
Table 06A: Cotton Supply and Distribution by Country 2018/19 (Continued)
Area
Harvested
Ending
Stocks
ExportsLossUseImportsProductio
n
Country
0 000114 Dominican Republic
17 5001923 Ecuador
103 51652136109141 Egypt
38 9003701 El Salvador
2 000200 Estonia
13 1900523865 Ethiopia
9 210900 France
26 5402200 Germany
0 2302616 Ghana
5 252721120307245 Greece
28 6002912 Guatemala
0 1300312 Guinea
1 000217 Haiti
4 100512 Honduras
0 000000 Hong Kong
1 010000 Hungary
305 1,55191405,4005,55212,250 India
697 1331069713 Indonesia
65 32001256080 Iran
8 50011310 Iraq
0 000000 Ireland
0 31101106 Israel
37 5103600 Italy
49 7005000 Japan
0 286001472128 Kazakhstan
3 4009530 Kenya
21 1200331219 Korea, North
174 341018000 Korea, South
0 422002318 Kyrgyzstan
2 000100 Latvia
1 000100 Lebanon
19 5001900 Lesotho
0 000000 Lithuania
1 000100 Macedonia
0 3204720 Madagascar
Foreign Agricultural Service/USDA 24 May 2019Office of Global Analysis
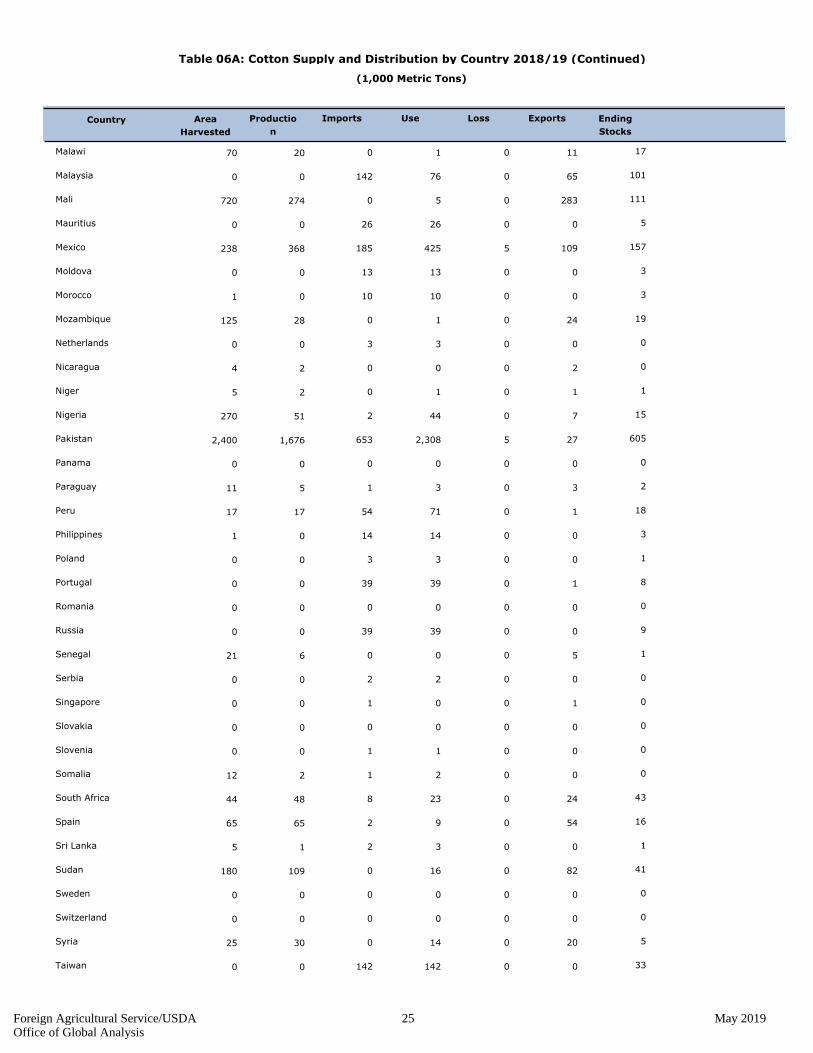
(1,000 Metric Tons)
Table 06A: Cotton Supply and Distribution by Country 2018/19 (Continued)
Area
Harvested
Ending
Stocks
ExportsLossUseImportsProductio
n
Country
0 1711012070 Malawi
142 1016507600 Malaysia
0 11128305274720 Mali
26 5002600 Mauritius
185 1571095425368238 Mexico
13 3001300 Moldova
10 3001001 Morocco
0 19240128125 Mozambique
3 000300 Netherlands
0 020024 Nicaragua
0 110125 Niger
2 15704451270 Nigeria
653 6052752,3081,6762,400 Pakistan
0 000000 Panama
1 2303511 Paraguay
54 1810711717 Peru
14 3001401 Philippines
3 100300 Poland
39 8103900 Portugal
0 000000 Romania
39 9003900 Russia
0 1500621 Senegal
2 000200 Serbia
1 010000 Singapore
0 000000 Slovakia
1 000100 Slovenia
1 0002212 Somalia
8 43240234844 South Africa
2 1654096565 Spain
2 100315 Sri Lanka
0 4182016109180 Sudan
0 000000 Sweden
0 000000 Switzerland
0 5200143025 Syria
142 330014200 Taiwan
Foreign Agricultural Service/USDA 25 May 2019Office of Global Analysis
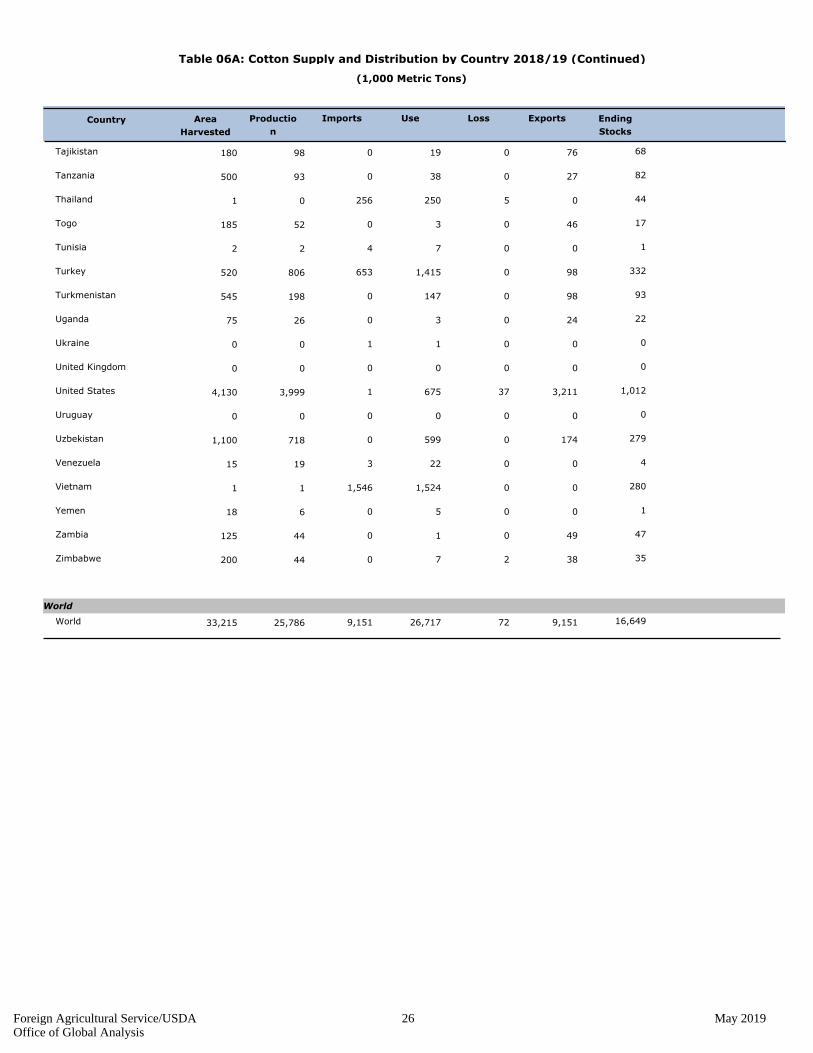
(1,000 Metric Tons)
Table 06A: Cotton Supply and Distribution by Country 2018/19 (Continued)
Area
Harvested
Ending
Stocks
ExportsLossUseImportsProductio
n
Country
0 687601998180 Tajikistan
0 822703893500 Tanzania
256 440525001 Thailand
0 17460352185 Togo
4 100722 Tunisia
653 3329801,415806520 Turkey
0 93980147198545 Turkmenistan
0 2224032675 Uganda
1 000100 Ukraine
0 000000 United Kingdom
1 1,0123,211376753,9994,130 United States
0 000000 Uruguay
0 27917405997181,100 Uzbekistan
3 400221915 Venezuela
1,546 280001,52411 Vietnam
0 1005618 Yemen
0 47490144125 Zambia
0 35382744200 Zimbabwe
World
9,151 16,6499,1517226,71725,78633,215 World
Foreign Agricultural Service/USDA 26 May 2019Office of Global Analysis
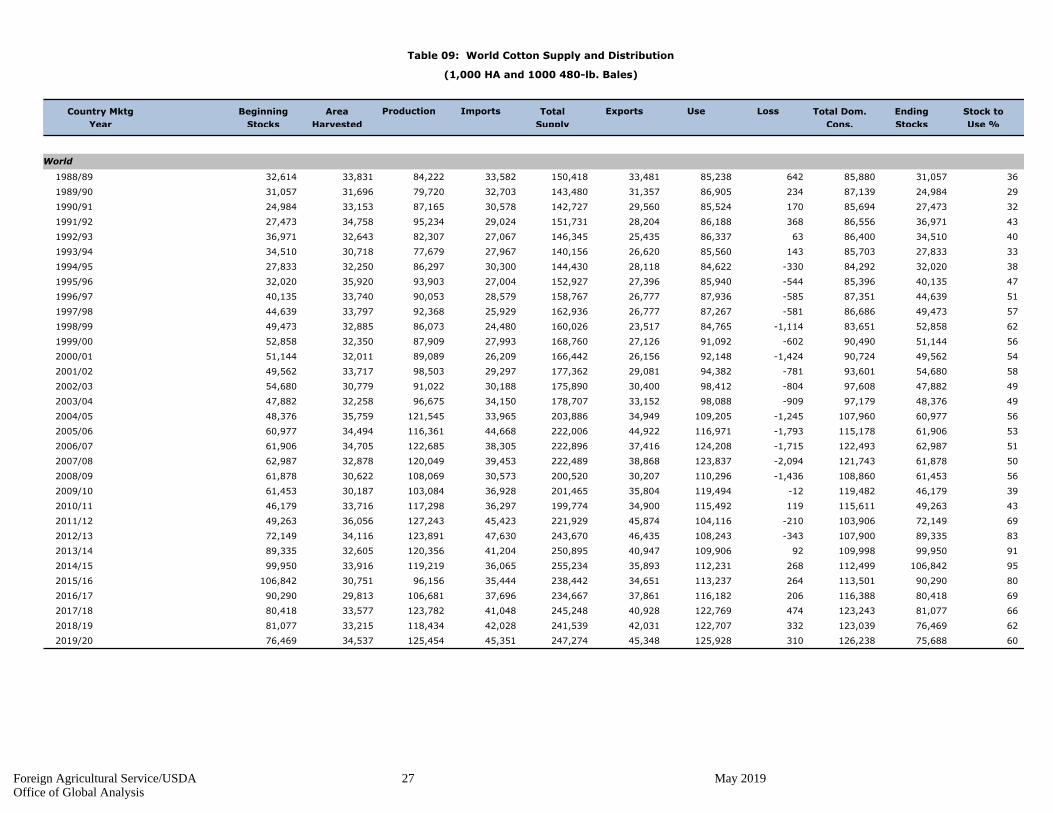
Table 09: World Cotton Supply and Distribution
(1,000 HA and 1000 480-lb. Bales)
Country Mktg
Year
Beginning
Stocks
Area
Harvested
Production Imports Total
Supply
Exports Use Loss Total Dom.
Cons.
Ending
Stocks
Stock to
Use %
World
3631,05785,88064285,23833,481150,41833,58284,22233,83132,614 1988/89
2924,98487,13923486,90531,357143,48032,70379,72031,69631,057 1989/90
3227,47385,69417085,52429,560142,72730,57887,16533,15324,984 1990/91
4336,97186,55636886,18828,204151,73129,02495,23434,75827,473 1991/92
4034,51086,4006386,33725,435146,34527,06782,30732,64336,971 1992/93
3327,83385,70314385,56026,620140,15627,96777,67930,71834,510 1993/94
3832,02084,292-33084,62228,118144,43030,30086,29732,25027,833 1994/95
4740,13585,396-54485,94027,396152,92727,00493,90335,92032,020 1995/96
5144,63987,351-58587,93626,777158,76728,57990,05333,74040,135 1996/97
5749,47386,686-58187,26726,777162,93625,92992,36833,79744,639 1997/98
6252,85883,651-1,11484,76523,517160,02624,48086,07332,88549,473 1998/99
5651,14490,490-60291,09227,126168,76027,99387,90932,35052,858 1999/00
5449,56290,724-1,42492,14826,156166,44226,20989,08932,01151,144 2000/01
5854,68093,601-78194,38229,081177,36229,29798,50333,71749,562 2001/02
4947,88297,608-80498,41230,400175,89030,18891,02230,77954,680 2002/03
4948,37697,179-90998,08833,152178,70734,15096,67532,25847,882 2003/04
5660,977107,960-1,245109,20534,949203,88633,965121,54535,75948,376 2004/05
5361,906115,178-1,793116,97144,922222,00644,668116,36134,49460,977 2005/06
5162,987122,493-1,715124,20837,416222,89638,305122,68534,70561,906 2006/07
5061,878121,743-2,094123,83738,868222,48939,453120,04932,87862,987 2007/08
5661,453108,860-1,436110,29630,207200,52030,573108,06930,62261,878 2008/09
3946,179119,482-12119,49435,804201,46536,928103,08430,18761,453 2009/10
4349,263115,611119115,49234,900199,77436,297117,29833,71646,179 2010/11
6972,149103,906-210104,11645,874221,92945,423127,24336,05649,263 2011/12
8389,335107,900-343108,24346,435243,67047,630123,89134,11672,149 2012/13
9199,950109,99892109,90640,947250,89541,204120,35632,60589,335 2013/14
95106,842112,499268112,23135,893255,23436,065119,21933,91699,950 2014/15
8090,290113,501264113,23734,651238,44235,44496,15630,751106,842 2015/16
6980,418116,388206116,18237,861234,66737,696106,68129,81390,290 2016/17
6681,077123,243474122,76940,928245,24841,048123,78233,57780,418 2017/18
6276,469123,039332122,70742,031241,53942,028118,43433,21581,077 2018/19
6075,688126,238310125,92845,348247,27445,351125,45434,53776,469 2019/20
Foreign Agricultural Service/USDA 27 May 2019Office of Global Analysis

Table 10: United States Cotton Supply and Distribution
(1,000 HA and 1000 480-lb. Bales)
Country Mktg
Year
Area
Harvested
Yield Beginning
Stocks
Production Imports Total
Supply
Exports Use Loss Ending
Stocks
Stock to
Use %
United States
517,0921657,7826,14821,187515,4115,7716944,835 1988/89
183,000-1638,7597,69419,290212,1967,0926883,860 1989/90
142,344-2858,6577,79318,509415,5053,0007114,748 1990/91
233,70489,6136,64619,9711317,6142,3447315,245 1991/92
304,662-19010,2505,20119,923116,2183,7047854,501 1992/93
203,530-810,4186,86220,802616,1344,6626795,173 1993/94
132,650-3811,1989,40223,2122019,6623,5307945,391 1994/95
142,6092710,6477,67520,95840817,9002,6506026,478 1995/96
223,971-811,1266,86521,95440318,9422,6097915,216 1996/97
213,8874111,3497,50022,7771318,7933,9717545,425 1997/98
273,939-39410,4014,29818,24443913,9183,8877014,324 1998/99
233,91514510,1946,75021,0049716,9683,9396805,433 1999/00
386,000-4838,8626,74021,1191617,1883,9157085,282 2000/01
407,4481807,69611,00026,3242120,3036,0007905,596 2001/02
285,3851667,27311,90024,7246717,2097,4487465,025 2002/03
173,4502116,26613,75823,6854518,2555,3858184,858 2003/04
265,4951086,69114,43626,7302923,2513,4509585,284 2004/05
266,069-2005,87117,67329,4132823,8905,4959315,586 2005/06
539,4793034,93512,95927,6761921,5886,0699125,152 2006/07
5510,0514294,58413,63428,6981219,2079,4799854,245 2007/08
386,337-2633,54113,26122,876012,82510,0519123,063 2008/09
192,947-143,55012,03718,520012,1836,3378703,049 2009/10
142,6001823,90014,37621,058918,1022,9479104,330 2010/11
223,350-1723,30011,71418,1921915,5732,6008863,829 2011/12
233,8003483,50013,02620,6741017,3143,3509993,772 2012/13
172,3502923,55010,53016,7221312,9093,8009213,051 2013/14
253,6502103,57511,24618,6811216,3192,3509393,785 2014/15
303,8001683,4509,15316,5713312,8883,6508593,268 2015/16
152,750603,25014,91720,977717,1703,8009723,848 2016/17
234,3003043,22515,84723,676320,9232,7501,0144,492 2017/18
264,6501723,10014,75022,672518,3674,3009684,130 2018/19
326,4001553,10017,00026,655522,0004,6509445,075 2019/20
Foreign Agricultural Service/USDA 28 May 2019Office of Global Analysis

Table 11: Foreign Cotton Supply and Distribution
(1,000 HA and 1000 480-lb. Bales)
Country Mktg
Year
Area
Harvested
Yield Beginning
Stocks
Production Imports Total
Supply
Exports Use Loss Ending
Stocks
Total Foreign
23,96547777,45627,333129,23133,57768,81126,84351728,996 1988/89
21,98439778,14623,663124,19032,70167,52423,96552827,836 1989/90
25,12945576,86721,767124,21830,57471,66021,98454928,405 1990/91
33,26736076,57521,558131,76029,01177,62025,12957329,513 1991/92
29,84825376,08720,234126,42227,06666,08933,26751128,142 1992/93
24,30315175,14219,758119,35427,96161,54529,84852525,545 1993/94
29,370-29273,42418,716121,21830,28066,63524,30354026,859 1994/95
37,526-57175,29319,721131,96926,59676,00329,37056229,442 1995/96
40,668-57776,81019,912136,81328,17671,11137,52654328,524 1996/97
45,586-62275,91819,277140,15925,91673,57540,66856528,372 1997/98
48,919-72074,36419,219141,78224,04172,15545,58655028,561 1998/99
47,229-74780,89820,376147,75627,89670,94148,91957426,917 1999/00
43,562-94183,28619,416145,32326,19371,90147,22958626,729 2000/01
47,232-96186,68618,081151,03829,27678,20043,56260528,121 2001/02
42,497-97091,13918,500151,16630,12173,81347,23262425,754 2002/03
44,926-1,12091,82219,394155,02234,10578,42042,49762327,400 2003/04
55,482-1,353102,51420,513177,15633,93698,29444,92670230,475 2004/05
55,837-1,593111,10027,249192,59344,64092,47155,48269628,908 2005/06
53,508-2,018119,27324,457195,22038,286101,09755,83774529,553 2006/07
51,827-2,523119,25325,234193,79139,441100,84253,50876728,633 2007/08
55,116-1,173106,75516,946177,64430,57395,24451,82775227,559 2008/09
43,2322115,94423,767182,94536,92890,90155,11672927,138 2009/10
46,663-63111,59220,524178,71636,28899,19643,23273529,386 2010/11
68,799-38100,81634,160203,73745,404111,67046,66375432,227 2011/12
85,535-691104,74333,409222,99647,620106,57768,79976530,344 2012/13
97,600-200106,35630,417234,17341,191107,44785,53579229,554 2013/14
103,19258108,65624,647236,55336,053102,90097,60074430,131 2014/15
86,49096109,78725,498221,87135,41183,268103,19266027,483 2015/16
77,668146112,93222,944213,69037,68989,51186,49075125,965 2016/17
76,777170119,54425,081221,57241,045102,85977,66877029,085 2017/18
71,819160119,60727,281218,86742,023100,06776,77774929,085 2018/19
69,288155122,82828,348220,61945,346103,45471,81976529,462 2019/20
Foreign Agricultural Service/USDA 29 May 2019Office of Global Analysis