council - feb 15 - 2019 budget
TRANSCRIPT

Appendix 1
FINAL BUDGET 2019
COUNCIL
February 15, 2019

INTRODUCTION
The Municipal Act requires local municipalities to prepare and adopt a budget including estimates of all sums required during the year for the purposes of the municipality. Municipalities must adopt a balanced budget.
The budget is developed to maintain service levels established by Council. The budget itself is developed utilizing an intricate forecasting model. Various financial tools are used to increase accuracy, including the utilization of extensive historical data, trend identification, and various costing methods and industry specific comparators.
The budget serves many purposes for the municipality. It provides a financial framework within which municipal departments conduct their operations and determines capital project selection and implementation. Amounts included within the budget are utilized to track financial variances against actual results throughout the fiscal year for accountability.
The budget determines the amount of revenue that is required to cover budgeted expenditures for the year. Property tax rates are established to generate the tax revenue portion of the approved budget.
BUDGET PROCESS TO DATE
The process was executed as follows:
1. The Senior Management Team of the municipality developed the contents of the operating and capital budgets to reflect service level continuity and sustainable asset management, consistent with the strategic direction provided by Council.
2. January 22/2019 Budget Presentation to Committee of the Whole (COW) Operating
Combined draft operating & capital levy increase was presented to Committee of the Whole on January 22/2019 at 5.12% - $1.61/$100,000 of residential CVA.
Operating: .12% - ($4.18)/$100,000 of residential CVA
Capital: 5.00% - $5.79/$100,000 of residential CVA
The increase in the 2019 draft-operating budget over the 2018 final operating budget is due to the following Programs/Projects/Initiatives shown below for Committee/Council consideration ($113,000 = 1%)
Staff have added additional initiatives for Committee/Council consideration. If approved, these additional initiatives would increase the operating levy to 6.56% - $2.72 / $100,000 of residential CVA (1.56% operating levy plus 5.00 capital levy)
1

Amount 2019 Expenditure $113,000 = "+/‐"
1%
$13,940 New Council meeting webcasting service 0.12%
$49,500 New Township Website 0.44%
$104,600 New Public Works asset management system 0.92%
$60,000 New electronic content management system 0.53%
$12,500 Increased cyber security/disaster recovery/business continuity 0.11%
$125,000 Formation of Minett joint steering committee 1.10%
$350,000 Increase in legal and insurance costs 3.08%
$219,000 Increase to Township reserves for replacement of/or new capital infrastructure 1.93%
$10,000 Increase in grants 0.09%
($155,000) Increase in non‐tax revenue ‐1.37%
($208,322) Net decrease in other operating expenses ‐1.83%
$581,218 2019 Draft Operating Budget Increase over 2018 Final Operating Budget (budget intro)
5.12%
2019 New Township Initiatives to be Considered by Committee/Council
New Planner/GIS technician for additional planning matters and asset management analysis
0.70%
New Chief Training officer 0.74%
163,197
Total additional levy increase for Township new initiatives 1.44%
$744,415 Total 2019 Draft Operating Budget with new initiatives for Council consideration 6.56%
Capital
The 2019 draft capital budget was presented to Committee of the Whole on January 22/2019 at $5,228,028.
The capital budget is allocated among the following departments as follows:
2

Ten-Year Capital Plan
The 2019 draft ten-year capital budget was presented to Committee of the Whole on January 22/2019 at $54,724,445.
3. January 22/2019 Committee of the Whole (COW) Revisions
Operating
Committee of the Whole reviewed the operating budget and directed staff to increase operating expenditures by $78,125. A total of these operating budget revisions may be found on Page 5.
After the above revisions, the combined draft operating & capital levy increase is currently at 5.81% - $2.41/$100,000 of residential CVA.
Operating: .81% - ($3.38)/$100,000 of residential CVA
Capital: 5.00% - $5.79/$100,000 of residential CVA
Capital
Committee of the Whole directed staff to reduce capital costs by $960,000. A total of the capital budget revisions may be found on Page 6.
After the above revisions, the draft capital budget is currently at $4,268,028.
Ten-Year Capital Plan
Committee of the Whole directed staff to reduce the ten-year capital plan by $3,746,032. A total of these ten-year capital budget revisions may be found on Page 8.
After the above revisions, the draft ten-year capital plan is currently at $50,978,413.
4. February 7/2019 Senior Management Revisions
Operating
Staff have added an additional $15,000 to the Roads labour budget for the hiring of an Engineering Student for the summer to gather asset coordinate information to upload into the new asset management system.
After the above addition, the combined draft operating & capital levy increase is currently at 5.94% - $2.56/$100,000 of residential CVA.
Operating: .94% - ($3.23)/$100,000 of residential CVA
Capital: 5.00% - $5.79/$100,000 of residential CVA
3

Capital
Staff have decreased the 2019 Roads capital budget by $1,269 for various roads that have been interchanged. A total of these revisions, may be found on Page 6.
After the above revisions, the 2019 draft capital budget is currently at $4,266,759.
Ten-Year Capital Plan
Due to various roads being interchanged in the 2019 capital budget, the ten-year capital plan has increased by $130,406. A total of these revisions may be found on Page 8.
After the above revisions, the draft ten-year capital plan is $51,108,819
5. February 11/2019 Committee of the Whole Revisions
Operating
Committee of the Whole reviewed the input made at the Budget Public meeting on February 5, 2019 and directed staff to reinstate the swimming program in Windermere. The net increase to operating expenditures is $2,250. A total of these operating budget revisions may be found on Page 5.
After the above addition, the combined draft operating & capital levy increase is currently at 5.96% - $2.58/$100,000 of residential CVA.
Operating: .96% - ($3.21)/$100,000 of residential CVA
Capital: 5.00% - $5.79/$100,000 of residential CVA
Capital
Committee of the Whole directed staff to decrease the 2019 draft capital budget by $57,000. A total of these revisions may be found on Page 6.
After the above revisions, the 2019 draft capital budget is currently at $4,209,759.
Ten-Year Capital Plan
With the revisions made to the 2019 draft capital budget, the ten-year draft capital plan is at $51,036,567. A total of these revisions may be found on Page 8.
4
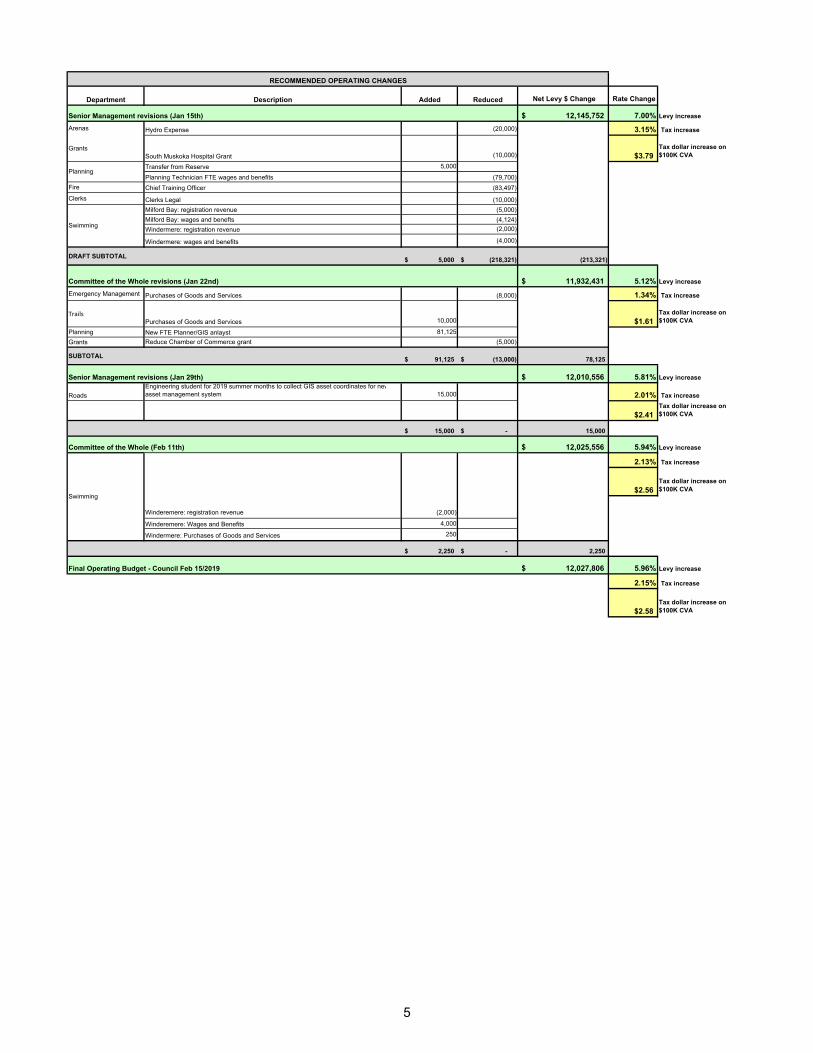
Department Description Added Reduced Net Levy $ Change Rate Change
12,145,752$ 7.00% Levy increase
Arenas Hydro Expense (20,000) 3.15% Tax increase
GrantsSouth Muskoka Hospital Grant (10,000) $3.79
Tax dollar increase on $100K CVA
Transfer from Reserve 5,000
Planning Technician FTE wages and benefits (79,700)
Fire Chief Training Officer (83,497)
Clerks Clerks Legal (10,000)
Milford Bay: registration revenue (5,000)
Milford Bay: wages and benefts (4,124)
Windermere: registration revenue (2,000)
Windermere: wages and benefits (4,000)
DRAFT SUBTOTAL5,000$ (218,321)$ (213,321)
11,932,431$ 5.12% Levy increase
Emergency Management Purchases of Goods and Services (8,000) 1.34% Tax increase
TrailsPurchases of Goods and Services 10,000 $1.61
Tax dollar increase on $100K CVA
Planning New FTE Planner/GIS anlayst 81,125
Grants Reduce Chamber of Commerce grant (5,000)
SUBTOTAL 91,125$ (13,000)$ 78,125
12,010,556$ 5.81% Levy increase
Roads
Engineering student for 2019 summer months to collect GIS asset coordinates for newasset management system 15,000 2.01% Tax increase
$2.41Tax dollar increase on $100K CVA
15,000$ -$ 15,000
12,025,556$ 5.94% Levy increase
2.13% Tax increase
$2.56Tax dollar increase on $100K CVA
Winderemere: Wages and Benefits 4,000
Windermere: Purchases of Goods and Services 250
2,250$ -$ 2,250
12,027,806$ 5.96% Levy increase
2.15% Tax increase
$2.58Tax dollar increase on $100K CVA
Committee of the Whole (Feb 11th)
Swimming
Winderemere: registration revenue (2,000)
Final Operating Budget - Council Feb 15/2019
RECOMMENDED OPERATING CHANGES
Senior Management revisions (Jan 15th)
Planning
Swimming
Committee of the Whole revisions (Jan 22nd)
Senior Management revisions (Jan 29th)
5

Department Description Added Reduced Capital $ Change
5,902,524$
Milford Bay Road Bridge Replacement (80,000)
Bala Falls Road Bridge Design (175,000)
Beaumaris Road Bridge Design and West approach (868,265)
Ridge Road (Slurry Seal) 2,000
Halls Road (Slurry Seal) 1,900
Morinus Road (Slurry Seal) (1,800)
Oak Bank Road (Slurry Seal) 400
Whites Road (Slurry Seal) 4,000
West Whites Road (Slurry Seal) (53,000)
Arundel Lodge Road (Slurry Seal) 900
Greenwood Point Road (Slurry Seal) 2,400
Tondern Island Road (Slurry Seal) 1,900
Fogo Street 17,000
Stroud Breach Road 25,500
Tom Wroe Road 5,100
Pratt Rd 8,500
Chown 23,500
Hemlock Point Road Section - 2058 23,800
Pennwood Rd - Section 2160.2 6,800
Purdy Rd Section - 4034 39,100
Paignton House Rd 10,200
Beaumaris 203,969
Island Park Road - 2154 93,600
Patterson Rd 28,000
Fire Raymond: New Well replacement 15,000
Clerks Transfer to reserves (10,000)
DRAFT SUBTOTAL 513,569 (1,188,065) (674,496)
5,228,028$
Raymond:Bay Addition (360,000)
Torrance: Pumper 4 (505,000)
Bala: Rescue 3 (75,000)
Emergency Management Raymond: Generator (20,000)
SUBTOTAL - (960,000) (960,000)$
4,268,028$
Butter and Egg Road (High Float) 38,500
Fogo Street (17,000)
Stroud Breach Road (25,500)
Tom Wroe Road (5,100)
Chown (23,500)
Pennwood Rd - Section 2160.2 (6,800)
Purdy Rd Section - 4034 (39,100)
Paignton House Rd (10,200)
Beaumaris Rd (203,969)
Patterson Rd (28,000)
Glen Gordon Road (Gravel) 30,500
Island Park Road - 2154 19,900
Stephen Road (High Float) 120,000
Senior Management Revisions: (Feb 7th)
Roads
RECOMMENDED CAPITAL CHANGES
Senior Management (Jan 15th)
Roads
Committee of the Whole: (Jan 22nd)
Fire
6
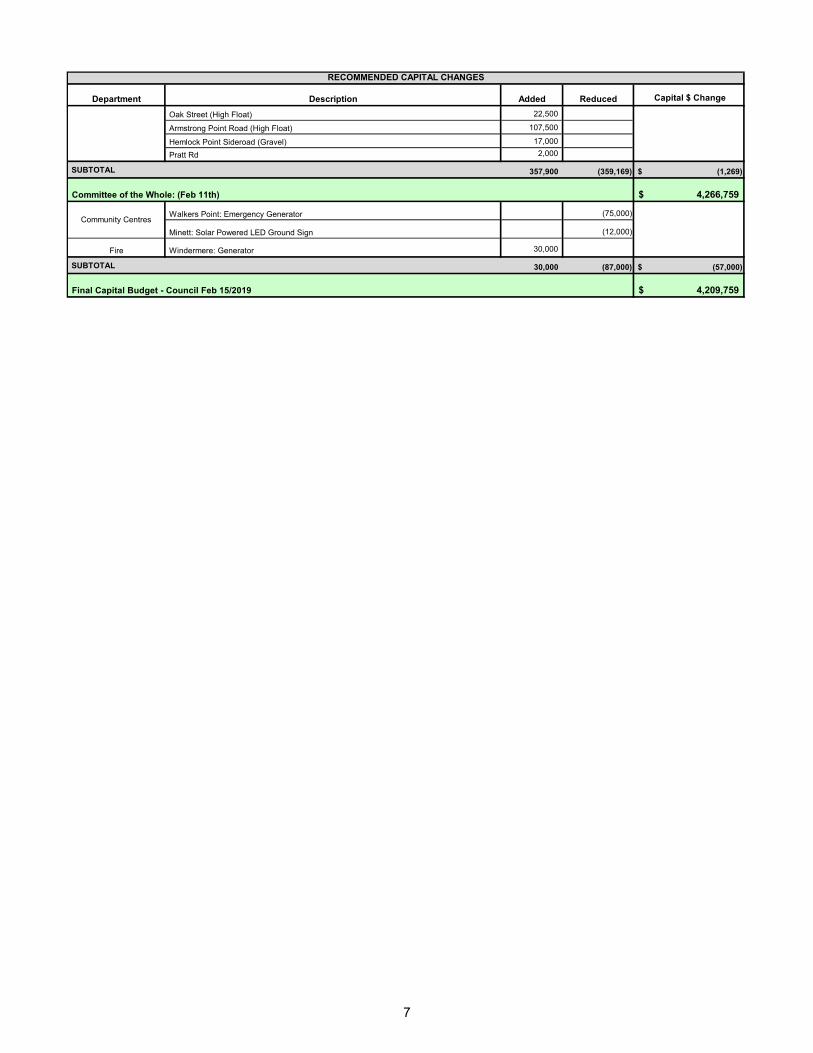
Department Description Added Reduced Capital $ Change
RECOMMENDED CAPITAL CHANGES
Oak Street (High Float) 22,500
Armstrong Point Road (High Float) 107,500
Hemlock Point Sideroad (Gravel) 17,000
Pratt Rd 2,000
SUBTOTAL 357,900 (359,169) (1,269)$
4,266,759$
Walkers Point: Emergency Generator (75,000)
Minett: Solar Powered LED Ground Sign (12,000)
Fire Windermere: Generator 30,000
SUBTOTAL 30,000 (87,000) (57,000)$
4,209,759$
Committee of the Whole: (Feb 11th)
Community Centres
Final Capital Budget - Council Feb 15/2019
7

Department Description Added Reduced Capital $ Change
54,724,445$
Year 2020: Inflation adjustment 16,128
Year 2021: Vehicles - Port Carling Station New Aerial (1,800,000)
Year 2021: Inflation adjustment (30,240)
Year 2024: Vehicles - Marine 1 Foot's Bay (400,000)
Year 2024: Inflation adjustment (6,720)
Year 2022: Marine Facilities - McDonald Road Wharf (Foot's Bay) (1,500,000)
Year 2022: Inflation adjustment (25,200)
DRAFT SUBTOTAL 16,128 (3,762,160) (3,746,032)
50,978,413$
Pratt Road (Gravel) 2,000
Glen Gordon Road (Gravel) (100)
Stephen Road (High Float) 120,000
Oak Street (High Float) 6,900
Butter & Egg Road (High Float) 320,000
Armstrong Point Road (High Float) 34,700
Island Park Road (High Float) 19,900
Fogo Street (17,000)
Stroud Breach Road (25,500)
Tom Wroe Road (5,100)
Chown Road (23,500)
Pennwood Road- Section 2160.2 (6,800)
Purdy Rd Section - 4034 (39,100)
Paignton House Road (10,200)
Beaumaris Road (203,969)
Patterson Road (28,000)
Other Equipment - Port Carling Sidewalk improvements (8,000)
Year 2020: Inflation adjustment (5,825)
DRAFT SUBTOTAL 503,500 (373,094) 130,406
51,108,819$ Year 2019: Windermere - Generator 30,000
Year 2020: Windermere - Generator (15,000)
Year 2020: Inflation adjustment (252)
Year 2019: Walkers Point - Generator (75,000)
Year 2019: Minett - New Solar Power Event Sign (12,000)
DRAFT SUBTOTAL 30,000 (102,252) (72,252)
51,036,567$
Fire
Community Centres
Final Ten Year Capital Plan - Council Feb 15/2019
Roads
Committee of the Whole: (Feb 11th)
RECOMMENDED - 2019 TEN YEAR CAPITAL PLAN CHANGES
Committee of the Whole: (Jan 22nd)
Fire
Parks
Senior Management Revisions: (Feb 7th)
8
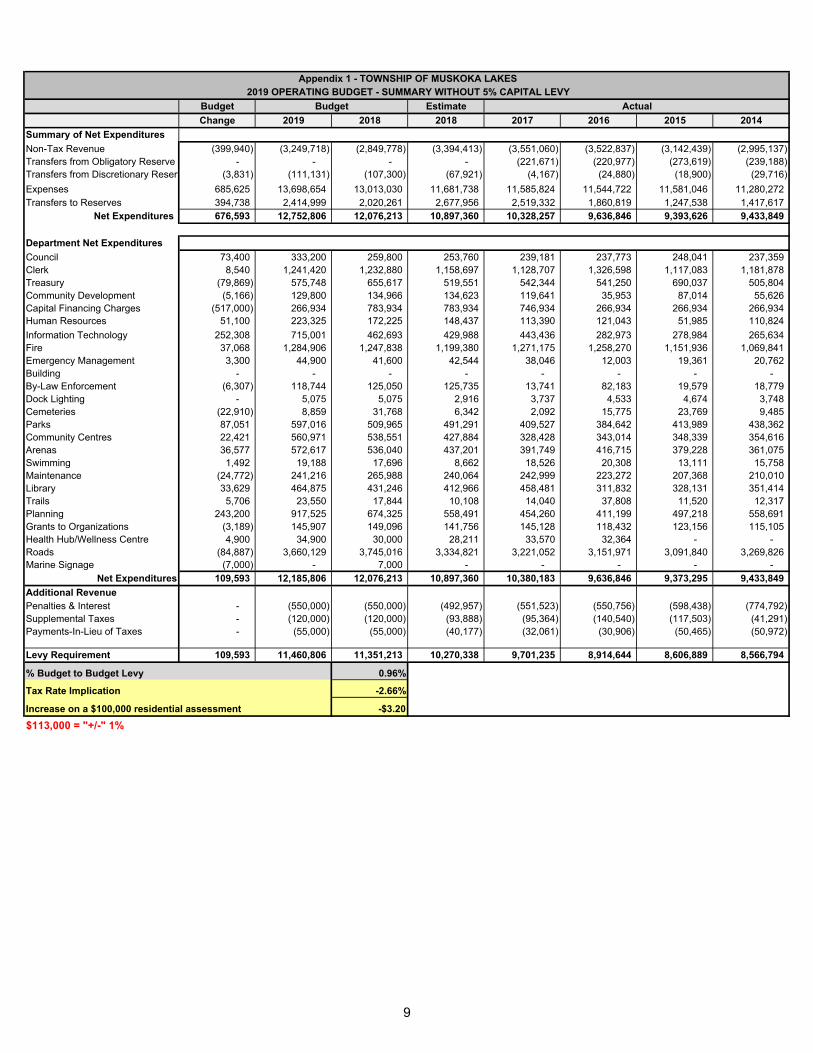
Budget Estimate
Change 2019 2018 2018 2017 2016 2015 2014
Summary of Net Expenditures
Non-Tax Revenue (399,940) (3,249,718) (2,849,778) (3,394,413) (3,551,060) (3,522,837) (3,142,439) (2,995,137)Transfers from Obligatory Reserve - - - - (221,671) (220,977) (273,619) (239,188) Transfers from Discretionary Reserv (3,831) (111,131) (107,300) (67,921) (4,167) (24,880) (18,900) (29,716)
Expenses 685,625 13,698,654 13,013,030 11,681,738 11,585,824 11,544,722 11,581,046 11,280,272Transfers to Reserves 394,738 2,414,999 2,020,261 2,677,956 2,519,332 1,860,819 1,247,538 1,417,617
Net Expenditures 676,593 12,752,806 12,076,213 10,897,360 10,328,257 9,636,846 9,393,626 9,433,849
Department Net Expenditures
Council 73,400 333,200 259,800 253,760 239,181 237,773 248,041 237,359Clerk 8,540 1,241,420 1,232,880 1,158,697 1,128,707 1,326,598 1,117,083 1,181,878 Treasury (79,869) 575,748 655,617 519,551 542,344 541,250 690,037 505,804Community Development (5,166) 129,800 134,966 134,623 119,641 35,953 87,014 55,626Capital Financing Charges (517,000) 266,934 783,934 783,934 746,934 266,934 266,934 266,934 Human Resources 51,100 223,325 172,225 148,437 113,390 121,043 51,985 110,824
Information Technology 252,308 715,001 462,693 429,988 443,436 282,973 278,984 265,634 Fire 37,068 1,284,906 1,247,838 1,199,380 1,271,175 1,258,270 1,151,936 1,069,841 Emergency Management 3,300 44,900 41,600 42,544 38,046 12,003 19,361 20,762Building - - - - - - - - By-Law Enforcement (6,307) 118,744 125,050 125,735 13,741 82,183 19,579 18,779Dock Lighting - 5,075 5,075 2,916 3,737 4,533 4,674 3,748Cemeteries (22,910) 8,859 31,768 6,342 2,092 15,775 23,769 9,485Parks 87,051 597,016 509,965 491,291 409,527 384,642 413,989 438,362Community Centres 22,421 560,971 538,551 427,884 328,428 343,014 348,339 354,616Arenas 36,577 572,617 536,040 437,201 391,749 416,715 379,228 361,075 Swimming 1,492 19,188 17,696 8,662 18,526 20,308 13,111 15,758Maintenance (24,772) 241,216 265,988 240,064 242,999 223,272 207,368 210,010 Library 33,629 464,875 431,246 412,966 458,481 311,832 328,131 351,414Trails 5,706 23,550 17,844 10,108 14,040 37,808 11,520 12,317Planning 243,200 917,525 674,325 558,491 454,260 411,199 497,218 558,691 Grants to Organizations (3,189) 145,907 149,096 141,756 145,128 118,432 123,156 115,105 Health Hub/Wellness Centre 4,900 34,900 30,000 28,211 33,570 32,364 - - Roads (84,887) 3,660,129 3,745,016 3,334,821 3,221,052 3,151,971 3,091,840 3,269,826Marine Signage (7,000) - 7,000 - - - - -
Net Expenditures 109,593 12,185,806 12,076,213 10,897,360 10,380,183 9,636,846 9,373,295 9,433,849
Additional RevenuePenalties & Interest - (550,000) (550,000) (492,957) (551,523) (550,756) (598,438) (774,792)Supplemental Taxes - (120,000) (120,000) (93,888) (95,364) (140,540) (117,503) (41,291)Payments-In-Lieu of Taxes - (55,000) (55,000) (40,177) (32,061) (30,906) (50,465) (50,972)
Levy Requirement 109,593 11,460,806 11,351,213 10,270,338 9,701,235 8,914,644 8,606,889 8,566,794
% Budget to Budget Levy 0.96%
Tax Rate Implication -2.66%
Increase on a $100,000 residential assessment -$3.20
$113,000 = "+/-" 1%
Appendix 1 - TOWNSHIP OF MUSKOKA LAKES2019 OPERATING BUDGET - SUMMARY WITHOUT 5% CAPITAL LEVY
Budget Actual
9

Budget Estimate
Change 2019 2018 2018 2017 2016 2015 2014
Summary of Net Expenditures
Non-Tax Revenue (399,940) (3,249,718) (2,849,778) (3,394,413) (3,551,060) (3,522,837) (3,142,439) (2,995,137)Transfers from Obligatory Reserve - - - - (221,671) (220,977) (273,619) (239,188) Transfers from Discretionary Reserv (3,831) (111,131) (107,300) (67,921) (4,167) (24,880) (18,900) (29,716)
Expenses 685,625 13,698,654 13,013,030 11,681,738 11,585,824 11,544,722 11,581,046 11,280,272Transfers to Reserves 394,738 2,414,999 2,020,261 2,677,956 2,519,332 1,860,819 1,247,538 1,417,617
Net Expenditures 676,593 12,752,806 12,076,213 10,897,360 10,328,257 9,636,846 9,393,626 9,433,849
Department Net Expenditures
Council 73,400 333,200 259,800 253,760 239,181 237,773 248,041 237,359Clerk 8,540 1,241,420 1,232,880 1,158,697 1,128,707 1,326,598 1,117,083 1,181,878 Treasury (79,869) 575,748 655,617 519,551 542,344 541,250 690,037 505,804Community Development (5,166) 129,800 134,966 134,623 119,641 35,953 87,014 55,626Capital Financing Charges 50,000 833,934 783,934 783,934 746,934 266,934 266,934 266,934Human Resources 51,100 223,325 172,225 148,437 113,390 121,043 51,985 110,824
Information Technology 252,308 715,001 462,693 429,988 443,436 282,973 278,984 265,634 Fire 37,068 1,284,906 1,247,838 1,199,380 1,271,175 1,258,270 1,151,936 1,069,841 Emergency Management 3,300 44,900 41,600 42,544 38,046 12,003 19,361 20,762Building - - - - - - - - By-Law Enforcement (6,307) 118,744 125,050 125,735 13,741 82,183 19,579 18,779Dock Lighting - 5,075 5,075 2,916 3,737 4,533 4,674 3,748Cemeteries (22,910) 8,859 31,768 6,342 2,092 15,775 23,769 9,485Parks 87,051 597,016 509,965 491,291 409,527 384,642 413,989 438,362Community Centres 22,421 560,971 538,551 427,884 328,428 343,014 348,339 354,616Arenas 36,577 572,617 536,040 437,201 391,749 416,715 379,228 361,075 Swimming 1,492 19,188 17,696 8,662 18,526 20,308 13,111 15,758Maintenance (24,772) 241,216 265,988 240,064 242,999 223,272 207,368 210,010 Library 33,629 464,875 431,246 412,966 458,481 311,832 328,131 351,414Trails 5,706 23,550 17,844 10,108 14,040 37,808 11,520 12,317Planning 243,200 917,525 674,325 558,491 454,260 411,199 497,218 558,691 Grants to Organizations (3,189) 145,907 149,096 141,756 145,128 118,432 123,156 115,105 Health Hub/Wellness Centre 4,900 34,900 30,000 28,211 33,570 32,364 - - Roads (84,887) 3,660,129 3,745,016 3,334,821 3,221,052 3,151,971 3,091,840 3,269,826Marine Signage (7,000) - 7,000 - - - - -
Net Expenditures 676,593 12,752,806 12,076,213 10,897,360 10,380,183 9,636,846 9,373,295 9,433,849
Additional RevenuePenalties & Interest - (550,000) (550,000) (492,957) (551,523) (550,756) (598,438) (774,792)Supplemental Taxes - (120,000) (120,000) (93,888) (95,364) (140,540) (117,503) (41,291)Payments-In-Lieu of Taxes - (55,000) (55,000) (40,177) (32,061) (30,906) (50,465) (50,972)
Levy Requirement 676,593 12,027,806 11,351,213 10,270,338 9,701,235 8,914,644 8,606,889 8,566,794
% Budget to Budget Levy 5.96%
Tax Rate Implication 2.15%
Increase on a $100,000 residential assessment $2.58
$113,000 = "+/-" 1%
Appendix 1 - TOWNSHIP OF MUSKOKA LAKES2019 OPERATING BUDGET - SUMMARY WITH 5% CAPITAL LEVY
Budget Actual
10
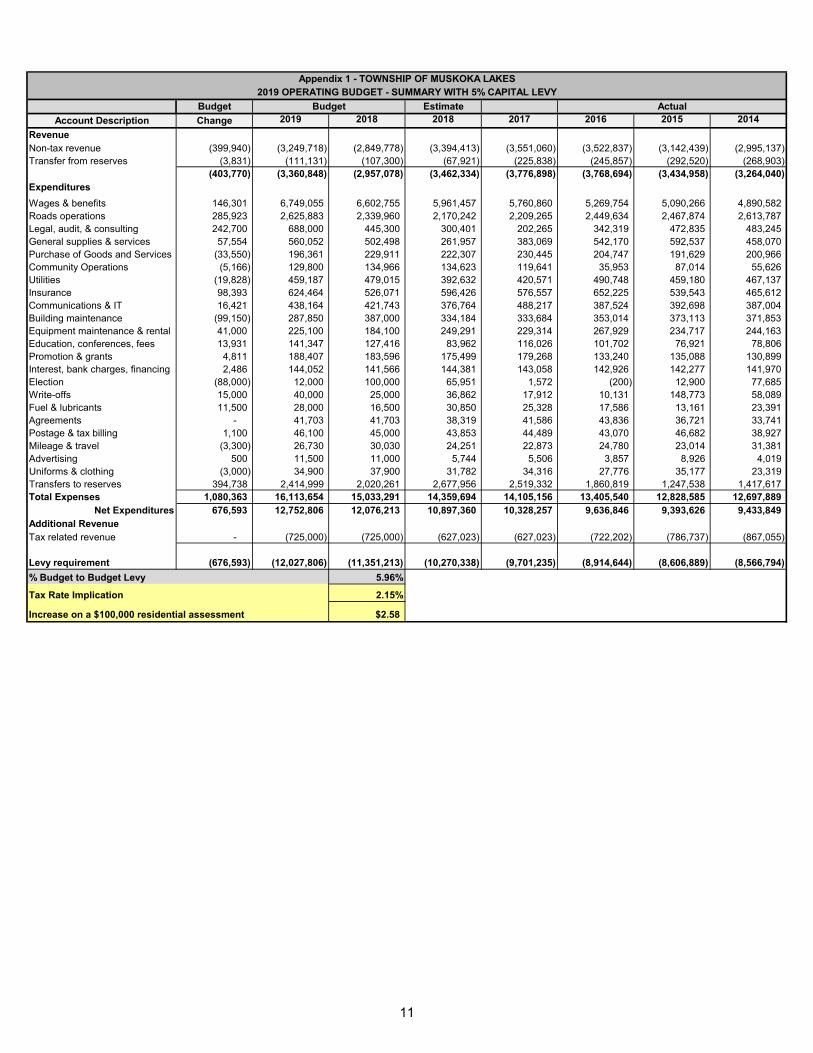
Budget Estimate
Account Description Change 2019 2018 2018 2017 2016 2015 2014
RevenueNon-tax revenue (399,940) (3,249,718) (2,849,778) (3,394,413) (3,551,060) (3,522,837) (3,142,439) (2,995,137)Transfer from reserves (3,831) (111,131) (107,300) (67,921) (225,838) (245,857) (292,520) (268,903)
(403,770) (3,360,848) (2,957,078) (3,462,334) (3,776,898) (3,768,694) (3,434,958) (3,264,040)Expenditures
Wages & benefits 146,301 6,749,055 6,602,755 5,961,457 5,760,860 5,269,754 5,090,266 4,890,582Roads operations 285,923 2,625,883 2,339,960 2,170,242 2,209,265 2,449,634 2,467,874 2,613,787 Legal, audit, & consulting 242,700 688,000 445,300 300,401 202,265 342,319 472,835 483,245 General supplies & services 57,554 560,052 502,498 261,957 383,069 542,170 592,537 458,070 Purchase of Goods and Services (33,550) 196,361 229,911 222,307 230,445 204,747 191,629 200,966 Community Operations (5,166) 129,800 134,966 134,623 119,641 35,953 87,014 55,626 Utilities (19,828) 459,187 479,015 392,632 420,571 490,748 459,180 467,137Insurance 98,393 624,464 526,071 596,426 576,557 652,225 539,543 465,612 Communications & IT 16,421 438,164 421,743 376,764 488,217 387,524 392,698 387,004 Building maintenance (99,150) 287,850 387,000 334,184 333,684 353,014 373,113 371,853 Equipment maintenance & rental 41,000 225,100 184,100 249,291 229,314 267,929 234,717 244,163 Education, conferences, fees 13,931 141,347 127,416 83,962 116,026 101,702 76,921 78,806 Promotion & grants 4,811 188,407 183,596 175,499 179,268 133,240 135,088 130,899 Interest, bank charges, financing 2,486 144,052 141,566 144,381 143,058 142,926 142,277 141,970 Election (88,000) 12,000 100,000 65,951 1,572 (200) 12,900 77,685 Write-offs 15,000 40,000 25,000 36,862 17,912 10,131 148,773 58,089 Fuel & lubricants 11,500 28,000 16,500 30,850 25,328 17,586 13,161 23,391 Agreements - 41,703 41,703 38,319 41,586 43,836 36,721 33,741 Postage & tax billing 1,100 46,100 45,000 43,853 44,489 43,070 46,682 38,927 Mileage & travel (3,300) 26,730 30,030 24,251 22,873 24,780 23,014 31,381 Advertising 500 11,500 11,000 5,744 5,506 3,857 8,926 4,019 Uniforms & clothing (3,000) 34,900 37,900 31,782 34,316 27,776 35,177 23,319 Transfers to reserves 394,738 2,414,999 2,020,261 2,677,956 2,519,332 1,860,819 1,247,538 1,417,617 Total Expenses 1,080,363 16,113,654 15,033,291 14,359,694 14,105,156 13,405,540 12,828,585 12,697,889
Net Expenditures 676,593 12,752,806 12,076,213 10,897,360 10,328,257 9,636,846 9,393,626 9,433,849Additional RevenueTax related revenue - (725,000) (725,000) (627,023) (627,023) (722,202) (786,737) (867,055)
Levy requirement (676,593) (12,027,806) (11,351,213) (10,270,338) (9,701,235) (8,914,644) (8,606,889) (8,566,794)
% Budget to Budget Levy 5.96%
Tax Rate Implication 2.15%
Increase on a $100,000 residential assessment $2.58
Appendix 1 - TOWNSHIP OF MUSKOKA LAKES2019 OPERATING BUDGET - SUMMARY WITH 5% CAPITAL LEVY
Budget Actual
11
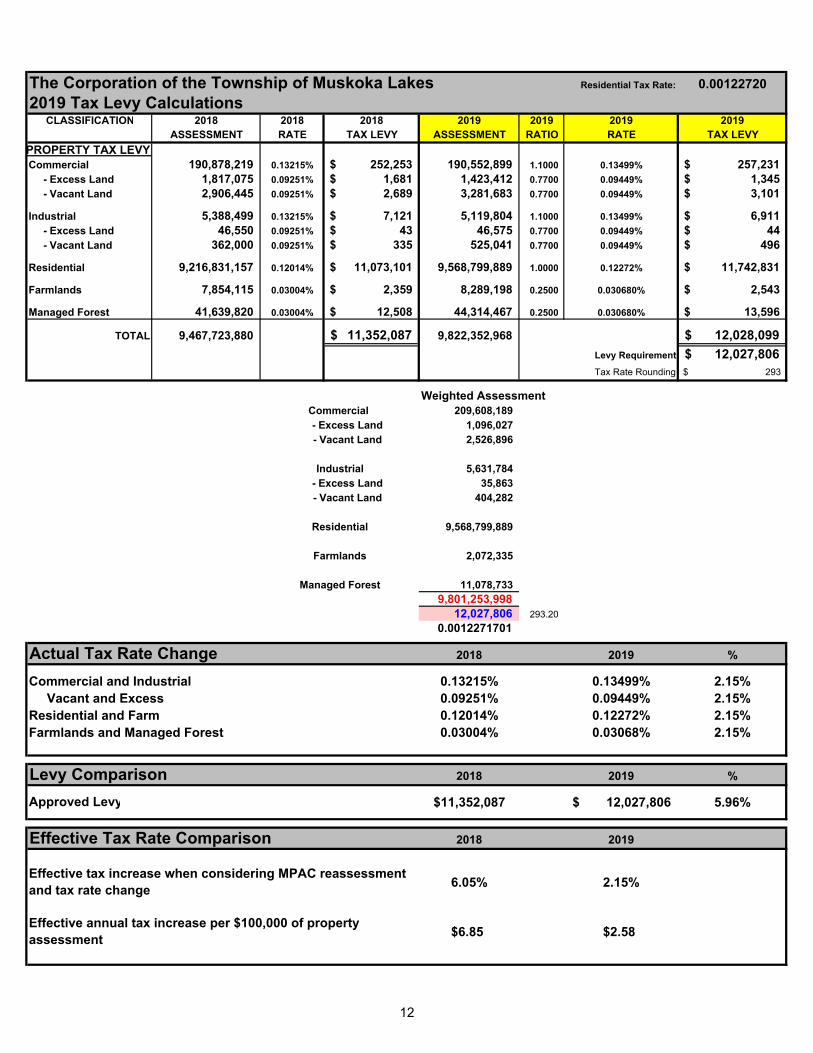
Residential Tax Rate: 0.00122720
CLASSIFICATION 2018 2018 2018 2019 2019 2019 2019ASSESSMENT RATE TAX LEVY ASSESSMENT RATIO RATE TAX LEVY
PROPERTY TAX LEVY Commercial 190,878,219 0.13215% 252,253$ 190,552,899 1.1000 0.13499% 257,231$ - Excess Land 1,817,075 0.09251% 1,681$ 1,423,412 0.7700 0.09449% 1,345$ - Vacant Land 2,906,445 0.09251% 2,689$ 3,281,683 0.7700 0.09449% 3,101$
Industrial 5,388,499 0.13215% 7,121$ 5,119,804 1.1000 0.13499% 6,911$ - Excess Land 46,550 0.09251% 43$ 46,575 0.7700 0.09449% 44$ - Vacant Land 362,000 0.09251% 335$ 525,041 0.7700 0.09449% 496$
Residential 9,216,831,157 0.12014% 11,073,101$ 9,568,799,889 1.0000 0.12272% 11,742,831$
Farmlands 7,854,115 0.03004% 2,359$ 8,289,198 0.2500 0.030680% 2,543$
Managed Forest 41,639,820 0.03004% 12,508$ 44,314,467 0.2500 0.030680% 13,596$
TOTAL 9,467,723,880 11,352,087$ 9,822,352,968 12,028,099$
12,027,806$ 293$
Weighted Assessment209,608,189
1,096,027 2,526,896
5,631,784 35,863
404,282
9,568,799,889
2,072,335
11,078,733 9,801,253,998
12,027,806 293.20
0.0012271701
Actual Tax Rate Change 2018 2019 %
Commercial and Industrial 0.13215% 0.13499% 2.15% Vacant and Excess 0.09251% 0.09449% 2.15%Residential and Farm 0.12014% 0.12272% 2.15%Farmlands and Managed Forest 0.03004% 0.03068% 2.15%
Levy Comparison 2018 2019 %
Approved Levy $11,352,087 12,027,806$ 5.96%
Effective Tax Rate Comparison 2018 2019
6.05% 2.15%
$6.85 $2.58
Farmlands
- Vacant Land
Industrial
- Vacant Land
Residential
Effective tax increase when considering MPAC reassessment and tax rate change
Effective annual tax increase per $100,000 of property assessment
The Corporation of the Township of Muskoka Lakes2019 Tax Levy Calculations
Managed Forest
Levy Requirement
Tax Rate Rounding
Commercial - Excess Land
- Excess Land
12

2018 Tax Rate2018 Township
Tax2019
Assessment 2019 Tax Rate2019 Township
TaxDollar
IncreasePercentage
Increase
0.0012014 120.14$ 100,000$ 0.00122720 122.72$ 2.58$ 2.15%
0.0012014 240.28$ 200,000$ 0.00122720 245.44$ 5.16$ 2.15%
0.0012014 300.35$ 250,000$ 0.00122720 306.80$ 6.45$ 2.15%
0.0012014 420.49$ 350,000$ 0.00122720 429.52$ 9.03$ 2.15%
0.0012014 600.70$ 500,000$ 0.00122720 613.60$ 12.90$ 2.15%
0.0012014 901.05$ 750,000$ 0.00122720 920.40$ 19.35$ 2.15%
0.0012014 1,201.40$ 1,000,000$ 0.00122720 1,227.20$ 25.80$ 2.15%
0.0012014 1,802.10$ 1,500,000$ 0.00122720 1,840.80$ 38.70$ 2.15%Assessed Value
$750,000Assessed Value
$1,000,000Assessed Value
$1,500,000
Township of Muskoka LakesImpact of 2019 Assessment Increase and Township 2019 Draft Tax Rate
Assessed Value
ASSESSMENT EXAMPLES
Per$100,000
of Assessment
Assessed Value
$500,000
$200,000Assessed Value
$250,000Assessed Value
$350,000
13

Estimated
Account Description 2019 2018 2018 YTD 2017 2016 2015 2014
ExpensesWages & Benefits 297,200 225,800 225,935 222,165 215,891 215,891 208,552 Mileage 6,500 6,500 3,461 4,323 4,258 7,901 5,663Telephone 2,000 2,000 892 592 1,481 1,502 1,532Fees, Conferences 12,000 10,000 1,385 3,957 4,446 9,612 7,047Purchase of Goods & Services 15,500 15,500 22,087 8,143 11,697 13,134 12,751Volunteer Appreciation - - - - - - 1,814
Total Expenses 333,200 259,800 253,760 239,181 237,773 248,041 237,359
Net Expenditures 333,200 259,800 253,760 239,181 237,773 248,041 237,359
$ Over/(Under) 2018 Budget 73,400 % Over/(Under) 2018 Budget 28.3%
Non-Tax Revenue - - - - - - - Expenses 333,200 259,800 253,760 239,181 237,773 248,041 237,359
2019 Notes:Wages & Benefits - due to elimination of 1/3 expense allocation, Council passed Remuneration By-law 2018-85 effective Dec 1, 2018
Fees, Conferences - increase to $12,000 to meet TML Policy C-GG-09 (Attendance at Conferences), New Council Training through AMO
Budget
COUNCIL
Actual
Purchase of Goods & Services - reduced by $12,000 to reallocate Integrity Commissioner / Council Code of Conduct retainer fee / fee for service from Council to Clerks cost centre
Volunteer Appreciation - Council to determine whether an event will be held in 2019
14

Estimated
Account Description 2019 2018 2018 YTD 2017 2016 2015 2014
RevenuesRoad Closing Application Fees (13,800) (13,800) (21,400) (11,400) (12,400) (14,600) (6,900)Licence Agreement Fees (2,400) (1,500) (4,100) (750) (1,500) (1,600) (1,300)Legal/Misc recoverable (1,000) - 4,919 (940) (39,489) (47,858) - Trailer Licences (7,680) (4,200) (4,280) (3,680) (3,730) (3,990) (3,785)Overhead Revenue (35,000) (30,000) (30,000) (30,000) (30,000) (30,000) (32,523)Freedom of Information Revenue (700) (700) (227) (1,030) (34) - - Lottery Licences (200) (100) (401) (75) (30) (30) (17)Liquor Licenses (400) - - - - - - Photocopies/Office Supplies (600) (500) (1,051) (450) (166) (986) (436)Library Service Fee (1,220) (1,220) (1,220) (1,220) (1,220) - - Land Sales (41,800) - - - - - - Transfer from Reserve Funds (12,000) (100,000) (64,921) (1,572) - (12,900) -
Total Revenues (116,800) (152,020) (122,680) (51,118) (88,569) (111,964) (44,960)
ExpensesWages & Benefits 711,200 695,400 691,356 643,489 637,617 498,237 526,428Office Supplies 13,000 13,000 8,602 9,111 11,312 11,252 8,590Canteen 3,500 3,500 1,536 1,485 1,553 1,651 1,410Cleaning Supplies 2,300 2,100 2,771 2,254 1,724 1,893 1,565Mileage 3,000 3,000 2,074 1,754 2,910 1,103 1,692Postage 12,000 15,000 10,421 15,286 12,384 16,313 10,413Telephone 1,600 1,500 1,230 1,139 1,116 1,094 1,072Advertising 2,500 5,000 1,360 1,006 1,263 684 2,372Legal 127,000 137,000 48,579 65,892 90,738 123,319 155,710Insurance 160,000 150,000 182,020 164,781 248,957 173,368 131,679Building Maintenance 47,500 41,000 26,355 57,172 41,001 47,414 52,899Heat 18,000 17,000 20,590 15,129 15,150 16,175 23,205Hydro 32,500 34,500 24,190 27,105 36,119 34,227 35,290Caretaking - - 860 - - - - Fees, Conferences, Memberships 15,500 13,500 12,910 14,869 11,347 10,767 10,765Elections 12,000 100,000 65,951 1,572 (200) 12,900 77,685WSIB 118,000 86,900 126,353 88,143 86,944 81,292 57,002Education & Training 6,000 7,200 3,002 989 3,228 2,625 1,101Purchase of Goods & Services 17,500 17,500 18,242 21,983 17,961 14,268 15,346Survey 3,000 4,000 - - 106 4,215 - Consultants Fees 3,000 5,000 - 5,877 75,161 147,887 88,278Sewer 1,200 1,200 1,132 1,126 1,358 860 1,040Water 1,300 1,300 1,194 1,342 1,625 972 1,190Garbage Disposal 1,620 1,300 1,648 1,478 1,393 1,233 1,105Computer Services - - - - - - - Labour 15,000 - - - - - - Transfer to Reserve Funds 30,000 29,000 29,000 36,842 114,400 25,299 21,000
Total Expenses 1,358,220 1,384,900 1,281,377 1,179,824 1,415,167 1,229,048 1,226,839
Net Expenditures 1,241,420 1,232,880 1,158,697 1,128,707 1,326,598 1,117,083 1,181,878
$ Over/(Under) 2018 Budget 8,540% Over/(Under) 2018 Budget 0.7%
Non-Tax Revenue (116,800) (152,020) (122,680) (51,118) (88,569) (111,964) (44,960)Expenses 1,358,220 1,384,900 1,281,377 1,179,824 1,415,167 1,229,048 1,226,839
CLERK
Budget Actual
15

Estimated
Account Description 2019 2018 2018 YTD 2017 2016 2015 2014
CLERK
Budget Actual
2019 Notes:
REVENUES CHANGES
Revenue account increases due to new and increased fees approved by Council in July 2018
Land Sales - Potential Land Sales Revenue
Transfer from Reserve Funds - withdrawal from election reserve for potential 2019 Muskoka Compliance Audit Committee requirements
EXPENSES CHANGES
Wages & Benefits - increase includes CPI pursuant to TML Policy C-HR-02 (Personnel Administration)
Cleaning Supplies and Garbage Disposal increased to meet actuals
Telephone adjusted to reallocate Township office telephone costs to IT cost centre
Legal - increased by $12,000 to reallocate Integrity Commissioner / Council Code of Conduct retainer fee / fee for service from Council to Clerks cost centre
Insurance increased to meet actuals
Equipment rental & repair reallocated to IT cost centre
Building Maintenance - increased to include; Ice melt system on front eaves, replace eavestrough drains/patch asphalt, parking lot line painting
Fees, Conferences, Memberships - increased to included the 2019 AMCTO Conference sponsorship to be held in Huntsville
Elections - for potential 2019 Muskoka Compliance Audit Committee requirements
WSIB - increased to meet actuals
Transfer to Reserve Funds-Elections - 1st of 4 year funding program to reserve for 2022 municipal election
16

Estimated
Account Description 2019 2018 2018 YTD 2017 2016 2015 2014
RevenuesTax Certificates (24,655) (24,655) (23,230) (24,700) (23,900) (22,650) (19,650)Tax Registrations (15,000) (5,000) (10,400) (35,700) (3,380) - (5,001)Sundry Revenue (25,000) (500) (23,020) (2,149) (1,047) (4,354) (3,054)Interest Earned (280,000) (125,000) (318,937) (181,905) (125,455) (137,448) (132,658)US Exchange (1,340) (1,340) (56) 242 (2,126) (1,330) (2,008)Maps (200) (45) (165) (90) (45) (30) (330)Library Service Fee (5,961) (5,961) (5,961) (5,961) (5,961) - - Burgess Hydro Facility (18,000) (18,000) (18,000) (18,000) (18,000) (18,000) (18,000)
Total Revenues (370,156) (180,501) (399,769) (268,262) (179,914) (183,812) (180,702)
ExpensesWages & Benefits 542,500 614,300 544,680 575,787 540,394 556,129 494,089 Mileage 980 980 403 1,025 1,086 649 299Telephone 520 520 262 205 646 531 488Legal 500 500 - 1,175 4,297 - - Audit 25,000 20,000 5,796 28,028 20,000 11,702 10,176Tax Billing 34,100 30,000 33,432 29,203 30,686 30,369 28,514Fees, Conferences 3,691 3,691 2,036 2,067 1,839 4,488 2,325Purchase of Goods & Services 3,113 3,113 2,105 3,806 2,888 2,668 4,469Consultants Fees 2,000 2,000 1,953 - 8,279 9,589 4,377911 Supplies 2,000 2,000 (1,510) 310 1,407 2,714 2,387Memberships 2,000 2,000 1,642 1,209 1,256 1,405 508Interest & Bank Charges 9,500 7,014 10,257 8,884 8,579 8,032 7,663Tax Adjustments - Lower Tier 35,000 20,000 34,743 16,562 8,105 144,878 55,478 Tax Adjustment - Heritage Designation 3,000 3,000 2,115 - - - - Bad Debts 2,000 2,000 4 1,350 2,026 3,895 2,612Transfer to Reserve Funds 280,000 125,000 281,402 140,994 89,675 96,801 73,122
Total Expenses 945,904 836,118 919,320 810,607 721,164 873,849 686,506
Net Expenditures 575,748 655,617 519,551 542,344 541,250 690,037 505,804
$ Over/(Under) 2018 Budget (79,869)% Over/(Under) 2018 Budget -12.2%
Non-Tax Revenue (370,156) (180,501) (399,769) (268,262) (179,914) (183,812) (180,702) Expenses 945,904 836,118 919,320 810,607 721,164 873,849 686,506
2019 Notes:Wages & Benefits
TREASURY
Budget Actual
Tax Adjustments Lower Tier: Provision for tax assessment decreases that result in a refund of revenue collected. Township portion of vested properties from tax sale
17

Estimated
Account Description 2019 2018 2018 YTD 2017 2016 2015 2014
RevenuesOther Grants (4,500) (4,500) (3,350) (8,366) (41,373) (19,247) (23,250)Visitors' Centre Revenue - - (1,130) (990) (1,960) (613) (1,118)Filming Permit - - - (713) - - - Community Policing Grant - (4,600) - - (4,600) (4,600) (4,600)
Total Revenues (4,500) (9,100) (4,480) (10,069) (47,933) (24,460) (28,968)
ExpensesWages & Benefits 88,800 81,500 82,453 53,465 2,477 2,477 13,674Mileage 1,500 1,500 1,275 1,395 1,321 170 1,092Fees, Conferences 2,000 2,000 1,863 2,314 261 1,723 1,018Purchase of Goods & Services 2,000 2,000 272 935 434 5,262 (3,171)Promotion 24,000 25,500 24,535 13,444 10,853 476 1,307Community Events 10,000 9,000 9,209 20,695 3,955 2,975 4,193Transfer to Reserve Funds 5,000 5,000 5,000 5,000 5,000 5,000 5,000Telephone 1,000 2,500 852 1,731 1,652 2,116 2,345Community Policing Costs - - 1,025 936 5,799 5,799 5,799Consultants Fees - - - - - 24,867 40,815Insurance - 6,875 7,570 7,470 6,749 6,123 2,868Building Repairs & Maintenance - 4,700 2,377 5,215 4,341 4,827 4,315Heat - 1,900 1,910 2,457 1,758 3,298 3,732Hydro - 1,200 596 1,216 1,337 1,357 1,250Sewer - 131 38 165 293 71 98Water - 260 131 340 475 198 257FedNor Project - - - 12,932 37,180 26,450 - Sports Project - - - - - 18,283 -
Total Expenses 134,300 144,066 139,103 129,709 83,886 111,473 84,593
Net Expenditures 129,800 134,966 134,623 119,641 35,953 87,014 55,626
$ Over/(Under) 2018 Budget (5,166) % Over/(Under) 2018 Budget -3.8%
Non-Tax Revenue (4,500) (9,100) (4,480) (10,069) (47,933) (24,460) (28,968)Expenses 134,300 144,066 139,103 129,709 83,886 111,473 84,593
2019 Notes:Transfer to Reserve: $5,000 Working Capital The Municipality's Visitor Centre was sold in 2018; therefore no operating cost expense in 2019
COMMUNITY ECONOMIC DEVELOPMENT
Budget Actual
18

Estimated
Account Description 2019 2018 2018 YTD 2017 2016 2015 2014
ExpensesDebenture 134,052 134,052 134,052 134,052 134,052 134,052 134,052Transfer to Reserves 132,882 132,882 132,882 132,882 132,882 132,882 132,882Transfer to Capital Levy Reserve 567,000 517,000 517,000 480,000 - - -
Total Expenses 833,934 783,934 783,934 746,934 266,934 266,934 266,934
Net Expenditures 833,934 783,934 783,934 746,934 266,934 266,934 266,934
$ Over/(Under) 2018 Budget 50,000 % Over/(Under) 2018 Budget 6.4%
Non-Tax Revenue - - - - - - Expenses 833,934 783,934 783,934 746,934 266,934 266,934 266,934
2019 Notes:$1.6 mm loan from District in 2008, 8 years remaining to pay $134,052/year
CAPITAL FINANCING
Budget Actual
Township additional 5% Capital Levy budget line was presented in the Roads budget. Staff have reallocated this budget line from Roads Department to the Financing Department for presentation purposes
19

Estimated
Account Description 2019 2018 2018 YTD 2017 2016 2015 2014
RevenuesLibrary Service Fee (900) (900) (900) (900) (900) - - Agreements - - (5,000) - - - (1,620) Transfer from Organizational Revie - - - (78,501) - - -
Total Revenues (900) (900) (5,900) (900) (900.00) - (1,620)
ExpensesWages & Benefits 180,700 127,500 125,836 53,870 - 22,643 83,111Mileage 500 500 181 444 - 385 308Telephone 300 - 314 274 - - - Advertising 5,000 1,000 3,765 2,006 514 5,349 - Fees, Conferences 1,500 1,100 903 1,092 - 999 1,739Education & Training 25,725 25,725 16,068 40,510 22,764 525 4,945Purchase of Goods & Services 3,000 6,000 1,535 14,147 8,820 11,485 10,355Consultants 2,500 2,500 941 687 5,871 9,058 10,815Health & Safety 5,000 8,800 4,793 1,260 2,336 1,541 1,171Transfer to Organizational Review Funds - - - - 55,914 - - Transfer to Education Reserve - - - - 25,725 - -
Total Expenses 224,225 173,125 154,337 114,290 121,943 51,985 112,444
Net Expenditures 223,325 172,225 148,437 113,390 121,043 51,985 110,824
$ Over/(Under) 2018 Budget 51,100 % Over/(Under) 2018 Budget 29.7%
Non-Tax Revenue (900) (900) (5,900) (900.00) (900.00) - (1,620) Expenses 224,225 173,125 154,337 114,290 121,943 51,985 112,444
2019 Notes:Education & Training - Corporate wide staff training
HUMAN RESOURCES
Budget Actual
20

EstimatedAccount Description 2019 2018 2018 YTD 2017 2016 2015 2014
RevenuesRecovery from Library (10,900) (15,000) (15,000) - - - -
Revenues (10,900) (15,000) (15,000) - - - -
ExpensesTelephone 7,600 7,600 7,858 7,066 7,470 7,428 6,866 Equipment Rental and Repair 25,100 31,000 22,529 25,394 27,924 27,682 28,320 Insurance 10,000 - - - - - - Purchase of Good & Services 5,000 5,000 4,959 5,442 - - - Consulting Fees 5,000 10,000 2,269 261 - - - Managed Devices 155,182 140,201 139,605 54,093 - - - Annual Licence Fees 103,821 58,092 44,480 28,813 - - - Circuit cost (Internet) 17,380 13,716 12,303 11,852 - - - Computer Allowance 13,000 6,000 5,281 5,986 - - - Transfer to Reserves for new computer equipment/software systems/cyber security/disaster recovery/business continuity 383,817 168,960 168,960 75,000 - - -
District Expenses - 37,124 36,743 229,530 247,579 243,875 230,448 Total Expenses 725,901 477,693 444,987 443,436 282,973 278,984 265,634
Net Expenditures 715,001 462,693 429,988 443,436 282,973 278,984 265,634
$ Over/(Under) 2018 Budget 252,308 % Over/(Under) 2018 Budget 54.5%
Non-Tax Revenue (10,900) (15,000) (15,000) - - - - Expenses 725,901 477,693 444,987 443,436 282,973 278,984 265,634
2019 Notes:
INFORMATION TECHNOLOGYBudget Actual
Transfer to Reserves includes funding for new Township website, new Township VOIP telephone system, Township asset management system and new electronic content management system. Increased cyber security
21

EstimatedAccount Description 2019 2018 2018 YTD 2017 2016 2015 2014
General RevenuesMedical Response Revenue (30,000) (30,000) (29,516) (30,150) (34,425) (28,120) (23,260)Agreements (36,179) (36,179) (34,261) (25,370) (26,591) (26,251) (17,481)Cost Recoveries (25,000) (15,000) (36,501) (1,960) (45,366) 1,712 (47,558)False Alarms (11,000) (6,000) (17,965) (9,229) (6,923) (12,045) (8,600)Fire Permits (7,500) (5,000) (9,945) (8,465) (6,590) (5,970) (5,225)Donations - - - - (11,006) (3,360) - Prevention / Investigation (3,000) (1,000) (7,985) (6,400) (450) (702) (750)Fire Marque Recoveries (15,000) (25,000) (3,399) (17,272) - (45,573) -
Total Revenues (127,679) (118,179) (139,571) (98,845) (131,351) (120,308) (102,874)
ExpensesGeneralWages & Benefits 396,500 380,600 374,718 357,021 356,804 330,819 307,597 Cleaning Supplies 1,500 300 771 367 348 533 69.82 Mileage 2,500 1,500 3,227 2,271 1,935 1,884 2,629Telephone 1,800 1,800 1,734 1,602 1,489 1,472 1,545Insurance 81,000 73,354 80,771 79,707 72,009 65,381 65,606Equipment Rental & Repair 37,000 37,000 27,645 45,244 43,563 32,283 37,967Fees, Conferences 14,500 14,500 14,894 13,092 13,392 15,145 11,996Vehicle & Boat Maintenance 58,200 57,200 111,825 106,454 128,964 92,230 76,788WSIB 27,532 27,532 27,740 27,802 24,837 26,010 20,345Agreements 41,703 41,703 38,319 41,586 43,836 36,721 33,741Education & Training 140,000 140,000 115,721 133,318 137,580 138,465 119,972Radios 38,000 38,000 38,211 40,554 27,146 23,511 24,021Purchase of Goods & Services 18,500 18,500 18,412 25,710 20,459 17,130 10,183Gas & Oil 12,000 9,000 16,627 13,904 8,870 9,528 12,157Fire Hydrants 12,000 12,000 11,970 10,070 8,041 7,854 7,854Health & Safety Committee 3,000 3,000 943 3,704 3,302 5,014 739Uniforms & Accessories 9,400 9,400 10,224 12,461 8,307 16,928 4,805Meeting Remuneration - 1,000 3,374 505 1,586 2,813 3,183Supervisory Honorarium 16,500 16,000 15,773 14,508 13,780 13,962 14,469Medical Supplies 5,000 5,000 3,465 1,246 9,698 4,709 4,626Safety Clothing 9,000 9,000 5,862 7,166 8,361 6,370 7,809Recognition & Awards 7,000 7,000 8,172 8,048 7,960 4,804 - Personnel wellness and safety 10,000 10,000 13,267 5,599 - - - Public Education 8,200 8,200 8,162 8,363 8,345 4,049 8,705VFIS Insurance 18,000 18,000 14,341 12,024 16,985 12,450 - Transfer to Org Review Funds - - - - 27,254 - 700 Transfer to Reserve Funds 15,000 20,000 - 21,179 - 45,573 700Labour 46,322 - - - - - -
General Expenses 1,030,157 959,589 966,167 993,506 994,852 915,638 778,208
Remuneration 280,813 292,813 273,950 263,278 267,536 250,672 246,638Telephone 8,820 8,820 7,282 6,917 8,459 8,539 8,661Building Repairs & Maintenance 22,650 34,650 22,431 39,922 49,088 27,272 61,543Heat 22,700 22,700 26,331 24,596 20,559 18,964 27,069Hydro 22,200 22,200 15,637 21,705 26,406 24,188 21,883Vehicle & Boat Maintenance - - - - - - - Boat Rental & Storage 2,500 2,500 3,734 594 3,611 4,583 3,366 Vehicle Maintenance - - - - - - - Gas & Oil 21,800 21,800 22,418 17,980 17,779 21,632 24,513 Sewer 275 275 336 561 377 230 217 Water 670 670 666 960 953 527 618
Total Station Expenses 382,428 406,428 372,784 376,513 394,769 356,606 394,507
Total Expenses 1,412,585 1,366,017 1,338,951 1,370,020 1,389,621 1,272,244 1,172,715
Net Expenditures 1,284,906 1,247,838 1,199,380 1,271,175 1,258,270 1,151,936 1,069,841 $ Over/(Under) 2018 Budget 37,068% Over/(Under) 2018 Budget 3.0%
Non-Tax Revenue (127,679) (118,179) (139,571) (98,845) (131,351) (120,308) (102,874) Expenses 1,412,585 1,366,017 1,338,951 1,370,020 1,389,621 1,272,244 1,172,715
2019 Notes:
FIRE CONSOLIDATEDBudget Actual
22
Estimated
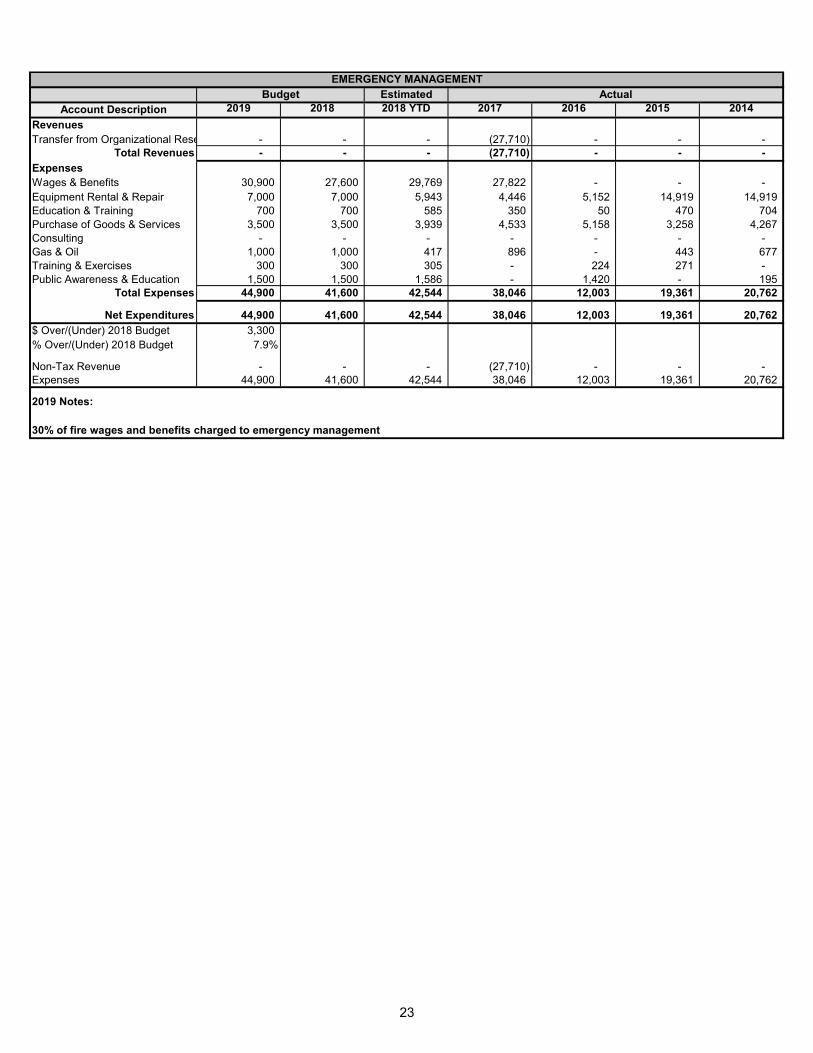
Account Description 2019 2018 2018 YTD 2017 2016 2015 2014
RevenuesTransfer from Organizational Rese - - - (27,710) - - -
Total Revenues - - - (27,710) - - -
ExpensesWages & Benefits 30,900 27,600 29,769 27,822 - - - Equipment Rental & Repair 7,000 7,000 5,943 4,446 5,152 14,919 14,919Education & Training 700 700 585 350 50 470 704Purchase of Goods & Services 3,500 3,500 3,939 4,533 5,158 3,258 4,267Consulting - - - - - - - Gas & Oil 1,000 1,000 417 896 - 443 677Training & Exercises 300 300 305 - 224 271 - Public Awareness & Education 1,500 1,500 1,586 - 1,420 - 195
Total Expenses 44,900 41,600 42,544 38,046 12,003 19,361 20,762
Net Expenditures 44,900 41,600 42,544 38,046 12,003 19,361 20,762
$ Over/(Under) 2018 Budget 3,300 % Over/(Under) 2018 Budget 7.9%
Non-Tax Revenue - - - (27,710) - - - Expenses 44,900 41,600 42,544 38,046 12,003 19,361 20,762
30% of fire wages and benefits charged to emergency management
EMERGENCY MANAGEMENT
Budget
2019 Notes:
Actual
23
Estimated
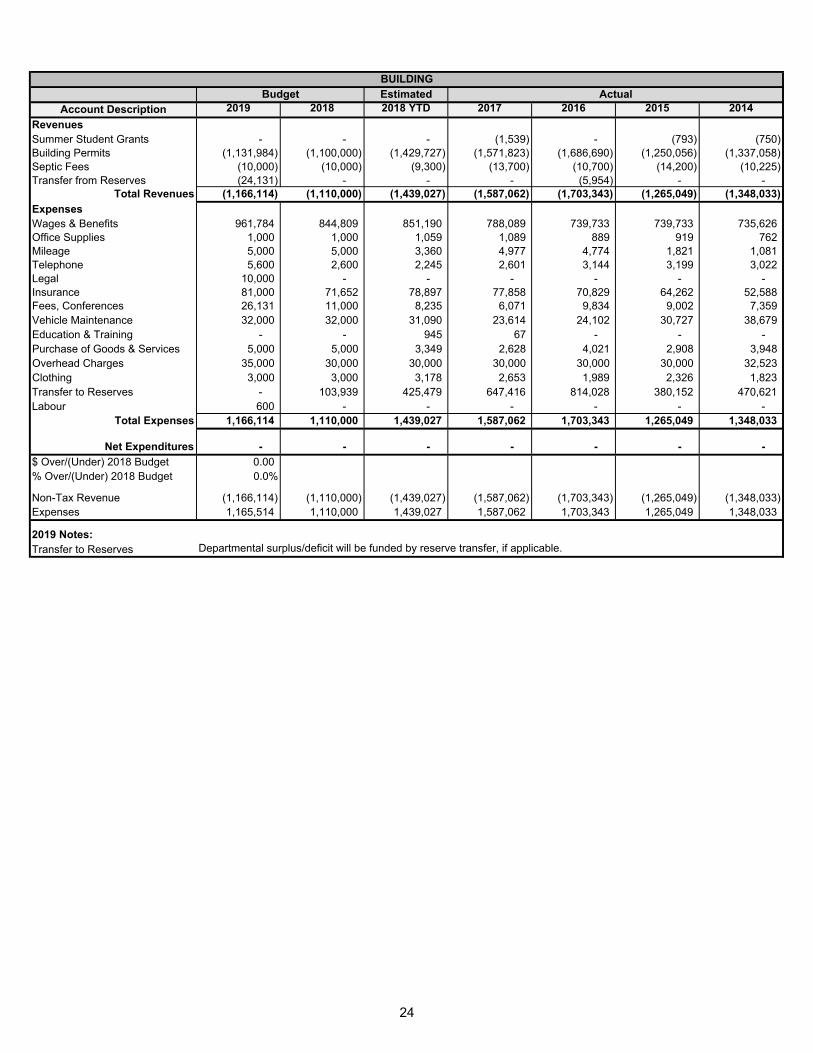
Account Description 2019 2018 2018 YTD 2017 2016 2015 2014
RevenuesSummer Student Grants - - - (1,539) - (793) (750)Building Permits (1,131,984) (1,100,000) (1,429,727) (1,571,823) (1,686,690) (1,250,056) (1,337,058)Septic Fees (10,000) (10,000) (9,300) (13,700) (10,700) (14,200) (10,225)Transfer from Reserves (24,131) - - - (5,954) - -
Total Revenues (1,166,114) (1,110,000) (1,439,027) (1,587,062) (1,703,343) (1,265,049) (1,348,033)
ExpensesWages & Benefits 961,784 844,809 851,190 788,089 739,733 739,733 735,626 Office Supplies 1,000 1,000 1,059 1,089 889 919 762Mileage 5,000 5,000 3,360 4,977 4,774 1,821 1,081Telephone 5,600 2,600 2,245 2,601 3,144 3,199 3,022Legal 10,000 - - - - - - Insurance 81,000 71,652 78,897 77,858 70,829 64,262 52,588Fees, Conferences 26,131 11,000 8,235 6,071 9,834 9,002 7,359Vehicle Maintenance 32,000 32,000 31,090 23,614 24,102 30,727 38,679Education & Training - - 945 67 - - - Purchase of Goods & Services 5,000 5,000 3,349 2,628 4,021 2,908 3,948Overhead Charges 35,000 30,000 30,000 30,000 30,000 30,000 32,523Clothing 3,000 3,000 3,178 2,653 1,989 2,326 1,823Transfer to Reserves - 103,939 425,479 647,416 814,028 380,152 470,621Labour 600 - - - - - -
Total Expenses 1,166,114 1,110,000 1,439,027 1,587,062 1,703,343 1,265,049 1,348,033
Net Expenditures - - - - - - -
$ Over/(Under) 2018 Budget 0.00% Over/(Under) 2018 Budget 0.0%
Non-Tax Revenue (1,166,114) (1,110,000) (1,439,027) (1,587,062) (1,703,343) (1,265,049) (1,348,033) Expenses 1,165,514 1,110,000 1,439,027 1,587,062 1,703,343 1,265,049 1,348,033
2019 Notes:Transfer to Reserves Departmental surplus/deficit will be funded by reserve transfer, if applicable.
BUILDING
Budget Actual
24

Estimated
Account Description 2019 2018 2018 YTD 2017 2016 2015 2014
RevenuesDog Tags (750) (750) (735) (890) (730) (630) (690)Court payments (4,000) (4,500) (2,898) (9,000) - (5,300) - Fines (3,500) (5,000) (1,261) (3,158) (2,691) (2,362) (1,332)Transient Traders Licences (1,500) (1,500) (1,355) (1,635) (1,255) (1,255) (2,005)Transfer from Organizational Review - - - (64,059) - - -
Total Revenues (9,750) (11,750) (6,249) (78,742) (4,676) (9,547) (4,027)
ExpensesWages & Benefits 93,600 85,300 86,367 62,371 18,031 18,031 17,635 Mileage - 1,500 - 12 60 - - Telephone 1,000 1,000 574 432 657 654 671Vehicle Maintenance 3,000 3,000 2,613 5,610 3,346 201 - Purchase of Goods & Services 12,000 12,000 7,363 7,505 11,310 7,680 4,499Gas & Oil 4,000 2,500 4,395 2,841 2,261 1,937 - Clothing 1,500 1,500 672 946 256 622 - Transfer to Reserves 12,800 30,000 30,000 12,766 50,938 - - Labour 594 - - - - - -
Total Expenses 128,494 136,800 131,984 92,483 86,859 29,126 22,806
Net Expenditures 118,744 125,050 125,735 13,741 82,183 19,579 18,779
$ Over/(Under) 2018 Budget (6,307)% Over/(Under) 2018 Budget -5.0%
Non-Tax Revenue (9,750) (11,750) (6,249) (78,742) (4,676) (9,547) (4,027) Expenses 127,900 136,800 131,984 92,483 86,859 29,126 22,806
2019 Notes:
BY-LAW ENFORCEMENT
Budget Actual
25

Estimated
Account Description 2019 2018 2018 YTD 2017 2016 2015 2014
General RevenuesInterest Income (15,000) (10,000) (9,500) (17,915) (9,352) (10,002) (11,296)
General Revenues (15,000) (10,000) (9,500) (17,915) (9,352) (10,002) (11,296)
ExpensesGeneralFees, Conferences - - 219 602 1,647 1,942 612 Transfer to Reserve Funds 10,000 10,000 10,000 9,855 9,352 10,002 11,296 Labour 21,179 - - - - - - Contract Services 900 - - - - - - TML Equipment 3,500 - - - - - -
General Expenses 35,579 10,000 10,219 10,458 10,999 11,944 11,908
Foot's BaySale of Plots - - (1,000) - - (2,600) (350) Internment Charges (600) (600) (350) (650) (450) (675) (775) Sale of Markers - - (59) - - (140) (200) Full Time - 2,030 1,214 1,774 1,924 2,161 1,340 Purchase of Markers 80 80 - - 93 - 182
Foot's Bay Net Expenses (520) 1,510 (195) 1,124 1,566 (1,254) 197
Glen OrchardSale of Plots (2,000) (2,000) (700) (3,150) (1,750) (1,050) (350) Internment Charges (2,500) (2,500) (850) (3,300) (5,600) (2,050) (2,400) Sale of Markers (300) (300) (140) (280) (140) (240) (100) Full Time - 7,917 3,580 4,831 7,021 4,641 3,899 Purchase of Markers 1,300 300 81 163 93 186 89 Purchase of Goods & Services 500 3,000 18 35 - 203 615
Glen Orchard Net Expenses (3,000) 6,417 1,990 (1,701) (376) 1,690 1,753
Milford BaySale of Plots - - - - - - - Internment Charges (400) (400) (350) (700) (1,300) (150) - Sale of Markers - - - - - - - Full Time - 1,000 702 1,494 1,343 788 620
Milford Bay Net Expenses (400) 600 352 794 43 638 620
Port CarlingSale of Plots - (100) - - - - Internment Charges (900) (900) (800) (850) (800) (1,850) (625) Sale of Markers - - - - - - - Full Time 4,974 1,106 2,578 4,372 5,122 1,078 Purchase of Markers 500 500 - - - - - Purchase of Goods & Services 500 8,000 - - 197 10 21
Port Carling Net Expenses 100 12,574 206 1,728 3,769 3,281 474
TorranceSale of Plots - - (2,820) (2,000) - (560) (1,050) Internment Charges (1,000) (1,000) (2,550) (1,800) (2,900) (4,950) (1,750) Sale of Markers (1,500) (1,500) (59) (560) (140) (420) (400) Full Time - 6,000 4,879 5,563 7,319 12,743 4,973 Purchase of Markers 350 350 - 326 81 279 408 Purchase of Goods & Services 250 250 607 58 - 417 100
Torrance Net Expenses (1,900) 4,100 58 1,587 4,360 7,508 2,281
UllswaterSale of Plots (1,500) (1,500) (700) (700) (350) - (1,050) Internment Charges (1,600) (1,600) (2,000) (2,500) (4,400) (650) (3,150) Sale of Markers (200) (200) - - (140) - (100) Full Time - 4,000 2,384 2,971 7,793 5,070 6,638 Purchase of Markers 100 100 - - 93 - 114 Purchase of Goods & Services 500 500 36 - 13 - -
Ullswater Net Expenses (2,700) 1,300 (280) (229) 3,009 4,420 2,451
UffordSale of Plots (800) (800) - 3,150 (700) (700) (2,100) Interment Charges (1,100) (1,100) (850) (1,150) (1,000) (1,150) (1,300) Sale of Markers (400) (400) - - (280) (140) (300)
CEMETERIES
Budget Actual
26

Estimated
Account Description 2019 2018 2018 YTD 2017 2016 2015 2014
CEMETERIES
Budget Actual
Full Time - 2,639 1,955 1,953 2,262 4,263 3,109 Purchase of Markers 500 500 - - 349 - 265 Purchase of Goods & Services 500 500 85 - - 1,000 -
Ufford Net Expenses (1,300) 1,339 1,190 3,953 631 3,273 (325)
MorinusInterment Charges (1,000) (1,000) - (1,000) - (150) - Full Time - 4,000 124 2,759 615 685 722
Morinus Net Expenses (1,000) 3,000 124 1,759 615 535 722
ZiskaSale of Plots - - 1,400 (350) (350) - - Internment Charges (1,000) (1,000) (150) (850) (650) - (25) Sale of Markers - - - - (140) - - Full Time 1,928 928 1,653 1,650 1,735 725 Purchase of Markers - - - 81 - - -
Ziska Net Expenses (1,000) 928 2,178 534 510 1,735 700
Net Expenditures 8,859 31,768 6,342 2,092 15,775 23,769 9,485
$ Over/(Under) 2018 Budget (22,910) % Over/(Under) 2018 Budget -72.1%
Non-Tax Revenue (31,800) (26,800) (21,477) (34,605) (30,442) (27,477) (27,321) Expenses 40,659 58,568 27,919 36,697 46,217 51,246 36,806
2019 Notes:
27

Estimated
Account Description 2019 2018 2018 YTD 2017 2016 2015 2014
ExpensesMilford BayHydro 2,460 2,460 1,187 1,488 1,873 2,262 1,334
Milford Bay Expenses 2,460 2,460 1,187 1,488 1,873 2,262 1,334
WindermereHydro 1,385 1,385 959 1,268 1,533 1,281 1,172
Windermere Expenses 1,385 1,385 959 1,268 1,533 1,281 1,172
Skeleton LakeHydro 615 615 269 359 403 471 665
Skeleton Lake Expenses 615 615 269 359 403 471 665
Nine MileHydro 615 615 502 622 724 660 577
Nine Mile Expenses 615 615 502 622 724 660 577
Net Expenditures 5,075 5,075 2,916 3,737 4,533 4,674 3,748
$ Over/(Under) 2018 Budget - % Over/(Under) 2018 Budget 0.0%Non-Tax Revenue - - - - - - - Expenses 5,075 5,075 2,916 3,737 4,533 4,674 3,748 2019 Notes:
DOCK LIGHTING
Budget Actual
28

Estimated
Account Description 2019 2018 2018 YTD 2017 2016 2015 2014
RevenuesBuilding Rentals (2,500) (2,000) (2,260) (1,750) (2,270) (2,250) (1,250)Insurance Recoveries (500) (500) - - (459) (513) (537)Donations - - - - (9,457) - - Labour Recovery (210,773) - - - - - - Summer Student Grants - - - - - (793) (750) TML Equipment Recovery (161,054) (6,500) (2,344) (8,797) - - - Docking Fees (16,000) (16,000) (19,043) (16,212) (21,688) (17,523) (16,493) Residential Rental Unit - - - - - - (7,000) Lockage Fees - - - - (44) (129,018) (103,830) Library Service Fee (708) (708) (708) (708) (708) - - Parkland Dedication - - - (36,969) (20,264) (40,270) (35,285) Total Revenues (391,535) (25,708) (24,355) (64,435) (54,889) (190,367) (165,146)
ExpensesGeneralWages & Benefits 550,207 346,194 326,496 287,493 269,666 296,537 311,638 Cleaning Supplies 4,300 4,300 3,659 4,190 3,283 3,547 2,993Telephone 1,200 2,400 1,056 927 2,045 2,250 2,445Insurance 23,824 20,535 22,612 22,315 23,071 20,564 18,274Equipment Rental & Repair 5,000 4,000 4,800 6,027 4,350 6,818 12,148Building Repairs & Maintenance 40,000 7,900 7,937 4,266 7,142 14,200 10,809Hydro 10,460 12,140 6,938 8,630 9,362 13,657 11,548Heat 1,020 1,020 1,034 775 558 964 1,208Fees, Conferences 2,000 2,000 84 - 243 2,087 3,453Vehicle Maintenance 48,000 35,000 53,794 39,555 44,737 52,105 56,758Purchase of Goods & Services 5,700 37,700 31,559 65,481 35,753 41,458 52,725Locks Operations - - - - 44 128,975 103,830Communities in Bloom 22,000 22,000 18,146 18,386 15,863 5,295 1,097Banners 1,600 - - 1,545 - - - Sewer 2,500 846 2,485 1,488 1,712 1,769 1,585Water 2,500 1,551 2,374 1,972 2,434 3,852 2,089Tipping Fees 6,000 5,500 8,716 6,268 7,405 4,184 3,791Health & Safety Committee 500 - - - - - - Emergency Events 5,000 - - - - - - Labour Management & Union Mee 1,500 - - - - - - Canine Goose Services 16,000 11,000 5,964 - - - - MNRF Land Use Permits 1,600 2,000 1,530 - - - - Snow Mobile Bridges 11,000 10,500 5,906 - - - - Community Cleanup Day 3,500 3,500 315 - - - - Material 31,900 2,000 3,595 2,217 2,873 1,343 2,156 Contract Services 26,600 - - - - - - TML Equipment 161,054 - - - - - -
Total Expenses 984,965 532,086 508,999 471,534 430,539 599,606 598,546
Net Expenditures 593,430 506,378 484,644 407,099 375,649 409,239 433,401
$ Over/(Under) 2018 Budget 87,052 % Over/(Under) 2018 Budget 17.2%
Non-Tax Revenue (391,535) (25,708) (24,355) (64,435) (54,889) (190,367) (165,146) Expenses 984,965 532,086 508,999 471,534 430,539 599,606 598,546
2019 Notes: New Financial Reporting Method in 2019: Asset Management Activiy Based Budget
CONSOLIDATED PARKS
Budget Actual
29
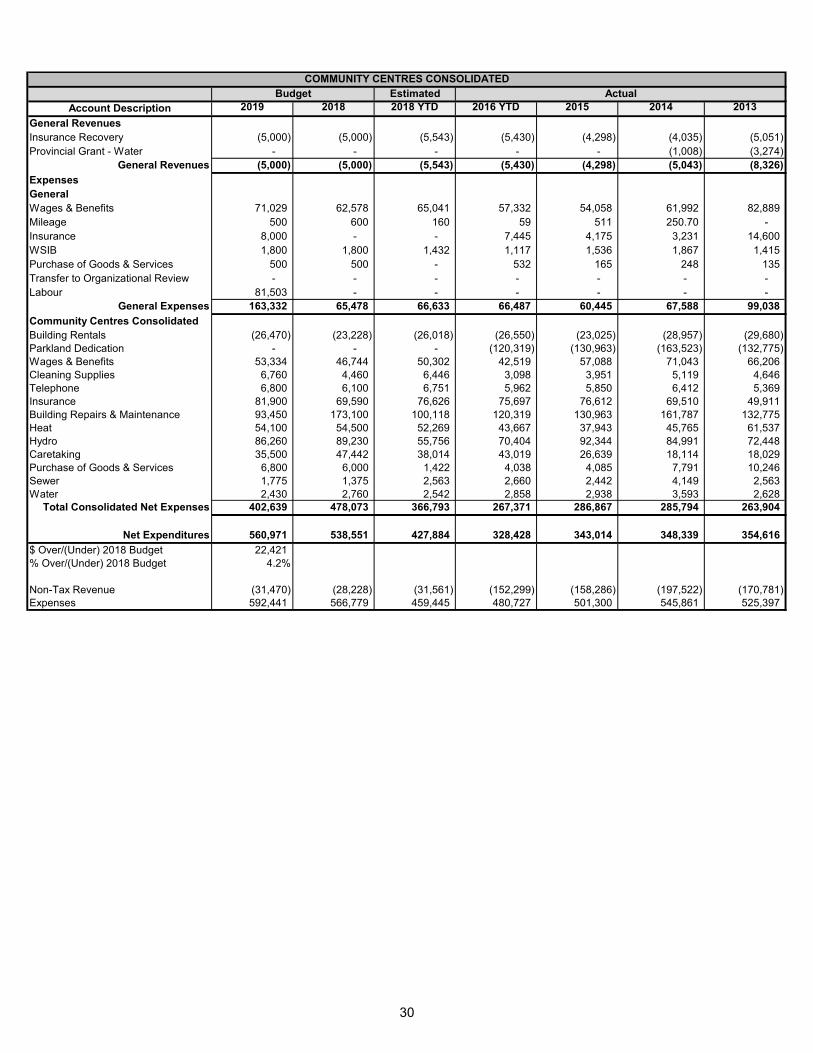
EstimatedAccount Description 2019 2018 2018 YTD 2016 YTD 2015 2014 2013
General RevenuesInsurance Recovery (5,000) (5,000) (5,543) (5,430) (4,298) (4,035) (5,051)Provincial Grant - Water - - - - - (1,008) (3,274)
General Revenues (5,000) (5,000) (5,543) (5,430) (4,298) (5,043) (8,326)
ExpensesGeneralWages & Benefits 71,029 62,578 65,041 57,332 54,058 61,992 82,889 Mileage 500 600 160 59 511 250.70 - Insurance 8,000 - - 7,445 4,175 3,231 14,600WSIB 1,800 1,800 1,432 1,117 1,536 1,867 1,415Purchase of Goods & Services 500 500 - 532 165 248 135 Transfer to Organizational Review - - - - - - - Labour 81,503 - - - - - -
General Expenses 163,332 65,478 66,633 66,487 60,445 67,588 99,038
Community Centres ConsolidatedBuilding Rentals (26,470) (23,228) (26,018) (26,550) (23,025) (28,957) (29,680)Parkland Dedication - - - (120,319) (130,963) (163,523) (132,775)Wages & Benefits 53,334 46,744 50,302 42,519 57,088 71,043 66,206Cleaning Supplies 6,760 4,460 6,446 3,098 3,951 5,119 4,646Telephone 6,800 6,100 6,751 5,962 5,850 6,412 5,369Insurance 81,900 69,590 76,626 75,697 76,612 69,510 49,911Building Repairs & Maintenance 93,450 173,100 100,118 120,319 130,963 161,787 132,775Heat 54,100 54,500 52,269 43,667 37,943 45,765 61,537Hydro 86,260 89,230 55,756 70,404 92,344 84,991 72,448Caretaking 35,500 47,442 38,014 43,019 26,639 18,114 18,029Purchase of Goods & Services 6,800 6,000 1,422 4,038 4,085 7,791 10,246Sewer 1,775 1,375 2,563 2,660 2,442 4,149 2,563Water 2,430 2,760 2,542 2,858 2,938 3,593 2,628
Total Consolidated Net Expenses 402,639 478,073 366,793 267,371 286,867 285,794 263,904
Net Expenditures 560,971 538,551 427,884 328,428 343,014 348,339 354,616
$ Over/(Under) 2018 Budget 22,421% Over/(Under) 2018 Budget 4.2%
Non-Tax Revenue (31,470) (28,228) (31,561) (152,299) (158,286) (197,522) (170,781)Expenses 592,441 566,779 459,445 480,727 501,300 545,861 525,397
BudgetCOMMUNITY CENTRES CONSOLIDATED
Actual
30

Bala
ITEM DESCRIPTION DRAFT
Operating
Requested by (H) = Hall Board (T) =
Township
DRAFTCapital
Requested by (H) = Hall Board (T) = Township
APPROVEDOperating
APPROVED Capital
Operating
Routine maintenance 4,500 T 4,500 Unanticipated repairs 3,000 T 3,000
01-2-071201-06509 7,500 - 7,500 -
Recycling Units 500 H 500 01-2-071201-06525 500 - 500 -
Capital
New eavestrough 2,800 T 2,800
02-2-071201-06707 - 2,800 - 2,800
TOTAL 8,000 2,800 8,000 2,800
Cardwell
ITEM DESCRIPTION DRAFTOperating
Requested by (H) = Hall Board (T) = Township
DRAFTCapital
Requested by (H) = Hall Board (T) = Township
APPROVEDOperating
APPROVED Capital
Operating
Routine maintenance 2,000 T 2,000 Unanticipated repairs 1,000 T 1,000
01-2-071202-06509 3,000 - 3,000 -
Purchases of Goods and Services 500 T 500 01-2-071202-06525 500 - 500 -
CapitalAluminum Fascia and Soffit 2,500 T 2,500
02-2-071202-06707 - 2,500 - 2,500
TOTAL 3,500 2,500 3,500 2,500
Community Centre Facility - 2019 Building Repair and Maintenance and Capital Budget
31

Foots Bay
ITEM DESCRIPTION DRAFT
Operating
Requested by (H) = Hall Board (T) =
Township
DRAFTCapital
Requested by (H) = Hall Board (T) = Township
APPROVEDOperating
APPROVED Capital
Operating
Routine maintenance 3,000 T 3,000 Unanticipated repairs 2,000 T 2,000 Paint interior walls 1,500 H 1,500
01-2-071203-06509 6,500 - 6,500 -
Microwave 300 H 300 New Phone 50 H 50
01-2-071203-06525 350 - 350 -
Capital Ceiling Fans 3,000 H 3,000
02-2-071203-06705 - 3,000 - 3,000
TOTAL 6,850 3,000 6,850 3,000
Glen Orchard
ITEM DESCRIPTION DRAFT
Operating
Requested by (H) = Hall Board (T) =
Township
DRAFTCapital
Requested by (H) = Hall Board (T) = Township
APPROVEDOperating
APPROVED Capital
Operating
Routine maintenance 4,000 T 4,000 Unanticipated repairs 4,000 T 4,000
01-2-071204-06509 8,000 - 8,000 -
Purchase of Goods and Services 500 T 500 01-2-071204-06525 500 - 500 -
Capital 02-2-071204-0670 - - - -
TOTAL 8,500 - 8,500 -
32
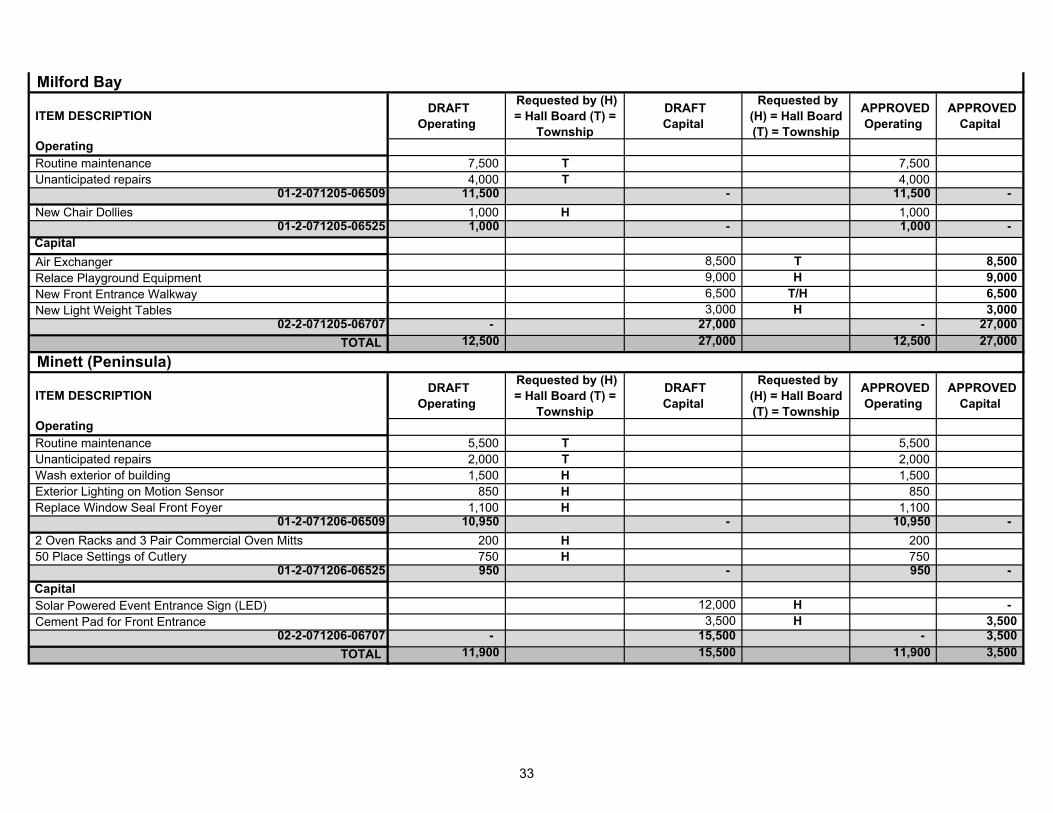
Milford Bay
ITEM DESCRIPTION DRAFT
Operating
Requested by (H) = Hall Board (T) =
Township
DRAFTCapital
Requested by (H) = Hall Board (T) = Township
APPROVEDOperating
APPROVED Capital
Operating
Routine maintenance 7,500 T 7,500 Unanticipated repairs 4,000 T 4,000
01-2-071205-06509 11,500 - 11,500 -
New Chair Dollies 1,000 H 1,000 01-2-071205-06525 1,000 - 1,000 -
Capital
Air Exchanger 8,500 T 8,500 Relace Playground Equipment 9,000 H 9,000 New Front Entrance Walkway 6,500 T/H 6,500 New Light Weight Tables 3,000 H 3,000
02-2-071205-06707 - 27,000 - 27,000
TOTAL 12,500 27,000 12,500 27,000
Minett (Peninsula)
ITEM DESCRIPTION DRAFT
Operating
Requested by (H) = Hall Board (T) =
Township
DRAFTCapital
Requested by (H) = Hall Board (T) = Township
APPROVEDOperating
APPROVED Capital
Operating
Routine maintenance 5,500 T 5,500 Unanticipated repairs 2,000 T 2,000 Wash exterior of building 1,500 H 1,500 Exterior Lighting on Motion Sensor 850 H 850 Replace Window Seal Front Foyer 1,100 H 1,100
01-2-071206-06509 10,950 - 10,950 -
2 Oven Racks and 3 Pair Commercial Oven Mitts 200 H 200 50 Place Settings of Cutlery 750 H 750
01-2-071206-06525 950 - 950 -
Capital Solar Powered Event Entrance Sign (LED) 12,000 H - Cement Pad for Front Entrance 3,500 H 3,500
02-2-071206-06707 - 15,500 - 3,500
TOTAL 11,900 15,500 11,900 3,500
33
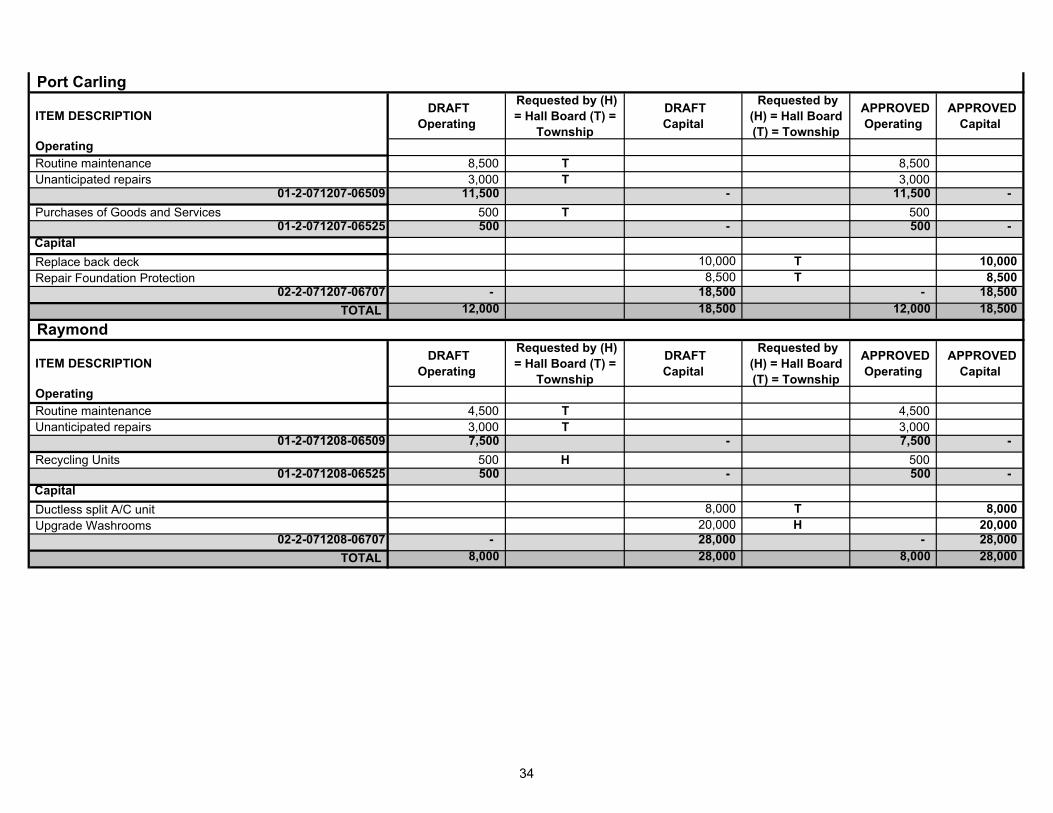
Port Carling
ITEM DESCRIPTION DRAFT
Operating
Requested by (H) = Hall Board (T) =
Township
DRAFTCapital
Requested by (H) = Hall Board (T) = Township
APPROVEDOperating
APPROVED Capital
Operating
Routine maintenance 8,500 T 8,500 Unanticipated repairs 3,000 T 3,000
01-2-071207-06509 11,500 - 11,500 -
Purchases of Goods and Services 500 T 500 01-2-071207-06525 500 - 500 -
Capital
Replace back deck 10,000 T 10,000 Repair Foundation Protection 8,500 T 8,500
02-2-071207-06707 - 18,500 - 18,500
TOTAL 12,000 18,500 12,000 18,500
Raymond
ITEM DESCRIPTION DRAFT
Operating
Requested by (H) = Hall Board (T) =
Township
DRAFTCapital
Requested by (H) = Hall Board (T) = Township
APPROVEDOperating
APPROVED Capital
Operating
Routine maintenance 4,500 T 4,500 Unanticipated repairs 3,000 T 3,000
01-2-071208-06509 7,500 - 7,500 -
Recycling Units 500 H 500 01-2-071208-06525 500 - 500 -
Capital
Ductless split A/C unit 8,000 T 8,000 Upgrade Washrooms 20,000 H 20,000
02-2-071208-06707 - 28,000 - 28,000
TOTAL 8,000 28,000 8,000 28,000
34

Torrance
ITEM DESCRIPTION DRAFT
Operating
Requested by (H) = Hall Board (T) =
Township
DRAFTCapital
Requested by (H) = Hall Board (T) = Township
APPROVEDOperating
APPROVED Capital
Operating
Routine maintenance 6,500 T 6,500 Unanticipated repairs 2,000 T 2,000
01-2-071209-06509 8,500 - 8,500 -
Recycling Units 500 H 500 01-2-071209-06525 500 - 500 -
Capital New Event Sign 5,000 H 5,000 Improvements to Office/Library Area 1,500 H 1,500 Landscaping Improvments 1,000 H 1,000 6 Spot Lights/Electrical for Dart Boards 5,000 H 5,000 Install Electric Heater in Womens Washroom Upstairs 1,500 H 1,500
02-2-071209-0670 - 14,000 - 14,000
TOTAL 9,000 14,000 9,000 14,000
Walkers Point
ITEM DESCRIPTION DRAFT
Operating
Requested by (H) = Hall Board (T) =
Township
DRAFTCapital
Requested by (H) = Hall Board (T) = Township
APPROVEDOperating
APPROVED Capital
Operating
Routine maintenance 6,500 T 6,500 Unanticipated repairs 2,000 T 2,000
01-2-071210-06509 8,500 - 8,500 -
Replace Missing Microphone/Batteries 500 H 500 01-2-071210-06525 500 - 500 -
Capital Emergency Generator (question on cost - can we reduce) 75,000 H Run Power to 6x6 Pole out Back with Parking Lot Lighting 6,000 H 6,000 Shade structure for Playground Area 3,500 H 3,500
02-2-071210-06707 - 84,500 - 9,500
TOTAL 9,000 84,500 9,000 9,500
35

Windermere
ITEM DESCRIPTION DRAFT
Operating
Requested by (H) = Hall Board (T) =
Township
DRAFTCapital
Requested by (H) = Hall Board (T) = Township
APPROVEDOperating
APPROVED Capital
Operating
Routine maintenance 3,000 T 3,000 Unanticipated repairs 2,000 T 2,000
01-2-071211-06509 5,000 - 5,000 -
Large Plastic Garbage Can 500 H 500 01-2-071211-06525 500 - 500 -
Capital
02-2-071211-06707 - - - -
TOTAL 5,500 - 5,500 -
Ullswater
ITEM DESCRIPTION DRAFT
Operating
Requested by (H) = Hall Board (T) =
Township
DRAFTCapital
Requested by (H) = Hall Board (T) = Township
APPROVEDOperating
APPROVED Capital
Operating
Routine maintenance 3,500 T 3,500 Unanticipated repairs 1,500 T 1,500
01-2-071212-06509 5,000 - 5,000 -
Purchases of Goods and services 500 T 500 01-2-071212-06525 500 - 500 -
Capital
Pave Parking Lot 12,000 H 12,000 Engineers Report to remove cement block pillars, replace with Jack Posts and Box them in. 3,500 H 3,500
12 Lightweight Plastic 6 Ft.Tables 1,800 H 1,800 02-2-071212-06707 - 17,300 - 17,300
TOTAL 5,500 17,300 5,500 17,300
Total 100,250$ 213,100$ 100,250$ 126,100$
36

Estimated
Account Description 2019 2018 2018 YTD 2017 2016 2015 2014
RevenuesPublic Skating (3,200) (3,700) (4,004) (4,315) (2,255) (4,756) (3,751)Ice Rental - Minor Hockey (11,000) (10,100) (16,500) (13,929) (15,909) (22,196) (25,192)Ice Rental - Figure Skating (20,000) (21,500) (23,427) (23,096) (22,643) (20,725) (22,932)Ice Rental - Other (75,000) (59,000) (91,360) (89,492) (85,260) (79,299) (70,353)Roller Skating (2,600) (3,800) (1,686) (5,110) (3,163) (3,098) (2,576)Building Rental (12,000) (10,000) (15,016) (10,909) (8,506) (10,722) (11,533)Pop Machine (400) (400) (458) (420) (265) (262) 548Snack Bar (4,000) (4,800) (2,823) (4,001) (1,789) (2,084) (1,034)Advertising Revenue (6,500) (6,400) (6,557) (6,904) (4,800) (4,900) (4,350)Insurance Recovery (1,900) (2,500) (3,398) (3,127) (2,985) (3,177) (2,804)Parkland Dedication - - - (64,384) (69,749) (69,827) (71,127)
Total Revenues (136,600) (122,200) (165,230) (225,687) (217,325) (221,045) (215,103)
ExpensesWages & Benefits 305,127 319,100 313,634 308,814 297,149 290,792 275,092 Office Supplies 500 500 691 314 241 371 387Cleaning Supplies 2,200 2,200 3,220 2,772 2,295 1,700 2,618Equipment 19,350 17,000 5,737 13,578 6,978 6,901 4,999Mileage 750 750 272 496 350 754 139Telephone 1,690 1,690 1,837 1,420 1,212 1,127 1,076Insurance 34,800 30,000 33,033 35,651 35,581 32,896 26,642Building Repairs & Maintenance 34,450 76,850 55,149 64,384 69,749 69,827 61,173Heat 17,500 17,500 17,612 14,784 12,700 15,328 20,664Hydro 115,000 115,000 104,179 112,605 137,277 119,955 109,095Fees, Conferences 6,100 7,500 6,527 3,692 3,789 3,475 2,125Purchase of Goods & Services 1,400 1,400 2,091 1,001 1,209 1,568 6,970Plant Maintenance 24,300 20,700 19,545 17,511 20,940 26,321 19,409Ice Resurfacer Maintenance 11,400 13,900 10,987 4,831 9,931 2,889 9,587Sewer 2,650 2,650 1,299 2,015 2,846 1,258 3,492Water 9,000 9,000 4,934 7,269 11,791 5,110 12,709Snack Bar Expenses 2,500 2,500 1,683 2,636 - - - Transfer to Reserves 100,000 20,000 20,000 23,664 20,000 20,000 20,000Labour 20,500 - - - - - -
Total Expenses 709,217 658,240 602,430 617,436 634,041 600,274 576,178
Net Expenditures 572,617 536,040 437,201 391,749 416,715 379,228 361,075
$ Over/(Under) 2018 Budget 36,577% Over/(Under) 2018 Budget 6.8%
Non-Tax Revenue (136,600) (122,200) (165,230) (225,687) (217,325) (221,045) (215,103)Expenses 709,217 658,240 602,430 617,436 634,041 600,274 576,178
2019 Notes:
Transfer to Reserves: Increase Contribution for future replacement of Arena capital infrastructure
Budget Actual
CONSOLIDATED ARENAS
37

Estimated
Account Description 2019 2018 2018 YTD 2017 2016 2015 2014
General ExpensesSundry Revenue (800) (800) (162) (360) (810) - - Wages & Benefits 6,400 6,114 551 4,897 5,831 4,523 - Mileage 200 200 784 181 1,343 857 649 Fees, Conferences 300 300 148 294 196 385 545 Purchase of Goods & Services 800 800 1,022 784 1,713 548 119 Ecommerce Fees 500 500 377 413 454 - -
General Expenses 7,400 7,114 2,719 6,209 8,727 6,313 1,313
BalaRegistrations & Memberships (4,000) (4,000) (3,910) (3,730) (4,950) (4,000) (1,775) Wages & Benefits 10,600 11,122 9,785 9,669 7,670 4,376 3,947 Telephone - - - - - - 379 Purchase of Goods & Services 950 950 18 885 105 289 165
Bala Net Expenses 7,550 8,072 5,892 6,824 2,825 665 2,716
Milford BayRegistrations & Memberships - - - - (1,075) (1,200) (935) Wages & Benefits - - - - 4,124 2,140 3,469 Telephone - - - - - - 577 Purchase of Goods & Services - - - - 105 - 55
Milford Bay Net Expenses - - - - 3,154 940 3,166
Port CarlingRegistrations & Memberships (10,000) (10,000) (8,739) (9,470) (7,680) (7,454) (6,257) Wages & Benefits 10,600 11,122 8,770 14,152 10,763 8,250 11,150 Telephone - - - - - - 340 Purchase of Goods & Services 1,388 1,388 19 481 345 960 897
Port Carling Net Expenses 1,988 2,510 50 5,162 3,428 1,756 6,129
Walker's PointRegistrations & Memberships - - - - - (825) (750) Wages & Benefits - - - - - 1,766 4,311 Purchase of Goods & Services - - - - - 117 146
Walker's Point Net Expenses - - - - - 1,057 3,707
WindermereRegistrations & Memberships (2,000) - - - (1,325) (1,980) (1,975) Wages & Benefits 4,000 - - - 3,395 3,650 - Telephone - - - - - 540 538 Purchase of Goods & Services 250 - - 331 105 170 165
Windermere Net Expenses 2,250 - - 331 2,174 2,380 (1,272)
Net Expenditures 19,188 17,696 8,662 18,526 20,308 13,111 15,758
$ Over/(Under) 2018 Budget 1,492 % Over/(Under) 2018 Budget 8.4%
Non-Tax Revenue (16,800) (14,800) (12,811) (13,560) (15,840) (15,459) (11,692)Expenses 35,988 32,496 21,473 32,086 36,148 28,569 27,451
2019 Notes:Head Swim Instructor oraganized swim program and therefore wages recorded as general. No telephone expense as instructors used their own personal cell phones, in employment agreement
SWIMMING
Budget Actual
38

Estimated
Account Description 2019 2018 2018 YTD 2017 2016 2015 2014
RevenuesLibrary Service Fee (4,012) (4,012) (4,012) (4,012) - - - Labour Recovery (36,322) - - - - - - Equipment Recovery (13,000) - - - - - -
Revenues (53,334) (4,012) (4,012) (4,012) - - -
General ExpensesWages & Benefits 177,300 189,900 171,652 166,708 162,275 136,402 131,850 Telephone 1,400 1,200 1,509 1,420 1,477 1,314 1,369 Insurance 5,000 3,540 3,898 3,847 3,896 3,535 2,199 Building Repairs & Maintenance 500 500 543 310 788 126 355 Hydro 6,500 6,860 4,219 6,121 7,741 3,490 3,510 Vehicle Maintenance 4,000 3,000 4,111 4,362 2,972 10,786 6,939 Education & Training 500 500 (1,800) 1,800 - - 3,202 Purchase of Goods & Services 7,000 7,000 7,240 8,257 7,969 9,547 10,307 Gas & Oil 9,000 4,000 8,927 7,688 6,454 1,253 10,557 Water Testing 3,000 3,500 2,618 2,528 3,864 4,844 5,245 Materials 54,850 40,000 31,158 33,770 15,837 26,070 24,477 TML Equipment 14,500 - - - - - - Rented Equipment - - - - - - - Small Tools 1,000 - - - - - - Transfer to Reserves 10,000 10,000 10,000 10,200 10,000 10,000 10,000
Total General Expenses 294,550 270,000 244,076 247,011 223,272 207,368 210,010
Net Expenditures 241,216 265,988 240,064 242,999 223,272 207,368 210,010
$ Over/(Under) 2018 Budget (24,772) % Over/(Under) 2018 Budget -9.3%
Non-Tax Revenue (53,334) (4,012) (4,012) (4,012) - - - Expenses 294,550 270,000 244,076 247,011 223,272 207,368 210,010
2019 Notes: New Financial Reporting Method in 2019: Asset Management Activiy Based Budget
MAINTENANCE DEPARTMENT CONSOLIDATED
Budget Actual
39
Estimated
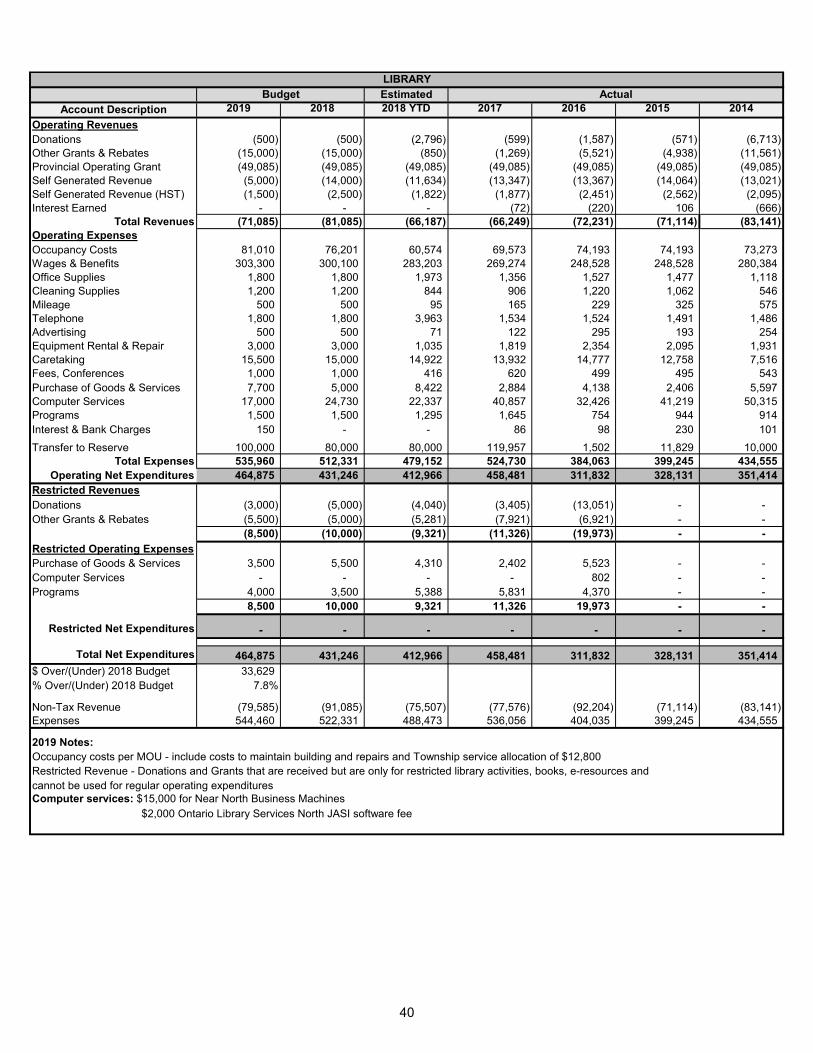
Account Description 2019 2018 2018 YTD 2017 2016 2015 2014
Operating RevenuesDonations (500) (500) (2,796) (599) (1,587) (571) (6,713) Other Grants & Rebates (15,000) (15,000) (850) (1,269) (5,521) (4,938) (11,561) Provincial Operating Grant (49,085) (49,085) (49,085) (49,085) (49,085) (49,085) (49,085) Self Generated Revenue (5,000) (14,000) (11,634) (13,347) (13,367) (14,064) (13,021) Self Generated Revenue (HST) (1,500) (2,500) (1,822) (1,877) (2,451) (2,562) (2,095) Interest Earned - - - (72) (220) 106 (666)
Total Revenues (71,085) (81,085) (66,187) (66,249) (72,231) (71,114) (83,141) Operating ExpensesOccupancy Costs 81,010 76,201 60,574 69,573 74,193 74,193 73,273 Wages & Benefits 303,300 300,100 283,203 269,274 248,528 248,528 280,384 Office Supplies 1,800 1,800 1,973 1,356 1,527 1,477 1,118 Cleaning Supplies 1,200 1,200 844 906 1,220 1,062 546 Mileage 500 500 95 165 229 325 575 Telephone 1,800 1,800 3,963 1,534 1,524 1,491 1,486 Advertising 500 500 71 122 295 193 254 Equipment Rental & Repair 3,000 3,000 1,035 1,819 2,354 2,095 1,931 Caretaking 15,500 15,000 14,922 13,932 14,777 12,758 7,516 Fees, Conferences 1,000 1,000 416 620 499 495 543 Purchase of Goods & Services 7,700 5,000 8,422 2,884 4,138 2,406 5,597 Computer Services 17,000 24,730 22,337 40,857 32,426 41,219 50,315 Programs 1,500 1,500 1,295 1,645 754 944 914 Interest & Bank Charges 150 - - 86 98 230 101
Transfer to Reserve 100,000 80,000 80,000 119,957 1,502 11,829 10,000 Total Expenses 535,960 512,331 479,152 524,730 384,063 399,245 434,555
Operating Net Expenditures 464,875 431,246 412,966 458,481 311,832 328,131 351,414Restricted RevenuesDonations (3,000) (5,000) (4,040) (3,405) (13,051) - - Other Grants & Rebates (5,500) (5,000) (5,281) (7,921) (6,921) - -
(8,500) (10,000) (9,321) (11,326) (19,973) - -
Restricted Operating ExpensesPurchase of Goods & Services 3,500 5,500 4,310 2,402 5,523 - - Computer Services - - - - 802 - - Programs 4,000 3,500 5,388 5,831 4,370 - -
8,500 10,000 9,321 11,326 19,973 - -
Restricted Net Expenditures - - - - - - -
Total Net Expenditures 464,875 431,246 412,966 458,481 311,832 328,131 351,414
$ Over/(Under) 2018 Budget 33,629 % Over/(Under) 2018 Budget 7.8%
Non-Tax Revenue (79,585) (91,085) (75,507) (77,576) (92,204) (71,114) (83,141)Expenses 544,460 522,331 488,473 536,056 404,035 399,245 434,555
2019 Notes:Occupancy costs per MOU - include costs to maintain building and repairs and Township service allocation of $12,800Restricted Revenue - Donations and Grants that are received but are only for restricted library activities, books, e-resources andcannot be used for regular operating expendituresComputer services: $15,000 for Near North Business Machines $2,000 Ontario Library Services North JASI software fee
LIBRARY
Budget Actual
40

Estimated
Account Description 2019 2018 2018 YTD 2017 2016 2015 2014
ExpensesWages & Benefits 9,000 13,294 8,583 8,632 17,225 9,564 9,522 Mileage 800 800 601 848 844 1,511 931 Telephone 50 50 61 31 244 244 244 Purchase of Goods & Services 13,500 3,500 863 4,530 19,495 200 1,620 Trails Committee 200 200 - - - - -
Total Expenses 23,550 17,844 10,108 14,040 37,808 11,520 12,317
Net Expenditures 23,550 17,844 10,108 14040 37,808 11,520 12,317
$ Over/(Under) 2018 Budget 5,706 % Over/(Under) 2018 Budget 32.0%
Non-Tax Revenue - - - - - - - Expenses 23,550 17,844 10,108 14,040 37,808 11,520 12,317
2019 Notes:
TRAILS
Budget Actual
41

Estimated
Account Description 2019 2018 2018 YTD 2017 2016 2015 2014
RevenuesDeeming By-Law (3,000) (3,000) (1,600) (5,600) (3,600) (4,275) (1,125) Official Plan Amendment (2,000) (1,275) (2,525) 375 (375) - (1,340) Zoning Amendment (50,000) (50,000) (58,138) (57,925) (58,400) (53,275) (40,300) Zoning & By-Law Information (25,000) (22,000) (32,250) (28,775) (23,900) (19,575) (16,500) Site Plan (65,000) (62,000) (61,950) (60,813) (58,863) (23,720) (51,356) Minor Variance (55,000) (55,000) (65,600) (57,250) (71,225) (59,975) (50,700) Severances / Consents (65,000) (65,000) (71,300) (79,151) (70,275) (66,275) (48,850) Legal/Misc Recovered (5,000) (5,000) (2,379) (987) (16,257) (6,167) - Consultants Recoverable (7,000) (6,000) (8,163) (4,505) (11,291) (7,670) (5,699) Tree Pres. & Site Alt. (500) (1,500) (1,000) - - - - Solar Farms GE/Cell Towers CT (1,500) - (3,000) (2,250) - (1,500) - Transfer from Reserves (70,000) - - - - - - Transfer from Bala Heritage Reser (5,000) (7,300) (3,000) (2,595) (18,926) (6,000) (29,716)
Total Revenue (354,000) (278,075) (310,904) (299,475) (333,112) (248,432) (245,585)
ExpensesWages & Benefits 709,025 647,100 600,711 601,251 557,381 557,381 550,830 Office Supplies 1,000 1,000 627 601 423 343 860 Mileage 500 3,000 1,161 3,168 3,195 2,944 3,436 Telephone 1,000 1,000 841 829 1,090 1,089 845 Advertising 2,000 2,000 - 1,403 - 1,945 366 Legal - Other 125,000 30,000 114,361 30,651 18,349 29,704 11,561 Fees, Conferences 7,000 7,000 2,853 5,282 5,035 4,077 3,316 Education & Training 2,000 2,000 1,848 1,908 1,366 322 - Purchase of Goods & Services 11,000 11,000 10,007 12,138 12,427 7,126 11,834 Heritage Committee 5,000 7,300 3,000 2,595 18,926 16,754 45,460 Consultant Fees 20,000 25,000 12,690 27,312 27,581 16,335 77,313 Hearings 40,000 60,000 - - - - - Committee of Adjustment 18,000 16,000 14,882 19,349 14,028 16,564 13,019 Vehicle Maintenance 3,000 - - - - - - Gas&Oil 2,000 - 483 - - - - Legal - LPAT Hearings 120,000 130,000 79,531 20,438 59,090 67,056 25,722 Minett Joint Steering Committee 125,000 - 16,400 - - - - Consultant Fees - Zoning - - - - 15,421 14,011 29,716 Zoning Official Plan Review 70,000 - - - - - - Transfer to Reserves 10,000 10,000 10,000 26,810 10,000 10,000 30,000
Total Expenses 1,271,525 952,400 869,396 753,734 744,311 745,650 804,277
Net Expenditures 917,525 674,325 558,491 454,260 411,199 497,218 558,691
$ Over/(Under) 2018 Budget 243,200% Over/(Under) 2018 Budget 36.1%
Non-Tax Revenue (354,000) (278,075) (310,904) (299,475) (333,112) (248,432) (245,585) Expenses 1,352,650 952,400 869,396 753,734 744,311 745,650 804,277
2019 Notes:Legal LPAT: Increase in significant hearings
Legal Other: Township served with several actions
Minett Joint Steering Committee - this amount represents the Township's portionNew Items: Commencement of Official Plan Review, Minett Joint Steering CommitteeWages & Benefits: New FTE Planner/GIS analyst Transfer from reserves: To cover costs of Zoning Official Plan Review
PLANNING
Budget Actual
42

Estimated
Account Description 2019 2018 2018 YTD 2017 2016 2015 2014
RevenuesTransfer from Reserves (8,500) (8,480) (8,480)
Total Revenues (8,500) - - - - (8,480) (8,480)
ExpensesAttainable Housing 8,500 - - - - 8,480 8,480 Festival and Events Grant 20,000 - - - - - - Community Grant 20,000 40,709 33,369 19,966 11,500 16,111 13,100 Operating Grant 97,407 99,907 99,907 88,966 98,452 107,045 102,005Canada 150 Grants - - - 27,716 - - - Transfer to Reserves 8,500 8,480 8,480 8,480 8,480 - -
Total Expenses 154,407 149,096 141,756 145,128 118,432 131,636 123,585
Net Expenditures 145,907 149,096 141,756 145,128 118,432 123,156 115,105
$ Over/(Under) 2018 Budget (3,189) % Over/(Under) 2018 Budget -2.1%
Non-Tax Revenue (8,500) - - - - (8,480) (8,480) Expenses 154,407 149,096 141,756 145,128 118,432 131,636 123,585
Grants calculated per revised Township policy C-FS-09.
Policy consists of three grant categories: Festival and Events, Community and Operating grants.
1. Festival and Events Grants
2. Community Grants
3. Operating Grants
GRANTS
Budget Actual
43

Estimated
Account Description 2019 2018 2018 YTD 2017 2016 2015 2014
RevenuesBuilding Rentals - - - - (3) - - Advertising Sales (500) - (320) - - - - Expense Recovery - - - (2,357) (1,552) -
Total Revenues (500) - (320) (2,357) (1,555) - -
ExpensesCleaning Supplies 500 500 - - - - - Building Repairs & Maintenance 5,000 7,600 13,020 9,359 8,171 - - Heat 5,000 7,900 3,476 1,889 5,310 - - Hydro 5,000 7,000 4,124 5,166 4,850 - - Sewer 600 600 363 479 718 - - Water 1,000 1,000 778 1,029 1,148 - - Insurance 8,100 4,300 5,998 4,672 - - - Caretaking - 400 - - 186 - - Telephone 700 700 451 410 611 - - Labour 9,000 - - - - - - Nursing Station Operations 34,900 30,000 28,211 23,004 20,996 - -
Transfer to Nursing station Reserve - - - 12,923 12,923 - -
Total Expenses 34,900 30,000 28,211 35,927 33,919 - -
Net Expenditures 34,400 30,000 27,891 33,570 32,364 - -
$ Over/(Under) 2018 Budget 4,400
% Over/(Under) 2018 Budget 14.7%
Non-Tax Revenue (500) - (320) (2,357) - - - Expenses 34,900 30,000 28,211 35,927 32,364 - -
2019 Notes:
Health Hub/Wellness Centre
Budget Actual
44
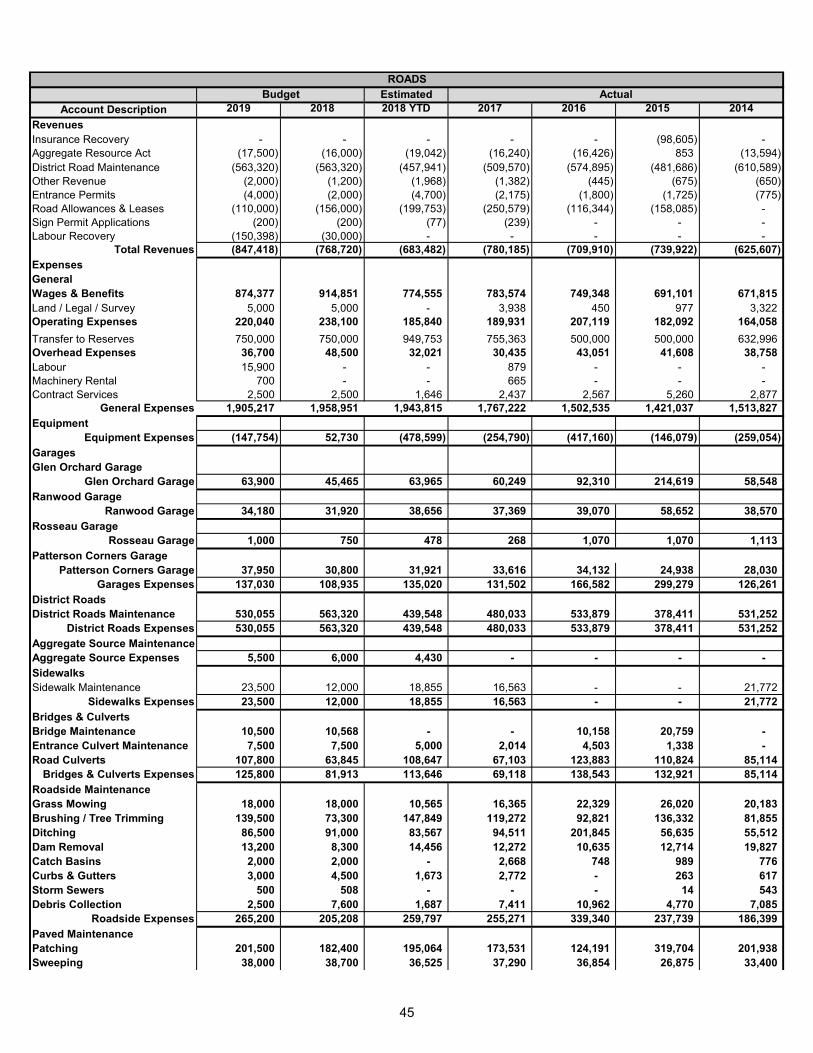
Estimated
Account Description 2019 2018 2018 YTD 2017 2016 2015 2014
RevenuesInsurance Recovery - - - - - (98,605) - Aggregate Resource Act (17,500) (16,000) (19,042) (16,240) (16,426) 853 (13,594) District Road Maintenance (563,320) (563,320) (457,941) (509,570) (574,895) (481,686) (610,589) Other Revenue (2,000) (1,200) (1,968) (1,382) (445) (675) (650) Entrance Permits (4,000) (2,000) (4,700) (2,175) (1,800) (1,725) (775) Road Allowances & Leases (110,000) (156,000) (199,753) (250,579) (116,344) (158,085) - Sign Permit Applications (200) (200) (77) (239) - - - Labour Recovery (150,398) (30,000) - - - - -
Total Revenues (847,418) (768,720) (683,482) (780,185) (709,910) (739,922) (625,607)
ExpensesGeneralWages & Benefits 874,377 914,851 774,555 783,574 749,348 691,101 671,815 Land / Legal / Survey 5,000 5,000 - 3,938 450 977 3,322 Operating Expenses 220,040 238,100 185,840 189,931 207,119 182,092 164,058
Transfer to Reserves 750,000 750,000 949,753 755,363 500,000 500,000 632,996 Overhead Expenses 36,700 48,500 32,021 30,435 43,051 41,608 38,758 Labour 15,900 - - 879 - - - Machinery Rental 700 - - 665 - - - Contract Services 2,500 2,500 1,646 2,437 2,567 5,260 2,877
General Expenses 1,905,217 1,958,951 1,943,815 1,767,222 1,502,535 1,421,037 1,513,827
EquipmentEquipment Expenses (147,754) 52,730 (478,599) (254,790) (417,160) (146,079) (259,054)
GaragesGlen Orchard Garage
Glen Orchard Garage 63,900 45,465 63,965 60,249 92,310 214,619 58,548
Ranwood GarageRanwood Garage 34,180 31,920 38,656 37,369 39,070 58,652 38,570
Rosseau GarageRosseau Garage 1,000 750 478 268 1,070 1,070 1,113
Patterson Corners GaragePatterson Corners Garage 37,950 30,800 31,921 33,616 34,132 24,938 28,030
Garages Expenses 137,030 108,935 135,020 131,502 166,582 299,279 126,261
District RoadsDistrict Roads Maintenance 530,055 563,320 439,548 480,033 533,879 378,411 531,252
District Roads Expenses 530,055 563,320 439,548 480,033 533,879 378,411 531,252
Aggregate Source MaintenanceAggregate Source Expenses 5,500 6,000 4,430 - - - -
SidewalksSidewalk Maintenance 23,500 12,000 18,855 16,563 - - 21,772
Sidewalks Expenses 23,500 12,000 18,855 16,563 - - 21,772
Bridges & CulvertsBridge Maintenance 10,500 10,568 - - 10,158 20,759 - Entrance Culvert Maintenance 7,500 7,500 5,000 2,014 4,503 1,338 - Road Culverts 107,800 63,845 108,647 67,103 123,883 110,824 85,114
Bridges & Culverts Expenses 125,800 81,913 113,646 69,118 138,543 132,921 85,114
Roadside MaintenanceGrass Mowing 18,000 18,000 10,565 16,365 22,329 26,020 20,183 Brushing / Tree Trimming 139,500 73,300 147,849 119,272 92,821 136,332 81,855 Ditching 86,500 91,000 83,567 94,511 201,845 56,635 55,512 Dam Removal 13,200 8,300 14,456 12,272 10,635 12,714 19,827 Catch Basins 2,000 2,000 - 2,668 748 989 776 Curbs & Gutters 3,000 4,500 1,673 2,772 - 263 617 Storm Sewers 500 508 - - - 14 543 Debris Collection 2,500 7,600 1,687 7,411 10,962 4,770 7,085
Roadside Expenses 265,200 205,208 259,797 255,271 339,340 237,739 186,399
Paved MaintenancePatching 201,500 182,400 195,064 173,531 124,191 319,704 201,938 Sweeping 38,000 38,700 36,525 37,290 36,854 26,875 33,400
ROADS
Budget Actual
45

Estimated
Account Description 2019 2018 2018 YTD 2017 2016 2015 2014
ROADS
Budget Actual
Shoulder Maintenance 62,000 64,000 62,522 63,535 29,356 6,654 62,294 Resurfacing - - - - - - 89,319
Paved Expenses 301,500 285,100 294,111 274,357 190,402 353,233 386,951
Loose Top MaintenanceWashouts 188,000 89,000 162,743 108,024 205,433 122,210 129,970 Grading 91,000 78,000 83,628 80,915 123,323 92,672 102,410 Gravel Resurfacing 59,000 156,570 44,556 128,699 45,150 146,977 21,355 Base Repairs 52,000 42,224 46,994 33,127 80,992 57,122 164,868 Dust Control 86,000 73,000 78,034 61,792 78,170 82,465 60,564
Loose Top Expenses 476,000 438,794 415,954 412,556 533,068 501,447 479,167
Winter ControlSnow Ploughing 426,000 418,250 373,010 396,985 421,402 411,799 464,833 Snow Removal 29,000 29,000 15,881 33,295 15,661 54,364 55,562 Sanding & Salting 235,700 213,235 270,941 258,738 307,336 114,676 254,396 Drainage 113,000 58,000 127,312 112,749 79,542 14,903 9,930Standby 28,500 27,900 34,665 31,450 32,655 28,975 22,695
Winter Control Expenses 832,200 746,385 821,809 833,217 856,596 624,716 807,416
Safety DevicesSign Replacement & Repair 41,500 40,100 40,329 7,175 7,175 7,175 5,828Protective Barriers 3,800 6,300 3,543 2,574 4,149 14,860 3,219Railroad Crossings 8,000 8,000 6,045 6,439 6,773 7,023 7,281
Safety Devices Expenses 53,300 54,400 49,917 16,188 18,097 29,058 16,328
Net Expenditures 3,660,129 3,745,016 3,334,821 3,221,052 3,151,971 3,091,840 3,269,826
$ Over/(Under) 2018 Budget (84,887) % Over/(Under) 2018 Budget -2.3%
Non-Tax Revenue (847,418) (768,720) (683,482) (780,185) (709,910) (739,922) (625,607) Expenses 4,507,548 4,513,736 4,018,303 4,001,237 3,861,881 3,831,762 3,895,434
2019 Notes:
46

Opening Additions Interest Outflow Closing
Development Charges 1,316,746 50,000 11,405 (31,518) 1,346,633 Parkland Dedication 1,562,192 100,000 15,897 (664,300) 1,013,789
Total Obligatory Reserves 2,878,939 150,000 27,302 (695,818) 2,360,422 Restricted ReservesBuilding Services 2,984,577 - 30,000 (64,131) 2,950,447 Library 58,142 100,000 - (129,500) 28,642
Total Restricted Reserves 3,042,720 100,000 30,000 (193,631) 2,979,089
Arenas 36,280 100,000 15,000 (22,000) 129,280 Attainable Housing 32,133 8,500 116 (8,500) 32,249 Bala Heritage Professional Fees 11,694 - 799 (5,000) 7,493 By-law 4,340 12,800 150 - 17,290 Capital Levy Reserve 706,348 567,000 30,000 - 1,303,348 Cemeteries 82,794 10,000 2,000 (7,500) 87,294 Computer Equipment 377,293 383,817 5,000 (197,619) 568,491 Education and Training 39,464 - 2,000 - 41,464 Election 54,145 30,000 3,000 (12,000) 75,145 Fire 933,237 165,000 30,000 (142,400) 985,837 Municipal Building 6,411 - 111 - 6,522 Mural 48,375 15,000 4,705 - 68,081 Nursing Station 210,459 - 10,000 - 220,459 Other equipment 84,021 120,000 7,000 (40,000) 171,021 Parking Facilities 50,207 50,000 4 - 100,210 Parks Equipment 69,543 - 1,028 (37,200) 33,372 Planning 87,235 10,000 1,119 (70,000) 28,354 Roads 1,766,237 750,000 45,000 (558,910) 2,002,327 Street Lighting 6,290 - 196 - 6,486 Weather Event 27,181 - 470 - 27,651 Working Capital 2,418,923 137,882 65,000 (432,921) 2,188,884
Total Discretionary Reserves 7,052,610 2,359,999 222,699 (1,534,050) 8,101,258
12,974,269 2,609,999 280,000 (2,423,499) 13,440,770
16,113,654
TML Discretionary Reserves to Municipal Expenses 50.3%2017 Provincial average 58.7%Difference -8.4%
2019 ESTIMATED FINANCIAL RESERVES
Discretionary Reserves:
Obligatory/Politically Restricted Reserves:
Total 2019 Expenses
47
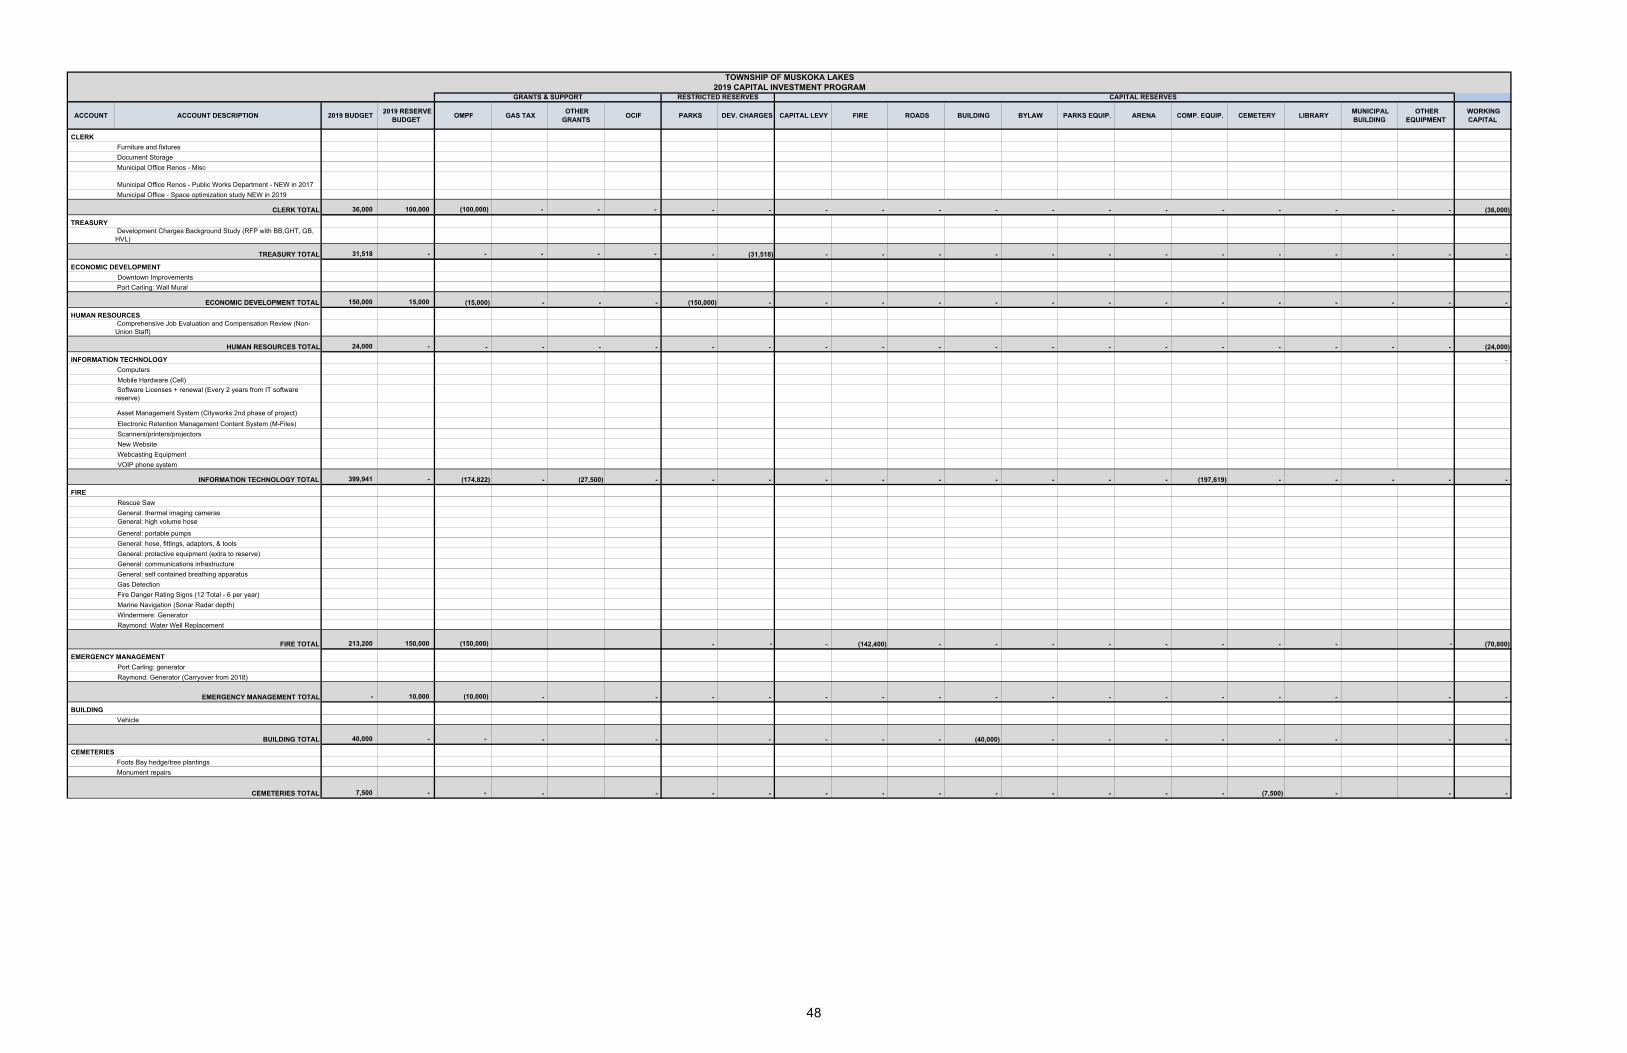
ACCOUNT ACCOUNT DESCRIPTION 2019 BUDGET 2019 RESERVE
BUDGET OMPF GAS TAX
OTHER GRANTS
OCIF PARKS DEV. CHARGES CAPITAL LEVY FIRE ROADS BUILDING BYLAW PARKS EQUIP. ARENA COMP. EQUIP. CEMETERY LIBRARY MUNICIPAL BUILDING
OTHER EQUIPMENT
WORKING CAPITAL
Furniture and fixtures
Document Storage
Municipal Office Renos - Misc
Municipal Office Renos - Public Works Department - NEW in 2017
Municipal Office - Space optimization study NEW in 2019
36,000 100,000 (100,000) - - - - - - - - - - - - - - - - - (36,000)
Development Charges Background Study (RFP with BB,GHT, GB, HVL)
31,518 - - - - - - (31,518) - - - - - - - - - - - - -
Downtown Improvements
Port Carling: Wall Mural
150,000 15,000 (15,000) - - - (150,000) - - - - - - - - - - - - - -
Comprehensive Job Evaluation and Compensation Review (Non-Union Staff)
24,000 - - - - - - - - - - - - - - - - - - - (24,000)
-
Computers
Mobile Hardware (Cell)
Software Licenses + renewal (Every 2 years from IT software reserve)
Asset Management System (Cityworks 2nd phase of project)
Electronic Retention Management Content System (M-Files)
Scanners/printers/projectors
New Website
Webcasting Equipment
VOIP phone system
399,941 - (174,822) - (27,500) - - - - - - - - - - (197,619) - - - - -
Rescue Saw
General: thermal imaging camerasGeneral: high volume hose
General: portable pumps
General: hose, fittings, adaptors, & tools
General: protective equipment (extra to reserve)
General: communications infrastructure
General: self contained breathing apparatus
Gas Detection
Fire Danger Rating Signs (12 Total - 6 per year)
Marine Navigation (Sonar Radar depth)
Windermere: Generator
Raymond: Water Well Replacement
213,200 150,000 (150,000) - - - (142,400) - - - - - - - - - (70,800)
Port Carling: generator
Raymond: Generator (Carryover from 2018)
- 10,000 (10,000) - - - - - - - - - - - - - - - -
Vehicle
40,000 - - - - - - - - (40,000) - - - - - - - -
Foots Bay hedge/tree plantings
Monument repairs
7,500 - - - - - - - - - - - - - - (7,500) - - - CEMETERIES TOTAL
EMERGENCY MANAGEMENT TOTAL
BUILDING
BUILDING TOTAL
CEMETERIES
HUMAN RESOURCES TOTAL
INFORMATION TECHNOLOGY
INFORMATION TECHNOLOGY TOTAL
FIRE
FIRE TOTAL
EMERGENCY MANAGEMENT
CLERK TOTAL
TREASURY
TREASURY TOTAL
ECONOMIC DEVELOPMENT
ECONOMIC DEVELOPMENT TOTAL
HUMAN RESOURCES
TOWNSHIP OF MUSKOKA LAKES2019 CAPITAL INVESTMENT PROGRAM
GRANTS & SUPPORT RESTRICTED RESERVES CAPITAL RESERVES
CLERK
48
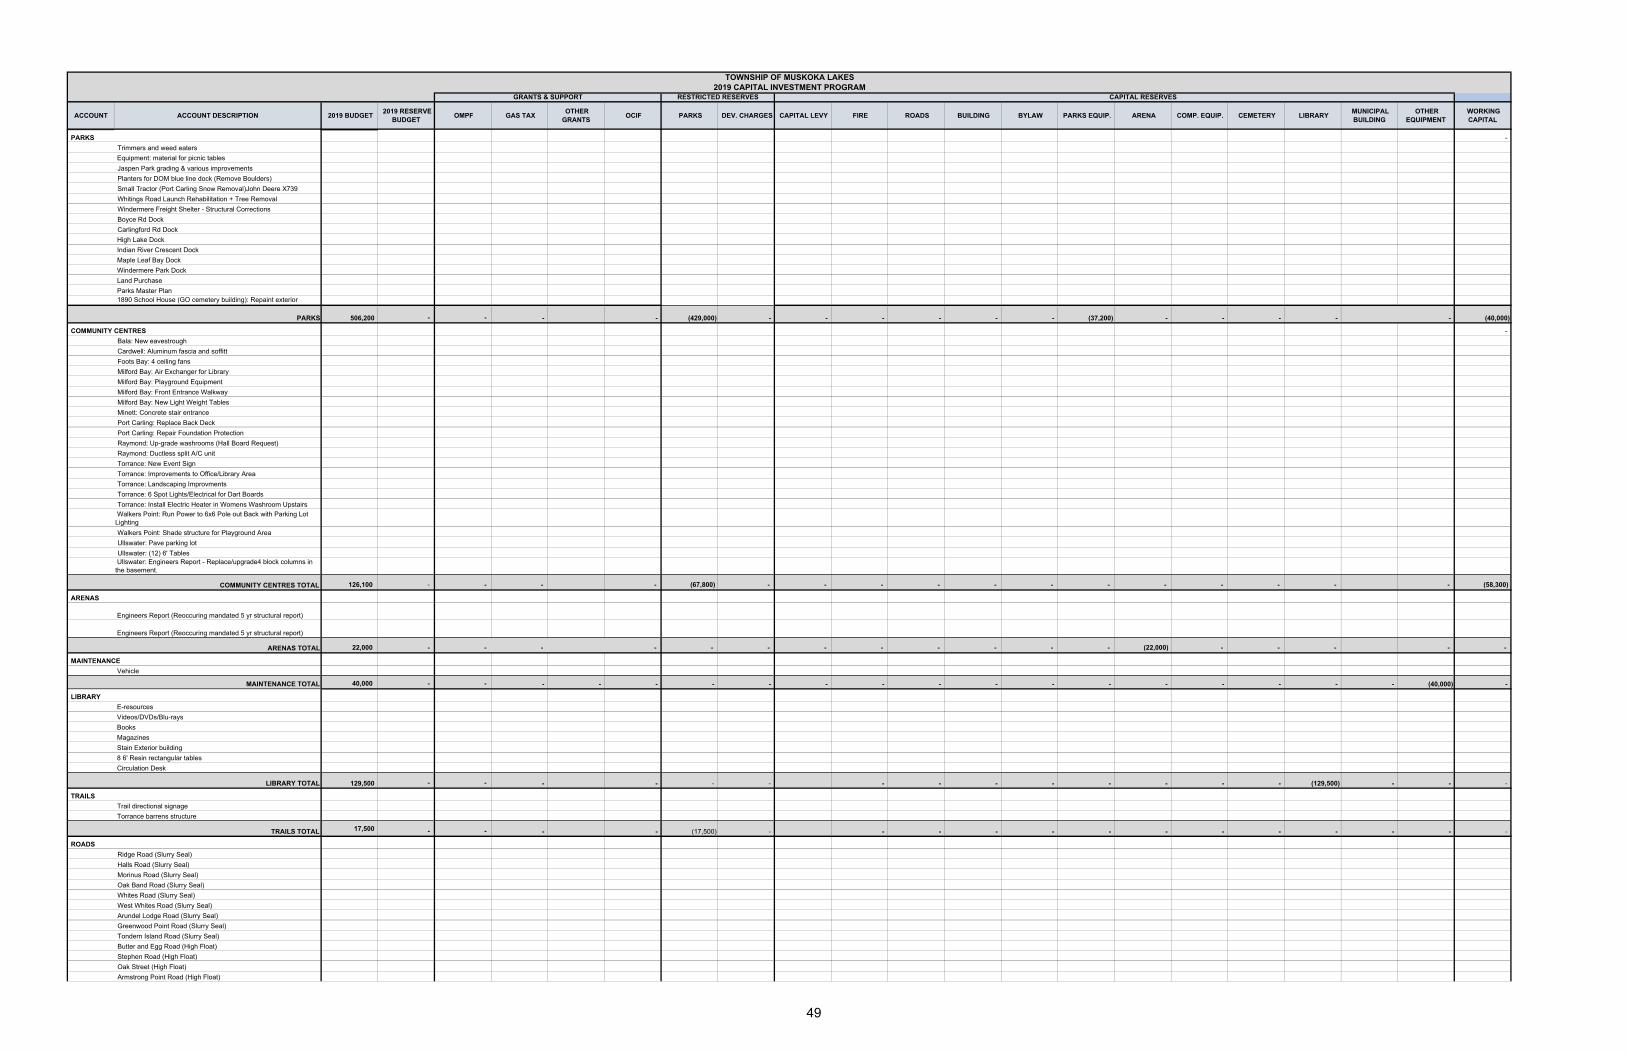
ACCOUNT ACCOUNT DESCRIPTION 2019 BUDGET 2019 RESERVE
BUDGET OMPF GAS TAX
OTHER GRANTS
OCIF PARKS DEV. CHARGES CAPITAL LEVY FIRE ROADS BUILDING BYLAW PARKS EQUIP. ARENA COMP. EQUIP. CEMETERY LIBRARY MUNICIPAL BUILDING
OTHER EQUIPMENT
WORKING CAPITAL
TOWNSHIP OF MUSKOKA LAKES2019 CAPITAL INVESTMENT PROGRAM
GRANTS & SUPPORT RESTRICTED RESERVES CAPITAL RESERVES
-
Trimmers and weed eaters
Equipment: material for picnic tables
Jaspen Park grading & various improvements
Planters for DOM blue line dock (Remove Boulders)
Small Tractor (Port Carling Snow Removal)John Deere X739
Whitings Road Launch Rehabilitation + Tree Removal
Windermere Freight Shelter - Structural Corrections
Boyce Rd Dock
Carlingford Rd Dock
High Lake Dock
Indian River Crescent Dock
Maple Leaf Bay Dock
Windermere Park Dock
Land Purchase
Parks Master Plan 1890 School House (GO cemetery building): Repaint exterior
506,200 - - - - (429,000) - - - - - - (37,200) - - - - - (40,000)
-
Bala: New eavestrough
Cardwell: Aluminum fascia and soffitt
Foots Bay: 4 ceiling fans
Milford Bay: Air Exchanger for Library
Milford Bay: Playground Equipment
Milford Bay: Front Entrance Walkway
Milford Bay: New Light Weight Tables
Minett: Concrete stair entrance
Port Carling: Replace Back Deck
Port Carling: Repair Foundation Protection
Raymond: Up-grade washrooms (Hall Board Request)
Raymond: Ductless split A/C unit
Torrance: New Event Sign
Torrance: Improvements to Office/Library Area
Torrance: Landscaping Improvments
Torrance: 6 Spot Lights/Electrical for Dart Boards
Torrance: Install Electric Heater in Womens Washroom Upstairs
Walkers Point: Run Power to 6x6 Pole out Back with Parking Lot Lighting
Walkers Point: Shade structure for Playground Area
Ullswater: Pave parking lot
Ullswater: (12) 6' Tables Ullswater: Engineers Report - Replace/upgrade4 block columns in the basement.
126,100 - - - - (67,800) - - - - - - - - - - - - (58,300)
Engineers Report (Reoccuring mandated 5 yr structural report)
Engineers Report (Reoccuring mandated 5 yr structural report)
22,000 - - - - - - - - - - - - (22,000) - - - - -
Vehicle
40,000 - - - - - - - - - - - - - - - - - - (40,000) -
E-resources
Videos/DVDs/Blu-rays
Books
Magazines
Stain Exterior building
8 6' Resin rectangular tables
Circulation Desk
129,500 - - - - - - - - - - - - - - (129,500) - - -
Trail directional signage
Torrance barrens structure
17,500 - - - - (17,500) - - - - - - - - - - - - -
Ridge Road (Slurry Seal)
Halls Road (Slurry Seal)
Morinus Road (Slurry Seal)
Oak Band Road (Slurry Seal)
Whites Road (Slurry Seal)
West Whites Road (Slurry Seal)
Arundel Lodge Road (Slurry Seal)
Greenwood Point Road (Slurry Seal)
Tondern Island Road (Slurry Seal)
Butter and Egg Road (High Float)
Stephen Road (High Float)
Oak Street (High Float)
Armstrong Point Road (High Float)
TRAILS TOTAL
ROADS
ARENAS TOTAL
MAINTENANCE
MAINTENANCE TOTAL
LIBRARY
LIBRARY TOTAL
TRAILS
PARKS
PARKS
COMMUNITY CENTRES
COMMUNITY CENTRES TOTAL
ARENAS
49

ACCOUNT ACCOUNT DESCRIPTION 2019 BUDGET 2019 RESERVE
BUDGET OMPF GAS TAX
OTHER GRANTS
OCIF PARKS DEV. CHARGES CAPITAL LEVY FIRE ROADS BUILDING BYLAW PARKS EQUIP. ARENA COMP. EQUIP. CEMETERY LIBRARY MUNICIPAL BUILDING
OTHER EQUIPMENT
WORKING CAPITAL
TOWNSHIP OF MUSKOKA LAKES2019 CAPITAL INVESTMENT PROGRAM
GRANTS & SUPPORT RESTRICTED RESERVES CAPITAL RESERVES
Island Park Road - 2154 (High Float)
Pratt Rd (Gravel)
Glen Gordon Road (Gravel)
Hemlock Point Road Section - 2058 (Gravel)
Hemlock Point Sideroad (Gravel)
Paint Handrails in Port Carling
Ed Breise Road ImprovementsBlasting, Ditching, Culverts, Shoulder/Ditch Lining, HMA
Mobile Hoists
Milford Bay Road Bridge Replacement Design
Beaumaris Road Bridge Design and West approach
Bala Falls Road Bridge Design
Carlo Enterprise Road Drainage Improvements
Tandem (Replace 55-03)
BackHoe (Replace 69-02)
1 Ton Truck (34-08)
3/4 Ton Truck (Road Foreman)
Roads Needs Study Update
GO Garage: Waste Oil Storage tank
Port Carling Sidewalk Improvements (SE side of Indian River Bridge)
TML Highway Signs
Municipal Parking
ROADS TOTAL 2,141,300 50,000 (1,027,278) (203,914) - (197,377) - - - - (558,910) - - - - - - - - (203,821)
3,884,759 325,000 (1,477,100) (203,914) (27,500) (197,377) (664,300) (31,518) - (142,400) (558,910) (40,000) - (37,200) (22,000) (197,619) (7,500) (129,500) - (40,000) (432,921)
TOTAL 2019 DRAFT CAPITAL REQUIREMENTS 4,209,759$
TOTAL ALL DEPARTMENTS
50

Appendix 2
Township of Muskoka Lakes
2019 Budget
Allowable Excluded Expense Analysis
2019 Budget
Add: Net
Reserve
Transactions
Less: Capital
Expenditures
Less: Principal
Repayment
Add: Estimated
Amortization
Restated
BudgetRevenueOperating budget: Non-tax revenues (4,085,848) 111,131 (3,974,718) Tax levy (12,027,806) (12,027,806)
Capital Investment Program: Grant revenue (1,681,014) (1,681,014) Other revenue and support (224,877) (224,877) Deferred revenue (695,818) (695,818) Reserve Funds (1,608,050) 1,608,050 - Total Revenue (20,323,413) 1,719,181 - - - (18,604,232)
Expenses Operating Expenditures 16,113,654 2,414,999 (80,936) 18,447,717 Capital Expenditures 4,209,759 (325,000) (3,884,759) 3,800,000 3,800,000 Total Expenses 20,323,413 2,089,999 (3,884,759) (80,936) 3,800,000 22,247,717
Estimated Change in
Accumulated (Surplus)/Deficit - 3,809,180 (3,884,759) (80,936) 3,800,000 3,643,485
51

Capital requirement:
Department 2019 2020 2021 2022 2023 2024 2025 2026 2027 2028 TotalGENERAL 356,518 234,881 139,302 139,302 140,318 211,494 49,823 49,823 50,840 50,840 1,423,141INFORMATION TECHNOLOGY 399,941 188,108 96,225 45,756 221,475 45,756 96,225 45,756 96,225 45,756 1,281,222FIRE 363,200 1,956,832 343,882 833,979 1,276,287 882,786 899,868 1,243,546 1,863,794 826,658 10,490,833EMERGENCY MANAGEMENT 10,000 10,168 10,168 45,756 45,756 10,168 10,168 10,168 10,168 10,168 172,688BUILDING 40,000 40,672 40,672 40,672 40,672 40,672 40,672 40,672 40,672 40,672 406,048BY-LAW - - - - 40,672 - - - - 40,672 81,344CEMETERIES 7,500 10,168 10,168 10,168 10,168 10,168 10,168 10,168 10,168 10,168 99,012PARKS 506,200 1,573,498 875,261 1,060,014 824,421 333,002 359,744 51,857 49,111 4,576 5,637,685COMMUNITY CENTRES 126,100 107,882 81,090 89,275 24,200 48,959 95,172 5,999 42,096 71,684 692,458ARENAS 22,000 1,309,638 1,549,603 178,957 199,293 132,184 155,570 115,915 318,767 144,659 4,126,586MAINTENANCE 40,000 - 20,336 40,672 - 40,672 - 40,672 - 40,672 223,024LIBRARY 129,500 43,214 40,164 43,214 40,164 43,214 40,164 43,214 40,164 43,214 506,224TRAILS 17,500 - - - - - - - - - 17,500
PUBLIC WORKS 2,191,300 5,059,597 3,311,311 3,368,404 2,280,835 2,155,565 1,706,750 1,983,489 1,910,776 1,910,776 25,878,802
TOTAL CAPITAL EXPENDITURES 4,209,759 10,534,658 6,518,181 5,896,169 5,144,261 3,954,640 3,464,324 3,641,280 4,432,780 3,240,515 51,036,567Funding requirement:
Ontario Municipal Partnership Fund 1,477,100 1,448,137 1,419,275 1,390,522 1,361,888 1,333,383 1,305,015 1,276,795 1,248,731 1,220,833 13,481,680
Federal Gas Tax Rebate 203,914 213,624 217,213 220,862 224,573 228,345 232,182 236,082 240,048 244,081 2,260,924Ontario Community Infrastructure Fund 197,377 200,693 204,065 207,493 210,979 214,523 218,127 221,792 225,518 229,307 2,129,872
OCIF Top up funding - 1,606,000 - - - - - - - - 1,606,000
Other Grants 27,500 - - - - - - - - - 27,500
Township Reserve Funds required 2,303,868 7,066,204 4,677,629 4,077,292 3,346,821 2,178,389 1,709,000 1,906,611 2,718,483 1,546,294 31,530,590
TOTAL: 4,209,759 10,534,658 6,518,181 5,896,169 5,144,261 3,954,640 3,464,324 3,641,280 4,432,780 3,240,515 51,036,567
Township Reserve Fund available beginning of year 8,271,525 9,620,056 4,941,459 2,680,215 1,038,238 145,404 440,238 1,224,272 1,831,100 1,647,075Contributions to Township Reserves 2,652,399 2,387,607 2,416,385 2,435,314 2,453,988 2,473,222 2,493,034 2,513,439 2,534,457 2,556,105 24,915,952Estimated 2018 Operating Budget Surplus 1,000,000 - - - - - - - - - 1,000,000Disbursements from Township Reserves (2,303,868) (7,066,204) (4,677,629) (4,077,292) (3,346,821) (2,178,389) (1,709,000) (1,906,611) (2,718,483) (1,546,294) (31,530,590)Township Reserve Fund Balance available end of year 9,620,056 4,941,459 2,680,215 1,038,238 145,404 440,238 1,224,272 1,831,100 1,647,075 2,656,886
1.68% 1.68% 1.68% 1.68% 1.68% 1.68% 1.68% 1.68% 1.68%Inflation is based on the average of the last 10 years for Canada - 1.68% annually.
Appendix 3 - 2019 Ten Year Capital Plan with 5% Capital Levy contribution and Estimated 2018 Operating Budget SurplusTOWNSHIP OF MUSKOKA LAKESTEN YEAR CAPITAL FORECAST
52

Department Description Added Reduced Capital $ Change
54,724,445$
Year 2020: Inflation adjustment 16,128
Year 2021: Vehicles - Port Carling Station New Aerial (1,800,000)
Year 2021: Inflation adjustment (30,240)
Year 2024: Vehicles - Marine 1 Foot's Bay (400,000)
Year 2024: Inflation adjustment (6,720)
Year 2022: Marine Facilities - McDonald Road Wharf (Foot's Bay) (1,500,000)
Year 2022: Inflation adjustment (25,200)
DRAFT SUBTOTAL 16,128 (3,762,160) (3,746,032)
50,978,413$
Pratt Road (Gravel) 2,000
Glen Gordon Road (Gravel) (100)
Stephen Road (High Float) 120,000
Oak Street (High Float) 6,900
Butter & Egg Road (High Float) 320,000
Armstrong Point Road (High Float) 34,700
Island Park Road (High Float) 19,900
Fogo Street (17,000)
Stroud Breach Road (25,500)
Tom Wroe Road (5,100)
Chown Road (23,500)
Pennwood Road- Section 2160.2 (6,800)
Purdy Rd Section - 4034 (39,100)
Paignton House Road (10,200)
Beaumaris Road (203,969)
Patterson Road (28,000)
Other Equipment - Port Carling Sidewalk improvements (8,000)
Year 2020: Inflation adjustment (5,825)
DRAFT SUBTOTAL 503,500 (373,094) 130,406
51,108,819$
Year 2019: Windermere - Generator 30,000
Year 2020: Windermere - Generator (15,000)
Year 2020: Inflation adjustment (252)
Year 2019: Walkers Point - Generator (75,000)
Year 2019: Minett - New Solar Power Event Sign (12,000)
DRAFT SUBTOTAL 30,000 (102,252) (72,252)
51,036,567$
Fire
Community Centres
Council: (Feb 15th)
Roads
Committee of the Whole: (Feb 11th)
RECOMMENDED - 2019 TEN YEAR CAPITAL PLAN CHANGES
Committee of the Whole: (Jan 22nd)
Fire
Parks
Senior Management Revisions: (Feb 7th)
53

DEPARTMENT NAME: GENERAL
Project Title and description 2019 2020 2021 2022 2023 2024 2025 2026 2027 2028 Total
Furniture and Fixtures 10,000$ 10,000$ 15,000$ 15,000$ 15,000$ 15,000$ 20,000$ 20,000$ 20,000$ 20,000$ 160,000$
Municipal Office Renovations Misc 6,000$ 6,000$ 7,000$ 7,000$ 8,000$ 8,000$ 9,000$ 9,000$ 10,000$ 10,000$ 80,000$
Municipal Office Renovations Public Works
Department 10,000$ 10,000$
Municipal Office Elevator upgrades‐ new in
2018 -$
Municipal Office ‐ space optimization study
‐ NEW in 2019 10,000$ 10,000$
Municipal Office ‐ space optimization
construction NEW in 2020 100,000$ 100,000$
Development Charges Background Study 31,518$ 40,000$ 71,518$
Organizational / Staff Review Study -$
Document Storage 100,000$ 100,000$ 100,000$ 100,000$ 100,000$ 100,000$ 600,000$
ED ‐ Port Carling Wall Mural ‐ to reserves 15,000$ 15,000$ 15,000$ 15,000$ 15,000$ 15,000$ 20,000$ 20,000$ 20,000$ 20,000$ 170,000$
ED ‐ Downtown Improvements 150,000$ -$ -$ -$ -$ -$ -$ -$ -$ ‐$ 150,000$
Human Resources ‐ Comprehensive
Compensation review and job evaluation 24,000$ -$ -$ -$ -$ 30,000$ -$ -$ -$ ‐$ 54,000$
TOTAL: 356,518$ 231,000$ 137,000$ 137,000$ 138,000$ 208,000$ 49,000$ 49,000$ 50,000$ 50,000$ 1,405,518$
with inflation 356,518$ 234,881$ 139,302$ 139,302$ 140,318$ 211,494$ 49,823$ 49,823$ 50,840$ 50,840$ 1,423,141$
54

DEPARTMENT NAME: Information Technology
Project Title and description 2019 2020 2021 2022 2023 2024 2025 2026 2027 2028 Total
Computer Related 28,000$ 30,000$ 30,000$ 30,000$ 30,000$ 30,000$ 30,000$ 30,000$ 30,000$ 30,000$ 298,000$
Mobile Hardware 10,000$ 10,000$
Scanners/Printers/Projectors 10,000$ 10,000$ 10,000$ 10,000$ 10,000$ 10,000$ 10,000$ 10,000$ 10,000$ 10,000$ 100,000$
Replace Datacentre Hardware 123,180$ 123,180$
New and Renew Software licenses 51,949$ 49,635$ 49,635$ 49,635$ 49,635$ 250,489$
Electronic Document/Content Records
Management System (M‐FILES) 117,313$ 117,312$
Cityworks Asset Management System 96,672$ 96,672$
New Website 43,700$ 43,655$
Phone System Review (VOIP System) 27,775$ 24,127$
Public Wifi Connectivity 40,000$ 40,000$
Webcasting equipment ‐ pulled in
2017 budget ‐ move to 2018 14,532$ -$ 14,532$
Communication Tower ‐ Raymond 105,000$ 5,000$ 5,000$ 5,000$ 5,000$ 5,000$ 5,000$ 5,000$ 5,000$ 145,000$
TOTAL: 399,941$ 185,000$ 94,635$ 45,000$ 217,815$ 45,000$ 94,635$ 45,000$ 94,635$ 45,000$ 1,266,661$
with inflation 399,941$ 188,108$ 96,225$ 45,756$ 221,475$ 45,756$ 96,225$ 45,756$ 96,225$ 45,756$ 1,281,222$
55

DEPARTMENT NAME: FIRE
Project 2019 2020 2021 2022 2023 2024 2025 2026 2027 2028 Total
Equipment
Chainsaws 3,000 3,000 3,000 3,000 12,000
Rescue Saw 3,200 3,200 3,200 3,200 3,200 3,200 19,200
Communications Infrastructure 10,000 10,000 10,000 10,000 10,000 10,000 10,000 10,000 10,000 10,000 100,000
Thermal Imaging Cameras 15,000 15,000 15,000 15,000 15,000 15,000 15,000 15,000 15,000 15,000 150,000
Gas Detection 2,000 2,000 2,000 2,000 2,000 5,000 2,000 2,000 2,000 2,000 23,000
Bunker Gear Washing Machines 0
Fire Hose 5,000 5,000 5,000 5,000 5,000 5,000 5,000 5,000 5,000 5,000 50,000
Portable Pumps 25,000 25,000 25,000 25,000 25,000 25,000 25,000 25,000 25,000 25,000 250,000
Boat Pumps 22,000 22,000 22,000 22,000 88,000
Fittings, Adaptors, and Tools 30,000 30,000 30,000 30,000 30,000 30,000 30,000 30,000 30,000 30,000 300,000Protective Equipment 48,000 48,000 48,000 48,000 48,000 48,000 48,000 48,000 48,000 48,000 480,000
Self Contained Breathing Apparatus 150,000 150,000 75,000 75,000 75,000 75,000 105,000 75,000 75,000 75,000 930,000
Self Contained Breathing Apparatus Filling Station 35,000 35,000Auto Extraction Equipment 45,000 45,000 45,000 135,000
Marine navigatioin (Sonar/Radar/Depth) 30,000 30,000
Fire Danger Rating Signs 1,300 1,300
Total Equipment 318,200 289,500 213,200 235,200 280,200 238,200 345,000 213,000 258,000 213,000 2,603,500Vehicles
Car 1 ‐ Chief 60,000 60,000 120,000
Car 2 ‐ Deputy Chief 60,000 60,000 120,000
Car 3 - Fire Prevention/By-Law 60,000 60,000
Water/Ice Rescue Trailer 0
Fire Prevention/Education Trailer 0
Wildland Supprt Trailer 10,000 10,000Station 1 ‐ Foot's Bay/Glen Orchard
Pumper 1 (Tanker 11) - Glen Orchard Move to P4 0Tanker 1 ‐ Foot's Bay 505,000 505,000
Rescue 1 (Pumper 1) - Foot's Bay 505,000 505,000
Rescue 1 - Foot's Bay 75,000 75,000Rescue Sled/Trailer ‐ Foot's Bay 35,000 35,000
Marine 1 ‐ Foot's Bay 0 0
Station 3 ‐ Bala
Pumper 3 ‐ Bala 0
Tanker 3 ‐ Bala 505,000 505,000
Rescue 3 - Bala 0 75,000 75,000Hazmat Trailer ‐ Bala 0
Zodiac/Motor 50,000 50,000
Sled/Trailer - Bala 35,000 35,000Station 4 ‐ Torrance/Walker's Point
Pumper 4 - Torrance 0 505,000 0 400,000 905,000Tanker 4 ‐ Walker's Point 0
Rescue 4 ‐ Torrance 0
56

DEPARTMENT NAME: FIRE
Project 2019 2020 2021 2022 2023 2024 2025 2026 2027 2028 Total
Pumper 44 - Walker's Point 0Marine 4 ‐ Torrance 0
Wildland 4/Trailer 35,000 35,000Station 5 ‐ Minett
Pumper 5 ‐ Minett 505,000 505,000
Tanker 5 ‐ Minett 505,000 505,000
Rescue 5 ‐ Minett 0
Rescue Sled/Trailer ‐ Minett 35,000 35,000
Marine 5 ‐ Minett 40,000 40,000
Station 6 ‐ Port Carling
Pumper 6 ‐ Port Carling 0
Tanker 6 ‐ Port Carling 505,000 505,000
Truck 6 ‐ Port Carling 0
New Aerial Truck 0 0Zodiac/Motor 0
Spare Pumper 10 ‐ Port Carling P7 P7 P7/9 P7/9 P7/9 P7/9 P7/9 P77 P77 P77 0
Spare Tanker 10 ‐ Port Carling T4 T4 T4 T4 T77 T77 T1 T1 T7 T6 0
Station 7 ‐ Windermere/Raymond
Pumper 7 ‐ Windermere 505,000 505,000
Tanker 7 ‐ Windermere 505,000 505,000
Sled/Trailer ‐ Windermere 35,000 35,000
Rescue 77 - Raymond 0Pumper 77 ‐ Raymond 505,000 505,000
Tanker 77 ‐ Raymond 505,000 505,000
Zodiac/Motor 0
Station 9 ‐ Milford Bay
Pumper 9 ‐ Milford Bay 0
Tanker 9 ‐ Milford Bay 0
Rescue 9 ‐ Milford Bay 75,000 75,000
Wildland 9/Trailer 0Marine 9 ‐ Milford Bay 0
Total Vehicles 0 1,255,000 95,000 565,000 485,000 630,000 540,000 1,010,000 1,575,000 600,000 6,755,000
Project 2019 2020 2021 2022 2023 2024 2025 2026 2027 2028
Buildings
Minett ‐ Station 5 0
Milford Bay ‐ Station 9 0
Foot's Bay - Station 1 - Retrofit 475,000 475,000
Port Carling - Station 6 - Retrofit 0
Raymond Fire Station - bay addition 0 360,000 360,000
Raymond Fire Station - Water well replacement 15,000 15,000Bala Fire Station ‐ Generator 15,000 15,000
Raymond Fire Station - Generator 0 20,000 20,000
Windermere Fire Station - Generator 30,000 0 30,000
57

DEPARTMENT NAME: FIRE
Project 2019 2020 2021 2022 2023 2024 2025 2026 2027 2028 Total
Milford Bay Fire Station ‐ Generator 15,000 15,000
Port Carling Fire Station ‐ Generator 20,000 20,000
Walker's Point Fire Station ‐ Generator 15,000 15,000
Minett Fire Station ‐ Generator 0
Milford Bay Fire Station 0
Total Buildings 45,000 380,000 30,000 20,000 490,000 0 0 0 0 0 965,000
total Fire Capital 363,200 1,924,500 338,200 820,200 1,255,200 868,200 885,000 1,223,000 1,833,000 813,000 10,323,500with inflation 363,200 1,956,832 343,882 833,979 1,276,287 882,786 899,868 1,243,546 1,863,794 826,658 10,490,833
58

DEPARTMENT NAME: Emergency Management
Project Title and description 2019 2020 2021 2022 2023 2024 2025 2026 2027 2028 Total
Port Carling ‐ Generator Replacement 10,000 10,000 10,000 10,000 10,000 10,000 10,000 10,000 10,000 10,000 100,000
Hekkla CC‐ Generator Replacement ‐
Milford Bay CC ‐ Generator Replacement ‐
Minett Fire Station ‐ Generator 35,000 35,000
Raymond CC ‐ Generator Replacement ‐
Foot's Bay Fire Station/CC ‐ Generator ‐
Torrance Fire Station/CC ‐ Generator 35,000 35,000
TOTAL: 10,000 10,000 10,000 45,000 45,000 10,000 10,000 10,000 10,000 10,000 170,000
with inflation 10,000 10,168 10,168 45,756 45,756 10,168 10,168 10,168 10,168 10,168 172,688
59

DEPARTMENT NAME: Building
Project 2019 2020 2021 2022 2023 2024 2025 2026 2027 2028 Total
Vehicle 1 40,000 40,000 80,000
Vehicle 2 40,000 40,000 80,000
Vehicle 3 40,000 40,000 80,000
Vehicle 4 40,000 40,000 80,000
Vehicle 5 40,000 40,000 80,000
Printers and Scanners - - - - - - - - - - -
MNR Air photos of Municipality
(Partnership with Area Municipaliities ‐
once every 5 years) -
TOTAL: 40,000 40,000 40,000 40,000 40,000 40,000 40,000 40,000 40,000 40,000 400,000
with inflation 40,000 40,672 40,672 40,672 40,672 40,672 40,672 40,672 40,672 40,672 406,048
60

DEPARTMENT NAME: By‐law
Project 2019 2020 2021 2022 2023 2024 2025 2026 2027 2028 Total
Vehicle 40,000 40,000 80,000
TOTAL: ‐ ‐ ‐ ‐ 40,000 ‐ ‐ ‐ ‐ 40,000 80,000
with inflation ‐ ‐ ‐ ‐ 40,672 ‐ ‐ ‐ ‐ 40,672 81,344
61

DEPARTMENT NAME: Cemeteries
Project Title and description 2019 2020 2021 2022 2023 2024 2025 2026 2027 2028 TotalPort Carling Columbarium 5,000 5,000 5,000 5,000 5,000 5,000 5,000 5,000 5,000 45,000Torrance Fencing 0
Monument Repair & Maintenance 5,000 5,000 5,000 5,000 5,000 5,000 5,000 5,000 5,000 5,000 50,000
Driveway Repairs 0
Foots Bay Hedge/Plantings 2,500 2,500TOTAL 7,500 10,000 10,000 10,000 10,000 10,000 10,000 10,000 10,000 10,000 97,500
with inflation 7,500 10,168 10,168 10,168 10,168 10,168 10,168 10,168 10,168 10,168 99,012
62

DEPARTMENT NAME: Parks
Project Title and description 2019 2020 2021 2022 2023 2024 2025 2026 2027 2028 Total
Equipment
Commercial Mower 40,000 40,000
Leaf Blowers 1,300 1,300 1,300 1,300 5,200
Weed Eaters 1,000 1,000
Chain Saws 1,000 1,000
Picnic Tables 5,000 2,500 2,500 2,500 2,500 2,500 2,500 2,500 2,500 25,000
Dock ladders for Windsor Park, Four Mile Beach -
Small Tractor (Port Carling Snow Removal)
John Deere X73935,000 35,000
Split boom line trimmers 2,200 2,200
Garbage Cans & Benches for PC & Bala -
Equipment 42,200 2,500 5,800 2,500 3,800 42,500 3,800 2,500 3,800 - 109,400
Vehicles
Vehicle 1 40,000 40,000 80,000
Vehicle 2 40,000 40,000 80,000
Vehicle 3 40,000 40,000 80,000
Vehicle 4 - 1 Ton 60,000 60,000
Vehicles - 40,000 40,000 40,000 60,000 0 40,000 40,000 40,000 - 300,000
Buildings
Port Sandfield Park - Washroom Roof -
Windermere Pavillion - Sign -
Bala Sports Park - Stain -
Sunset Park - Washroom Roof -
Baycliffe Park - Washroom Stalls 160,000 160,000
Buildings - - - - - - 160,000 - - - 160,000
Marine Facilities
Adams Bay Launch Repairs -
Boyce Rd Dock 22,000
Beaumaris Wharf -
Carlingford Rd Dock 60,000 125,000
High Lake Dock 10,000
63

DEPARTMENT NAME: Parks
Project Title and description 2019 2020 2021 2022 2023 2024 2025 2026 2027 2028 Total
Indian River Crescent - Repalce Dock 20,000 Maple Leaf Bay - Level Crib Dock, New Floating Docks
90,000 72,000
Whitings Road Dock/Ramp, Ramp Improvements & Tree Removal
7,500 7,500.00
Windermere Freight Shelter - Structural Corrections
50,000
Windermere Park Dock 35,000
Innisfree Dock/Ramp - New Ramp/Base -
Riverview Drive - Replace Dock -
Bala - Portage St. Ramp/Dock Replacement 1,500,000 1,500,000
Baycliffe Launch - New Ramp, Level & Re-deck Dock
410,000 410,000
Church Dock - New Docks 115,000 115,000
Nine Mile Lk Launch - Improve Parking Drainage 15,000 15,000
Sunset Park Dock - Engineer to confirm intergrity, Re-deck/Level Dock
150,000 150,000
McDonald Road Wharf (Foots Bay) 1,000,000 1,000,000
Bala - River Street Dock - New Ramp 400,000 400,000
Rosseau Lake Road 2 - Remove Dock/Causeway (Do not replace)
50,000 50,000
Adams Bay Dock/Ramp - Re-construct Dock & Ramp
225,000 225,000
Hannah Park Docks/Ramp - Re-construct Ramp, Replace Docks
285,000 285,000
Skeleton Lake Road 2 Dock - Level, Re-deck 150,000 150,000
Three Mile Lk Launch - Ramp Repair 8,500 8,500
Long Lake (Bala) - Ramp Improvements 4,500 4,500 9,000
Marine Facilities 294,500 1,500,000 815,000 1,000,000 747,000 285,000 150,000 8,500 4,500 4,500 4,325,000
64

DEPARTMENT NAME: Parks
Project Title and description 2019 2020 2021 2022 2023 2024 2025 2026 2027 2028 Total
Property
Parks Master Plan 25,000 25,000
Jaspen Park Grading Improvements 25,000 25,000
Hannah Park Electrical Improvements -
Dock Ladders -
1890 School House (GO cemetery building): Repaint exterior
9,500 9,500.00
Planters for DOM blue line dock (Remove Boulders)
10,000 10,000
Skeleton Road # 5 repair entrance and parking lot -
SMART - Turtles Program 5,000 5,000
Fish Hatchery Removal -
Land Purchase 100,000 100,000
Property 169,500 5,000 - - - - - - - - 174,500
Total 506,200 1,547,500 860,800 1,042,500 810,800 327,500 353,800 51,000 48,300 4,500 5,068,900
with inflation 506,200 1,573,498 875,261 1,060,014 824,421 333,002 359,744 51,857 49,111 4,576 5,637,685
65

DEPARTMENT NAME: Community Centres
Project 2019 2020 2021 2022 2023 2024 2025 2026 2027 2028 Total
Equipment
Divider
Exterior Refurbishing
Shingles
Furnace
Flooring
Total 2,800 - 17,000 - 1,200 850 4,500 - - 5,000 31,350
Equipment
Roof
Accessible Ramp
Furnace
Total 2,500 - 250 - 2,200 - 800 400 - 2,000 8,150
Equipment
Parking Lot
Windows
Doors
Steps/Walkway
Total 3,000 - 1,000 - - 10,000 - 1,200 - 2,500 17,700
Equipment
Septic System
Furnace
Shingles
Total - 6,000 - 2,500 - 1,800 7,500 - - 3,000 20,800
Equipment
Ceiling Fans
New Steel Door
Roof SEE AMP
Bala
Cardwell
Foot's Bay
Glen Orchard
Milford Bay
SEE AMP
SEE AMP
SEE AMP
SEE AMP
66
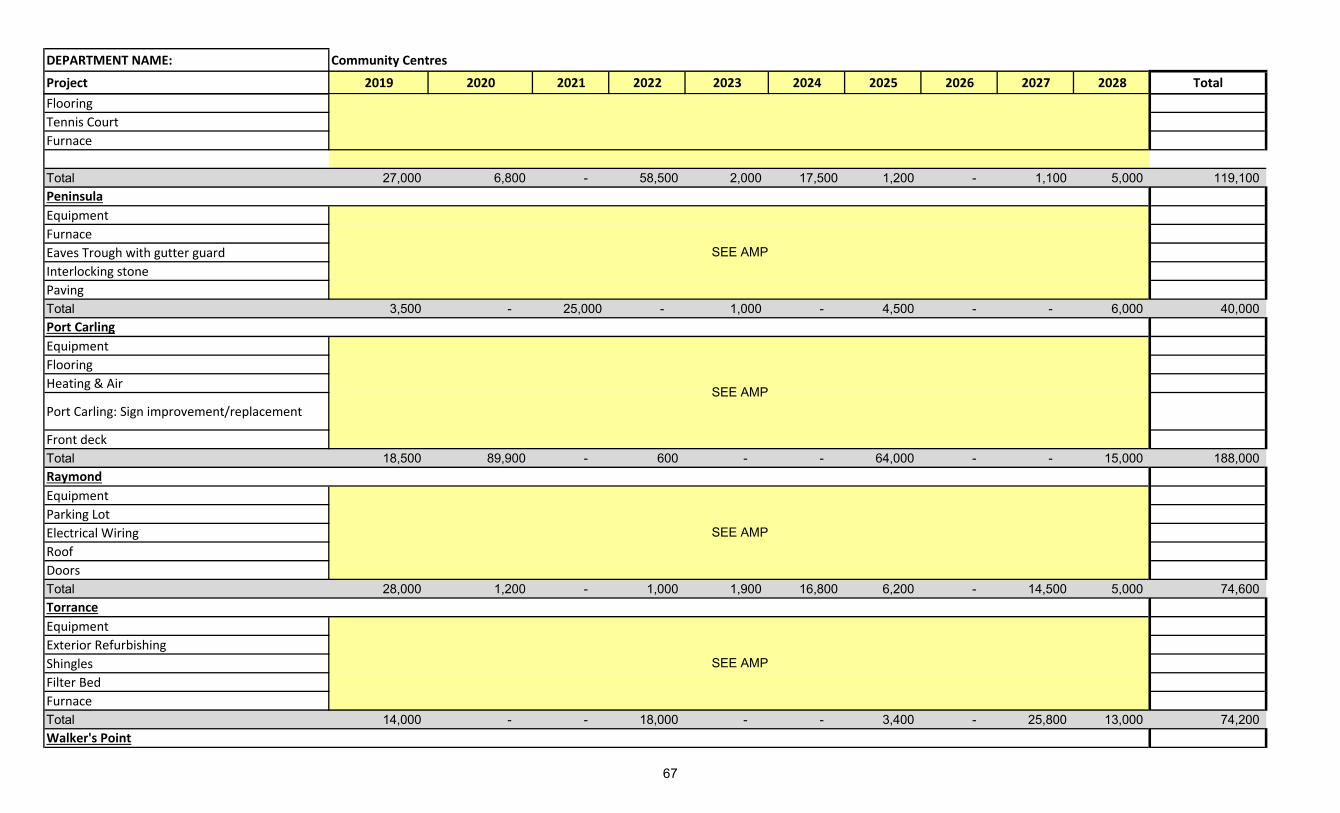
DEPARTMENT NAME: Community Centres
Project 2019 2020 2021 2022 2023 2024 2025 2026 2027 2028 Total
Flooring
Tennis Court
Furnace
Total 27,000 6,800 - 58,500 2,000 17,500 1,200 - 1,100 5,000 119,100
Equipment
Furnace
Eaves Trough with gutter guard
Interlocking stone
Paving
Total 3,500 - 25,000 - 1,000 - 4,500 - - 6,000 40,000
Equipment
Flooring
Heating & Air
Port Carling: Sign improvement/replacement
Front deck
Total 18,500 89,900 - 600 - - 64,000 - - 15,000 188,000
Equipment
Parking Lot
Electrical Wiring
Roof
Doors
Total 28,000 1,200 - 1,000 1,900 16,800 6,200 - 14,500 5,000 74,600
Equipment
Exterior Refurbishing
Shingles
Filter Bed
Furnace
Total 14,000 - - 18,000 - - 3,400 - 25,800 13,000 74,200
SEE AMP
SEE AMP
SEE AMP
SEE AMP
Peninsula
Port Carling
Raymond
Torrance
Walker's Point
67

DEPARTMENT NAME: Community Centres
Project 2019 2020 2021 2022 2023 2024 2025 2026 2027 2028 Total
Equipment
Site Grading
Filter Bed
Flooring
Total 9,500 - 25,000 2,200 4,500 - - 2,500 - 8,000 51,700
Equipment
Barrier Free Ramp/Railing
Shingles
Filter Bed
Parking Lot
Signage
Total - - - 5,000 11,000 - - 1,800 - 4,000 21,800
Equipment
Interior Refurbishing
Exterior Refurbishing
Parking Lot
Filter Bed
Total 17,300 2,200 11,500 - - 1,200 1,500 - - 2,000 35,700
TOTAL: 126,100 106,100 79,750 87,800 23,800 48,150 93,600 5,900 41,400 70,500 683,100
with inflation 126,100 107,882 81,090 89,275 24,200 48,959 95,172 5,999 42,096 71,684 692,458
SEE AMP
SEE AMP
SEE AMP
Windermere
Ullswater
68

DEPARTMENT NAME: Arenas
Project 2019 2020 2021 2022 2023 2024 2025 2026 2027 2028 Total 10 YEARS
Bala
Ice Resurfacer 93,000 93,000
Engineer's Report 11,000 14,000 25,000
Chiller (20-25 years-due now)
88,000 88,000
Heating System 65,000 65,000
Flat Roof-Front (North End)
82,000 82,000
Flat Roof-South End 95,000 95,000
Arena Floor & Boards 1,300,000 1,300,000
Dehumidifier 53,000 53,000
Brine Header Trench-Main Lines
48,000 48,000
Accessibility Compliance 20,000 20,000
Replace Lighting with LED 51,000 51,000
Condenser (18-20 years) 75,000 75,000
Compressor #1 (20-25 years)
-
Scoreclock 20,000 20,000
Stereo System -
Arena Main Roof -
Compressor #2 (20-25 years)
-
Replace Discharge lines -
Matting for Dressing Rooms
40,000 40,000
Subtotal Bala 11,000 88,000 1,447,000 71,000 141,000 67,000 95,000 40,000 20,000 75,000 2,055,000
with inflation 11,000 89,478 1,471,310 72,193 143,369 68,126 96,596 40,672 20,336 76,260 2,089,339
Port Carling
Chiller (20-25 years) -
Condenser (18-20 years) -
Compressor (6 cylinder) 58,000 58,000
Engineer's Report 11,000 14,000 25,000
69

DEPARTMENT NAME: Arenas
Project 2019 2020 2021 2022 2023 2024 2025 2026 2027 2028 Total 10 YEARS
Header Brine Trench -
West Side Flat Roof 85,000 85,000
Arena Floor & Boards 1,200,000 1,200,000
Accessibility Compliance 20,000 20,000
Dehumidifier- North End 49,000 49,000
Ice Resurfacer (20 yrs.) 2,269 2,269
Replacement piping Plant Rm
55,000 55,000
Glycol Loop- reduce Water 29,000 29,000
Heating System-Roof 74,000 74,000
Furnaces in Janitor's Rm. -
Replace Matting-Lobby 56,000 56,000
Replace Matting-Rooms 65,000 65,000
Replace Lighting to LED 48,000 48,000
Score clock 20,000 20,000
Low E Ceiling -
Drainage & Pavement Driveway
217,500 217,500
Stereo System -
Matting for Arena Area -
Subtotal Port Carling 11,000 1,200,000 77,000 105,000 55,000 63,000 58,000 74,000 293,500 67,269 2,003,769
with inflation 11,000 1,220,160 78,294 106,764 55,924 64,058 58,974 75,243 298,431 68,399 2,037,247
TOTAL CONSOLIDATED ARENAS
22,000 1,309,638 1,549,603 178,957 199,293 132,184 155,570 115,915 318,767 144,659 4,126,586
70

DEPARTMENT NAME: Maintenance
Project 2019 2020 2021 2022 2023 2024 2025 2026 2027 2028 TOTALS
Vehicle 1 40,000 40,000 80,000
Vehicle 2 40,000 40,000 40,000 120,000
Shop Improvements 20,000 20,000
TOTALS 40,000 - 20,000 40,000 - 40,000 - 40,000 - 40,000 220,000
with inflation 40,000 ‐ 20,336 40,672 ‐ 40,672 ‐ 40,672 ‐ 40,672 223,024
71
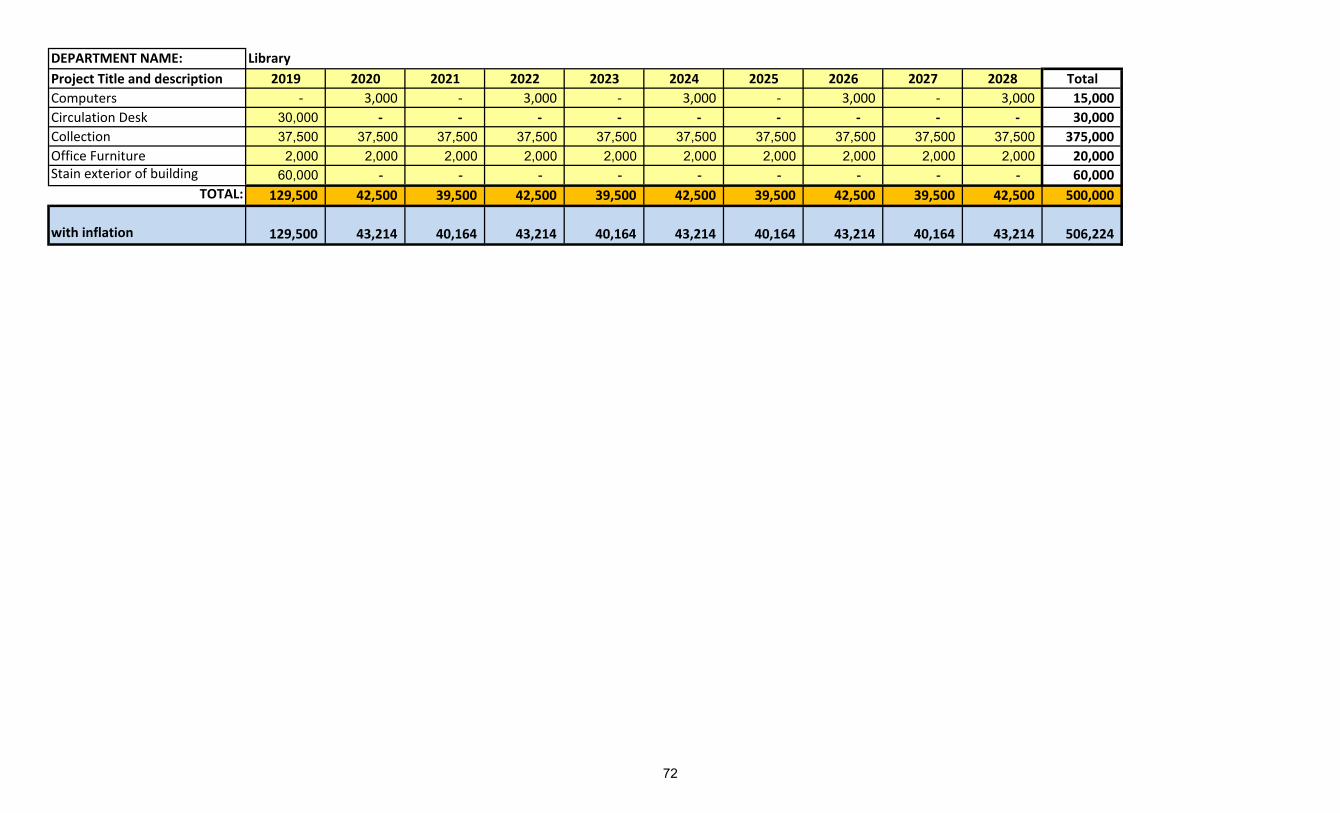
DEPARTMENT NAME: Library
Project Title and description 2019 2020 2021 2022 2023 2024 2025 2026 2027 2028 Total
Computers ‐ 3,000 ‐ 3,000 ‐ 3,000 ‐ 3,000 ‐ 3,000 15,000
Circulation Desk 30,000 ‐ ‐ ‐ ‐ ‐ ‐ ‐ ‐ ‐ 30,000
Collection 37,500 37,500 37,500 37,500 37,500 37,500 37,500 37,500 37,500 37,500 375,000
Office Furniture 2,000 2,000 2,000 2,000 2,000 2,000 2,000 2,000 2,000 2,000 20,000 Stain exterior of building 60,000 - - - - - - - - - 60,000
TOTAL: 129,500 42,500 39,500 42,500 39,500 42,500 39,500 42,500 39,500 42,500 500,000
with inflation 129,500 43,214 40,164 43,214 40,164 43,214 40,164 43,214 40,164 43,214 506,224
72

DEPARTMENT NAME: Trails
Project Title and description 2019 2020 2021 2022 2023 2024 2025 2026 2027 2028 TotalTrail head signage/maps 2,500 2,500Trail directional signage 0
Torrance barrens structure 15,000 15,000
Highway signage 0
Fish Hatchery signage 0TOTAL 17,500 - - - - - - - - - 17,500
with inflation 17,500 ‐ ‐ ‐ ‐ ‐ ‐ ‐ ‐ ‐ 17,500
73
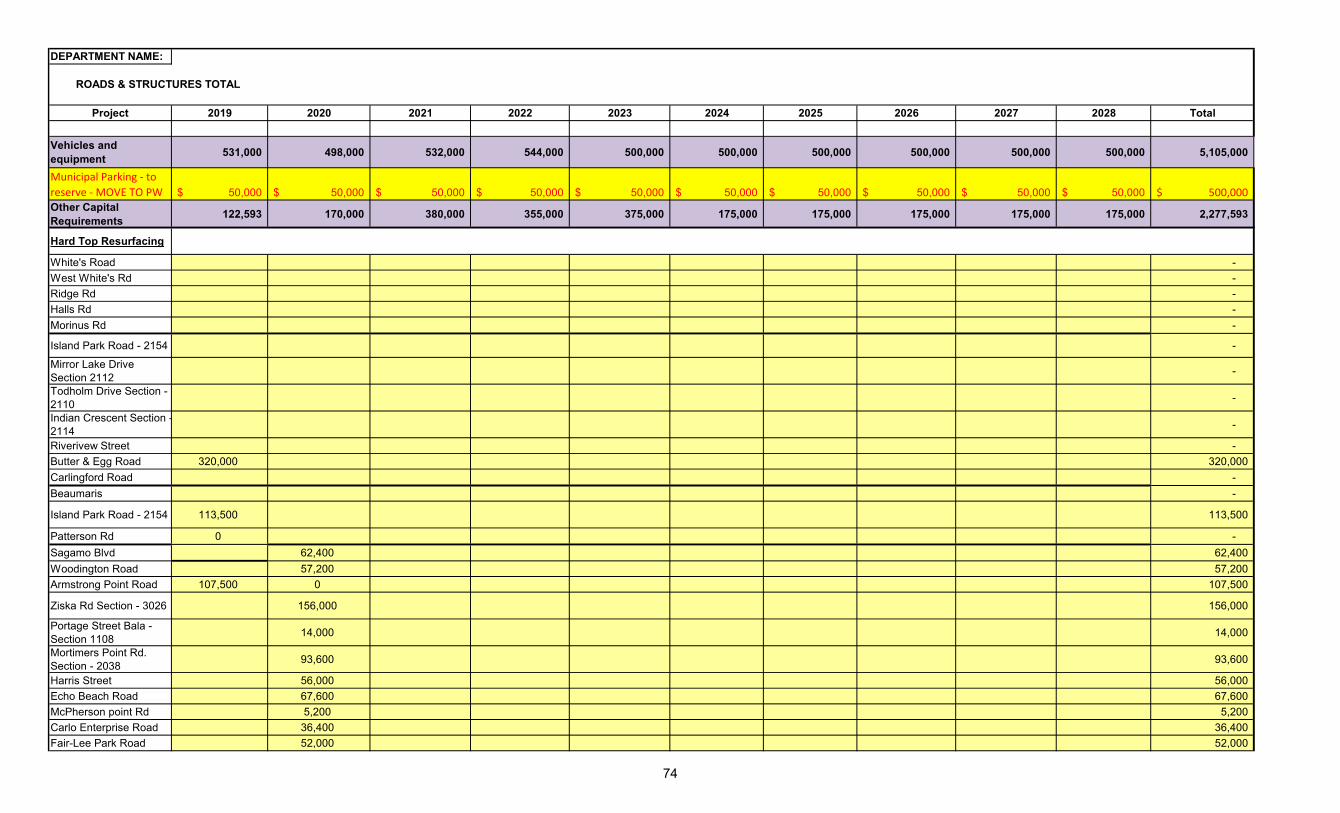
DEPARTMENT NAME:
Project 2019 2020 2021 2022 2023 2024 2025 2026 2027 2028 Total
Vehicles and equipment
531,000 498,000 532,000 544,000 500,000 500,000 500,000 500,000 500,000 500,000 5,105,000
Municipal Parking ‐ to
reserve ‐ MOVE TO PW 50,000$ 50,000$ 50,000$ 50,000$ 50,000$ 50,000$ 50,000$ 50,000$ 50,000$ 50,000$ 500,000$ Other Capital Requirements
122,593 170,000 380,000 355,000 375,000 175,000 175,000 175,000 175,000 175,000 2,277,593
Hard Top Resurfacing
White's Road -
West White's Rd -
Ridge Rd -
Halls Rd -
Morinus Rd -
Island Park Road - 2154 -
Mirror Lake Drive Section 2112
-
Todholm Drive Section - 2110
-
Indian Crescent Section -2114
-
Riverivew Street -
Butter & Egg Road 320,000 320,000
Carlingford Road -
Beaumaris -
Island Park Road - 2154 113,500 113,500
Patterson Rd 0 -
Sagamo Blvd 62,400 62,400
Woodington Road 57,200 57,200
Armstrong Point Road 107,500 0 107,500
Ziska Rd Section - 3026 156,000 156,000
Portage Street Bala - Section 1108
14,000 14,000
Mortimers Point Rd. Section - 2038
93,600 93,600
Harris Street 56,000 56,000
Echo Beach Road 67,600 67,600
McPherson point Rd 5,200 5,200
Carlo Enterprise Road 36,400 36,400
Fair-Lee Park Road 52,000 52,000
ROADS & STRUCTURES TOTAL
74

DEPARTMENT NAME:
Project 2019 2020 2021 2022 2023 2024 2025 2026 2027 2028 Total
ROADS & STRUCTURES TOTAL
Old Parry Sound Road 291,200 291,200
Spring Street 14,000 14,000 North Shore Road - 4042
26,000 26,000
Stephen Road 120,000 120,000
Duke Street 14,000 14,000
Long Point Road 26,000 26,000
Silver Street 7,000 7,000
Burns Street 14,000 14,000
Johnston Street 14,000 14,000
McMullen Drive 21,000 21,000
Bayview Avenue 21,000 21,000
Cherokee Crescent 31,200 31,200
James Bartleman Way 7,000 7,000
McLeod Rd 26,000 26,000
Old Bridge Road 26,000 26,000
Milford Manor Road 10,400 10,400
Ziska Rd Section - 3027 130,000 130,000
Buttler Road 52,000 52,000
Camel Lake Rd - 4068 83,200 83,200
Kitchener Street 35,000 35,000
Ferndale Rd 26,000 26,000
Oak Bank Rd 15,600 15,600
Marquis Lane 10,400 10,400
Cedar Rail Drive 52,000 52,000
Lawrences Pit Rd 57,200 57,200
Rostrevor Rd - 4032 140,400 140,400
Sandwood Road 93,600 93,600
Oak Street 22,500 0 22,500
Woodington Road 57,200 57,200
McDonald Road 26,000 26,000
Henshaw Lake Road 31,200 31,200
Kerrie Glen Road 15,600 15,600
Skeleton Lake Rd 2 52,000 52,000
River Street Bala - 1112 77,000 77,000
Russ Hammel Road 150,800 150,800
Dawson Road 150,800 150,800
Section House Road 10,400 10,400
75

DEPARTMENT NAME:
Project 2019 2020 2021 2022 2023 2024 2025 2026 2027 2028 Total
ROADS & STRUCTURES TOTAL
Camel Lake Rd - 4066 135,200 135,200
Sutton Road 31,200 31,200
Gullwing Lake Rd 36,400 36,400
Pleasant View Point Rd 62,400 62,400
Islander Avenue 26,000 26,000
Longhurst Rd 171,000 171,000
Whiteside Road 254,000 254,000
Kimberley Point Road 41,600 41,600
Hallets Rd 52,000 52,000
Kendon Rd 109,200 109,200
Matthew's Rd 35,000 35,000
Cove Rd 31,200 31,200
Cranberry Rd 72,800 72,800
Bluff's Rd 15,600 15,600
North Shore Rd - 4038 41,600 41,600
Shea Rd - 4060 41,600 41,600
Skeleton Lake Rd 3 20,800 20,800
Weismiller St 42,000 42,000
Currie Street 35,000 35,000
Carl's Rd 83,200 83,200
Scarcliffe Rd 57,200 57,200
Butterfly Rd 93,600 93,600
Hammels Hollow 15,600 15,600
Morinus Rd 119,600 119,600
Eveleigh Rd 130,000 130,000
Gregory Rd 41,600 41,600
Sutton Dr 28,000 28,000
Moon River Rd 234,000 234,000
Windsor Dr 70,000 70,000
Rostrevor Rd - 4030 52,000 52,000
Three Mile Lake Rd 1 88,400 88,400
Skeleton Lake Rd 3 46,800 46,800
Shea Rd - 4058 83,200 83,200
Fife Avenue 55,000 55,000
Strathdee Rd 57,200 57,200
Keeler Rd 40,000 40,000
Johnston Street 43,882 43,882
Kitchener Street 136,117 136,117
Echo Beach Road 140,887 140,887
76

DEPARTMENT NAME:
Project 2019 2020 2021 2022 2023 2024 2025 2026 2027 2028 Total
ROADS & STRUCTURES TOTAL
Russ Hammel Road 323,181 323,181
Butler Rd 182,000 182,000 364,000
Carlingford Road 371,131 371,131 742,262
River Street Bala - 1113 196,974 196,974 393,948
Subtotal Hard Top Resurfacing
683,500 891,600 661,800 1,065,000 1,051,800 568,800 686,600 684,067 750,105 750,105 7,793,377
Gravel Resurfacing
Rosseau Lake Road 2 0
Bear Cave Road 0
Rosseau Lake Road 3 0
Crawford Street 0
Houston Road -
Woodruff Road -
Chowan Road -
Youngs Road -
Fogo Road -
Shenamere Road -
Leonard Lake Road 2 -
Skeleton Lake Road 4 -
Josh Bay Road -
Hekkla Road -
Shannon Hall Road - Skeleton Lake Rd 5 Section - 4104
-
Fogo Street 0 0
Stroud Breach Road 0 0
Tom Wroe Road 0 0
Pratt Rd 10,500 10,500
Chown 0 0
South Monck 100,300 100,300Hemlock Point Road Section - 2058
23,800 23,800
Pennwood Rd - Section 2160.2
0 0
Purdy Rd Section - 4034 0 0
Paignton House Rd 0 0
Rosseau Lake Rd 1 45,900 45,900
Hemlock Point Sideroad 17,000 0 17,000
77

DEPARTMENT NAME:
Project 2019 2020 2021 2022 2023 2024 2025 2026 2027 2028 Total
ROADS & STRUCTURES TOTAL
Trafalger Bay Rd 32,300 32,300
Whites Road 32,300 32,300
Neil Beathune Road 8,500 8,500
Leonard Lake Rd 2 17,000 17,000
Bannockburn Rd 17,000 17,000
Roberts Bay Rd 27,200 27,200
Hardy Lake Rd 22,100 22,100Brandy Crest Road - 3006
13,600 13,600
Bear Cave Rd - Sect 5014
44,200 44,200
Wilson Lodge Road 17,000 17,000
Hill Rd 5,100 5,100
Glen Gordon Road 30,500 0 30,500Carlo Enterprise Rd - 4079
10,200 10,200
Pine Needle Point Road 18,700 18,700
Camp Jackson Rd - 1128
54,000 54,000
Houston Rd 40,800 40,800
Segwun Place 13,600 13,600
McKenzie Rd 23,800 23,800
Partridge Lane 30,600 30,600
Luckey Rd - 4074 32,300 32,300
Hazelwood Rd 8,500 8,500
Rosseau Lake Rd 3 39,100 39,100
Craigie Lea Rd 10,200 10,200
Cranberry Rd - 1142 8,500 8,500
Woodroffe Rd - 2030 5,100 5,100
Shennamere Rd 18,700 18,700
Buttler Mill Rd - 5034 17,000 17,000
Sandor Dr 5,100 5,100
Roy Klingbeil Road 3,400 3,400
Shannon Hall Rd 27,200 27,200
Crawford St 44,200 44,200
Cooper's Point Rd 18,700 18,700
Tom Greer Rd 10,200 10,200
Woodwinds Rd 13,600 13,600Camp Jackson Rd - 1127
20,400 20,400
78

DEPARTMENT NAME:
Project 2019 2020 2021 2022 2023 2024 2025 2026 2027 2028 Total
ROADS & STRUCTURES TOTAL
Brandy Crest Road - 3004
5,100 5,100
Rosseau Lake Rd 1 45,900 45,900
Doherty Rd 103,700 103,700
Inverness Rd 10,200 10,200
Fogo Street 17,000 17,000 34,000
Stroud Breach Road 25,500 25,500 51,000
Tom Wroe Road 5,100 5,100 10,200
Crawford Rd 8,500 8,500 17,000
Pratt Rd 8,500 8,500 17,000
Paignton House Rd 10,200 10,200 20,400
Hemlock Point Sideroad 17,000 17,000 34,000
Trafalger Bay Rd 32,300 32,300 64,600
Whites Road 32,300 32,300 64,600
Neil Beathune Road 8,500 8,500 17,000
Subtotal Gravel Resurfacing
81,800 219,300 141,100 159,400 95,200 107,100 113,900 185,300 164,900 164,900 1,432,900
Road Sealing
Campbell's Rd -
Clear Water Shores -
Tammark Trail -
Townline Road -
Old Parry Sound Road -
Clear Lake Road - Mortimers Point Rd. Section - 2038
-
Gullwing Lake Road -
Brackenrig Centre Road -
Tondern Island Rd - 1.6km
16,800 16,800
Clear Lake Rd 28,842 28,842
Gullwing Lake Rd 7,315 7,315Hammils Point Rd - 2.1km
22,050 22,050
Mortimers Point Rd. Section - 2038
18,900 18,900
Acton Island Rd - 5.5km 57,750 57,750
Innisfree Rd - 3.6km 37,800 37,800
79

DEPARTMENT NAME:
Project 2019 2020 2021 2022 2023 2024 2025 2026 2027 2028 Total
ROADS & STRUCTURES TOTAL
Beaumaris Rd Section - 3020
19,950 19,950
Ziska Rd Section - 3026 31,500 31,500
Island Park Road - 2154 18,900 18,900
Greenwood Point Road 12,600 12,600
McDonald Road 5,250 5,250
Henshaw Lake Road 6,300 6,300
White's Road 4,200 4,200
Kerrie Glen Road 3,150 3,150
West White's Rd 4,200 4,200
Skeleton Lake Rd 2 10,500 10,500
Russ Hammel Road 30,450 30,450
Beatrice Townline Road 74,550 74,550
Carlingford Road 34,650 34,650
Patterson Rd 4,200 4,200
Sagamo Blvd 12,600 12,600
Woodington Road 11,550 11,550
Armstrong Point Road 14,700 14,700
Echo Beach Road 13,650 13,650
McPherson point Rd 1,050 1,050
Fair-Lee Park Road 10,500 10,500
Old Parry Sound Road 58,800 58,800North Shore Road - 4042
5,250 5,250
Long Point Road 5,250 5,250
Cherokee Crescent 6,300 6,300
McLeod Rd 5,250 5,250
Old Bridge Road 5,250 5,250
Milford Manor Road 2,100 2,100
Ziska Rd Section - 3027 26,250 26,250
Buttler Road 10,500 10,500
Camel Lake Rd - 4068 16,800 16,800
Ferndale Rd 5,250 5,250
Oak Bank Rd 3,150 3,150
Marquis Lane 2,100 2,100
Cedar Rail Drive 10,500 10,500
Lawrences Pit Rd 11,550 11,550
80
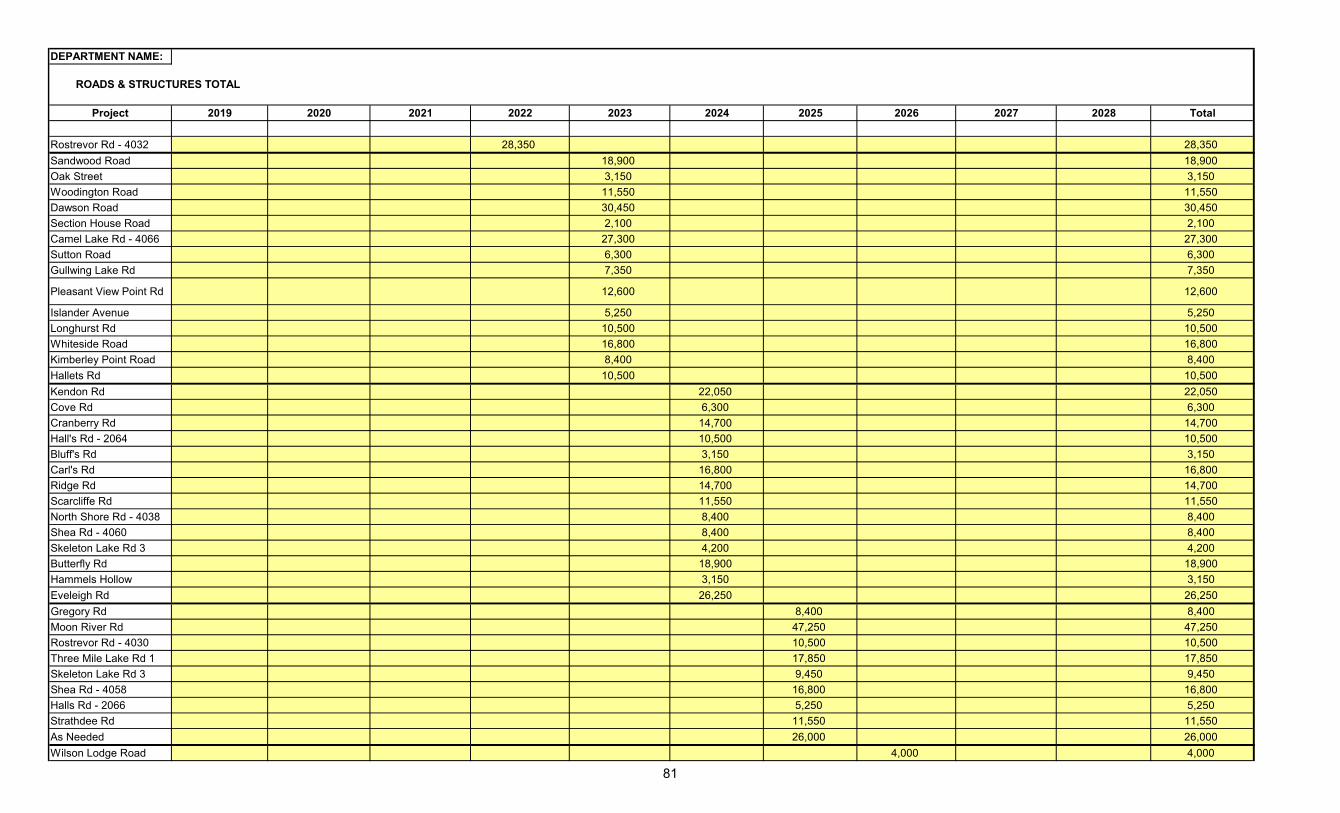
DEPARTMENT NAME:
Project 2019 2020 2021 2022 2023 2024 2025 2026 2027 2028 Total
ROADS & STRUCTURES TOTAL
Rostrevor Rd - 4032 28,350 28,350
Sandwood Road 18,900 18,900
Oak Street 3,150 3,150
Woodington Road 11,550 11,550
Dawson Road 30,450 30,450
Section House Road 2,100 2,100
Camel Lake Rd - 4066 27,300 27,300
Sutton Road 6,300 6,300
Gullwing Lake Rd 7,350 7,350
Pleasant View Point Rd 12,600 12,600
Islander Avenue 5,250 5,250
Longhurst Rd 10,500 10,500
Whiteside Road 16,800 16,800
Kimberley Point Road 8,400 8,400
Hallets Rd 10,500 10,500
Kendon Rd 22,050 22,050
Cove Rd 6,300 6,300
Cranberry Rd 14,700 14,700
Hall's Rd - 2064 10,500 10,500
Bluff's Rd 3,150 3,150
Carl's Rd 16,800 16,800
Ridge Rd 14,700 14,700
Scarcliffe Rd 11,550 11,550
North Shore Rd - 4038 8,400 8,400
Shea Rd - 4060 8,400 8,400
Skeleton Lake Rd 3 4,200 4,200
Butterfly Rd 18,900 18,900
Hammels Hollow 3,150 3,150
Eveleigh Rd 26,250 26,250
Gregory Rd 8,400 8,400
Moon River Rd 47,250 47,250
Rostrevor Rd - 4030 10,500 10,500
Three Mile Lake Rd 1 17,850 17,850
Skeleton Lake Rd 3 9,450 9,450
Shea Rd - 4058 16,800 16,800
Halls Rd - 2066 5,250 5,250
Strathdee Rd 11,550 11,550
As Needed 26,000 26,000
Wilson Lodge Road 4,000 4,000
81
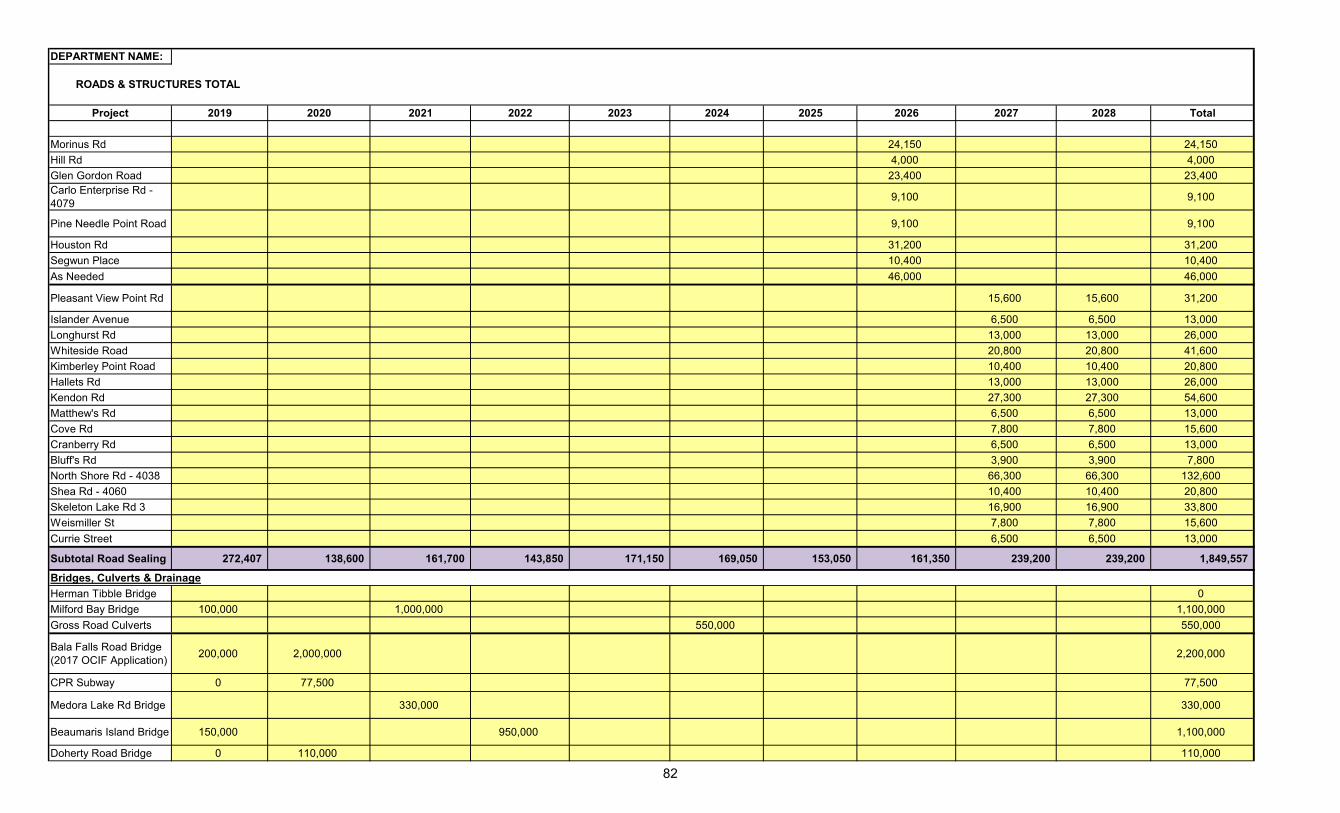
DEPARTMENT NAME:
Project 2019 2020 2021 2022 2023 2024 2025 2026 2027 2028 Total
ROADS & STRUCTURES TOTAL
Morinus Rd 24,150 24,150
Hill Rd 4,000 4,000
Glen Gordon Road 23,400 23,400Carlo Enterprise Rd - 4079
9,100 9,100
Pine Needle Point Road 9,100 9,100
Houston Rd 31,200 31,200
Segwun Place 10,400 10,400
As Needed 46,000 46,000
Pleasant View Point Rd 15,600 15,600 31,200
Islander Avenue 6,500 6,500 13,000
Longhurst Rd 13,000 13,000 26,000
Whiteside Road 20,800 20,800 41,600
Kimberley Point Road 10,400 10,400 20,800
Hallets Rd 13,000 13,000 26,000
Kendon Rd 27,300 27,300 54,600
Matthew's Rd 6,500 6,500 13,000
Cove Rd 7,800 7,800 15,600
Cranberry Rd 6,500 6,500 13,000
Bluff's Rd 3,900 3,900 7,800
North Shore Rd - 4038 66,300 66,300 132,600
Shea Rd - 4060 10,400 10,400 20,800
Skeleton Lake Rd 3 16,900 16,900 33,800
Weismiller St 7,800 7,800 15,600
Currie Street 6,500 6,500 13,000
Subtotal Road Sealing 272,407 138,600 161,700 143,850 171,150 169,050 153,050 161,350 239,200 239,200 1,849,557
Bridges, Culverts & Drainage
Herman Tibble Bridge 0
Milford Bay Bridge 100,000 1,000,000 1,100,000
Gross Road Culverts 550,000 550,000
Bala Falls Road Bridge(2017 OCIF Application)
200,000 2,000,000 2,200,000
CPR Subway 0 77,500 77,500
Medora Lake Rd Bridge 330,000 330,000
Beaumaris Island Bridge 150,000 950,000 1,100,000
Doherty Road Bridge 0 110,000 110,000
82

DEPARTMENT NAME:
Project 2019 2020 2021 2022 2023 2024 2025 2026 2027 2028 Total
ROADS & STRUCTURES TOTAL
Dee River Bridge 0 76,000 45,500 121,500
Bala Bay Dock Bridge 195,000 195,000Beatrice Townline Bridge #1
560,000 560,000
Clear Lake Rd Bridge 55,000 55,000
Milford Bay Rd Culvert 30,000 30,000
Dark Bay Rd Culvert 0 50,000 50,000
Bear Cave Road Culvert 0 50,000 50,000
Three Mile Lake Rd Culvert
-
Carlo Enterprise Drainage Improvements
-
Duke Street Drainage Imrpovements
-
Subtotal Bridges 450,000 3,008,500 1,330,000 995,500 - 550,000 - 195,000 - - 6,529,000
ROADS & STRUCTURES TOTAL
2,191,300$ 4,976,000$ 3,256,600$ 3,312,750$ 2,243,150$ 2,119,950$ 1,678,550$ 1,950,717$ 1,879,205$ 1,879,205$ 25,487,427$
with inflation 2,191,300$ 5,059,597$ 3,311,311$ 3,368,404$ 2,280,835$ 2,155,565$ 1,706,750$ 1,983,489$ 1,910,776$ 1,910,776$ 25,878,802$
83