council’s natural resources branch
TRANSCRIPT


Acknowledgements:
Data used in the 2014-2015 Water Quality Monitoring Program Annual Report was collected and analysed by
Kristy Guise under the supervision of Peter Coad, Natural Resources Strategy Manager and Diane Campbell,
Manager Natural Resources Branch. Assistance with sampling and data collection was provided by staff from
Council’s Natural Resources Branch along with a number of volunteers and work experience students. Laboratory
analysis was carried out by Sydney Water Monitoring Services and phytoplankton identification carried out by
Microalgal Services.
For further information contact:
Kristy Guise Environmental Scientist – Water Quality Natural Resources Branch Environment & Human Services Division Phone 02 9847 6874 Email [email protected]

Table of Contents
Table of Contents ........................................................................................................................................................ ii
Table of Figures ..........................................................................................................................................................v
Table of Tables ......................................................................................................................................................... vii
Executive Summary ................................................................................................................................................... 1
1. Hornsby Shire and Catchments .......................................................................................................................... 3
1.1 Hornsby Shire Region ............................................................................................................................... 3
1.2 Major Water Catchments ........................................................................................................................... 4
1.2.1 Berowra Creek Catchment .................................................................................................................... 4
1.2.2 Cowan Creek Catchment ...................................................................................................................... 4
1.2.3 Lane Cove River ................................................................................................................................... 4
1.2.4 Hawkesbury River Catchment ............................................................................................................... 4
2. Water Quality Monitoring Program...................................................................................................................... 6
2.1 Water Quality Management ....................................................................................................................... 6
2.1.1 National Level ....................................................................................................................................... 6
2.1.2 Regional Level ...................................................................................................................................... 6
2.1.3 Local Level ............................................................................................................................................ 6
2.2 History of the Program .............................................................................................................................. 6
2.3 Program Objectives ................................................................................................................................... 7
2.4 Program Review ........................................................................................................................................ 7
3. Water Quality Sites ............................................................................................................................................. 8
3.1 Aquatic Ecosystem Health ........................................................................................................................ 8
3.1.1 Reference Sites ..................................................................................................................................... 8
3.1.2 Industrial, Rural and Urban Sites .......................................................................................................... 8
3.1.3 Estuarine Sites ...................................................................................................................................... 9
3.2 Catchment Remediation Initiatives .......................................................................................................... 13
3.2.1 Stormwater Harvesting and Reuse ..................................................................................................... 13
3.2.2 Stormwater Quality Improvement ........................................................................................................ 13
3.2.3 Disused Landfill Remediation .............................................................................................................. 13
4. Sampling and Testing Procedures .................................................................................................................... 15
4.1 Routine Monitoring .................................................................................................................................. 15

4.1.1 Field Measurements ............................................................................................................................ 15
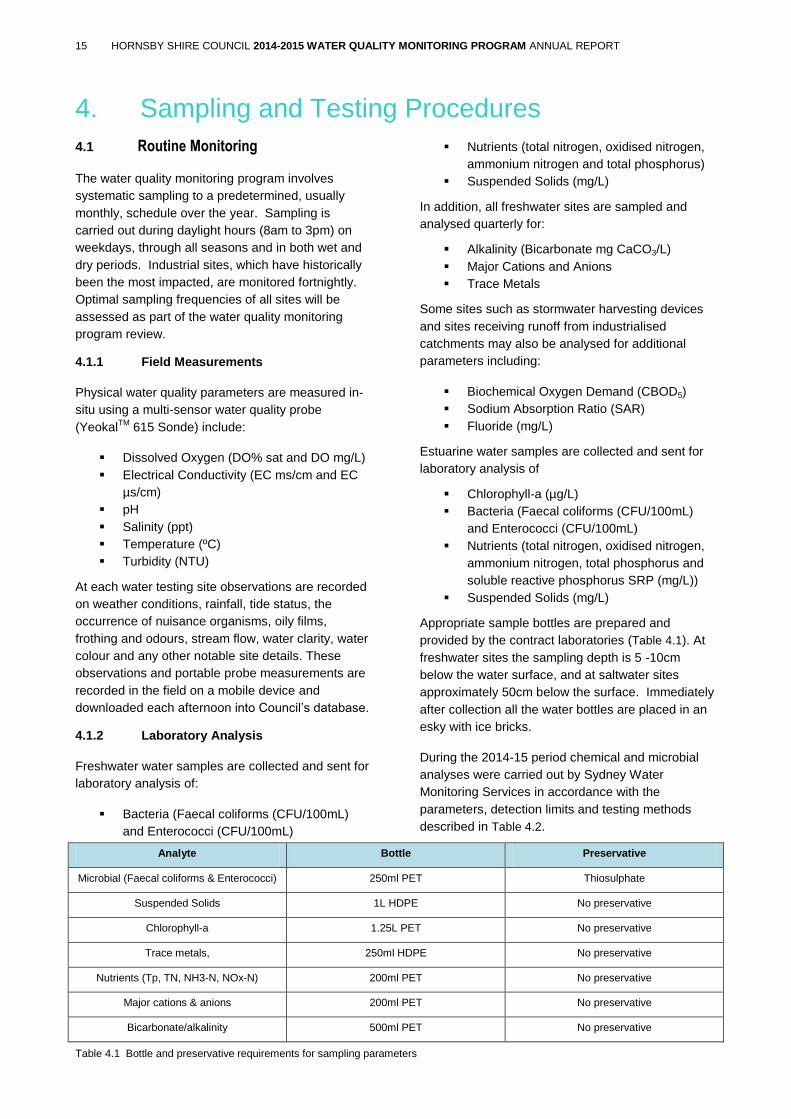
4.1.2 Laboratory Analysis ............................................................................................................................. 15
4.1.3 Phytoplankton Identification ................................................................................................................ 16
4.2 Quality Assurance / Quality Control ........................................................................................................ 17
4.2.1 Probe Calibration ................................................................................................................................ 17
4.2.2 Sample Handling ................................................................................................................................. 17
4.2.3 Duplicate and Field Blank Samples .................................................................................................... 17
4.2.4 Laboratory Procedures ........................................................................................................................ 17
5. Water Quality Guidelines .................................................................................................................................. 18
5.1 Aquatic Ecosystem Protection ................................................................................................................. 18
5.1.1 Australian Water Quality Guidelines ................................................................................................... 18
5.1.2 Regional Environmental Health Values ............................................................................................... 18
5.2 Stormwater Harvesting and Reuse ......................................................................................................... 20
5.3 Estuarine Phytoplankton / Microalgal Bloom Hazards ............................................................................ 21
6. Presentation of Monitoring Data ....................................................................................................................... 22
6.1 Box and Whisker Plots ............................................................................................................................ 22
6.2 Waterway Health Grading ....................................................................................................................... 23
6.2.1 Indicator Health Grade ........................................................................................................................ 23
6.2.2 Site Health Grade ................................................................................................................................ 25
6.2.3 Summary Waterway Health Grade ..................................................................................................... 26
7. Water Quality Monitoring Results ..................................................................................................................... 27
7.1 Influence of Rainfall on Water Quality ..................................................................................................... 27
7.2 Aquatic Ecosystem Health ...................................................................................................................... 29
7.2.1 QA/QC Results .................................................................................................................................... 29
7.2.2 Reference Sites ................................................................................................................................... 30
7.2.3 Industrial Sites ..................................................................................................................................... 34
7.2.4 Rural Sites ........................................................................................................................................... 37
7.2.5 Urban Sites ......................................................................................................................................... 40
7.2.6 Estuarine Sites .................................................................................................................................... 43
7.2.7 Estuarine Phytoplankton Analysis ....................................................................................................... 47
7.2.8 Wastewater Treatment Plant Sites ...................................................................................................... 51
7.3 Catchment Remediation Initiatives .......................................................................................................... 57

7.3.1 Stormwater Harvesting and Reuse ..................................................................................................... 57
7.3.2 Landfill Sites ........................................................................................................................................ 59
8. Summary .......................................................................................................................................................... 61
9. Acronyms .......................................................................................................................................................... 62
10. References .................................................................................................................................................. 63
11. Appendices .................................................................................................................................................. 65

Table of Figures
Figure 1 Percentage of site health grades for physical-chemical indicators within each catchment land use .......... 1
Figure 2 Percentage of site health grades for microbial indicators within each catchment land use ........................ 1
Figure 1.1 Hornsby Shire Council Zoning Map ......................................................................................................... 3
Figure 1.2 Hornsby Shire Council Major Catchments ............................................................................................... 5
Figure 3.1 Remote water quality monitoring buoy at Courangra Point on the Hawkesbury River ............................ 9
Figure 3.2 Active water quality monitoring sites for 2014-15 .................................................................................. 11
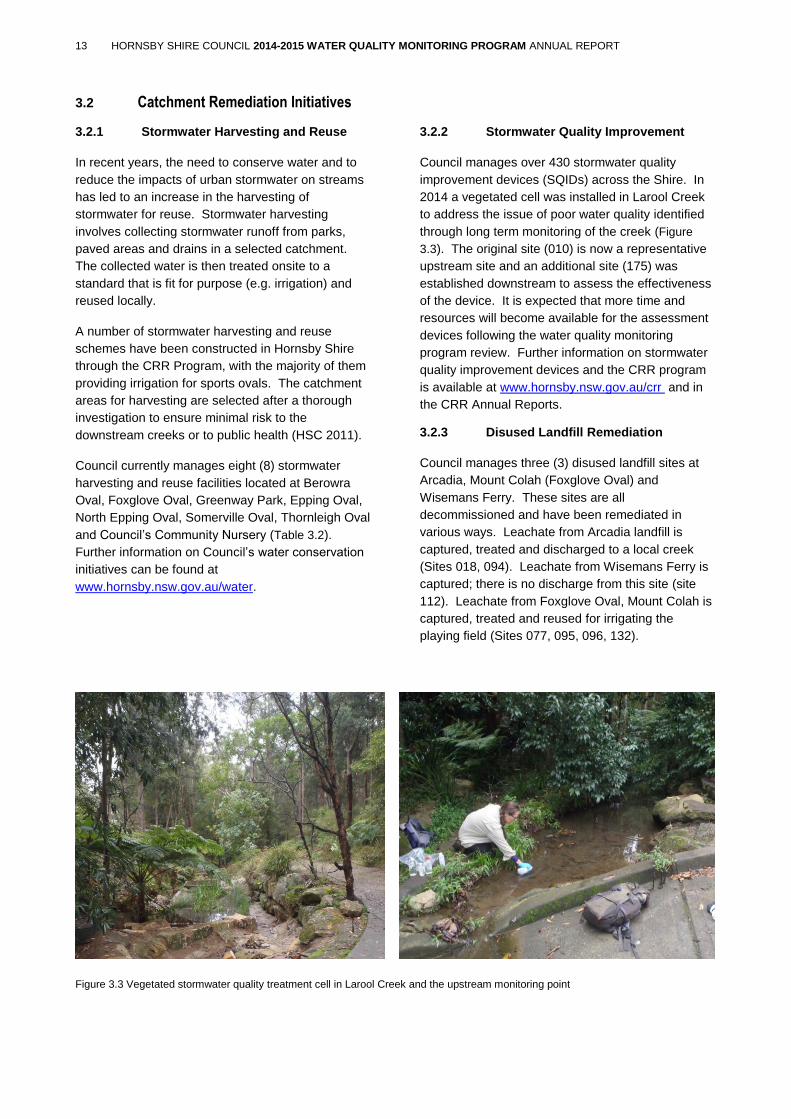
Figure 3.3 Vegetated stormwater quality treatment cell in Larool Creek and the upstream monitoring point .......... 13
Figure 4.1 Collecting and preserving an integrated (profiling tube) and a concentrated (net tow) sample for
phytoplankton analysis ............................................................................................................................................. 16
Figure 6.1 Interpretation of water quality data using box and whisker plots ........................................................... 23
Figure 6.2 Method for indicator health grading for physical-chemical stressors using percentiles and REHVs on a
box and whisker plot ................................................................................................................................................ 24
Figure 6.3 Method for indicator health grading for physical-chemical stressors using percentiles and REHVs on a
histogram ................................................................................................................................................................. 24
Figure 6.4 Method for indicator health grading for microbial stressors using percentiles and REHVs on a box and
whisker plot .............................................................................................................................................................. 24
Figure 6.5 How indicator grades are scored and averaged to produce a site grade for physical-chemical stressors
................................................................................................................................................................................. 25
Figure 6.6 Physical-chemical, microbial and aquatic biota indicators used to determine a summary waterway
health gradings ........................................................................................................................................................ 26
Figure 7.1 Comparison of dry weather and wet weather flows in Tunks Creek (Site 002) ..................................... 27
Figure 7.2 Water quality monitoring dates and wet weather monitoring events overlayed on daily rainfall ............ 28
Figure 7.3 Water quality in creeks in primarily undisturbed locations: annual distribution of parameters compared
with REHVs for freshwater aquatic ecosystem health ............................................................................................. 32
Figure 7.4 Water quality in creeks receiving runoff from industrial areas: annual distribution of parameters
compared with reference creeks and REHVs for freshwater aquatic ecosystem health ......................................... 36
Figure 7.5 Water quality in creeks receiving runoff from rural areas: annual distribution of parameters compared
with reference creeks and REHVs for freshwater aquatic ecosystem health .......................................................... 39
Figure 7.6 Water quality in creeks receiving runoff from urban areas: annual distribution of parameters compared
with reference creeks and REHVs for freshwater aquatic ecosystem health .......................................................... 42
Figure 7.7 Water quality in estuarine areas: annual distribution of parameters compared with REHVs for estuarine
aquatic ecosystem health ........................................................................................................................................ 46
Figure 7.8 Distribution of microalgal classes present at each site for at least 10 months of the reporting year ..... 49
Figure 7.9 Comparison of potentially harmful versus non- harmful algae species per site during the 2013-14 period
................................................................................................................................................................................. 49

Figure 7.10 Water quality at creeks associated with West Hornsby wastewater treatment plant discharge: annual
distribution of selected parameters compared to reference sites and REHVs for freshwater aquatic ecosystem
health ....................................................................................................................................................................... 53
Figure 7.11 Water quality at creeks associated with West Hornsby wastewater treatment plant discharge: annual
distribution of selected parameters compared to reference sites and REHVs for freshwater aquatic ecosystem
health ....................................................................................................................................................................... 56
Figure 7.12 Water quality in stormwater harvesting and reuse systems: annual distribution of selected parameters
comparing raw and treated stormwater ................................................................................................................... 58
Figure 7.13 Quality of leachate from Foxglove Oval disused landfill site: annual distribution of selected parameters
compared with REHVs for freshwater aquatic ecosystem health ............................................................................ 60

Table of Tables
Table 1 Comparison of site health grades for freshwater aquatic ecosystem health sites between the last three
reporting periods. Results for 2014-15 also indicate whether the site health grade has improved or decline since
the 2013-14 reporting period ...................................................................................................................................... 2
Table 2 Site Health Grades and subsequent Waterway Health Grades for estuarine sites during the 2014-15
reporting period .......................................................................................................................................................... 2
Table 3.1 Freshwater and estuarine sites monitored for aquatic ecosystem health during 2014-15 ..................... 12
Table 3.2 Sites monitored to determine the effectiveness of catchment remediation initiatives during 2014-15. ... 14
Table 4.1 Bottle and preservative requirements for sampling parameters ............................................................. 15
Table 4.2 Laboratory parameters, reporting limits and test methods ....................................................................... 16
Table 4.3 Probe calibration QA/QC procedures ...................................................................................................... 17
Table 5.1 REHVs for physical-chemical stressors and faecal bacteria for freshwater sites (derived from long term
local reference data, ANZECC (2000) & NHMRC (2008)) ....................................................................................... 19
Table 5.2 Trigger values for physical-chemical, faecal bacteria and aquatic biota indicators for estuarine sites
(derived from ANZECC (2000) & NHMRC (2008)) .................................................................................................. 19
Table 5.3 Trigger values for stormwater harvesting, treatment and reuse for open space irrigation. ...................... 20
Table 5.4 Management response to real-time chlorophyll-a monitoring probes from Coad et al (2012) ................. 21
Table 6.1 Terminology for water quality data presentation ...................................................................................... 22
Table 6.2 Grading system used to categorise water quality for physical-chemical stressors .................................. 25
Table 7.1 Laboratory results for selected parameters of blank samples (N=75) .................................................... 29
Table 7.2 Correlation coefficients for selected parameters of duplicate samples (N=11, p<0.05) .......................... 29
Table 7.3 Comparison of Site Health Grades for phys-chem and microbial indicators at Reference sites for the
2012-13 to 2014-15 reporting periods ...................................................................................................................... 33
Table 7.4 Comparison of Site Health Grades for phys-chem and microbial indicators at industrial sites for the
2012-13 to 2014-15 reporting periods ...................................................................................................................... 36
Table 7.5 Comparison of Site Health Grades for phys-chem and microbial indicators at Rural sites for the 2012-13
to 2014-15 reporting periods .................................................................................................................................... 39
Table 7.6 Comparison of Site Health Grades for phys-chem and microbial indicators at Urban sites for the 2012-
13 to 2014-15 reporting periods ............................................................................................................................... 42
Table 7.7 Waterway Health Grades for estuarine sites for the 2014-15 reporting period ....................................... 46
Table 7.8 Occurrence of harmful algal species compared to the NSW Food Authority Phytoplankton Alert Levels
(PALs) ...................................................................................................................................................................... 50
Table 7.9 Comparison of Site Health Grades for phys-chem and microbial indicators at West Hornsby WTP sites
for the 2012-13 to 2014-15 reporting periods .......................................................................................................... 53
Table 7.10 Comparison of Site Health Grades for phys-chem and microbial indicators at Hornsby Heights WTP
sites for the 2012-13 to 2014-15 reporting periods .................................................................................................. 56

Table 7.11 Water quality of the treated water component of stormwater harvesting and reuse systems ................ 57
Table 7.12 Summary statistics for raw leachate at Arcadia Oval for the 2014-15 reporting period ........................ 59
Table 7.13 Summary statistics for treated leachate at Arcadia Oval for the 2014-15 reporting period ................... 59

Executive Summary
Hornsby Shire Council established a water quality
monitoring program in 1994 to assess, through time,
the impact of land use on waterways within the Shire
and to monitor the performance of Council’s
Catchments Remediation Rate (CRR) Program. The
monitoring data is used for prioritising catchment
remediation works, environmental assessments,
catchment modelling and education programs. This
data is available to the community and interested
authorities upon request and presented within
Annual Reports and on Council’s website
www.hornsby.nsw.gov.au/water.
During the 2014-15 reporting period water quality
was routinely monitored at 65 sites across the Shire
in both freshwater and estuarine locations to assess:
Long term ecosystem health in estuarine and
freshwater sites located below different landuse
types (urban, industrial, rural, bushland).
Activities directly influencing water quality (e.g.
wastewater treatment plants).
Effectiveness of disused landfill leachate
collection and treatment.
Effectiveness of stormwater harvesting and
reuse programs which reduce stormwater
impacts and improve water conservation.
Routine water quality monitoring for aquatic
ecosystem health showed the following results
(Table 1 and Table 2) between the 2013-14 and
2014-15 reporting periods:
an improvement in the physical-chemical site
health grades of two freshwater sites and one
estuarine site
a decline in the physical-chemical site health
grades of two freshwater sites and two estuarine
sites
an improvement in the microbial site health
grade of one freshwater site
a decline in the microbial site health grades of
fourteen freshwater sites and three estuarine
sites.
It is important to note that 2014-15 reporting period
received significantly more rain fall than the previous
year (~1400mm compared to ~680mm in 2013-14),
resulting in more pressure from catchment inputs.
The general trend for water quality in Hornsby Shire
(Figure 1 and Figure 2), as evident from monitoring
through time, is that better water quality results are
recorded where catchments remain primarily
undisturbed (reference sites), this is usually in
National Parks and Nature Reserves. Results
generally decline downstream of rural and urban
settlements, with most impacted water quality being
recorded downstream of industrial areas. Water
quality in estuarine areas is generally good due to
constant tidal flushing. The upper sections of
Marramarra and Berowra Creeks, where less tidal
flushing occurs, show signs of impacts from the
catchments.
Figure 1 Percentage of site health grades for physical-
chemical indicators within each catchment land use
Figure 2 Percentage of site health grades for microbial
indicators within each catchment land use
Stormwater harvesting and reuse systems have
been operating well since the implementation of a
preventative maintenance system in late 2013.
Further investigation into the amount of potable
water in the systems at Epping, North Epping and
Greenway Ovals is recommended. Levels of
bacteria are low (below trigger values) in all treated
stormwater being applied to playing ovals through
irrigation.
0%
20%
40%
60%
80%
100%
Estuarine Industrial Reference Rural Urban WTP
Physical-chemical Indicators
A Excellent B Good C Poor D Very Poor F Fail
0%
20%
40%
60%
80%
100%
Estuarine Industrial Reference Rural Urban WTP
Microbial Indicators
A Excellent B Good C Poor D Very Poor F Fail

Site No. Location Category 2012/2013 2013/2014 2014/2015
Phys-Chem Microbial Phys-Chem Microbial Phys-Chem Microbial
001 Berowra Ck WTP D A+ C A+ C C ↓
002 Tunks Ck Rural B A+ A A+ B ↓ A+
004 Berowra Ck Urban C A C A C C ↓
005 Berowra Ck Urban D A C A C D ↓
006 Georges Ck Urban C A C A C B ↓
008 Devlins Ck Urban D D C B C D ↓
010 Larool Ck Industrial D F D D C ↑ D
012 Hornsby Ck Industrial D F C F C F
013 Sams Ck Industrial D D C A C D ↓
023 Waitara Ck WTP D C C C C D ↓
036 Murray Anderson
Ck Reference A A+ A A+ A A+
037 Smugglers Ck Reference A A+ A A+ A A+
039 Joe Crafts Ck Urban A A+ B A+ B A
042 Colah Ck Rural C A C A C C ↓
043 Calna Ck WTP C A+ C A+ C A+
045 Berowra Ck WTP C B C B C C ↓
046 Trib Terrys Ck Urban D F C C C D ↓
049 Still Ck Rural C A B A+ C ↓ B ↓
052 Calna Ck WTP B D B A B D ↓
054 Laughtondale Ck Reference A A+ A A+ A A
062 Kimmerikong Ck Rural D B C A C C ↓
063 Colah Ck Rural C A+ B A B A
064 Trib. Colah Ck Urban D B C B C C ↓
080 Glenorie Ck Rural D F D F C ↑ D ↑
114 Muogomarra Ck Reference B A+ A A+ A A+
123 Peats Crater Ck Reference B A B A+ B A
147 Trib. Byles Ck Reference A A+ A A+ A A
149 Duckpond Ridge
Ck Reference B A+ B A+ B A+
164 Djarra Crossing Reference A A A A+ A A
Table 1 Comparison of site health grades for freshwater aquatic ecosystem health sites between the last three reporting periods.
Results for 2014-15 also indicate whether the site health grade has improved or decline since the 2013-14 reporting period
Site No. Location Phys-Chem Microbial Aquatic Biota Waterway Health Grade
038 Sandbrook Inlet B A C B
048 Marramarra Ck C B C C
055 Brooklyn Baths B A A A
060 Berowra Ferry B B C B
061 Calabash Bay B A D B
100 Crosslands
Reserve C C A B
103 Milsons Passage B A A A
108 Bradleys Beach, Dangar Island
B A A A
150 Gunya Point A A A A
151 Bar Island B A C B
152 Courangra Point B A B B
153 Laughtondale C A C B
174 Mullet Ck B A B B
Table 2 Site Health Grades and subsequent Waterway Health Grades for estuarine sites during the 2014-15 reporting period

1. Hornsby Shire and Catchments
1.1 Hornsby Shire Region
The Hornsby Shire is approximately 25 kilometres
north-west of Sydney covering an area of 510
square kilometres. Nearly two-thirds of Hornsby
Shire is National Park and bushland. The Shire
includes land from Eastwood in the south to
Wisemans Ferry in the north and Brooklyn to the
east (HSC 2013).
The traditional owners of the Shire were the
Aboriginal people of the Darug and Guringai
language groups. European settlement in the Shire
dates from 1794 when the first land grants were
made along the Hawkesbury River, with land
primarily used for farming (HSC 2013).
Hornsby Shire’s main urban and rural developments
are located in the southern half of the Shire on the
plateau areas. At present approximately 10% of the
Shire is zoned and used for urban development,
15% for rural purposes, 5% for open space and 70%
is Environmental Protection or National Park (Figure
1.1).
Figure 1.1 Hornsby Shire Council Zoning Map

4 HORNSBY SHIRE COUNCIL 2014-2015 WATER QUALITY MONITORING PROGRAM ANNUAL REPORT
1.2 Major Water Catchments
The four major water catchments within Hornsby
Shire include Berowra Creek, Cowan Creek, the
Hawkesbury River and Lane Cove River (Figure 1.2).
The lower Hawkesbury River (estuary) connects with
the ocean at Broken Bay and is the receiving water
for Berowra Creek and Cowan Creek catchments.
Water from the Lane Cove River catchment is
received in Sydney Harbour.
1.2.1 Berowra Creek Catchment
The Berowra Creek catchment is bounded on the
south by Castle Hill Road, to the west by Old
Northern Road, to the north by Canoelands Ridge
and to the east by the Pacific Highway. All of the
Berowra Creek Catchment is within the Hornsby
Shire Local Government Area.
The catchment contains significant bushland areas,
including Marramarra National Park, Muogamarra
Nature Reserve and Berowra Valley National Park.
Land uses in this catchment include bushland, rural,
developed and developing urban, light industrial and
commercial. The main impacts on water quality in
Berowra Creek arise from the discharge of tertiary
treated sewage from the West Hornsby and Hornsby
Heights Wastewater Treatment Plants (WTPs) into
Waitara and Calna Creeks, and from stormwater
run-off from the developed urban and commercial
areas located in the south eastern parts of the Shire.
The rural and rural-residential areas in the southern
end of the Shire flow to upper Berowra Creek,
Tunks, Still and Calabash Creeks. Along the south-
western edge similar areas flow to Colah and
Fiddletown Creeks then to Marramarra Creek which
flows to lower Berowra Creek, close to the
confluence with the Hawkesbury River.
1.2.2 Cowan Creek Catchment
Within the Cowan Creek catchment there are four
Local Government Areas. The western boundary of
Cowan Creek catchment, defined by the Pacific
Highway, lies within Hornsby Shire. Cockle Creek
and Cowan Creek form part of the Shire boundary.
Land uses in the southern part of this area include
extensive light industrial areas, large commercial
shopping centres and developed urban areas. Ku-
ring-gai Chase National Park also covers a large part
of the catchment.
1.2.3 Lane Cove River
Seven Local Government authorities have
jurisdiction over the Lane Cove River catchment.
Only the upper reaches of the Lane Cove River
catchment are within Hornsby Shire; Devlins Creek,
upper Lane Cover River and Terrys Creek. This
catchment is dominated by developed urban land
uses and some commercial areas as well as
bushland areas including the upper parts of Lane
Cove National Park. This is Hornsby Shire’s only
catchment area that flows to Sydney Harbour.
1.2.4 Hawkesbury River Catchment
The Hawkesbury River catchment within Hornsby
Shire is divided into two areas which include the
Wiseman’s Ferry and Maroota region as well as the
Brooklyn area. These areas flow directly to the
Hawkesbury River. Land uses in these areas
include small farming ventures, market gardening,
residential development, marinas, boat ramps,
aquaculture and fishing industries (commercial and
recreational). A wastewater treatment plant that
services Brooklyn, Dangar Island, Mooney Mooney
and Cheero Point discharges tertiary treated effluent
beneath Peats Ferry Bridge on the Old Pacific
Highway, into an area of strong tidal current.

5 HORNSBY SHIRE COUNCIL 2014-2015 WATER QUALITY MONITORING PROGRAM ANNUAL REPORT
Figure 1.2 Hornsby Shire Council Major Catchments

6 HORNSBY SHIRE COUNCIL 2014-2015 WATER QUALITY MONITORING PROGRAM ANNUAL REPORT
2. Water Quality Monitoring Program
2.1 Water Quality Management
2.1.1 National Level
The National Water Quality Management Strategy
(NWQMS) outlines a national approach to improving
water quality in Australian and New Zealand
waterways. It was originally endorsed by two
Ministerial Councils; the former Agriculture and
Resources Management Council of Australia and
New Zealand (ARMCANZ) and the former Australian
and New Zealand Environment and Conservation
Council (ANZECC). Since 1992 the NWQMS has
been developed by the Australian and New Zealand
Governments in cooperation with state and territory
governments. Ongoing development is currently
overseen by the Standing Council on Environment
and Water (SCEW) and the National Health and
Medical Research Council (NHMRC). The NWQMS
aims to protect the nation's water resources, by
improving water quality while supporting the
businesses, industry, environment and communities
that depend on water for their continued
development (Dept of Environment 2015).
Australia has a national framework for assessing
water quality which is explained in the ANZECC
2000 Guidelines. These guidelines outline an
agreed framework to assess water quality in terms of
whether the water is suitable for a range of
environmental values, including human uses. The
Water Quality Objectives identify environmental
values for NSW waters and the ANZECC 2000
Guidelines provide the technical guidance to assess
the water quality needed to protect those values
(NSW DECCW 2006).
2.1.2 Regional Level
NSW has a set of Water Quality Objectives that are
the agreed environmental values and long-term
goals for NSW surface waters (NSW DECCW 2006).
They describe:
Community values and uses for our rivers,
creeks, estuaries and lakes (i.e. healthy
aquatic life, water suitable for recreational
activities like swimming and boating, and
drinking water).
A range of water quality indicators to assess
whether the current condition of our
waterways supports those values and uses.
NSW water quality objectives have been agreed for
fresh, estuarine and marine waters. These
objectives are consistent with the agreed national
framework for assessing water quality set out in the
ANZECC 2000 Guidelines (NSW DECCW 2006).
2.1.3 Local Level
The local environment within the Hornsby Shire has
substantial and continual pressure to accommodate
a rapidly growing population. Over the next 10 years
it is forecast over 4270 new private dwellings will be
built, and over 2380 new jobs created (HSC 2013).
The importance of understanding the condition of our
local environment is critical as a healthy environment
supports our health and wellbeing and thus our
quality of life (HSC 2012). Water quality is one of
the prime indicators of the condition of our local
environment. The continuing collection and
interpretation of water quality through time is
essential to understand both climate variability and
the impact of development on the Shire’s natural
environment (HSC 2012).
Hornsby Council has a number of programs to
protect and enhance the local waterways. These
include:
Catchment Remediation Rate Program
Hawkesbury Estuary Program
Sustainable Total Water Cycle Management
Water Quality Monitoring Program.
This report will detail the results of Council’s water
quality monitoring program for the 2014-2015 period.
Other Annual Reports prepared by the Natural
Resources Branch can be accessed via the Hornsby
Council website www.hornsby.nsw.gov.au.
2.2 History of the Program
Hornsby Shire Councils water quality monitoring
program began soon after the Statement of Joint
Intent (SoJI) was signed in 1994 (Appendix A). This
was an agreement between the NSW Department of
Planning, Environmental Protection Authority,
Hawkesbury-Nepean Catchment Management Trust,
Hornsby Shire Council and the Water Board
established in response to environmental issues
which included, the regular occurrence of algal
blooms in the estuarine section of Berowra Creek,
increasing pressures of urban development and

7 HORNSBY SHIRE COUNCIL 2014-2015 WATER QUALITY MONITORING PROGRAM ANNUAL REPORT
sewage discharge issues, tighter pollution
regulations coming into force, the publication of
Australian environmental water quality guidelines
(ANZECC, 1992 (updated 2000)), and the
recognition of the detrimental impacts of catchment
activities on water quality.
The monitoring program was initially designed to
assess, through time, the impact of land use on
waterways and to monitor the performance of
Council’s Catchment Remediation Rate (CRR)
Program. Sites have progressively been added and
the program expanded to include:
aquatic ecosystem health monitoring (fresh
and estuarine waters),
monitoring and assessment of CRR
initiatives,
recreational water quality monitoring,
monitoring to detect harmful estuarine algal
blooms,
biological monitoring (macroinvertebrates
and diatoms),
monitoring of discrete events (e.g. Hornsby
Quarry dewatering program).
2.3 Program Objectives
Objectives of the Water Quality Monitoring Program
include:
Trends through time - undertake long term
monitoring of water catchments within
Hornsby Shire to asses trends in water
quality from both point and diffuse pollution
sources, with an emphasis on
understanding causes and effects of algal
blooms in the Berowra Creek estuary.
Environmental condition assessment -
compare the observed water quality data
with undisturbed catchments, and with
Regional Environmental Health Values
(REHVs) developed using local long term
monitoring data in conjunction with
nationally accepted guidelines for fresh and
marine waters; specifically for the water
values associated with the protection of
aquatic ecosystems, with recreational water
uses, and for stormwater reuse projects.
Further, to use biological monitoring at
representative sites to complement the
water quality program.
Asset management - determine the
effectiveness of Catchment Remediation
assets in removing pollutants from the
waterways.
Water conservation - support water savings
programs, including stormwater harvesting
and reuse projects at sports ovals.
Improve catchment knowledge - use water
quality data to calibrate and support
catchment/pollutant modelling and assist
with environmental education programs.
2.4 Program Review
To ensure that Council’s long term Water Quality
Monitoring Program continues to deliver appropriate
and reliable data to achieve program objectives a
systematic review of all program components
commenced in 2014.
At the time of writing this report a Review Summary
document and Program Matrix was being developed
to provide a detailed inventory of all current program
components with recommendations for specific
review actions. During 2015-16 a review team will
work through the recommendations and actions to
move towards an optimal program design. It is
expected that implementation of the reviewed
program will commence by July 2016.
The structure of the review has been based on a
combination of approaches to developing water
quality monitoring programs with key documents
being the Australian Guidelines for Water Quality
Monitoring and Reporting (ANZECC 2000), Design
of Networks for Monitoring Water Quality (Sander et
al 1983) and the New South Wales Natural
Resources Monitoring, Evaluation and Reporting
Strategy 2010-2015 (NSW DECCW 2010).

8 HORNSBY SHIRE COUNCIL 2014-2015 WATER QUALITY MONITORING PROGRAM ANNUAL REPORT
3. Water Quality Sites
Representative sampling sites have been selected
across the Shire to meet the objectives of the water
quality monitoring program. A site is a geographic
location where a hand held probe can be used to
measure the physical conditions of a water body
and/or where a sample of water can be collected for
analysis of the water body’s chemical, microbial and
biological characteristics.
During 2014-15 water quality was routinely
monitored at 65 sites (Figure 3.2) across the Shire to
assess:
Long term ecosystem health in estuarine
and freshwater sites located below different
landuse types (urban, industrial, rural,
bushland).
Activities directly influencing water quality
(e.g. wastewater treatment plants).
Effectiveness of disused landfill leachate
collection and treatment
Effectiveness of stormwater harvesting and
treatment processes which reduce
stormwater impacts and improve water
conservation.
Water quality was assessed at a number of
additional sites throughout the year in response to
individual events. These samples were not part of
the routine sampling schedule and will not be
presented in this report.
Appendix G provides details of all water quality
monitoring sites including inactive/historic sites,
active/current sites and sites established for short
term monitoring of discrete events.
3.1 Aquatic Ecosystem Health
Freshwater sites monitored for long term aquatic
ecosystem health were selected with consideration
given to the reliability of stream flow throughout the
year, site accessibility and the ability to monitor
stormwater flows. These sites are representative of
different catchment landuses within the Shire (i.e.
primarily undisturbed/reference condition, urban,
rural and industrial). Table 3.1 provides summary
information on site classification or primary land use
and the location of sites monitored for aquatic
ecosystem health. Detailed information on each site
can be found in Appendix B.
3.1.1 Reference Sites
Reference sites represent the highest water quality
against which water quality in other less pristine
locations can be compared. Data from reference
sites show natural variation of water parameters in
creeks with minimal human impact, thus providing
‘control’ or ‘reference’ data. These creeks with
primarily undisturbed catchments reflect the water
quality that may have existed before Hornsby Shire
was developed.
Ideally reference sites should have similar
geography, geology, soils and vegetation to the
creeks to which they are being compared. However,
development within the Shire historically began in
areas with good quality soils suitable for farming and
on ridge tops with shale derived soils. Subsequent
urban development concentrated around the ridge
top areas. As a result there is now a paucity of
unimpacted creeks draining such types of soils and
geology.
Council monitors two long-term reference sites (036
and 037) that are within nearby National Parks and
dominated by large areas of exposed sandstone and
poorer soils. Six potential reference sites were
introduced in 2011 (054, 114, 123, 147, 149, 164) to
obtain additional data to assess how representative
sites 036 and 037 are as reference sites (Wright,
2011). As part of the water quality monitoring
program review these additional potential reference
sites will be assessed and the most suitable sites
retained as long term reference sites to meet the
objectives of the water quality monitoring program.
For the purpose of this report, only the current long
term reference sites (036 and 037) will be used as
comparative reference sites in the data analysis.
These are also the sites that were used in the
development of Council’s Regional Environmental
Health Values (REHVs).
3.1.2 Industrial, Rural and Urban Sites
The major industrial areas in Hornsby Shire are
located around Sefton Rd Thornleigh, Leighton
Place Hornsby and Beaumont Road Mount Kuring-
gai. These industrial areas flow to Larool Creek (site
010), Hornsby Creek (site 012) and Sams Creek
(site 013) respectively (Table 3.1).
Rural areas are classified as those areas with a
majority of their catchment being zoned rural or with
townships which primarily rely on onsite sewage

9 HORNSBY SHIRE COUNCIL 2014-2015 WATER QUALITY MONITORING PROGRAM ANNUAL REPORT
management systems to dispose of their effluent.
Current rural sites are 002, 042, 049, 062, 063, 064
and 080 (Table 3.1), generally located in the north
and western parts of the Shire. The townships of
Galston, Glenorie and Cowan have recently had
sewer infrastructure installed by Sydney Water and it
is expected that the impacts from onsite systems in
these areas will lessen into the future as more
properties become connected.
Urban catchments consist of residential and light
commercial areas throughout the Shire. They are
characterised by reticulated water and sewerage
systems, a large percentage of impervious surfaces
(e.g. roads, driveways, and roofs) and complex
stormwater collection infrastructure, which often
discharges directly into local streams. Current urban
sites include 004, 005, 006, 008, 039 and 046 (Table
3.1). It is likley that a recommendation from the
water quality monitoring program review will be to
establish an additional category of landuse to
distinguish between medium density and high
density urban landuse to account for the substantial
amount of multistoried residential developments
currently being built.
3.1.3 Estuarine Sites
Monitoring of water quality at estuarine sites in the
Hawkesbury River is undertaken to assess the
environmental health of the estuary, which is the
receiving water for the majority of the Shire as well
as upstream catchments outside of the Hornsby
Shire Local Government Area. Current estuarine
sites include 038, 048, 055, 060, 061, 100, 103, 108,
150, 151, 152, 153 and 174 (Table 3.1). These sites
are distributed across the salinity gradient of the
estuary from high salinity sea water (25-35ppt) near
the mouth of the Hawkesbury River to brackish (10-
25ppt) and mostly fresh water (<10ppt) further up the
estuary and in tributaries. In addition to catchment
inputs coming down the river, water quality in
estuarine sites relies significantly on the amount of
tidal flushing a site receives from the ocean.
Brooklyn Baths (site 055), Crosslands Reserve (site
100) and Bradleys Beach, Dangar Island (site 108)
are popular swimming locations. In addition to
environmental health, water quality data from these
sites also provides information regarding public
health and the suitability of the sites for recreational
activities. Long term monitoring data has been used
to develop an online application providing daily
updates on the suitability of swimming at different
locations in the Hawkesbury estuary
www.hornsby.nsw.gov.au/waterquality.
Council also manages a number of water quality
monitoring buoys (Figure 3.1) remotely deployed to
monitor temperature, chlorophyll-a, salinity and
turbidity levels within the estuary. Chlorophyll-a is
used as an indicator for algal growth and Council
responds if levels are persistently elevated
(~30μg/L), as this may indicate a problematic micro-
algal bloom. Further details of this monitoring
program are available at
www.hornsby.nsw.gov.au/waterquality and within the
Estuary Management Annual Reports.
Figure 3.1 Remote water quality monitoring buoy at Courangra Point on the Hawkesbury River
10 HORNSBY SHIRE COUNCIL 2014-2015 WATER QUALITY MONITORING PROGRAM ANNUAL REPORT
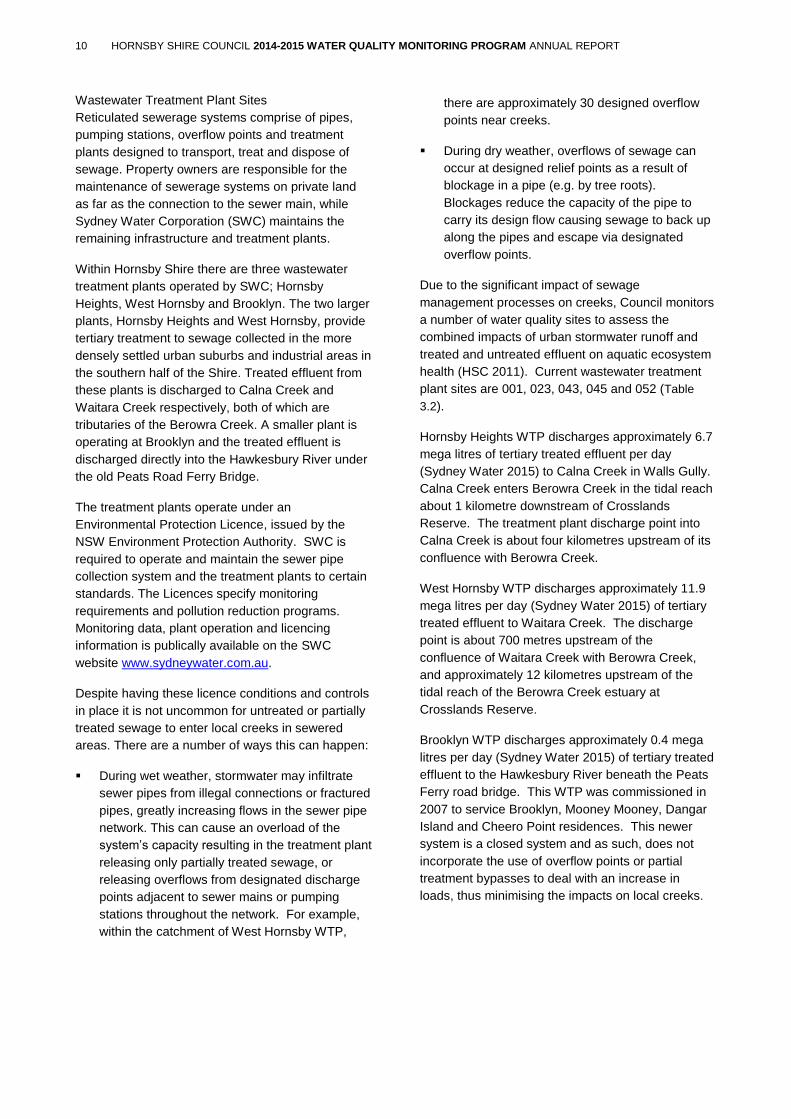
Wastewater Treatment Plant Sites
Reticulated sewerage systems comprise of pipes,
pumping stations, overflow points and treatment
plants designed to transport, treat and dispose of
sewage. Property owners are responsible for the
maintenance of sewerage systems on private land
as far as the connection to the sewer main, while
Sydney Water Corporation (SWC) maintains the
remaining infrastructure and treatment plants.
Within Hornsby Shire there are three wastewater
treatment plants operated by SWC; Hornsby
Heights, West Hornsby and Brooklyn. The two larger
plants, Hornsby Heights and West Hornsby, provide
tertiary treatment to sewage collected in the more
densely settled urban suburbs and industrial areas in
the southern half of the Shire. Treated effluent from
these plants is discharged to Calna Creek and
Waitara Creek respectively, both of which are
tributaries of the Berowra Creek. A smaller plant is
operating at Brooklyn and the treated effluent is
discharged directly into the Hawkesbury River under
the old Peats Road Ferry Bridge.
The treatment plants operate under an
Environmental Protection Licence, issued by the
NSW Environment Protection Authority. SWC is
required to operate and maintain the sewer pipe
collection system and the treatment plants to certain
standards. The Licences specify monitoring
requirements and pollution reduction programs.
Monitoring data, plant operation and licencing
information is publically available on the SWC
website www.sydneywater.com.au.
Despite having these licence conditions and controls
in place it is not uncommon for untreated or partially
treated sewage to enter local creeks in sewered
areas. There are a number of ways this can happen:
During wet weather, stormwater may infiltrate
sewer pipes from illegal connections or fractured
pipes, greatly increasing flows in the sewer pipe
network. This can cause an overload of the
system’s capacity resulting in the treatment plant
releasing only partially treated sewage, or
releasing overflows from designated discharge
points adjacent to sewer mains or pumping
stations throughout the network. For example,
within the catchment of West Hornsby WTP,
there are approximately 30 designed overflow
points near creeks.
During dry weather, overflows of sewage can
occur at designed relief points as a result of
blockage in a pipe (e.g. by tree roots).
Blockages reduce the capacity of the pipe to
carry its design flow causing sewage to back up
along the pipes and escape via designated
overflow points.
Due to the significant impact of sewage
management processes on creeks, Council monitors
a number of water quality sites to assess the
combined impacts of urban stormwater runoff and
treated and untreated effluent on aquatic ecosystem
health (HSC 2011). Current wastewater treatment
plant sites are 001, 023, 043, 045 and 052 (Table
3.2).
Hornsby Heights WTP discharges approximately 6.7
mega litres of tertiary treated effluent per day
(Sydney Water 2015) to Calna Creek in Walls Gully.
Calna Creek enters Berowra Creek in the tidal reach
about 1 kilometre downstream of Crosslands
Reserve. The treatment plant discharge point into
Calna Creek is about four kilometres upstream of its
confluence with Berowra Creek.
West Hornsby WTP discharges approximately 11.9
mega litres per day (Sydney Water 2015) of tertiary
treated effluent to Waitara Creek. The discharge
point is about 700 metres upstream of the
confluence of Waitara Creek with Berowra Creek,
and approximately 12 kilometres upstream of the
tidal reach of the Berowra Creek estuary at
Crosslands Reserve.
Brooklyn WTP discharges approximately 0.4 mega
litres per day (Sydney Water 2015) of tertiary treated
effluent to the Hawkesbury River beneath the Peats
Ferry road bridge. This WTP was commissioned in
2007 to service Brooklyn, Mooney Mooney, Dangar
Island and Cheero Point residences. This newer
system is a closed system and as such, does not
incorporate the use of overflow points or partial
treatment bypasses to deal with an increase in
loads, thus minimising the impacts on local creeks.

11 HORNSBY SHIRE COUNCIL 2014-2015 WATER QUALITY MONITORING PROGRAM ANNUAL REPORT
Figure 3.2 Active water quality monitoring sites for 2014-15

12 HORNSBY SHIRE COUNCIL 2014-2015 WATER QUALITY MONITORING PROGRAM ANNUAL REPORT
Site Classification/Landuse Creek Location
001 Wastewater Treatment Plant Berowra Creek Downstream West Hornsby WTP
002 Rural Tunks Creek Galston Gorge
004 Urban Berowra Creek Benowie Walking Trail Westleigh
005 Urban Pyes Creek Kristine Pl Cherrybrook
006 Urban Georges Creek Fallon Rd Cherrybrook
008 Urban Devlins Creek Sutherland Rd Cheltenham
010 Industrial Larool Creek Larool Cres Thornleigh
012 Industrial Hornsby Creek Leighton Place Hornsby
013 Industrial Sams Creek Hamley Rd Mt Kuring-gai
023 Wastewater Treatment Plant Waitara Creek Upstream West Hornsby WTP
036 Reference Murray Anderson Creek Ku-ring-gai Chase National Park
037 Reference Smugglers Creek Marramarra National Park
038 Estuarine Sandbrook Inlet Brooklyn, Hawkesbury River
039 Urban Joe Crafts Creek Tributary of Berowra Creek
042 Rural Colah Creek Wylds Rd Glenorie
043 Wastewater Treatment Plant Calna Creek Downstream Hornsby Heights WTP
045 Wastewater Treatment Plant Berowra Creek Downstream West Hornsby WTP
046 Urban Unamed, tributary of Terrys Creek Somerset St North Epping
048 Estuarine Marramarra Creek Marramarra National Park
049 Rural Still Creek Mansfield Rd Arcadia
052 Wastewater Treatment Plant Calna Creek Upstream Hornsby Heights WTP
054 Reference Laughtondale Creek Laughtondale Gully Rd Marramarra National Park
055 Estuarine Hawkesbury River Brooklyn Baths
060 Estuarine Berowra Creek Berowra Ferry Crossing
061 Estuarine Berowra Creek Calabash Point
062 Rural Unamed, tributary of Kimmeriking Creek Alberta Ave Cowan
063 Rural Colah Creek Ben Bullen Firetrail Glenorie
064 Rural Unamed, tributary of Colah Creek Sallaway Rd Galston
080 Rural Glenorie Creek Tekapo Ave Glenorie
100 Estuarine Berowra Creek Crosslands Reserve Hornsby Heights
103 Estuarine Hawkesbury River Milsons Passage
108 Estuarine Hawkesbury River Bradleys Beach, Dangar Island
114 Reference Muogamarra Creek Muogamarra Nature Reserve
123 Reference Unamed Creek in Peats Crater Muogamarra Nature Reserve
147 Reference Unamed Creek, tributary Byles Creek Day Rd Cheltenham
149 Reference Unamed Creek, Marramarra National Park
Duckpond Ridge Firetrail Marramarra National Park
150 Estuarine Hawkesbury River Gunyah Point
151 Estuarine Hawkesbury River Mouth Marramarra Ck
152 Estuarine Hawkesbury River Courangra point
153 Estuarine Hawkesbury River Laughtondale
164 Reference Djarra Crossing Muogamarra Nature Reserve
174 Estuarine Mullet Creek Mouth of Mullet Creek
Table 3.1 Freshwater and estuarine sites monitored for aquatic ecosystem health during 2014-15
13 HORNSBY SHIRE COUNCIL 2014-2015 WATER QUALITY MONITORING PROGRAM ANNUAL REPORT
3.2 Catchment Remediation Initiatives
3.2.1 Stormwater Harvesting and Reuse
In recent years, the need to conserve water and to
reduce the impacts of urban stormwater on streams
has led to an increase in the harvesting of
stormwater for reuse. Stormwater harvesting
involves collecting stormwater runoff from parks,
paved areas and drains in a selected catchment.
The collected water is then treated onsite to a
standard that is fit for purpose (e.g. irrigation) and
reused locally.
A number of stormwater harvesting and reuse
schemes have been constructed in Hornsby Shire
through the CRR Program, with the majority of them
providing irrigation for sports ovals. The catchment
areas for harvesting are selected after a thorough
investigation to ensure minimal risk to the
downstream creeks or to public health (HSC 2011).
Council currently manages eight (8) stormwater
harvesting and reuse facilities located at Berowra
Oval, Foxglove Oval, Greenway Park, Epping Oval,
North Epping Oval, Somerville Oval, Thornleigh Oval
and Council’s Community Nursery (Table 3.2).
Further information on Council’s water conservation
initiatives can be found at
www.hornsby.nsw.gov.au/water.
3.2.2 Stormwater Quality Improvement
Council manages over 430 stormwater quality
improvement devices (SQIDs) across the Shire. In
2014 a vegetated cell was installed in Larool Creek
to address the issue of poor water quality identified
through long term monitoring of the creek (Figure
3.3). The original site (010) is now a representative
upstream site and an additional site (175) was
established downstream to assess the effectiveness
of the device. It is expected that more time and
resources will become available for the assessment
devices following the water quality monitoring
program review. Further information on stormwater
quality improvement devices and the CRR program
is available at www.hornsby.nsw.gov.au/crr and in
the CRR Annual Reports.
3.2.3 Disused Landfill Remediation
Council manages three (3) disused landfill sites at
Arcadia, Mount Colah (Foxglove Oval) and
Wisemans Ferry. These sites are all
decommissioned and have been remediated in
various ways. Leachate from Arcadia landfill is
captured, treated and discharged to a local creek
(Sites 018, 094). Leachate from Wisemans Ferry is
captured; there is no discharge from this site (site
112). Leachate from Foxglove Oval, Mount Colah is
captured, treated and reused for irrigating the
playing field (Sites 077, 095, 096, 132).
Figure 3.3 Vegetated stormwater quality treatment cell in Larool Creek and the upstream monitoring point

14 HORNSBY SHIRE COUNCIL 2014-2015 WATER QUALITY MONITORING PROGRAM ANNUAL REPORT
Site Classification Location Description
010 Stormwater Quality Improvement Larool Creek Upstream device / Industrial
018 Landfill Remediation Arcadia Raw leachate
077 Landfill Remediation Foxglove Oval Downstream receiving water
094 Landfill Remediation Arcadia Treated leachate
095 Landfill Remediation Foxglove Oval Raw leachate
096/178 Landfill Remediation Foxglove Oval Partially treated leachate
098 Harvesting & reuse Community Nursery Treated Stormwater
112 Landfill Remediation Wisemans Ferry Raw leachate
120 Harvesting & reuse Greenway Park Raw stormwater
121 Harvesting & reuse Greenway Park Treated stormwater
128 Harvesting & reuse Berowra Oval Raw stormwater
131 Harvesting & reuse Berowra Oval Treated stormwater
132 Landfill Remediation Foxglove Oval Treated leachate
134 Harvesting & reuse Epping Oval Raw stormwater
137 Harvesting & reuse Epping Oval Treated stormwater
138 Harvesting & reuse North Epping Oval Raw stormwater
141 Harvesting & reuse North Epping Oval Treated stormwater
142 Harvesting & reuse Somerville Oval Raw stormwater
145 Harvesting & reuse Somerville Oval Treated stormwater
173 Harvesting and reuse Dawson Ave, Thornleigh Treated stormwater
175 Stormwater Quality Improvement Larool Creek Downstream device
180 Harvesting & reuse Community Nursery Raw Stormwater
Table 3.2 Sites monitored to determine the effectiveness of catchment remediation initiatives during 2014-15.
15 HORNSBY SHIRE COUNCIL 2014-2015 WATER QUALITY MONITORING PROGRAM ANNUAL REPORT
4. Sampling and Testing Procedures
4.1 Routine Monitoring
The water quality monitoring program involves
systematic sampling to a predetermined, usually
monthly, schedule over the year. Sampling is
carried out during daylight hours (8am to 3pm) on
weekdays, through all seasons and in both wet and
dry periods. Industrial sites, which have historically
been the most impacted, are monitored fortnightly.
Optimal sampling frequencies of all sites will be
assessed as part of the water quality monitoring
program review.
4.1.1 Field Measurements
Physical water quality parameters are measured in-
situ using a multi-sensor water quality probe
(YeokalTM
615 Sonde) include:
Dissolved Oxygen (DO% sat and DO mg/L)
Electrical Conductivity (EC ms/cm and EC
µs/cm)
pH
Salinity (ppt)
Temperature (ºC)
Turbidity (NTU)
At each water testing site observations are recorded
on weather conditions, rainfall, tide status, the
occurrence of nuisance organisms, oily films,
frothing and odours, stream flow, water clarity, water
colour and any other notable site details. These
observations and portable probe measurements are
recorded in the field on a mobile device and
downloaded each afternoon into Council’s database.
4.1.2 Laboratory Analysis
Freshwater water samples are collected and sent for
laboratory analysis of:
Bacteria (Faecal coliforms (CFU/100mL)
and Enterococci (CFU/100mL)
Nutrients (total nitrogen, oxidised nitrogen,
ammonium nitrogen and total phosphorus)
Suspended Solids (mg/L)
In addition, all freshwater sites are sampled and
analysed quarterly for:
Alkalinity (Bicarbonate mg CaCO3/L)
Major Cations and Anions
Trace Metals
Some sites such as stormwater harvesting devices
and sites receiving runoff from industrialised
catchments may also be analysed for additional
parameters including:
Biochemical Oxygen Demand (CBOD5)
Sodium Absorption Ratio (SAR)
Fluoride (mg/L)
Estuarine water samples are collected and sent for
laboratory analysis of
Chlorophyll-a (µg/L)
Bacteria (Faecal coliforms (CFU/100mL)
and Enterococci (CFU/100mL)
Nutrients (total nitrogen, oxidised nitrogen,
ammonium nitrogen, total phosphorus and
soluble reactive phosphorus SRP (mg/L))
Suspended Solids (mg/L)
Appropriate sample bottles are prepared and
provided by the contract laboratories (Table 4.1). At
freshwater sites the sampling depth is 5 -10cm
below the water surface, and at saltwater sites
approximately 50cm below the surface. Immediately
after collection all the water bottles are placed in an
esky with ice bricks.
During the 2014-15 period chemical and microbial
analyses were carried out by Sydney Water
Monitoring Services in accordance with the
parameters, detection limits and testing methods
described in Table 4.2.
Analyte Bottle Preservative
Microbial (Faecal coliforms & Enterococci) 250ml PET Thiosulphate
Suspended Solids 1L HDPE No preservative
Chlorophyll-a 1.25L PET No preservative
Trace metals, 250ml HDPE No preservative
Nutrients (Tp, TN, NH3-N, NOx-N) 200ml PET No preservative
Major cations & anions 200ml PET No preservative
Bicarbonate/alkalinity 500ml PET No preservative
Table 4.1 Bottle and preservative requirements for sampling parameters

16 HORNSBY SHIRE COUNCIL 2014-2015 WATER QUALITY MONITORING PROGRAM ANNUAL REPORT
Analyte Detection Limit Method Reference (APHA 2005)
General
Suspended solids <2mg/L APHA 2540-D
BOD5 <2mg/L APHA 5210-B
Bicarbonate/Alkalinity <5mg CaCO3/L APHA 2320-B
Nutrients
Oxidised Nitrogen NOX-N <0.01mg/L APHA 4500-NO3 I FIA
Ammonia Nitrogen NH3-N <0.01mg/L APHA 4500-NH3 H FIA
Total Nitrogen <0.05mg/L APHA 4500-P J FIA
Total Phosphorus <0.002mg/L APHA 4500-P J / NO3 FIA
Soluble Reactive Phosphorus <0.002mg/L PHA 4500-P
Micro-biological
Faecal coliforms <1 CFU/100ml AS 4276-7
Enterococci <1 CFU/100ml AS 4276.9 (2007)
Chlorophyll –a <1 g/L APHA 10200-H
Metals (freshwater only)
Trace metals various various methods
Cations various various methods
Anions various various methods
Organic
PAH <0.5 g/L APHA 6440-B
Oil and grease <3 mg/L APHA 5520 various
Table 4.2 Laboratory parameters, reporting limits and test methods
4.1.3 Phytoplankton Identification
Identification of phytoplankton (>5µm) from estuarine
sites involves sampling from surface waters using a
1m long plastic bailer tube and transferring the
sample to a 500mL PET bottle containing Lugols
preserving solution. In addition, a concentrated algal
sample is collected using a 30 micron mesh net. The
net is towed behind the boat for approximately 5
minutes at slow speed. The contents of the net are
washed into a 200mL PET bottle containing Lugols
solution (Figure 4.1). These samples are stored in a
cool dark location then sealed in a plastic bag,
wrapped in bubble wrap and sent by overnight
express post to Microalgal Services laboratory in
Victoria for algal identification and enumeration.
Figure 4.1 Collecting and preserving an integrated (profiling tube) and a concentrated (net tow) sample for phytoplankton analysis

17 HORNSBY SHIRE COUNCIL 2014-2015 WATER QUALITY MONITORING PROGRAM ANNUAL REPORT
4.2 Quality Assurance / Quality Control
4.2.1 Probe Calibration
To ensure accurate in-situ measurements, the
YeokalTM
probe sensors are calibrated the morning
of each sampling run using commercially available
standard solutions and check tests (Table 4.3).
Calibration is checked again in the afternoon
following each sampling run. Correction factors are
applied to probe data if sensor calibration drifted by
more than accepted daily variation (Table 4.3).
At each sample site the date, time, site details, visual
observations and probe readings are typed into a
mobile device, and later downloaded into Council’s
database. In the field, the probe readings are stored
in the probe memory, downloaded in the afternoon
and stored as ‘back-up’ data.
4.2.2 Sample Handling
The contract laboratory supplies new bottles for
sampling prepared with preservatives where
required. The date and unique sample identification
number is printed on adhesive labels prior to
sampling. After the water samples are taken the
sample bottles are immediately placed in eskies with
ice and freezer blocks. After returning from the field
the bottles are repacked on ice, a ‘Chain of Custody’
form is completed and attached to the esky. The
samples are then couriered to the laboratory by 5pm
the same day.
4.2.3 Duplicate and Field Blank Samples
A duplicate field sample is taken at one site each
month. This effectively provides two samples of the
same water which are labelled differently. The
results from the laboratory analysis provide an
indication of combined variability of water quality at a
site and variability of the laboratory testing
procedures.
Further, a field blank is prepared each month and
sent to the laboratory for analysis. Field blanks are
sample bottles filled with high purity deionised water
before the sampling run, labelled, packaged and
then sent to the laboratory with the other water
samples for analysis of all parameters. The results
indicate potential contamination from either the
sample bottles or transportation and handling. Field
blanks can also provide a check of a laboratories
handling, analysis and detection limits.
4.2.4 Laboratory Procedures
The contract laboratory has a comprehensive quality
control program which is a requirement to retain
national accreditation (NATA certification). With each
daily batch of samples for each test parameter the
laboratory includes extra Quality Assurance / Quality
Control (QA/QC) samples including replicate tests,
lab blanks, spiked samples and lab check samples,
which must all pass in-house QC standards before
results are released. Final reports provided to
Council include QA/QC test results.
Probe Tests Low Value Calibration
High Value Calibration
Check Solution, Test immediately after calibration
Daily Calibration check before and after each days sampling
Accepted Daily Variation (low/high)
Temperature Quarterly in range 3 to 7ºC
Quarterly in range 40 to 45ºC
One point check against standardised thermometer in water bath
0.2 / 0.2ºC
EC Daily 0µS/cm (DI water)
Daily 1413µS/cm (commercial)
Sydney Tap water (approx 200µS/cm)
Low and high point calibration check
1 / 15µS/cm
Salinity Daily 0ppt (DI water)
Daily 35ppt (commercial)
Low and high point calibration check
0.01 / 0.5ppt
DO Monthly 0% sat(zero DO sensor insert)
Daily 100% sat (air bubbled in tank of tap water)
Low and high point calibration check
0.5 / 5%
pH Daily pH7 (commercial)
Daily pH10 (commercial)
Daily pH4 and pH7 dilute x10 (commercial)
Low and high point calibration check
0.1 / 0.1 pH units.
Correct pH for temperature variation
Table 4.3 Probe calibration QA/QC procedures

18 HORNSBY SHIRE COUNCIL 2014-2015 WATER QUALITY MONITORING PROGRAM ANNUAL REPORT
5. Water Quality Guidelines
A water quality guideline is a numerical concentration limit or narrative statement recommended to support and
maintain a designated water use. Guidelines are used as a general tool for assessing water quality and are the
key to determining water quality objectives that protect and support the designated environmental values of our
water resources, and against which performance can be measured.
Guidelines are derived with the intention of providing some confidence that there will be no significant impact on
the environmental values if they are achieved. Exceedance of the guidelines indicates that there is potential for an
impact to occur, but does not provide any certainty that an impact will/has occurred.
(ANZECC 2000)
5.1 Aquatic Ecosystem Protection
5.1.1 Australian Water Quality Guidelines
Previously, Council’s water quality monitoring
program employed National Guidelines (ANZECC
2000) for aquatic ecosystem protection for data
analysis and reporting. In particular, Council used the
default trigger values for aquatic ecosystem protection
in south-east Australian lowland east flowing rivers
and south-east Australian estuaries.
However, the Guidelines (ANZECC 2000) suggest
that where possible, more appropriate guideline
trigger values for selected indicators should be
developed based on long term local or regional
monitoring of reference sites. Reference sites
represent the highest quality of water health against
which the water quality at sites in less pristine
locations can be compared.
Local long term reference sites have been used to
develop Regional Environmental Health Values
(REHVs Sect 5.1.2) for Hornsby Shire and these are
now used for data analysis and reporting on aquatic
ecosystem health.
In addition, faecal coliform and enterococci trigger
values were derived from the national Guidelines for
Managing Risk in Recreational Waters (NHMRC
2008). Trigger values for suspended solids and
turbidity are not precisely defined in the Guidelines
(ANZECC 2000) so the ‘NSW State Authority’
recommendations, listed in the guidelines, have been
used.
5.1.2 Regional Environmental Health Values
Freshwater
As recommended in the Guidelines (ANZECC 2000)
local trigger values, known as Regional Environmental
Health Values (REHVs), have been developed for
Hornsby Shire in preference to using the ‘default’
national values (Table 5.1).
Measurements of physical, chemical and biological
indicators at suitable reference sites provide
benchmarks for assessing biological diversity in
waterways in the local regions. REHVs for freshwater
sites were derived from water quality data collected at
two local reference sites (036, 037) between 2002
and 2010. Procedures used to develop these REHVs
are detailed in the Companion Technical Report (HSC
2012).
Estuarine Water
Due to the nature of development in Hornsby Shire
the water quality monitoring program does not include
an estuarine reference site. All estuarine areas in or
near Hornsby Shire (Hawkesbury River, Berowra and
Cowan Creeks) are in some way impacted by
developed areas. Therefore, it was not possible to
collect long term estuarine reference data. In the
absence of available data for local estuarine reference
sites the default values from ANZECC (2000) and
NHMRC (2008) Guidelines have been used (Table
5.2).

19 HORNSBY SHIRE COUNCIL 2014-2015 WATER QUALITY MONITORING PROGRAM ANNUAL REPORT
REHVs
FRESHWATER Turbidity
Suspended Solids
Total Phosphorus
Total Nitrogen Oxidised Nitrogen
Ammonium Nitrogen
pH Electrical
Conductivity Dissolved Oxygen
Faecal Coliforms
Units NTU mg/L mg/L mg/L mg/L mg/L unit mS/cm %sat CFU/100mL
Trigger Values 8 7 0.01 0.32 0.05 0.02 4.8 to 7 0.32 75 to 118 Median <150
and 80th%
<600
Table 5.1 REHVs for physical-chemical stressors and faecal bacteria for freshwater sites (derived from long term local reference data, ANZECC (2000) & NHMRC (2008))
REHVs ESTUARINE
WATER Turbidity
Suspended Solids
Total Phosphorus
Total Nitrogen Oxidised Nitrogen
Ammonium Nitrogen
pH Dissolved Oxygen
Faecal Coliforms
Enterococci Chlorophyll-a
Units NTU mg/L mg/L mg/L mg/L mg/L unit %sat CFU/100mL CFU/100mL µg/L
Trigger Values
10 6 0.03 0.3 0.015 0.015 7 – 8.5 80 - 110 Median <150
and 80th%
<600
95th% <40
(200,500) 4
Table 5.2 Trigger values for physical-chemical, faecal bacteria and aquatic biota indicators for estuarine sites (derived from ANZECC (2000) & NHMRC (2008))

20 HORNSBY SHIRE COUNCIL 2014-2015 WATER QUALITY MONITORING PROGRAM ANNUAL REPORT
5.2 Stormwater Harvesting and Reuse
A series of National Guideline documents on water
reuse have been published under the National Water
Quality Management Strategy. One of these
guidelines, Stormwater Harvesting and Reuse
(NRMMC et al 2009), describes processes to manage
the risks of stormwater capture and reuse in terms of
minimising health, environmental and operational risk.
To ensure stormwater harvested by Council is fit for
purpose (i.e. irrigation of sports ovals and the
community nursery) a set of trigger values have been
derived based on the Stormwater Harvesting and
Reuse Guideline (NRMMC et al 2009) together with
the ANZECC Guideline (2000) for Irrigation Waters
(Table 5.3).
Risk Parameter Trigger Notes
Catchment Issues Fluoride 0.1mg/L Presence of fluoride may point to leaking fluoridated town water (e.g. fluoride level of 0.3mg/L implies approximately 30% town water).
Soil Structure Salinity/Conductivity 2000µS/cm (for very sensitive plants)
Irrigation of sensitive plants. Salt tolerance depends on sand/clay content of soils, and on plant species being grown.
Sodicity Na 114mg/L
Sodium Absorption Ratio (SAR)
SAR 2 (at EC=200µS/cm)
SAR 7 (at EC=2000µS/cm)
Acceptable SAR depends on value of conductivity. Waters with high SAR might induce degradation of soil structure by clay aggregate breakdown. Potential problems may overcome by corrective management (e.g. application of lime or gypsum)
Chloride Cl 175mg/L
Infrastructure and equipment
Turbidity 10 NTU Effectiveness of UV treatment decreases as turbidity increases
Total suspended solids
Hardness (mg CaCO3/L)
Total Iron (mg/L)
Total Phosphorus (mg/L
20 year life
50
350
10
0.8
100 year life
20
350
0.2
0.05
Potential blockages of irrigation pipes and jets
Public Health Bacterial (median values) Faecal coliforms 10 CFU/100mL
E.Coli 10 CFU/100mL
Test initially fortnightly, then reduce to monthly if median <10. But increase back to fortnightly after any result >100.
Table 5.3 Trigger values for stormwater harvesting, treatment and reuse for open space irrigation.

21 HORNSBY SHIRE COUNCIL 2014-2015 WATER QUALITY MONITORING PROGRAM ANNUAL REPORT
5.3 Estuarine Phytoplankton / Microalgal Bloom Hazards
Phytoplankton are small (often microscopic) aquatic
plants that are free floating and able to reproduce
rapidly in favourable conditions (ANZECC 2000).
Blooms often occur when essential nutrients (nitrate,
phosphate, and silicate) are available in response to
natural processes (oceanic upwelling or runoff) or
human activities (fertiliser use or effluent discharge).
Some blooms are beneficial to an ecosystem while
others can be harmful, so it is important to know what
species make up the bloom and what conditions
caused it (Suthers & Rissik 2009).
Phytoplankton blooms have different effects
depending on the species present. Blooms can cause
harmless water discolouration, be non-toxic but
harmful to marine organisms or they may contain
toxins that are harmful to fish, marine mammal and
humans (Suthers & Rissik 2009). Some species of
marine phytoplankton produce natural toxins which,
when filtered by shellfish are concentrated to levels
which may be harmful to humans if consumed (NSW
Food Authority, 2014).
The NSW Food Authority sets out recommended
Phytoplankton Action Levels (PALs) based on the
concentrations of specific algal species that affect
shellfish aquaculture (Appendix D). Whenever
monitoring indicates these species are present and
trigger values are exceeded, the Regional Algal
Coordinating Committee (RACC) is notified. This may
result in the closure of the estuary to fishing (by the
Department of Primary Industries – Fishing and
Aquaculture), or closure of shellfish harvesting (by the
NSW Food Authority) and/or the placement of public
warning notices by Council.
Council has developed preliminary guidelines for
monitoring algal blooms based on Table 5.4 from
Coad et al (2012). Recommended management
actions are based on mean daily chlorophyll-a
concentrations. The findings are compared with the
PALs of the NSW Food Authority (2014) and the
appropriate actions taken.
Table 5.4 Management response to real-time chlorophyll-a monitoring probes from Coad et al (2012)

22 HORNSBY SHIRE COUNCIL 2014-2015 WATER QUALITY MONITORING PROGRAM ANNUAL REPORT
6. Presentation of Monitoring Data
6.1 Box and Whisker Plots
Water quality data is presented using ‘box and
whisker’ plots to compare water quality at test sites
with the local reference sites. Figure 6.1 shows how
to interpret the graphs used in this report. The graph
presents the median, maximum, minimum, 20th
percentile and 80th percentile data for each parameter
at a site. This gives a visual presentation of the
magnitude, scatter and most usual range of a water
quality parameter.
A red dotted line on a plot represents the associated
REHV for either fresh or estuarine water. A single
dotted line indicates a maximum trigger value (e.g.
turbidity or total phosphorus), below which compliant
values will occur. Results exceeding the REHV
indicate the potential for an impact to occur, which
may trigger further investigation.
Two red dotted lines indicate an upper and lower limit
to the REHV (e.g. pH or dissolved oxygen). Data that
comply with the REHV will fall between these lines.
Values outside (either above or below) the REHV
range indicate the potential for an impact to occur,
which may trigger further investigation.
A number of statistical terms are used within the
results section of this report to provide water quality
summaries and trends (Table 6.1).
Term Meaning
Parameter A water quality variable or component which is subjected to analysis (e.g. temperature, phosphorus etc.).
Valid N The number of water samples taken or tests conducted at the site during the reporting period for each parameter.
Mean The numerical average of the values for the parameter for the samples taken or tested during the reporting period. The ’mean’ value can be biased by extreme values.
Median The ’middle’ value of the parameter at a site for all the samples taken or tested during the reporting period. When all the values are sorted into increasing magnitude from lowest to highest (rank order), the median is the middle number if there are uneven number of values, or it is the average of the two central numbers when there is an even number of values.
Minimum The lowest value of the parameter at a site for all the samples taken or tested during the reporting period.
Maximum The highest value of the parameter at the site for all samples taken or tested during the reporting period.
Range The numerical difference between the minimum and maximum value for the parameter is the range of values for that parameter during the reporting period
20th Percentile The statistically calculated value of the parameter above which 80% of all test results occur. Values below the 20
th
percentile might be considered significantly lower than the average.
80th Percentile The statistically calculated value of the parameter below which 80% of all test results occur. Values above the 80
th
percentile might be considered significantly higher than the average.
Standard Deviation
The statistical standard deviation of the values for a parameter for the samples taken or tested during the reporting period. If the standard deviation is high relative to the mean (e.g. turbidity, faecal coliforms) it means the parameter is variable throughout the year. If the standard deviation is low relative to the mean (e.g. pH) it means there is low variability of parameter results over the year.
Table 6.1 Terminology for water quality data presentation

23 HORNSBY SHIRE COUNCIL 2014-2015 WATER QUALITY MONITORING PROGRAM ANNUAL REPORT
Interpretation of the Box & Whisker Plots
Shows box and whisker plots for 3 sites for Total Nitrogen concentrations in
milligrams per Litre
Sometimes the maximum concentration value of a parameter is so
high it is necessary to draw the whisker ‘off scale’. In this case the value of
the maximum concentration (‘2.3’) is noted on the graph.
Maximum value of the test data at this site for the year is the top
value of the ‘whisker’ line.
80th percentile value of test data for the year is the top of the ‘box’.
Median value of test date for the year is the ‘dot’ inside the box.
20th percentile value of test data for the year is the bottom of the
box.
Minimum value of test data for the year is the bottom value of the
‘whisker’ line (Note; often the reported minimum value is equal to half the
laboratory detection limit).
Dashed Line showing Guideline/REHV concentration. In this case
the guideline for ecosystem protection of estuarine waters is 0.3 mg/L for
this parameter. Concentrations above this value are considered to be
undesirable in estuarine waters.
Sampling Site Number. The whisker-box symbol directly above the
site number shows the distribution of data for the selected parameter for the
year at that sample site.
Figure 6.1 Interpretation of water quality data using box and whisker plots
6.2 Waterway Health Grading
In 2012 Council developed a waterway health grading
system to report on the health of creeks and estuaries
in the Shire. This involves determining an indicator
health grade, site health grade and subsequent
summary health grade for each water quality
monitoring site. Development of the water health
grading system is detailed in the Companion
Technical Report (HSC 2012).
To determine a summary health grade three
categories of indicators are used;
physical-chemical stressors
microbial indicators
aquatic biota indicators.
For freshwater sites this report presents indicator and
sites health grades for physical-chemical stressors
and microbial indicators only, aquatic biota data was
not collected during this reporting period.
For estuarine sites this report presents indicator and
site health grades for all categories and an overall
Waterway Health Grade for each site.
6.2.1 Indicator Health Grade
Phys-Chem Indicators
Indicator health grades for phys-chem parameters are
determined by using box and whisker plots to
compare water quality data for each parameter
against REHVs for fresh or estuarine water (Figure
6.2). Indicator Health Grades are displayed along the
top of each box plot.
In the case of pH and dissolved oxygen, which have
upper and lower REHVs, it is more precise to
determine the percentage of data that is within the
REHV limits by preparing histograms that
calculate the percentage of results that fall within the
associated limits (Figure 6.3).
Microbial Indicators
Indicator health grades for microbial parameters are
determined using box and whisker plots with REHVs
based on the median and 80th percentile. Results of
the box plot are compared against the health grade
categories (Figure 6.4) and an indicator health grade

24 HORNSBY SHIRE COUNCIL 2014-2015 WATER QUALITY MONITORING PROGRAM ANNUAL REPORT
assigned. In estuarine sites there is also an REHV for
enterococci using the 95th percentile. It should be
noted that it is statistically preferred to have more than
20 data points for this analysis, annual results have
only 12 (N=12). Use of this REHV is more suitable for
long term data analysis when data from multiple years
can be combined, thus enterococci results will not be
reported in this annual report.
Aquatic Biota Indicators
Indicator health grades for aquatic biota in freshwater
are based on macroinvertebrate sampling and
analysis which has not been undertaken in this
reporting period. Indicator health grades for aquatic
biota in estuarine water is based on chlorophyll-a
results and determined using box and whisker plots,
as per the phys-chem indicator health grades (Figure
6.1).
Figure 6.2 Method for indicator health grading for physical-chemical stressors using percentiles and REHVs on a box and whisker plot
Figure 6.3 Method for indicator health grading for physical-chemical stressors using percentiles and REHVs on a histogram
Median 80th Percentile Faecal Coliform
Health Grade
≤ 150 ≤ 150 A+
≤ 150 ≤ 600 A
≤ 150 >600 and ≤ 1000 B
>150 ≤ 600 B
≤ 150 >1000 C
>150 and ≤ 600 >600 and ≤ 1000 C
>150 and ≤ 600 >1000 D
>600 ≤ 1000 D
>600 and ≤ 1000 >1000 F
>1000 - F
Figure 6.4 Method for indicator health grading for microbial stressors using percentiles and REHVs on a box and whisker plot
75 118
Dissolved oxygen (%sat)
0
1
2
3
4
5
6
7
8
No
of
ob
s
42%
58%23
4.8 7.0
pH
0
1
2
3
4
5
6
7
8
9
No
of
ob
s
33%
67% 23

25 HORNSBY SHIRE COUNCIL 2014-2015 WATER QUALITY MONITORING PROGRAM ANNUAL REPORT
6.2.2 Site Health Grade
Phys-Chem Indicators
A site health grade for physical and chemical
parameters is a combined ranking of the indicator
health grades at each water quality site. It is
calculated using the averaging process as follows
(Figure 6.5):
Step 1. Each individual indicator grade is given an indicator score
Step 2. Scores for all physical-chemical parameters are then averaged
Step 3. The average score is compared to average score categories
Step 4. Assign corresponding site grade
The site health grades for physical-chemical stressors
are A to F (Table 6.2): Grade A is the top score, which
indicates clean water and a healthy ecosystem;
Grades B, C and D indicate increasingly degraded
water bodies; Grade F represents a ‘Fail’ implying that
water quality is always poor and the ecosystem is
severely impaired.
Microbial Indicators
Site Health Grades for microbial indicators in
freshwater sites are the same as the Indicator Health
Grades as there is only parameter (i.e. faecal
coliforms). Site Health Grades for microbial indicators
in estuarine sites are determined using the averaging
process in Figure 6.4 for faecal coliforms and
enterococci
Aquatic biota Indicators
Site Health Grades for aquatic biota indicators in
estuarine sites are the same as the Indicator Health
Grades as there is only parameter (i.e. chlorophyll-a).
Step 1
Step 2
Step 3
Step 4
Indicator Grade
Indicator Score
Average Indicator Score
Site Grade
A → 9
>
>8 → A
B → 7 >6 to 8 → B
C → 5 >4 to 6 → C
D → 3 >2 to 4 → D
F → 1 0 to 2 → F
Figure 6.5 How indicator grades are scored and averaged to produce a site grade for physical-chemical stressors
Health Grade and
Colour
Percentage of time
physical-chemical stressors
satisfy REHVs*
Health Description Cleanliness categories Probable impact on the
natural aquatic biota
A Over 80% Excellent Clean Healthy
B 50% to 80% Good Slightly degraded Mild impairment
C 20% to 50% Poor Moderately degraded Moderate impairment
D Below 20% Very Poor Severely degraded Serious impairment
F Never passes Fail Always Bad Severe impairment
Table 6.2 Grading system used to categorise water quality for physical-chemical stressors

26 HORNSBY SHIRE COUNCIL 2014-2015 WATER QUALITY MONITORING PROGRAM ANNUAL REPORT
6.2.3 Summary Waterway Health Grade
The site health grade for physical and chemical
stressors can be combined with a health grading for
microbial and aquatic biota indicators for each
individual monitoring site to determine a summary
waterway health grade (Figure 6.6). It is proposed
that this analysis is undertaken every 5 years to
monitor the improvement, or otherwise, of water
quality within Hornsby Shire. This will accommodate
aquatic biota sampling regimes for freshwater sites
and also provide a more statistically robust result for
microbial indicators (i.e. N≥ 20).
For the purpose of this report Summary Waterway
Health Grades have been determined for estuarine
sites. Freshwater sites have Site Health Grades only
determined for phys-chem and microbial indicators.
Further information on Summary Waterway Health
Grades and the determination process can be found
in the Water Quality Report Card and Companion
Technical Report (HSC 2012) respectively.
Figure 6.6 Physical-chemical, microbial and aquatic biota indicators used to determine a summary waterway health gradings
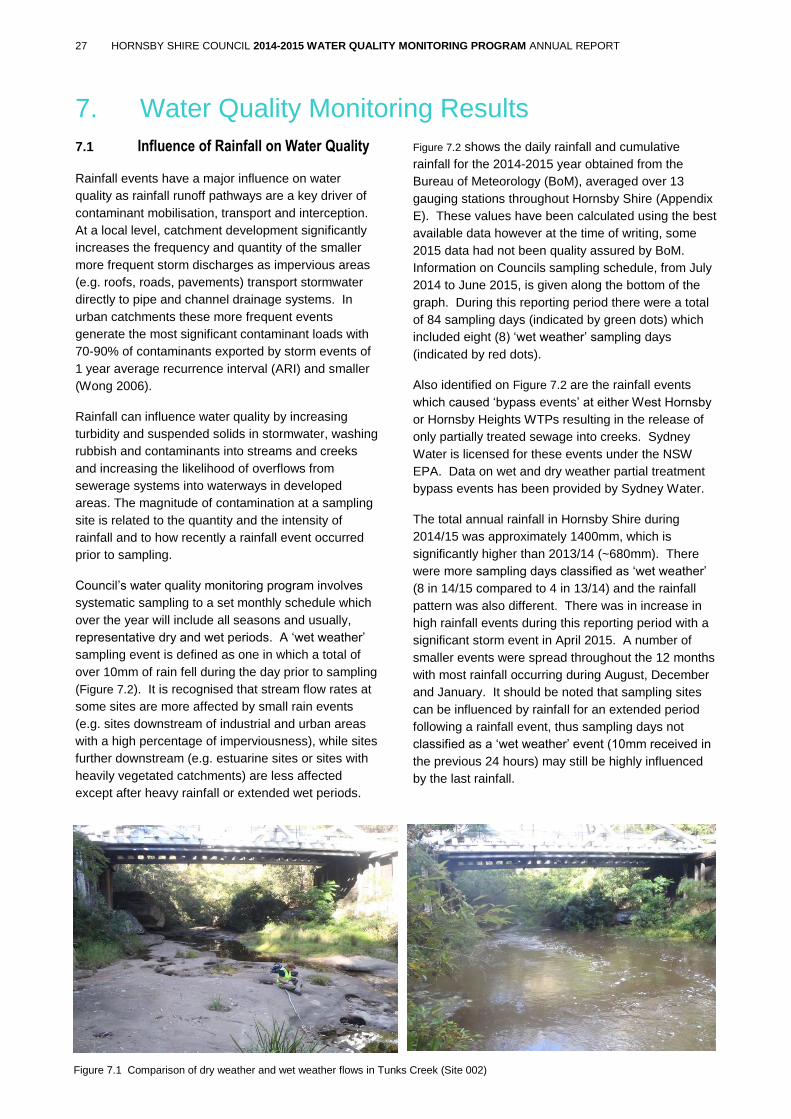
27 HORNSBY SHIRE COUNCIL 2014-2015 WATER QUALITY MONITORING PROGRAM ANNUAL REPORT
7. Water Quality Monitoring Results
7.1 Influence of Rainfall on Water Quality
Rainfall events have a major influence on water
quality as rainfall runoff pathways are a key driver of
contaminant mobilisation, transport and interception.
At a local level, catchment development significantly
increases the frequency and quantity of the smaller
more frequent storm discharges as impervious areas
(e.g. roofs, roads, pavements) transport stormwater
directly to pipe and channel drainage systems. In
urban catchments these more frequent events
generate the most significant contaminant loads with
70-90% of contaminants exported by storm events of
1 year average recurrence interval (ARI) and smaller
(Wong 2006).
Rainfall can influence water quality by increasing
turbidity and suspended solids in stormwater, washing
rubbish and contaminants into streams and creeks
and increasing the likelihood of overflows from
sewerage systems into waterways in developed
areas. The magnitude of contamination at a sampling
site is related to the quantity and the intensity of
rainfall and to how recently a rainfall event occurred
prior to sampling.
Council’s water quality monitoring program involves
systematic sampling to a set monthly schedule which
over the year will include all seasons and usually,
representative dry and wet periods. A ‘wet weather’
sampling event is defined as one in which a total of
over 10mm of rain fell during the day prior to sampling
(Figure 7.2). It is recognised that stream flow rates at
some sites are more affected by small rain events
(e.g. sites downstream of industrial and urban areas
with a high percentage of imperviousness), while sites
further downstream (e.g. estuarine sites or sites with
heavily vegetated catchments) are less affected
except after heavy rainfall or extended wet periods.
Figure 7.2 shows the daily rainfall and cumulative
rainfall for the 2014-2015 year obtained from the
Bureau of Meteorology (BoM), averaged over 13
gauging stations throughout Hornsby Shire (Appendix
E). These values have been calculated using the best
available data however at the time of writing, some
2015 data had not been quality assured by BoM.
Information on Councils sampling schedule, from July
2014 to June 2015, is given along the bottom of the
graph. During this reporting period there were a total
of 84 sampling days (indicated by green dots) which
included eight (8) ‘wet weather’ sampling days
(indicated by red dots).
Also identified on Figure 7.2 are the rainfall events
which caused ‘bypass events’ at either West Hornsby
or Hornsby Heights WTPs resulting in the release of
only partially treated sewage into creeks. Sydney
Water is licensed for these events under the NSW
EPA. Data on wet and dry weather partial treatment
bypass events has been provided by Sydney Water.
The total annual rainfall in Hornsby Shire during
2014/15 was approximately 1400mm, which is
significantly higher than 2013/14 (~680mm). There
were more sampling days classified as ‘wet weather’
(8 in 14/15 compared to 4 in 13/14) and the rainfall
pattern was also different. There was in increase in
high rainfall events during this reporting period with a
significant storm event in April 2015. A number of
smaller events were spread throughout the 12 months
with most rainfall occurring during August, December
and January. It should be noted that sampling sites
can be influenced by rainfall for an extended period
following a rainfall event, thus sampling days not
classified as a ‘wet weather’ event (10mm received in
the previous 24 hours) may still be highly influenced
by the last rainfall.
Figure 7.1 Comparison of dry weather and wet weather flows in Tunks Creek (Site 002)

28 HORNSBY SHIRE COUNCIL 2014-2015 WATER QUALITY MONITORING PROGRAM ANNUAL REPORT
Figure 7.2 Water quality monitoring dates and wet weather monitoring events overlayed on daily rainfall
-150.0
50.0
250.0
450.0
650.0
850.0
1050.0
1250.0
1450.0
1650.0
-15.0
5.0
25.0
45.0
65.0
85.0
105.0
125.0
145.01
/07
/20
14
8/0
7/2
01
4
15
/07
/20
14
22
/07
/20
14
29
/07
/20
14
5/0
8/2
01
4
12
/08
/20
14
19
/08
/20
14
26
/08
/20
14
2/0
9/2
01
4
9/0
9/2
01
4
16
/09
/20
14
23
/09
/20
14
30
/09
/20
14
7/1
0/2
01
4
14
/10
/20
14
21
/10
/20
14
28
/10
/20
14
4/1
1/2
01
4
11
/11
/20
14
18
/11
/20
14
25
/11
/20
14
2/1
2/2
01
4
9/1
2/2
01
4
16
/12
/20
14
23
/12
/20
14
30
/12
/20
14
6/0
1/2
01
5
13
/01
/20
15
20
/01
/20
15
27
/01
/20
15
3/0
2/2
01
5
10
/02
/20
15
17
/02
/20
15
24
/02
/20
15
3/0
3/2
01
5
10
/03
/20
15
17
/03
/20
15
24
/03
/20
15
31
/03
/20
15
7/0
4/2
01
5
14
/04
/20
15
21
/04
/20
15
28
/04
/20
15
5/0
5/2
01
5
12
/05
/20
15
19
/05
/20
15
26
/05
/20
15
2/0
6/2
01
5
9/0
6/2
01
5
16
/06
/20
15
23
/06
/20
15
30
/06
/20
15
Dai
ly A
vera
ge R
ain
fall
(mm
)
Date
Rainfall and Water Sampling 2014-2015
Daily Average Rainfall
Sampling Event
Wet Weather Sampling Event
Cumulative Rainfall
WTP Partial TreatmentDischarge Event

29 HORNSBY SHIRE COUNCIL 2014-2015 WATER QUALITY MONITORING PROGRAM ANNUAL REPORT
7.2 Aquatic Ecosystem Health
7.2.1 QA/QC Results
Blank Samples
Eleven (11) blank suites of samples (N=75) were
prepared and sent for analysis during this reporting
period. For selected parameters the results were
below detection limits on 95% of occasions (Table
7.1). Results on or above detection limits may be due
to contamination during the sampling and handling
process or through laboratory practices.
Duplicate Samples
Nine (9) duplicate samples were collected and sent
for analysis during this reporting period. Each
duplicate comprised a suite of samples “A” and a
duplicate suite of samples “B”. For selected
parameters the correlation coefficient shows no
significant differences between the results for sample
A and sample B for any parameter (Table 7.2).
Suspended Solids (mg/L)
Ammonium-Nitrogen (mg/L)
Oxidised-Nitrogen (mg/L)
Total Nitrogen (mg/L)
Total Phosphorus
(mg/L)
Chlorophyll-a (ug/L)
Faecal Cols (CFU/100ml)
Enterococci (CFU/100ml)
<2 <0.01 <0.01 <0.05 <0.002 <0.2 <1 <1
<2 <0.01 <0.01 <0.05 <0.002 <0.2 <1 <1
<2 <0.01 <0.01 <0.05 <0.002 * <1 *
<2 <0.01 <0.01 <0.05 <0.002 * <1 *
<2 <0.01 <0.01 <0.05 <0.002 <0.2 <1 <1
<2 <0.01 <0.01 <0.05 <0.002 * <1 *
<2 <0.01 <0.01 <0.05 0.002 * <1 *
<2 <0.01 <0.01 <0.05 0.002 <0.2 <1 <1
<2 <0.01 <0.01 <0.05 <0.002 * <1 <1
<2 <0.01 <0.01 <0.05 <0.002 <0.2 <1 <1
<2 <0.01 <0.01 <0.05 0.002 0.2 <1 <1
<2 <0.01 <0.01 <0.05 <0.002 * <1 <1
* Not sampled
Laboratory detection limit
Result not below detection limit
Table 7.1 Laboratory results for selected parameters of blank samples (N=75)
P<0.05
Suspended
Solids (mg/L
Ammonium-
Nitrogen
(mg/L)
Oxidised
Nitrogen
(mg/L)
Total
Nitrogen
(mg/L)
Total
Phosphorus
(mg/L)
Faecal
Coliforms
(CFU/100ml)
Enterococci
(CFU/100ml)
Correlation
Coefficient
0.943739 0.999999 0.999996 0.999972 0.989785 0.962998 0.984189
Table 7.2 Correlation coefficients for selected parameters of duplicate samples (N=11, p<0.05)

30 HORNSBY SHIRE COUNCIL 2014-2015 WATER QUALITY MONITORING PROGRAM ANNUAL REPORT
7.2.2 Reference Sites
Eight sites were monitored for reference conditions
during the 2014-15 period. Graphical comparisons of
water quality parameters between reference sites and
against REHVs are presented in Figure 7.3. Indicator
Health Grades are presented along the top of the box
plots with subsequent Site Health Grades for phys-
chem and microbial indicators in Table 7.3. A
comparison of the phys-chem and microbial Site
Health Grades for the last three reporting years is also
presented in Table 7.3. Summary statistics for these
sites are presented in Appendix F.
Reference sites represent the highest water quality
against which the water quality in other locations (less
pristine sites) can be compared with. Data from
reference sites show natural variation of water
parameters in creeks with minimal human impact,
thus providing ‘control’ or ‘reference’ data. These
creeks reflect the water quality that may have existed
before Hornsby Shire was developed. Only the two
long term reference sites (036 and 037) are used for
comparison against sites representative of other land
use types in the following sections.
Receiving waters of primarily undisturbed catchments
in Hornsby Shire are generally characterised by low
pH, electrical conductivity, faecal coliforms,
suspended solids and nutrients and high dissolved
oxygen levels. The pH values at reference sites are
more acidic (i.e. lower pH) than the pH range found in
other sites. These pH levels are not unusual for
unbuffered waters in wholly sandstone catchments.
Creeks in many developed sandstone catchment
areas are considerably higher (more alkaline) than the
natural background, which may be attributed to the
widespread use of alkaline concretes and detergents.
This may have permanently changed the naturally
acidic nature of most streams in urban areas in
Sydney (HSC 2011).
Site 023 within Peats Crater, Muogamarra Nature
Reserve, shows some major differences when
compared with other reference sites. pH, turbidity,
total phosphorus, total nitrogen and oxidised-nitrogen
results are consistently higher relative to other
reference sites, reflecting the known igneous geology
influence of the catchment. It is unlikely that site 123
will continue to be monitored for reference conditions
following the water quality monitoring program review.
Site dot-points below summarise which indicators
exceeded the REHV trigger values on the majority of
sampling occasions. This highlights the parameters
of most concern and provides an indication of the
types of catchment activities that may be impacting
the waterway.
Site 036 – Murray Anderson Creek
Site Health Grade of A for phys-chem indicators.
Site Health Grade of A+ for microbial indicators.
All results complied with the REHVs 100% of the time.
Site 037 – Smugglers Creek
Site Health Grade of A for phys-chem indicators.
Site Health Grade of A+ for microbial indicators.
All results complied with the REHVs >80% of the time.
Results exceeding the REHVs <20% of the time turbidity, total phosphorus, total nitrogen and faecal coliforms.
Site 054 – Laughtondale Creek
Site Health Grade of A for phys-chem indicators.
Site Health Grade of A for microbial indicators.
Results that complied with the REHVs 100% of the time oxidised-nitrogen.
Results exceeding the REHVs <20% of the time suspended solids, dissolved oxygen and ammonium-nitrogen.
Results exceeding the REHVs 20-50% of the time electrical conductivity, turbidity, total phosphorus, total nitrogen and faecal coliforms.
Results exceeding the REHVs 50-80% of the time pH.
Site 114 – Muogamarra Creek Note: this site was inaccessible due to inclement weather conditions on a number of occasions during this reporting period and in March 2015 the creek was dry. These results are based on only four (N=4) sampling events.
Site Health Grade of A for phys-chem indicators.
Site Health Grade of A+ for microbial indicators.
Results complying with the REHVs 100% of the time electrical conductivity, turbidity, suspended solids, total phosphorus, total nitrogen, oxidised nitrogen and faecal coliforms.
Results exceeding the REHVs 20-50% of the time dissolved oxygen, pH and ammonium-nitrogen.
Site 123 – Peats Crater Creek Note: this site was inaccessible on a number of occasions due to inclement weather conditions during this reporting period. These results are based on only five (N=5) sampling events.
Site Health Grade of B for phys-chem indicators.
Site Health Grade of A for microbial indicators.
Results complying with the REHVs 100% of the time turbidity and suspended solids.
Results exceeding the REHVs <20% of the time ammonium-nitrogen.
Results exceeding the REHVs 20-50% of the time total nitrogen and oxidised-nitrogen and faecal coliforms.
Results exceeding the REHVs 50-80% of the time dissolved oxygen.

31 HORNSBY SHIRE COUNCIL 2014-2015 WATER QUALITY MONITORING PROGRAM ANNUAL REPORT
Results exceeding the REHVs >80% of the time electrical conductivity and pH.
Results exceeding the REHVS 100% of the time total phosphorus.
Site 147 – Unnamed Creek, Cheltenham
Site Health Grade of A for phys-chem indicators.
Site Health Grade of A for microbial indicators.
Results complying with the REHVs 100% of the time suspended solids, dissolved oxygen, ammonium-nitrogen and oxidised-nitrogen.
Results exceeding the REHVs <20% of the time electrical conductivity, turbidity, pH, total phosphorus, total nitrogen.
Results exceeding the REHVs 20-50% of the time faecal coliforms.
Site 149 – Duckpond Ridge Creek
Site Health Grade of B for phys-chem indicators.
Site Health Grade of A+ for microbial indicators.
Results complying with the REHVs 100% of the time dissolved oxygen and oxidised-nitrogen.
Results exceeding the REHVs <20% of the time turbidity, total nitrogen, ammonium-nitrogen and faecal coliforms.
Results exceeding the REHVs 20-50% of the time suspended solids, total phosphorus.
Results exceeding the REHVs 50-80% of the time electrical conductivity.
Results exceeding the REHVs 100% of the time pH.
Site 164 – Djarra Crossing
Site Health Grade of A for phys-chem indicators.
Site Health Grade of A for microbial indicators.
Results complying with the REHVs 100% of the time electrical conductivity, total nitrogen, ammonium-nitrogen and oxidised-nitrogen.
Results exceeding the REHVs <20% of the time turbidity, suspended solids, dissolved oxygen, total phosphorus.
Results exceeding the REHVs 20-50% of the time faecal coliforms.
Results exceeding the REHVs 50-80% of the time pH.
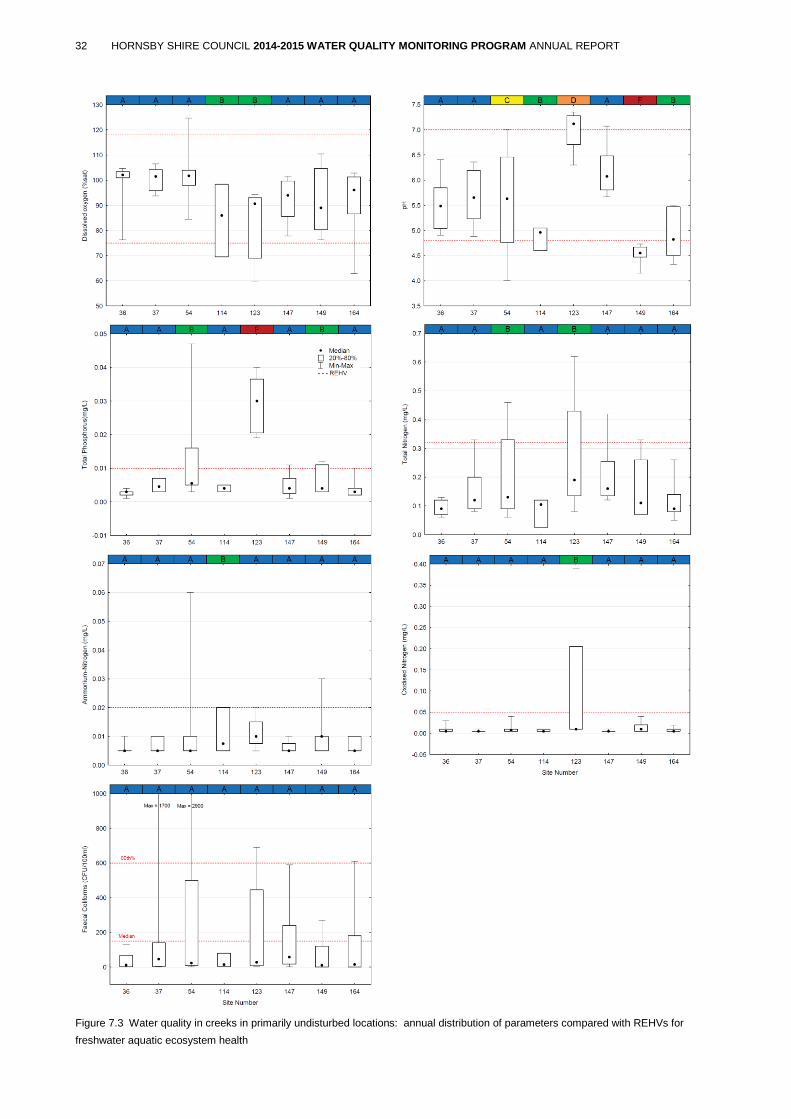
32 HORNSBY SHIRE COUNCIL 2014-2015 WATER QUALITY MONITORING PROGRAM ANNUAL REPORT
Figure 7.3 Water quality in creeks in primarily undisturbed locations: annual distribution of parameters compared with REHVs for
freshwater aquatic ecosystem health

33 HORNSBY SHIRE COUNCIL 2014-2015 WATER QUALITY MONITORING PROGRAM ANNUAL REPORT
SITE HEALTH GRADES THROUGH TIME - REFERENCE SITES
SITE NO. 2012/2013 2013/2014 2014/2015
Phys-Chem Microbial Phys-Chem Microbial Phys-Chem Microbial
036 A A+ A A+ A A+
037 A A+ A A+ A A+
054 A A+ A A+ A A
114 B A+ A A+ A A+
123 B A B A+ B A
147 A A+ A A+ A A
149 B A+ B A+ B A+
164 A A A A+ A A
Table 7.3 Comparison of Site Health Grades for phys-chem and microbial indicators at Reference sites for the 2012-13 to 2014-15
reporting periods

34 HORNSBY SHIRE COUNCIL 2014-2015 WATER QUALITY MONITORING PROGRAM ANNUAL REPORT
7.2.3 Industrial Sites
Three sites representative of industrial landuse within
the catchment were monitored during the 2014-15
period. Graphical comparisons of water quality
parameters against two long term reference sites
(Ref) and the REHVs are presented in Figure 7.4.
Indicator Health Grades are presented along top of
the box plots with subsequent Site Health Grades for
phys-chem and microbial indicators in Table 7.4. A
comparison of the phys-chem and microbial Site
Health Grades for the last three reporting years is also
presented in Table 7.4. Summary statistics for these
sites are presented in Appendix F.
Receiving waters of industrial catchments in Hornsby
Shire are generally characterised by high
concentrations of nutrients (TP, TN, NOx-N, NH3-N)
and elevated levels of pH and faecal coliforms. pH
values well above reference levels may reflect
widespread use of alkaline products (e.g. concrete
and surfactants) within developed areas. Elevated
nutrient levels in industrial catchments may be due to
discharge of human waste, industrial and household
chemicals, industrial processes and stormwater
inputs. Common sources of faecal contaminants in
developed catchments are sewer overflows and
animal faeces where roofs and other depositional
areas are directly connected to the drainage system
(Wong 2006).
Site dot-points below summarise which indicators
exceeded the REHV trigger values on the majority of
sampling occasions. This highlights the parameters
of most concern and provides an indication of the
types of catchment activities that may be impacting
the waterway.
Site 010 – Larool Creek
Site Health Grade of C for phys-chem indicators.
Site Health Grade of D for microbial indicators.
Results exceeding the REHVs 100% of the time pH, total phosphorus, total nitrogen and oxidised nitrogen.
Results exceeding the REHVs >80% of the time electrical conductivity, ammonium nitrogen and faecal coliforms.
No results exceeded the REHVs 50-80% of the time.
Site 012 – Hornsby Creek
Site Health Grade of C for phys-chem indicators.
Site Health Grade of F for microbial indicators.
Results exceeding the REHVs 100% of the time total phosphorus, total nitrogen oxidised nitrogen and faecal coliforms.
Results exceeding the REHVs >80% of the time pH and ammonium nitrogen.
Results exceeding the REHVs 50-80% of the time electrical conductivity.
Site 013 – Sams Creek
Site Health Grade of C for phys-chem indicators.
Site Health Grade of D for microbial indicators.
Results exceeding the REHVs 100% of the time total phosphorus.
Results exceeding the REHVs >80% of the time oxidised nitrogen and faecal coliforms.
Results exceeding the REHVs 50-80% of the time dissolved oxygen, pH, total nitrogen and ammonium nitrogen.
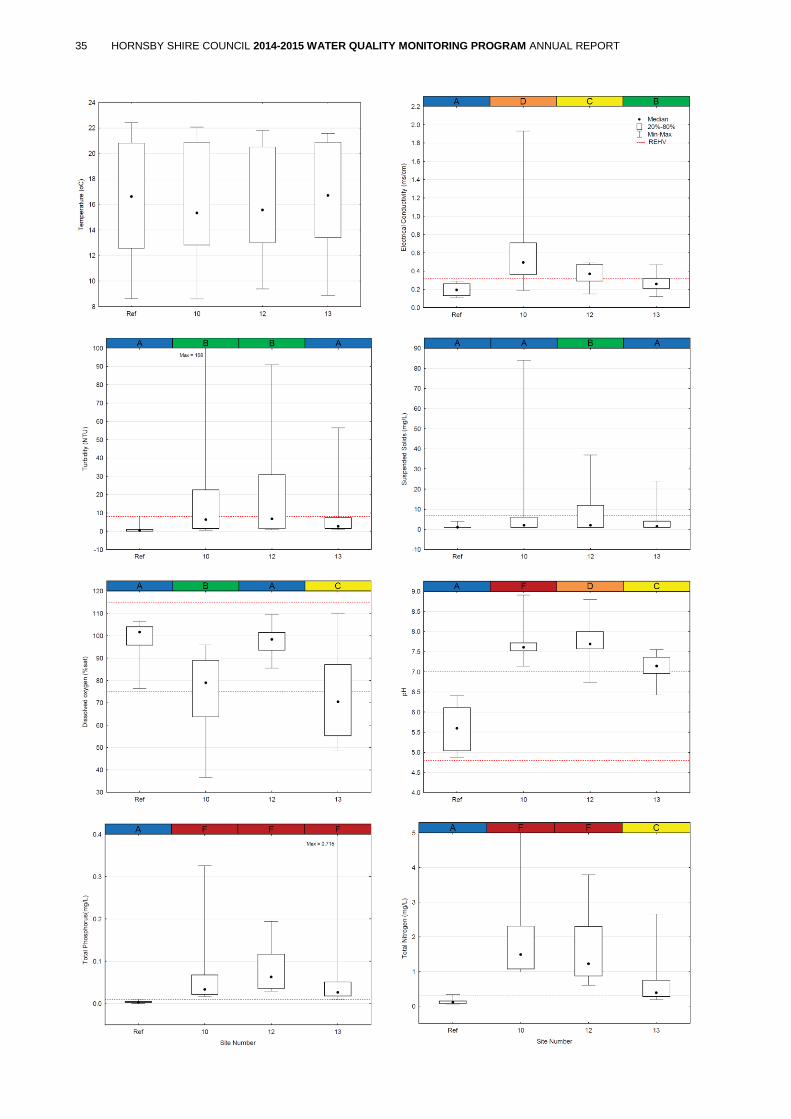
35 HORNSBY SHIRE COUNCIL 2014-2015 WATER QUALITY MONITORING PROGRAM ANNUAL REPORT

36 HORNSBY SHIRE COUNCIL 2014-2015 WATER QUALITY MONITORING PROGRAM ANNUAL REPORT
Figure 7.4 Water quality in creeks receiving runoff from industrial areas: annual distribution of parameters compared with reference
creeks and REHVs for freshwater aquatic ecosystem health
SITE HEALTH GRADES THROUGH TIME - INDUSTRIAL SITES
SITE NO. 2012/2013 2013/2014 2014/2015
Phys-Chem Microbial Phys-Chem Microbial Phys-Chem Microbial
010 D F D D C D
012 D F C F C F
013 D D C A C D
Table 7.4 Comparison of Site Health Grades for phys-chem and microbial indicators at industrial sites for the 2012-13 to 2014-15
reporting periods

37 HORNSBY SHIRE COUNCIL 2014-2015 WATER QUALITY MONITORING PROGRAM ANNUAL REPORT
7.2.4 Rural Sites
Seven (7) sites representative of rural land use within
the catchment were monitored during the 2014-15
period. Graphical comparisons of water quality
parameters against two long term reference sites
(Ref) and the REHVs are presented in Figure 7.5.
Indicator Health Grades are displayed along the top of
the box plots with subsequent Site Health Grades for
phys-chem and microbial indicators in Table 7.5. A
comparison of the phys-chem and microbial Site
Health Grades for the last three reporting years is also
presented in Table 7.5. Summary statistics for these
sites are presented in Appendix F.
Receiving waters downstream of rural catchments in
Hornsby Shire are generally characterised by
elevated electrical conductivity, faecal coliforms and
nutrients (TP, TN, NH3-N, NOx-N). Elevated levels of
nutrients and bacteria are most likely due to the use of
on-site wastewater management systems (OSWMS)
in areas not yet connected to sewer. Council routinely
inspects the OSWMSs in rural areas, however the
shallow, sandstone geology is not well suited to
absorption trenches or aerated wastewater treatment
systems (AWTS) and significant seepage of untreated
effluent would occur. Fertilisers, domestic use of
detergents, incorrect disposal of grey water and illegal
septic tank discharges could also contribute to the
high nutrient loads. Site 002 continues to maintain
good water quality despite receiving runoff from rural
catchments. This may be attributed to the site being
located quite a distance downstream of the rural
settlements with significant intact bushland in between
which allows natural in-stream processes to absorb
an assimilate pollutants that are present in sites in
closer proximity to rural settlements.
Site dot-points below summarise which indicators
exceeded the REHV trigger values on the majority of
sampling occasions. This highlights the parameters
of most concern and provides an indication of the
types of catchment activities that may be impacting
the waterway.
Site 002 – Tunks Creek
Site Health Grade of B for phys-chem indicators.
Site Health Grade of A+ for microbial indicators.
No results exceeded the REHVs 100% of the time.
No results exceeded the REHVs >80% of the time.
Results exceeding the REHVs 50-80% of the time pH and total phosphorus.
Site 042 – Colah Creek
Site Health Grade of C for phys-chem indicators.
Site Health Grade of C for microbial indicators.
Results exceeding the REHVs 100% of the time total phosphorus.
Results exceeding the REHVs >80% of the time total nitrogen.
Results exceeding the REHVs 50-80% of the time electrical conductivity, pH, ammonium-nitrogen, oxidised-nitrogen and faecal coliforms.
Site 049 – Still Creek
Site Health Grade of C for phys-chem indicators.
Site Health Grade of B for microbial indicators.
No results exceeded the REHVs 100% of the time.
Results exceeding the REHVs >80% of the time electrical conductivity, total phosphorus, total nitrogen and oxidised-nitrogen.
Results exceeding the REHVs 50-80% of the time pH.
Site 062 – Unnamed Creek, Cowan
Site Health Grade of C for phys-chem indicators.
Site Health Grade of C for microbial indicators.
Results exceeding the REHVs 100% of the time pH.
Results exceeding the REHVs >80% of the time electrical conductivity, total phosphorus, total nitrogen.
Results exceeding the REHVs 50-80% of the time ammonium-nitrogen, oxidised-nitrogen and faecal coliforms.
Site 063 – Colah Creek
Site Health Grade of B for phys-chem indicators.
Site Health Grade of A for microbial indicators.
No results exceeded the REHVs 100% of the time.
Results exceeding the REHVs >80% of the time electrical conductivity, total phosphorus.
Results exceeding the REHVs 50-80% of the time pH, total nitrogen.
Site 064 – Unnamed Creek, Galston Village
Site Health Grade of C for phys-chem indicators.
Site Health Grade of C for microbial indicators.
Results exceeding the REHVs 100% of the time total phosphorus, total nitrogen.
Results exceeding the REHVs >80% of the time electrical conductivity, ammonium-nitrogen and oxidised-nitrogen.
Results exceeding the REHVs 50-80% of the time pH and faecal coliforms.
Site 080 – Glenorie Creek
Site Health Grade of C for phys-chem indicators.
Site Health Grade of D for microbial indicators.
Results exceeding the REHVs 100% of the time total phosphorus, total nitrogen, ammonium-nitrogen and oxidised-nitrogen.
Results exceeding the REHVs >80% of the time electrical conductivity, pH and faecal coliforms.
No results exceeded the REHVs 50-80% of the time.

38 HORNSBY SHIRE COUNCIL 2014-2015 WATER QUALITY MONITORING PROGRAM ANNUAL REPORT

39 HORNSBY SHIRE COUNCIL 2014-2015 WATER QUALITY MONITORING PROGRAM ANNUAL REPORT
Figure 7.5 Water quality in creeks receiving runoff from rural areas: annual distribution of parameters compared with reference creeks
and REHVs for freshwater aquatic ecosystem health
SITE HEALTH GRADES THROUGH TIME - RURAL SITES
SITE NO. 2012/2013 2013/2014 2014/2015
Phys-Chem Microbial Phys-Chem Microbial Phys-Chem Microbial
002 B A+ A A+ B A+
042 C A C A C C
049 C A B A+ C B
062 D B C A C C
063 C A+ B A B A
064 D B C B C C
080 D F D F C D
Table 7.5 Comparison of Site Health Grades for phys-chem and microbial indicators at Rural sites for the 2012-13 to 2014-15 reporting
periods

40 HORNSBY SHIRE COUNCIL 2014-2015 WATER QUALITY MONITORING PROGRAM ANNUAL REPORT
7.2.5 Urban Sites
Six (6) sites representative of urban land use within
the catchment were monitored during the 2014-15
period. Graphical comparisons of water quality
parameters against two long term reference sites
(Ref) and the REHVs are presented in Figure 7.6.
Indicator Health Grades are displayed along the top of
the box plots and subsequent Site Health Grades for
phys-chem and microbial indicators in Table 7.6. A
comparison of the phys-chem and microbial Site
Health Grades for the last three reporting years is also
presented in Table 7.6. Summary statistics for these
sites are presented in Appendix F.
Receiving waters of urban catchments in Hornsby
Shire are generally characterised by elevated
electrical conductivity and pH values and high levels
of nutrients (TP, TN, NOx-N). pH values well above
natural background (reference) levels may reflect
widespread use of alkaline products (e.g. concrete
and surfactants) within developed urban areas.
Elevated levels of bacteria in urban areas may be
attributed faecal contamination entering streams via
stormwater runoff and/or sewage overflows during wet
weather events. Nutrients in urban catchments could
be sourced from overuse of garden fertilisers and
manures, eroding soils, road runoff and sewage
overflows. Site 039 maintains particularly good water
quality results for a site downstream of an urban
catchment. This may be attributed to the site being
located quite a distance downstream of the urban
settlements with significant intact bushland which
allows in-stream processes to absorb and assimilate
pollutants that are present at sites in close proximity
to urban settlements.
Site dot-points below summarise which indicators
exceeded the REHV trigger values on the majority of
sampling occasions. This highlights the parameters
of most concern and provides an indication of the
types of catchment activities that may be impacting
the waterway.
Site 004 – Berowra Creek
Site Health Grade of C for phys-chem indicators.
Site Health Grade of C for microbial indicators.
Results exceeding the REHVs 100% of the time pH and oxidised-nitrogen.
Results exceeding the REHVs >80% of the time total phosphorus and total nitrogen.
Results exceeding the REHVs 50-80% of the time electrical conductivity and faecal coliforms.
Site 005 – Pyes Creek
Site Health Grade of C for phys-chem indicators.
Site Health Grade of D for microbial indicators.
Results exceeding the REHVs 100% of the time pH, total phosphorus, total nitrogen and oxidised-nitrogen.
Results exceeding the REHVs >80% of the time electrical conductivity and faecal coliforms.
Results exceeding the REHVs 50-80% of the time ammonium-nitrogen.
Site 006 – Georges Creek
Site Health Grade of C for phys-chem indicators.
Site Health Grade of B for microbial indicators.
Results exceeding the REHVs 100% of the time electrical conductivity, pH and total phosphorus.
No results exceeded the REHVs >80% of the time.
Results exceeding the REHVs 50-80% of the time total nitrogen and oxidised-nitrogen.
Site 008 – Devlins Creek
Site Health Grade of C for phys-chem indicators.
Site Health Grade of D for microbial indicators.
Results exceeding the REHVs 100% of the time pH, total phosphorus, total nitrogen and oxidised-nitrogen.
Results exceeding the REHVs >80% of the time electrical conductivity, ammonium-nitrogen and faecal coliforms.
No results exceeded the REHVs 50-80% of the time.
Site 039 – Joe Crafts Creek
Site Health Grade of B for phys-chem indicators.
Site Health Grade of A for microbial indicators.
No results exceeded the REHVs 100% of the time.
Results exceeding the REHVs >80% of the time oxidised-nitrogen.
Results exceeding the REHVs 50-80% of the time pH, total phosphorus and total nitrogen.
Site 046 – Unnamed Creek, Epping
Site Health Grade of C for phys-chem indicators.
Site Health Grade of D for microbial indicators.
Results exceeding the REHVs 100% of the time pH, total phosphorus, oxidised-nitrogen.
Results exceeding the REHVs >80% of the time electrical conductivity, total nitrogen, ammonium-nitrogen and faecal coliforms.
No results exceeded the REHVs 50-80% of the time.

41 HORNSBY SHIRE COUNCIL 2014-2015 WATER QUALITY MONITORING PROGRAM ANNUAL REPORT
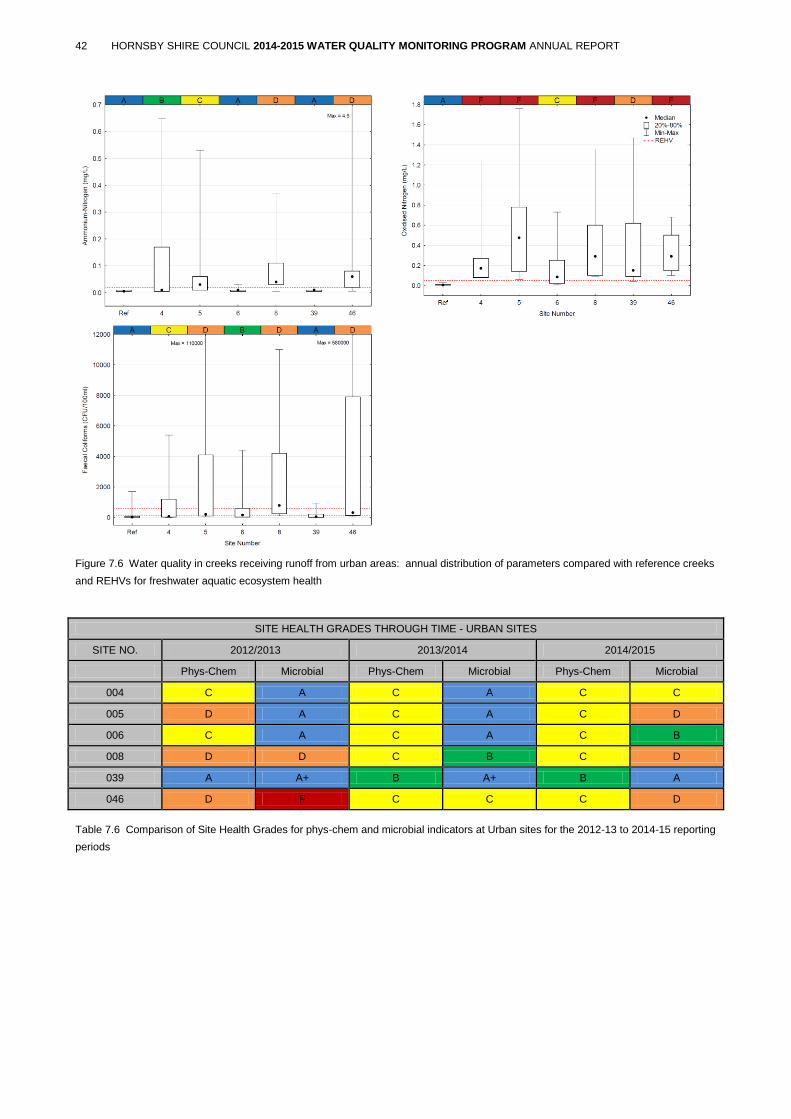
42 HORNSBY SHIRE COUNCIL 2014-2015 WATER QUALITY MONITORING PROGRAM ANNUAL REPORT
Figure 7.6 Water quality in creeks receiving runoff from urban areas: annual distribution of parameters compared with reference creeks
and REHVs for freshwater aquatic ecosystem health
SITE HEALTH GRADES THROUGH TIME - URBAN SITES
SITE NO. 2012/2013 2013/2014 2014/2015
Phys-Chem Microbial Phys-Chem Microbial Phys-Chem Microbial
004 C A C A C C
005 D A C A C D
006 C A C A C B
008 D D C B C D
039 A A+ B A+ B A
046 D F C C C D
Table 7.6 Comparison of Site Health Grades for phys-chem and microbial indicators at Urban sites for the 2012-13 to 2014-15 reporting
periods

43 HORNSBY SHIRE COUNCIL 2014-2015 WATER QUALITY MONITORING PROGRAM ANNUAL REPORT
7.2.6 Estuarine Sites
Thirteen estuarine sites were monitored in the lower
Hawkesbury River and its tributaries during the 2014-
15 period. Graphical comparisons of water quality
parameters against the REHVs are presented in Figure
7.7. Indicator Health Grades are displayed along the
top of the box plots. Subsequent Site Health Grades
and an overall Waterway Health Grade is presented in
Table 7.7. Summary statistics for these sites are
presented in Appendix F.
Water quality in estuarine waters within Hornsby Shire
is generally characterised by low levels of faecal
contamination, high suspended solids and elevated
nutrient concentrations higher in the tributaries. The
elevated nutrient levels higher in the tributaries reflect
the influence of urban and rural catchments on
receiving waters. Further downstream these impacts
are mitigated through a stronger influence of tidal
flushing. Nutrient sources include wastewater
treatment discharge from urban systems and fertiliser
use in the rural catchments. High suspended solids
and turbidity levels are indicative of a tide dominant
estuary with fine sediment that is easily resuspended.
Sites 038, 048 and 151 are located in relatively
shallow locations that have a bed load of
predominantly fine sediments.
Elevated chlorophyll-a levels at site 061 reflect the
high algal productivity in this location. It is thought
that the deep hole (~15m) at this locations reduces
the flushing capacity compared to the rest of Berowra
Creek which provides favourable conditions for algal
bloom propagation. Council undertakes continuous
remote monitoring of Chlorophyll-a levels within the
estuary, details of this monitoring are available in the
Hawkesbury Estuary Program Annual Report and
online www.hornsby.nsw.gov.au/waterquality.
Site dot-points below summarise which indicators
exceeded the REHV trigger values on the majority of
sampling occasions. This highlights the parameters
of most concern and provides an indication of the
types of catchment activities that may be impacting
the waterway.
Site 038 – Sandbrook Inlet
Overall Waterway Health Grade B
Results exceeding the trigger values 100% of the time suspended solids.
No results exceeded the trigger values >80% of the time.
Results exceeding the trigger values 50-80% of the time turbidity, oxidised-nitrogen and chlorophyll-a.
Site 048 – Marramarra Creek
Overall Waterway Health Grade C
No results exceeded the trigger values 100% of the time.
Results exceeding the trigger values >80% of the time suspended solids, turbidity, total nitrogen and ammonium-nitrogen.
Results exceeding the trigger values 50-80% of the time total phosphorus, oxidised-nitrogen and chlorophyll-a.
Site 055 – Brooklyn Baths
Overall Waterway Health Grade A.
Results exceeding the trigger values 100% of the time suspended solids.
Results exceeding the trigger values >80% of the time ammonium-nitrogen.
Results exceeding the trigger values 50-80% of the time turbidity.
Site 060 – Berowra Waters
Overall Waterway Health Grade B.
Results exceeding the trigger values 100% of the time total nitrogen.
Results exceeding the trigger values >80% of the time oxidised-nitrogen.
Results exceeding the trigger values 50-80% of the time dissolved oxygen, suspended solids, ammonium-nitrogen and chlorophyll-a.
Site 061 – Calabash Bay
Overall Waterway Health Grade B.
No results exceeded the trigger values 100% of the time.
Results exceeding the trigger values >80% of the time total nitrogen and chlorophyll-a.
Results exceeding the trigger values 50-80% of the time total phosphorus.
Site 100 – Crosslands Reserve
Overall Waterway Health Grade B.
Results exceeding the trigger values 100% of the time total nitrogen, ammonium-nitrogen and oxidised-nitrogen.
No results exceeded the trigger values >80% of the time.
Results exceeding the trigger values 50-80% of the time dissolved oxygen, total phosphorus.
Site 103 – Milsons Passage
Overall Waterway Health Grade A.
Results exceeding the trigger values 100% of the time suspended solids.
Results exceeding the trigger values >80% of the time oxidised-nitrogen.
Results exceeding the trigger values 50-80% of the time turbidity and ammonium-nitrogen.
Site 108 – Bradleys Beach, Dangar Island
Overall Waterway Health Grade A.
No results exceeded the trigger values 100% of the time.
Results exceeding the trigger values >80% of the time suspended solids.
Results exceeding the trigger values 50-80% of the time ammonium-nitrogen and oxidised-nitrogen.
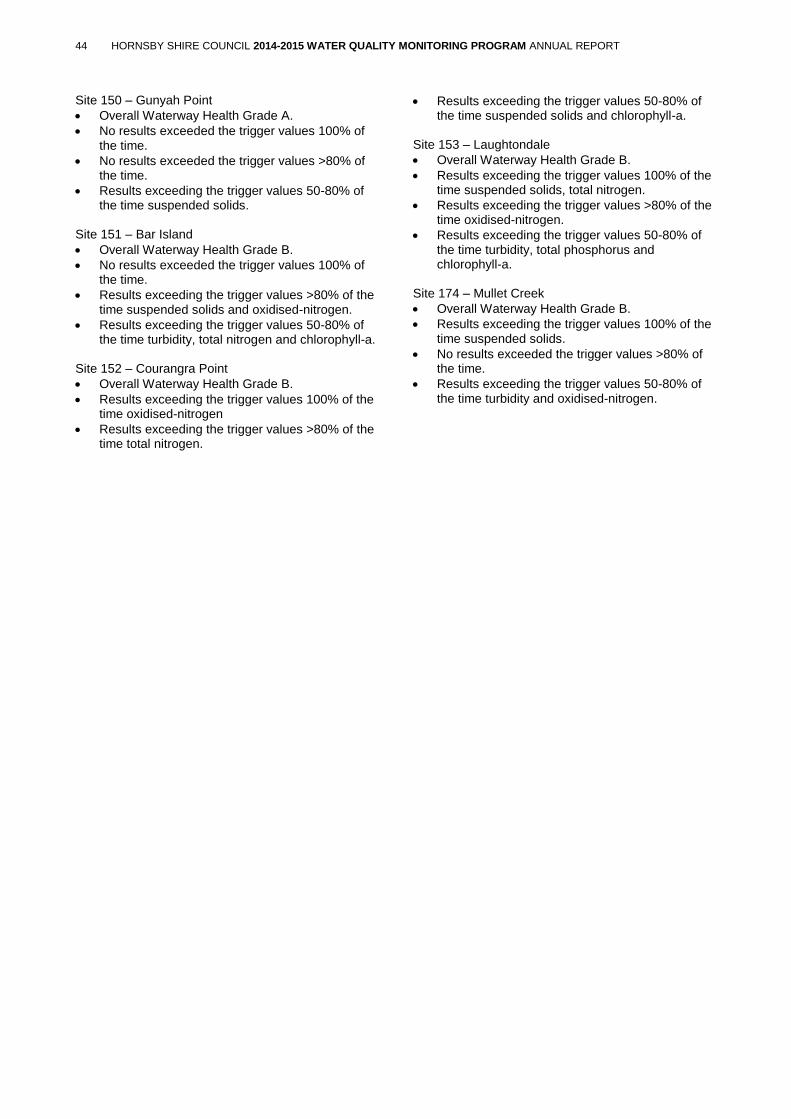
44 HORNSBY SHIRE COUNCIL 2014-2015 WATER QUALITY MONITORING PROGRAM ANNUAL REPORT
Site 150 – Gunyah Point
Overall Waterway Health Grade A.
No results exceeded the trigger values 100% of the time.
No results exceeded the trigger values >80% of the time.
Results exceeding the trigger values 50-80% of the time suspended solids.
Site 151 – Bar Island
Overall Waterway Health Grade B.
No results exceeded the trigger values 100% of the time.
Results exceeding the trigger values >80% of the time suspended solids and oxidised-nitrogen.
Results exceeding the trigger values 50-80% of the time turbidity, total nitrogen and chlorophyll-a.
Site 152 – Courangra Point
Overall Waterway Health Grade B.
Results exceeding the trigger values 100% of the time oxidised-nitrogen
Results exceeding the trigger values >80% of the time total nitrogen.
Results exceeding the trigger values 50-80% of the time suspended solids and chlorophyll-a.
Site 153 – Laughtondale
Overall Waterway Health Grade B.
Results exceeding the trigger values 100% of the time suspended solids, total nitrogen.
Results exceeding the trigger values >80% of the time oxidised-nitrogen.
Results exceeding the trigger values 50-80% of the time turbidity, total phosphorus and chlorophyll-a.
Site 174 – Mullet Creek
Overall Waterway Health Grade B.
Results exceeding the trigger values 100% of the time suspended solids.
No results exceeded the trigger values >80% of the time.
Results exceeding the trigger values 50-80% of the time turbidity and oxidised-nitrogen.

45 HORNSBY SHIRE COUNCIL 2014-2015 WATER QUALITY MONITORING PROGRAM ANNUAL REPORT

46 HORNSBY SHIRE COUNCIL 2014-2015 WATER QUALITY MONITORING PROGRAM ANNUAL REPORT
Figure 7.7 Water quality in estuarine areas: annual distribution of parameters compared with REHVs for estuarine aquatic ecosystem
health
Site No. Phys-Chem Bacteria Chlorophyll-a Waterway Health Grade
038 B A C B
048 C B C C
055 B A A A
060 B B C B
061 B A D B
100 C C A B
103 B A A A
108 B A A A
150 A A A A
151 B A C B
152 B A B B
153 C A C B
174 B A B B
Table 7.7 Waterway Health Grades for estuarine sites for the 2014-15 reporting period

47 HORNSBY SHIRE COUNCIL 2014-2015 WATER QUALITY MONITORING PROGRAM ANNUAL REPORT
7.2.7 Estuarine Phytoplankton Analysis
Phytoplankton samples were collected at seven (7)
sites in the Hawkesbury River ranging from marine to
predominantly fresh water sites (Figure 3.2). Analysis
of phytoplankton samples collected during this
reporting period showed a diverse range of species,
with significant variations in algal classes as a result
of decreasing salinity further up the river system.
Figure 7.8 shows the algal classes that are present at
each site for 10 or more months of the year. Site 153
has the most classes continually present and is also
the site that is most influence by fresh water. All sites
had between 5 and 7 algae classes present for 10 or
more months of the year whilst site 153 had 9
classes.
Five classes of microalgae were present at all sites for
10 or months of the year; Cryptophyceae,
Bacillariophyceae, Prymnesiophyceae, Dinophyceae
and Prasinophyceae.
Table 7.8 summarises the occurrences of potentially
harmful algae and comparisons with the current PALs.
Alexandrium sp. exceeded PAL levels in September
October and December of 2014. Dinophysis sp.
exceeded PAL levels in October and December of
2014 and February and March of 2015. Pseudo-
nitzschia sp. exceeded PAL levels in December 2014
and January 2015. Psuedo-nitzschiadelicatisma
group and Psuedo-nitzschia pungens/multiseries
were present all twelve months of the year.
The presence of harmful species is generally low
relative to the total number of algae species present in
the estuary as shown in Figure 7.9.
0
200000
400000
600000
800000
1000000
1200000
1400000
1600000
Jul-
14
Au
g-1
4
Sep
-14
Oct
-14
No
v-1
4
Dec
-14
Jan
-15
Feb
-15
Mar
-15
Ap
r-1
5
May
-15
Jun
-15
Ave
rage
Co
un
t (c
ells
/L)
Site 060
CRYPTOPHYCEAE PRYMNESIOPHYCEAE PRASINOPHYCEAE
BACILLARIOPHYCEAE DINOPHYCEAE OTHER
0
200000
400000
600000
800000
1000000
1200000
Jul-
14
Au
g-1
4
Sep
-14
Oct
-14
No
v-1
4
Dec
-14
Jan
-15
Feb
-15
Mar
-15
Ap
r-1
5
May
-15
Jun
-15
Ave
rage
Co
un
t (c
ells
/L)
Site 061
BACILLARIOPHYCEAE CRYPTOPHYCEAE PEDINELLOPHYCEAE PRYMNESIOPHYCEAE
PRASINOPHYCEAE DINOPHYCEAE EUGLENOPHYCEAE OTHER

48 HORNSBY SHIRE COUNCIL 2014-2015 WATER QUALITY MONITORING PROGRAM ANNUAL REPORT
0
50000
100000
150000
200000
250000
300000
Jul-
14
Au
g-1
4
Sep
-14
Oct
-14
No
v-1
4
Dec
-14
Jan
-15
Feb
-15
Mar
-15
Ap
r-1
5
May
-15
Jun
-15
Ave
rage
Co
un
t (c
ells
/L)
Site 150
CRYPTOPHYCEAE PRASINOPHYCEAE BACILLARIOPHYCEAE
PRYMNESIOPHYCEAE DINOPHYCEAE OTHER
0
50000
100000
150000
200000
250000
Jul-
14
Au
g-1
4
Sep
-14
Oct
-14
No
v-1
4
Dec
-14
Jan
-15
Feb
-15
Mar
-15
Ap
r-1
5
May
-15
Jun
-15
Ave
rage
Co
un
t (c
ells
/L)
Site 151
CRYPTOPHYCEAE PRASINOPHYCEAE BACILLARIOPHYCEAE PRYMNESIOPHYCEAE
DINOPHYCEAE EUGLENOPHYCEAE OTHER
0
200000
400000
600000
800000
1000000
1200000
Jul-
14
Au
g-1
4
Sep
-14
Oct
-14
No
v-1
4
Dec
-14
Jan
-15
Feb
-15
Mar
-15
Ap
r-1
5
May
-15
Jun
-15
Ave
rage
Co
un
t (c
ells
/L)
Site 152
CRYPTOPHYCEAE BACILLARIOPHYCEAE PRASINOPHYCEAE DINOPHYCEAE
PRYMNESIOPHYCEAE EUGLENOPHYCEAE OTHER
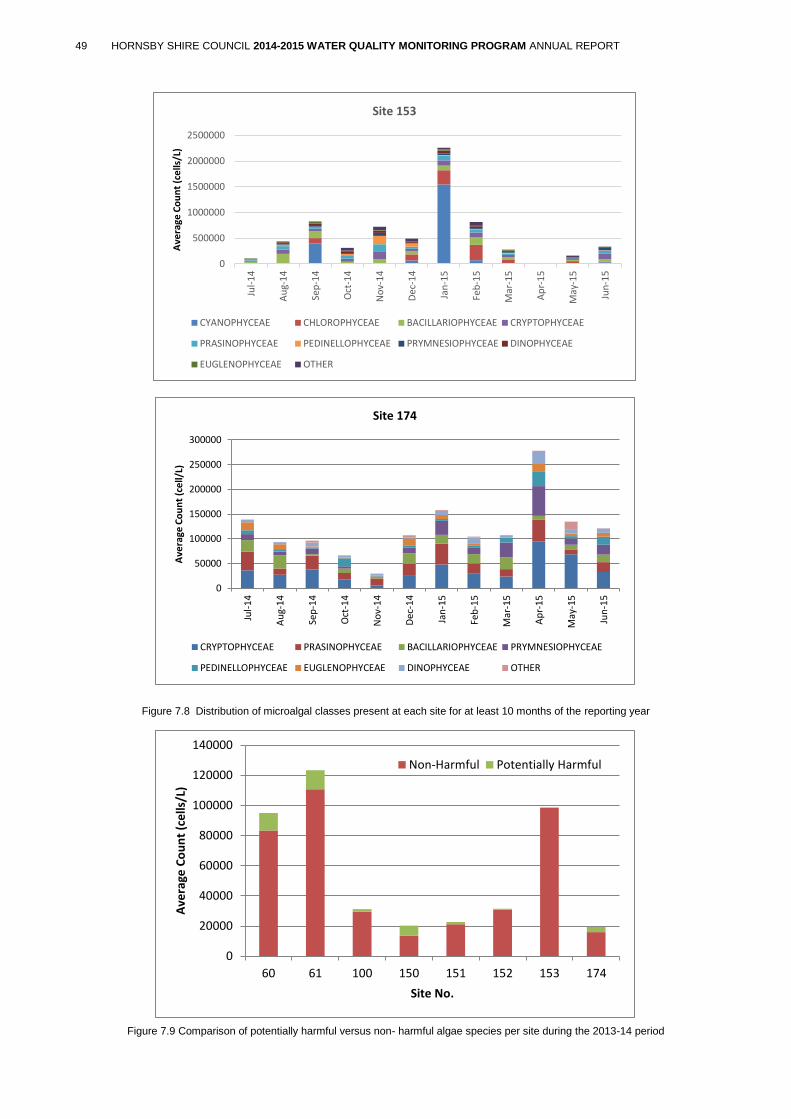
49 HORNSBY SHIRE COUNCIL 2014-2015 WATER QUALITY MONITORING PROGRAM ANNUAL REPORT
Figure 7.8 Distribution of microalgal classes present at each site for at least 10 months of the reporting year
Figure 7.9 Comparison of potentially harmful versus non- harmful algae species per site during the 2013-14 period
0
500000
1000000
1500000
2000000
2500000
Jul-
14
Au
g-1
4
Sep
-14
Oct
-14
No
v-1
4
Dec
-14
Jan
-15
Feb
-15
Mar
-15
Ap
r-1
5
May
-15
Jun
-15
Ave
rage
Co
un
t (c
ells
/L)
Site 153
CYANOPHYCEAE CHLOROPHYCEAE BACILLARIOPHYCEAE CRYPTOPHYCEAE
PRASINOPHYCEAE PEDINELLOPHYCEAE PRYMNESIOPHYCEAE DINOPHYCEAE
EUGLENOPHYCEAE OTHER
0
50000
100000
150000
200000
250000
300000
Jul-
14
Au
g-1
4
Sep
-14
Oct
-14
No
v-1
4
Dec
-14
Jan
-15
Feb
-15
Mar
-15
Ap
r-1
5
May
-15
Jun
-15
Ave
rage
Co
un
t (c
ell/
L)
Site 174
CRYPTOPHYCEAE PRASINOPHYCEAE BACILLARIOPHYCEAE PRYMNESIOPHYCEAE
PEDINELLOPHYCEAE EUGLENOPHYCEAE DINOPHYCEAE OTHER
0
20000
40000
60000
80000
100000
120000
140000
60 61 100 150 151 152 153 174
Ave
rage
Co
un
t (c
ells
/L)
Site No.
Non-Harmful Potentially Harmful

50 HORNSBY SHIRE COUNCIL 2014-2015 WATER QUALITY MONITORING PROGRAM ANNUAL REPORT
Genus Species Trigger Level
(cell/L) Jul 14 Aug 14 Sep 14 Oct 14 Nov 14 Dec 14 Jan 15 Feb 15 Mar 15 Apr 15 May 15 Jun 15
Total number of months present
A Amnesic
/ Paralytic
/ Diarrhetic / Shellfish Poisoning
Alexandrium catenella 200 E E P P P 5
minutum 200
E
P
2
tamarense 200
P
1
Dinophysis acuminata 1000 P P P E P P P
P
P 9
caudata 500 P P
P P E P E E P P P 11
tripos 500
P P
2
Phalachroma/Dinophysis rotundata 500
E P P P
4
Pseudo-nitzschia delicatissima group 500000 P P P P P P P P P P P P 12
fraudulenta 50000 P P
P
P
P
5
multistriata 50000 P P P P P E P P P
P 10
pungens/multiseries 50000 P P P P P E E P P P P P 12
subpacifica 50000 P
1
turgidula 50000
P
1
turgidula/dolorosa 50000 P P 2
B Toxicity Unclear
Alexandrium ostenfeldii
P P
P
P
4
pseudogonyaulax
P P P P
P P P
P
8
Chattonella sp.
P
P
P
P
4
Heterosigma akashiwo
P P
P P P P P P
8
Pseudochattonella sp.
P
1
Pseudo-nitzschia subpacifica
P
1
subpacifica/heimii
P
P
P
P 4
C Potential
Toxin Producer
Cochlodinium sp. P P P P P 5
Dictyocha octonaria
P P P P P P P P P
P
10
speculum
P
1
Karenia mikimoloi
P
1
mikimotoi
P P
P
3
papilionacea
P
1
sp.
P
P P P P
P 6
Karlodinium sp.
P
1
Lepidodinium chlorophorum
P
1
Lingulodinium polyedrum
P P P P P P
6
Mesoporus perforatus
P 1
Prorocentrum minimum/cordatum
P P P P P P P P P
P P 11
Protoceratium reticulatum
P P
P
3
Takayama pulchella P 1
D Toxicity Unlikely
Alexandrium fraterculus
P
P
P
P
4
insuetum
P P
2
margalefi
P P P P
P P P
P 8
Prorocentrum dentatum
P
1
Total number of potentially harmful algae species present per month 15 12 11 15 13 31 16 23 18 3 7 12 P Species is present with cell counts below trigger levels (Group A only) E Species is present with cell counts exceeding trigger levels (Group A only)
Species not present/recorded in that month
Table 7.8 Occurrence of harmful algal species compared to the NSW Food Authority Phytoplankton Alert Levels (PALs)

51 HORNSBY SHIRE COUNCIL 2014-2015 WATER QUALITY MONITORING PROGRAM ANNUAL REPORT
7.2.8 Wastewater Treatment Plant Sites
Sites upstream and downstream of local wastewater
treatment plants are monitored to investigate the
influence of treated and partially treated effluent
discharge on local creeks. Sites downstream of
wastewater treatment plants in Hornsby Shire are
generally characterised by high levels of nutrients and
increased electrical conductivity. The high electrical
conductivity results are due to dissolved salts used
during the sewage treatment process being
discharged to the creek. There is often an increase in
water temperature downstream of the treatment
plants as a result of wastewater being retained in
shallow maturation ponds and heated by exposure to
sunlight prior to being discharged. Suspended solids
and turbidity levels can decrease downstream of
discharge points, primarily due to the dilution factor of
the clear treated effluent mixing with more turbid
creek water flowing from disturbed catchments.
West Hornsby Wastewater Treatment Plant
One site upstream and two sites downstream (near
and far) of the West Hornsby WTP were monitored
during the 2014-15 period. Graphical comparisons of
water quality parameters against two long term
reference sites (Ref) and the REHVs are presented in
Figure 7.10. Indicator health grades are displayed
along the top of the box plots and subsequent site
health grades for physical-chemical and microbial
properties in Table 7.9. A comparison of the physical-
chemical and microbial Site Health Grades for the last
three reporting years is also presented in Table 7.9.
Summary statistics for these sites are presented in
Appendix F.
Site dot-points below summarise which indicators
exceeded the REHV trigger values on the majority of
sampling occasions. This highlights the parameters
of most concern and provides an indication of the
types of catchment activities that may be impacting
the waterway.
Site 023 – Waitara Creek (upstream WHWTP)
Site Health Grade of C for phys-chem parameters. No change from 2013-14.
Site Health Grade of D for microbial parameters.
Results exceeding the REHVs 100% of the time total phosphorus and total nitrogen.
Results exceeding the REHVs >80% of the time faecal coliforms.
Results exceeding the REHVs 50-80% of the time pH and oxidised nitrogen.
Site 045 – Berowra Creek (near downstream WHWTP)
Site Health Grade of C for phys-chem parameters. No change from 2013-14.
Site Health Grade of C for microbial parameters.
Results exceeding the REHVs 100% of the time electrical conductivity, pH, total phosphorus, total nitrogen and oxidised nitrogen.
No results exceeded the REHVs >80% of the time.
Results exceeding the REHVs 50-80% of the time faecal coliforms.
Site 001 – Berowra Creek (further downstream WHWTP)
Site Health Grade of C for phys-chem parameters. No change from 2013-14.
Site Health Grade of D for microbial parameters.
Results exceeding the REHVs 100% of the time total phosphorus, total nitrogen and oxidised nitrogen.
Results exceeding the REHVs >80% of the time pH.
Results exceeding the REHVs 50-80% of the time electrical conductivity and faecal coliforms.

52 HORNSBY SHIRE COUNCIL 2014-2015 WATER QUALITY MONITORING PROGRAM ANNUAL REPORT

53 HORNSBY SHIRE COUNCIL 2014-2015 WATER QUALITY MONITORING PROGRAM ANNUAL REPORT
Figure 7.10 Water quality at creeks associated with West Hornsby wastewater treatment plant discharge: annual distribution of selected
parameters compared to reference sites and REHVs for freshwater aquatic ecosystem health
SITE HEALTH GRADES THROUGH TIME - WHWTP SITES
SITE NO. 2012/2013 2013/2014 2014/2015
Phys-Chem Microbial Phys-Chem Microbial Phys-Chem Microbial
023 D C C C C D
045 C B C B C C
001 D A+ C A+ C C
Table 7.9 Comparison of Site Health Grades for phys-chem and microbial indicators at West Hornsby WTP sites for the 2012-13 to
2014-15 reporting periods
54 HORNSBY SHIRE COUNCIL 2014-2015 WATER QUALITY MONITORING PROGRAM ANNUAL REPORT
Hornsby Heights Wastewater Treatment Plant
One site upstream and one site downstream of the
Hornsby Heights WTP were monitored during the
2014-15 period. Graphical comparisons of water
quality parameters against two long term reference
sites (Ref) and the REHVs are presented in Figure
7.11. Indicator health grades are displayed along the
top of the box plots and subsequent site health grades
for physical-chemical and microbial properties are
presented in Table 7.10. A comparison of the physical-
chemical and microbial Site Health Grades for the last
three reporting years is also presented in Table 7.10.
Summary statistics are presented in Appendix F.
Site dot-points below summarise which indicators
exceeded the REHV trigger values on the majority of
sampling occasions. This highlights the parameters
of most concern and provides an indication of the
types of catchment activities that may be impacting
the waterway.
Site 052 – Calna Creek (upstream HHWTP)
Site Health Grade of B for phys-chem parameters.
Site Health Grade of D for microbial parameters.
No results exceeded the REHVs 100% of the time.
Results exceeding the REHVs >80% of the time pH, total phosphorus and faecal coliforms.
Results exceeding the REHVs 50-80% of the time total nitrogen and oxidised nitrogen.
Site 043 – Calna Creek (downstream HHWTP)
Site Health Grade of C for phys-chem parameters.
Site Health Grade of A+ for microbial parameters.
Results exceeding the REHVs 100% of the time electrical conductivity, pH, total phosphorus, total nitrogen and oxidised nitrogen.
No results exceeded the REHVs >80% of the time.
No results exceeded the REHVs 50-80% of the time.
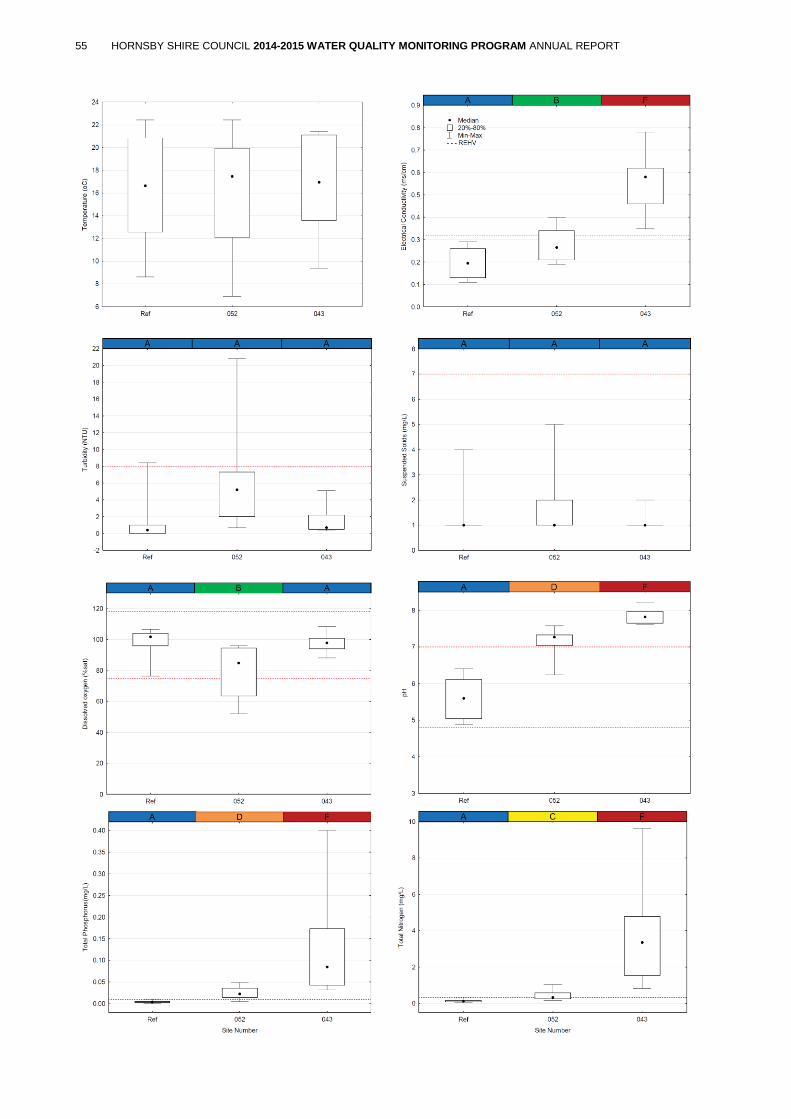
55 HORNSBY SHIRE COUNCIL 2014-2015 WATER QUALITY MONITORING PROGRAM ANNUAL REPORT

56 HORNSBY SHIRE COUNCIL 2014-2015 WATER QUALITY MONITORING PROGRAM ANNUAL REPORT
Figure 7.11 Water quality at creeks associated with West Hornsby wastewater treatment plant discharge: annual distribution of selected
parameters compared to reference sites and REHVs for freshwater aquatic ecosystem health
SITE HEALTH GRADES THROUGH TIME – HHWTP SITES
SITE NO. 2012/2013 2013/2014 2014/2015
Phys-Chem Microbial Phys-Chem Microbial Phys-Chem Microbial
052 B D B A B D
043 C A+ C A+ C A+
Table 7.10 Comparison of Site Health Grades for phys-chem and microbial indicators at Hornsby Heights WTP sites for the 2012-13 to
2014-15 reporting periods

57 HORNSBY SHIRE COUNCIL 2014-2015 WATER QUALITY MONITORING PROGRAM ANNUAL REPORT
7.3 Catchment Remediation Initiatives
7.3.1 Stormwater Harvesting and Reuse
The performance of stormwater harvesting facilities is
dependent on regular maintenance to prevent
equipment deterioration and failures and to ensure
systems are operating satisfactorily. There has been
an improvement in operation efficiencies following the
introduction of a preventative maintenance program in
2013. Results for this reporting period indicate that
high turbidity levels at Somerville Oval may be
hindering the treatment process and should be
investigated further. During dry periods or when a
treatment process is not operating effectively the
facilities are set to ‘top up’ with potable water. This
process is monitored by recording fluoride levels in
the treated water (Table 7.11). A fluoride result of
0.1mg/L indicated approximately 10% potable water in
the sample. Fluoride results from this reporting period
indicate the amount of potable water in the systems at
North Epping Oval, Epping Oval and Greenway Park
are still of concern.
Graphical comparisons of selected water quality
parameters against trigger values for stormwater
harvesting and reuse are presented in Figure 7.12.
Summary statistics for these sites are presented in
Appendix F.
Table 7.11 Water quality of the treated water component of stormwater harvesting and reuse systems
Berowra Oval – Site 128 (raw) and 131 (treated)
Reduction in faecal coliform count from raw to
treated samples
Very low levels of potable water evident
System working well
Greenway Park – Site 120 (raw) and 121 (treated)
Low faecal coliform counts in both raw and
treated samples
Very high levels of potable water evident in
treated tanks
System requires some investigation
Epping Oval – Site 134 (raw) and 137 (treated)
Low faecal coliform counts in both raw and
treated samples
Approximately 50% potable water evident in
treated tanks
System may require some further investigation
Nth Epping Oval – Site 138 (raw) and 141 (treated)
Significant reduction in faecal coliform count from
raw to treated samples
Approximately 50% potable water evident in
treated tanks
System may require further investigation
regarding potable water use but disinfection
working well
Somerville Oval – Site 142 (raw) and 145 (treated)
Some reduction in faecal coliform count from raw
to treated samples
Very low levels of potable water evident
High turbidity in both raw and treated samples
which may be inhibiting the disinfection process
System may require some further investigation
into the turbidity levels.
Community Nursery – Site 180 (raw) and 098
(treated)
Due to a contamination incident this site has not
been routinely monitored during this reporting
period. The system became operational in early
2015 however there is not enough data for
analysis at this time.
Test Parameter Trigger Value Valid N Nth Epping Epping Somerville Greenway Berowra
141 137 145 121 131
Fluoride (mg/L) >0.1 12 0.47 0.48 0.20 0.85 0.19
Electrical Conductivity (µS/cm) >2000 12 352.92 230.77 254.08 210.31 303.85
Chloride (mg/L) >175 5 37.00 23.67 31.00 26.50 38.50
Turbidity (NTU) >10 12 0.47 1.27 41.93 1.98 0.42
Suspended Solids (mg/L) >50 5 1.00 1.50 5.00 1.33 1.00
Bicarbonate Alkalinity (mg/CaCO3/L) >350 2 91.00 83.00 48.80 31.20 50.70
Iron (mg/L) >10 2 0.03 0.06 1.10 0.005 0.04
Total Phosphorus(mg/L) >0.8 5 0.07 0.13 0.01 0.03 0.02
Faecal Coliforms (CFU/100ml) >10 12 1.00* 0.50* 6.00* 0.50* 3.00*
*Mean values given, except for Faecal Coliforms where median value is listed
Acceptable
Potential Issue
Problematic, investigate further

58 HORNSBY SHIRE COUNCIL 2014-2015 WATER QUALITY MONITORING PROGRAM ANNUAL REPORT
Figure 7.12 Water quality in stormwater harvesting and reuse systems: annual distribution of selected parameters comparing raw and
treated stormwater
120 121 128 131 134 137 138 141 142 145
Site No.
0
50
100
150
200
250
300
350
400
Fa
eca
l C
olif
orm
s (
CF
U/1
00
ml)
Max = 1600
Max = 450000
Max = 7800
Max = 4300
120 121 128 131 134 137 138 141 142 145
Site No.
0
20
40
60
80
100
Tu
rbid
ity (
NT
U)
Max = 205.9
Median
20%-80%
Min-Max
- - - Trigger Value
120 121 128 131 134 137 138 141 142 145
Site No.
100
200
300
400
500
600
Ele
ctr
ica
l C
on
du
ctivity (
µS
/cm
)

59 HORNSBY SHIRE COUNCIL 2014-2015 WATER QUALITY MONITORING PROGRAM ANNUAL REPORT
7.3.2 Landfill Sites
Seven (7) sites were monitored at three disused landfill locations during the 2014-2015 period; Wisemans Ferry, Arcadia Oval and Foxglove Oval. Arcadia Oval and Wisemans Ferry are monitored quarterly and Foxglove Oval is monitored monthly. Data from monitoring at Wisemans Ferry is incorporated into the Infrastructure and Recreation Division’s report to the NSW EPA and not reported here.
Arcadia Oval Two (2) sites were monitored at Arcadia Oval to assess the effectiveness of the leachate capture and treatment system in place. As these sites are
sampled quarterly (i.e. N=4) is more suitable to present the limited data in a table, not a box plot. Table 7.12 presents data from site 018 which is raw leachate and Table 7.13 presents data from site 094 which is treated leachate.
Turbidity and suspended solids are reduced to below trigger values leachate treatment.
Faecal coliforms are reduced to below trigger values following leachate treatment.
Total nitrogen and ammonium-nitrogen are slightly reduced in treated leachate.
Oxidised-nitrogen increased in treated leachate.
Summary statistics for site 018 - raw leachate at Arcadia Ocal
Site 018 Valid N Mean Median Minimum Maximum Percentile Percentile Std.Dev.
20 80
Temperature (oC) 4 18.398 18.665 14.200 22.060 14.200 22.060 3.238
Electrical Conductivity (µS/cm) 4 1123.750 1112.000 906.000 1365.000 906.000 1365.000 231.187
pH 4 6.750 6.770 6.650 6.810 6.650 6.810 0.071
Turbidity (NTU) 4 22.525 17.450 4.500 50.700 4.500 50.700 20.666
Dissolved oxygen (%sat) 4 19.725 12.550 2.100 51.700 2.100 51.700 23.310
Suspended Solids (mg/L) 4 21.250 20.500 4.000 40.000 4.000 40.000 17.462
Ammonium-Nitrogen (mg/L) 4 10.350 10.275 7.550 13.300 7.550 13.300 3.125
Oxidised Nitrogen (mg/L) 4 1.990 2.005 0.700 3.250 0.700 3.250 1.048
Total Nitrogen (mg/L) 4 13.568 14.000 8.470 17.800 8.470 17.800 4.313
Total Phosphorus(mg/L) 4 0.023 0.018 0.013 0.044 0.013 0.044 0.014
Faecal Coliforms (CFU/100ml) 4 55.250 13.000 5.000 190.000 5.000 190.000 90.005
Table 7.12 Summary statistics for raw leachate at Arcadia Oval for the 2014-15 reporting period
Summary statistics for site 094 - raw leachate at Arcadia Ocal
Site 094 Valid N Mean Median Minimum Maximum Percentile Percentile Std.Dev.
20 80
Temperature (oC) 4 17.470 17.625 13.010 21.620 13.010 21.620 3.527
Electrical Conductivity (µS/cm) 4 1123.750 1099.000 1053.000 1244.000 1053.000 1244.000 85.718
pH 4 7.663 7.655 7.630 7.710 7.630 7.710 0.036
Turbidity (NTU) 4 2.475 0.150 0.100 9.500 0.100 9.500 4.684
Dissolved oxygen (%sat) 4 41.600 41.400 15.000 68.600 15.000 68.600 29.429
Suspended Solids (mg/L) 4 2.250 1.000 1.000 6.000 1.000 6.000 2.500
Ammonium-Nitrogen (mg/L) 4 8.180 8.185 4.550 11.800 4.550 11.800 3.556
Oxidised Nitrogen (mg/L) 4 5.170 5.890 2.300 6.600 2.300 6.600 1.957
Total Nitrogen (mg/L) 4 14.075 14.350 10.700 16.900 10.700 16.900 2.554
Total Phosphorus(mg/L) 4 0.013 0.012 0.010 0.020 0.010 0.020 0.005
Faecal Coliforms (CFU/100ml) 4 2.125 1.000 0.500 6.000 0.500 6.000 2.594
Table 7.13 Summary statistics for treated leachate at Arcadia Oval for the 2014-15 reporting period
Foxglove Oval Four sites were monitored at Foxglove Oval to assess the effectiveness of the leachate capture, treatment and resuse system. Site 077 is an urban creek downstream of Foxglove Oval. Site 095 is raw captured leachate, site 096 is leachate that has been treated by a bioreactor for nutrients and site 132 is the treated tank that is used for oval irrigation. Graphical comparisons of water quality parameters against stormwater harvesting and irrigation guideline trigger values and the REHVs are presented in Figure
7.13.
Fluoride results show that the treated leachate is not being used for irrigation as the treated tank (132) results indicate 100% potable water on all sampling occasions.
Electrical conductivity and turbidity results show that the bioreactor is treating the leachate to a level below stormwater harvesting and reuse trigger values.
Total nitrogen and ammonium-nitrogen are both significantly reduced through treatment in the bioreactor.
Levels of nitrogen in Gleeson Creek are well above REHVs indicating some impacts from the landfill are still occurring.
High faecal coliform results in Gleeson Creek (077) and in the treated leachate pit (096) indicate there may a source of faecal contaminants in the catchment which could require further investigated.

60 HORNSBY SHIRE COUNCIL 2014-2015 WATER QUALITY MONITORING PROGRAM ANNUAL REPORT
Figure 7.13 Quality of leachate from Foxglove Oval disused landfill site: annual distribution of selected parameters compared with
REHVs for freshwater aquatic ecosystem health
77 095 096 132
Site No.
0.0
0.2
0.4
0.6
0.8
1.0
1.2
Flu
orid
e (
mg
/L)
Median
20%-80%
Min-Max
- - - Trigger Value
77 095 096 132
Site No.
0
200
400
600
800
1000
1200
1400
1600
1800
2000
2200
2400
2600
Ele
ctr
ica
l C
on
du
ctivity (
µS
/cm
)
Median
20%-80%
Min-Max
- - - Trigger Value
77 095 096 132
Site No.
0
20
40
60
80
100
120
140
160
180
Tu
rbid
ity (
NT
U)
Median
20%-80%
Min-Max
- - - Trigger Value
77 095 096 132
Site No.
6.6
6.8
7.0
7.2
7.4
7.6
7.8
8.0
8.2
8.4
8.6
8.8
pH
77 095 096 132
Site No.
0
20
40
60
80
100
120
To
tal N
itro
ge
n (
mg
/L)
Median
20%-80%
Min-Max
- - - REHVs
77 095 096 132
Site No.
0
20
40
60
80
100
Am
mo
niu
m-N
itro
ge
n (
mg
/L)
Median
20%-80%
Min-Max
- - - REHV
77 095 096 132
Site No.
-2
0
2
4
6
8
10
12
Oxid
ise
d N
itro
ge
n (
mg
/L)
Median
20%-80%
Min-Max
- - - REHVs
77 095 096 132
Site No.
0
500
1000
1500
2000
2500
3000
Fa
eca
l C
olif
orm
s (
CF
U/1
00
ml)
Median
20%-80%
Min-Max
- - - Trigger Value
61 HORNSBY SHIRE COUNCIL 2014-2015 WATER QUALITY MONITORING PROGRAM ANNUAL REPORT
8. Summary
Chemical, physical and biological water quality results
for 2014-2015 show that catchment land-use and
rainfall play a major role in the aquatic ecosystem
health of the Shire’s waterways. Rainfall contributed
to the transport and deposition of land base pollutants
such as sediment, nutrients and gross pollutants
(litter) in streams, creeks and rivers. This is especially
significant in areas with piped stormwater
infrastructure where run-off moves rapidly and directly
to the receiving waters.
Water quality results for the 2014-2015 reporting
period have been assessed against REHVs
developed specifically for Hornsby Shire (HSC 2012).
Due to higher annual rainfall and a number of
significant rainfall events many sites show a decline
compared to results from last year. REHVs are being
exceeded at most sites across the Shire, indicating
the potential for impacts to aquatic ecosystem health.
Stormwater and sewage from overflows or failing
infrastructure continue to be a problem in industrial
and urban catchments where large areas of
impervious surfaces and piped stormwater systems
move catchment based pollutants quickly and directly
to the receiving creeks. Onsite wastewater
management systems continue to place stress on
waterways in rural settlements, particularly the
townships of Galston and Glenorie. Rural catchment
activities such as the intensive use of fertilisers and
reduced vegetation are impacting on receiving waters
further downstream. Despite significant upgrades to
the West Hornsby and Hornsby Heights STPs in early
2000, both Berowra Creek and Calna Creek are
impacted by treated effluent being discharged into
these systems. Water quality results for estuarine
areas are generally good however the upper sections
of Marramarra and Berowra Creeks show signs of
impacts from the upper catchments.
Ongoing maintenance and monitoring of stormwater
harvesting and reuse facilities will reduce the use of
potable water for irrigating playing ovals and prevent
the flow of contaminated stormwater to urban creeks
having positive outcomes for both aquatic ecosystem
health and water conservation.
It is expected that a number of changes will be made
to the current water quality monitoring program and
reporting following the extensive program review that
commenced in 2014. The revised program should be
implemented by July 2016.

62 HORNSBY SHIRE COUNCIL 2014-2015 WATER QUALITY MONITORING PROGRAM ANNUAL REPORT
9. Acronyms
ANZECC Australian and New Zealand Environmental and Conservation Council
ARI Average Recurrence Interval
ARMCANZ Agriculture and Resources Management Council of Australia and New Zealand
BOD Biochemical Oxygen Demand
BOM Bureau of Meteorology
CFU Colony Forming Units
CRR Catchment Remediation Rate
DO Dissolved Oxygen
EC Electrical Conductivity
NH3-N Ammonia-Nitrogen
NHMRC National Health and Medical Research Council
NOx Oxidised Nitrogen
NWQMS National Water Quality Management Strategy
PAL Phytoplankton Action Levels
QA/QC Quality Assurance / Quality Control
RACC Regional Algal Coordinating Committee
REHV Regional Environmental Health Value
SCEW Standing Council on Environment and Water
SoJI Statement of Joint Intent
SWC Sydney Water Corporation
TN Total Nitrogen
TP Total Phosphorus
WTP Wastewater Treatment Plant

63 HORNSBY SHIRE COUNCIL 2014-2015 WATER QUALITY MONITORING PROGRAM ANNUAL REPORT
10. References ANZECC/ARMCANZ 2000. Australian and New Zealand Guidelines for Fresh and Marine Water Quality. National
Water Quality Management Strategy. Australian and New Zealand Environment Council & Agriculture and Resource Management Council of Australia and New Zealand, Canberra.
APHA 2005. Standard Methods for the Examination of Water and Wastewater. APHA, AWWA and WF. Eds. Eaton, A.D., Clesceri, L.S., Rice, E.W and Greenberg, A.E.
Coad, P. W. 2012. Prediction of estuarine algal blooms using Artificial Neural Networks PhD Thesis. University of New South Wales, School of Civil and Environmental Engineering.
Department of Environment 2015. National Water Quality Management Strategy. Department of Sustainability, Environment, Water, Population and Communities. Accessed August 2015. http://environment.gov.au/water/policy-programs/nwqms/index.html
NSW DECCW 2006. NSW Water Quality and River Flow Objectives. Department of Sustainability, Environment, Water, Population and Communities. Accessed August 2015. http://www.environment.nsw.gov.au/ieo/index.htm
Ecowise Environmental 2010. Risk Management Plan for Pumping Hornsby Quarry and Review of Impacts. Report Prepared for Hornsby Shire Council.
HSC 2011. Water Quality Monitoring Program 2010-2011 Annual Report. Water Catchments Team, Hornsby Shire Council.
HSC 2012. Companion Technical Report: Water Quality Report Card 2012. Hornsby Shire Council.
HSC 2013. Your Community Plan 2013 – 2023. Hornsby Shire Community Strategic Plan. Hornsby Shire Council.
NHMRC 2008. National Water Quality Management Strategy: Guidelines for Managing Risks in Recreational Waters. National Health and Medical Research Council. Australian Government.
NHMRC and NRMMC 2011. National Water Quality Management Strategy: Australian Drinking Water Guidelines 6. National Health and Medical Research Council and Natural Resource Management Ministerial Council. Australian Government.
NRMMC et at 2009. National Water Quality Management Strategy: Australian Guidelines for Water Recycling: Managing Health and Environmental Risks Stormwater Harvesting and Reuse. Natural Resource Management Ministerial Council, Environment Protection and Heritage Council and National Health and Medical Research Council. Australian Government.
NSW DECCW 2010. New South Wales Natural Resources Monitoring, Evaluation and Reporting Strategy 2010-2015. NSW Department of Environment, Climate Change and Water, Sydney.
NSW Food Authority 2014. Marine Biotoxin Management Plan NSW Shellfish Program.
RACC 2009 (draft). Metropolitan South Coast Regional Algal Co-ordinating Committee. Guidelines for Management Response to Marine and Freshwater Algal Blooms. For application in the Sydney Metropolitan South Coast Catchments. NSW Office of Water.
Sanders, T.G., Ward, R.C., Loftis, J.C., Steele, T.D. Adrian, D.D. and Yevjevich, Y. (1983). Design of Networks for Monitoring Water Quality. Water Resources Publications, Littleton, Colorado, USA.
Sidhu, J.P.S., Ahmed, W., Gernjak, W., Aryal, R., McCarthy, D., Palmer, A., Kolotelo, D. and Toze, S. 2013. Sewage pollution in urban stormwater runoff as evident from the widespread presence of multiple microbial and chemical source tracking markers. Science of the Total Environment 463–464 (2013) 488–496
Storm Consulting 2012(a). Stormwater Harvesting Management Plan – Berowra Oval. Prepared for Hornsby Shire Council. Storm Consulting Pty Ltd, Pymble.
Storm Consulting 2012(b). Stormwater Harvesting Management Plan – Epping Oval. Prepared for Hornsby Shire Council. Storm Consulting Pty Ltd, Pymble.
Storm Consulting 2012(c). Stormwater Harvesting Management Plan – Foxglove Oval. Prepared for Hornsby Shire Council. Storm Consulting Pty Ltd, Pymble.
Storm Consulting 2012(d). Stormwater Harvesting Management Plan – Greenway Park. Prepared for Hornsby Shire Council. Storm Consulting Pty Ltd, Pymble.
Storm Consulting 2012(e). Stormwater Harvesting Management Plan – North Epping Oval. Prepared for Hornsby Shire Council. Storm Consulting Pty Ltd, Pymble.

64 HORNSBY SHIRE COUNCIL 2014-2015 WATER QUALITY MONITORING PROGRAM ANNUAL REPORT
Storm Consulting 2012(f). Stormwater Harvesting Management Plan – Somerville Oval. Prepared for Hornsby Shire Council. Storm Consulting Pty Ltd, Pymble.
Storm Consulting 2012(g). Stormwater Harvesting Management Plan – The Nursery. Prepared for Hornsby Shire Council. Storm Consulting Pty Ltd, Pymble.
Suthers, I.M. and Rissik, D. (Eds) 2009. Plankton: A guide to their ecology and monitoring for water quality. CSIRO Publishing, VIC.
Sydney Water 2015. Wastewater Treatment Plants. Accessed September 2015. http://www.sydneywater.com.au/SW/water-the-environment/how-we-manage-sydney-s-water/wastewater-network/wastewater-treatment-plants/index.htm
Tang, J.Y.M., Aryal, R., Deletic, A., Gernjak, W., Glenn, E., McCarthy, D., and Escher, B.I. 2013. Toxicity characterization of urban stormwater with bioanalytical tools. Water Research, Volume 47, Issue 15, 1 October 2013, Pages 5594-5606.
Wong, T H F (Editor in Chief) 2006. Australian Runoff Quality – A Guide to Water Sensitive Urban Design. Engineers Australia.
Wright I. 2011. Review of Hornsby Council’s Aquatic Ecosystem Program (2002-2007) Macroinvertebrates and Diatoms. Report prepared for Hornsby Shire Council.

65 HORNSBY SHIRE COUNCIL 2014-2015 WATER QUALITY MONITORING PROGRAM ANNUAL REPORT
11. Appendices

66 HORNSBY SHIRE COUNCIL 2014-2015 WATER QUALITY MONITORING PROGRAM ANNUAL REPORT
Appendix A – Extract from Original Statement of Joint Intent

67 HORNSBY SHIRE COUNCIL 2014-2015 WATER QUALITY MONITORING PROGRAM ANNUAL REPORT

68 HORNSBY SHIRE COUNCIL 2014-2015 WATER QUALITY MONITORING PROGRAM ANNUAL REPORT
Appendix B - Detailed site descriptions of freshwater and estuarine sites monitored for aquatic ecosystem health
Reference Creeks
Site 36 Murray Anderson Creek. Site 36 is located in Murray Anderson Creek, which is a of Smiths Creek within
the Cowan Creek catchment. Access is via boat from Cowan Creek with a short walk to the site. The catchment
above this site is approximately 250 hectares in size, all within Ku-ring-gai Chase National Park. This site has
been sampled since 1995.
Site 37 Smugglers Creek. Site 37 is located in Smugglers Creek, which is a tributary of Marramarra Creek within
the Berowra Creek catchment. Access is via boat up Marramarra Creek and then on foot approximately 500m
upstream. The catchment above this site is approximately 533 hectares in size, all within Marramarra National
Park. This site has been sampled since 1995.
Site 54 Laughtondale Creek. Site 54 is located in Laughtondale Creek on the northern boundary of Marramarra
National Park. Access is via Laughtondale Gully Rd. The catchment is approximately 312 hectares which has
about 10% cleared land under horticulture. There is a gravel road running beside the creek for much of its length.
During wet weather the creek can contain fresh coarse sediment washed off from the road. The creek flows
through a narrow gully with a series of shallow pools of sandstone bedrock. The site was used as a reference site
between 1996 and 2002, sampling of this site commenced again in 2011.
Site 114 Muogamarra Creek. Site 114 is located within Muogamarra Creek within Muogamarra Nature Reserve.
The catchment is approximately 305 hectares of undisturbed bushland valley with sandstone geology. Access is
by 4WD down Peats Trail from the Pacific Highway then by foot on a bush track for about 1 kilometre. The site is
in a shady, freshwater section of the creek approximately, 100m upstream of the saltwater marsh of Peats Bight.
The creek has crystal clear base flow, but surface water may cease in drought conditions, leaving stagnant pools.
Site 123 Peats Crater. Site 123 is located in an unnamed creek draining Peats Crater, here referred to as ‘Peats
Crater Creek’, in Muogamarra Nature Reserve. Although its catchment size (at approximately 90 hectares) is not
large, this site was chosen because of its predominantly basalt geology. The catchment includes exposure of
igneous rock in a diatreme. The central part of the valley (crater) was cleared for farming in the late 1800’s, but
since the area was declared a Nature Reserve it has been undergoing natural revegetation. Access is by 4WD
down Peats Trail from the Pacific Highway then by foot on a bush track for about 200m. Near the sample site the
creek flows through a densely shaded gully and does not have a permanent base flow, drying out occasionally
during drought conditions.
Site 147 Unnamed Creek. Site 147 is located in an unnamed creek, here referred to as ‘Pennant Hills Oval
Creek’, which flows into Byles Creek from a small bushland catchment of about 33 hectares adjacent to the
Pennant Hills Oval complex. This small creek flows after rainy periods but periodically dries out. It is in sandstone
geology and the sample site has wide shallow pools on bare sandstone bedrock. It is believed to be the only
remaining subcatchment of Lane Cove River that has not been subjected to degradation by urban development.
Access to this site is along a walking track about 200m from the end of Day Rd, Cheltenham.
Site 149 Unnamed Creek. Site 149 is located in an unnamed creek in Canoelands, here referred to as ‘Duckpond
Ridge Creek’, which flows through predominantly undisturbed bushland in sandstone geology within Marramarra
National Park. The catchment is approximately 760 hectares and is bound by Duckpond Ridge, the Old Northern
Road and Canoelands Ridge. Some relatively small areas (about 10%) of the catchment in its headwaters along
Old Northern Road and Canoelands Road have been cleared for sand extraction and horticulture. The creek at
the sample site is in a deep rocky gully, heavily shaded and with sandstone boulders covered in brown diatom
growth. Access to the site is by 4WD to the north-eastern end of Duckpond Ridge fire trail and then a short walk
through bushland.
Site 164 Djarra Crossing. Site 164 is located in the north arm of Joe Crafts Creek in Muogamarra Nature Reserve.
The catchment is 90 hectares in undisturbed bushland in sandstone geology. Access is by 4WD from Glendale
Road, Cowan and down the western fire trail to the creek crossing. The creek at the sample site is predominantly
bare sandstone bedrock open to midday sunlight. Water flow may cease during drought conditions, although this
has not occurred since monitoring started in May 2011.

69 HORNSBY SHIRE COUNCIL 2014-2015 WATER QUALITY MONITORING PROGRAM ANNUAL REPORT
Industrial Sites
Site 10 Larool Creek, Thornleigh. The headwaters of Larool Creek originate within the Thornleigh industrial area
and flow in a northerly direction until it intersects Waitara Creek west of Hornsby. Site 10 on Larool Creek is about
100m downstream of Sefton Road. The catchment above this site is small, approximately 38 hectares, of which
34% is zoned residential, 51% is zoned commercial/business/industrial, 13% is open space and 2% is special
uses. As indicated by the long term water quality monitoring results, this creek has received a consistent level of
pollution which has resulted in poor water quality for many years. This creek consistently remains one of the most
polluted within Hornsby Shire. This site has been sampled since October 1994.
Site 12 Hornsby Creek, Hornsby. Site 12 is located in Hornsby Creek, upstream of the road bridge at Leighton
Place and flows into Ku-ring-gai Chase National Park. The catchment above this site is approximately 305
hectares in size and 60% of the landuse is residential comprising high, medium and low density residential
zonings. Commercial/Industrial/Business makes up 17%, 10% is Special use A (roads, rail etc), 10% is Special
use B (community purposes) and 2% is open space. This highly urbanised catchment contains large areas of
impervious surfaces which can contribute to higher flow volumes during rain and rapidly transport pollutants to the
creek. This site has been sampled since October 1994.
Site 13 Sams Creek, Mount Kuring-gai. This site is located in the headwaters of Sams Creek within Berowra
Valley National Park, at the end of Hamley Road, Mt Kuring-gai. Industry dominates the landuse upstream of this
site. The area was connected to sewer in 2008 and premises are being progressively connected. As of 2011 (the
last inspections undertaken) more than half of the premises were connected, however some premises may still be
relying on the pump out of effluent. Any new development in the area is required to connect to the sewer. The
catchment above this site is approximately 18 hectares with 86% zoned industrial and 14% zoned open space.
Downstream of this sample site the creek flows in a north westerly direction for 3km before it joins Berowra Creek.
This site has been sampled since October 1994.
Rural Sites
Site 2 Tunks Creek, Galston Gorge. Site 2 is located at the bottom of the Tunks Creek catchment, 100 metres
upstream of the confluence with Berowra Creek. The site is approximately 5 km downstream of rural and urban
sources. The catchment area is approximately 1690 hectares with 65% being zoned rural and approximately 30%
consisting of open space and environmental protection zones. Sampling commenced at this site in October 1994.
Site 42 Colah Creek, Glenorie. Site 42 is located in Colah Creek, upstream of the Wylds Road Bridge, Glenorie.
The catchment above this site is approximately 990 hectares, 83% zoned as rural with the remaining areas being
a mix of residential, main roads, commercial and open space. Sampling commenced at this site in October 1994.
Site 49 Still Creek, Arcadia. Site 49 is located in the upper reaches of Still Creek draining a catchment of
approximately 440 hectares, 80% of which is zoned rural and 17% is open space. Sampling commenced at this
site in October 1994.
Site 62 Cowan. This site is located in the headwaters of Kimmerikong Creek and receives run-off from the Cowan
township. The monitoring site is located upstream of the former quarry. Sampling commenced at this site in July
2002. The catchment area is estimated to be approximately 11 hectares.
Site 63 Colah Creek, Glenorie. Site 63 is located in Colah Creek, prior to it flowing into Marramarra National Park.
Sampling commenced at this site in July 2002. The site has an estimated catchment area of 2290 Ha.
Site 64 Tributary of Colah Creek, Galston. Site 64 is located off Sallaway Road, Galston. The monitoring location
is on a tributary of Colah Creek, which receives run-off from the Galston township. Sampling commenced at this
site in July 2002. The catchment area is estimated to be 145 Ha.
Site 80 Glenorie Creek, Glenorie. Site 80 is located in Glenorie Creek at the corner of Tekopa Ave and Tecoma
Drive Glenorie. Sampling commenced at this site in August 1999 to assess the impact of the Glenorie township
and residential area, with onsite wastewater treatment systems, on water quality. This site is also impacted by
market gardens and animal/hobby farms. The catchment area is approximately 100 Ha.

70 HORNSBY SHIRE COUNCIL 2014-2015 WATER QUALITY MONITORING PROGRAM ANNUAL REPORT
Urban Sites
Site 4 Berowra Creek, Westleigh. Site 4 is located in the Berowra Valley National Park and is accessed by the
Benowie walking track below Westleigh. The estimated catchment area is 1230 hectares. Monitoring started here
in October 1994. The site is surrounded by predominantly bushland areas which buffer the influences of
surrounding development by filtering stormwater pollution. This site is upstream of the two sewage treatment
plants which discharge into Berowra Creek, but is influenced by stormwater from roads and residential
developments of Westleigh, Pennant Hills, parts of Thornleigh and Cherrybrook.
Site 5 Pyes Creek, Cherrybrook. Site 5 is located in Pyes Creek at Cherrybrook and drains a catchment of
approximately 380 hectares of which 79% is zoned residential. The site is located in a section of creek that has
extensive patches of exposed bedrock. Monitoring started here in October 1994.
Site 6 Georges Creek, Cherrybrook. Site 6 is located within Georges Creek. The upstream area of the catchment
is 440 hectares in size with 56% zoned rural, 20% zoned residential and approximately 24% being zoned open
space and environmental protection. The site is located adjacent to a gabion wall constructed to retain a sewage
pumping station. Monitoring started here in October 1994.
Site 8 Devlins Creek, Cheltenham. Site 8 is located in Devlins Creek, adjacent to Sutherland Road at Cheltenham
and is about 200m downstream of the crossing of the M2 Motorway. The catchment above this site is
approximately 823 hectares with about 8% falling in the Parramatta City Council area. Almost 77% of this
catchment is zoned residential with the remaining 23% consisting of special uses (9%), commercial/industrial and
business (1%) and open space (13%). Monitoring started here in October 1994.
Site 39 Joe Crafts Creek, Berowra. Site 39 on Joe Crafts Creek is located in the freshwater section of the creek
about 100m above the tidal influence of Berowra Creek. Joe Crafts Creek at the sampling site is characterised by
a rocky substrate with large boulders throughout the creek. The estimated catchment area is 688 ha. Sampling
commenced at this site in October 1994. The site receives runoff predominantly from a large area of bushland and
from parts of the Berowra urban area. The site differs from other urban area monitoring sites as it is further (4km)
downstream from the associated urban development. The site provides a good indication of water quality for the
Joe Crafts Creek catchment as a whole as the site is close to its confluence with Berowra Creek.
Site 46 Unnamed tributary of Terrys Creek, Epping. Site 46 is located in a tributary of Terrys Creek at Epping in
the Lane Cover River catchment. Part of the creek is piped under the M2 Motorway. The catchment above this site
is approximately 82 hectares, 87% of which is zoned residential. Monitoring started here in October 1994. During
the construction and expansion of the M2 motorway it was necessary to relocate this site approximately 200m
downstream of the original location (Site 46A).
Estuarine Sites
Site 38 Sandbrook Inlet. This site is located in the navigation channel towards the upstream end of Sandbrook
Inlet, Brooklyn. This area is heavily influenced by marine industry and is characterised by shallow foreshores with
a navigation channel down the middle of the inlet and swing moorings on either side. The Inlet is bound by marina
operations and residential development along the southern shore and Long Island Nature Reserve to the north.
Sandbrook Inlet is not open to the Hawkesbury River at the eastern end. The Brooklyn area commenced
connection to the Brooklyn STP in 2006/07.
Site 48 Marramarra Creek. This site is located within Marramarra National Park in the estuarine tidal reaches of
Marramarra Creek (adjacent to the old orange orchard). The creek receives runoff from a large area of
undisturbed bushland as well as rural developments at Galston, Glenorie, Fiddletown, Arcadia, Forrest Glen and
Canoelands. The site has been monitored since October 1994.
Site 60 Berowra Creek. This site is located in the middle of Berowra Creek at Berowra Waters, downstream of the
Berowra Ferry crossing. The site is characterised by the ferry crossing, marina operations, swing moorings and
residential development along the foreshore. The site has been monitored since 1997.
Site 61 Berowra Creek. This site is located in Berowra Creek at Calabash Point. The site has a depth of
approximately 15m which is unusually deep compared to the rest of Berowra Creek. This site has been monitored

71 HORNSBY SHIRE COUNCIL 2014-2015 WATER QUALITY MONITORING PROGRAM ANNUAL REPORT
since 1997. In 2002 a remote water quality monitoring probe was deployed to monitor temperature, salinity and
chlorophyll-a, acting as an early warning device for algal bloom detection. Detailed information on the Council’s
remote water quality monitoring buoys can be found in the Hawkesbury Estuary Program Annual Reports.
Site 100 Berowra Creek. This site is located at the northern beach of Crosslands Reserve, in the upper reaches of
Berowra Creek.
Site 103. This site is located at the eastern end of Milsons Passage. This site is influenced by the river side
settlement of Milsons Passage and sampled by boat.
Site 108. This site is located off Bradleys Beach, Dangar Island, Hawkesbury River. The site is primarily marine
and highly influenced by tidal movement. This is a popular recreational area.
Sites 150 – 153 Hawkesbury River. Council has deployed a number of remote water quality monitoring buoys
along the salinity gradient of the Hawkesbury River estuary, from the freshwater of Wisemans Ferry to the marine
waters off Gunyah Point. Water quality data collected at these sites includes temperature, salinity and chlorophyll-
a levels and is available at www.hornsby.nsw.gov.au/estuary.
Site 174. This site is located in the mouth of Mullet Creek on the Hawkesbury River. The site is primarily marine
and highly influenced by tidal movement. This location is an oyster growing area.

72 HORNSBY SHIRE COUNCIL 2014-2015 WATER QUALITY MONITORING PROGRAM ANNUAL REPORT
Appendix C - Detailed site descriptions of sites monitored to assess the performance of catchment remediation initiatives
Site 43 Calna Creek. Site 43 is located in the freshwater section of Calna Creek 4km downstream of the HHSTP
outfall, and approximately 1km upstream of the confluence with the Berowra Creek estuary. The estimated
catchment area is 1060 Ha. This section of creek is shaded by vegetation and the substrate consists of large
sandstone boulders. Sampling at this site gives a good indication of the quality of water entering Berowra Creek
from the Calna Creek catchment. Dry weather flows in Calna Creek are dominated by STP discharge which
contains high levels of oxidised nitrogen. Monitoring started here in October 1994.
Site 52 Calna Creek. This site is located in Calna Creek about 300m above the STP outfall. The water quality at
site 52 provides a direct indication of the influence of the urban catchment on water quality compared to the STP.
The catchment area above this site is approximately 280 hectares with 59% zoned residential. Monitoring started
here in November 1995.
Site 1 Berowra Creek. Site 1 is located on Berowra Creek at Galston Gorge and is included in the section, with
other sites associated with the WHSTP, because of the significant influence of the WHSTP on water quality this far
downstream in Berowra Creek. The catchment area above this site is approximately 5550 hectares with 30%
zoned rural, 33% residential and 19% national parks and reserves. Other landuses in the catchment include open
space, industrial/commercial/business, special uses and environmental protection. Monitoring started here in
November 1994.
Site 23 Waitara Creek. Site 23 is located approximately 100 metres upstream of the WHSTP outfall and is situated
in the pool above a fire trail crossing. This site drains the Waitara Creek catchment which contains residential,
commercial, small areas of open space as well as Larool Creek which drains the Thornleigh industrial area. The
total catchment area above this sampling site is 650 hectares. Of this catchment area 58% is zoned residential,
19% is zoned special uses, 18% is zoned open space and 5% is zoned commercial. Monitoring started here in
October 1994.
Site 45 Fishponds, Berowra Creek. This site is located in the Berowra Valley Regional Park and is influenced by
the catchments of upper Berowra Creek and Waitara Creek, of the Pyes/Georges Creek catchments, as well as
West Hornsby STP which discharges into Waitara Creek. The volume of treated waters discharged by the STP
accounts for a significant fraction of the base flow at Fishponds. The high concentrations of nitrogen species at
Fishponds and downstream can mainly be attributed to the WHSTP. Notwithstanding the current effect of the STP
on nitrogen concentrations downstream of the discharge point, it should be noted that the concentration values at
Fishponds are now about 10-20% of those routinely recorded before the STP upgrade works about 2003.
Nevertheless further nutrient removal is required to achieve Guideline values for nitrogen.
The catchment area above this site is approximately 3370 hectares of which 12% is zoned rural, 46% is zoned
residential, 3% is zoned industrial/commercial/business, 10% is special uses, 9% is open space, 3% is
environmental protection and 17% is national parks and reserves. Monitoring started here in October 1994.
Berowra Oval, Berowra (Sites 128, 131). Berowra Oval is a 2 hectare park that includes a 1.3 hectare sports oval
as well as vegetated surrounds comprised of trees and recreational areas. This scheme harvests runoff from the
17.5 hectare mostly developed areas surrounding Berowra Oval. The catchment primarily consists of an
established residential area, including some open space area. This project has been operational since 2009
(Storm Consulting 2012(a)).
Community Nursery, Pennant Hills (Sites 98, 180). The nursery grounds constitute the 0.7 hectare water supply
catchment for the Earthwise Cottage scheme. The nursery grounds comprise of unsealed gravel surfaces with
slope at roughly 6% towards the western boundary. Surface runoff drains to the western boundary, where it is
collected by vegetated bio-swales and conveyed to an off take pit located at a low point within the site. The project
has been operational since January 2004 (Storm Consulting 2012(g)).
Epping Oval, Epping (Sites 134, 137). Epping Oval is a 4 hectare park with a 1.3 hectare sports oval and athletics
track, car park, as well as vegetated surrounds comprising of trees and recreational areas. This scheme harvests
stormwater from a 4 hectare suburban catchment for the purpose of irrigating the oval, athletics track and

73 HORNSBY SHIRE COUNCIL 2014-2015 WATER QUALITY MONITORING PROGRAM ANNUAL REPORT
playground gardens. The catchment is dominated by open space parklands, fringed by residential areas and two
sealed roads. The project has been operational since 2011 (Storm Consulting 2012(b)).
Greenway Park, Cherrybrook (Sites 120, 121). This scheme captures stormwater from an 8 hectare catchment
which is treated and used for irrigation of two playing fields. The catchment is dominated by open space
parklands, and includes some residential and commercial areas, which do not pose any major risks to water
quality. The project has been operational since 2009 (Storm Consulting 2012(d)).
North Epping Oval, North Epping (Sites 138, 141). North Epping is a 3.4 hectare park that includes a 1.3 hectare
sports oval, two enclosed tennis/netball courts, car park, as well as vegetated surrounds comprised of a mix of
both trees and grasses. This scheme harvests stormwater from a 4 hectare suburban catchment for irrigating the
sports oval. The catchment is dominated by open space, residential areas and two sealed roads (Storm
Consulting 2012(e)).
Somerville Oval, Epping (Sites 142, 145). Somerville oval is a 3 hectare park that includes a 1.3 hectare sports
oval, amenities buildings, playground and car park as well as surrounds comprised of trees and recreational areas.
This scheme harvests stormwater from a 25 hectare suburban catchment for irrigating the oval. The catchment is
dominated by open space parklands, fringed by residential areas and intersected by a railway line (Storm
Consulting 2012(f)).
Arcadia Landfill (Sites 18, 94). The Arcadia landfill near Arcadia Park was remediated in 1997/1998 by clay
capping. Water management included separation of stormwater seepages. The captured leachate is collected in
underground tanks and treated using a trailer-mounted bioreactor. Water is tested at two sites to assess the
effectiveness of seepage collection and the bioreactor performance.
Foxglove Oval, Mt Colah (Sites 77, 95, 96, 132). Foxglove oval was initially operated as a landfill site which
closed in 1980. The landfill site was compacted, capped and converted into an oval in 1985. In the 1990’s
Council installed a water quality treatment process to reduce the impacts of the leachate leaving the site. With the
leachate being treated to a quality suitable for irrigation, a harvesting system was commissioned and completed in
2010.
Wisemans Ferry Landfill (Sites 56, 112). This landfill site ceased operation in 2002. The tip has been clay capped
with ongoing revegetation and water management activities. Two sites are monitored quarterly: the leachate
collection dam (Site 56) and Riser ‘C’ (Site 112). Water quality monitoring is a requirement of the Environmental
Protection Licence issued for this site. Council’s Work Division currently manages the disused landfill site and
associated licence, reporting to State Government as required.

74 HORNSBY SHIRE COUNCIL 2014-2015 WATER QUALITY MONITORING PROGRAM ANNUAL REPORT
Appendix D – NSW Food Authority Phytoplankton Action levels
The following table summarises the phytoplankton levels (in cells/litre) which are used to trigger
sampling of shellfish flesh. The levels relate to discrete or composite samples. These levels are a
combination of levels used internationally and in various states in Australia. They should be revised as
further monitoring and research is undertaken and supports a change.
Phytoplankton species Toxin Trigger flesh
sampling#
(cells per litre)
Alert level – Close
harvest area pending
flesh testing results
Issue public health
warning
(cells per litre)
Alexandrium minutum# PSP 200 500 5000
Alexandrium ostenfeldii# PSP 200 500 5000
Alexandrium catenella# PSP 200 500 5000
Alexandrium tamarense# PSP 200 500 5000
Alexandrium spp# PSP (?)
Gymnodinium catenatum PSP 1000 mussels
2000 other shellfish
5000 5000
Pseudonitzschia (P.multiseries
& P.australis)*
ASP 50,000 500,000 N/A
Pseudonitzschia delicatissima
group – historically non-toxic
in Australia
ASP (?) 500,000 N/A
Karenia cf brevis NSP 1000 5000
Dinophysis acuminata DSP 1000 N/A
Dinophysis acuta DSP 500 N/A
Dinophysis caudata DSP 500 N/A
Dinophysis fortii DSP 500 N/A
Dinophysis hastate DSP 500 N/A
Dinophysis mitra DSP 500 N/A
Dinophysis rotundata DSP 500 N/A
Dinophysis tripos DSP 500 N/A
Total Dinophysis spp. DSP 500 N/A
Prorocentrum lima DSP 500 N/A
Note: For Pseudonitzschia spp. risk remains high for a minimum of two weeks post bloom crash.
The cell levels within each toxin group are cumulative, eg 600 cells/l of both D. acuta and D. fortii would
mean a total count of 1200 cells/l, exceeding the critical level to initiate flesh testing. # Alexandrium species may be difficult to identify when numbers are low. If any doubt exists, they should be treated as potentially toxic.
* Species within the Pseudo-nitzchia groups are difficult to identify. The toxic species of most concern in each group are listed for those laboratories that have capacity to identify these algae to species level.
Otherwise all algae within these groups should be considered potentially toxic.
NSW Shellfish Program Marine Biotoxin Management Plan FI115/1409
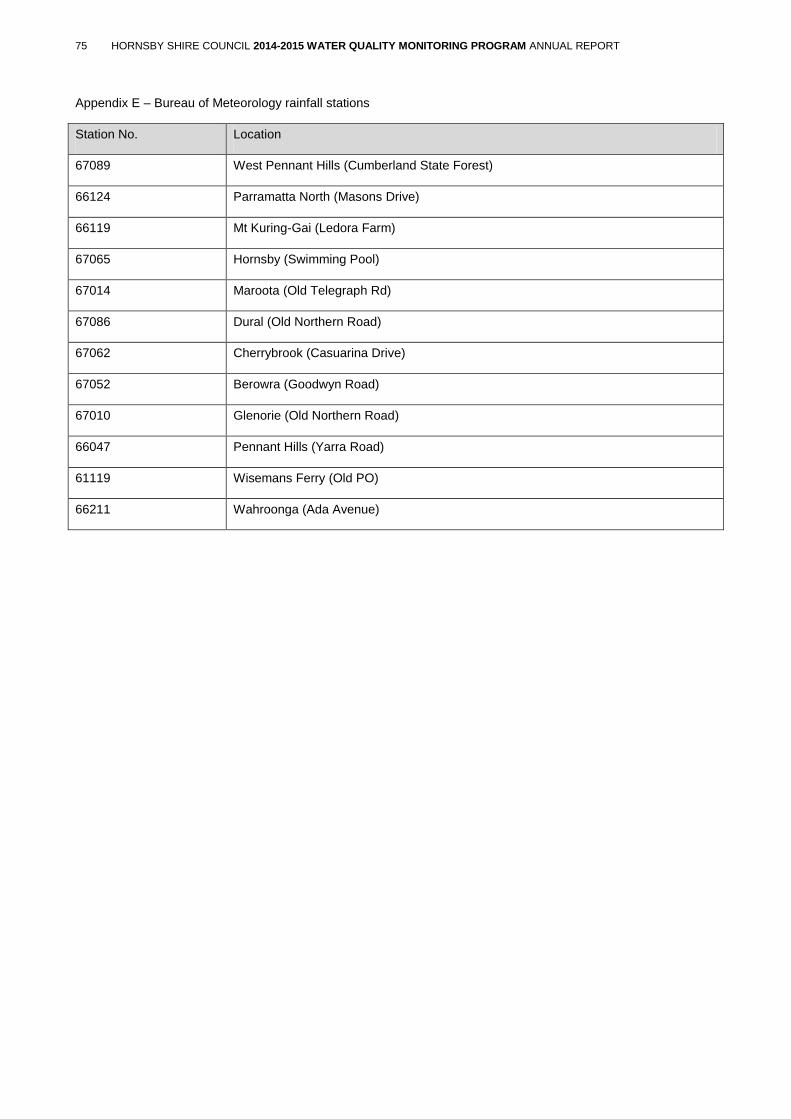
75 HORNSBY SHIRE COUNCIL 2014-2015 WATER QUALITY MONITORING PROGRAM ANNUAL REPORT
Appendix E – Bureau of Meteorology rainfall stations
Station No. Location
67089 West Pennant Hills (Cumberland State Forest)
66124 Parramatta North (Masons Drive)
66119 Mt Kuring-Gai (Ledora Farm)
67065 Hornsby (Swimming Pool)
67014 Maroota (Old Telegraph Rd)
67086 Dural (Old Northern Road)
67062 Cherrybrook (Casuarina Drive)
67052 Berowra (Goodwyn Road)
67010 Glenorie (Old Northern Road)
66047 Pennant Hills (Yarra Road)
61119 Wisemans Ferry (Old PO)
66211 Wahroonga (Ada Avenue)

76 HORNSBY SHIRE COUNCIL 2014-2015 WATER QUALITY MONITORING PROGRAM ANNUAL REPORT
Appendix F – Individual Site Summary Statistics
Summary Statistics for Site 001 for July 2014 to June 2015
Site 001 Valid N Mean Median Minimum Maximum Percentile Percentile Std.Dev.
20 80
Temperature (oC) 12 16.443 17.170 10.600 22.100 12.660 18.970 3.830
Electrical Conductivity (ms/cm) 12 0.465 0.545 0.120 0.660 0.280 0.620 0.180
Electrical Conductivity (µS/cm) 12 468.417 544.000 166.000 652.000 276.000 611.000 177.800
Turbidity (NTU) 12 10.617 0.750 0.000 52.100 0.100 16.800 19.690
Dissolved oxygen (mg/L) 12 9.345 9.450 7.290 11.520 7.990 10.580 1.430
Dissolved oxygen (%sat) 12 95.025 97.250 85.020 107.900 87.684 101.200 7.770
pH 12 7.443 7.500 6.590 7.810 7.320 7.700 0.320
Salinity (ppt) 12 0.231 0.270 0.060 0.330 0.140 0.310 0.090
Suspended Solids (mg/L) 12 7.333 1.000 1.000 46.000 1.000 4.000 14.570
Ammonium-Nitrogen (mg/L) 12 0.055 0.015 0.010 0.270 0.010 0.060 0.090
Oxidised Nitrogen (mg/L) 12 2.235 2.300 0.530 4.800 0.870 3.000 1.340
Total Nitrogen (mg/L) 12 2.905 2.895 1.300 5.530 1.540 3.560 1.350
Total Phosphorus(mg/L) 12 0.080 0.054 0.031 0.210 0.042 0.101 0.060
Faecal Coliforms (CFU/100ml) 12 7824.50 109.00 6.00 49000.00 30.00 3800.00 17270.82
Enterococci (CFU/100ml) 5 1232.20 200.00 22.00 5600.00 35.50 2945.00 2444.15
Bicarbonate Alkalinity (mg/CaCO3/L) 4 49.500 54.850 29.700 58.600 29.700 58.600 13.480
Chloride (mg/L) 4 61.250 64.000 32.000 85.000 32.000 85.000 24.680
Fluoride (mg/L) 4 0.288 0.245 0.080 0.580 0.080 0.580 0.210
Sodium (mg/L) 4 44.500 44.750 20.200 68.300 20.200 68.300 22.340
Sulphate as SO42-(mg/L) 4 43.000 42.500 13.000 74.000 13.000 74.000 27.580
Potassium (mg/L) 4 6.668 4.320 3.130 14.900 3.130 14.900 5.570
Magnesium (mg/L) 4 6.080 6.325 3.140 8.530 3.140 8.530 2.300
Calcium (mg/L) 4 23.450 21.650 11.000 39.500 11.000 39.500 12.750
Aluminium (ug/L) 4 665.500 175.000 32.000 2280.000 32.000 2280.000 1078.450
Arsenic (ug/L) 4 0.875 0.500 0.500 2.000 0.500 2.000 0.750
Cadmium (ug/L) 4 0.500 0.500 0.500 0.500 0.500 0.500 0.000
Chromium (ug/L) 4 1.250 0.750 0.500 3.000 0.500 3.000 1.190
Copper (ug/L) 4 5.500 5.500 3.000 8.000 3.000 8.000 2.080
Lead (ug/L) 4 1.375 0.500 0.500 4.000 0.500 4.000 1.750
Manganese (ug/L) 4 14.000 8.000 5.000 35.000 5.000 35.000 14.070
Molybdenum (ug/L) 4 1.000 0.750 0.500 2.000 0.500 2.000 0.710
Nickel (ug/L) 4 1.625 1.500 0.500 3.000 0.500 3.000 1.110
Selenium (ug/L) 4 1.500 1.500 1.500 1.500 1.500 1.500 0.000
Silver (ug/L) 4 0.500 0.500 0.500 0.500 0.500 0.500 0.000
Uranium (ug/L) 4 0.500 0.500 0.500 0.500 0.500 0.500 0.000
Zinc (ug/L) 4 13.500 12.500 7.000 22.000 7.000 22.000 6.240
Boron (ug/L) 4 32.500 27.000 25.000 51.000 25.000 51.000 12.400
Iron (ug/L) 4 779.500 427.000 204.000 2060.000 204.000 2060.000 863.250
Mercury (ug/L) 4 0.005 0.005 0.005 0.010 0.005 0.005 0.000
Summary Statistics for Site 002 for July 2014 to June 2015
Site 002 Valid N Mean Median Minimum Maximum Percentile Percentile Std.Dev.
20 80
Temperature (oC) 12 14.934 14.830 8.420 20.300 11.720 18.380 3.854
Electrical Conductivity (ms/cm) 12 0.281 0.305 0.130 0.380 0.220 0.340 0.077
Electrical Conductivity (µS/cm) 12 283.000 301.000 160.000 387.000 176.000 362.000 81.038
Turbidity (NTU) 12 8.525 1.450 0.000 46.000 0.500 16.500 14.885
Dissolved oxygen (mg/L) 12 9.995 9.960 8.020 12.290 9.470 10.560 1.212
Dissolved oxygen (%sat) 12 98.540 96.700 90.800 107.800 95.100 102.400 5.092
pH 12 6.962 7.150 5.400 7.310 6.950 7.290 0.547
Salinity (ppt) 12 0.140 0.155 0.060 0.190 0.110 0.170 0.041
Suspended Solids (mg/L) 12 3.333 1.000 1.000 19.000 1.000 4.000 5.365
Ammonium-Nitrogen (mg/L) 12 0.009 0.010 0.005 0.020 0.005 0.010 0.004
Oxidised Nitrogen (mg/L) 12 0.122 0.035 0.010 0.730 0.030 0.140 0.203
Total Nitrogen (mg/L) 12 0.423 0.275 0.140 1.430 0.210 0.570 0.366
Total Phosphorus(mg/L) 12 0.024 0.011 0.004 0.114 0.006 0.041 0.032
Faecal Coliforms (CFU/100ml) 12 283.292 10.500 0.500 2000.000 2.000 110.000 638.957
Enterococci (CFU/100ml) 5 21.400 22.000 3.000 40.000 8.500 34.000 13.993
E Coli (CFU/100mL) 2 6.000 6.000 6.000 6.000 6.000 6.000 0.000
Bicarbonate Alkalinity (mg/CaCO3/L) 4 17.750 16.350 13.500 24.800 13.500 24.800 4.902
Chloride (mg/L) 4 60.250 62.500 35.000 81.000 35.000 81.000 19.687
Sulphate as SO42-(mg/L) 4 12.975 12.500 6.900 20.000 6.900 20.000 5.392
Fluoride (mg/L) 4 0.050 0.050 0.050 0.050 0.050 0.050 0.000
Sodium (mg/L) 4 33.550 31.900 20.100 50.300 20.100 50.300 12.836
Potassium (mg/L) 4 3.335 3.030 2.500 4.780 2.500 4.780 1.042

77 HORNSBY SHIRE COUNCIL 2014-2015 WATER QUALITY MONITORING PROGRAM ANNUAL REPORT
Magnesium (mg/L) 4 5.915 5.490 3.240 9.440 3.240 9.440 2.631
Calcium (mg/L) 4 7.600 7.145 5.710 10.400 5.710 10.400 1.992
Aluminium (ug/L) 4 603.750 260.000 35.000 1860.000 35.000 1860.000 847.382
Arsenic (ug/L) 4 0.500 0.500 0.500 0.500 0.500 0.500 0.000
Cadmium (ug/L) 4 0.500 0.500 0.500 0.500 0.500 0.500 0.000
Chromium (ug/L) 4 1.125 0.500 0.500 3.000 0.500 3.000 1.250
Copper (ug/L) 4 1.375 1.000 0.500 3.000 0.500 3.000 1.109
Lead (ug/L) 4 0.875 0.500 0.500 2.000 0.500 2.000 0.750
Manganese (ug/L) 4 8.500 7.000 5.000 15.000 5.000 15.000 4.509
Molybdenum (ug/L) 4 0.500 0.500 0.500 0.500 0.500 0.500 0.000
Nickel (ug/L) 4 0.875 0.500 0.500 2.000 0.500 2.000 0.750
Selenium (ug/L) 4 1.500 1.500 1.500 1.500 1.500 1.500 0.000
Silver (ug/L) 4 0.500 0.500 0.500 0.500 0.500 0.500 0.000
Uranium (ug/L) 4 0.500 0.500 0.500 0.500 0.500 0.500 0.000
Zinc (ug/L) 4 4.375 5.000 2.500 5.000 2.500 5.000 1.250
Boron (ug/L) 4 20.750 20.000 19.000 24.000 19.000 24.000 2.217
Iron (ug/L) 4 656.000 418.500 247.000 1540.000 247.000 1540.000 597.038
Mercury (ug/L) 4 0.005 0.005 0.005 0.005 0.005 0.005 0.000
Summary Statistics for Site 004 for July 2014 to June 2015
Site 004 Valid N Mean Median Minimum Maximum Percentile Percentile Std.Dev.
20 80
Temperature (oC) 12 14.802 14.205 8.490 20.650 11.650 19.950 3.902
Electrical Conductivity (ms/cm) 12 0.317 0.320 0.220 0.450 0.240 0.370 0.077
Electrical Conductivity (µS/cm) 12 323.583 315.000 225.000 425.000 267.000 399.000 68.704
Turbidity (NTU) 12 4.542 1.600 0.800 26.600 1.000 5.600 7.272
Dissolved oxygen (mg/L) 12 8.981 9.515 5.930 11.280 7.040 10.960 1.941
Dissolved oxygen (%sat) 12 86.604 91.725 66.100 100.800 72.200 99.500 13.827
pH 12 7.380 7.345 7.170 7.600 7.250 7.560 0.158
Salinity (ppt) 12 0.158 0.160 0.110 0.220 0.120 0.190 0.040
Suspended Solids (mg/L) 13 1.538 1.000 1.000 4.000 1.000 3.000 1.050
Ammonium-Nitrogen (mg/L) 13 0.088 0.010 0.005 0.650 0.005 0.170 0.181
Oxidised Nitrogen (mg/L) 13 0.302 0.170 0.080 1.250 0.080 0.270 0.369
Total Nitrogen (mg/L) 13 0.630 0.370 0.270 1.690 0.330 1.080 0.471
Total Phosphorus(mg/L) 13 0.036 0.035 0.009 0.073 0.012 0.060 0.021
Faecal Coliforms (CFU/100ml) 13 848.23 71.00 11.00 5400.00 26.00 1200.00 1691.37
Enterococci (CFU/100ml) 6 55.83 43.50 32.00 90.00 38.00 88.00 26.14
E Coli (CFU/100mL) 2 48.00 48.00 40.00 56.00 40.00 56.00 11.31
Bicarbonate Alkalinity (mg/CaCO3/L) 5 39.440 38.100 30.800 50.800 34.150 45.400 7.238
Chloride (mg/L) 5 49.400 45.000 36.000 79.000 36.000 65.000 17.729
Sulphate as SO42-(mg/L) 5 12.260 13.000 6.600 18.000 6.650 17.500 5.452
Fluoride (mg/L) 5 0.178 0.200 0.090 0.270 0.105 0.240 0.073
Sodium (mg/L) 5 30.660 27.000 25.300 41.600 26.050 37.100 6.717
Potassium (mg/L) 5 2.880 3.260 1.800 3.720 1.970 3.600 0.855
Magnesium (mg/L) 5 5.610 5.410 4.270 7.680 4.545 6.775 1.305
Calcium (mg/L) 5 16.960 16.600 13.300 21.200 14.850 19.250 2.825
Aluminium (ug/L) 5 520.000 66.000 34.000 2100.000 47.500 1219.500 891.930
Arsenic (ug/L) 5 0.800 0.500 0.500 2.000 0.500 1.250 0.671
Cadmium (ug/L) 5 0.500 0.500 0.500 0.500 0.500 0.500 0.000
Chromium (ug/L) 5 1.200 1.000 0.500 2.000 0.500 2.000 0.758
Copper (ug/L) 5 2.800 3.000 1.000 4.000 1.500 4.000 1.304
Lead (ug/L) 5 0.800 0.500 0.500 2.000 0.500 1.250 0.671
Manganese (ug/L) 5 14.800 15.000 12.000 17.000 13.000 16.500 1.924
Molybdenum (ug/L) 5 0.500 0.500 0.500 0.500 0.500 0.500 0.000
Nickel (ug/L) 5 0.900 0.500 0.500 2.000 0.500 1.500 0.652
Silver (ug/L) 5 0.500 0.500 0.500 0.500 0.500 0.500 0.000
Selenium (ug/L) 5 1.500 1.500 1.500 1.500 1.500 1.500 0.000
Uranium (ug/L) 5 0.500 0.500 0.500 0.500 0.500 0.500 0.000
Zinc (ug/L) 5 17.000 17.000 8.000 26.000 11.500 22.500 6.519
Boron (ug/L) 5 41.600 38.000 27.000 57.000 28.000 57.000 14.656
Iron (ug/L) 5 1298.200 1470.000 517.000 1920.000 615.500 1895.000 650.897
Mercury (ug/L) 5 0.005 0.005 0.005 0.005 0.005 0.005 0.000
Summary Statistics for Site 005 for July 2014 to June 2015
Site 005 Valid N Mean Median Minimum Maximum Percentile Percentile Std.Dev.
20 80
Temperature (oC) 12 15.480 14.620 10.410 21.000 12.640 20.300 3.470
Electrical Conductivity (ms/cm) 12 0.690 0.740 0.260 1.300 0.470 0.800 0.290
Electrical Conductivity (µS/cm) 12 720.170 727.500 253.000 1313.000 501.000 945.000 291.080
Turbidity (NTU) 12 7.530 3.750 1.000 25.200 1.200 12.200 7.980

78 HORNSBY SHIRE COUNCIL 2014-2015 WATER QUALITY MONITORING PROGRAM ANNUAL REPORT
Dissolved oxygen (mg/L) 12 8.490 8.910 5.680 11.000 7.000 9.600 1.700
Dissolved oxygen (%sat) 12 83.620 86.200 63.300 99.000 69.600 97.000 12.580
pH 12 7.420 7.440 7.100 7.800 7.240 7.500 0.170
Salinity (ppt) 12 0.350 0.370 0.130 0.700 0.230 0.400 0.150
Suspended Solids (mg/L) 12 2.580 1.000 1.000 8.000 1.000 5.000 2.500
Ammonium-Nitrogen (mg/L) 12 0.080 0.030 0.010 0.500 0.010 0.100 0.150
Oxidised Nitrogen (mg/L) 12 0.550 0.480 0.060 1.800 0.140 0.800 0.490
Total Nitrogen (mg/L) 12 0.950 0.750 0.400 2.200 0.430 1.300 0.580
Total Phosphorus(mg/L) 12 0.040 0.030 0.026 0.100 0.029 0.000 0.020
Faecal Coliforms (CFU/100ml) 12 10051.75 205.00 33.00 110000.00 98.00 4100.00 31518.95
Enterococci (CFU/100ml) 5 2512.60 210.00 42.00 12000.00 51.50 6125.00 5304.39
E Coli (CFU/100mL) 2 55215.00 55215.00 430.00 110000.00 430.00 110000.00 77477.69
Bicarbonate Alkalinity (mg/CaCO3/L) 4 57.130 59.800 40.600 68.300 40.600 68.300 12.440
Chloride (mg/L) 4 86.750 94.500 38.000 120.000 38.000 120.000 34.940
Sulphate as SO42-(mg/L) 4 118.250 113.000 17.000 230.000 17.000 230.000 107.480
Fluoride (mg/L) 4 0.200 0.210 0.090 0.300 0.090 0.300 0.100
Sodium (mg/L) 4 87.230 92.550 27.800 136.000 27.800 136.000 55.010
Potassium (mg/L) 4 8.220 8.380 2.830 13.300 2.830 13.300 5.300
Magnesium (mg/L) 4 7.510 7.610 3.810 11.000 3.810 11.000 2.940
Calcium (mg/L) 4 34.680 30.150 17.300 61.100 17.300 61.100 18.950
Aluminium (ug/L) 4 552.250 434.000 31.000 1310.000 31.000 1310.000 540.160
Arsenic (ug/L) 4 0.630 0.500 0.500 1.000 0.500 1.000 0.250
Cadmium (ug/L) 4 0.500 0.500 0.500 0.500 0.500 0.500 0.000
Chromium (ug/L) 4 1.630 1.000 0.500 4.000 0.500 4.000 1.600
Copper (ug/L) 4 4.500 4.500 3.000 6.000 3.000 6.000 1.290
Lead (ug/L) 4 1.130 0.500 0.500 3.000 0.500 3.000 1.250
Manganese (ug/L) 4 30.500 30.500 18.000 43.000 18.000 43.000 13.870
Molybdenum (ug/L) 4 2.380 2.000 0.500 5.000 0.500 5.000 1.890
Nickel (ug/L) 4 1.750 1.500 1.000 3.000 1.000 3.000 0.960
Silver (ug/L) 4 0.500 0.500 0.500 0.500 0.500 0.500 0.000
Selenium (ug/L) 4 1.500 1.500 1.500 1.500 1.500 1.500 0.000
Uranium (ug/L) 4 0.500 0.500 0.500 0.500 0.500 0.500 0.000
Zinc (ug/L) 4 17.000 16.500 15.000 20.000 15.000 20.000 2.160
Boron (ug/L) 4 41.500 37.000 24.000 68.000 24.000 68.000 19.810
Iron (ug/L) 4 1054.250 927.500 692.000 1670.000 692.000 1670.000 425.280
Mercury (ug/L) 4 0.010 0.010 0.005 0.000 0.005 0.000 0.000
Summary Statistics for Site 006 for July 2014 to June 2015
Site 006 Valid N Mean Median Minimum Maximum Percentile Percentile Std.Dev.
20 80
Temperature (oC) 12 15.395 14.685 10.020 20.870 12.270 20.560 3.698
Electrical Conductivity (ms/cm) 12 0.392 0.370 0.320 0.500 0.350 0.490 0.064
Electrical Conductivity (µS/cm) 12 392.833 374.500 300.000 469.000 352.000 460.000 56.248
Turbidity (NTU) 12 10.775 3.100 0.600 72.200 1.100 15.100 20.413
Dissolved oxygen (mg/L) 12 9.082 9.360 6.010 11.510 7.480 10.630 1.801
Dissolved oxygen (%sat) 12 88.868 92.250 67.300 101.800 77.500 97.500 11.944
pH 12 7.515 7.530 7.200 7.740 7.470 7.630 0.147
Salinity (ppt) 12 0.192 0.190 0.130 0.250 0.170 0.240 0.036
Suspended Solids (mg/L) 12 2.250 1.000 1.000 8.000 1.000 3.000 2.094
Ammonium-Nitrogen (mg/L) 12 0.012 0.010 0.005 0.030 0.005 0.010 0.009
Oxidised Nitrogen (mg/L) 12 0.196 0.085 0.010 0.730 0.020 0.250 0.250
Total Nitrogen (mg/L) 12 0.593 0.515 0.220 1.290 0.310 0.830 0.358
Total Phosphorus(mg/L) 12 0.043 0.039 0.013 0.120 0.019 0.062 0.031
Faecal Coliforms (CFU/100ml) 12 572.08 165.00 15.00 4400.00 29.00 590.00 1225.45
Enterococci (CFU/100ml) 5 345.20 330.00 68.00 890.00 83.00 615.00 329.78
E Coli (CFU/100mL) 2 250.00 250.00 150.00 350.00 150.00 350.00 141.42
Bicarbonate Alkalinity (mg/CaCO3/L) 4 49.475 49.400 40.000 59.100 40.000 59.100 8.918
Chloride (mg/L) 4 66.750 64.000 49.000 90.000 49.000 90.000 17.212
Sulphate as SO42-(mg/L) 4 19.400 23.000 5.600 26.000 5.600 26.000 9.344
Fluoride (mg/L) 4 0.103 0.100 0.090 0.120 0.090 0.120 0.013
Sodium (mg/L) 4 40.975 40.600 34.000 48.700 34.000 48.700 6.214
Potassium (mg/L) 4 4.790 4.750 4.340 5.320 4.340 5.320 0.503
Magnesium (mg/L) 4 7.455 7.690 5.450 8.990 5.450 8.990 1.493
Calcium (mg/L) 4 20.775 20.950 17.600 23.600 17.600 23.600 3.169
Aluminium (ug/L) 4 1724.250 262.000 43.000 6330.000 43.000 6330.000 3074.708
Arsenic (ug/L) 4 0.875 0.500 0.500 2.000 0.500 2.000 0.750
Cadmium (ug/L) 4 0.500 0.500 0.500 0.500 0.500 0.500 0.000
Chromium (ug/L) 4 1.750 1.750 0.500 3.000 0.500 3.000 1.443
Copper (ug/L) 4 2.750 3.000 1.000 4.000 1.000 4.000 1.258
Lead (ug/L) 4 1.375 0.500 0.500 4.000 0.500 4.000 1.750
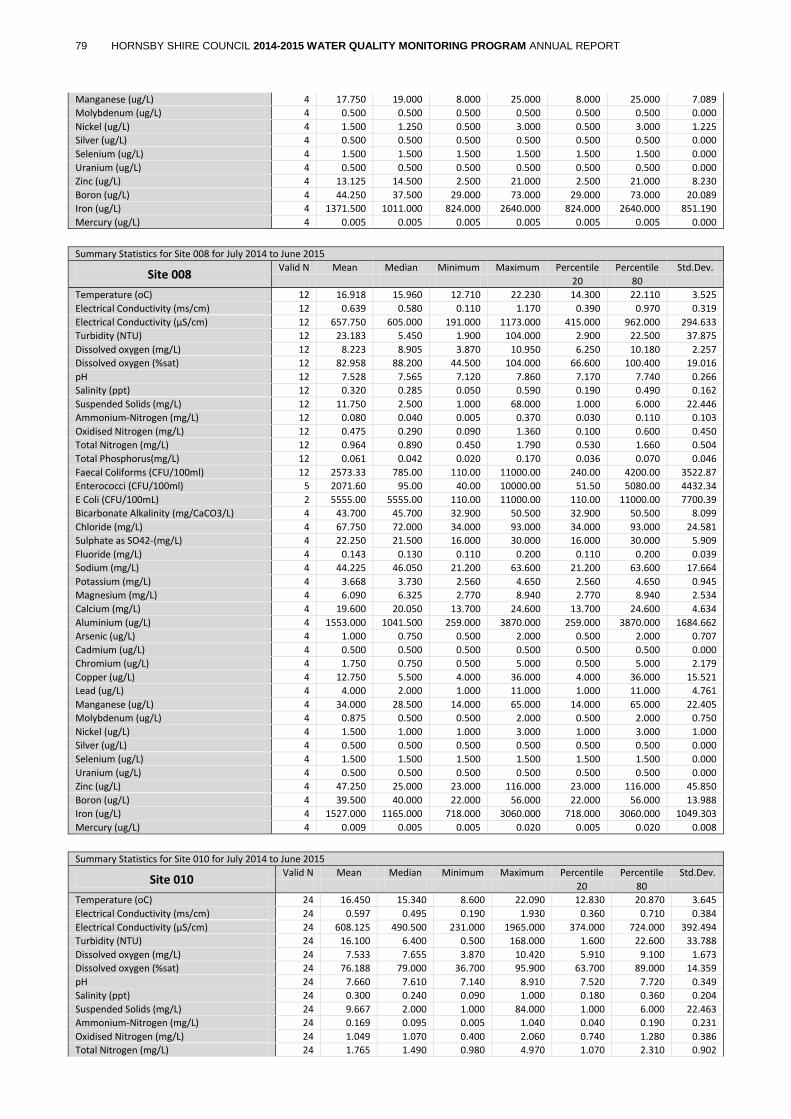
79 HORNSBY SHIRE COUNCIL 2014-2015 WATER QUALITY MONITORING PROGRAM ANNUAL REPORT
Manganese (ug/L) 4 17.750 19.000 8.000 25.000 8.000 25.000 7.089
Molybdenum (ug/L) 4 0.500 0.500 0.500 0.500 0.500 0.500 0.000
Nickel (ug/L) 4 1.500 1.250 0.500 3.000 0.500 3.000 1.225
Silver (ug/L) 4 0.500 0.500 0.500 0.500 0.500 0.500 0.000
Selenium (ug/L) 4 1.500 1.500 1.500 1.500 1.500 1.500 0.000
Uranium (ug/L) 4 0.500 0.500 0.500 0.500 0.500 0.500 0.000
Zinc (ug/L) 4 13.125 14.500 2.500 21.000 2.500 21.000 8.230
Boron (ug/L) 4 44.250 37.500 29.000 73.000 29.000 73.000 20.089
Iron (ug/L) 4 1371.500 1011.000 824.000 2640.000 824.000 2640.000 851.190
Mercury (ug/L) 4 0.005 0.005 0.005 0.005 0.005 0.005 0.000
Summary Statistics for Site 008 for July 2014 to June 2015
Site 008 Valid N Mean Median Minimum Maximum Percentile Percentile Std.Dev.
20 80
Temperature (oC) 12 16.918 15.960 12.710 22.230 14.300 22.110 3.525
Electrical Conductivity (ms/cm) 12 0.639 0.580 0.110 1.170 0.390 0.970 0.319
Electrical Conductivity (µS/cm) 12 657.750 605.000 191.000 1173.000 415.000 962.000 294.633
Turbidity (NTU) 12 23.183 5.450 1.900 104.000 2.900 22.500 37.875
Dissolved oxygen (mg/L) 12 8.223 8.905 3.870 10.950 6.250 10.180 2.257
Dissolved oxygen (%sat) 12 82.958 88.200 44.500 104.000 66.600 100.400 19.016
pH 12 7.528 7.565 7.120 7.860 7.170 7.740 0.266
Salinity (ppt) 12 0.320 0.285 0.050 0.590 0.190 0.490 0.162
Suspended Solids (mg/L) 12 11.750 2.500 1.000 68.000 1.000 6.000 22.446
Ammonium-Nitrogen (mg/L) 12 0.080 0.040 0.005 0.370 0.030 0.110 0.103
Oxidised Nitrogen (mg/L) 12 0.475 0.290 0.090 1.360 0.100 0.600 0.450
Total Nitrogen (mg/L) 12 0.964 0.890 0.450 1.790 0.530 1.660 0.504
Total Phosphorus(mg/L) 12 0.061 0.042 0.020 0.170 0.036 0.070 0.046
Faecal Coliforms (CFU/100ml) 12 2573.33 785.00 110.00 11000.00 240.00 4200.00 3522.87
Enterococci (CFU/100ml) 5 2071.60 95.00 40.00 10000.00 51.50 5080.00 4432.34
E Coli (CFU/100mL) 2 5555.00 5555.00 110.00 11000.00 110.00 11000.00 7700.39
Bicarbonate Alkalinity (mg/CaCO3/L) 4 43.700 45.700 32.900 50.500 32.900 50.500 8.099
Chloride (mg/L) 4 67.750 72.000 34.000 93.000 34.000 93.000 24.581
Sulphate as SO42-(mg/L) 4 22.250 21.500 16.000 30.000 16.000 30.000 5.909
Fluoride (mg/L) 4 0.143 0.130 0.110 0.200 0.110 0.200 0.039
Sodium (mg/L) 4 44.225 46.050 21.200 63.600 21.200 63.600 17.664
Potassium (mg/L) 4 3.668 3.730 2.560 4.650 2.560 4.650 0.945
Magnesium (mg/L) 4 6.090 6.325 2.770 8.940 2.770 8.940 2.534
Calcium (mg/L) 4 19.600 20.050 13.700 24.600 13.700 24.600 4.634
Aluminium (ug/L) 4 1553.000 1041.500 259.000 3870.000 259.000 3870.000 1684.662
Arsenic (ug/L) 4 1.000 0.750 0.500 2.000 0.500 2.000 0.707
Cadmium (ug/L) 4 0.500 0.500 0.500 0.500 0.500 0.500 0.000
Chromium (ug/L) 4 1.750 0.750 0.500 5.000 0.500 5.000 2.179
Copper (ug/L) 4 12.750 5.500 4.000 36.000 4.000 36.000 15.521
Lead (ug/L) 4 4.000 2.000 1.000 11.000 1.000 11.000 4.761
Manganese (ug/L) 4 34.000 28.500 14.000 65.000 14.000 65.000 22.405
Molybdenum (ug/L) 4 0.875 0.500 0.500 2.000 0.500 2.000 0.750
Nickel (ug/L) 4 1.500 1.000 1.000 3.000 1.000 3.000 1.000
Silver (ug/L) 4 0.500 0.500 0.500 0.500 0.500 0.500 0.000
Selenium (ug/L) 4 1.500 1.500 1.500 1.500 1.500 1.500 0.000
Uranium (ug/L) 4 0.500 0.500 0.500 0.500 0.500 0.500 0.000
Zinc (ug/L) 4 47.250 25.000 23.000 116.000 23.000 116.000 45.850
Boron (ug/L) 4 39.500 40.000 22.000 56.000 22.000 56.000 13.988
Iron (ug/L) 4 1527.000 1165.000 718.000 3060.000 718.000 3060.000 1049.303
Mercury (ug/L) 4 0.009 0.005 0.005 0.020 0.005 0.020 0.008
Summary Statistics for Site 010 for July 2014 to June 2015
Site 010 Valid N Mean Median Minimum Maximum Percentile Percentile Std.Dev.
20 80
Temperature (oC) 24 16.450 15.340 8.600 22.090 12.830 20.870 3.645
Electrical Conductivity (ms/cm) 24 0.597 0.495 0.190 1.930 0.360 0.710 0.384
Electrical Conductivity (µS/cm) 24 608.125 490.500 231.000 1965.000 374.000 724.000 392.494
Turbidity (NTU) 24 16.100 6.400 0.500 168.000 1.600 22.600 33.788
Dissolved oxygen (mg/L) 24 7.533 7.655 3.870 10.420 5.910 9.100 1.673
Dissolved oxygen (%sat) 24 76.188 79.000 36.700 95.900 63.700 89.000 14.359
pH 24 7.660 7.610 7.140 8.910 7.520 7.720 0.349
Salinity (ppt) 24 0.300 0.240 0.090 1.000 0.180 0.360 0.204
Suspended Solids (mg/L) 24 9.667 2.000 1.000 84.000 1.000 6.000 22.463
Ammonium-Nitrogen (mg/L) 24 0.169 0.095 0.005 1.040 0.040 0.190 0.231
Oxidised Nitrogen (mg/L) 24 1.049 1.070 0.400 2.060 0.740 1.280 0.386
Total Nitrogen (mg/L) 24 1.765 1.490 0.980 4.970 1.070 2.310 0.902

80 HORNSBY SHIRE COUNCIL 2014-2015 WATER QUALITY MONITORING PROGRAM ANNUAL REPORT
Total Phosphorus(mg/L) 24 0.054 0.034 0.017 0.330 0.022 0.068 0.063
Faecal Coliforms (CFU/100ml) 24 3434.96 775.00 59.00 24000.00 260.00 5000.00 5938.07
Enterococci (CFU/100ml) 9 434.00 450.00 38.00 1100.00 78.00 760.00 347.89
E Coli (CFU/100mL) 3 336.67 240.00 120.00 650.00 120.00 650.00 277.91
Bicarbonate Alkalinity (mg/CaCO3/L) 4 67.175 62.600 52.800 90.700 52.800 90.700 16.570
Chloride (mg/L) 4 55.000 52.000 34.000 82.000 34.000 82.000 19.900
Sulphate as SO42-(mg/L) 4 23.500 19.000 18.000 38.000 18.000 38.000 9.678
Fluoride (mg/L) 22 0.568 0.585 0.120 0.920 0.490 0.700 0.209
Sodium (mg/L) 4 36.625 33.450 24.500 55.100 24.500 55.100 13.226
Potassium (mg/L) 4 4.125 3.500 2.960 6.540 2.960 6.540 1.651
Magnesium (mg/L) 4 7.750 7.685 4.430 11.200 4.430 11.200 2.788
Calcium (mg/L) 4 28.300 27.550 21.500 36.600 21.500 36.600 7.088
Aluminium (ug/L) 4 751.250 682.500 60.000 1580.000 60.000 1580.000 793.330
Arsenic (ug/L) 4 0.625 0.500 0.500 1.000 0.500 1.000 0.250
Cadmium (ug/L) 4 0.500 0.500 0.500 0.500 0.500 0.500 0.000
Chromium (ug/L) 4 2.250 2.000 1.000 4.000 1.000 4.000 1.258
Copper (ug/L) 4 7.000 7.000 4.000 10.000 4.000 10.000 2.582
Lead (ug/L) 4 1.750 1.250 0.500 4.000 0.500 4.000 1.658
Manganese (ug/L) 4 44.000 42.000 16.000 76.000 16.000 76.000 24.940
Molybdenum (ug/L) 4 1.500 1.500 1.000 2.000 1.000 2.000 0.577
Nickel (ug/L) 4 1.625 2.000 0.500 2.000 0.500 2.000 0.750
Selenium (ug/L) 4 1.500 1.500 1.500 1.500 1.500 1.500 0.000
Silver (ug/L) 4 0.500 0.500 0.500 0.500 0.500 0.500 0.000
Uranium (ug/L) 4 0.500 0.500 0.500 0.500 0.500 0.500 0.000
Zinc (ug/L) 4 49.250 48.000 23.000 78.000 23.000 78.000 22.559
Boron (ug/L) 4 41.250 40.500 28.000 56.000 28.000 56.000 14.315
Iron (ug/L) 4 1128.000 1034.000 474.000 1970.000 474.000 1970.000 631.660
Mercury (ug/L) 4 0.005 0.005 0.005 0.010 0.005 0.005 0.000
Summary Statistics for Site 012 for July 2014 to June 2015
Site 012 Valid N Mean Median Minimum Maximum Percentile Percentile Std.Dev.
20 80
Temperature (oC) 24 16.317 15.575 9.380 21.830 13.010 20.510 3.550
Electrical Conductivity (ms/cm) 24 0.362 0.370 0.150 0.490 0.290 0.470 0.100
Electrical Conductivity (µS/cm) 24 363.458 381.000 115.000 472.000 297.000 439.000 82.170
Turbidity (NTU) 24 16.958 6.800 0.800 91.000 1.400 30.900 22.020
Dissolved oxygen (mg/L) 24 9.667 9.940 7.560 11.800 8.480 10.610 1.090
Dissolved oxygen (%sat) 24 97.669 98.400 85.500 109.500 93.500 101.450 4.990
pH 24 7.701 7.690 6.730 8.790 7.570 8.000 0.400
Salinity (ppt) 24 0.178 0.180 0.070 0.250 0.150 0.230 0.050
Suspended Solids (mg/L) 24 8.167 2.000 1.000 37.000 1.000 12.000 10.810
Ammonium-Nitrogen (mg/L) 24 0.079 0.035 0.010 0.700 0.020 0.080 0.140
Oxidised Nitrogen (mg/L) 24 0.722 0.675 0.290 1.440 0.480 1.000 0.270
Total Nitrogen (mg/L) 24 1.458 1.225 0.600 3.790 0.870 2.300 0.860
Total Phosphorus(mg/L) 24 0.077 0.063 0.029 0.190 0.036 0.120 0.050
Faecal Coliforms (CFU/100ml) 24 7843.33 1350.00 310.00 62000.00 680.00 10000.00 14879.99
Enterococci (CFU/100ml) 9 340.67 250.00 66.00 690.00 150.00 640.00 224.58
E Coli (CFU/100mL) 3 1966.67 1500.00 1100.00 3300.00 1100.00 3300.00 1171.89
Bicarbonate Alkalinity (mg/CaCO3/L) 4 50.500 53.500 31.200 63.800 31.200 63.800 13.880
Chloride (mg/L) 4 32.925 36.000 9.700 50.000 9.700 50.000 17.320
Sulphate as SO42-(mg/L) 4 17.575 17.500 9.300 26.000 9.300 26.000 6.930
Fluoride (mg/L) 22 0.354 0.345 0.080 0.600 0.260 0.490 0.140
Sodium (mg/L) 4 22.685 23.600 8.540 35.000 8.540 35.000 11.030
Potassium (mg/L) 4 2.943 2.725 2.140 4.180 2.140 4.180 0.950
Magnesium (mg/L) 4 4.920 5.400 2.100 6.780 2.100 6.780 2.280
Calcium (mg/L) 4 21.275 22.900 13.000 26.300 13.000 26.300 5.890
Aluminium (ug/L) 4 856.000 835.500 83.000 1670.000 83.000 1670.000 685.970
Arsenic (ug/L) 4 0.750 0.750 0.500 1.000 0.500 1.000 0.290
Cadmium (ug/L) 4 0.500 0.500 0.500 0.500 0.500 0.500 0.000
Chromium (ug/L) 4 4.500 4.000 2.000 8.000 2.000 8.000 2.650
Copper (ug/L) 4 7.500 7.500 4.000 11.000 4.000 11.000 2.890
Lead (ug/L) 4 2.125 1.500 0.500 5.000 0.500 5.000 2.020
Manganese (ug/L) 4 13.250 12.000 10.000 19.000 10.000 19.000 3.950
Molybdenum (ug/L) 4 1.375 1.000 0.500 3.000 0.500 3.000 1.110
Nickel (ug/L) 4 1.375 1.000 0.500 3.000 0.500 3.000 1.110
Selenium (ug/L) 4 1.500 1.500 1.500 1.500 1.500 1.500 0.000
Silver (ug/L) 4 0.500 0.500 0.500 0.500 0.500 0.500 0.000
Uranium (ug/L) 4 0.500 0.500 0.500 0.500 0.500 0.500 0.000
Zinc (ug/L) 4 60.750 60.000 43.000 80.000 43.000 80.000 16.820
Boron (ug/L) 4 45.750 38.000 21.000 86.000 21.000 86.000 28.430

81 HORNSBY SHIRE COUNCIL 2014-2015 WATER QUALITY MONITORING PROGRAM ANNUAL REPORT
Iron (ug/L) 4 867.000 883.000 702.000 1000.000 702.000 1000.000 136.730
Mercury (ug/L) 4 0.006 0.005 0.005 0.010 0.005 0.010 0.000
Summary Statistics for Site 013 for July 2014 to June 2015
Site 013 Valid N Mean Median Minimum Maximum Percentile Percentile Std.Dev.
20 80
Temperature (oC) 24 16.598 16.715 8.900 21.580 13.400 20.870 3.750
Electrical Conductivity (ms/cm) 24 0.274 0.260 0.120 0.470 0.210 0.320 0.080
Electrical Conductivity (µS/cm) 24 273.000 270.500 98.000 463.000 225.000 312.000 72.190
Turbidity (NTU) 24 9.999 2.750 0.800 56.400 1.600 7.500 16.770
Dissolved oxygen (mg/L) 24 7.013 6.885 4.560 11.020 5.310 8.240 1.670
Dissolved oxygen (%sat) 24 71.556 70.500 48.500 110.100 55.300 87.200 15.610
pH 24 7.144 7.145 6.430 7.550 6.960 7.360 0.250
Salinity (ppt) 24 0.135 0.130 0.060 0.240 0.100 0.160 0.040
Suspended Solids (mg/L) 24 4.375 1.500 1.000 24.000 1.000 4.000 6.700
Ammonium-Nitrogen (mg/L) 24 0.064 0.040 0.010 0.310 0.010 0.090 0.070
Oxidised Nitrogen (mg/L) 24 0.173 0.105 0.030 0.820 0.050 0.240 0.190
Total Nitrogen (mg/L) 24 0.555 0.385 0.190 2.660 0.280 0.750 0.520
Total Phosphorus(mg/L) 24 0.063 0.027 0.011 0.720 0.018 0.051 0.140
Faecal Coliforms (CFU/100ml) 24 3515.17 215.00 10.00 49000.00 44.00 2000.00 10451.79
Enterococci (CFU/100ml) 9 676.56 250.00 59.00 3800.00 120.00 600.00 1185.69
E Coli (CFU/100mL) 3 109.67 68.00 61.00 200.00 61.00 200.00 78.31
Bicarbonate Alkalinity (mg/CaCO3/L) 4 50.450 52.300 32.400 64.800 32.400 64.800 13.700
Chloride (mg/L) 4 27.775 32.000 9.100 38.000 9.100 38.000 13.000
Sulphate as SO42-(mg/L) 4 14.900 16.500 6.600 20.000 6.600 20.000 6.440
Fluoride (mg/L) 22 0.108 0.095 0.060 0.180 0.080 0.130 0.030
Sodium (mg/L) 4 16.635 17.800 7.140 23.800 7.140 23.800 7.300
Potassium (mg/L) 4 2.080 2.170 1.310 2.670 1.310 2.670 0.580
Magnesium (mg/L) 4 4.335 4.420 2.060 6.440 2.060 6.440 1.810
Calcium (mg/L) 4 19.450 20.600 11.600 25.000 11.600 25.000 6.020
Aluminium (ug/L) 4 500.500 243.500 35.000 1480.000 35.000 1480.000 671.990
Arsenic (ug/L) 4 0.500 0.500 0.500 0.500 0.500 0.500 0.000
Cadmium (ug/L) 4 0.500 0.500 0.500 0.500 0.500 0.500 0.000
Chromium (ug/L) 4 1.125 0.500 0.500 3.000 0.500 3.000 1.250
Copper (ug/L) 4 5.000 3.500 1.000 12.000 1.000 12.000 4.970
Lead (ug/L) 4 1.875 0.500 0.500 6.000 0.500 6.000 2.750
Manganese (ug/L) 4 38.250 38.500 27.000 49.000 27.000 49.000 10.440
Molybdenum (ug/L) 4 1.125 1.000 0.500 2.000 0.500 2.000 0.630
Nickel (ug/L) 4 1.000 0.750 0.500 2.000 0.500 2.000 0.710
Selenium (ug/L) 4 1.500 1.500 1.500 1.500 1.500 1.500 0.000
Silver (ug/L) 4 0.500 0.500 0.500 0.500 0.500 0.500 0.000
Uranium (ug/L) 4 0.500 0.500 0.500 0.500 0.500 0.500 0.000
Zinc (ug/L) 4 61.750 41.500 24.000 140.000 24.000 140.000 52.850
Boron (ug/L) 4 30.500 28.000 14.000 52.000 14.000 52.000 15.800
Iron (ug/L) 4 1221.750 1169.500 718.000 1830.000 718.000 1830.000 504.950
Mercury (ug/L) 4 0.006 0.005 0.005 0.010 0.005 0.010 0.000
Summary Statistics for Site 018 for July 2014 to June 2015
Site 018 Valid N Mean Median Minimum Maximum Percentile Percentile Std.Dev.
20 80
Temperature (oC) 4 18.398 18.665 14.2000 22.060 14.2000 22.060 3.2382
Electrical Conductivity (ms/cm) 4 1.108 1.120 0.8600 1.330 0.8600 1.330 0.2472
Electrical Conductivity (µS/cm) 4 1123.750 1112.000 906.0000 1365.000 906.0000 1365.000 231.1873
Turbidity (NTU) 4 22.525 17.450 4.5000 50.700 4.5000 50.700 20.6660
Dissolved oxygen (mg/L) 4 1.963 1.170 0.2100 5.300 0.2100 5.300 2.3942
Dissolved oxygen (%sat) 4 19.725 12.550 2.1000 51.700 2.1000 51.700 23.3099
pH 4 6.750 6.770 6.6500 6.810 6.6500 6.810 0.0712
Salinity (ppt) 4 0.558 0.555 0.4400 0.680 0.4400 0.680 0.1201
Suspended Solids (mg/L) 4 21.250 20.500 4.0000 40.000 4.0000 40.000 17.4619
Ammonium-Nitrogen (mg/L) 4 10.350 10.275 7.5500 13.300 7.5500 13.300 3.1254
Oxidised Nitrogen (mg/L) 4 1.990 2.005 0.7000 3.250 0.7000 3.250 1.0479
Total Nitrogen (mg/L) 4 13.568 14.000 8.4700 17.800 8.4700 17.800 4.3125
Total Phosphorus(mg/L) 4 0.023 0.018 0.0130 0.044 0.0130 0.044 0.0141
Faecal Coliforms (CFU/100ml) 4 55.250 13.000 5.0000 190.000 5.0000 190.000 90.0051
Enterococci (CFU/100ml) 1 310.000 310.000 310.0000 310.000 310.0000 310.000
Summary Statistics for Site 023 for July 2014 to June 2015
Site 023 Valid N Mean Median Minimum Maximum Percentile Percentile Std.Dev.
20 80

82 HORNSBY SHIRE COUNCIL 2014-2015 WATER QUALITY MONITORING PROGRAM ANNUAL REPORT
Temperature (oC) 12 16.406 15.970 9.480 21.730 12.530 21.000 4.212
Electrical Conductivity (ms/cm) 12 0.334 0.295 0.180 0.490 0.260 0.430 0.102
Electrical Conductivity (µS/cm) 12 326.000 360.000 173.000 467.000 225.000 430.000 104.785
Turbidity (NTU) 12 7.983 3.650 1.900 19.000 2.700 17.800 6.791
Dissolved oxygen (mg/L) 12 6.361 8.600 0.370 11.530 1.090 10.630 4.441
Dissolved oxygen (%sat) 12 62.046 88.000 4.000 100.550 12.400 97.100 41.909
pH 12 7.262 7.200 6.910 7.770 6.980 7.510 0.299
Salinity (ppt) 12 0.168 0.160 0.090 0.240 0.130 0.210 0.049
Suspended Solids (mg/L) 12 4.333 3.000 1.000 13.000 2.000 5.000 3.962
Ammonium-Nitrogen (mg/L) 12 0.119 0.010 0.005 1.250 0.005 0.030 0.356
Oxidised Nitrogen (mg/L) 12 0.360 0.180 0.005 1.180 0.040 0.890 0.409
Total Nitrogen (mg/L) 12 0.809 0.570 0.360 1.800 0.400 1.300 0.521
Total Phosphorus(mg/L) 12 0.058 0.055 0.028 0.100 0.042 0.074 0.021
Faecal Coliforms (CFU/100ml) 12 3437.25 625.00 34.00 17000.00 110.00 7900.00 5412.79
Enterococci (CFU/100ml) 4 703.50 130.00 54.00 2500.00 54.00 2500.00 1199.57
Bicarbonate Alkalinity (mg/CaCO3/L) 5 39.040 38.200 33.200 47.700 35.100 43.400 5.338
Chloride (mg/L) 5 36.200 33.000 25.000 48.000 29.000 45.000 8.927
Fluoride (mg/L) 5 0.132 0.100 0.090 0.220 0.090 0.190 0.057
Sodium (mg/L) 5 24.500 22.800 16.100 31.600 19.350 30.500 6.154
Sulphate as SO42-(mg/L) 5 13.260 16.000 8.900 16.000 9.150 16.000 3.756
Potassium (mg/L) 5 2.824 2.850 1.530 4.070 2.160 3.475 0.899
Magnesium (mg/L) 5 4.608 4.060 3.650 5.790 3.845 5.645 0.966
Calcium (mg/L) 5 16.480 17.200 10.900 19.300 14.050 18.550 3.235
Aluminium (ug/L) 5 616.400 473.000 116.000 1150.000 159.500 1145.000 500.187
Arsenic (ug/L) 5 0.700 0.500 0.500 1.000 0.500 1.000 0.274
Cadmium (ug/L) 5 0.500 0.500 0.500 0.500 0.500 0.500 0.000
Chromium (ug/L) 5 1.000 0.500 0.500 3.000 0.500 1.750 1.118
Copper (ug/L) 5 4.600 5.000 2.000 7.000 2.500 6.500 2.074
Lead (ug/L) 5 2.100 3.000 0.500 3.000 0.750 3.000 1.245
Manganese (ug/L) 5 32.800 16.000 16.000 71.000 16.000 58.000 24.773
Molybdenum (ug/L) 5 0.800 0.500 0.500 2.000 0.500 1.250 0.671
Nickel (ug/L) 5 0.800 0.500 0.500 2.000 0.500 1.250 0.671
Selenium (ug/L) 5 1.500 1.500 1.500 1.500 1.500 1.500 0.000
Silver (ug/L) 5 0.500 0.500 0.500 0.500 0.500 0.500 0.000
Uranium (ug/L) 5 0.500 0.500 0.500 0.500 0.500 0.500 0.000
Zinc (ug/L) 5 18.600 19.000 12.000 24.000 14.000 23.000 4.775
Boron (ug/L) 5 33.800 28.000 26.000 57.000 26.500 44.000 13.103
Iron (ug/L) 5 1171.400 1050.000 607.000 1640.000 813.500 1590.000 421.799
Mercury (ug/L) 5 0.005 0.005 0.005 0.010 0.005 0.005 0.000
Summary Statistics for Site 036 for July 2014 to June 2015
Site 036 Valid N Mean Median Minimum Maximum Percentile Percentile Std.Dev.
20 80
Temperature (oC) 12 16.349 16.430 10.170 22.420 13.060 20.510 3.810
Electrical Conductivity (ms/cm) 12 0.174 0.190 0.110 0.230 0.120 0.220 0.047
Electrical Conductivity (µS/cm) 12 159.083 167.500 113.000 196.000 127.000 182.000 26.953
Turbidity (NTU) 12 0.258 0.150 0.000 1.000 0.000 0.500 0.318
Dissolved oxygen (mg/L) 12 9.963 9.960 8.250 11.800 9.160 10.680 0.962
Dissolved oxygen (%sat) 12 99.460 102.100 76.320 104.700 100.900 103.400 8.009
pH 12 5.492 5.485 4.900 6.410 5.040 5.850 0.484
Salinity (ppt) 12 0.085 0.090 0.050 0.110 0.060 0.110 0.022
Suspended Solids (mg/L) 12 1.000 1.000 1.000 1.000 1.000 1.000 0.000
Ammonium-Nitrogen (mg/L) 12 0.005 0.005 0.005 0.010 0.005 0.005 0.001
Oxidised Nitrogen (mg/L) 12 0.009 0.005 0.005 0.030 0.005 0.010 0.007
Total Nitrogen (mg/L) 12 0.095 0.090 0.060 0.130 0.070 0.120 0.024
Total Phosphorus(mg/L) 12 0.003 0.003 0.001 0.004 0.002 0.003 0.001
Faecal Coliforms (CFU/100ml) 12 31.67 12.00 0.50 130.00 2.00 68.00 41.38
Enterococci (CFU/100ml) 5 13.80 6.00 1.00 29.00 3.00 28.50 13.55
E Coli (CFU/100mL) 2 24.25 24.25 0.50 48.00 0.50 48.00 33.59
Bicarbonate Alkalinity (mg/CaCO3/L) 4 3.225 1.700 1.000 8.500 1.000 8.500 3.578
Chloride (mg/L) 4 39.500 39.000 32.000 48.000 32.000 48.000 7.326
Sulphate as SO42-(mg/L) 4 5.500 5.500 3.800 7.200 3.800 7.200 1.398
Fluoride (mg/L) 4 0.025 0.025 0.025 0.025 0.025 0.025 0.000
Sodium (mg/L) 4 21.450 20.500 17.400 27.400 17.400 27.400 4.230
Potassium (mg/L) 4 0.920 0.840 0.700 1.300 0.700 1.300 0.264
Magnesium (mg/L) 4 3.263 3.010 2.660 4.370 2.660 4.370 0.768
Calcium (mg/L) 4 0.770 0.605 0.440 1.430 0.440 1.430 0.447
Aluminium (ug/L) 4 161.000 175.500 90.000 203.000 90.000 203.000 52.997
Arsenic (ug/L) 4 0.500 0.500 0.500 0.500 0.500 0.500 0.000
Cadmium (ug/L) 4 0.500 0.500 0.500 0.500 0.500 0.500 0.000

83 HORNSBY SHIRE COUNCIL 2014-2015 WATER QUALITY MONITORING PROGRAM ANNUAL REPORT
Chromium (ug/L) 4 0.500 0.500 0.500 0.500 0.500 0.500 0.000
Copper (ug/L) 4 0.875 1.000 0.500 1.000 0.500 1.000 0.250
Lead (ug/L) 4 0.500 0.500 0.500 0.500 0.500 0.500 0.000
Manganese (ug/L) 4 42.000 46.500 24.000 51.000 24.000 51.000 12.517
Molybdenum (ug/L) 4 0.500 0.500 0.500 0.500 0.500 0.500 0.000
Nickel (ug/L) 4 0.625 0.500 0.500 1.000 0.500 1.000 0.250
Selenium (ug/L) 4 1.500 1.500 1.500 1.500 1.500 1.500 0.000
Silver (ug/L) 4 0.500 0.500 0.500 0.500 0.500 0.500 0.000
Uranium (ug/L) 4 0.500 0.500 0.500 0.500 0.500 0.500 0.000
Zinc (ug/L) 4 6.375 5.000 2.500 13.000 2.500 13.000 4.571
Boron (ug/L) 4 22.000 24.500 14.000 25.000 14.000 25.000 5.354
Iron (ug/L) 4 290.750 247.500 143.000 525.000 143.000 525.000 169.270
Mercury (ug/L) 4 0.005 0.005 0.005 0.005 0.005 0.005 0.000
Summary Statistics for Site 037 for July 2014 to June 2015
Site 037 Valid N Mean Median Minimum Maximum Percentile Percentile Std.Dev.
20 80
Temperature (oC) 12 15.923 16.635 8.620 21.190 12.220 20.830 4.100
Electrical Conductivity (ms/cm) 12 0.221 0.220 0.130 0.290 0.180 0.260 0.050
Electrical Conductivity (µS/cm) 12 206.750 218.500 117.000 291.000 175.000 230.000 51.119
Turbidity (NTU) 12 1.583 0.600 0.000 8.400 0.000 1.900 2.499
Dissolved oxygen (mg/L) 12 10.253 10.130 8.480 12.610 8.960 11.280 1.298
Dissolved oxygen (%sat) 12 100.762 101.450 93.700 106.500 95.840 104.200 3.900
pH 12 5.643 5.653 4.880 6.360 5.230 6.190 0.528
Salinity (ppt) 12 0.109 0.110 0.030 0.170 0.090 0.130 0.036
Suspended Solids (mg/L) 12 1.500 1.000 1.000 4.000 1.000 1.000 1.168
Ammonium-Nitrogen (mg/L) 12 0.007 0.005 0.005 0.010 0.005 0.010 0.003
Oxidised Nitrogen (mg/L) 12 0.006 0.005 0.005 0.010 0.005 0.005 0.002
Total Nitrogen (mg/L) 12 0.148 0.120 0.080 0.330 0.090 0.200 0.072
Total Phosphorus(mg/L) 12 0.005 0.005 0.003 0.010 0.003 0.007 0.003
Faecal Coliforms (CFU/100ml) 12 212.58 46.00 0.50 1700.00 4.00 140.00 484.59
Enterococci (CFU/100ml) 5 25.60 27.00 10.00 44.00 12.00 38.50 13.90
E Coli (CFU/100mL) 2 35.00 35.00 6.00 64.00 6.00 64.00 41.01
Bicarbonate Alkalinity (mg/CaCO3/L) 4 2.075 1.700 1.000 3.900 1.000 3.900 1.384
Chloride (mg/L) 4 55.500 55.500 49.000 62.000 49.000 62.000 6.028
Sulphate as SO42-(mg/L) 4 5.025 4.850 3.800 6.600 3.800 6.600 1.179
Fluoride (mg/L) 4 0.025 0.025 0.025 0.025 0.025 0.025 0.000
Sodium (mg/L) 4 28.500 28.600 24.200 32.600 24.200 32.600 4.465
Potassium (mg/L) 4 1.168 1.120 0.920 1.510 0.920 1.510 0.283
Magnesium (mg/L) 4 4.723 4.800 3.910 5.380 3.910 5.380 0.608
Calcium (mg/L) 4 1.005 0.950 0.770 1.350 0.770 1.350 0.282
Aluminium (ug/L) 4 127.500 142.500 47.000 178.000 47.000 178.000 56.394
Arsenic (ug/L) 4 0.500 0.500 0.500 0.500 0.500 0.500 0.000
Cadmium (ug/L) 4 0.500 0.500 0.500 0.500 0.500 0.500 0.000
Chromium (ug/L) 4 0.500 0.500 0.500 0.500 0.500 0.500 0.000
Copper (ug/L) 4 0.875 1.000 0.500 1.000 0.500 1.000 0.250
Lead (ug/L) 4 0.500 0.500 0.500 0.500 0.500 0.500 0.000
Manganese (ug/L) 4 54.250 47.000 42.000 81.000 42.000 81.000 18.062
Molybdenum (ug/L) 4 0.500 0.500 0.500 0.500 0.500 0.500 0.000
Nickel (ug/L) 4 1.125 1.000 0.500 2.000 0.500 2.000 0.629
Selenium (ug/L) 4 1.500 1.500 1.500 1.500 1.500 1.500 0.000
Silver (ug/L) 4 0.500 0.500 0.500 0.500 0.500 0.500 0.000
Uranium (ug/L) 4 0.500 0.500 0.500 0.500 0.500 0.500 0.000
Zinc (ug/L) 4 4.375 5.000 2.500 5.000 2.500 5.000 1.250
Boron (ug/L) 4 19.500 20.500 13.000 24.000 13.000 24.000 4.655
Iron (ug/L) 4 629.000 368.500 189.000 1590.000 189.000 1590.000 646.388
Mercury (ug/L) 4 0.005 0.005 0.005 0.005 0.005 0.005 0.000
Summary Statistics for Site 038 for July 2014 to June 2015
Site 038 Valid N Mean Median Minimum Maximum Percentile Percentile Std.Dev.
20 80
Secchi Depth (m) 11 0.868 0.900 0.500 1.100 0.700 1.100 0.198
Temperature (oC) 12 20.811 20.215 12.910 26.790 17.320 25.690 4.602
Turbidity (NTU) 12 11.625 10.950 6.400 22.100 8.700 13.600 4.232
Dissolved oxygen (mg/L) 12 7.541 7.180 5.720 11.280 6.550 8.470 1.475
Dissolved oxygen (%sat) 12 95.313 94.650 82.800 110.160 89.700 97.700 7.628
pH 12 7.871 7.885 7.660 8.010 7.770 7.960 0.103
Salinity (ppt) 12 26.948 28.045 16.100 30.960 24.110 30.330 4.191
Suspended Solids (mg/L) 12 11.833 11.500 6.000 24.000 8.000 14.000 4.726
Ammonium-Nitrogen (mg/L) 12 0.014 0.010 0.005 0.060 0.010 0.010 0.015

84 HORNSBY SHIRE COUNCIL 2014-2015 WATER QUALITY MONITORING PROGRAM ANNUAL REPORT
Oxidised Nitrogen (mg/L) 12 0.043 0.015 0.005 0.200 0.010 0.070 0.058
Total Nitrogen (mg/L) 12 0.306 0.270 0.200 0.630 0.240 0.310 0.115
Total Phosphorus(mg/L) 12 0.021 0.020 0.014 0.031 0.018 0.025 0.005
Soluble Reactive Phosphorus (mg/L) 0
Chlorphyll-a (ug/L) 12 4.625 4.850 2.400 8.000 2.700 6.000 1.767
Faecal Coliforms (CFU/100ml) 12 5.58 2.00 0.50 33.00 1.00 5.00 9.51
Enterococci (CFU/100ml) 12 4.25 2.00 0.50 22.00 1.00 6.00 6.09
Summary Statistics for Site 039 for July 2014 to June 2015
Site 039 Valid N Mean Median Minimum Maximum Percentile Percentile Std.Dev.
20 80
Temperature (oC) 12 15.723 16.270 7.960 20.800 12.370 20.630 4.085
Electrical Conductivity (ms/cm) 12 0.240 0.245 0.150 0.320 0.190 0.280 0.050
Electrical Conductivity (µS/cm) 12 228.000 225.000 130.000 301.000 176.000 275.000 52.352
Turbidity (NTU) 12 1.608 1.000 0.000 5.700 0.100 2.600 1.920
Dissolved oxygen (mg/L) 12 9.443 9.390 6.690 12.010 7.510 10.960 1.834
Dissolved oxygen (%sat) 12 91.888 92.480 74.500 103.300 84.000 101.300 9.792
pH 12 7.141 7.125 6.840 7.710 6.960 7.230 0.219
Salinity (ppt) 12 0.119 0.120 0.070 0.160 0.100 0.140 0.026
Suspended Solids (mg/L) 12 1.250 1.000 1.000 3.000 1.000 1.000 0.622
Ammonium-Nitrogen (mg/L) 12 0.009 0.010 0.005 0.020 0.005 0.010 0.004
Oxidised Nitrogen (mg/L) 12 0.348 0.150 0.040 1.470 0.090 0.620 0.419
Total Nitrogen (mg/L) 12 0.553 0.400 0.200 1.590 0.280 0.770 0.384
Total Phosphorus(mg/L) 12 0.011 0.010 0.005 0.016 0.008 0.015 0.004
Faecal Coliforms (CFU/100ml) 12 159.21 52.00 0.50 940.00 6.00 230.00 263.31
Enterococci (CFU/100ml) 5 93.00 37.00 21.00 320.00 25.00 189.00 127.64
E Coli (CFU/100mL) 2 152.00 152.00 44.00 260.00 44.00 260.00 152.74
Bicarbonate Alkalinity (mg/CaCO3/L) 4 24.025 24.350 17.400 30.000 17.400 30.000 5.185
Chloride (mg/L) 4 38.500 40.000 22.000 52.000 22.000 52.000 12.477
Sulphate as SO42-(mg/L) 4 11.875 12.000 8.500 15.000 8.500 15.000 3.614
Fluoride (mg/L) 4 0.039 0.025 0.025 0.080 0.025 0.080 0.028
Sodium (mg/L) 4 23.925 23.200 15.900 33.400 15.900 33.400 7.284
Potassium (mg/L) 4 1.805 1.640 1.400 2.540 1.400 2.540 0.511
Magnesium (mg/L) 4 4.275 4.155 2.530 6.260 2.530 6.260 1.543
Calcium (mg/L) 4 9.460 8.915 6.410 13.600 6.410 13.600 3.018
Aluminium (ug/L) 4 243.750 161.000 38.000 615.000 38.000 615.000 255.803
Arsenic (ug/L) 4 0.500 0.500 0.500 0.500 0.500 0.500 0.000
Cadmium (ug/L) 4 0.500 0.500 0.500 0.500 0.500 0.500 0.000
Chromium (ug/L) 4 0.500 0.500 0.500 0.500 0.500 0.500 0.000
Copper (ug/L) 4 2.000 1.500 1.000 4.000 1.000 4.000 1.414
Lead (ug/L) 4 0.625 0.500 0.500 1.000 0.500 1.000 0.250
Manganese (ug/L) 4 9.250 6.500 5.000 19.000 5.000 19.000 6.551
Molybdenum (ug/L) 4 0.500 0.500 0.500 0.500 0.500 0.500 0.000
Nickel (ug/L) 4 0.500 0.500 0.500 0.500 0.500 0.500 0.000
Silver (ug/L) 4 0.500 0.500 0.500 0.500 0.500 0.500 0.000
Selenium (ug/L) 4 1.500 1.500 1.500 1.500 1.500 1.500 0.000
Uranium (ug/L) 4 0.500 0.500 0.500 0.500 0.500 0.500 0.000
Zinc (ug/L) 4 5.625 5.000 2.500 10.000 2.500 10.000 3.146
Boron (ug/L) 4 27.000 27.000 22.000 32.000 22.000 32.000 5.228
Iron (ug/L) 4 418.500 407.000 280.000 580.000 280.000 580.000 158.941
Mercury (ug/L) 4 0.005 0.005 0.005 0.005 0.005 0.005 0.000
Summary Statistics for Site 042 for July 2014 to June 2015
Site 042 Valid N Mean Median Minimum Maximum Percentile Percentile Std.Dev.
20 80
Temperature (oC) 12 15.730 16.340 8.910 21.810 12.020 19.250 4.061
Electrical Conductivity (ms/cm) 12 0.352 0.360 0.190 0.490 0.280 0.400 0.083
Electrical Conductivity (µS/cm) 12 351.667 364.000 235.000 455.000 268.000 402.000 69.243
Turbidity (NTU) 12 15.733 7.650 2.700 56.900 3.500 30.300 18.571
Dissolved oxygen (mg/L) 12 8.813 8.690 5.860 12.740 7.680 10.080 1.920
Dissolved oxygen (%sat) 12 87.849 86.150 66.800 119.000 78.100 95.600 13.651
pH 12 6.997 7.095 5.950 7.310 6.950 7.230 0.363
Salinity (ppt) 12 0.177 0.180 0.100 0.240 0.150 0.200 0.038
Suspended Solids (mg/L) 13 6.923 4.000 1.000 21.000 1.000 19.000 7.889
Ammonium-Nitrogen (mg/L) 13 0.024 0.020 0.010 0.050 0.010 0.030 0.012
Oxidised Nitrogen (mg/L) 13 0.288 0.220 0.010 1.540 0.020 0.410 0.416
Total Nitrogen (mg/L) 13 0.755 0.580 0.300 2.460 0.340 1.170 0.596
Total Phosphorus(mg/L) 13 0.060 0.039 0.018 0.222 0.020 0.120 0.060
Faecal Coliforms (CFU/100ml) 13 1195.231 360.000 26.000 8300.000 42.000 900.000 2385.945
Enterococci (CFU/100ml) 6 283.333 280.000 80.000 510.000 220.000 330.000 142.922

85 HORNSBY SHIRE COUNCIL 2014-2015 WATER QUALITY MONITORING PROGRAM ANNUAL REPORT
E Coli (CFU/100mL) 3 706.667 800.000 420.000 900.000 420.000 900.000 253.246
Bicarbonate Alkalinity (mg/CaCO3/L) 4 38.550 38.000 32.100 46.100 32.100 46.100 5.897
Chloride (mg/L) 4 62.250 66.500 43.000 73.000 43.000 73.000 13.696
Sulphate as SO42-(mg/L) 4 18.525 21.000 7.100 25.000 7.100 25.000 7.889
Fluoride (mg/L) 4 0.088 0.090 0.070 0.100 0.070 0.100 0.013
Sodium (mg/L) 4 38.700 39.750 28.800 46.500 28.800 46.500 7.850
Potassium (mg/L) 4 5.860 5.715 5.160 6.850 5.160 6.850 0.794
Magnesium (mg/L) 4 7.520 7.665 6.050 8.700 6.050 8.700 1.226
Calcium (mg/L) 4 15.100 14.850 13.400 17.300 13.400 17.300 1.730
Aluminium (ug/L) 4 1103.000 636.000 120.000 3020.000 120.000 3020.000 1308.677
Arsenic (ug/L) 4 0.513 0.500 0.050 1.000 0.050 1.000 0.388
Cadmium (ug/L) 4 0.388 0.500 0.050 0.500 0.050 0.500 0.225
Chromium (ug/L) 4 1.388 1.250 0.050 3.000 0.050 3.000 1.360
Copper (ug/L) 4 2.500 1.500 1.000 6.000 1.000 6.000 2.380
Lead (ug/L) 4 1.013 0.500 0.050 3.000 0.050 3.000 1.342
Manganese (ug/L) 4 35.750 37.500 25.000 43.000 25.000 43.000 8.461
Molybdenum (ug/L) 4 0.388 0.500 0.050 0.500 0.050 0.500 0.225
Nickel (ug/L) 4 1.013 1.000 0.050 2.000 0.050 2.000 0.796
Selenium (ug/L) 4 1.500 1.500 1.500 1.500 1.500 1.500 0.000
Silver (ug/L) 4 0.500 0.500 0.500 0.500 0.500 0.500 0.000
Uranium (ug/L) 4 0.500 0.500 0.500 0.500 0.500 0.500 0.000
Zinc (ug/L) 4 11.000 11.000 5.000 17.000 5.000 17.000 6.928
Boron (ug/L) 4 39.250 34.500 33.000 55.000 33.000 55.000 10.532
Iron (ug/L) 4 1740.000 1460.000 1240.000 2800.000 1240.000 2800.000 714.283
Mercury (ug/L) 4 0.005 0.005 0.005 0.005 0.005 0.005 0.000
Summary Statistics for Site 043 for July 2014 to June 2015
Site 043 Valid N Mean Median Minimum Maximum Percentile Percentile Std.Dev.
20 80
Temperature (oC) 11 16.557 16.940 9.370 21.440 13.580 21.110 3.996
Electrical Conductivity (ms/cm) 11 0.557 0.580 0.350 0.780 0.460 0.620 0.117
Electrical Conductivity (µS/cm) 11 562.455 580.000 351.000 740.000 476.000 654.000 113.454
Turbidity (NTU) 11 1.673 0.700 0.300 5.100 0.500 2.200 1.782
Dissolved oxygen (mg/L) 11 9.570 9.580 7.430 11.440 8.290 10.850 1.304
Dissolved oxygen (%sat) 11 97.592 97.800 88.110 108.400 94.000 100.800 5.295
pH 11 7.825 7.820 7.610 8.220 7.650 7.970 0.183
Salinity (ppt) 11 0.282 0.290 0.180 0.390 0.230 0.310 0.058
Suspended Solids (mg/L) 11 1.182 1.000 1.000 2.000 1.000 1.000 0.405
Ammonium-Nitrogen (mg/L) 11 0.012 0.010 0.005 0.030 0.010 0.010 0.007
Oxidised Nitrogen (mg/L) 11 2.406 2.350 0.410 6.250 0.950 2.900 1.682
Total Nitrogen (mg/L) 11 3.672 3.350 0.820 9.630 1.540 4.780 2.561
Total Phosphorus(mg/L) 11 0.126 0.085 0.032 0.400 0.043 0.173 0.113
Faecal Coliforms (CFU/100ml) 11 516.18 22.00 3.00 5400.00 11.00 43.00 1619.97
Enterococci (CFU/100ml) 5 35.40 31.00 19.00 64.00 22.50 50.50 17.30
Bicarbonate Alkalinity (mg/CaCO3/L) 4 67.000 62.500 54.100 88.900 54.100 88.900 15.476
Chloride (mg/L) 4 68.500 69.000 58.000 78.000 58.000 78.000 9.147
Fluoride (mg/L) 4 0.365 0.305 0.270 0.580 0.270 0.580 0.147
Sodium (mg/L) 4 59.050 59.700 44.700 72.100 44.700 72.100 12.547
Sulphate as SO42-(mg/L) 4 52.000 53.500 38.000 63.000 38.000 63.000 10.551
Potassium (mg/L) 4 10.018 7.775 5.720 18.800 5.720 18.800 6.032
Magnesium (mg/L) 4 6.235 6.510 5.100 6.820 5.100 6.820 0.793
Calcium (mg/L) 4 30.100 28.400 26.100 37.500 26.100 37.500 5.197
Aluminium (ug/L) 4 133.500 145.500 59.000 184.000 59.000 184.000 61.104
Arsenic (ug/L) 4 0.500 0.500 0.500 0.500 0.500 0.500 0.000
Cadmium (ug/L) 4 0.500 0.500 0.500 0.500 0.500 0.500 0.000
Chromium (ug/L) 4 0.500 0.500 0.500 0.500 0.500 0.500 0.000
Copper (ug/L) 4 2.250 2.000 1.000 4.000 1.000 4.000 1.258
Lead (ug/L) 4 0.500 0.500 0.500 0.500 0.500 0.500 0.000
Manganese (ug/L) 4 6.000 5.500 4.000 9.000 4.000 9.000 2.160
Molybdenum (ug/L) 4 0.750 0.750 0.500 1.000 0.500 1.000 0.289
Nickel (ug/L) 4 1.750 2.000 1.000 2.000 1.000 2.000 0.500
Selenium (ug/L) 4 1.500 1.500 1.500 1.500 1.500 1.500 0.000
Silver (ug/L) 4 0.500 0.500 0.500 0.500 0.500 0.500 0.000
Uranium (ug/L) 4 0.500 0.500 0.500 0.500 0.500 0.500 0.000
Zinc (ug/L) 4 9.375 8.000 2.500 19.000 2.500 19.000 7.341
Boron (ug/L) 4 35.000 37.000 22.000 44.000 22.000 44.000 9.274
Iron (ug/L) 4 212.750 185.500 134.000 346.000 134.000 346.000 96.067
Mercury (ug/L) 4 0.005 0.005 0.005 0.005 0.005 0.005 0.000
Summary Statistics for Site 045 for July 2014 to June 2015

86 HORNSBY SHIRE COUNCIL 2014-2015 WATER QUALITY MONITORING PROGRAM ANNUAL REPORT
Site 045 Valid N Mean Median Minimum Maximum Percentile Percentile Std.Dev.
20 80
Temperature (oC) 12 18.290 18.595 12.000 24.000 15.440 21.820 3.900
Electrical Conductivity (ms/cm) 12 0.548 0.555 0.360 0.710 0.460 0.640 0.110
Electrical Conductivity (µS/cm) 12 565.917 575.000 358.000 688.000 504.000 670.000 103.560
Turbidity (NTU) 12 5.358 0.500 0.000 41.300 0.200 6.400 11.700
Dissolved oxygen (mg/L) 12 9.456 9.455 7.270 11.070 8.560 10.880 1.130
Dissolved oxygen (%sat) 12 99.004 100.550 85.100 103.400 96.700 102.300 4.920
pH 12 7.733 7.765 7.460 7.920 7.620 7.870 0.140
Salinity (ppt) 12 0.278 0.280 0.180 0.370 0.230 0.320 0.060
Suspended Solids (mg/L) 12 1.333 1.000 1.000 5.000 1.000 1.000 1.150
Ammonium-Nitrogen (mg/L) 12 0.031 0.010 0.010 0.210 0.010 0.020 0.060
Oxidised Nitrogen (mg/L) 12 3.160 2.950 1.370 6.000 1.800 4.500 1.430
Total Nitrogen (mg/L) 12 3.862 3.555 2.200 7.360 2.320 5.090 1.560
Total Phosphorus(mg/L) 12 0.074 0.055 0.029 0.250 0.047 0.082 0.060
Chlorphyll-a (ug/L) 12 0.667 0.550 0.300 1.400 0.500 0.900 0.310
Faecal Coliforms (CFU/100ml) 12 4448.92 225.00 44.00 47000.00 51.00 690.00 13445.20
Enterococci (CFU/100ml) 10 65.70 51.00 20.00 210.00 29.50 84.00 56.28
Bicarbonate Alkalinity (mg/CaCO3/L) 3 51.467 57.400 38.600 58.400 38.600 58.400 11.150
Chloride (mg/L) 3 76.667 77.000 65.000 88.000 65.000 88.000 11.500
Fluoride (mg/L) 3 0.367 0.240 0.180 0.680 0.180 0.680 0.270
Sodium (mg/L) 3 59.167 54.200 45.900 77.400 45.900 77.400 16.330
Sulphate as SO42-(mg/L) 3 53.333 46.000 22.000 92.000 22.000 92.000 35.570
Potassium (mg/L) 3 9.240 5.050 4.270 18.400 4.270 18.400 7.940
Magnesium (mg/L) 3 6.960 7.320 4.970 8.590 4.970 8.590 1.840
Calcium (mg/L) 3 31.633 30.400 18.700 45.800 18.700 45.800 13.590
Aluminium (ug/L) 3 1357.667 526.000 57.000 3490.000 57.000 3490.000 1861.480
Arsenic (ug/L) 3 1.000 0.500 0.500 2.000 0.500 2.000 0.870
Cadmium (ug/L) 3 0.500 0.500 0.500 0.500 0.500 0.500 0.000
Chromium (ug/L) 3 1.167 1.000 0.500 2.000 0.500 2.000 0.760
Copper (ug/L) 3 6.333 5.000 5.000 9.000 5.000 9.000 2.310
Lead (ug/L) 3 1.000 0.500 0.500 2.000 0.500 2.000 0.870
Manganese (ug/L) 3 107.333 18.000 7.000 297.000 7.000 297.000 164.350
Molybdenum (ug/L) 3 1.167 1.000 0.500 2.000 0.500 2.000 0.760
Nickel (ug/L) 3 2.333 2.000 2.000 3.000 2.000 3.000 0.580
Selenium (ug/L) 3 1.500 1.500 1.500 1.500 1.500 1.500 0.000
Silver (ug/L) 3 0.500 0.500 0.500 0.500 0.500 0.500 0.000
Uranium (ug/L) 3 0.500 0.500 0.500 0.500 0.500 0.500 0.000
Zinc (ug/L) 3 15.333 18.000 7.000 21.000 7.000 21.000 7.370
Boron (ug/L) 3 51.333 40.000 34.000 80.000 34.000 80.000 25.010
Iron (ug/L) 3 848.333 724.000 191.000 1630.000 191.000 1630.000 727.510
Mercury (ug/L) 3 0.005 0.005 0.005 0.010 0.005 0.005 0.000
Summary Statistics for Site 046 for July 2014 to June 2015
Site 046 Valid N Mean Median Minimum Maximum Percentile Percentile Std.Dev.
20 80
Temperature (oC) 12 16.680 15.635 11.850 23.500 14.280 20.990 3.600
Electrical Conductivity (ms/cm) 12 0.470 0.500 0.050 0.700 0.380 0.600 0.200
Electrical Conductivity (µS/cm) 12 479.920 525.500 102.000 625.000 397.000 610.000 153.000
Turbidity (NTU) 12 9.880 3.950 0.700 36.500 2.400 16.500 12.600
Dissolved oxygen (mg/L) 12 10.160 10.145 8.490 12.000 9.320 10.830 1.000
Dissolved oxygen (%sat) 12 103.170 100.650 96.200 120.700 99.200 105.300 6.300
pH 12 7.640 7.445 7.200 8.600 7.290 8.160 0.500
Salinity (ppt) 12 0.240 0.260 0.020 0.300 0.170 0.300 0.100
Suspended Solids (mg/L) 12 5.830 2.500 1.000 34.000 1.000 6.000 9.600
Ammonium-Nitrogen (mg/L) 12 0.450 0.060 0.005 4.600 0.020 0.080 1.300
Oxidised Nitrogen (mg/L) 12 0.340 0.290 0.100 0.700 0.150 0.500 0.200
Total Nitrogen (mg/L) 12 1.320 0.615 0.290 9.000 0.440 1.040 2.400
Total Phosphorus(mg/L) 12 0.120 0.023 0.011 1.000 0.016 0.056 0.300
Faecal Coliforms (CFU/100ml) 12 51239.92 315.00 42.00 580000.00 140.00 7900.00 166660.80
Enterococci (CFU/100ml) 5 1503.40 110.00 24.00 7100.00 43.50 3660.00 3129.50
E Coli (CFU/100mL) 2 3971.00 3971.00 42.00 7900.00 42.00 7900.00 5556.40
Bicarbonate Alkalinity (mg/CaCO3/L) 4 45.850 51.000 24.800 56.600 24.800 56.600 14.600
Chloride (mg/L) 4 53.500 62.500 13.000 76.000 13.000 76.000 29.600
Sulphate as SO42-(mg/L) 4 25.000 28.000 6.000 38.000 6.000 38.000 13.500
Fluoride (mg/L) 4 0.080 0.080 0.060 0.100 0.060 0.100 0.000
Sodium (mg/L) 4 38.550 40.300 10.300 63.300 10.300 63.300 22.400
Potassium (mg/L) 4 3.740 2.960 2.060 7.000 2.060 6.980 2.200
Magnesium (mg/L) 4 5.510 5.980 1.320 8.800 1.320 8.760 3.400
Calcium (mg/L) 4 24.460 27.400 8.450 34.600 8.450 34.600 11.300

87 HORNSBY SHIRE COUNCIL 2014-2015 WATER QUALITY MONITORING PROGRAM ANNUAL REPORT
Aluminium (ug/L) 4 657.000 583.000 62.000 1400.000 62.000 1400.000 635.200
Arsenic (ug/L) 4 0.630 0.500 0.500 1.000 0.500 1.000 0.300
Cadmium (ug/L) 4 0.500 0.500 0.500 0.500 0.500 0.500 0.000
Chromium (ug/L) 4 1.250 0.750 0.500 3.000 0.500 3.000 1.200
Copper (ug/L) 4 4.750 5.000 1.000 8.000 1.000 8.000 2.900
Lead (ug/L) 4 2.000 1.750 0.500 4.000 0.500 4.000 1.800
Manganese (ug/L) 4 53.250 52.500 22.000 86.000 22.000 86.000 35.000
Molybdenum (ug/L) 4 0.880 0.500 0.500 2.000 0.500 2.000 0.800
Nickel (ug/L) 4 1.130 1.000 0.500 2.000 0.500 2.000 0.600
Silver (ug/L) 4 0.500 0.500 0.500 0.500 0.500 0.500 0.000
Selenium (ug/L) 4 1.500 1.500 1.500 1.500 1.500 1.500 0.000
Uranium (ug/L) 4 0.500 0.500 0.500 0.500 0.500 0.500 0.000
Zinc (ug/L) 4 29.250 30.000 27.000 30.000 27.000 30.000 1.500
Boron (ug/L) 4 40.000 40.500 17.000 62.000 17.000 62.000 18.900
Iron (ug/L) 4 1960.000 1285.000 1150.000 4120.000 1150.000 4120.000 1441.900
Mercury (ug/L) 4 0.010 0.005 0.005 0.000 0.005 0.005 0.000
Summary Statistics for Site 048 for July 2014 to June 2015
Site 048 Valid N Mean Median Minimum Maximum Percentile Percentile Std.Dev.
20 80
Secchi Depth (m) 10 0.640 0.650 0.200 1.100 0.400 0.850 0.272
Temperature (oC) 12 18.733 18.965 10.440 24.670 14.670 23.650 4.909
Turbidity (NTU) 12 25.083 20.700 7.500 68.800 12.200 26.100 19.022
Dissolved oxygen (mg/L) 12 6.782 6.355 4.360 11.060 4.800 8.590 2.162
Dissolved oxygen (%sat) 12 76.518 69.100 59.300 103.900 65.600 89.800 14.738
pH 12 7.208 7.380 6.350 7.580 6.850 7.540 0.408
Salinity (ppt) 12 17.320 20.855 0.200 26.740 7.930 25.460 9.623
Suspended Solids (mg/L) 12 22.083 17.500 4.000 53.000 11.000 35.000 14.519
Ammonium-Nitrogen (mg/L) 12 0.037 0.030 0.010 0.140 0.020 0.040 0.034
Oxidised Nitrogen (mg/L) 12 0.098 0.020 0.005 0.840 0.010 0.050 0.236
Total Nitrogen (mg/L) 12 0.523 0.395 0.290 1.550 0.360 0.610 0.341
Total Phosphorus(mg/L) 12 0.043 0.037 0.017 0.125 0.022 0.052 0.030
Soluble Reactive Phosphorus (mg/L) 0
Chlorphyll-a (ug/L) 12 7.008 5.250 1.200 21.300 2.900 11.900 5.802
Faecal Coliforms (CFU/100ml) 12 507.17 20.00 3.00 5600.00 6.00 100.00 1605.36
Enterococci (CFU/100ml) 12 191.25 12.00 2.00 2000.00 7.00 59.00 571.13
Summary Statistics for Site 049 for July 2014 to June 2015
Site 049 Valid N Mean Median Minimum Maximum Percentile Percentile Std.Dev.
20 80
Temperature (oC) 12 15.458 15.645 9.140 20.860 11.880 19.210 3.813
Electrical Conductivity (ms/cm) 12 0.473 0.480 0.190 0.740 0.330 0.600 0.164
Electrical Conductivity (µS/cm) 12 476.000 445.000 260.000 797.000 306.000 617.000 165.706
Turbidity (NTU) 12 16.017 7.600 1.400 55.100 2.100 37.300 18.682
Dissolved oxygen (mg/L) 12 9.444 9.195 7.000 12.520 8.250 10.760 1.574
Dissolved oxygen (%sat) 12 94.026 93.600 78.500 117.000 86.300 100.200 9.847
pH 12 7.065 7.105 6.350 7.410 6.900 7.350 0.300
Salinity (ppt) 12 0.233 0.220 0.100 0.370 0.160 0.300 0.082
Suspended Solids (mg/L) 12 5.083 2.000 1.000 19.000 1.000 11.000 5.823
Ammonium-Nitrogen (mg/L) 12 0.023 0.015 0.010 0.060 0.010 0.040 0.018
Oxidised Nitrogen (mg/L) 12 0.269 0.100 0.005 1.820 0.050 0.310 0.499
Total Nitrogen (mg/L) 12 0.747 0.530 0.080 2.870 0.340 1.110 0.740
Total Phosphorus(mg/L) 12 0.065 0.025 0.002 0.320 0.012 0.134 0.092
Faecal Coliforms (CFU/100ml) 12 1223.417 133.500 7.000 7300.000 16.000 980.000 2425.306
Enterococci (CFU/100ml) 5 363.400 130.000 7.000 1200.000 23.500 820.000 497.959
E Coli (CFU/100mL) 2 600.000 600.000 220.000 980.000 220.000 980.000 537.401
Bicarbonate Alkalinity (mg/CaCO3/L) 4 25.450 30.850 1.000 39.100 1.000 39.100 17.097
Chloride (mg/L) 4 82.500 88.000 59.000 95.000 59.000 95.000 16.340
Sulphate as SO42-(mg/L) 4 15.000 15.500 5.000 24.000 5.000 24.000 7.874
Fluoride (mg/L) 4 0.061 0.070 0.025 0.080 0.025 0.080 0.025
Sodium (mg/L) 4 46.575 48.450 37.200 52.200 37.200 52.200 6.633
Potassium (mg/L) 4 5.270 5.980 2.180 6.940 2.180 6.940 2.117
Magnesium (mg/L) 4 8.473 8.690 6.860 9.650 6.860 9.650 1.168
Calcium (mg/L) 4 9.568 11.650 2.270 12.700 2.270 12.700 4.965
Aluminium (ug/L) 4 927.500 534.000 262.000 2380.000 262.000 2380.000 994.520
Arsenic (ug/L) 4 0.513 0.500 0.050 1.000 0.050 1.000 0.388
Cadmium (ug/L) 4 0.388 0.500 0.050 0.500 0.050 0.500 0.225
Chromium (ug/L) 4 1.138 0.750 0.050 3.000 0.050 3.000 1.301
Copper (ug/L) 4 2.500 1.500 1.000 6.000 1.000 6.000 2.380
Lead (ug/L) 4 0.763 0.500 0.050 2.000 0.050 2.000 0.852

88 HORNSBY SHIRE COUNCIL 2014-2015 WATER QUALITY MONITORING PROGRAM ANNUAL REPORT
Manganese (ug/L) 4 139.750 70.000 37.000 382.000 37.000 382.000 162.594
Molybdenum (ug/L) 4 0.388 0.500 0.050 0.500 0.050 0.500 0.225
Nickel (ug/L) 4 2.500 2.000 1.000 5.000 1.000 5.000 1.915
Selenium (ug/L) 4 1.500 1.500 1.500 1.500 1.500 1.500 0.000
Silver (ug/L) 4 0.500 0.500 0.500 0.500 0.500 0.500 0.000
Uranium (ug/L) 4 0.500 0.500 0.500 0.500 0.500 0.500 0.000
Zinc (ug/L) 4 11.625 14.000 2.500 16.000 2.500 16.000 6.156
Boron (ug/L) 4 27.750 27.000 23.000 34.000 23.000 34.000 4.646
Iron (ug/L) 4 1688.000 1545.000 582.000 3080.000 582.000 3080.000 1033.481
Mercury (ug/L) 4 0.005 0.005 0.005 0.005 0.005 0.005 0.000
Summary Statistics for Site 052 for July 2014 to June 2015
Site 052 Valid N Mean Median Minimum Maximum Percentile Percentile Std.Dev.
20 80
Temperature (oC) 12 15.693 17.460 6.900 22.430 12.090 19.920 4.693
Electrical Conductivity (ms/cm) 12 0.278 0.265 0.190 0.400 0.210 0.340 0.072
Electrical Conductivity (µS/cm) 12 271.083 268.500 187.000 351.000 212.000 329.000 55.092
Turbidity (NTU) 12 6.075 5.200 0.700 20.800 2.000 7.300 5.578
Dissolved oxygen (mg/L) 12 8.083 8.885 5.010 10.230 5.820 10.080 1.997
Dissolved oxygen (%sat) 12 80.244 84.750 52.000 95.900 63.500 94.500 15.000
pH 12 7.162 7.270 6.240 7.580 7.040 7.330 0.338
Salinity (ppt) 12 0.140 0.130 0.090 0.200 0.100 0.180 0.040
Suspended Solids (mg/L) 14 1.571 1.000 1.000 5.000 1.000 2.000 1.284
Ammonium-Nitrogen (mg/L) 14 0.016 0.015 0.005 0.030 0.010 0.020 0.008
Oxidised Nitrogen (mg/L) 14 0.151 0.110 0.010 0.740 0.020 0.220 0.190
Total Nitrogen (mg/L) 14 0.421 0.325 0.150 1.020 0.240 0.570 0.236
Total Phosphorus(mg/L) 14 0.025 0.023 0.005 0.049 0.014 0.036 0.013
Faecal Coliforms (CFU/100ml) 14 847.43 265.00 18.00 3900.00 77.00 2000.00 1297.11
Enterococci (CFU/100ml) 6 211.33 245.00 31.00 380.00 47.00 320.00 144.57
Bicarbonate Alkalinity (mg/CaCO3/L) 4 43.525 43.750 36.700 49.900 36.700 49.900 5.908
Chloride (mg/L) 4 40.000 43.500 25.000 48.000 25.000 48.000 10.614
Fluoride (mg/L) 4 0.075 0.075 0.070 0.080 0.070 0.080 0.006
Sodium (mg/L) 4 23.800 23.850 17.500 30.000 17.500 30.000 5.258
Sulphate as SO42-(mg/L) 4 13.950 15.500 4.800 20.000 4.800 20.000 7.430
Potassium (mg/L) 4 1.840 2.050 1.130 2.130 1.130 2.130 0.475
Magnesium (mg/L) 4 5.560 5.400 4.150 7.290 4.150 7.290 1.376
Calcium (mg/L) 4 14.900 14.250 13.400 17.700 13.400 17.700 1.944
Aluminium (ug/L) 4 296.250 280.500 43.000 581.000 43.000 581.000 263.772
Arsenic (ug/L) 4 0.500 0.500 0.500 0.500 0.500 0.500 0.000
Cadmium (ug/L) 4 0.500 0.500 0.500 0.500 0.500 0.500 0.000
Chromium (ug/L) 4 0.500 0.500 0.500 0.500 0.500 0.500 0.000
Copper (ug/L) 4 2.500 1.500 1.000 6.000 1.000 6.000 2.380
Lead (ug/L) 4 1.000 0.750 0.500 2.000 0.500 2.000 0.707
Manganese (ug/L) 4 31.500 25.500 13.000 62.000 13.000 62.000 21.486
Molybdenum (ug/L) 4 0.500 0.500 0.500 0.500 0.500 0.500 0.000
Nickel (ug/L) 4 0.875 1.000 0.500 1.000 0.500 1.000 0.250
Selenium (ug/L) 4 1.500 1.500 1.500 1.500 1.500 1.500 0.000
Silver (ug/L) 4 0.500 0.500 0.500 0.500 0.500 0.500 0.000
Uranium (ug/L) 4 0.500 0.500 0.500 0.500 0.500 0.500 0.000
Zinc (ug/L) 4 10.500 10.000 5.000 17.000 5.000 17.000 5.916
Boron (ug/L) 4 29.750 33.000 16.000 37.000 16.000 37.000 9.674
Iron (ug/L) 4 1134.500 1048.000 612.000 1830.000 612.000 1830.000 512.711
Mercury (ug/L) 4 0.005 0.005 0.005 0.005 0.005 0.005 0.000
Summary Statistics for Site 054 for July 2014 to June 2015
Site 054 Valid N Mean Median Minimum Maximum Percentile Percentile Std.Dev.
20 80
Temperature (oC) 12 16.060 16.480 9.410 22.510 12.030 19.310 4.225
Electrical Conductivity (ms/cm) 12 0.213 0.200 0.060 0.360 0.110 0.340 0.105
Electrical Conductivity (µS/cm) 12 206.250 186.500 90.000 335.000 110.000 321.000 95.445
Turbidity (NTU) 12 17.467 3.450 0.000 100.400 0.000 28.300 28.717
Dissolved oxygen (mg/L) 12 10.091 10.145 7.260 13.250 9.380 11.260 1.691
Dissolved oxygen (%sat) 12 101.425 101.750 84.500 124.700 97.900 104.000 9.790
pH 12 5.557 5.630 4.000 7.010 4.760 6.460 0.983
Salinity (ppt) 12 0.105 0.095 0.030 0.180 0.050 0.170 0.053
Suspended Solids (mg/L) 12 4.917 2.000 1.000 35.000 1.000 4.000 9.539
Ammonium-Nitrogen (mg/L) 12 0.011 0.005 0.005 0.060 0.005 0.010 0.016
Oxidised Nitrogen (mg/L) 12 0.012 0.008 0.005 0.040 0.005 0.010 0.011
Total Nitrogen (mg/L) 12 0.192 0.130 0.060 0.460 0.090 0.330 0.136
Total Phosphorus(mg/L) 12 0.013 0.006 0.003 0.047 0.005 0.016 0.014

89 HORNSBY SHIRE COUNCIL 2014-2015 WATER QUALITY MONITORING PROGRAM ANNUAL REPORT
Faecal Coliforms (CFU/100ml) 12 558.63 23.00 0.50 2900.00 9.00 500.00 1103.98
Enterococci (CFU/100ml) 5 182.60 40.00 9.00 800.00 13.50 423.00 345.47
E Coli (CFU/100mL) 2 265.00 265.00 30.00 500.00 30.00 500.00 332.34
Bicarbonate Alkalinity (mg/CaCO3/L) 4 3.975 3.850 2.700 5.500 2.700 5.500 1.159
Chloride (mg/L) 4 39.250 40.500 24.000 52.000 24.000 52.000 12.366
Sulphate as SO42-(mg/L) 4 4.700 4.650 4.200 5.300 4.200 5.300 0.469
Fluoride (mg/L) 4 0.025 0.025 0.025 0.025 0.025 0.025 0.000
Sodium (mg/L) 4 20.400 19.800 13.500 28.500 13.500 28.500 6.694
Potassium (mg/L) 4 1.725 1.755 1.300 2.090 1.300 2.090 0.390
Magnesium (mg/L) 4 3.188 3.025 1.840 4.860 1.840 4.860 1.347
Calcium (mg/L) 4 1.395 1.360 0.910 1.950 0.910 1.950 0.513
Aluminium (ug/L) 4 950.250 876.000 639.000 1410.000 639.000 1410.000 366.290
Arsenic (ug/L) 4 0.388 0.500 0.050 0.500 0.050 0.500 0.225
Cadmium (ug/L) 4 0.388 0.500 0.050 0.500 0.050 0.500 0.225
Chromium (ug/L) 4 1.263 1.500 0.050 2.000 0.050 2.000 0.936
Copper (ug/L) 4 1.250 1.000 1.000 2.000 1.000 2.000 0.500
Lead (ug/L) 4 0.638 0.750 0.050 1.000 0.050 1.000 0.457
Manganese (ug/L) 4 39.500 31.500 19.000 76.000 19.000 76.000 25.775
Molybdenum (ug/L) 4 0.388 0.500 0.050 0.500 0.050 0.500 0.225
Nickel (ug/L) 4 2.250 2.000 1.000 4.000 1.000 4.000 1.258
Selenium (ug/L) 4 1.500 1.500 1.500 1.500 1.500 1.500 0.000
Silver (ug/L) 4 0.500 0.500 0.500 0.500 0.500 0.500 0.000
Uranium (ug/L) 4 0.500 0.500 0.500 0.500 0.500 0.500 0.000
Zinc (ug/L) 4 10.750 11.000 5.000 16.000 5.000 16.000 4.500
Boron (ug/L) 4 16.250 15.000 14.000 21.000 14.000 21.000 3.304
Iron (ug/L) 4 702.250 713.500 362.000 1020.000 362.000 1020.000 339.368
Mercury (ug/L) 4 0.005 0.005 0.005 0.005 0.005 0.005 0.000
Summary Statistics for Site 055 for July 2014 to June 2015
Site 055 Valid N Mean Median Minimum Maximum Percentile Percentile Std.Dev.
20 80
Secchi Depth (m) 11 1.045 1.000 0.700 1.900 0.800 1.100 0.314
Temperature (oC) 12 20.161 19.670 14.150 25.000 16.910 24.380 3.649
Turbidity (NTU) 12 10.842 10.400 5.200 18.000 9.400 11.900 3.341
Dissolved oxygen (mg/L) 12 7.476 7.010 6.150 10.970 6.780 8.180 1.289
Dissolved oxygen (%sat) 12 96.817 95.800 84.200 111.600 90.600 101.500 7.641
pH 12 7.992 8.045 7.630 8.180 7.940 8.070 0.158
Salinity (ppt) 12 32.338 33.200 23.020 34.470 32.120 33.880 3.077
Suspended Solids (mg/L) 13 14.846 15.000 7.000 23.000 11.000 18.000 4.240
Ammonium-Nitrogen (mg/L) 13 0.026 0.020 0.010 0.070 0.020 0.020 0.020
Oxidised Nitrogen (mg/L) 13 0.045 0.010 0.010 0.160 0.010 0.080 0.056
Total Nitrogen (mg/L) 13 0.295 0.240 0.200 0.580 0.210 0.320 0.122
Total Phosphorus(mg/L) 13 0.025 0.020 0.017 0.070 0.018 0.028 0.014
Soluble Reactive Phosphorus (mg/L) 1 0.011 0.011 0.011 0.011 0.011 0.011
Chlorphyll-a (ug/L) 13 1.954 1.500 1.200 3.800 1.400 2.900 0.911
Faecal Coliforms (CFU/100ml) 13 11.12 6.00 0.50 29.00 0.50 25.00 11.52
Enterococci (CFU/100ml) 13 4.46 2.00 0.50 15.00 1.00 9.00 4.87
Summary Statistics for Site 060 for July 2014 to June 2015
Site 060 Valid N Mean Median Minimum Maximum Percentile Percentile Std.Dev.
20 80
Secchi Depth (m) 13 2.119 2.100 1.000 3.800 1.500 2.600 0.774
Temperature (oC) 12 20.518 19.790 12.000 27.450 15.310 27.230 5.352
Turbidity (NTU) 12 2.983 1.450 0.000 13.300 0.800 4.800 3.834
Dissolved oxygen (mg/L) 12 6.526 6.235 3.960 9.980 4.990 8.240 1.829
Dissolved oxygen (%sat) 12 77.843 77.500 57.200 99.000 65.200 91.920 12.821
pH 12 7.514 7.535 6.960 7.840 7.320 7.750 0.247
Salinity (ppt) 12 19.899 20.795 4.840 26.870 17.410 23.780 5.646
Suspended Solids (mg/L) 13 5.615 6.000 1.000 10.000 2.000 9.000 3.097
Ammonium-Nitrogen (mg/L) 13 0.046 0.030 0.010 0.160 0.010 0.090 0.048
Oxidised Nitrogen (mg/L) 13 0.143 0.090 0.005 0.330 0.030 0.290 0.125
Total Nitrogen (mg/L) 13 0.513 0.450 0.300 0.910 0.340 0.700 0.194
Total Phosphorus(mg/L) 13 0.032 0.027 0.016 0.069 0.021 0.040 0.015
Soluble Reactive Phosphorus (mg/L) 5 0.016 0.017 0.011 0.019 0.012 0.019 0.003
Chlorphyll-a (ug/L) 13 5.385 5.800 1.700 10.200 3.200 7.300 2.490
Faecal Coliforms (CFU/100ml) 13 414.92 9.00 1.00 4300.00 4.00 22.00 1199.06
Enterococci (CFU/100ml) 13 48.38 2.00 0.50 500.00 0.50 7.00 138.36
Summary Statistics for Site 061 for July 2014 to June 2015
Site 061 Valid N Mean Median Minimum Maximum Percentile Percentile Std.Dev.

90 HORNSBY SHIRE COUNCIL 2014-2015 WATER QUALITY MONITORING PROGRAM ANNUAL REPORT
20 80
Secchi Depth (m) 26 2.002 2.000 0.550 3.500 1.500 2.300 0.749
Temperature (oC) 27 20.923 20.960 11.970 27.900 15.410 26.890 5.348
Turbidity (NTU) 27 2.911 1.500 0.200 20.100 1.000 2.900 4.219
Dissolved oxygen (mg/L) 27 7.410 7.060 4.820 10.840 6.040 8.950 1.519
Dissolved oxygen (%sat) 27 92.200 94.100 67.700 122.400 74.300 103.100 15.422
pH 27 7.659 7.690 6.830 7.990 7.490 7.900 0.287
Salinity (ppt) 27 21.104 22.020 1.610 27.830 19.200 24.770 5.860
Suspended Solids (mg/L) 28 5.821 5.000 1.000 16.000 3.000 9.000 3.570
Ammonium-Nitrogen (mg/L) 28 0.027 0.010 0.005 0.160 0.010 0.030 0.040
Oxidised Nitrogen (mg/L) 28 0.091 0.030 0.005 0.320 0.005 0.250 0.113
Total Nitrogen (mg/L) 28 0.479 0.420 0.270 1.040 0.340 0.620 0.185
Total Phosphorus(mg/L) 28 0.038 0.032 0.014 0.162 0.020 0.047 0.029
Soluble Reactive Phosphorus (mg/L) 10 0.015 0.015 0.008 0.020 0.011 0.018 0.004
Chlorphyll-a (ug/L) 27 10.378 10.200 0.300 30.500 4.000 15.100 7.862
Faecal Coliforms (CFU/100ml) 28 130.04 2.50 0.50 2700.00 1.00 28.00 514.88
Enterococci (CFU/100ml) 28 25.05 1.00 0.50 540.00 0.50 5.00 101.85
Summary Statistics for Site 062 for July 2014 to June 2015
Site 062 Valid N Mean Median Minimum Maximum Percentile Percentile Std.Dev.
20 80
Temperature (oC) 12 16.341 16.165 10.220 22.760 13.060 19.750 3.766
Electrical Conductivity (ms/cm) 12 0.403 0.395 0.270 0.510 0.350 0.460 0.067
Electrical Conductivity (µS/cm) 12 394.167 407.000 261.000 476.000 363.000 436.000 58.041
Turbidity (NTU) 12 3.817 1.900 0.900 17.100 1.300 4.800 4.524
Dissolved oxygen (mg/L) 12 8.738 9.230 6.650 10.300 7.230 9.820 1.223
Dissolved oxygen (%sat) 12 88.914 89.000 74.900 102.000 78.100 99.400 9.358
pH 12 7.326 7.315 7.050 7.580 7.200 7.420 0.153
Salinity (ppt) 12 0.199 0.195 0.130 0.260 0.170 0.230 0.036
Suspended Solids (mg/L) 12 1.917 1.000 1.000 6.000 1.000 3.000 1.621
Ammonium-Nitrogen (mg/L) 12 0.039 0.030 0.005 0.090 0.010 0.080 0.031
Oxidised Nitrogen (mg/L) 12 0.525 0.085 0.020 2.350 0.030 0.780 0.834
Total Nitrogen (mg/L) 12 0.893 0.445 0.220 2.820 0.400 1.120 0.893
Total Phosphorus(mg/L) 12 0.030 0.023 0.007 0.090 0.017 0.042 0.022
Faecal Coliforms (CFU/100ml) 12 402.667 210.000 21.000 1400.000 53.000 670.000 461.008
Enterococci (CFU/100ml) 5 78.200 72.000 36.000 140.000 45.500 114.000 39.601
E Coli (CFU/100mL) 3 196.667 170.000 120.000 300.000 120.000 300.000 92.916
Bicarbonate Alkalinity (mg/CaCO3/L) 4 67.075 66.800 58.400 76.300 58.400 76.300 7.391
Chloride (mg/L) 4 52.000 57.500 32.000 61.000 32.000 61.000 13.441
Sulphate as SO42-(mg/L) 4 18.950 19.750 4.300 32.000 4.300 32.000 14.099
Fluoride (mg/L) 4 0.040 0.038 0.025 0.060 0.025 0.060 0.018
Sodium (mg/L) 4 39.175 42.050 25.700 46.900 25.700 46.900 9.270
Potassium (mg/L) 4 3.870 3.695 3.150 4.940 3.150 4.940 0.859
Magnesium (mg/L) 4 7.168 6.900 5.800 9.070 5.800 9.070 1.413
Calcium (mg/L) 4 19.525 19.500 16.000 23.100 16.000 23.100 3.288
Aluminium (ug/L) 4 207.500 213.000 58.000 346.000 58.000 346.000 121.360
Arsenic (ug/L) 4 0.500 0.500 0.500 0.500 0.500 0.500 0.000
Cadmium (ug/L) 4 0.500 0.500 0.500 0.500 0.500 0.500 0.000
Chromium (ug/L) 4 0.625 0.500 0.500 1.000 0.500 1.000 0.250
Copper (ug/L) 4 1.750 1.500 1.000 3.000 1.000 3.000 0.957
Lead (ug/L) 4 0.500 0.500 0.500 0.500 0.500 0.500 0.000
Manganese (ug/L) 4 30.000 28.000 14.000 50.000 14.000 50.000 15.427
Molybdenum (ug/L) 4 0.500 0.500 0.500 0.500 0.500 0.500 0.000
Nickel (ug/L) 4 0.625 0.500 0.500 1.000 0.500 1.000 0.250
Selenium (ug/L) 4 1.500 1.500 1.500 1.500 1.500 1.500 0.000
Silver (ug/L) 4 0.500 0.500 0.500 0.500 0.500 0.500 0.000
Uranium (ug/L) 4 0.500 0.500 0.500 0.500 0.500 0.500 0.000
Zinc (ug/L) 4 7.375 5.000 2.500 17.000 2.500 17.000 6.524
Boron (ug/L) 4 44.250 45.000 36.000 51.000 36.000 51.000 6.994
Iron (ug/L) 4 754.250 763.500 390.000 1100.000 390.000 1100.000 372.629
Mercury (ug/L) 4 0.005 0.005 0.005 0.005 0.005 0.005 0.000
Summary Statistics for Site 063 for July 2014 to June 2015
Site 063 Valid N Mean Median Minimum Maximum Percentile Percentile Std.Dev.
20 80
Temperature (oC) 9 14.337 13.800 7.420 20.470 11.090 19.810 4.252
Electrical Conductivity (ms/cm) 9 0.438 0.440 0.190 0.620 0.380 0.510 0.116
Electrical Conductivity (µS/cm) 9 450.222 434.000 231.000 713.000 383.000 505.000 126.608
Turbidity (NTU) 9 7.900 2.000 1.500 52.000 1.600 5.700 16.588
Dissolved oxygen (mg/L) 9 8.614 7.870 4.980 11.650 6.200 11.090 2.411

91 HORNSBY SHIRE COUNCIL 2014-2015 WATER QUALITY MONITORING PROGRAM ANNUAL REPORT
Dissolved oxygen (%sat) 9 82.875 81.600 55.400 102.800 61.500 98.100 16.996
pH 9 7.114 7.060 6.710 7.470 6.930 7.440 0.247
Salinity (ppt) 9 0.224 0.230 0.100 0.310 0.190 0.260 0.057
Suspended Solids (mg/L) 9 4.000 1.000 1.000 28.000 1.000 1.000 9.000
Ammonium-Nitrogen (mg/L) 9 0.014 0.010 0.005 0.030 0.010 0.020 0.008
Oxidised Nitrogen (mg/L) 9 0.221 0.030 0.010 1.400 0.020 0.270 0.451
Total Nitrogen (mg/L) 9 0.601 0.420 0.230 2.290 0.290 0.620 0.644
Total Phosphorus(mg/L) 9 0.037 0.022 0.007 0.177 0.014 0.028 0.053
Faecal Coliforms (CFU/100ml) 9 949.667 41.000 15.000 7900.000 27.000 260.000 2607.710
Enterococci (CFU/100ml) 3 109.667 95.000 84.000 150.000 84.000 150.000 35.360
E Coli (CFU/100mL) 1 180.000 180.000 180.000 180.000 180.000 180.000
Bicarbonate Alkalinity (mg/CaCO3/L) 3 30.600 31.200 26.400 34.200 26.400 34.200 3.934
Chloride (mg/L) 3 94.667 93.000 81.000 110.000 81.000 110.000 14.572
Sulphate as SO42-(mg/L) 3 18.333 19.000 10.000 26.000 10.000 26.000 8.021
Fluoride (mg/L) 3 0.080 0.080 0.070 0.090 0.070 0.090 0.010
Sodium (mg/L) 3 51.100 47.900 44.400 61.000 44.400 61.000 8.750
Potassium (mg/L) 3 5.497 5.390 4.660 6.440 4.660 6.440 0.895
Magnesium (mg/L) 3 9.513 8.820 8.420 11.300 8.420 11.300 1.560
Calcium (mg/L) 3 14.067 13.600 12.800 15.800 12.800 15.800 1.553
Aluminium (ug/L) 3 249.000 328.000 61.000 358.000 61.000 358.000 163.502
Arsenic (ug/L) 3 0.350 0.500 0.050 0.500 0.050 0.500 0.260
Cadmium (ug/L) 3 0.350 0.500 0.050 0.500 0.050 0.500 0.260
Chromium (ug/L) 3 0.517 0.500 0.050 1.000 0.050 1.000 0.475
Copper (ug/L) 3 1.000 1.000 1.000 1.000 1.000 1.000 0.000
Lead (ug/L) 3 0.350 0.500 0.050 0.500 0.050 0.500 0.260
Manganese (ug/L) 3 18.000 21.000 11.000 22.000 11.000 22.000 6.083
Molybdenum (ug/L) 3 0.350 0.500 0.050 0.500 0.050 0.500 0.260
Nickel (ug/L) 3 0.517 0.500 0.050 1.000 0.050 1.000 0.475
Selenium (ug/L) 3 1.500 1.500 1.500 1.500 1.500 1.500 0.000
Silver (ug/L) 3 0.500 0.500 0.500 0.500 0.500 0.500 0.000
Uranium (ug/L) 3 0.500 0.500 0.500 0.500 0.500 0.500 0.000
Zinc (ug/L) 3 7.500 5.000 2.500 15.000 2.500 15.000 6.614
Boron (ug/L) 3 33.000 32.000 29.000 38.000 29.000 38.000 4.583
Iron (ug/L) 3 1017.667 1020.000 993.000 1040.000 993.000 1040.000 23.587
Mercury (ug/L) 3 0.005 0.005 0.005 0.005 0.005 0.005 0.000
Summary Statistics for Site 064 for July 2014 to June 2015
Site 064 Valid N Mean Median Minimum Maximum Percentile Percentile Std.Dev.
20 80
Temperature (oC) 12 16.380 16.200 10.160 22.110 13.710 19.360 3.700
Electrical Conductivity (ms/cm) 12 0.410 0.390 0.120 0.600 0.340 0.550 0.130
Electrical Conductivity (µS/cm) 12 407.580 414.500 111.000 585.000 345.000 537.000 127.080
Turbidity (NTU) 12 28.850 7.700 1.200 230.700 2.600 26.200 64.410
Dissolved oxygen (mg/L) 12 9.210 9.290 6.880 11.600 7.300 10.370 1.490
Dissolved oxygen (%sat) 12 93.450 95.300 78.600 112.200 82.316 100.000 9.720
pH 12 7.170 7.160 6.290 7.750 6.980 7.450 0.370
Salinity (ppt) 12 0.200 0.190 0.060 0.300 0.170 0.270 0.060
Suspended Solids (mg/L) 12 11.580 2.000 1.000 110.000 1.000 5.000 31.060
Ammonium-Nitrogen (mg/L) 12 0.060 0.040 0.020 0.220 0.030 0.070 0.060
Oxidised Nitrogen (mg/L) 12 0.920 0.660 0.040 2.800 0.080 1.810 0.950
Total Nitrogen (mg/L) 12 1.400 1.220 0.340 3.590 0.390 2.150 1.120
Total Phosphorus(mg/L) 12 0.110 0.090 0.028 0.360 0.037 0.160 0.090
Faecal Coliforms (CFU/100ml) 12 3793.50 185.00 23.00 41000.00 55.00 930.00 11731.94
Enterococci (CFU/100ml) 5 11419.00 260.00 75.00 56000.00 162.50 28255.00 24922.02
E Coli (CFU/100mL) 2 20710.00 20710.00 420.00 41000.00 420.00 41000.00 28694.39
Bicarbonate Alkalinity (mg/CaCO3/L) 4 54.000 54.600 49.800 57.000 49.800 57.000 3.040
Chloride (mg/L) 4 76.750 70.000 57.000 110.000 57.000 110.000 23.510
Sulphate as SO42-(mg/L) 4 22.250 24.500 11.000 29.000 11.000 29.000 7.890
Fluoride (mg/L) 4 0.090 0.080 0.070 0.130 0.070 0.130 0.030
Sodium (mg/L) 4 50.880 45.800 38.800 73.100 38.800 73.100 15.220
Potassium (mg/L) 4 5.080 5.080 4.140 6.000 4.140 6.000 0.960
Magnesium (mg/L) 4 7.860 7.280 6.600 10.300 6.600 10.300 1.660
Calcium (mg/L) 4 21.400 20.400 19.200 25.600 19.200 25.600 2.870
Aluminium (ug/L) 4 1174.250 901.000 55.000 2840.000 55.000 2840.000 1180.460
Arsenic (ug/L) 4 0.760 0.500 0.050 2.000 0.050 2.000 0.850
Cadmium (ug/L) 4 0.390 0.500 0.050 0.500 0.050 0.500 0.230
Chromium (ug/L) 4 1.500 1.000 1.000 3.000 1.000 3.000 1.000
Copper (ug/L) 4 4.250 3.500 1.000 9.000 1.000 9.000 3.400
Lead (ug/L) 4 1.010 0.500 0.050 3.000 0.050 3.000 1.340
Manganese (ug/L) 4 26.250 28.000 17.000 32.000 17.000 32.000 6.900

92 HORNSBY SHIRE COUNCIL 2014-2015 WATER QUALITY MONITORING PROGRAM ANNUAL REPORT
Molybdenum (ug/L) 4 0.390 0.500 0.050 0.500 0.050 0.500 0.230
Nickel (ug/L) 4 1.250 1.000 1.000 2.000 1.000 2.000 0.500
Selenium (ug/L) 4 1.500 1.500 1.500 1.500 1.500 1.500 0.000
Silver (ug/L) 4 0.500 0.500 0.500 0.500 0.500 0.500 0.000
Uranium (ug/L) 4 0.500 0.500 0.500 0.500 0.500 0.500 0.000
Zinc (ug/L) 4 21.000 23.000 5.000 33.000 5.000 33.000 12.110
Boron (ug/L) 4 41.250 40.500 34.000 50.000 34.000 50.000 6.600
Iron (ug/L) 4 1650.000 1440.000 1220.000 2500.000 1220.000 2500.000 584.350
Mercury (ug/L) 4 0.010 0.010 0.005 0.010 0.005 0.010 0.000
Summary Statistics for Site 077 for July 2014 to June 2015
Site 077 Valid N Mean Median Minimum Maximum Percentile Percentile Std.Dev.
20 80
Temperature (oC) 12 16.231 17.540 8.180 22.520 12.740 20.010 4.460
Electrical Conductivity (ms/cm) 12 0.658 0.565 0.220 1.460 0.390 0.800 0.360
Electrical Conductivity (µS/cm) 12 660.833 562.500 203.000 1551.000 408.000 808.000 380.960
Turbidity (NTU) 12 11.825 7.000 1.100 50.500 2.600 11.900 14.460
Dissolved oxygen (mg/L) 12 6.078 5.675 3.950 9.620 4.310 7.900 1.940
Dissolved oxygen (%sat) 12 61.616 57.200 38.100 91.000 45.600 82.900 18.590
pH 12 7.471 7.445 7.060 7.820 7.360 7.630 0.230
Salinity (ppt) 12 0.333 0.280 0.110 0.750 0.190 0.430 0.190
Suspended Solids (mg/L) 13 4.077 1.000 1.000 17.000 1.000 6.000 5.510
Ammonium-Nitrogen (mg/L) 13 9.420 3.750 0.180 43.000 1.150 11.000 12.490
Oxidised Nitrogen (mg/L) 13 5.045 5.400 1.880 10.000 3.000 6.000 2.130
Total Nitrogen (mg/L) 13 15.646 9.770 3.560 58.800 5.790 18.500 15.620
Total Phosphorus(mg/L) 13 0.039 0.024 0.012 0.120 0.014 0.065 0.040
Faecal Coliforms (CFU/100ml) 13 8253.538 340.000 54.000 80000.000 94.000 2700.000 22225.500
Enterococci (CFU/100ml) 6 484.000 180.000 34.000 1800.000 40.000 670.000 688.060
E Coli (CFU/100mL) 3 103.33 96.00 94.00 120.00 94.00 120.00 14.47
Bicarbonate Alkalinity (mg/CaCO3/L) 5 98.56 100.00 33.20 147.00 49.90 146.50 49.73 Chloride (mg/L) 5 68.000 84.000 30.000 94.000 34.000 94.000 31.430
Sulphate as SO42-(mg/L) 5 22.620 27.000 6.100 32.000 13.550 29.500 10.020
Fluoride (mg/L) 5 0.036 0.025 0.025 0.080 0.025 0.053 0.020
Sodium (mg/L) 5 39.500 42.500 18.600 58.400 19.850 57.650 19.000
Potassium (mg/L) 5 9.798 7.530 6.390 14.200 6.680 14.050 3.900
Magnesium (mg/L) 5 8.046 8.160 3.140 12.100 4.135 11.900 3.950
Calcium (mg/L) 5 30.460 32.800 13.600 40.300 20.200 39.550 10.830 Aluminium (ug/L) 5 334.400 239.000 130.000 827.000 183.000 533.500 279.340
Arsenic (ug/L) 5 0.800 0.500 0.500 2.000 0.500 1.250 0.670
Cadmium (ug/L) 5 0.500 0.500 0.500 0.500 0.500 0.500 0.000
Chromium (ug/L) 5 0.800 0.500 0.500 2.000 0.500 1.250 0.670
Copper (ug/L) 5 5.200 2.000 1.000 16.000 1.500 10.500 6.220
Lead (ug/L) 5 1.200 0.500 0.500 4.000 0.500 2.250 1.570
Manganese (ug/L) 5 30.000 35.000 12.000 36.000 22.000 35.500 10.170
Molybdenum (ug/L) 5 0.500 0.500 0.500 0.500 0.500 0.500 0.000
Nickel (ug/L) 5 1.500 2.000 0.500 2.000 0.750 2.000 0.710
Selenium (ug/L) 5 1.500 1.500 1.500 1.500 1.500 1.500 0.000
Silver (ug/L) 5 0.500 0.500 0.500 0.500 0.500 0.500 0.000
Uranium (ug/L) 5 0.500 0.500 0.500 0.500 0.500 0.500 0.000
Zinc (ug/L) 5 18.000 11.000 6.000 39.000 6.000 33.500 14.820
Boron (ug/L) 5 73.800 62.000 48.000 100.000 53.500 100.000 24.480
Iron (ug/L) 5 909.000 844.000 475.000 1800.000 514.000 1336.500 527.850
Mercury (ug/L) 5 0.01 0.01 0.01 0.01 0.01 0.01 0.00
Summary Statistics for Site 080 for July 2014 to June 2015
Site 080 Valid N Mean Median Minimum Maximum Percentile Percentile Std.Dev.
20 80
Temperature (oC) 13 16.462 16.150 11.340 20.870 13.200 20.460 3.436
Electrical Conductivity (ms/cm) 13 0.468 0.480 0.180 0.630 0.390 0.570 0.128
Electrical Conductivity (µS/cm) 13 467.077 509.000 137.000 609.000 374.000 571.000 128.758
Turbidity (NTU) 13 27.454 4.500 0.900 170.100 1.400 35.200 47.879
Dissolved oxygen (mg/L) 13 9.023 9.150 7.450 11.500 7.850 10.190 1.273
Dissolved oxygen (%sat) 13 92.074 92.500 76.800 111.500 82.700 98.500 9.070
pH 13 7.322 7.350 6.690 7.540 7.250 7.490 0.236
Salinity (ppt) 13 0.232 0.240 0.090 0.320 0.190 0.280 0.063
Suspended Solids (mg/L) 14 10.857 3.000 1.000 100.000 1.000 11.000 25.973
Ammonium-Nitrogen (mg/L) 14 0.210 0.175 0.050 0.640 0.110 0.310 0.153
Oxidised Nitrogen (mg/L) 14 0.851 0.470 0.240 3.000 0.320 1.340 0.817
Total Nitrogen (mg/L) 14 1.689 1.285 0.890 4.430 0.990 1.990 1.054

93 HORNSBY SHIRE COUNCIL 2014-2015 WATER QUALITY MONITORING PROGRAM ANNUAL REPORT
Total Phosphorus(mg/L) 14 0.198 0.131 0.054 0.540 0.061 0.350 0.155
Faecal Coliforms (CFU/100ml) 14 2001.71 745.00 44.00 10000.00 120.00 3700.00 2694.91
Enterococci (CFU/100ml) 5 7496.00 1900.00 750.00 24000.00 790.00 17000.00 9998.89
E Coli (CFU/100mL) 2 5255.00 5255.00 510.00 10000.00 510.00 10000.00 6710.44
Bicarbonate Alkalinity (mg/CaCO3/L) 4 62.900 62.050 50.500 77.000 50.500 77.000 10.872
Chloride (mg/L) 4 74.250 71.000 60.000 95.000 60.000 95.000 14.863
Sulphate as SO42-(mg/L) 4 32.500 30.500 22.000 47.000 22.000 47.000 10.472
Fluoride (mg/L) 4 0.113 0.110 0.100 0.130 0.100 0.130 0.013
Sodium (mg/L) 4 43.125 39.000 35.800 58.700 35.800 58.700 10.504
Potassium (mg/L) 4 11.178 11.000 8.610 14.100 8.610 14.100 2.274
Magnesium (mg/L) 4 10.348 9.455 8.480 14.000 8.480 14.000 2.484
Calcium (mg/L) 4 21.500 20.200 20.100 25.500 20.100 25.500 2.668
Aluminium (ug/L) 4 843.000 524.000 44.000 2280.000 44.000 2280.000 985.538
Arsenic (ug/L) 4 0.763 0.500 0.050 2.000 0.050 2.000 0.852
Cadmium (ug/L) 4 0.388 0.500 0.050 0.500 0.050 0.500 0.225
Chromium (ug/L) 4 1.138 1.250 0.050 2.000 0.050 2.000 1.013
Copper (ug/L) 4 2.750 3.000 1.000 4.000 1.000 4.000 1.500
Lead (ug/L) 4 1.013 0.500 0.050 3.000 0.050 3.000 1.342
Manganese (ug/L) 4 40.000 42.500 16.000 59.000 16.000 59.000 19.408
Molybdenum (ug/L) 4 0.388 0.500 0.050 0.500 0.050 0.500 0.225
Nickel (ug/L) 4 0.888 0.750 0.050 2.000 0.050 2.000 0.837
Selenium (ug/L) 4 1.500 1.500 1.500 1.500 1.500 1.500 0.000
Silver (ug/L) 4 0.500 0.500 0.500 0.500 0.500 0.500 0.000
Uranium (ug/L) 4 0.500 0.500 0.500 0.500 0.500 0.500 0.000
Zinc (ug/L) 4 10.250 10.000 5.000 16.000 5.000 16.000 5.123
Boron (ug/L) 4 39.500 35.000 33.000 55.000 33.000 55.000 10.408
Iron (ug/L) 4 1410.250 1375.000 881.000 2010.000 881.000 2010.000 484.266
Mercury (ug/L) 4 0.005 0.005 0.005 0.010 0.005 0.010 0.000
Summary Statistics for Site 094 for July 2014 to June 2015
Site 094 Valid N Mean Median Minimum Maximum Percentile Percentile Std.Dev.
20 80
Temperature (oC) 4 17.470 17.625 13.0100 21.620 13.0100 21.620 3.5267
Electrical Conductivity (ms/cm) 4 1.125 1.120 1.0200 1.240 1.0200 1.240 0.0915
Electrical Conductivity (µS/cm) 4 1123.750 1099.000 1053.0000 1244.000 1053.0000 1244.000 85.7181
Turbidity (NTU) 4 2.475 0.150 0.1000 9.500 0.1000 9.500 4.6836
Dissolved oxygen (mg/L) 4 4.103 3.955 1.2800 7.220 1.2800 7.220 3.0794
Dissolved oxygen (%sat) 4 41.600 41.400 15.0000 68.600 15.0000 68.600 29.4294
pH 4 7.663 7.655 7.6300 7.710 7.6300 7.710 0.0359
Salinity (ppt) 4 0.575 0.570 0.5200 0.640 0.5200 0.640 0.0500
Suspended Solids (mg/L) 4 2.250 1.000 1.0000 6.000 1.0000 6.000 2.5000
Ammonium-Nitrogen (mg/L) 4 8.180 8.185 4.5500 11.800 4.5500 11.800 3.5565
Oxidised Nitrogen (mg/L) 4 5.170 5.890 2.3000 6.600 2.3000 6.600 1.9568
Total Nitrogen (mg/L) 4 14.075 14.350 10.7000 16.900 10.7000 16.900 2.5539
Total Phosphorus(mg/L) 4 0.013 0.012 0.0100 0.020 0.0100 0.020 0.0046
Faecal Coliforms (CFU/100ml) 4 2.125 1.000 0.5000 6.000 0.5000 6.000 2.5941
Enterococci (CFU/100ml) 1 29.000 29.000 29.0000 29.000 29.0000 29.000
Bicarbonate Alkalinity (mg/CaCO3/L) 1 316.000 316.000 316.0000 316.000 316.0000 316.000
Chloride (mg/L) 1 51.000 51.000 51.0000 51.000 51.0000 51.000
Sulphate as SO42-(mg/L) 1 137.000 137.000 137.0000 137.000 137.0000 137.000
Fluoride (mg/L) 1 0.025 0.025 0.0250 0.025 0.0250 0.025
Sodium (mg/L) 1 45.300 45.300 45.3000 45.300 45.3000 45.300
Magnesium (mg/L) 1 22.600 22.600 22.6000 22.600 22.6000 22.600
Potassium (mg/L) 1 17.000 17.000 17.0000 17.000 17.0000 17.000
Calcium (mg/L) 1 122.000 122.000 122.0000 122.000 122.0000 122.000
Aluminium (ug/L) 1 61.000 61.000 61.0000 61.000 61.0000 61.000
Arsenic (ug/L) 1 0.050 0.050 0.0500 0.050 0.0500 0.050
Cadmium (ug/L) 1 0.050 0.050 0.0500 0.050 0.0500 0.050
Chromium (ug/L) 1 0.050 0.050 0.0500 0.050 0.0500 0.050
Copper (ug/L) 1 2.000 2.000 2.0000 2.000 2.0000 2.000
Lead (ug/L) 1 0.050 0.050 0.0500 0.050 0.0500 0.050
Manganese (ug/L) 1 193.000 193.000 193.0000 193.000 193.0000 193.000
Molybdenum (ug/L) 1 0.050 0.050 0.0500 0.050 0.0500 0.050
Nickel (ug/L) 1 7.000 7.000 7.0000 7.000 7.0000 7.000
Selenium (ug/L) 1 1.500 1.500 1.5000 1.500 1.5000 1.500
Silver (ug/L) 1 0.500 0.500 0.5000 0.500 0.5000 0.500
Uranium (ug/L) 1 0.500 0.500 0.5000 0.500 0.5000 0.500
Zinc (ug/L) 1 69.000 69.000 69.0000 69.000 69.0000 69.000
Boron (ug/L) 1 267.000 267.000 267.0000 267.000 267.0000 267.000

94 HORNSBY SHIRE COUNCIL 2014-2015 WATER QUALITY MONITORING PROGRAM ANNUAL REPORT
Iron (ug/L) 1 185.000 185.000 185.0000 185.000 185.0000 185.000
Mercury (ug/L) 1 0.005 0.005 0.0050 0.005 0.0050 0.005
Summary Statistics for Site 095 for July 2014 to June 2015
Site 095 Valid N Mean Median Minimum Maximum Percentile Percentile Std.Dev.
20 80
Temperature (oC) 7 18.909 19.970 13.710 23.450 15.640 21.590 3.464
Electrical Conductivity (ms/cm) 7 2.117 2.080 1.920 2.400 1.970 2.250 0.173
Electrical Conductivity (µS/cm) 7 2150.429 2108.000 1920.000 2382.000 2037.000 2294.000 167.817
Turbidity (NTU) 7 84.629 72.800 47.000 165.600 61.900 94.000 38.720
Dissolved oxygen (mg/L) 7 5.157 5.300 3.180 6.140 4.860 5.970 0.995
Dissolved oxygen (%sat) 7 55.557 55.500 32.200 68.600 51.300 66.500 12.359
pH 7 7.119 7.140 6.830 7.250 7.060 7.220 0.143
Salinity (ppt) 7 1.079 1.070 0.890 1.240 1.020 1.160 0.114
Suspended Solids (mg/L) 5 9.200 7.000 7.000 15.000 7.000 12.500 3.493
Ammonium-Nitrogen (mg/L) 7 77.929 78.000 48.500 97.900 63.500 93.000 17.295
Oxidised Nitrogen (mg/L) 7 0.813 0.510 0.180 2.500 0.430 1.070 0.791
Total Nitrogen (mg/L) 7 86.357 88.400 52.000 121.000 70.800 98.400 21.878
Total Phosphorus(mg/L) 7 0.021 0.019 0.013 0.035 0.015 0.025 0.007
Faecal Coliforms (CFU/100ml) 7 4.857 5.000 0.500 11.000 0.500 8.000 4.049
Enterococci (CFU/100ml) 5 25.800 30.000 3.000 51.000 4.500 45.000 20.850
E Coli (CFU/100mL) 4 5.38 5.00 0.50 11.00 0.50 11.00 4.96
Chloride (mg/L) 5 241.00 242.00 210.00 270.00 215.00 266.50 26.12 Sulphate as SO42-(mg/L) 2 21.300 21.300 3.600 39.000 3.600 39.000 25.032
Fluoride (mg/L) 7 0.025 0.025 0.025 0.025 0.025 0.025 0.000
Sodium (mg/L) 5 144.800 146.000 121.000 165.000 128.500 160.500 17.167
Potassium (mg/L) 2 63.250 63.250 53.800 72.700 53.800 72.700 13.364
Magnesium (mg/L) 5 29.860 30.900 26.300 31.800 27.650 31.550 2.255
Calcium (mg/L) 5 99.640 99.300 88.900 111.000 92.450 107.000 8.201
Iron (ug/L) 1 3.150 3.150 3.150 3.150 3.150 3.150
Summary Statistics for Site 096 for July 2014 to June 2015
Site 096 Valid N Mean Median Minimum Maximum Percentile Percentile Std.Dev.
20 80
Temperature (oC) 7 17.596 19.350 11.010 21.460 14.100 20.610 3.820
Electrical Conductivity (ms/cm) 7 1.431 1.590 0.770 1.870 1.090 1.770 0.403
Electrical Conductivity (µS/cm) 7 1450.143 1631.000 762.000 1854.000 1099.000 1854.000 412.035
Turbidity (NTU) 7 1.557 0.800 0.300 4.600 0.300 2.300 1.579
Dissolved oxygen (mg/L) 7 2.579 2.300 2.050 3.390 2.170 3.360 0.562
Dissolved oxygen (%sat) 7 26.914 24.700 22.400 37.300 22.800 30.800 5.347
pH 7 7.281 7.240 7.150 7.480 7.170 7.420 0.127
Salinity (ppt) 7 0.731 0.810 0.390 0.960 0.550 0.910 0.210
Suspended Solids (mg/L) 5 1.200 1.000 1.000 2.000 1.000 1.500 0.447
Ammonium-Nitrogen (mg/L) 7 7.319 1.360 0.130 33.200 0.570 10.100 11.942
Oxidised Nitrogen (mg/L) 7 6.116 5.350 1.760 11.500 3.600 8.550 3.211
Total Nitrogen (mg/L) 7 15.804 8.280 3.190 45.700 6.970 21.300 14.714
Total Phosphorus(mg/L) 7 0.051 0.046 0.035 0.076 0.038 0.066 0.016
Faecal Coliforms (CFU/100ml) 7 345.929 40.000 0.500 1200.000 4.000 1100.000 550.292
Enterococci (CFU/100ml) 5 1433.600 320.000 58.000 6000.000 89.000 3335.000 2563.836
E Coli (CFU/100mL) 4 285.13 20.00 0.50 1100.00 0.50 1100.00 543.49
Chloride (mg/L) 5 224.40 263.00 86.00 313.00 128.00 301.50 94.55 Sulphate as SO42-(mg/L) 2 10.400 10.400 3.800 17.000 3.800 17.000 9.334
Fluoride (mg/L) 7 0.071 0.080 0.025 0.100 0.050 0.090 0.027
Sodium (mg/L) 5 140.400 176.000 58.000 181.000 84.000 179.000 54.702
Potassium (mg/L) 2 50.050 50.050 27.900 72.200 27.900 72.200 31.325
Magnesium (mg/L) 5 29.140 32.400 18.400 33.800 23.000 33.650 6.501
Calcium (mg/L) 5 81.200 88.200 51.900 96.700 64.950 93.950 17.734
Iron (ug/L) 1 0.290 0.290 0.290 0.290 0.290 0.290
Summary Statistics for Site 098 for July 2014 to June 2015
Site 098 Valid N Mean Median Minimum Maximum Percentile Percentile Std.Dev.
20 80
Temperature (oC) 4 19.563 19.880 15.4000 23.090 15.4000 23.090 3.7018
Electrical Conductivity (ms/cm) 4 0.225 0.210 0.1800 0.300 0.1800 0.300 0.0526
Electrical Conductivity (µS/cm) 4 207.000 217.000 168.0000 226.000 168.0000 226.000 27.1416
Turbidity (NTU) 4 0.625 0.550 0.0000 1.400 0.0000 1.400 0.6449
Dissolved oxygen (mg/L) 4 6.005 6.000 3.9700 8.050 3.9700 8.050 1.6860
Dissolved oxygen (%sat) 4 64.575 66.100 45.6000 80.500 45.6000 80.500 14.3565

95 HORNSBY SHIRE COUNCIL 2014-2015 WATER QUALITY MONITORING PROGRAM ANNUAL REPORT
pH 4 7.523 7.545 7.1100 7.890 7.1100 7.890 0.3239
Salinity (ppt) 4 0.113 0.105 0.0900 0.150 0.0900 0.150 0.0263
Suspended Solids (mg/L) 4 1.000 1.000 1.0000 1.000 1.0000 1.000 0.0000
Ammonium-Nitrogen (mg/L) 4 0.013 0.008 0.0050 0.030 0.0050 0.030 0.0119
Oxidised Nitrogen (mg/L) 4 0.460 0.495 0.3100 0.540 0.3100 0.540 0.1030
Total Nitrogen (mg/L) 4 0.780 0.805 0.6800 0.830 0.6800 0.830 0.0707
Total Phosphorus(mg/L) 4 0.083 0.074 0.0680 0.116 0.0680 0.116 0.0224
Faecal Coliforms (CFU/100ml) 4 19.250 16.000 3.0000 42.000 3.0000 42.000 18.2825
Enterococci (CFU/100ml) 3 8.333 6.000 1.0000 18.000 1.0000 18.000 8.7369
Fluoride (mg/L) 4 0.580 0.630 0.4100 0.650 0.4100 0.650 0.1137
Summary Statistics for Site 100 for July 2014 to June 2015
Site 100 Valid N Mean Median Minimum Maximum Percentile Percentile Std.Dev.
20 80
Secchi Depth (m) 0
Temperature (oC) 12 18.939 20.070 9.660 26.160 14.090 24.080 5.459
Turbidity (NTU) 12 12.867 4.700 1.400 87.000 2.400 12.700 23.875
Dissolved oxygen (mg/L) 12 6.769 7.010 3.550 9.750 3.820 9.250 2.488
Dissolved oxygen (%sat) 12 76.122 79.650 45.100 105.400 55.160 93.700 21.168
pH 12 7.370 7.285 7.110 7.760 7.200 7.620 0.229
Salinity (ppt) 12 11.632 13.675 0.170 21.080 2.550 16.350 6.848
Suspended Solids (mg/L) 13 4.615 5.000 1.000 10.000 2.000 6.000 2.434
Ammonium-Nitrogen (mg/L) 13 0.108 0.100 0.020 0.270 0.050 0.160 0.070
Oxidised Nitrogen (mg/L) 13 0.532 0.450 0.070 1.560 0.220 0.590 0.400
Total Nitrogen (mg/L) 13 1.019 0.870 0.560 1.950 0.710 1.220 0.423
Total Phosphorus(mg/L) 13 0.060 0.056 0.023 0.110 0.025 0.099 0.032
Soluble Reactive Phosphorus (mg/L) 3 0.028 0.032 0.017 0.040 0.017 0.036 0.010
Chlorphyll-a (ug/L) 13 2.131 1.500 0.800 8.300 1.100 2.200 2.021
Faecal Coliforms (CFU/100ml) 13 2903.69 65.00 3.00 32000.00 17.00 1200.00 8812.38
Enterococci (CFU/100ml) 13 446.69 18.00 5.00 5000.00 6.00 300.00 1373.02
Summary Statistics for Site 103 for July 2014 to June 2015
Site 103 Valid N Mean Median Minimum Maximum Percentile Percentile Std.Dev.
20 80
Secchi Depth (m) 12 0.879 0.700 0.400 2.150 0.500 1.200 0.512
Temperature (oC) 12 20.073 19.885 13.180 26.010 16.070 25.620 4.489
Turbidity (NTU) 12 22.358 22.650 4.800 48.400 7.900 36.000 14.228
Dissolved oxygen (mg/L) 12 7.091 6.820 5.630 9.760 6.000 8.290 1.271
Dissolved oxygen (%sat) 12 88.937 88.150 79.100 103.200 82.900 93.840 6.820
pH 12 7.870 7.905 7.530 8.060 7.820 7.960 0.154
Salinity (ppt) 12 27.687 28.495 15.300 31.990 26.160 31.650 4.645
Suspended Solids (mg/L) 12 27.000 22.000 6.000 82.000 11.000 37.000 20.494
Ammonium-Nitrogen (mg/L) 12 0.027 0.020 0.010 0.100 0.010 0.030 0.026
Oxidised Nitrogen (mg/L) 12 0.061 0.030 0.010 0.240 0.020 0.100 0.068
Total Nitrogen (mg/L) 12 0.340 0.285 0.230 0.670 0.250 0.390 0.129
Total Phosphorus(mg/L) 12 0.027 0.028 0.015 0.042 0.019 0.038 0.009
Soluble Reactive Phosphorus (mg/L) 0
Chlorphyll-a (ug/L) 12 2.258 2.000 1.300 4.400 1.700 2.700 0.901
Faecal Coliforms (CFU/100ml) 12 5.21 1.00 0.50 49.00 0.50 1.00 13.88
Enterococci (CFU/100ml) 12 4.13 2.00 0.50 26.00 0.50 4.00 7.09
Summary Statistics for Site 108 for July 2014 to June 2015
Site 108 Valid N Mean Median Minimum Maximum Percentile Percentile Std.Dev.
20 80
Secchi Depth (m) 10 1.195 1.200 0.800 1.500 1.050 1.350 0.209
Temperature (oC) 12 19.738 19.565 14.000 24.520 17.320 23.690 3.384
Turbidity (NTU) 12 8.958 9.350 2.500 14.600 5.700 11.000 3.557
Dissolved oxygen (mg/L) 12 7.244 6.835 6.250 10.430 6.500 8.070 1.178
Dissolved oxygen (%sat) 12 93.122 92.100 83.200 106.160 89.900 96.500 6.207
pH 12 8.028 8.025 7.820 8.190 7.970 8.100 0.095
Salinity (ppt) 12 32.676 33.410 25.220 34.550 31.570 34.080 2.549
Suspended Solids (mg/L) 12 13.250 12.000 4.000 26.000 7.000 17.000 6.552
Ammonium-Nitrogen (mg/L) 12 0.020 0.015 0.010 0.070 0.010 0.020 0.017
Oxidised Nitrogen (mg/L) 12 0.035 0.020 0.005 0.130 0.010 0.050 0.037
Total Nitrogen (mg/L) 12 0.257 0.235 0.180 0.460 0.210 0.290 0.077
Total Phosphorus(mg/L) 12 0.022 0.019 0.016 0.050 0.018 0.024 0.009
Soluble Reactive Phosphorus (mg/L) 0
Chlorphyll-a (ug/L) 12 1.967 1.650 1.100 4.400 1.400 2.200 0.905
Faecal Coliforms (CFU/100ml) 12 3.33 0.75 0.50 28.00 0.50 2.00 7.81

96 HORNSBY SHIRE COUNCIL 2014-2015 WATER QUALITY MONITORING PROGRAM ANNUAL REPORT
Enterococci (CFU/100ml) 12 2.92 0.75 0.50 21.00 0.50 3.00 5.81
Summary Statistics for Site 112 for July 2014 to June 2015
Site 112 Valid N Mean Median Minimum Maximum Percentile Percentile Std.Dev.
20 80
Temperature (oC) 4 19.518 19.610 15.5300 23.320 15.5300 23.320 3.1902
Electrical Conductivity (ms/cm) 4 2.290 2.255 1.9800 2.670 1.9800 2.670 0.3575
Electrical Conductivity (µS/cm) 4 2312.500 2287.000 1999.0000 2677.000 1999.0000 2677.000 362.8099
Turbidity (NTU) 4 1.250 1.000 0.0000 3.000 0.0000 3.000 1.3820
Dissolved oxygen (mg/L) 4 3.700 2.935 0.2400 8.690 0.2400 8.690 3.8446
Dissolved oxygen (%sat) 4 38.375 31.600 2.8000 87.500 2.8000 87.500 38.6655
pH 4 6.993 6.860 6.5900 7.660 6.5900 7.660 0.4654
Salinity (ppt) 4 1.198 1.180 1.0300 1.400 1.0300 1.400 0.1857
Suspended Solids (mg/L) 4 2.500 1.500 1.0000 6.000 1.0000 6.000 2.3805
Ammonium-Nitrogen (mg/L) 4 0.679 0.005 0.0050 2.700 0.0050 2.700 1.3475
Oxidised Nitrogen (mg/L) 4 3.848 2.445 0.4000 10.100 0.4000 10.100 4.5664
Total Nitrogen (mg/L) 4 5.843 4.120 1.8300 13.300 1.8300 13.300 5.3872
Total Phosphorus(mg/L) 4 0.035 0.034 0.0240 0.046 0.0240 0.046 0.0107
Faecal Coliforms (CFU/100ml) 4 3.625 2.500 0.5000 9.000 0.5000 9.000 3.7277
Enterococci (CFU/100ml) 1 2300.000 2300.000 2300.0000 2300.000 2300.0000 2300.000
Summary Statistics for Site 114 for July 2014 to June 2015
Site 114 Valid N Mean Median Minimum Maximum Percentile Percentile Std.Dev.
20 80
Temperature (oC) 4 16.528 17.530 9.060 21.990 9.060 21.990 5.417
Electrical Conductivity (ms/cm) 4 0.198 0.210 0.140 0.230 0.140 0.230 0.040
Electrical Conductivity (µS/cm) 4 196.250 196.000 189.000 204.000 189.000 204.000 6.185
Turbidity (NTU) 4 0.875 0.750 0.100 1.900 0.100 1.900 0.802
Dissolved oxygen (mg/L) 4 8.388 8.960 6.080 9.550 6.080 9.550 1.568
Dissolved oxygen (%sat) 4 84.950 85.950 69.500 98.400 69.500 98.400 13.214
pH 4 4.893 4.960 4.600 5.050 4.600 5.050 0.202
Salinity (ppt) 4 0.098 0.105 0.070 0.110 0.070 0.110 0.019
Suspended Solids (mg/L) 4 2.500 2.500 1.000 4.000 1.000 4.000 1.291
Ammonium-Nitrogen (mg/L) 4 0.010 0.008 0.005 0.020 0.005 0.020 0.007
Oxidised Nitrogen (mg/L) 4 0.006 0.005 0.005 0.010 0.005 0.010 0.003
Total Nitrogen (mg/L) 4 0.089 0.105 0.025 0.120 0.025 0.120 0.045
Total Phosphorus(mg/L) 4 0.004 0.004 0.003 0.005 0.003 0.005 0.001
Faecal Coliforms (CFU/100ml) 4 28.00 14.00 4.00 80.00 4.00 80.00 35.59
Summary Statistics for Site 120 for July 2014 to June 2015
Site 120 Valid N Mean Median Minimum Maximum Percentile Percentile Std.Dev.
20 80
Temperature (oC) 12 20.047 20.210 12.3300 26.260 15.0400 24.890 4.6917
Electrical Conductivity (ms/cm) 12 0.236 0.240 0.1300 0.330 0.1900 0.280 0.0607
Electrical Conductivity (µS/cm) 12 237.333 229.000 171.0000 304.000 182.0000 293.000 52.5501
Turbidity (NTU) 12 1.542 0.600 0.0000 6.100 0.3000 2.200 2.0088
Dissolved oxygen (mg/L) 12 4.428 4.380 1.8200 6.790 3.8700 5.530 1.3186
Dissolved oxygen (%sat) 12 48.392 49.900 21.4000 65.300 40.3000 59.700 13.4280
pH 12 7.035 7.010 6.6700 7.450 6.8800 7.180 0.2098
Salinity (ppt) 12 0.117 0.120 0.0700 0.160 0.0900 0.140 0.0296
Suspended Solids (mg/L) 5 1.000 1.000 1.0000 1.000 1.0000 1.000 0.0000
Ammonium-Nitrogen (mg/L) 5 0.016 0.010 0.0050 0.050 0.0050 0.030 0.0192
Oxidised Nitrogen (mg/L) 5 0.622 0.650 0.2400 0.930 0.3950 0.835 0.2553
Total Nitrogen (mg/L) 5 1.236 1.140 0.9600 1.600 1.0450 1.475 0.2460
Total Phosphorus(mg/L) 5 0.113 0.117 0.0600 0.158 0.0725 0.153 0.0412
Faecal Coliforms (CFU/100ml) 12 3.542 0.500 0.5000 16.000 0.5000 6.000 4.8451
Enterococci (CFU/100ml) 4 1.875 0.500 0.5000 6.000 0.5000 6.000 2.7500
Bicarbonate Alkalinity (mg/CaCO3/L) 1 66.000 66.000 66.0000 66.000 66.0000 66.000
Chloride (mg/L) 5 18.600 19.000 12.0000 26.000 12.0000 25.000 6.5422
Sulphate as SO42-(mg/L) 3 24.000 25.000 18.0000 29.000 18.0000 29.000 5.5678
Fluoride (mg/L) 12 0.121 0.120 0.0900 0.150 0.1200 0.130 0.0183
Sodium (mg/L) 5 12.760 13.000 7.5900 18.100 8.1000 17.300 4.6506
Magnesium (mg/L) 5 4.968 4.780 2.9900 7.450 3.0200 7.010 2.0220
Potassium (mg/L) 3 6.607 6.510 6.1900 7.120 6.1900 7.120 0.4725
Calcium (mg/L) 5 26.080 26.900 19.5000 31.000 22.6500 29.100 4.1686
Aluminium (ug/L) 1 124.000 124.000 124.0000 124.000 124.0000 124.000
Arsenic (ug/L) 1 0.500 0.500 0.5000 0.500 0.5000 0.500
Cadmium (ug/L) 1 0.500 0.500 0.5000 0.500 0.5000 0.500
Chromium (ug/L) 1 0.500 0.500 0.5000 0.500 0.5000 0.500

97 HORNSBY SHIRE COUNCIL 2014-2015 WATER QUALITY MONITORING PROGRAM ANNUAL REPORT
Copper (ug/L) 1 227.000 227.000 227.0000 227.000 227.0000 227.000
Lead (ug/L) 1 5.000 5.000 5.0000 5.000 5.0000 5.000
Manganese (ug/L) 1 17.000 17.000 17.0000 17.000 17.0000 17.000
Molybdenum (ug/L) 1 0.500 0.500 0.5000 0.500 0.5000 0.500
Nickel (ug/L) 1 13.000 13.000 13.0000 13.000 13.0000 13.000
Selenium (ug/L) 1 1.500 1.500 1.5000 1.500 1.5000 1.500
Silver (ug/L) 1 0.500 0.500 0.5000 0.500 0.5000 0.500
Uranium (ug/L) 1 0.500 0.500 0.5000 0.500 0.5000 0.500
Zinc (ug/L) 1 948.000 948.000 948.0000 948.000 948.0000 948.000
Boron (ug/L) 1 15.000 15.000 15.0000 15.000 15.0000 15.000
Iron (ug/L) 2 168.815 168.815 0.6300 337.000 0.6300 337.000 237.8495
Mercury (ug/L) 1 0.005 0.005 0.0050 0.005 0.0050 0.005
Summary Statistics for Site 121 for July 2014 to June 2015
Site 121 Valid N Mean Median Minimum Maximum Percentile Percentile Std.Dev.
20 80
Temperature (oC) 13 17.729 18.030 13.3600 21.530 14.5100 21.220 3.0003
Electrical Conductivity (ms/cm) 13 0.212 0.200 0.1400 0.290 0.1800 0.250 0.0407
Electrical Conductivity (µS/cm) 13 210.308 204.000 188.0000 237.000 195.0000 231.000 17.4661
Turbidity (NTU) 13 1.985 0.000 0.0000 17.800 0.0000 2.300 4.9327
Dissolved oxygen (mg/L) 13 9.309 9.410 7.7700 11.010 8.4000 10.190 1.0040
Dissolved oxygen (%sat) 13 97.554 100.100 79.8000 110.500 89.5000 107.600 9.9153
pH 13 7.972 8.050 7.1000 8.550 7.3900 8.460 0.4625
Salinity (ppt) 13 0.104 0.100 0.0700 0.140 0.0900 0.120 0.0190
Suspended Solids (mg/L) 6 1.333 1.000 1.0000 3.000 1.0000 1.000 0.8165
Ammonium-Nitrogen (mg/L) 6 0.213 0.270 0.0100 0.340 0.0500 0.340 0.1481
Oxidised Nitrogen (mg/L) 6 0.260 0.215 0.1600 0.450 0.1800 0.340 0.1123
Total Nitrogen (mg/L) 6 0.895 0.745 0.6500 1.320 0.6900 1.220 0.2945
Total Phosphorus(mg/L) 6 0.032 0.003 0.0020 0.101 0.0020 0.083 0.0466
Faecal Coliforms (CFU/100ml) 13 9.885 0.500 0.5000 120.000 0.5000 0.500 33.0928
Enterococci (CFU/100ml) 5 9.700 0.500 0.5000 37.000 0.5000 23.500 15.8059 Bicarbonate Alkalinity (mg/CaCO3/L) 1 31.200 31.200 31.2000 31.200 31.2000 31.200
Chloride (mg/L) 6 26.500 29.500 20.0000 30.000 20.0000 30.000 5.0498
Sulphate as SO42-(mg/L) 3 11.967 10.000 8.9000 17.000 8.9000 17.000 4.3936
Fluoride (mg/L) 13 0.851 1.000 0.2500 1.130 0.5100 1.080 0.3236
Sodium (mg/L) 6 15.333 15.450 13.2000 17.000 13.9000 17.000 1.6729
Magnesium (mg/L) 6 5.255 5.180 4.5900 6.310 4.8700 5.400 0.5926
Potassium (mg/L) 3 3.703 2.520 2.0100 6.580 2.0100 6.580 2.5043
Calcium (mg/L) 6 17.167 15.400 13.6000 24.700 13.8000 20.100 4.3962
Aluminium (ug/L) 1 29.000 29.000 29.0000 29.000 29.0000 29.000
Arsenic (ug/L) 1 0.500 0.500 0.5000 0.500 0.5000 0.500
Cadmium (ug/L) 1 0.500 0.500 0.5000 0.500 0.5000 0.500
Chromium (ug/L) 1 0.500 0.500 0.5000 0.500 0.5000 0.500
Copper (ug/L) 1 10.000 10.000 10.0000 10.000 10.0000 10.000
Lead (ug/L) 1 0.500 0.500 0.5000 0.500 0.5000 0.500
Manganese (ug/L) 1 3.000 3.000 3.0000 3.000 3.0000 3.000
Molybdenum (ug/L) 1 0.500 0.500 0.5000 0.500 0.5000 0.500
Nickel (ug/L) 1 0.500 0.500 0.5000 0.500 0.5000 0.500
Selenium (ug/L) 1 1.500 1.500 1.5000 1.500 1.5000 1.500
Silver (ug/L) 1 0.500 0.500 0.5000 0.500 0.5000 0.500
Uranium (ug/L) 1 0.500 0.500 0.5000 0.500 0.5000 0.500
Zinc (ug/L) 1 5.000 5.000 5.0000 5.000 5.0000 5.000
Boron (ug/L) 1 27.000 27.000 27.0000 27.000 27.0000 27.000
Iron (ug/L) 2 5.155 5.155 0.3100 10.000 0.3100 10.000 6.8519
Mercury (ug/L) 1 0.005 0.005 0.0050 0.005 0.0050 0.005
Summary Statistics for Site 123 for July 2014 to June 2015
Site 123 Valid N Mean Median Minimum Maximum Percentile Percentile Std.Dev.
20 80
Temperature (oC) 5 15.424 16.780 7.610 20.860 11.190 18.980 4.891
Electrical Conductivity (ms/cm) 5 0.384 0.350 0.300 0.490 0.325 0.460 0.075
Electrical Conductivity (µS/cm) 5 386.200 365.000 324.000 512.000 333.500 449.500 74.180
Turbidity (NTU) 5 2.300 1.800 1.600 4.500 1.650 3.200 1.235
Dissolved oxygen (mg/L) 5 8.448 8.730 5.340 11.310 6.660 10.095 2.141
Dissolved oxygen (%sat) 5 82.920 90.600 59.800 94.400 69.000 93.000 14.343
pH 5 7.018 7.120 6.300 7.350 6.705 7.280 0.413
Salinity (ppt) 5 0.190 0.170 0.150 0.250 0.160 0.230 0.040
Suspended Solids (mg/L) 5 1.000 1.000 1.000 1.000 1.000 1.000 0.000
Ammonium-Nitrogen (mg/L) 5 0.011 0.010 0.005 0.020 0.008 0.015 0.006

98 HORNSBY SHIRE COUNCIL 2014-2015 WATER QUALITY MONITORING PROGRAM ANNUAL REPORT
Oxidised Nitrogen (mg/L) 5 0.088 0.010 0.010 0.390 0.010 0.205 0.169
Total Nitrogen (mg/L) 5 0.264 0.190 0.080 0.620 0.135 0.430 0.207
Total Phosphorus(mg/L) 5 0.029 0.030 0.019 0.040 0.021 0.037 0.009
Faecal Coliforms (CFU/100ml) 5 186.60 28.00 4.00 690.00 7.50 445.00 292.80
Enterococci (CFU/100ml) 1 83.00 83.00 83.00 83.00 83.00 83.00
E Coli (CFU/100mL) 1 690.00 690.00 690.00 690.00 690.00 690.00
Summary Statistics for Site 128 for July 2014 to June 2015
Site 128 Valid N Mean Median Minimum Maximum Percentile Percentile Std.Dev.
20 80
Temperature (oC) 13 18.337 18.520 13.0100 22.630 13.9700 22.230 3.5601
Electrical Conductivity (ms/cm) 13 0.307 0.310 0.1900 0.410 0.2500 0.360 0.0621
Electrical Conductivity (µS/cm) 13 301.615 286.000 224.0000 409.000 271.0000 341.000 48.8408
Turbidity (NTU) 13 1.100 0.600 0.2000 3.600 0.3000 1.700 1.0893
Dissolved oxygen (mg/L) 13 7.637 7.870 5.2800 9.590 6.2400 9.190 1.4944
Dissolved oxygen (%sat) 13 80.300 82.000 59.2000 99.200 69.1000 90.600 11.9826
pH 13 7.743 7.420 6.8000 10.020 7.0400 8.570 0.9081
Salinity (ppt) 13 0.152 0.160 0.0900 0.200 0.1200 0.180 0.0311
Suspended Solids (mg/L) 6 1.000 1.000 1.0000 1.000 1.0000 1.000 0.0000
Ammonium-Nitrogen (mg/L) 6 0.008 0.008 0.0050 0.010 0.0050 0.010 0.0027
Oxidised Nitrogen (mg/L) 6 0.612 0.505 0.2700 1.000 0.4700 0.920 0.2856
Total Nitrogen (mg/L) 6 0.817 0.675 0.6300 1.320 0.6400 0.960 0.2757
Total Phosphorus(mg/L) 6 0.031 0.023 0.0100 0.066 0.0140 0.050 0.0227
Faecal Coliforms (CFU/100ml) 13 149.577 35.000 0.5000 1600.000 6.0000 55.000 436.4823
Enterococci (CFU/100ml) 5 17.600 3.000 1.0000 60.000 1.5000 41.000 25.2448 Bicarbonate Alkalinity (mg/CaCO3/L) 1 41.200 41.200 41.2000 41.200 41.2000 41.200
Chloride (mg/L) 6 38.333 36.500 31.0000 50.000 34.0000 42.000 6.9474
Sulphate as SO42-(mg/L) 3 30.667 32.000 24.0000 36.000 24.0000 36.000 6.1101
Fluoride (mg/L) 13 0.147 0.140 0.0600 0.320 0.0900 0.180 0.0687
Sodium (mg/L) 6 25.450 24.850 21.9000 31.200 23.0000 26.900 3.4098
Magnesium (mg/L) 6 6.193 5.850 5.2500 7.940 5.5300 6.740 0.9988
Potassium (mg/L) 3 2.797 3.180 1.7100 3.500 1.7100 3.500 0.9546
Calcium (mg/L) 6 27.250 20.800 17.6000 49.800 18.2000 36.300 13.0318
Aluminium (ug/L) 1 43.000 43.000 43.0000 43.000 43.0000 43.000
Arsenic (ug/L) 1 0.500 0.500 0.5000 0.500 0.5000 0.500
Cadmium (ug/L) 1 0.500 0.500 0.5000 0.500 0.5000 0.500
Chromium (ug/L) 1 0.500 0.500 0.5000 0.500 0.5000 0.500
Copper (ug/L) 1 9.000 9.000 9.0000 9.000 9.0000 9.000
Lead (ug/L) 1 0.500 0.500 0.5000 0.500 0.5000 0.500
Manganese (ug/L) 1 1.000 1.000 1.0000 1.000 1.0000 1.000
Molybdenum (ug/L) 1 0.500 0.500 0.5000 0.500 0.5000 0.500
Nickel (ug/L) 1 0.500 0.500 0.5000 0.500 0.5000 0.500
Selenium (ug/L) 1 1.500 1.500 1.5000 1.500 1.5000 1.500
Silver (ug/L) 1 0.500 0.500 0.5000 0.500 0.5000 0.500
Uranium (ug/L) 1 0.500 0.500 0.5000 0.500 0.5000 0.500
Zinc (ug/L) 1 12.000 12.000 12.0000 12.000 12.0000 12.000
Boron (ug/L) 1 29.000 29.000 29.0000 29.000 29.0000 29.000
Iron (ug/L) 2 12.610 12.610 0.2200 25.000 0.2200 25.000 17.5221
Mercury (ug/L) 1 0.005 0.005 0.0050 0.005 0.0050 0.005
Summary Statistics for Site 131 for July 2014 to June 2015
Site 131 Valid N Mean Median Minimum Maximum Percentile Percentile Std.Dev.
20 80
Temperature (oC) 13 19.355 18.900 14.1600 23.960 15.3200 22.460 3.3376
Electrical Conductivity (ms/cm) 13 0.308 0.310 0.2300 0.360 0.2800 0.330 0.0383
Electrical Conductivity (µS/cm) 13 303.846 315.000 258.0000 327.000 288.0000 325.000 24.5352
Turbidity (NTU) 13 0.423 0.200 0.0000 2.000 0.0000 0.900 0.5904
Dissolved oxygen (mg/L) 13 8.308 8.210 7.3400 10.400 7.4700 8.920 0.9491
Dissolved oxygen (%sat) 13 89.669 88.100 82.3000 101.100 85.1000 93.100 5.1956
pH 13 8.156 8.110 7.4000 8.980 7.5500 8.880 0.6077
Salinity (ppt) 13 0.149 0.150 0.0900 0.180 0.1400 0.170 0.0257
Suspended Solids (mg/L) 6 1.000 1.000 1.0000 1.000 1.0000 1.000 0.0000
Ammonium-Nitrogen (mg/L) 6 0.007 0.005 0.0050 0.010 0.0050 0.010 0.0026
Oxidised Nitrogen (mg/L) 6 0.485 0.420 0.2200 1.010 0.2700 0.570 0.2862
Total Nitrogen (mg/L) 6 0.632 0.605 0.3000 1.130 0.4200 0.730 0.2892
Total Phosphorus(mg/L) 6 0.017 0.017 0.0130 0.021 0.0150 0.021 0.0034
Faecal Coliforms (CFU/100ml) 13 9.423 3.000 0.5000 35.000 0.5000 22.000 11.3850
Enterococci (CFU/100ml) 5 14.300 11.000 0.5000 28.000 3.2500 27.000 12.1943 Bicarbonate Alkalinity (mg/CaCO3/L) 1 50.700 50.700 50.7000 50.700 50.7000 50.700

99 HORNSBY SHIRE COUNCIL 2014-2015 WATER QUALITY MONITORING PROGRAM ANNUAL REPORT
Chloride (mg/L) 6 38.500 39.000 33.0000 43.000 37.0000 40.000 3.3317
Sulphate as SO42-(mg/L) 3 25.333 23.000 23.0000 30.000 23.0000 30.000 4.0415
Fluoride (mg/L) 13 0.190 0.160 0.0600 0.480 0.0900 0.200 0.1241
Sodium (mg/L) 6 25.567 25.300 23.7000 29.400 23.8000 25.900 2.0849
Magnesium (mg/L) 6 6.160 6.015 5.3300 7.530 5.5100 6.560 0.7993
Potassium (mg/L) 3 2.350 2.190 2.1600 2.700 2.1600 2.700 0.3035
Calcium (mg/L) 6 24.383 22.800 20.1000 31.800 20.2000 28.600 4.8738
Aluminium (ug/L) 1 146.000 146.000 146.0000 146.000 146.0000 146.000
Arsenic (ug/L) 1 0.500 0.500 0.5000 0.500 0.5000 0.500
Cadmium (ug/L) 1 0.500 0.500 0.5000 0.500 0.5000 0.500
Chromium (ug/L) 1 0.500 0.500 0.5000 0.500 0.5000 0.500
Copper (ug/L) 1 11.000 11.000 11.0000 11.000 11.0000 11.000
Lead (ug/L) 1 0.500 0.500 0.5000 0.500 0.5000 0.500
Manganese (ug/L) 1 2.000 2.000 2.0000 2.000 2.0000 2.000
Molybdenum (ug/L) 1 0.500 0.500 0.5000 0.500 0.5000 0.500
Nickel (ug/L) 1 0.500 0.500 0.5000 0.500 0.5000 0.500
Selenium (ug/L) 1 1.500 1.500 1.5000 1.500 1.5000 1.500
Silver (ug/L) 1 0.500 0.500 0.5000 0.500 0.5000 0.500
Uranium (ug/L) 1 0.500 0.500 0.5000 0.500 0.5000 0.500
Zinc (ug/L) 1 5.000 5.000 5.0000 5.000 5.0000 5.000
Boron (ug/L) 1 21.000 21.000 21.0000 21.000 21.0000 21.000
Iron (ug/L) 2 38.505 38.505 0.0100 77.000 0.0100 77.000 54.4402
Mercury (ug/L) 1 0.005 0.005 0.0050 0.005 0.0050 0.005
Summary Statistics for Site 132 for July 2014 to June 2015
Site 132 Valid N Mean Median Minimum Maximum Percentile Percentile Std.Dev.
20 80
Temperature (oC) 7 19.369 21.260 13.790 23.000 15.830 21.800 3.468
Electrical Conductivity (ms/cm) 7 0.246 0.260 0.190 0.310 0.190 0.280 0.045
Electrical Conductivity (µS/cm) 7 225.857 228.000 202.000 246.000 210.000 243.000 17.382
Turbidity (NTU) 7 0.057 0.000 0.000 0.300 0.000 0.100 0.113
Dissolved oxygen (mg/L) 7 8.870 8.860 7.650 9.820 8.480 9.260 0.686
Dissolved oxygen (%sat) 7 95.729 96.600 88.600 99.900 93.000 99.800 4.142
pH 7 8.104 7.990 7.850 8.650 7.930 8.290 0.277
Salinity (ppt) 7 0.121 0.130 0.090 0.150 0.090 0.140 0.023
Suspended Solids (mg/L) 5 2.400 1.000 1.000 8.000 1.000 4.500 3.131
Ammonium-Nitrogen (mg/L) 7 0.028 0.010 0.005 0.090 0.010 0.050 0.031
Oxidised Nitrogen (mg/L) 7 0.210 0.220 0.150 0.260 0.190 0.240 0.037
Total Nitrogen (mg/L) 7 0.430 0.410 0.310 0.590 0.400 0.450 0.084
Total Phosphorus(mg/L) 7 0.003 0.002 0.002 0.004 0.002 0.004 0.001
Faecal Coliforms (CFU/100ml) 7 0.500 0.500 0.500 0.500 0.500 0.500 0.000
Enterococci (CFU/100ml) 5 8.600 0.500 0.500 41.000 0.500 20.750 18.112
E Coli (CFU/100mL) 4 0.50 0.50 0.50 0.50 0.50 0.50 0.00
Chloride (mg/L) 5 35.00 35.00 34.00 36.00 34.50 35.50 0.71 Sulphate as SO42-(mg/L) 2 9.550 9.550 9.100 10.000 9.100 10.000 0.636
Fluoride (mg/L) 7 1.023 1.010 0.980 1.090 1.000 1.060 0.039
Sodium (mg/L) 5 19.340 19.800 18.400 19.900 18.600 19.850 0.691
Potassium (mg/L) 2 2.640 2.640 2.430 2.850 2.430 2.850 0.297
Magnesium (mg/L) 5 5.478 5.370 5.040 6.210 5.100 5.910 0.463
Calcium (mg/L) 5 15.820 16.400 13.600 18.700 13.800 17.550 2.074
Iron (ug/L) 1 0.020 0.020 0.020 0.020 0.020 0.020
Summary Statistics for Site 134 for July 2014 to June 2015
Site 134 Valid N Mean Median Minimum Maximum Percentile Percentile Std.Dev.
20 80
Temperature (oC) 13 19.707 19.010 14.2300 26.720 15.3700 24.140 4.5299
Electrical Conductivity (ms/cm) 13 0.237 0.210 0.1300 0.360 0.1600 0.340 0.0850
Electrical Conductivity (µS/cm) 13 238.462 178.000 127.0000 357.000 158.0000 334.000 92.4262
Turbidity (NTU) 13 0.346 0.300 0.0000 1.100 0.0000 0.800 0.3688
Dissolved oxygen (mg/L) 13 5.159 4.530 1.1300 8.940 2.8700 8.210 2.7351
Dissolved oxygen (%sat) 13 54.123 48.800 13.4000 87.100 35.6000 82.300 25.2905
pH 13 7.402 7.600 6.8200 8.060 6.8800 7.770 0.4242
Salinity (ppt) 13 0.115 0.100 0.0600 0.180 0.0800 0.170 0.0431
Suspended Solids (mg/L) 5 1.000 1.000 1.0000 1.000 1.0000 1.000 0.0000
Ammonium-Nitrogen (mg/L) 5 0.027 0.010 0.0050 0.100 0.0075 0.055 0.0409
Oxidised Nitrogen (mg/L) 5 0.438 0.410 0.3600 0.550 0.3750 0.515 0.0766
Total Nitrogen (mg/L) 5 0.866 0.740 0.6500 1.370 0.6800 1.115 0.2919
Total Phosphorus(mg/L) 5 0.200 0.210 0.1690 0.237 0.1695 0.225 0.0295
Faecal Coliforms (CFU/100ml) 12 4.792 2.000 0.5000 14.000 0.5000 9.000 5.2978

100 HORNSBY SHIRE COUNCIL 2014-2015 WATER QUALITY MONITORING PROGRAM ANNUAL REPORT
Enterococci (CFU/100ml) 4 18.500 10.000 2.0000 52.000 2.0000 52.000 23.0145 Bicarbonate Alkalinity (mg/CaCO3/L) 1 96.300 96.300 96.3000 96.300 96.3000 96.300
Chloride (mg/L) 5 20.000 15.000 13.0000 29.000 14.0000 28.500 7.8102
Sulphate as SO42-(mg/L) 3 17.000 21.000 8.0000 22.000 8.0000 22.000 7.8102
Fluoride (mg/L) 12 0.109 0.115 0.0250 0.190 0.0500 0.170 0.0643
Sodium (mg/L) 5 11.986 8.460 7.7700 18.000 7.8850 17.850 5.3599
Magnesium (mg/L) 5 2.824 2.540 1.8900 4.160 1.9400 3.850 0.9932
Potassium (mg/L) 3 7.477 8.980 3.7300 9.720 3.7300 9.720 3.2657
Calcium (mg/L) 5 26.840 20.000 16.9000 40.500 17.7500 39.350 11.5014
Aluminium (ug/L) 1 88.000 88.000 88.0000 88.000 88.0000 88.000
Arsenic (ug/L) 1 2.000 2.000 2.0000 2.000 2.0000 2.000
Cadmium (ug/L) 1 0.500 0.500 0.5000 0.500 0.5000 0.500
Chromium (ug/L) 1 0.500 0.500 0.5000 0.500 0.5000 0.500
Copper (ug/L) 1 9.000 9.000 9.0000 9.000 9.0000 9.000
Lead (ug/L) 1 0.500 0.500 0.5000 0.500 0.5000 0.500
Manganese (ug/L) 1 1.000 1.000 1.0000 1.000 1.0000 1.000
Molybdenum (ug/L) 1 0.500 0.500 0.5000 0.500 0.5000 0.500
Nickel (ug/L) 1 2.000 2.000 2.0000 2.000 2.0000 2.000
Selenium (ug/L) 1 1.500 1.500 1.5000 1.500 1.5000 1.500
Silver (ug/L) 1 0.500 0.500 0.5000 0.500 0.5000 0.500
Uranium (ug/L) 1 0.500 0.500 0.5000 0.500 0.5000 0.500
Zinc (ug/L) 1 24.000 24.000 24.0000 24.000 24.0000 24.000
Boron (ug/L) 1 37.000 37.000 37.0000 37.000 37.0000 37.000
Iron (ug/L) 2 77.050 77.050 0.1000 154.000 0.1000 154.000 108.8237
Mercury (ug/L) 1 0.005 0.005 0.0050 0.005 0.0050 0.005
Summary Statistics for Site 137 for July 2014 to June 2015
Site 137 Valid N Mean Median Minimum Maximum Percentile Percentile Std.Dev.
20 80
Temperature (oC) 13 17.427 19.030 12.1300 22.100 13.0800 20.390 3.5510
Electrical Conductivity (ms/cm) 13 0.246 0.250 0.1500 0.390 0.1900 0.270 0.0685
Electrical Conductivity (µS/cm) 13 230.769 202.000 147.0000 353.000 171.0000 300.000 68.0002
Turbidity (NTU) 13 1.269 0.300 0.0000 7.100 0.2000 2.100 2.0035
Dissolved oxygen (mg/L) 13 8.858 9.590 5.7500 10.610 6.6500 10.340 1.7051
Dissolved oxygen (%sat) 13 91.846 95.700 67.6000 115.500 76.1000 104.000 14.8567
pH 13 8.230 8.470 7.0000 9.290 7.4600 8.800 0.7180
Salinity (ppt) 13 0.121 0.120 0.0700 0.190 0.0900 0.130 0.0345
Suspended Solids (mg/L) 6 1.500 1.000 1.0000 4.000 1.0000 1.000 1.2247
Ammonium-Nitrogen (mg/L) 6 0.128 0.070 0.0050 0.310 0.0050 0.310 0.1486
Oxidised Nitrogen (mg/L) 6 0.345 0.355 0.2200 0.480 0.2300 0.430 0.1067
Total Nitrogen (mg/L) 6 0.802 0.720 0.6900 1.230 0.7100 0.740 0.2106
Total Phosphorus(mg/L) 6 0.100 0.128 0.0030 0.182 0.0040 0.155 0.0773
Faecal Coliforms (CFU/100ml) 13 0.654 0.500 0.5000 2.000 0.5000 0.500 0.4274
Enterococci (CFU/100ml) 5 4.900 0.500 0.5000 19.000 0.5000 11.500 8.0265
Bicarbonate Alkalinity (mg/CaCO3/L) 1 83.000 83.000 83.0000 83.000 83.0000 83.000
Chloride (mg/L) 6 23.667 23.000 16.0000 32.000 17.0000 31.000 7.7374
Sulphate as SO42-(mg/L) 3 12.567 11.000 8.7000 18.000 8.7000 18.000 4.8439
Fluoride (mg/L) 13 0.485 0.490 0.0600 1.060 0.0600 0.950 0.4126
Sodium (mg/L) 6 12.860 12.600 9.0600 17.100 9.3000 16.500 3.6921
Magnesium (mg/L) 6 3.778 3.870 1.6500 6.380 1.8700 5.030 1.8181
Potassium (mg/L) 3 4.530 3.810 2.4000 7.380 2.4000 7.380 2.5669
Calcium (mg/L) 6 22.833 21.800 13.6000 38.900 16.5000 24.400 8.9005
Aluminium (ug/L) 1 69.000 69.000 69.0000 69.000 69.0000 69.000
Arsenic (ug/L) 1 2.000 2.000 2.0000 2.000 2.0000 2.000
Cadmium (ug/L) 1 0.500 0.500 0.5000 0.500 0.5000 0.500
Chromium (ug/L) 1 0.500 0.500 0.5000 0.500 0.5000 0.500
Copper (ug/L) 1 29.000 29.000 29.0000 29.000 29.0000 29.000
Lead (ug/L) 1 0.500 0.500 0.5000 0.500 0.5000 0.500
Manganese (ug/L) 1 8.000 8.000 8.0000 8.000 8.0000 8.000
Molybdenum (ug/L) 1 0.500 0.500 0.5000 0.500 0.5000 0.500
Nickel (ug/L) 1 2.000 2.000 2.0000 2.000 2.0000 2.000
Selenium (ug/L) 1 1.500 1.500 1.5000 1.500 1.5000 1.500
Silver (ug/L) 1 0.500 0.500 0.5000 0.500 0.5000 0.500
Uranium (ug/L) 1 0.500 0.500 0.5000 0.500 0.5000 0.500
Zinc (ug/L) 1 49.000 49.000 49.0000 49.000 49.0000 49.000
Boron (ug/L) 1 26.000 26.000 26.0000 26.000 26.0000 26.000
Iron (ug/L) 2 56.545 56.545 0.0900 113.000 0.0900 113.000 79.8394
Mercury (ug/L) 1 0.005 0.005 0.0050 0.005 0.0050 0.005

101 HORNSBY SHIRE COUNCIL 2014-2015 WATER QUALITY MONITORING PROGRAM ANNUAL REPORT
Summary Statistics for Site 138 for July 2014 to June 2015
Site 138 Valid N Mean Median Minimum Maximum Percentile Percentile Std.Dev.
20 80
Temperature (oC) 12 18.710 18.005 14.0600 23.800 15.6600 22.720 3.5000
Electrical Conductivity (ms/cm) 12 0.420 0.420 0.3100 0.500 0.3500 0.500 0.1000
Electrical Conductivity (µS/cm) 12 430.000 420.500 347.0000 536.000 363.0000 494.000 63.3000
Turbidity (NTU) 12 2.880 1.150 0.2000 10.900 0.3000 4.300 3.5000
Dissolved oxygen (mg/L) 12 3.730 4.335 0.1600 6.700 1.1600 5.640 2.2000
Dissolved oxygen (%sat) 12 38.970 45.950 2.0000 65.400 13.2000 56.800 22.5000
pH 12 7.390 7.380 6.8200 8.300 7.1400 7.500 0.3000
Salinity (ppt) 12 0.210 0.205 0.1500 0.300 0.1700 0.250 0.0000
Suspended Solids (mg/L) 5 2.800 1.000 1.0000 6.000 1.0000 5.500 2.5000
Ammonium-Nitrogen (mg/L) 5 0.050 0.020 0.0100 0.200 0.0150 0.110 0.1000
Oxidised Nitrogen (mg/L) 5 0.360 0.360 0.0100 0.800 0.1300 0.595 0.3000
Total Nitrogen (mg/L) 5 1.390 1.350 0.8900 2.000 1.0900 1.710 0.4000
Total Phosphorus(mg/L) 5 0.220 0.146 0.0750 0.500 0.0840 0.391 0.2000
Faecal Coliforms (CFU/100ml) 12 ######### 57.500 0.5000 ########## 1.0000 360.000 ##########
Enterococci (CFU/100ml) 4 8.750 5.500 1.0000 23.000 1.0000 23.000 9.9000
Bicarbonate Alkalinity (mg/CaCO3/L) 1 78.000 78.000 78.0000 78.000 78.0000 78.000
Chloride (mg/L) 5 43.600 41.000 37.0000 53.000 38.5000 50.000 6.4000
Sulphate as SO42-(mg/L) 3 33.000 28.000 26.0000 45.000 26.0000 45.000 10.4000
Fluoride (mg/L) 12 0.270 0.160 0.1100 1.400 0.1500 0.210 0.3000
Sodium (mg/L) 5 28.380 30.300 23.5000 30.900 25.1000 30.700 3.2000
Magnesium (mg/L) 5 7.160 7.500 4.7200 9.200 5.6450 8.515 1.7000
Potassium (mg/L) 3 9.380 9.760 7.2900 11.100 7.2900 11.100 1.9000
Calcium (mg/L) 5 46.380 49.700 38.4000 53.900 39.1000 52.000 6.9000
Aluminium (ug/L) 1 244.000 244.000 244.0000 244.000 244.0000 244.000
Arsenic (ug/L) 1 1.000 1.000 1.0000 1.000 1.0000 1.000
Cadmium (ug/L) 1 0.500 0.500 0.5000 0.500 0.5000 0.500
Chromium (ug/L) 1 2.000 2.000 2.0000 2.000 2.0000 2.000
Copper (ug/L) 1 9.000 9.000 9.0000 9.000 9.0000 9.000
Lead (ug/L) 1 0.500 0.500 0.5000 0.500 0.5000 0.500
Manganese (ug/L) 1 12.000 12.000 12.0000 12.000 12.0000 12.000
Molybdenum (ug/L) 1 0.500 0.500 0.5000 0.500 0.5000 0.500
Nickel (ug/L) 1 2.000 2.000 2.0000 2.000 2.0000 2.000
Selenium (ug/L) 1 1.500 1.500 1.5000 1.500 1.5000 1.500
Silver (ug/L) 1 0.500 0.500 0.5000 0.500 0.5000 0.500
Uranium (ug/L) 1 0.500 0.500 0.5000 0.500 0.5000 0.500
Zinc (ug/L) 1 28.000 28.000 28.0000 28.000 28.0000 28.000
Boron (ug/L) 1 55.000 55.000 55.0000 55.000 55.0000 55.000
Iron (ug/L) 2 162.640 162.640 0.2800 325.000 0.2800 325.000 229.6000
Mercury (ug/L) 1 0.010 0.005 0.0050 0.000 0.0050 0.005
Summary Statistics for Site 141 for July 2014 to June 2015
Site 141 Valid N Mean Median Minimum Maximum Percentile Percentile Std.Dev.
20 80
Temperature (oC) 12 19.015 18.230 14.5600 23.810 15.5600 22.820 3.3854
Electrical Conductivity (ms/cm) 12 0.355 0.352 0.2300 0.500 0.2600 0.470 0.0965
Electrical Conductivity (µS/cm) 12 352.917 362.500 224.0000 470.000 255.0000 432.000 86.7551
Turbidity (NTU) 12 0.467 0.000 0.0000 2.300 0.0000 0.900 0.7500
Dissolved oxygen (mg/L) 12 7.325 7.555 5.7000 8.910 6.2100 8.390 1.1112
Dissolved oxygen (%sat) 12 79.325 78.200 60.3000 101.800 64.6000 97.200 15.2258
pH 12 7.713 7.725 7.3500 8.400 7.4600 7.890 0.2848
Salinity (ppt) 12 0.174 0.170 0.1100 0.250 0.1300 0.230 0.0494
Suspended Solids (mg/L) 5 1.000 1.000 1.0000 1.000 1.0000 1.000 0.0000
Ammonium-Nitrogen (mg/L) 5 0.075 0.010 0.0050 0.190 0.0075 0.175 0.0919
Oxidised Nitrogen (mg/L) 5 0.584 0.380 0.3000 1.420 0.3050 0.965 0.4748
Total Nitrogen (mg/L) 5 1.140 1.020 0.7400 1.810 0.7550 1.585 0.4496
Total Phosphorus(mg/L) 5 0.075 0.081 0.0260 0.138 0.0270 0.119 0.0481
Faecal Coliforms (CFU/100ml) 12 2.042 1.000 0.5000 6.000 0.5000 3.000 2.0721
Enterococci (CFU/100ml) 4 3.625 0.500 0.5000 13.000 0.5000 13.000 6.2500
Bicarbonate Alkalinity (mg/CaCO3/L) 1 91.000 91.000 91.0000 91.000 91.0000 91.000
Chloride (mg/L) 5 37.000 33.000 32.0000 50.000 32.0000 44.000 7.6812
Sulphate as SO42-(mg/L) 3 26.333 24.000 12.0000 43.000 12.0000 43.000 15.6312
Fluoride (mg/L) 12 0.468 0.305 0.1500 1.000 0.1800 0.880 0.3429
Sodium (mg/L) 5 22.640 23.600 17.8000 27.600 18.0000 26.800 4.4708
Magnesium (mg/L) 5 6.612 6.370 5.3400 8.260 5.6500 7.695 1.1276
Potassium (mg/L) 3 6.427 6.780 3.1200 9.380 3.1200 9.380 3.1449
Calcium (mg/L) 5 37.000 43.100 18.4000 53.500 19.8500 51.100 16.1152

102 HORNSBY SHIRE COUNCIL 2014-2015 WATER QUALITY MONITORING PROGRAM ANNUAL REPORT
Aluminium (ug/L) 1 45.000 45.000 45.0000 45.000 45.0000 45.000
Arsenic (ug/L) 1 1.000 1.000 1.0000 1.000 1.0000 1.000
Cadmium (ug/L) 1 0.500 0.500 0.5000 0.500 0.5000 0.500
Chromium (ug/L) 1 1.000 1.000 1.0000 1.000 1.0000 1.000
Copper (ug/L) 1 14.000 14.000 14.0000 14.000 14.0000 14.000
Lead (ug/L) 1 0.500 0.500 0.5000 0.500 0.5000 0.500
Manganese (ug/L) 1 20.000 20.000 20.0000 20.000 20.0000 20.000
Molybdenum (ug/L) 1 0.500 0.500 0.5000 0.500 0.5000 0.500
Nickel (ug/L) 1 2.000 2.000 2.0000 2.000 2.0000 2.000
Selenium (ug/L) 1 1.500 1.500 1.5000 1.500 1.5000 1.500
Silver (ug/L) 1 0.500 0.500 0.5000 0.500 0.5000 0.500
Uranium (ug/L) 1 0.500 0.500 0.5000 0.500 0.5000 0.500
Zinc (ug/L) 1 16.000 16.000 16.0000 16.000 16.0000 16.000
Boron (ug/L) 1 47.000 47.000 47.0000 47.000 47.0000 47.000
Iron (ug/L) 2 30.585 30.585 0.1700 61.000 0.1700 61.000 43.0133
Mercury (ug/L) 1 0.005 0.005 0.0050 0.005 0.0050 0.005
Summary Statistics for Site 142 for July 2014 to June 2015
Site 142 Valid N Mean Median Minimum Maximum Percentile Percentile Std.Dev.
20 80
Temperature (oC) 12 18.751 18.505 15.6800 23.220 15.9800 21.060 2.5140
Electrical Conductivity (ms/cm) 12 0.237 0.250 0.1400 0.290 0.1900 0.270 0.0470
Electrical Conductivity (µS/cm) 12 240.500 250.000 188.0000 267.000 228.0000 263.000 26.3590
Turbidity (NTU) 12 50.275 35.750 9.2000 205.900 19.1000 69.100 53.5090
Dissolved oxygen (mg/L) 12 4.414 4.815 0.1700 7.610 2.6000 6.460 2.2290
Dissolved oxygen (%sat) 12 46.650 51.450 1.9000 77.000 29.8000 65.000 22.3900
pH 12 7.056 7.085 6.6700 7.440 6.9000 7.230 0.2370
Salinity (ppt) 12 0.117 0.125 0.0800 0.140 0.0900 0.130 0.0210
Suspended Solids (mg/L) 5 15.600 4.000 1.0000 66.000 1.0000 36.000 28.2540
Ammonium-Nitrogen (mg/L) 5 0.035 0.005 0.0050 0.130 0.0050 0.080 0.0540
Oxidised Nitrogen (mg/L) 5 0.550 0.550 0.3000 0.830 0.3150 0.785 0.2370
Total Nitrogen (mg/L) 5 0.908 0.890 0.5000 1.270 0.6550 1.170 0.2890
Total Phosphorus(mg/L) 5 0.104 0.088 0.0420 0.240 0.0470 0.169 0.0800
Faecal Coliforms (CFU/100ml) 12 724.792 12.000 0.5000 7800.000 1.0000 330.000 2233.4010
Enterococci (CFU/100ml) 4 93.500 16.000 12.0000 330.000 12.0000 330.000 157.6970
Bicarbonate Alkalinity (mg/CaCO3/L) 1 34.200 34.200 34.2000 34.200 34.2000 34.200
Chloride (mg/L) 5 33.000 33.000 32.0000 34.000 32.5000 33.500 0.7070
Sulphate as SO42-(mg/L) 3 19.667 20.000 18.0000 21.000 18.0000 21.000 1.5280
Fluoride (mg/L) 12 0.135 0.130 0.1200 0.150 0.1200 0.150 0.0120
Sodium (mg/L) 5 28.160 27.900 25.7000 31.000 26.0500 30.400 2.2350
Magnesium (mg/L) 5 4.674 4.680 4.1600 5.070 4.2800 5.065 0.4020
Potassium (mg/L) 3 3.587 3.550 3.3000 3.910 3.3000 3.910 0.3070
Calcium (mg/L) 5 15.620 15.000 12.8000 20.200 13.8000 17.750 2.7430
Aluminium (ug/L) 1 9640.000 9640.000 9640.0000 9640.000 9640.0000 9640.000
Arsenic (ug/L) 1 5.000 5.000 5.0000 5.000 5.0000 5.000
Cadmium (ug/L) 1 0.500 0.500 0.5000 0.500 0.5000 0.500
Chromium (ug/L) 1 4.000 4.000 4.0000 4.000 4.0000 4.000
Copper (ug/L) 1 29.000 29.000 29.0000 29.000 29.0000 29.000
Lead (ug/L) 1 12.000 12.000 12.0000 12.000 12.0000 12.000
Manganese (ug/L) 1 68.000 68.000 68.0000 68.000 68.0000 68.000
Molybdenum (ug/L) 1 0.500 0.500 0.5000 0.500 0.5000 0.500
Nickel (ug/L) 1 4.000 4.000 4.0000 4.000 4.0000 4.000
Selenium (ug/L) 1 1.500 1.500 1.5000 1.500 1.5000 1.500
Silver (ug/L) 1 0.500 0.500 0.5000 0.500 0.5000 0.500
Uranium (ug/L) 1 0.500 0.500 0.5000 0.500 0.5000 0.500
Zinc (ug/L) 1 103.000 103.000 103.0000 103.000 103.0000 103.000
Boron (ug/L) 1 49.000 49.000 49.0000 49.000 49.0000 49.000
Iron (ug/L) 2 2705.555 2705.555 1.1100 5410.000 1.1100 5410.000 3824.6630
Mercury (ug/L) 1 0.040 0.040 0.0400 0.040 0.0400 0.040
Summary Statistics for Site 145 for July 2014 to June 2015
Site 145 Valid N Mean Median Minimum Maximum Percentile Percentile Std.Dev.
20 80
Temperature (oC) 12 18.953 18.650 15.5600 22.780 16.3400 21.530 2.5800
Electrical Conductivity (ms/cm) 12 0.265 0.260 0.1900 0.340 0.2400 0.290 0.0410
Electrical Conductivity (µS/cm) 12 254.083 264.500 201.0000 300.000 217.0000 279.000 32.2950
Turbidity (NTU) 12 41.933 37.550 4.0000 86.600 22.3000 60.300 25.6150
Dissolved oxygen (mg/L) 12 5.698 5.505 2.3500 8.520 4.3800 7.780 1.8430
Dissolved oxygen (%sat) 12 60.767 61.900 25.7000 86.100 48.2000 81.000 17.5740

103 HORNSBY SHIRE COUNCIL 2014-2015 WATER QUALITY MONITORING PROGRAM ANNUAL REPORT
pH 12 7.211 7.280 6.7800 7.590 6.9700 7.390 0.2530
Salinity (ppt) 12 0.131 0.130 0.0900 0.170 0.1200 0.150 0.0220
Suspended Solids (mg/L) 5 5.000 1.000 1.0000 20.000 1.0000 11.000 8.3960
Ammonium-Nitrogen (mg/L) 5 0.050 0.020 0.0050 0.200 0.0050 0.110 0.0840
Oxidised Nitrogen (mg/L) 5 0.808 0.880 0.3400 1.030 0.5750 1.005 0.2750
Total Nitrogen (mg/L) 5 1.104 1.220 0.7700 1.240 0.9200 1.230 0.1990
Total Phosphorus(mg/L) 5 0.097 0.110 0.0320 0.124 0.0680 0.120 0.0370
Faecal Coliforms (CFU/100ml) 12 382.792 6.000 0.5000 4300.000 0.5000 30.000 1235.3020
Enterococci (CFU/100ml) 4 15.000 14.000 2.0000 30.000 2.0000 30.000 11.9440
Bicarbonate Alkalinity (mg/CaCO3/L) 1 48.800 48.800 48.8000 48.800 48.8000 48.800
Chloride (mg/L) 5 31.000 31.000 29.0000 33.000 29.5000 32.500 1.5810
Sulphate as SO42-(mg/L) 3 19.667 20.000 15.0000 24.000 15.0000 24.000 4.5090
Fluoride (mg/L) 12 0.201 0.155 0.1300 0.680 0.1400 0.180 0.1520
Sodium (mg/L) 5 24.140 23.600 21.8000 27.600 22.2000 26.350 2.2930
Magnesium (mg/L) 5 4.414 4.320 4.0100 5.310 4.0250 4.850 0.5280
Potassium (mg/L) 3 3.443 3.100 2.7600 4.470 2.7600 4.470 0.9050
Calcium (mg/L) 5 20.080 20.900 11.9000 29.600 14.0000 25.750 6.6590
Aluminium (ug/L) 1 4180.000 4180.000 4180.0000 4180.000 4180.0000 4180.000
Arsenic (ug/L) 1 3.000 3.000 3.0000 3.000 3.0000 3.000
Cadmium (ug/L) 1 0.500 0.500 0.5000 0.500 0.5000 0.500
Chromium (ug/L) 1 2.000 2.000 2.0000 2.000 2.0000 2.000
Copper (ug/L) 1 18.000 18.000 18.0000 18.000 18.0000 18.000
Lead (ug/L) 1 5.000 5.000 5.0000 5.000 5.0000 5.000
Manganese (ug/L) 1 38.000 38.000 38.0000 38.000 38.0000 38.000
Molybdenum (ug/L) 1 0.500 0.500 0.5000 0.500 0.5000 0.500
Nickel (ug/L) 1 2.000 2.000 2.0000 2.000 2.0000 2.000
Selenium (ug/L) 1 1.500 1.500 1.5000 1.500 1.5000 1.500
Silver (ug/L) 1 0.500 0.500 0.5000 0.500 0.5000 0.500
Uranium (ug/L) 1 0.500 0.500 0.5000 0.500 0.5000 0.500
Zinc (ug/L) 1 86.000 86.000 86.0000 86.000 86.0000 86.000
Boron (ug/L) 1 44.000 44.000 44.0000 44.000 44.0000 44.000
Iron (ug/L) 2 1090.680 1090.680 1.3600 2180.000 1.3600 2180.000 1540.5310
Mercury (ug/L) 1 0.020 0.020 0.0200 0.020 0.0200 0.020
Summary Statistics for Site 147 for July 2014 to June 2015
Site 147 Valid N Mean Median Minimum Maximum Percentile Percentile Std.Dev.
20 80
Temperature (oC) 10 15.777 14.485 12.060 21.070 12.645 19.735 3.317
Electrical Conductivity (ms/cm) 10 0.220 0.210 0.120 0.330 0.145 0.300 0.076
Electrical Conductivity (µS/cm) 10 206.500 200.500 114.000 295.000 142.500 275.000 62.996
Turbidity (NTU) 10 2.860 0.200 0.000 16.700 0.000 4.800 5.298
Dissolved oxygen (mg/L) 10 9.318 9.595 7.110 10.920 8.145 10.485 1.291
Dissolved oxygen (%sat) 10 92.228 93.990 77.900 101.500 85.650 99.650 7.775
pH 10 6.152 6.075 5.670 7.070 5.805 6.480 0.445
Salinity (ppt) 10 0.108 0.105 0.060 0.160 0.070 0.145 0.037
Suspended Solids (mg/L) 10 1.300 1.000 1.000 4.000 1.000 1.000 0.949
Ammonium-Nitrogen (mg/L) 10 0.006 0.005 0.005 0.010 0.005 0.008 0.002
Oxidised Nitrogen (mg/L) 10 0.006 0.005 0.005 0.010 0.005 0.005 0.002
Total Nitrogen (mg/L) 10 0.199 0.160 0.120 0.420 0.135 0.255 0.094
Total Phosphorus(mg/L) 10 0.005 0.004 0.001 0.011 0.003 0.007 0.003
Faecal Coliforms (CFU/100ml) 10 146.25 58.00 0.50 590.00 17.50 240.00 183.19
Enterococci (CFU/100ml) 5 30.80 28.00 2.00 71.00 5.00 58.00 28.17
E Coli (CFU/100mL) 2 126.00 126.00 52.00 200.00 52.00 200.00 104.65
Bicarbonate Alkalinity (mg/CaCO3/L) 4 5.025 4.500 2.800 8.300 2.800 8.300 2.465
Chloride (mg/L) 4 50.500 52.000 27.000 71.000 27.000 71.000 18.699
Sulphate as SO42-(mg/L) 4 7.275 8.450 2.400 9.800 2.400 9.800 3.490
Fluoride (mg/L) 4 0.025 0.025 0.025 0.025 0.025 0.025 0.000
Sodium (mg/L) 4 26.500 25.400 17.800 37.400 17.800 37.400 8.128
Potassium (mg/L) 4 1.445 1.325 1.090 2.040 1.090 2.040 0.412
Magnesium (mg/L) 4 5.365 5.430 2.900 7.700 2.900 7.700 1.969
Calcium (mg/L) 4 2.678 2.610 1.890 3.600 1.890 3.600 0.718
Aluminium (ug/L) 4 1008.250 334.500 204.000 3160.000 204.000 3160.000 1437.176
Arsenic (ug/L) 4 0.500 0.500 0.500 0.500 0.500 0.500 0.000
Cadmium (ug/L) 4 0.500 0.500 0.500 0.500 0.500 0.500 0.000
Chromium (ug/L) 4 1.250 1.250 0.500 2.000 0.500 2.000 0.866
Copper (ug/L) 4 0.875 1.000 0.500 1.000 0.500 1.000 0.250
Lead (ug/L) 4 1.000 0.750 0.500 2.000 0.500 2.000 0.707
Manganese (ug/L) 4 25.750 10.000 4.000 79.000 4.000 79.000 35.697
Molybdenum (ug/L) 4 0.500 0.500 0.500 0.500 0.500 0.500 0.000
Nickel (ug/L) 4 1.000 0.750 0.500 2.000 0.500 2.000 0.707

104 HORNSBY SHIRE COUNCIL 2014-2015 WATER QUALITY MONITORING PROGRAM ANNUAL REPORT
Selenium (ug/L) 4 1.500 1.500 1.500 1.500 1.500 1.500 0.000
Silver (ug/L) 4 0.500 0.500 0.500 0.500 0.500 0.500 0.000
Uranium (ug/L) 4 0.500 0.500 0.500 0.500 0.500 0.500 0.000
Zinc (ug/L) 4 8.250 6.000 5.000 16.000 5.000 16.000 5.252
Boron (ug/L) 4 32.750 28.500 16.000 58.000 16.000 58.000 17.951
Iron (ug/L) 4 677.750 689.000 83.000 1250.000 83.000 1250.000 524.777
Mercury (ug/L) 4 0.005 0.005 0.005 0.005 0.005 0.005 0.000
Summary Statistics for Site 149 for July 2014 to June 2015
Site 149 Valid N Mean Median Minimum Maximum Percentile Percentile Std.Dev.
20 80
Temperature (oC) 9 14.544 14.090 7.830 20.980 11.290 20.560 4.525
Electrical Conductivity (ms/cm) 9 0.317 0.340 0.130 0.420 0.250 0.380 0.089
Electrical Conductivity (µS/cm) 9 321.667 326.000 198.000 448.000 254.000 384.000 77.519
Turbidity (NTU) 9 3.711 0.500 0.000 26.800 0.000 2.100 8.698
Dissolved oxygen (mg/L) 9 9.436 9.160 6.810 12.100 7.250 11.460 2.019
Dissolved oxygen (%sat) 9 91.626 89.000 76.400 110.400 80.400 104.600 11.432
pH 9 4.533 4.550 4.150 4.730 4.470 4.670 0.167
Salinity (ppt) 9 0.158 0.170 0.060 0.210 0.130 0.190 0.046
Suspended Solids (mg/L) 9 10.778 1.000 1.000 76.000 1.000 11.000 24.672
Ammonium-Nitrogen (mg/L) 9 0.011 0.010 0.005 0.030 0.005 0.010 0.007
Oxidised Nitrogen (mg/L) 9 0.012 0.010 0.005 0.040 0.005 0.020 0.012
Total Nitrogen (mg/L) 9 0.143 0.110 0.070 0.330 0.070 0.260 0.094
Total Phosphorus(mg/L) 9 0.006 0.004 0.003 0.012 0.003 0.011 0.004
Faecal Coliforms (CFU/100ml) 9 50.17 11.00 0.50 270.00 1.00 120.00 90.54
Enterococci (CFU/100ml) 3 28.33 24.00 8.00 53.00 8.00 53.00 22.81
E Coli (CFU/100mL) 1 10.00 10.00 10.00 10.00 10.00 10.00
Bicarbonate Alkalinity (mg/CaCO3/L) 3 12.067 1.000 1.000 34.200 1.000 34.200 19.168
Chloride (mg/L) 3 98.667 79.000 67.000 150.000 67.000 150.000 44.859
Sulphate as SO42-(mg/L) 3 8.033 7.200 7.100 9.800 7.100 9.800 1.531
Fluoride (mg/L) 3 0.047 0.025 0.025 0.090 0.025 0.090 0.038
Sodium (mg/L) 3 53.933 38.500 33.600 89.700 33.600 89.700 31.072
Potassium (mg/L) 3 3.473 1.490 1.480 7.450 1.480 7.450 3.444
Magnesium (mg/L) 3 9.363 6.070 5.520 16.500 5.520 16.500 6.187
Calcium (mg/L) 3 6.183 1.680 1.270 15.600 1.270 15.600 8.158
Aluminium (ug/L) 3 241.000 314.000 51.000 358.000 51.000 358.000 166.009
Arsenic (ug/L) 3 0.350 0.500 0.050 0.500 0.050 0.500 0.260
Cadmium (ug/L) 3 0.350 0.500 0.050 0.500 0.050 0.500 0.260
Chromium (ug/L) 3 0.350 0.500 0.050 0.500 0.050 0.500 0.260
Copper (ug/L) 3 0.833 1.000 0.500 1.000 0.500 1.000 0.289
Lead (ug/L) 3 0.350 0.500 0.050 0.500 0.050 0.500 0.260
Manganese (ug/L) 3 160.333 160.000 66.000 255.000 66.000 255.000 94.500
Molybdenum (ug/L) 3 0.350 0.500 0.050 0.500 0.050 0.500 0.260
Nickel (ug/L) 3 2.667 3.000 1.000 4.000 1.000 4.000 1.528
Selenium (ug/L) 3 1.500 1.500 1.500 1.500 1.500 1.500 0.000
Silver (ug/L) 3 0.500 0.500 0.500 0.500 0.500 0.500 0.000
Uranium (ug/L) 3 0.500 0.500 0.500 0.500 0.500 0.500 0.000
Zinc (ug/L) 3 13.000 17.000 5.000 17.000 5.000 17.000 6.928
Boron (ug/L) 3 25.333 18.000 16.000 42.000 16.000 42.000 14.468
Iron (ug/L) 3 481.333 349.000 267.000 828.000 267.000 828.000 303.009
Mercury (ug/L) 3 0.005 0.005 0.005 0.005 0.005 0.005 0.000
Summary Statistics for Site 150 for July 2014 to June 2015
Site 150 Valid N Mean Median Minimum Maximum Percentile Percentile Std.Dev.
20 80
Secchi Depth (m) 14 1.321 1.300 0.600 1.900 1.000 1.600 0.351
Temperature (oC) 14 19.947 19.700 13.750 25.050 17.360 23.380 3.567
Turbidity (NTU) 14 6.250 5.600 2.600 14.100 3.600 8.100 3.372
Dissolved oxygen (mg/L) 14 7.024 6.755 6.200 8.200 6.530 7.960 0.648
Dissolved oxygen (%sat) 14 93.357 93.300 78.500 103.900 88.900 97.900 5.937
pH 14 7.967 7.985 7.650 8.120 7.920 8.110 0.142
Salinity (ppt) 14 32.126 33.140 15.860 34.910 31.740 34.300 4.789
Suspended Solids (mg/L) 15 7.400 8.000 1.000 12.000 5.000 11.000 3.355
Ammonium-Nitrogen (mg/L) 15 0.016 0.010 0.005 0.080 0.008 0.020 0.018
Oxidised Nitrogen (mg/L) 15 0.031 0.010 0.005 0.200 0.008 0.040 0.050
Total Nitrogen (mg/L) 15 0.250 0.230 0.170 0.640 0.200 0.255 0.111
Total Phosphorus(mg/L) 15 0.019 0.017 0.013 0.034 0.015 0.022 0.005
Soluble Reactive Phosphorus (mg/L) 5 0.009 0.009 0.006 0.013 0.006 0.012 0.003
Chlorphyll-a (ug/L) 15 2.627 2.600 0.800 6.200 1.700 3.250 1.281
Faecal Coliforms (CFU/100ml) 15 5.07 0.50 0.50 42.00 0.50 1.50 11.85

105 HORNSBY SHIRE COUNCIL 2014-2015 WATER QUALITY MONITORING PROGRAM ANNUAL REPORT
Enterococci (CFU/100ml) 15 1.27 0.50 0.50 8.00 0.50 1.50 1.94
Summary Statistics for Site 151 for July 2014 to June 2015
Site 151 Valid N Mean Median Minimum Maximum Percentile Percentile Std.Dev.
20 80
Secchi Depth (m) 14 0.775 0.750 0.300 1.250 0.400 1.100 0.303
Temperature (oC) 14 20.481 21.270 11.870 27.220 15.720 25.570 5.026
Turbidity (NTU) 14 13.307 10.150 7.000 31.700 7.200 21.300 7.583
Dissolved oxygen (mg/L) 14 6.784 6.580 5.130 8.860 6.000 8.190 1.087
Dissolved oxygen (%sat) 14 85.907 86.350 71.400 102.700 79.600 95.500 8.894
pH 14 7.740 7.745 6.960 8.020 7.630 7.960 0.264
Salinity (ppt) 14 24.126 25.105 5.000 29.740 21.650 28.290 6.118
Suspended Solids (mg/L) 15 10.667 9.000 5.000 17.000 7.000 15.500 4.100
Ammonium-Nitrogen (mg/L) 15 0.023 0.010 0.005 0.110 0.010 0.020 0.029
Oxidised Nitrogen (mg/L) 15 0.065 0.030 0.010 0.260 0.020 0.110 0.069
Total Nitrogen (mg/L) 15 0.356 0.320 0.240 0.810 0.265 0.355 0.152
Total Phosphorus(mg/L) 15 0.022 0.019 0.012 0.047 0.017 0.028 0.009
Soluble Reactive Phosphorus (mg/L) 5 0.009 0.009 0.006 0.012 0.007 0.011 0.002
Chlorphyll-a (ug/L) 15 4.620 4.400 1.500 8.600 2.250 7.150 2.358
Faecal Coliforms (CFU/100ml) 15 4.60 2.00 0.50 43.00 0.50 3.50 10.74
Enterococci (CFU/100ml) 15 6.90 2.00 0.50 59.00 0.50 5.50 15.01
Summary Statistics for Site 152 for July 2014 to June 2015
Site 152 Valid N Mean Median Minimum Maximum Percentile Percentile Std.Dev.
20 80
Secchi Depth (m) 13 0.962 0.700 0.500 1.800 0.500 1.600 0.512
Temperature (oC) 13 21.200 23.530 13.080 27.777 15.420 26.180 5.227
Turbidity (NTU) 13 9.092 6.700 3.200 25.400 5.300 13.100 6.003
Dissolved oxygen (mg/L) 13 6.857 6.670 5.560 8.960 5.900 7.710 1.112
Dissolved oxygen (%sat) 13 85.531 87.400 73.100 96.900 75.700 92.400 7.835
pH 13 7.654 7.690 7.180 7.940 7.520 7.810 0.208
Salinity (ppt) 13 19.598 20.570 11.090 26.300 15.790 22.940 4.309
Suspended Solids (mg/L) 14 8.500 7.500 4.000 18.000 4.000 13.000 4.220
Ammonium-Nitrogen (mg/L) 14 0.025 0.010 0.005 0.140 0.010 0.040 0.035
Oxidised Nitrogen (mg/L) 14 0.121 0.105 0.040 0.250 0.070 0.170 0.065
Total Nitrogen (mg/L) 14 0.404 0.360 0.290 0.730 0.310 0.470 0.120
Total Phosphorus(mg/L) 14 0.023 0.018 0.015 0.063 0.016 0.029 0.013
Soluble Reactive Phosphorus (mg/L) 4 0.010 0.010 0.006 0.012 0.006 0.012 0.003
Chlorphyll-a (ug/L) 14 5.071 3.900 1.400 21.200 1.600 5.900 5.142
Faecal Coliforms (CFU/100ml) 14 4.68 2.50 0.50 19.00 1.00 6.00 5.34
Enterococci (CFU/100ml) 14 5.79 2.50 0.50 38.00 1.00 8.00 9.70
Summary Statistics for Site 153 for July 2014 to June 2015
Site 153 Valid N Mean Median Minimum Maximum Percentile Percentile Std.Dev.
20 80
Secchi Depth (m) 13 0.646 0.600 0.200 1.200 0.300 1.000 0.320
Temperature (oC) 13 21.608 24.180 13.110 27.980 14.900 26.740 5.543
Turbidity (NTU) 13 18.569 13.600 7.300 37.100 8.300 29.100 10.338
Dissolved oxygen (mg/L) 13 7.586 7.210 6.460 10.330 6.740 7.910 1.157
Dissolved oxygen (%sat) 13 88.215 88.000 73.500 103.800 80.700 96.500 8.115
pH 13 7.426 7.410 6.940 7.780 7.340 7.510 0.206
Salinity (ppt) 13 5.870 5.620 0.190 11.760 0.890 8.380 3.736
Suspended Solids (mg/L) 14 14.071 15.000 6.000 26.000 7.000 19.000 6.207
Ammonium-Nitrogen (mg/L) 14 0.021 0.010 0.005 0.070 0.005 0.040 0.022
Oxidised Nitrogen (mg/L) 14 0.195 0.125 0.005 0.530 0.020 0.350 0.183
Total Nitrogen (mg/L) 14 0.531 0.470 0.300 0.860 0.330 0.820 0.204
Total Phosphorus(mg/L) 14 0.032 0.029 0.012 0.065 0.018 0.050 0.016
Soluble Reactive Phosphorus (mg/L) 4 0.009 0.007 0.003 0.018 0.003 0.018 0.007
Chlorphyll-a (ug/L) 14 10.607 10.750 1.500 25.100 3.500 17.000 6.628
Faecal Coliforms (CFU/100ml) 14 5.21 5.50 2.00 9.00 3.00 7.00 2.08
Enterococci (CFU/100ml) 14 7.29 4.00 0.50 38.00 0.50 12.00 10.05
Summary Statistics for Site 164 for July 2014 to June 2015
Site 164 Valid N Mean Median Minimum Maximum Percentile Percentile Std.Dev.
20 80
Temperature (oC) 9 17.779 18.870 8.420 29.660 11.600 24.340 6.609
Electrical Conductivity (ms/cm) 9 0.171 0.160 0.120 0.240 0.120 0.210 0.047
Electrical Conductivity (µS/cm) 9 161.667 168.000 114.000 196.000 125.000 178.000 25.822
Turbidity (NTU) 9 2.644 1.100 0.000 10.300 0.400 4.600 3.307

106 HORNSBY SHIRE COUNCIL 2014-2015 WATER QUALITY MONITORING PROGRAM ANNUAL REPORT
Dissolved oxygen (mg/L) 9 8.080 9.180 0.750 11.890 5.240 11.200 3.492
Dissolved oxygen (%sat) 9 92.348 96.100 62.900 102.800 86.630 101.300 12.075
pH 9 4.862 4.820 4.320 5.490 4.500 5.470 0.408
Salinity (ppt) 9 0.084 0.080 0.060 0.120 0.060 0.110 0.024
Suspended Solids (mg/L) 9 2.889 2.000 1.000 12.000 1.000 4.000 3.551
Ammonium-Nitrogen (mg/L) 9 0.007 0.005 0.005 0.010 0.005 0.010 0.003
Oxidised Nitrogen (mg/L) 9 0.008 0.005 0.005 0.020 0.005 0.010 0.005
Total Nitrogen (mg/L) 9 0.113 0.090 0.050 0.260 0.080 0.140 0.060
Total Phosphorus(mg/L) 9 0.004 0.003 0.002 0.010 0.002 0.004 0.003
Faecal Coliforms (CFU/100ml) 9 101.17 15.00 0.50 610.00 1.00 180.00 199.45
Enterococci (CFU/100ml) 4 29.75 22.00 1.00 74.00 1.00 74.00 31.12
E Coli (CFU/100mL) 2 16.00 16.00 6.00 26.00 6.00 26.00 14.14
Bicarbonate Alkalinity (mg/CaCO3/L) 2 1.500 1.500 1.000 2.000 1.000 2.000 0.707
Chloride (mg/L) 2 37.000 37.000 32.000 42.000 32.000 42.000 7.071
Sulphate as SO42-(mg/L) 2 4.950 4.950 4.500 5.400 4.500 5.400 0.636
Fluoride (mg/L) 2 0.025 0.025 0.025 0.025 0.025 0.025 0.000
Sodium (mg/L) 2 19.600 19.600 18.200 21.000 18.200 21.000 1.980
Potassium (mg/L) 2 0.950 0.950 0.860 1.040 0.860 1.040 0.127
Magnesium (mg/L) 2 3.020 3.020 2.750 3.290 2.750 3.290 0.382
Calcium (mg/L) 2 0.370 0.370 0.270 0.470 0.270 0.470 0.141
Aluminium (ug/L) 2 286.500 286.500 228.000 345.000 228.000 345.000 82.732
Arsenic (ug/L) 2 0.500 0.500 0.500 0.500 0.500 0.500 0.000
Cadmium (ug/L) 2 0.500 0.500 0.500 0.500 0.500 0.500 0.000
Chromium (ug/L) 2 0.500 0.500 0.500 0.500 0.500 0.500 0.000
Copper (ug/L) 2 0.750 0.750 0.500 1.000 0.500 1.000 0.354
Lead (ug/L) 2 0.500 0.500 0.500 0.500 0.500 0.500 0.000
Manganese (ug/L) 2 18.500 18.500 14.000 23.000 14.000 23.000 6.364
Molybdenum (ug/L) 2 0.500 0.500 0.500 0.500 0.500 0.500 0.000
Nickel (ug/L) 2 0.500 0.500 0.500 0.500 0.500 0.500 0.000
Selenium (ug/L) 2 1.500 1.500 1.500 1.500 1.500 1.500 0.000
Silver (ug/L) 2 0.500 0.500 0.500 0.500 0.500 0.500 0.000
Uranium (ug/L) 2 0.500 0.500 0.500 0.500 0.500 0.500 0.000
Zinc (ug/L) 2 3.750 3.750 2.500 5.000 2.500 5.000 1.768
Boron (ug/L) 2 34.500 34.500 14.000 55.000 14.000 55.000 28.991
Iron (ug/L) 2 341.000 341.000 188.000 494.000 188.000 494.000 216.375
Mercury (ug/L) 2 0.005 0.005 0.005 0.005 0.005 0.005 0.000
Summary Statistics for Site 173 for July 2014 to June 2015
Site 173 Valid N Mean Median Minimum Maximum Percentile Percentile Std.Dev.
20 80
Temperature (oC) 11 17.334 16.640 13.3500 22.050 14.4500 20.620 2.9430
Electrical Conductivity (ms/cm) 11 0.107 0.110 0.0000 0.160 0.1100 0.150 0.0480
Electrical Conductivity (µS/cm) 11 97.364 99.000 33.0000 144.000 79.0000 114.000 31.5410
Turbidity (NTU) 11 17.236 13.300 2.5000 67.800 10.3000 16.700 17.3560
Dissolved oxygen (mg/L) 11 6.908 7.130 2.3300 10.350 3.9600 9.540 2.7850
Dissolved oxygen (%sat) 11 70.727 76.100 26.0000 100.800 45.3000 98.900 26.2510
pH 11 6.826 6.750 6.5400 7.360 6.7000 6.900 0.2360
Salinity (ppt) 11 0.055 0.060 0.0000 0.080 0.0500 0.070 0.0250
Suspended Solids (mg/L) 10 3.900 2.000 1.0000 18.000 1.0000 5.000 5.2160
Ammonium-Nitrogen (mg/L) 11 0.007 0.005 0.0050 0.020 0.0050 0.010 0.0050
Oxidised Nitrogen (mg/L) 11 0.735 0.690 0.2500 1.590 0.3100 0.870 0.4330
Total Nitrogen (mg/L) 11 0.921 0.880 0.3600 1.800 0.5200 1.410 0.4640
Total Phosphorus(mg/L) 11 0.034 0.029 0.0200 0.070 0.0220 0.047 0.0160
Faecal Coliforms (CFU/100ml) 12 2333.750 78.500 2.0000 26000.000 18.0000 640.000 7456.7560
Enterococci (CFU/100ml) 3 107.667 99.000 54.0000 170.000 54.0000 170.000 58.4840
Chloride (mg/L) 2 15.000 15.000 12.0000 18.000 12.0000 18.000 4.2430
Fluoride (mg/L) 12 0.025 0.025 0.0250 0.030 0.0250 0.025 0.0000
Sodium (mg/L) 2 11.000 11.000 9.2000 12.800 9.2000 12.800 2.5460
Magnesium (mg/L) 2 1.375 1.375 1.2800 1.470 1.2800 1.470 0.1340
Calcium (mg/L) 2 8.835 8.835 8.0100 9.660 8.0100 9.660 1.1670
Summary Statistics for Site 174 for July 2014 to June 2015
Site 174 Valid N Mean Median Minimum Maximum Percentile Percentile Std.Dev.
20 80
Secchi Depth (m) 14 0.957 0.925 0.550 1.900 0.700 1.100 0.327
Temperature (oC) 14 20.135 20.775 12.240 25.520 16.450 24.230 4.400
Turbidity (NTU) 14 10.393 9.900 3.500 20.000 5.800 13.800 4.904
Dissolved oxygen (mg/L) 14 6.908 6.755 5.720 8.630 6.260 7.750 0.841
Dissolved oxygen (%sat) 14 89.893 90.450 77.000 100.200 84.800 94.800 6.362

107 HORNSBY SHIRE COUNCIL 2014-2015 WATER QUALITY MONITORING PROGRAM ANNUAL REPORT
pH 14 7.868 7.935 7.360 8.070 7.820 8.050 0.222
Salinity (ppt) 14 29.359 30.500 10.230 32.930 29.420 31.940 5.636
Suspended Solids (mg/L) 15 10.600 11.000 7.000 13.000 8.500 12.000 2.063
Ammonium-Nitrogen (mg/L) 15 0.016 0.010 0.005 0.060 0.010 0.020 0.015
Oxidised Nitrogen (mg/L) 15 0.041 0.020 0.005 0.180 0.010 0.065 0.048
Total Nitrogen (mg/L) 15 0.277 0.250 0.190 0.600 0.220 0.285 0.104
Total Phosphorus(mg/L) 15 0.018 0.018 0.011 0.027 0.016 0.022 0.004
Soluble Reactive Phosphorus (mg/L) 5 0.008 0.007 0.006 0.012 0.007 0.011 0.002
Chlorphyll-a (ug/L) 15 3.173 3.300 1.500 5.000 1.900 4.150 1.132
Faecal Coliforms (CFU/100ml) 15 3.07 1.00 0.50 16.00 0.50 3.50 4.97
Enterococci (CFU/100ml) 15 14.67 1.00 0.50 200.00 0.50 3.00 51.28
Summary Statistics for Site 175 for July 2014 to June 2015
Site 175 Valid N Mean Median Minimum Maximum Percentile Percentile Std.Dev.
20 80
Temperature (oC) 15 18.454 18.530 13.940 22.780 14.720 21.505 3.133
Electrical Conductivity (ms/cm) 15 0.494 0.420 0.260 0.870 0.365 0.625 0.187
Electrical Conductivity (µS/cm) 15 504.133 433.000 237.000 858.000 382.000 657.000 180.752
Turbidity (NTU) 15 6.373 3.100 0.500 43.900 1.150 5.800 10.988
Dissolved oxygen (mg/L) 15 8.836 8.850 7.830 10.430 8.145 9.415 0.707
Dissolved oxygen (%sat) 15 93.993 94.000 80.700 101.000 90.700 98.650 5.160
pH 15 7.705 7.730 7.380 8.050 7.595 7.800 0.154
Salinity (ppt) 15 0.248 0.210 0.130 0.440 0.185 0.310 0.095
Suspended Solids (mg/L) 15 2.733 2.000 1.000 10.000 1.000 3.500 2.576
Ammonium-Nitrogen (mg/L) 15 0.095 0.080 0.005 0.340 0.030 0.130 0.085
Oxidised Nitrogen (mg/L) 15 1.013 0.980 0.270 2.100 0.545 1.375 0.485
Total Nitrogen (mg/L) 15 1.585 1.520 0.550 4.230 1.000 1.885 0.858
Total Phosphorus(mg/L) 15 0.038 0.030 0.014 0.100 0.020 0.064 0.025
Faecal Coliforms (CFU/100ml) 15 2837.93 650.00 99.00 23000.00 345.00 3200.00 5797.39
Enterococci (CFU/100ml) 9 343.56 290.00 35.00 960.00 37.00 680.00 300.36
E Coli (CFU/100mL) 3 292.00 280.00 66.00 530.00 66.00 530.00 232.23
Bicarbonate Alkalinity (mg/CaCO3/L) 3 62.000 67.400 50.400 68.200 50.400 68.200 10.054
Chloride (mg/L) 3 45.000 52.000 30.000 53.000 30.000 53.000 13.000
Sulphate as SO42-(mg/L) 3 17.333 17.000 16.000 19.000 16.000 19.000 1.528
Fluoride (mg/L) 15 0.586 0.620 0.110 0.850 0.495 0.705 0.190
Sodium (mg/L) 3 28.567 29.500 21.800 34.400 21.800 34.400 6.352
Potassium (mg/L) 3 3.960 3.060 2.780 6.040 2.780 6.040 1.807
Magnesium (mg/L) 3 6.290 7.100 4.020 7.750 4.020 7.750 1.993
Calcium (mg/L) 3 26.067 23.400 20.300 34.500 20.300 34.500 7.466
Aluminium (ug/L) 3 670.333 90.000 51.000 1870.000 51.000 1870.000 1039.125
Arsenic (ug/L) 3 0.667 0.500 0.500 1.000 0.500 1.000 0.289
Cadmium (ug/L) 3 0.500 0.500 0.500 0.500 0.500 0.500 0.000
Chromium (ug/L) 3 2.333 2.000 2.000 3.000 2.000 3.000 0.577
Copper (ug/L) 3 5.667 4.000 4.000 9.000 4.000 9.000 2.887
Lead (ug/L) 3 1.667 0.500 0.500 4.000 0.500 4.000 2.021
Manganese (ug/L) 3 27.000 30.000 10.000 41.000 10.000 41.000 15.716
Molybdenum (ug/L) 3 1.333 1.000 1.000 2.000 1.000 2.000 0.577
Nickel (ug/L) 3 1.500 2.000 0.500 2.000 0.500 2.000 0.866
Selenium (ug/L) 3 1.500 1.500 1.500 1.500 1.500 1.500 0.000
Silver (ug/L) 3 0.500 0.500 0.500 0.500 0.500 0.500 0.000
Uranium (ug/L) 3 0.500 0.500 0.500 0.500 0.500 0.500 0.000
Zinc (ug/L) 3 54.333 50.000 38.000 75.000 38.000 75.000 18.877
Boron (ug/L) 3 34.667 28.000 25.000 51.000 25.000 51.000 14.224
Iron (ug/L) 3 900.000 999.000 371.000 1330.000 371.000 1330.000 487.105
Mercury (ug/L) 3 0.005 0.005 0.005 0.010 0.005 0.005 0.000
Summary Statistics for Site 180 for July 2014 to June 2015
Site 180 Valid N Mean Median Minimum Maximum Percentile Percentile Std.Dev.
20 80
Temperature (oC) 4 19.770 19.945 16.0000 23.190 16.0000 23.190 3.5419
Electrical Conductivity (ms/cm) 4 0.208 0.210 0.1800 0.230 0.1800 0.230 0.0222
Electrical Conductivity (µS/cm) 4 182.500 183.000 155.0000 209.000 155.0000 209.000 24.8395
Turbidity (NTU) 4 12.525 2.550 1.6000 43.400 1.6000 43.400 20.5915
Dissolved oxygen (mg/L) 4 4.800 4.845 3.8100 5.700 3.8100 5.700 0.7781
Dissolved oxygen (%sat) 4 52.575 49.800 43.9000 66.800 43.9000 66.800 9.8858
pH 4 7.278 7.140 6.9500 7.880 6.9500 7.880 0.4116
Salinity (ppt) 4 0.103 0.105 0.0900 0.110 0.0900 0.110 0.0096
Suspended Solids (mg/L) 4 3.500 1.000 1.0000 11.000 1.0000 11.000 5.0000
Ammonium-Nitrogen (mg/L) 4 0.043 0.050 0.0200 0.050 0.0200 0.050 0.0150
Oxidised Nitrogen (mg/L) 4 0.298 0.295 0.1300 0.470 0.1300 0.470 0.1394

108 HORNSBY SHIRE COUNCIL 2014-2015 WATER QUALITY MONITORING PROGRAM ANNUAL REPORT
Total Nitrogen (mg/L) 4 0.748 0.705 0.6800 0.900 0.6800 0.900 0.1031
Total Phosphorus(mg/L) 4 0.167 0.101 0.0660 0.400 0.0660 0.400 0.1571
Faecal Coliforms (CFU/100ml) 4 75.750 46.500 10.0000 200.000 10.0000 200.000 87.7435
Enterococci (CFU/100ml) 3 161.000 77.000 16.0000 390.000 16.0000 390.000 200.6514
Chloride (mg/L) 1 12.000 12.000 12.0000 12.000 12.0000 12.000
Sulphate as SO42-(mg/L) 1 4.500 4.500 4.5000 4.500 4.5000 4.500
Fluoride (mg/L) 4 0.415 0.410 0.1400 0.700 0.1400 0.700 0.2288
Sodium (mg/L) 1 8.350 8.350 8.3500 8.350 8.3500 8.350
Magnesium (mg/L) 1 4.600 4.600 4.6000 4.600 4.6000 4.600
Potassium (mg/L) 1 5.270 5.270 5.2700 5.270 5.2700 5.270
Calcium (mg/L) 1 14.600 14.600 14.6000 14.600 14.6000 14.600

109 HORNSBY SHIRE COUNCIL 2014-2015 WATER QUALITY MONITORING PROGRAM ANNUAL REPORT
APPENDIX XX
SITE STATUS SITE LOCATION RECEIVING WATERS CATCHMENT SITE ACCESS PROJECT ACCESS FREQUENCY SITE TYPE Latitude Longitude
001 ACTIVE Berowra Ck, Galston Gorge Berowra Creek > Hawkesbury River Berowra Creek 200m downstream (north) of Galston Rd bridge and confluence with Tunks Ck
Routine Monitoring Car Monthly Freshwater S 33 39.8022' E 51 04.7695'
002 ACTIVE Tunks Ck, Galson Gorge Tunks Creek > Berowra Ck > Hawkesbury River
Berowra Creek 100m above confluence with Berowra CkUnder Galston Rd bridge Routine Monitoring Car Monthly Freshwater S 33 39.9326' E 51 04.7695'
003 NON-ACTIVE Bujwa Ck, below Cowan Bujwa Creek Berowra Project QUACK (south branch "reference" creek) Berowra CMC Car No Freshwater
004 ACTIVE Berowra Ck, Westleigh Berowra Ck > Hawkesbury River Berowra Creek About 800m south along Benowie Track from junction with firetrail below Barwood Close
Routine Monitoring Car Monthly Freshwater S 33 42.4804' E 51 04.0078'
005 ACTIVE Pyes Ck, Cherrybrook Pyes Ck > Berowra Ck > Hawkesbury River
Berowra Creek Below end Kristine Place Routine Monitoring Car Monthly Freshwater S 33 42.7778' E 51 02.2656'
006 ACTIVE Georges Ck, Dural Georges Ck > Pyes Ck > Berowra Ck > Hawkesbury River
Berowra Creek Below end of Jenner Rd or down Sydney Water access track off Fallon Drive
Routine Monitoring Car Monthly Freshwater S 33 42.6679' E 51 02.3359'
007 NON-ACTIVE Devlins Ck, Beecroft Devlins Creek Lane Cove End Mahers Rd, Beecroft behind golf course routine Monitoring Car Yes Freshwater
008 ACTIVE Devlins Ck, Cheltenham Devlins Ck > Lane Cove River Lane Cove River End Sutherland Rd, Cheltenham Routine Monitoring Car Monthly Freshwater S 33 45.7905' E 51 05.0410'
009 NON-ACTIVE Bujwa Ck, Cowan Bujwa Creek Berowra Project QUACK (north branch) Berowra CMC Car No Freshwater
010 ACTIVE Larool Ck, Thornleigh Larool Ck > Waitara Ck > Berowra Ck > Hawkesbury River
Berowra Creek Behind park next to Larool Child Care Centre, below Thornleigfh Industrial Area
Routine Monitoring Car Fortnightly Freshwater S 33 43.1953' E 51 04.9609'
011 NON-ACTIVE Canoeland Ck Canoelands Creek Berowra Project QUACK Berowra CMC Car No Freshwater
012 ACTIVE Hornsby Ck, Hornsby Hornsby Ck > Cockle Ck > Cowan Ck Cowan Creek 20m upstream of Leighton Place crossing of Creek Routine Monitoring Car Fortnightly Freshwater S 33 41.8002' E 51 06.7148'
013 ACTIVE Sams Ck, Mt Ku-ring-gai Sams Ck > Berowra Ck > Hawkesbury River
Berowra Creek Walk down fire trail from bottom of Hamley Rd. 10m below trash rack
Routine Monitoring Car Fortnightly Freshwater S 33 38.4819' E 51 08.1386'
014 NON-ACTIVE Water tank, Greenway Park, Shephards Drive Cherrybrook
Berowra Creek Berowra Stormwater tank at Greenway Pk off Shephards Dv, Cherrybrook - tank removed ~2009
Stormwater Harvesting
Car No Stormwater
015 NON-ACTIVE Water tank Pennant Hills Tennis Courts
Berowra Creek Berowra Stormwater tank in Pennant Hills Park behind tennis courts Stormwater Harvesting
Car No Stormwater
016 NON-ACTIVE Water tank in Sommerville Park, Epping
Terrys Creek Lane Cove Stormwater tank near Sommerville Oval - tank removed 2010 Stormwater Harvesting
Car No Stormwater
017 NON-ACTIVE Colah Ck, Sallaway Rd crossing Colah Creek Berowra Project QUACK routine Monitoring Car No Freshwater
018 ACTIVE Arcadia Tip Calabash Ck > Calabash Bay > Berowra Ck > Hawkesbury River
Berowra Creek Arcadia tip leachate (main pond now) concrete sump. Access down track in locked compound). Lift concrete lid to dip sample
Tip leachate monitoring
Car Quarterly Leachate S 33 36.8559' E 51 03.4785'
019 NON-ACTIVE Hornsby Heights STP outfall (into Calna Ck) Walls Gully
Calna Creek Berowra End Pikes Rd in SW land routine Monitoring Car Yes Freshwater
020 NON-ACTIVE Calna Ck, Walls Gully, Hornsby Heights
Calna Creek Berowra Near Pikes Rd 100m upstream of SW STP routine Monitoring Car Yes Freshwater
021 NON-ACTIVE Calna Ck, Walls Gully, Hornsby Heights (downstream of STP)
Calna Creek Berowra 100m downstream of STP routine Monitoring Car Yes Freshwater
022 NON-ACTIVE Waitara Ck, West Hornsby STP outfall
Waitara Creek Berowra Outfall from West Hornsby STP into Waitara Ck. Access of Valley Rd down concrete channel
routine Monitoring Car Yes Freshwater
023 ACTIVE Waitara Ck, Hornsby Waitara Ck > Berowra Ck > Hawkesbury River
Berowra Creek Upstream side of concrete causeway of firetrail just south of Ginger Meggs Park
Routine Monitoring Car Monthly Freshwater S 33 42.1420' E 51 04.8320'
024 NON-ACTIVE Waitara Ck, downstream of West Hornsby STP
Waitara Creek Berowra Just upstream of confluence with Old Mans Ck routine Monitoring Car Yes Freshwater
025 NON-ACTIVE Samuel Oxley Park West Pennant Hills- downstream of CDS
Berowra Creek Berowra Down stream of SQID CRR Device Car No Freshwater
026 NON-ACTIVE Samuel Oxley Park- West Pennant Hills- upstream of CDS Device
Berowra Creek Berowra Upstream of SQID CRR Device Car No Freshwater
027 NON-ACTIVE Clarinda St wetland- Downstream Berowra Creek Berowra Wetland overflow at weir of lower pond CRR Device Car No Stormwater
028 NON-ACTIVE Clarinda St Wetland- upstream Berowra Creek Berowra Inlet of wetland below trash rack CRR Device Car No Stormwater
029 NON-ACTIVE Fiddletown Ck Fiddletown Creek Berowra Project QUACK Berowra CMC Car No Freshwater
030 NON-ACTIVE HSC Nursery- downstream-raw water
Berowra Creek Berowra
CRR Device Car No Freshwater
031 NON-ACTIVE HSC Nursery- upstream-wetland Berowra Creek Berowra
CRR Device Car No Freshwater
032 NON-ACTIVE Council Depot- Sefton Road- upstream
Berowra Creek Berowra
CRR Device Car No Freshwater
033 NON-ACTIVE Council Depot- Sefton Road- downstream
Berowra Creek Berowra
CRR Device Car No Freshwater
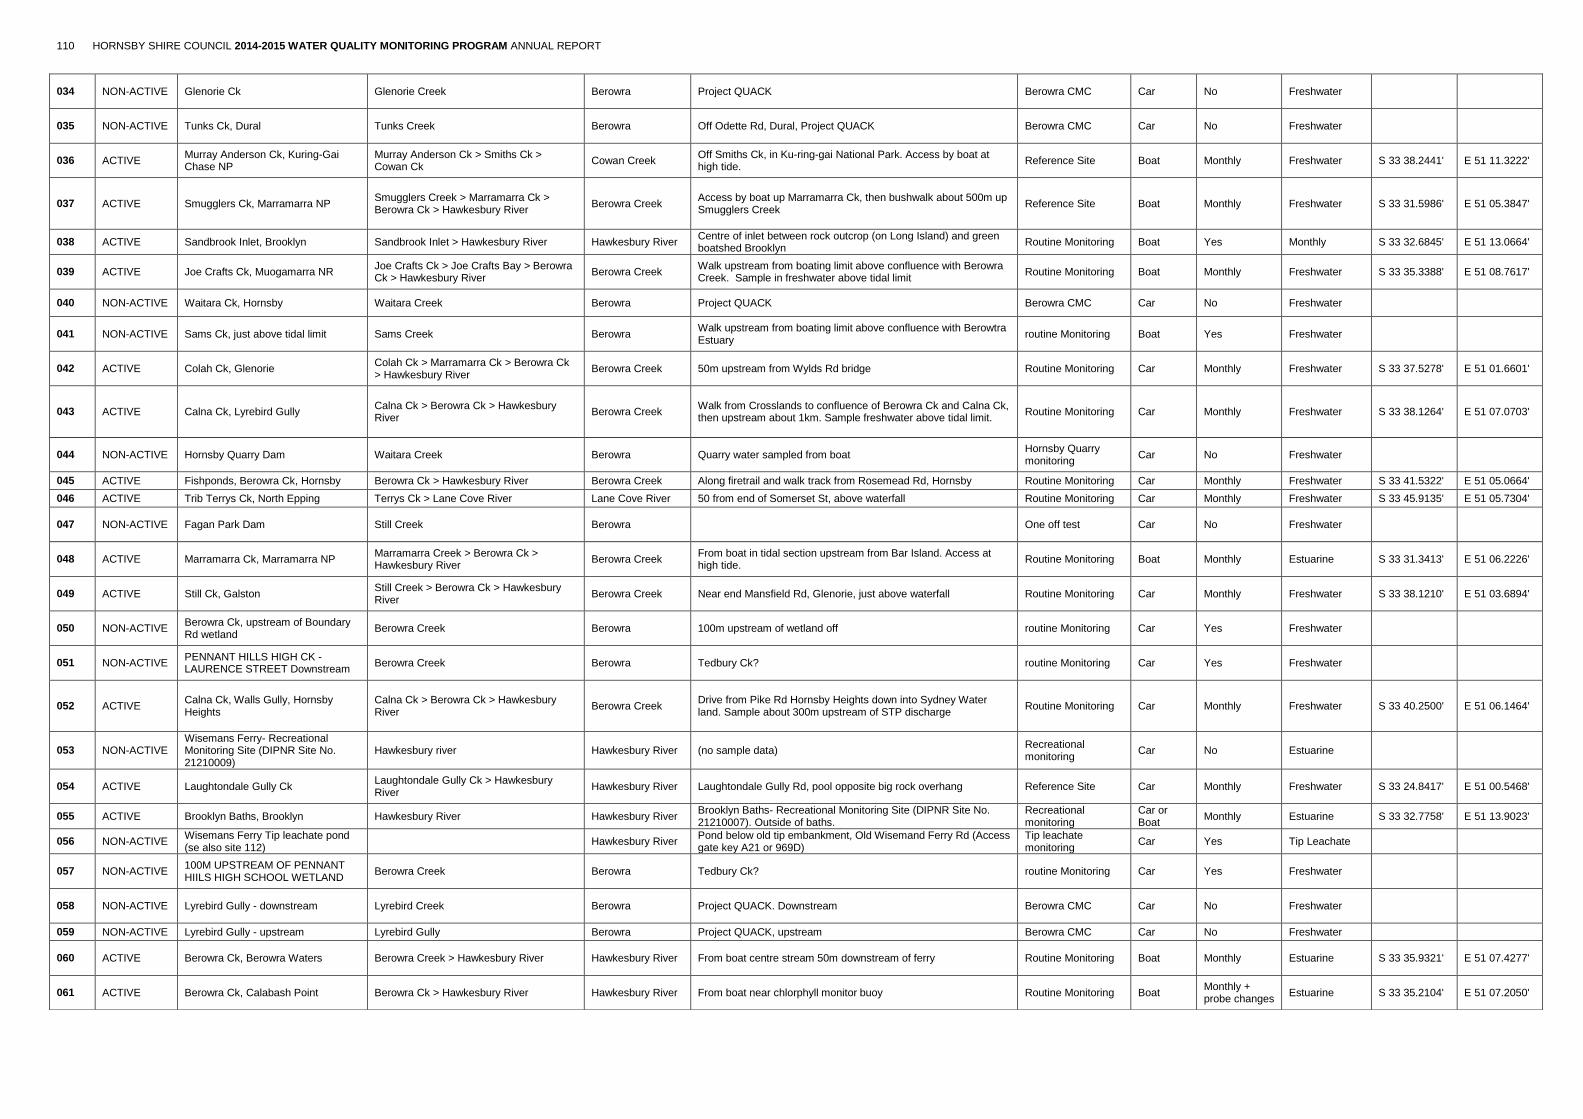
110 HORNSBY SHIRE COUNCIL 2014-2015 WATER QUALITY MONITORING PROGRAM ANNUAL REPORT
034 NON-ACTIVE Glenorie Ck Glenorie Creek Berowra Project QUACK Berowra CMC Car No Freshwater
035 NON-ACTIVE Tunks Ck, Dural Tunks Creek Berowra Off Odette Rd, Dural, Project QUACK Berowra CMC Car No Freshwater
036 ACTIVE Murray Anderson Ck, Kuring-Gai Chase NP
Murray Anderson Ck > Smiths Ck > Cowan Ck
Cowan Creek Off Smiths Ck, in Ku-ring-gai National Park. Access by boat at high tide.
Reference Site Boat Monthly Freshwater S 33 38.2441' E 51 11.3222'
037 ACTIVE Smugglers Ck, Marramarra NP Smugglers Creek > Marramarra Ck > Berowra Ck > Hawkesbury River
Berowra Creek Access by boat up Marramarra Ck, then bushwalk about 500m up Smugglers Creek
Reference Site Boat Monthly Freshwater S 33 31.5986' E 51 05.3847'
038 ACTIVE Sandbrook Inlet, Brooklyn Sandbrook Inlet > Hawkesbury River Hawkesbury River Centre of inlet between rock outcrop (on Long Island) and green boatshed Brooklyn
Routine Monitoring Boat Yes Monthly S 33 32.6845' E 51 13.0664'
039 ACTIVE Joe Crafts Ck, Muogamarra NR Joe Crafts Ck > Joe Crafts Bay > Berowra Ck > Hawkesbury River
Berowra Creek Walk upstream from boating limit above confluence with Berowra Creek. Sample in freshwater above tidal limit
Routine Monitoring Boat Monthly Freshwater S 33 35.3388' E 51 08.7617'
040 NON-ACTIVE Waitara Ck, Hornsby Waitara Creek Berowra Project QUACK Berowra CMC Car No Freshwater
041 NON-ACTIVE Sams Ck, just above tidal limit Sams Creek Berowra Walk upstream from boating limit above confluence with Berowtra Estuary
routine Monitoring Boat Yes Freshwater
042 ACTIVE Colah Ck, Glenorie Colah Ck > Marramarra Ck > Berowra Ck > Hawkesbury River
Berowra Creek 50m upstream from Wylds Rd bridge Routine Monitoring Car Monthly Freshwater S 33 37.5278' E 51 01.6601'
043 ACTIVE Calna Ck, Lyrebird Gully Calna Ck > Berowra Ck > Hawkesbury River
Berowra Creek Walk from Crosslands to confluence of Berowra Ck and Calna Ck, then upstream about 1km. Sample freshwater above tidal limit.
Routine Monitoring Car Monthly Freshwater S 33 38.1264' E 51 07.0703'
044 NON-ACTIVE Hornsby Quarry Dam Waitara Creek Berowra Quarry water sampled from boat Hornsby Quarry monitoring
Car No Freshwater
045 ACTIVE Fishponds, Berowra Ck, Hornsby Berowra Ck > Hawkesbury River Berowra Creek Along firetrail and walk track from Rosemead Rd, Hornsby Routine Monitoring Car Monthly Freshwater S 33 41.5322' E 51 05.0664'
046 ACTIVE Trib Terrys Ck, North Epping Terrys Ck > Lane Cove River Lane Cove River 50 from end of Somerset St, above waterfall Routine Monitoring Car Monthly Freshwater S 33 45.9135' E 51 05.7304'
047 NON-ACTIVE Fagan Park Dam Still Creek Berowra
One off test Car No Freshwater
048 ACTIVE Marramarra Ck, Marramarra NP Marramarra Creek > Berowra Ck > Hawkesbury River
Berowra Creek From boat in tidal section upstream from Bar Island. Access at high tide.
Routine Monitoring Boat Monthly Estuarine S 33 31.3413' E 51 06.2226'
049 ACTIVE Still Ck, Galston Still Creek > Berowra Ck > Hawkesbury River
Berowra Creek Near end Mansfield Rd, Glenorie, just above waterfall Routine Monitoring Car Monthly Freshwater S 33 38.1210' E 51 03.6894'
050 NON-ACTIVE Berowra Ck, upstream of Boundary Rd wetland
Berowra Creek Berowra 100m upstream of wetland off routine Monitoring Car Yes Freshwater
051 NON-ACTIVE PENNANT HILLS HIGH CK - LAURENCE STREET Downstream
Berowra Creek Berowra Tedbury Ck? routine Monitoring Car Yes Freshwater
052 ACTIVE Calna Ck, Walls Gully, Hornsby Heights
Calna Ck > Berowra Ck > Hawkesbury River
Berowra Creek Drive from Pike Rd Hornsby Heights down into Sydney Water land. Sample about 300m upstream of STP discharge
Routine Monitoring Car Monthly Freshwater S 33 40.2500' E 51 06.1464'
053 NON-ACTIVE Wisemans Ferry- Recreational Monitoring Site (DIPNR Site No. 21210009)
Hawkesbury river Hawkesbury River (no sample data) Recreational monitoring
Car No Estuarine
054 ACTIVE Laughtondale Gully Ck Laughtondale Gully Ck > Hawkesbury River
Hawkesbury River Laughtondale Gully Rd, pool opposite big rock overhang Reference Site Car Monthly Freshwater S 33 24.8417' E 51 00.5468'
055 ACTIVE Brooklyn Baths, Brooklyn Hawkesbury River Hawkesbury River Brooklyn Baths- Recreational Monitoring Site (DIPNR Site No. 21210007). Outside of baths.
Recreational monitoring
Car or Boat
Monthly Estuarine S 33 32.7758' E 51 13.9023'
056 NON-ACTIVE Wisemans Ferry Tip leachate pond (se also site 112)
Hawkesbury River Pond below old tip embankment, Old Wisemand Ferry Rd (Access gate key A21 or 969D)
Tip leachate monitoring
Car Yes Tip Leachate
057 NON-ACTIVE 100M UPSTREAM OF PENNANT HIILS HIGH SCHOOL WETLAND
Berowra Creek Berowra Tedbury Ck? routine Monitoring Car Yes Freshwater
058 NON-ACTIVE Lyrebird Gully - downstream Lyrebird Creek Berowra Project QUACK. Downstream Berowra CMC Car No Freshwater
059 NON-ACTIVE Lyrebird Gully - upstream Lyrebird Gully Berowra Project QUACK, upstream Berowra CMC Car No Freshwater
060 ACTIVE Berowra Ck, Berowra Waters Berowra Creek > Hawkesbury River Hawkesbury River From boat centre stream 50m downstream of ferry Routine Monitoring Boat Monthly Estuarine S 33 35.9321' E 51 07.4277'
061 ACTIVE Berowra Ck, Calabash Point Berowra Ck > Hawkesbury River Hawkesbury River From boat near chlorphyll monitor buoy Routine Monitoring Boat Monthly + probe changes
Estuarine S 33 35.2104' E 51 07.2050'

111 HORNSBY SHIRE COUNCIL 2014-2015 WATER QUALITY MONITORING PROGRAM ANNUAL REPORT
062 ACTIVE Kimmeriong Ck, Cowan Kimmerikong Ck > Kimmerikong Bay > Berowra Ck > Hawkesbury River
Berowra Creek About 300m from Alberta Ave along bushtrack Routine Monitoring Car Monthly Freshwater S 33 35.1772' E 51 10.2910'
063 ACTIVE Colah Creek, Ben Bullen Road Colah Creek > Marramarra Ck > Berowra Ck > Hawkesbury River
Berowra Creek Drive/walk down firetrail then track for about 400m Routine Monitoring Car Monthly Freshwater S 33 34.9067' E 51 02.0957'
064 ACTIVE Trib Colah Ck, Galston Trib > Colah Creek > Marramarra Ck > Berowra Ck > Hawkesbury River
Berowra Creek small stream at causeway of firetrail off Sallaway Rd Routine Monitoring Car Monthly Freshwater S 33 38.7304' E 51 01.9843'
065 NON-ACTIVE Bujwa Bay Berowra Estuary Hawkesbury River
Routine Monitoring Boat No Estuarine
066 NON-ACTIVE Berowra Ck, Boundary Rd, Pennant Hills
Berowra Creek Berowra Below Boundary Rd Routine Monitoring Car Yes Freshwater
067 NON-ACTIVE BEROWRA CREEK AT KIMMERKONG BAY (FC ONLY)
Berowra Esturary Hawkesbury River
Routine Monitoring Boat Yes Estuarine
068 NON-ACTIVE BEROWRA CREEK AT COBA BAY (FC ONLY)
Berowra Esturary Hawkesbury River
Routine Monitoring Boat Yes Estuarine
069 NON-ACTIVE BEROWRA CREEK AT PEATS BITE (FC ONLY)
Berowra Esturary Hawkesbury River
Routine Monitoring Boat Yes Estuarine
070 NON-ACTIVE MOONEY MOONEY CK AT WORKERS CLUB WHARF (MIDSTREAM)
Lower Hawkesbury Estuary Hawkesbury River
Routine Monitoring Boat Yes Estuarine
071 NON-ACTIVE MOONEY MOONEY CREEK AT SNAKE ISLAND
Lower Hawkesbury Estuary Hawkesbury River
Routine Monitoring Boat Yes Estuarine
072 NON-ACTIVE MULLET CREEK IN BETWEEN FIRST TWO OYSTER LEASES
Lower Hawkesbury Estuary Hawkesbury River
Routine Monitoring Boat Yes Estuarine
073 NON-ACTIVE Kalang Rd, Asquith - upstream of SQID
Calna Creek Berowra Upstream of sed. Basin at Kalang Rd, Asquith Routine Monitoring Car Yes Freshwater
074 NON-ACTIVE Kalang Rd, Asquith - SQID downstream of both sed basins
Calna Creek Berowra Downstream of sed. Basin at Kalang Rd, Asquith Routine Monitoring Car Yes Freshwater
075 NON-ACTIVE Berowra Ck, below Boundary Rd wetland
Berowra Creek Berowra Directly below wetland at green outlet pipe Routine Monitoring Car Yes Freshwater
076 NON-ACTIVE PORTO BAY Lower Hawkesbury Estuary Hawkesbury River
Routine Monitoring Boat Yes Estuarine
077 ACTIVE Gleeson Ck, Mt Colah Gleeson Creek > Calna Ck > Berowra Ck > Hawkesbury River
Berowra Creek Upstream of fire trail causeway off Oxley Dr, Mt Colah (east end) Routine Monitoring Car Monthly Freshwater S 33 39.4155' E 51 07.2089'
078 NON-ACTIVE Fox Glove Oval. Southern stormwater drain
Gleeson Creek Berowra Stormwater drain (in pool down two levels) Tip leachate monitoring
Car No Freshwater
079 NON-ACTIVE Fox Glove Oval. Northern stormwater drain
Gleeson Creek Berowra Stormwater line (upstream of sewer line) Tip leachate monitoring
Car No Freshwater
080 ACTIVE Glenorie Ck, Glenorie Glenorie Ck > Colah Creek > Marramarra Ck > Berowra Ck > Hawkesbury River
Berowra Creek Upstream of GPT at Tepoka Dr, Glenorie Routine Monitoring Car Monthly Freshwater S 33 35.8789' E 51 00.5957'
081 NON-ACTIVE PLYMPTON ROAD WETLAND, BEECROFT
Lane Cove
Routine Monitoring Car No Freshwater
082 NON-ACTIVE END OF GULLY RD, BEROWRA AT FIRST POND
Joe Crafts Creek Berowra
Routine Monitoring Car No Freshwater
083 NON-ACTIVE
BEROWRA CREEK, DIRECTLY UPSTREAM OF WALLAMEDA WETLAND, UNDER SMALL BRIDGE
Berowra Berowra
Routine Monitoring Car Yes Freshwater
084 NON-ACTIVE LOCATED DOWNSTREAM OF PLYMPTOM ROAD WETLAND
Lane Cove
Routine Monitoring Car Yes Freshwater
085 ACTIVE Hornsby Quarry, Hornsby Old Mans Ck > Waitara Ck > Berowra Ck > Hawkesbury River
Berowra Creek Pumping station just prior to discharge Hornsby Quarry monitoring
Car Monthly Freshwater
086 NON-ACTIVE NEVERFAIL BAY Berowra Estuary Hawkesbury River
routine Monitoring Car No Estuarine
087 NON-ACTIVE Milsons Passage Lower Hawkesbury Estuary Hawkesbury River
routine Monitoring Car No Estuarine
088 ACTIVE SPLIT SAMPLE
QA/QC
Monthly QA/QC
089 NON-ACTIVE Hornsby Quarry upstream of Dam Waitara Creek Berowra
Hornsby Quarry monitoring
Car
090 NON-ACTIVE Crosslands Reserve- Recreational Monitoring Site (DIPNR Site No. 21210040)(1st ramp)
Berowra Estuary Hawkesbury River wade out from 1st ramp (opposite SDA wharf) Recreational monitoring
Car No Estuarine
091 NON-ACTIVE Bobbin Head- Recreational Monitoring Site (DIPNR Site No. 21210006)
Cowan Estuary Hawkesbury River
Recreational monitoring
Car No Estuarine
092 NON-ACTIVE Hornsby Swimming Pool RO treated water
purple tap centre of Hornsby Park Water Reuse Car No Freshwater

112 HORNSBY SHIRE COUNCIL 2014-2015 WATER QUALITY MONITORING PROGRAM ANNUAL REPORT
093 ACTIVE BLANK SAMPLE
QA/QC
Monthly QA/QC
094 ACTIVE Arcadia Tip Calabash Ck > Calabash Bay > Berowra Ck > Hawkesbury River
Berowra Creek Treated water. Dip sample using tube sampler from plastic tank in locked compound
Tip leachate monitoring
Car Quarterly Leachate S 33 36.8554' E 51 03.4746'
095 ACTIVE Foxglove oval- tip leachate upstream of CRR treatment device
Gleeson Creek Berowra sample from tap on large green tank (or concrete sump below tip embankment using tube sampler
Tip leachate monitoring
Car No Tip Leachate
096 ACTIVE Foxglove oval- CRR treatment device outlet tank-sampled at end of reedbed
Gleeson Creek Berowra downstream end of reedbed polishing dam. Sample from flexible pipe in concrete sump
Tip leachate monitoring
Car Yes Tip Leachate
097 NON-ACTIVE Berowra Creek at the Woolwash Berowra Estuary Berowra
algal bloom Boat Yes Estuarine
098 ACTIVE HSC Nursery- Treated Water - purple sample tap near propagation shed
Devlins Creek Lane Cove Sampled at purple tap near propagation shed CRR Device Car No Stormwater
098 NON-ACTIVE HSC Nursery- pump shed - from pump (which pumps up to nursery)
098 NON-ACTIVE HSC Nursery- from port on top of grodan tank
098 NON-ACTIVE HSC Nursery- from port on top of left concrete storage water tank
098 NON-ACTIVE HSC Nursery- from port on top of right concrete storage water tank
099 NON-ACTIVE HSC Nursery- outlet end of open sediment tank
099 NON-ACTIVE HSC Nursery- stormwater collection sump in Parks Depot
099 NON-ACTIVE Crosslands Reserve- Recreational Monitoring Site (2nd boat ramp)
Berowra Estuary Hawkesbury River Wade out from 2nd ramp Recreational monitoring
Car No Estuarine
100 ACTIVE Berowra Creek, Crosslands Reserve Berowra Creek > Hawkesbury River Berowra Creek Drive to end of track (through gate - key required). Sampe off the small beach at the northern end of the reserve
Recreational monitoring
Car Monthly Estuarine S 33 37.5292' E 51 06.8417'
101 NON-ACTIVE Epping pool reverse osmosis unit Devlins Creek Lane Cove Large corrigated water tank, from outlet tap Water Reuse Car No Freshwater
102 NON-ACTIVE Pennant Hills Park Tennis Courts. Downstream of UV treatment
Lane Cove
Stormwater Harvesting
Car No Stormwater
103 ACTIVE Milsons Passage, Hawkesbury River Hawkesbury river Hawkesbury River Mouth of Milsons Passage (Eastern end) Brooklyn STP outfall monitoring
Boat Monthly Estuarine S 33 31.2900' E 51 10.8183'
104 NON-ACTIVE Hawkesbury R (STP monitoring) off Peat Island
Hawkesbury River Middle of Hawkesbury River Channel off Peat Island Brooklyn STP outfall monitoring
Boat Yes Estuarine
105 NON-ACTIVE Hawkesbury R (STP monitoring) under F3 bridge
Hawkesbury River Hawkesbury River Bridge. 2nd pylon from the southern side Brooklyn STP outfall monitoring
Boat Yes Estuarine
106 NON-ACTIVE Hawkesbury R (STP monitoring) entrance to Sandbrook Inlet
Hawkesbury River Sandbrook inlet channel (middle). End of Fenwicks Marina Brooklyn STP outfall monitoring
Boat Yes Estuarine
107 NON-ACTIVE Hawkesbury R (STP monitoring) off Long Island
Hawkesbury River Middle of Hawkesbury River Channel North of Long Island Brooklyn STP outfall monitoring
Boat Yes Estuarine
108 ACTIVE Bradleys Beach, Hawkesbury River Hawkesbury River Hawkesbury River Off Bradley's Beach , Dangar Island Brooklyn STP outfall monitoring
Boat Monthly Estuarine S 33 32.4614' E 51 14.5175'
109 NON-ACTIVE Cherrybrook Lakes inlet Berowra Creek Berowra pool at outlet of stormwater pipe under Kenburn Rd CRR Device Car Yes Stormwater
110 Non-ACTIVE Cherrybrook Lakes outlet Berowra Creek Berowra outlet stream under footbridge CRR Device Car Yes Stormwater
111 Non-ACTIVE
Berowra Ck at Rocky Fall Rapids (freshwater just upstream of tidal influence) - routine and rec monitoring
Berowra Creek Berowra Estuary Walk upstream from Crosslands Reserve about 4 km. Sample freshwater flow around rocks just above tidal influence
Routine Monitoring Car/walk No Freshwater
112 ACTIVE Wisemans Ferry Tip Mill Ck > Hawkesbury River Hawkesbury River open padlocked riser, sample using tube bailer Tip leachate monitoring
Car Quarterly Leachate S 33 24.6230' E 50 58.7910'
113 NON-ACTIVE Dog Pound Ck Larool Creek Berowra walking track x-ing about 200m u/s of Larool Ck junction Diatreme geology seepage
car/walk no Freshwater
114 ACTIVE Muogamarra Ck Muogamarra Ck > Berowra Ck > Hawkesbury River
Berowra Creek walking track at xing about 500m up creek from estuary, or drive Peats Crater fire trail
Possible Reference Site
Car or Boat
Monthly Freshwater S 33 32.5605' E 51 10.2871'
115 ACTIVE Old Mans Ck, Hornsby Old Mans Ck > Waitara Ck > Berowra Ck > Hawkesbury River
Berowra Creek firetrail crossing (on way to Fishponds) Hornsby Quarry monitoring
Car Monthly Freshwater
116 NON-ACTIVE Coba Ck - freshwater - 50m above tidal influence
Berowra Estuary at Coba Bay Berowra 100m u/s of end of Kulpas Track - severe bushbash Possible reference site
walk No Freshwater
117 NON-ACTIVE BYLES CK - 50m u/s of Devlins Ck Devlins Ck Lane Cove walk from end Day/Malton Rd
walk No Freshwater

113 HORNSBY SHIRE COUNCIL 2014-2015 WATER QUALITY MONITORING PROGRAM ANNUAL REPORT
118 NON-ACTIVE Still Ck, 50m above tidal influence Berowra Ck Berowra Drive through Crosslands Convention Centre, walk about 300m up creek, 50m above tidal limit
Reference Site Car/walk No Freshwater
119 NON-ACTIVE The Gully Rd stormwater pipe outlet near Community Centre
Joe Crafts Creek Berowra Measure water flow from pipe into trash rack area Stormwater Harvesting
car No Stormwater
120 ACTIVE Cherrybrook Greenway Park, raw stormwater
Berowra U/G tank outlet (sampling tap) in pump room, just before UV treatment
Stormwater Harvesting
car Yes Stormwater
121 ACTIVE Cherrybrook Greenway Park, UV treated stormwater
Berowra Tank outlet (sampling tap) in pump room. After Jan 2011 sample using 12v pump directly into concrete tank
Stormwater Harvesting
car Yes Stormwater
122 NON-ACTIVE Calabash Ck below Arcadia Tip - about 200m downslope
Berowra Creek Berowra Walk down track from water treatment plant then bushbash to below first creek junction
Tip Leachate Monitoring
car No Freshwater
123 ACTIVE Peats Crater Creek Peats Crater Ck > Berowra Ck > Hawkesbury River
Berowra Creek Walk from estuary about 800m, sample from rocky gully, or drive Peats Crater fire trail
Routine Monitoring Car or Boat
Monthly Freshwater S 33 32.5258' E 51 10.5000'
124 NON-ACTIVE Margaret St Bioretention Basin - Inlet Pipe
Berorwa Ck
CRR Device car
Stormwater
125 NON-ACTIVE Margaret St Bioretention Basin - Outlet Pipe
Berorwa Ck
CRR Device car
Stormwater
126 Non-active Lyne Rd Bioretention Basin - inlet pipe
Lane Cove
CRR Device car
Stormwater
127 Non-active Lyne Rd Bioretention Basin - outlet pipe
Lane Cove
CRR Device car
Stormwater
128 ACTIVE Gully Rd, Berowra
Berowra Ck U/G tank near Gully Rd trash rack; from overflow or 12v pump Stormwater harvesting
Car Monthly Stormwater S 33 37.3403' E 51 09.0546'
129 ACTIVE Berowra Oval Stormwater Harvesting - raw water- from tap at UV inlet
Berowra Ck Sample from pipe inside control room - tap at UV inlet
Stormwater harvesting
Car
Stormwater S 33 37.4033' E 51 08.9394'
130 ACTIVE Berowra Oval Stormwater Harvesting - treated water - from tap at UV outlet
Berowra Ck Sample from pipe inside control room - tap at UV outlet
Stormwater harvesting
Car
Stormwater S 33 37.4033' E 51 08.9394'
131 ACTIVE Berowra Oval, Berowra
Berowra Ck Sample with bailer tube or 12V pump from inspection lid. Since Jan 2011 sample from tap on tank inside control room
Stormwater harvesting
Car Monthly Stormwater S 33 37.4033' E 51 08.9394'
132 ACTIVE Foxglove Oval Stormwater harvesting - treated water from tap on green concrete tank
Berowra Ck
Sample direct from large green tank behind kiosk. Need vandal-proof tap key to sample
Stormwater harvesting
car
Stormwater
133 Non-Active Berowra Creek, Calabash Bay, southern shoreline near houses
Berowra Creek Berowra Ck
Macro-Algal probem
134 ACTIVE Epping Oval Stormwater harvesting - raw water- large underground tank
Lane Cove R Sample from U/G tank using 12v pump Stormwater harvesting
Stormwater
135 ACTIVE Epping Oval Stormwater harvesting - raw water immediately before treatment
Lane Cove R From tap before UV lamps in cntrol room
Stormwater harvesting
Stormwater
136 ACTIVE Epping Oval Stormwater harvesting - treated water immediately after UV
Lane Cove R From tap after UV lamps in control room Stormwater harvesting
Stormwater
137 ACTIVE Epping Oval Stormwater harvesting - treated water - aboveground tank from tap
Lane Cove R Sample from tap on above ground tank near control room
Stormwater harvesting
Stormwater
138 ACTIVE North Epping Stormwater harvesting - raw water - small underground tank
Lane Cove R Sample from U/G tank using 12v pump Stormwater harvesting
Stormwater
139 ACTIVE North Epping Stormwater harvesting - raw water immediately before treatment
Lane Cove R
Stormwater harvesting
Stormwater
140 ACTIVE North Epping Stormwater harvesting - treated water immediately after UV
Lane Cove R
Stormwater harvesting
Stormwater
141 ACTIVE North Epping Stormwater harvesting - treated water - large underground tank
Lane Cove R Sample from U/G tank using 12v pump
Stormwater harvesting
Stormwater
142 ACTIVE Somerville Oval Stormwater harvesting - raw water - underground tank
Lane Cove R Sample from U/G tank using 12v pump
Stormwater harvesting
Stormwater
143 ACTIVE Somerville Oval Stormwater harvesting - raw water - immediately before treatment
Lane Cove R
Stormwater harvesting
Stormwater
144 ACTIVE Somerville Oval Stormwater harvesting - treated water immediately after UV
Lane Cove R
Stormwater harvesting
Stormwater
145 ACTIVE Somerville Oval Stormwater harvesting - treated water large underground tank
Lane Cove R Sample from U/G tank using 12v pump
Stormwater harvesting
Stormwater

114 HORNSBY SHIRE COUNCIL 2014-2015 WATER QUALITY MONITORING PROGRAM ANNUAL REPORT
146 NON-ACTIVE Yatala Ck, Jerusalem Bay - 50m above tidal influence
Cowan Creek Cowan Ck boat up Jerusalem Bay at high tide as far as possible, then walk about 100m to freshwater ck just above camp site
Reference Site
Freshwater
147 ACTIVE Unnamed Ck, Trib Byles Ck, Cheltenham
Trib > Byles Ck > Devlins Ck > Lane Cove River
Lane Cove River walk from Day/Malton Rd Cheltenham, cross Byles Ck, walk 20m to small side ck
Reference Site Car Monthly Freshwater S 33 45.0571' E 51 05.0585'
148 NON-ACTIVE Hornsby Park - stormwater outlet behind public toilets
Berowra Berowra Ck
Stormwater
149 ACTIVE Marramarra Ck, Duckpond Ridge, Marramarra NP
Marramarra Ck > Berowra Ck Berowra Creek drive down to end of DuckPond Ridge firetrail, bushbash ~50m to creek, sample upstream of deep pool filled with strapweed
Reference Site Car Monthly Freshwater S 33 31.4042' E 51 03.8339'
150 ACTIVE Gunyah Point, Hawkesbury River Hawkesbury River Hawkesbury River next to Council's moored probe water monitoring algal bloom, salinity Boat
Every 3 weeks through warm months - Every 4 weeks through cool months
Estuarine S 33 34.1093' E 51 14.4472'
151 ACTIVE West Bar Island, Marramarra Creek Hawkesbury River Hawkesbury River next to Council's moored probe water monitoring algal bloom, salinity Boat
Every 3 weeks through warm months - Every 4 weeks through cool months
Estuarine S 33 31.7456' E 51 08.6210'
152 ACTIVE Courangra Point, Hawkesbury River Hawkesbury River Hawkesbury River next to Council's moored probe water monitoring algal bloom, salinity Boat
Every 3 weeks through warm months - Every 4 weeks through cool months
Estuarine S 33 28.3520' E 51 08.0019'
153 ACTIVE Laughtondale, Hawkesbury River Hawkesbury River Hawkesbury River next to Council's moored probe water monitoring algal bloom, salinity Boat
Every 3 weeks through warm months - Every 4 weeks through cool months
Estuarine S 33 24.1518' E 51 01.0429'
154 NON-ACTIVE Calabash Ck - freshwater - 50m above tidal influence
Berowra Ck Berowra
Reference Site Boat
Freshwater
155 NON-ACTIVE Banks Ck - freshwater- 50m above tidal influence
Berowra Ck Berowra
Reference Site Boat
Freshwater
156 NON-ACTIVE Dennys Ck - freshwater- 50m above tidal influence
Berowra Ck Berowra boat up Donnybrook Bay into Denny Ck at high tide, motor as far as possible, walk ~50m to freshwater
Reference Site Boat
Freshwater
157 NON-ACTIVE "Deep Bay" Ck - freshwater- 50m above tidal influence
Berowra Ck Berowra Boat up Deep Bay, walk/climb up creek line about 50-80m and sample in pools
Reference Site Boat
Freshwater
158 Non-ACTIVE Marramarra Ck (fresh) about 200m upstream of tidal limit
Berowra Ck Berowra Boat up Marramarra ck on high tide up to tidal limit. Walk 200m to large pool
Boat
Freshwater
159 NON-ACTIVE Marramarra Ck about 200m u/s of junction with Duckpond Ridge Ck
Berowra Ck Berowra Drive to bottom end of DuckPond Ridge firetrail. Bushbash to Marrmarra Ck (~500m) sample at bottom end of big pool
Car
Freshwater
160 NON-ACTIVE Unnamed Ck flowing from saddle near Joes Mountain towards Fishponds
Berowra Ck Berowra Drive on firetrail from Rosemead Rd towards Fishponds. Walk towards Fishponds alone GN Walk, and sample ck at small wooden bridge
Reference Site Car/Walk
Freshwater
161 NON-ACTIVE Canoelands Ck just above tidal limit Berowra Ck Berowra Boat up side creek from Marramarra Ck (just d/s from Smugglers ck), walk about 50m upstream to freshwater
Reference Site Boat
Freshwater
162 NON-ACTIVE McCarrs Ck near McCarrs Ck Road Bridge
Pittwater
Drive and walk up firetrail about 100m Reference Site Car
Freshwater
163 NON-ACTIVE Unnamed Ck - draining from Barkala Cres Westleigh at GNWalk crossing
Berowra Ck Berowra Drive down firetrail from Barwood Close, walk towards Site 4 along GNW
Car/walk
Freshwater
164 ACTIVE Unnamed Ck, Djara Crossing Djarra Crossing > Joe Crafts Bay > Berowra Ck
Berowra Creek Drive down firetrail from Glendale Rd to Djara Crossing Reference Site Car Monthly Freshwater S 33 34.8686' E 51 08.9941'
165 NON-ACTIVE Duneba/Apanie Bioretention Basin - inlet pipe
Berowra Ck Berowra Large stainless steel pipe flowing under Duneba Drive into bioretention basin
CRR Device Car
Stormwater
166 Active Duneba/Apanie Bioretention Basin - overflow of rock wall at weir
Water flowing from large stainless steel pipe - entering into the upper sediment basin above the rock wall and bioretention basin
CRR Device
167 Active Duneba/Apanie Bioretention Basin - outlet pipe
Berowra Ck Berowra Concrete pipe with sandbed underflow outlet from bioretention basin
CRR Device Car
Stormwater
168
Stewart St Nornsby Bioretention basin- outlet pipe
Berowra Ck Berowra Concrete pipe outlet- sandbed underdrain outlet from bioretention basin
CRR Device Car
Stormwater
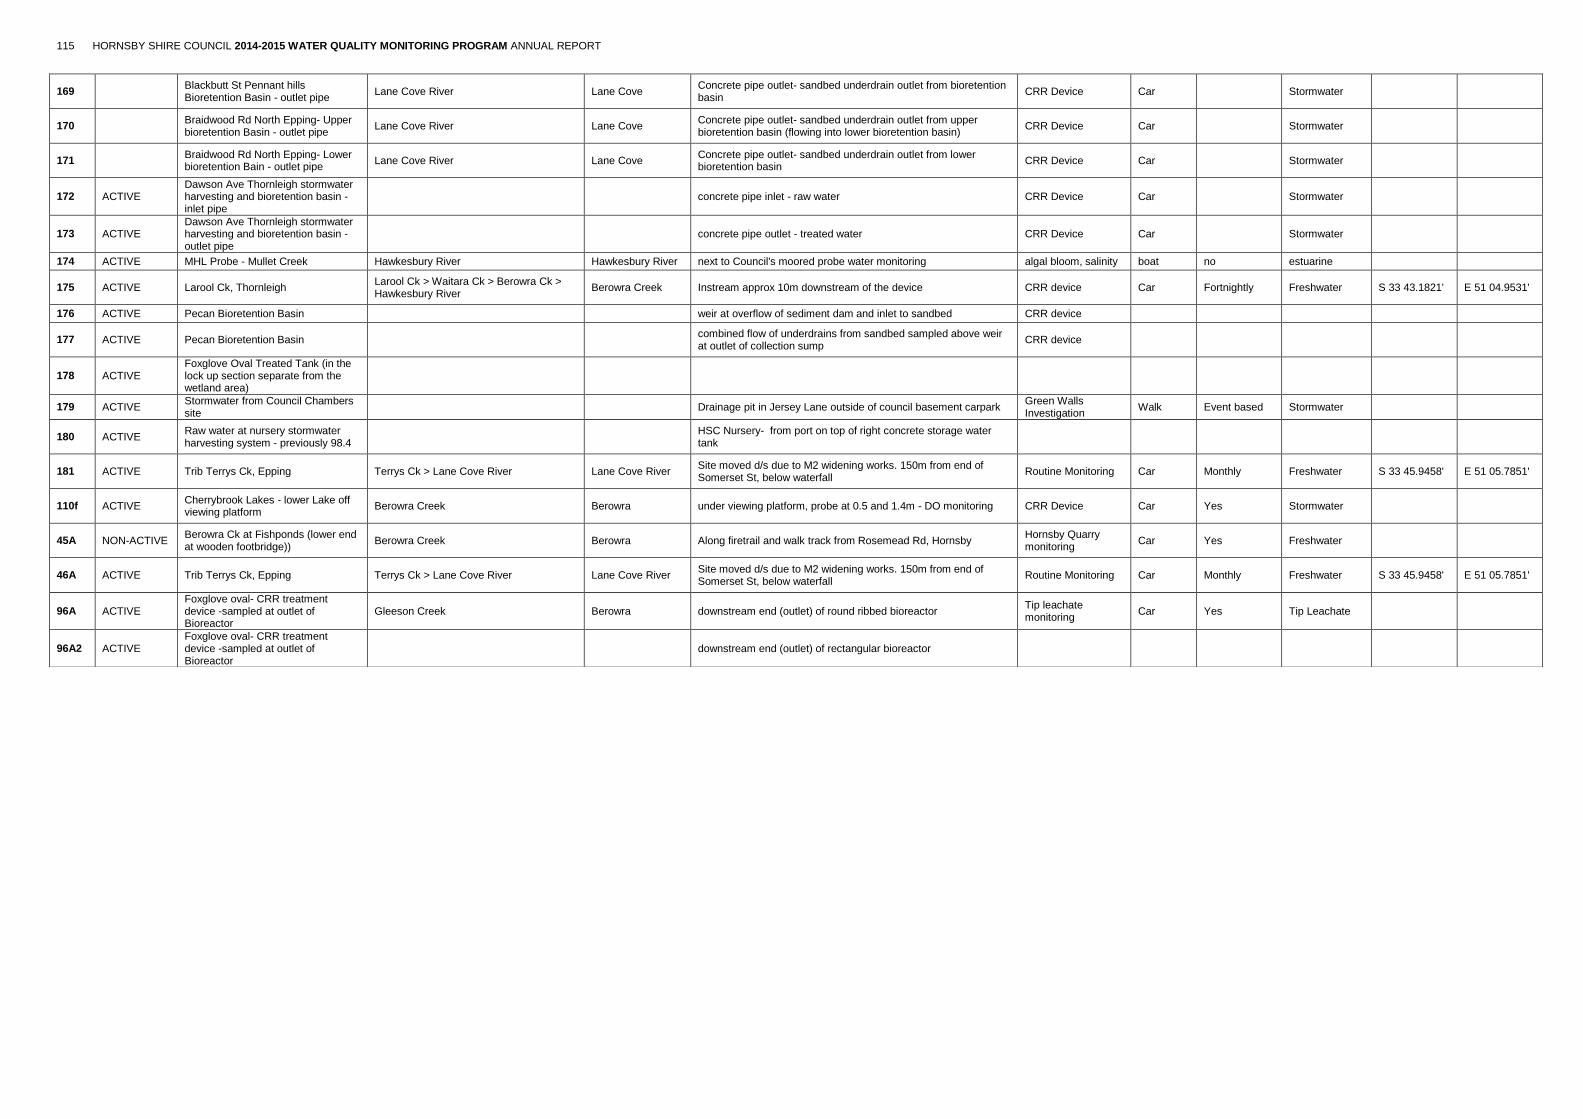
115 HORNSBY SHIRE COUNCIL 2014-2015 WATER QUALITY MONITORING PROGRAM ANNUAL REPORT
169
Blackbutt St Pennant hills Bioretention Basin - outlet pipe
Lane Cove River Lane Cove Concrete pipe outlet- sandbed underdrain outlet from bioretention basin
CRR Device Car
Stormwater
170
Braidwood Rd North Epping- Upper bioretention Basin - outlet pipe
Lane Cove River Lane Cove Concrete pipe outlet- sandbed underdrain outlet from upper bioretention basin (flowing into lower bioretention basin)
CRR Device Car
Stormwater
171
Braidwood Rd North Epping- Lower bioretention Bain - outlet pipe
Lane Cove River Lane Cove Concrete pipe outlet- sandbed underdrain outlet from lower bioretention basin
CRR Device Car
Stormwater
172 ACTIVE Dawson Ave Thornleigh stormwater harvesting and bioretention basin - inlet pipe
concrete pipe inlet - raw water CRR Device Car
Stormwater
173 ACTIVE Dawson Ave Thornleigh stormwater harvesting and bioretention basin - outlet pipe
concrete pipe outlet - treated water CRR Device Car
Stormwater
174 ACTIVE MHL Probe - Mullet Creek Hawkesbury River Hawkesbury River next to Council's moored probe water monitoring algal bloom, salinity boat no estuarine
175 ACTIVE Larool Ck, Thornleigh Larool Ck > Waitara Ck > Berowra Ck > Hawkesbury River
Berowra Creek Instream approx 10m downstream of the device CRR device Car Fortnightly Freshwater S 33 43.1821' E 51 04.9531'
176 ACTIVE Pecan Bioretention Basin
weir at overflow of sediment dam and inlet to sandbed CRR device
177 ACTIVE Pecan Bioretention Basin
combined flow of underdrains from sandbed sampled above weir at outlet of collection sump
CRR device
178 ACTIVE Foxglove Oval Treated Tank (in the lock up section separate from the wetland area)
179 ACTIVE Stormwater from Council Chambers site
Drainage pit in Jersey Lane outside of council basement carpark Green Walls Investigation
Walk Event based Stormwater
180 ACTIVE Raw water at nursery stormwater harvesting system - previously 98.4
HSC Nursery- from port on top of right concrete storage water tank
181 ACTIVE Trib Terrys Ck, Epping Terrys Ck > Lane Cove River Lane Cove River Site moved d/s due to M2 widening works. 150m from end of Somerset St, below waterfall
Routine Monitoring Car Monthly Freshwater S 33 45.9458' E 51 05.7851'
110f ACTIVE Cherrybrook Lakes - lower Lake off viewing platform
Berowra Creek Berowra under viewing platform, probe at 0.5 and 1.4m - DO monitoring CRR Device Car Yes Stormwater
45A NON-ACTIVE Berowra Ck at Fishponds (lower end at wooden footbridge))
Berowra Creek Berowra Along firetrail and walk track from Rosemead Rd, Hornsby Hornsby Quarry monitoring
Car Yes Freshwater
46A ACTIVE Trib Terrys Ck, Epping Terrys Ck > Lane Cove River Lane Cove River Site moved d/s due to M2 widening works. 150m from end of Somerset St, below waterfall
Routine Monitoring Car Monthly Freshwater S 33 45.9458' E 51 05.7851'
96A ACTIVE Foxglove oval- CRR treatment device -sampled at outlet of Bioreactor
Gleeson Creek Berowra downstream end (outlet) of round ribbed bioreactor Tip leachate monitoring
Car Yes Tip Leachate
96A2 ACTIVE Foxglove oval- CRR treatment device -sampled at outlet of Bioreactor
downstream end (outlet) of rectangular bioreactor

116 HORNSBY SHIRE COUNCIL 2014-2015 WATER QUALITY MONITORING PROGRAM ANNUAL REPORT