counterparty risk cva - operations...
TRANSCRIPT

Counterparty Risk
CVAEduardo Canabarro
Global Head of Risk Analytics
Morgan Stanley, New York
22
Disclaimer
This presentation containsstatements and views ofthe author only.
It is not intended torepresent the views ofMorgan Stanley.

33
Introduction
OTC derivatives are efficient and effective tools to transfer financialrisks between market participants
As a byproduct of such transfer, they create credit risk between thecounterparties
They also increase the connectedness of the financial system Banks have built sophisticated frameworks to manage their
counterparty credit risks Typically, a large bank has many thousands of counterparties,
trillions of dollars of derivatives’ notional and billions of dollars ofcredit exposures to their counterparties
In this presentation we’ll cover counterparty risk pricing (aka CVA),hedging, stress testing, capital, and CCPs
44
Counterparty exposures: bilateral and market-driven
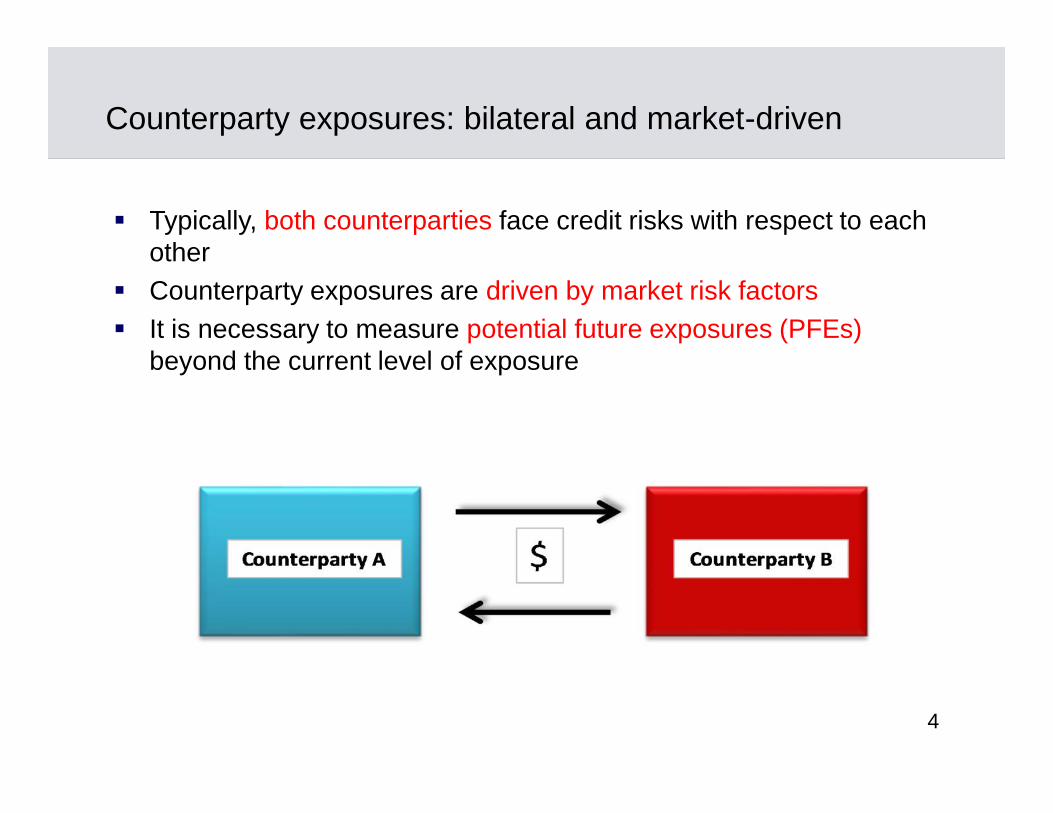
Typically, both counterparties face credit risks with respect to eachother
Counterparty exposures are driven by market risk factors It is necessary to measure potential future exposures (PFEs)
beyond the current level of exposure

55
Simulation of PFEs
Banks use Monte Carlo methods to simulate the future values of theportfolio of derivatives with a counterparty
66
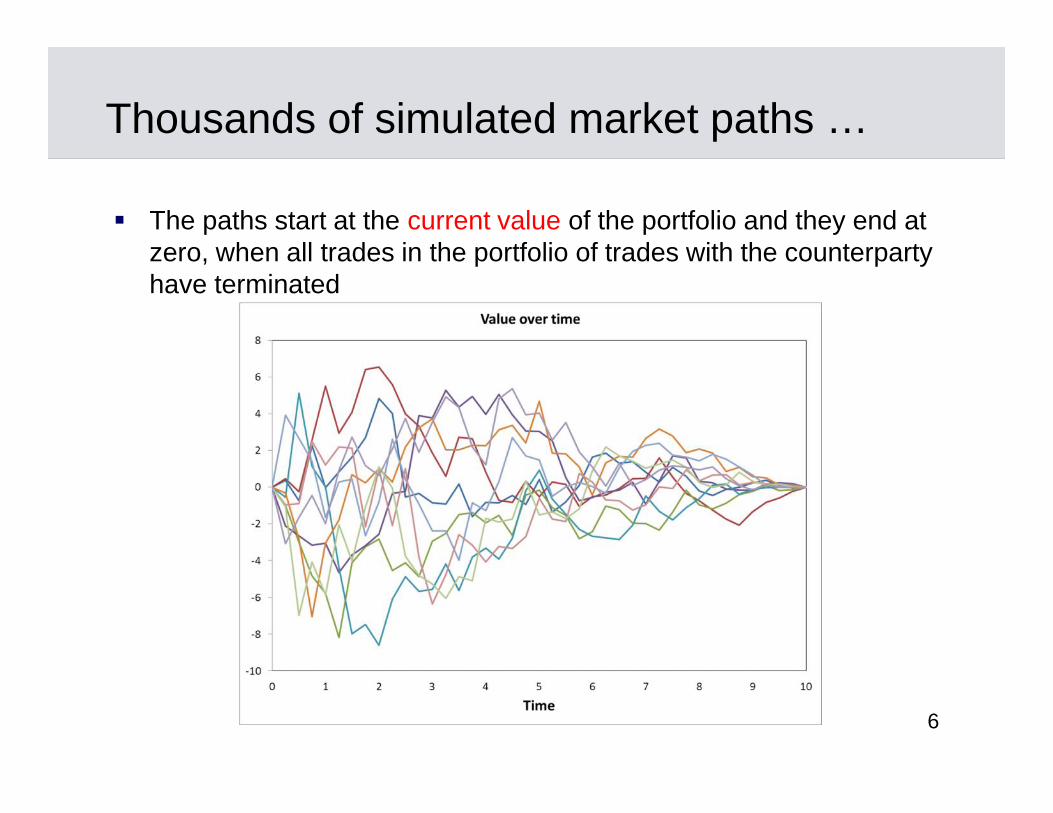
Thousands of simulated market paths …
The paths start at the current value of the portfolio and they end atzero, when all trades in the portfolio of trades with the counterpartyhave terminated

77
EPE and ENE
For each point in time on asimulated market path, wecalculate the exposure as themax(value of the portfolio, 0)
Expected Positive Exposure(EPE) is our averageexposure to the counterparty,across all paths, at each pointin time
Expected Negative Exposure(ENE) is the equivalent ofEPE, from the perspective ofour counterparty

88
EPE and ENE
The EPE and ENE profiles are central to the calculation of CVAs In sophisticated CVA models those profiles are calculated
conditional on the credit spreads of each counterparty

99
Credit Valuation Adjustment (CVA)
Bank A has a portfolio of OTC derivatives withCounterparty B
CVA is the adjustment to the risk-free value of theportfolio of OTC derivatives between A and B to reflectthe market value of the bilateral counterparty credit risksfaced them
Eduardo Canabarro and Darrell Duffie, Counterparty Risk: Measurement andPricing, 2003.http://www.darrellduffie.com/uploads/surveys/DuffieCanabarro2004.pdf
1010
Economic intuition
If Bank A faces more credit risk than its Counterparty B,the CVA is negative, i.e. it reduces the value of the OTCderivatives from the perspective of Bank A
If Bank A faces less credit risk than Counterparty B, theCVA is positive, i.e. it increases the value of thederivatives from the perspective of Bank A

1111
CVA is part of the valuation of derivatives
CVA is an integral component of the value of derivatives
Ideally, CVA should be part of each trade’s valuationmodel
The reason it is calculated separately is that there areportfolio effects that transcend the valuation of eachtrade (e.g. netting and margin agreements)
CVA can be attributed to each trade on a marginalcontribution basis
1212
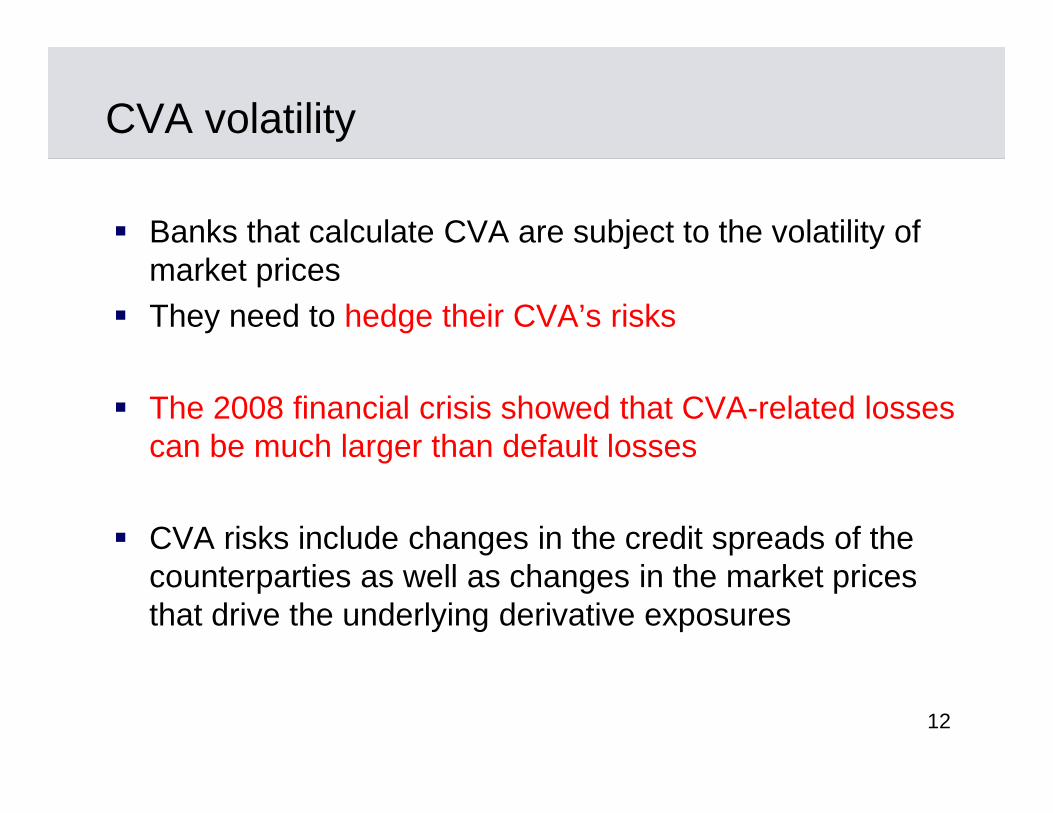
CVA volatility
Banks that calculate CVA are subject to the volatility ofmarket prices
They need to hedge their CVA’s risks
The 2008 financial crisis showed that CVA-related lossescan be much larger than default losses
CVA risks include changes in the credit spreads of thecounterparties as well as changes in the market pricesthat drive the underlying derivative exposures

1313
CVA risk management
The technology to mark to market and hedge CVA hasevolved over the last 20+ years
Investment banks started pricing and hedging CVAaround 1990 Litzenberger, R., Swaps: Plain and Fanciful, Journal of Finance, vol.47, pages
831-850, 1992. Sorensen, E., and T. Bollier, Pricing Swap Default Risk, Financial Analysts
Journal, 50, pp. 23-33, May-June 1994. Duffie, D. and M. Huang, Swap Rates and Credit Quality, Journal of Finance, v.
51, pp. 921-949, 1996
More recently, many more banks are pricing and activelyhedging their CVAs

1414
CVA calculation
In concise notation:
BBAA sEsECVA
EA is the present-valued expected exposure faced by counterparty Bwith respect to Bank A;
sA is the market loss rate (i.e. the product of risk-neutral PD and riskneutral LGD) of A
EB is the present-valued expected exposure faced by A with respectto B;
sB is the market loss rate of B.
1515
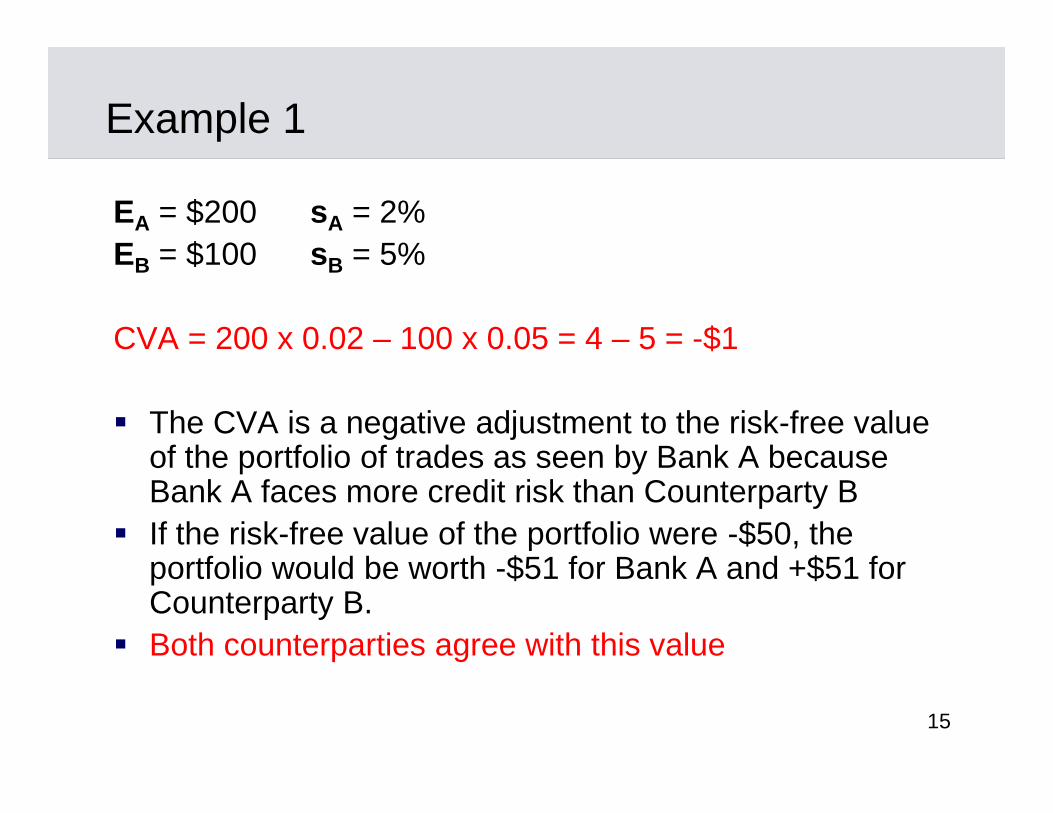
Example 1
EA = $200 sA = 2%EB = $100 sB = 5%
CVA = 200 x 0.02 – 100 x 0.05 = 4 – 5 = -$1
The CVA is a negative adjustment to the risk-free valueof the portfolio of trades as seen by Bank A becauseBank A faces more credit risk than Counterparty B
If the risk-free value of the portfolio were -$50, theportfolio would be worth -$51 for Bank A and +$51 forCounterparty B.
Both counterparties agree with this value

1616
Example 2
Now, suppose that Bank A exits the portfolio of tradeswith Counterparty B by transferring it to Bank C
C has sC = 5% and from C’s perspective:CVA = 200 x 0.05 – 100 x 0.05 = 10 – 5 = +$5
To effect the transfer, A pays +$51 to C C is a worse counterparty than A and it has to pay $6 to
B in order to compensate B for the drop in the value ofthe portfolio of trades from $51 to $45
All three parties break even and they agree with thetransactions
1717
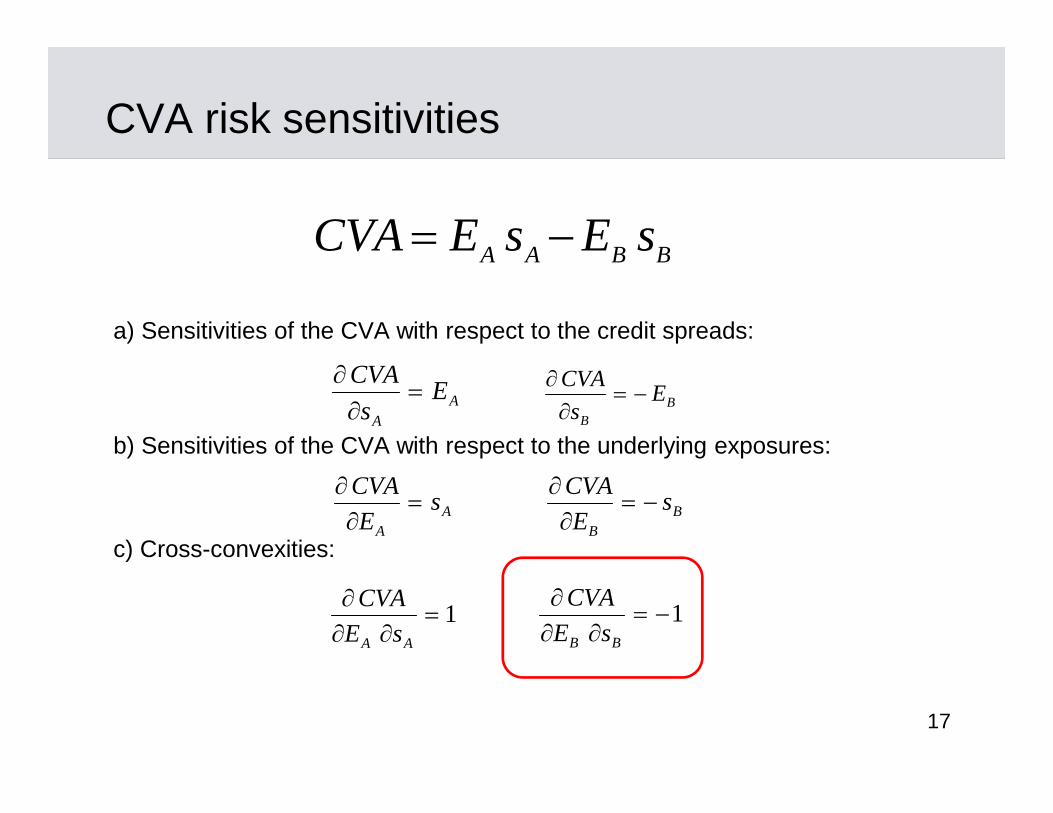
CVA risk sensitivities
a) Sensitivities of the CVA with respect to the credit spreads:
b) Sensitivities of the CVA with respect to the underlying exposures:
c) Cross-convexities:
AA
Es
CVA
BB
Es
CVA
AA
sE
CVA
BB
sE
CVA
1
AA sE
CVA1
BB sE
CVA
BBAA sEsECVA
1818
Should banks hedge their CVA?
If the bank marks to market its CVA and the bank doesnot hedge it, it will experience P&L (and earnings)variability
Importantly, in a trending and deteriorating credit marketenvironment, the bank could suffer substantialcumulative CVA losses
In the 2008 crisis, some banks lost many billions ofdollars in CVAs. This was particularly the case of banksthat did not actively hedge their CVAs

1919
CVA hedging: challenges
The hedges of the CVA include hedges of the marketrisk factors that drive the underlying exposures andhedges of the credit spreads of the counterparties
There are important cross-gammas which can be ofsubstantial size when the changes in spreads andexposures are large
During the 2008 crisis, due to the large size of the CVAsand the high volatility of markets (i.e. large ΔE and Δs),the cross-gammas created difficulties for CVA desks thatwere dynamically hedging the CVAs
Eduardo Canabarro, Pricing and Hedging Counterparty Risk: Lessons Re-Learned?, Chapter 6 in Canabarro E., editor, Counterparty Credit Risk, RiskBooks, 2010

2020
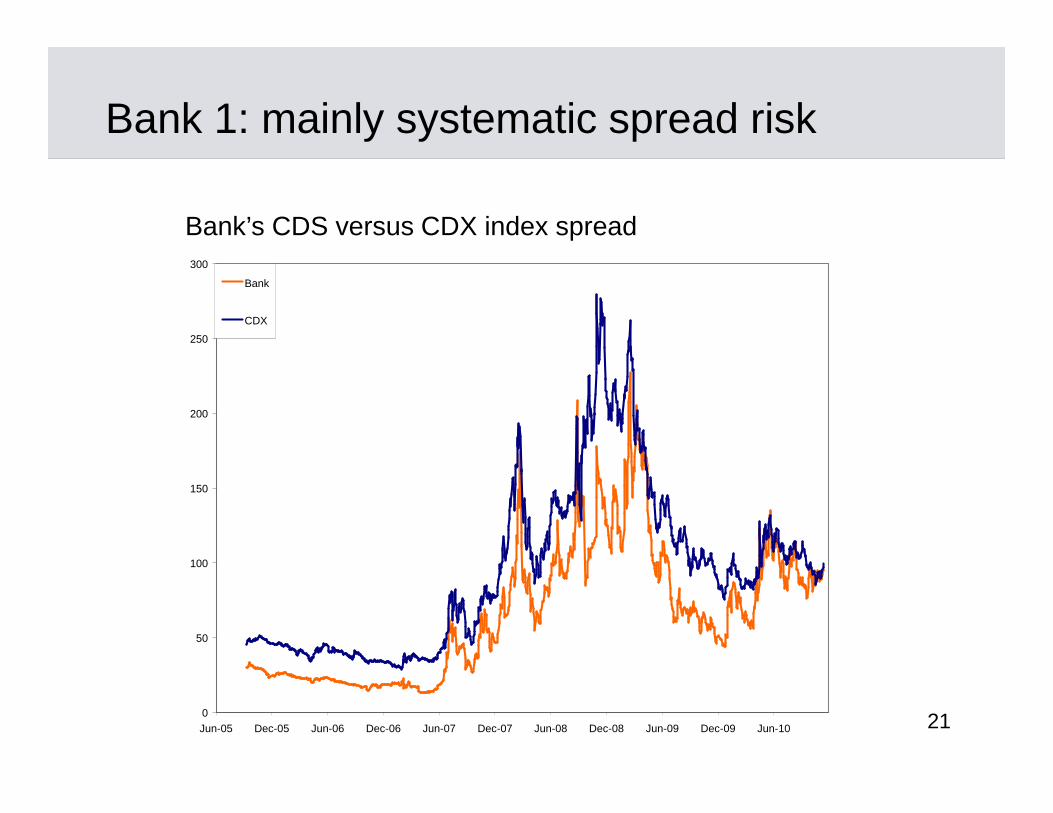
Should banks hedge their own spread?
ΔCVA / ΔEA = sAΔCVA / ΔsA = EAΔ2CVA / (ΔEA ΔsA ) = 1
Changes in the exposure EA can be hedged by takingpositions on the market risk factors that drive theexposure
Changes in Bank A’s own loss rate sA are morechallenging to hedge. The systematic risk componentcan be hedged. The bank-specific, idiosyncratic riskcomponent is more difficult to hedge
By hedging the systematic component of their own creditrisk, banks can realize the value of the liability CVA
2121
Bank 1: mainly systematic spread risk
0
50
100
150
200
250
300
Jun-05 Dec-05 Jun-06 Dec-06 Jun-07 Dec-07 Jun-08 Dec-08 Jun-09 Dec-09 Jun-10
Bank
CDX
Bank’s CDS versus CDX index spread

2222
Bank 2: some idiosyncratic spread risk
0
100
200
300
400
500
600
700
Jun-05 Dec-05 Jun-06 Dec-06 Jun-07 Dec-07 Jun-08 Dec-08 Jun-09 Dec-09 Jun-10
Bank
CDX
Bank’s CDS versus CDX index spread
2323
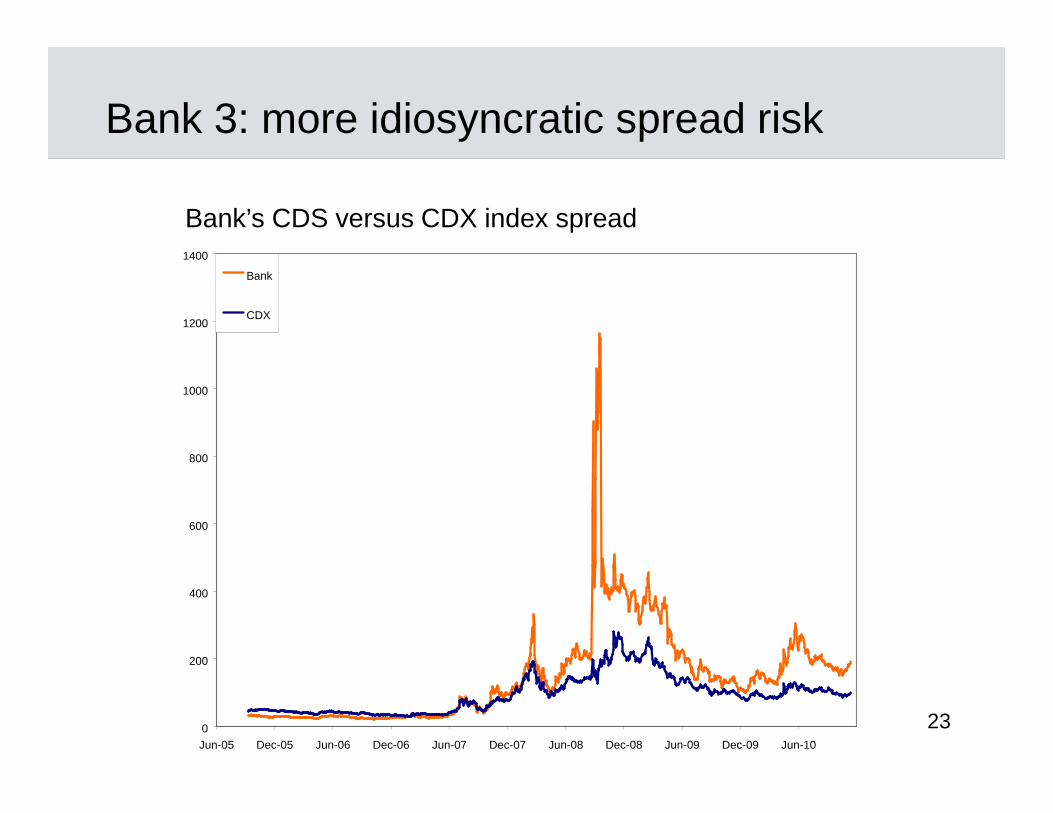
Bank 3: more idiosyncratic spread risk
0
200
400
600
800
1000
1200
1400
Jun-05 Dec-05 Jun-06 Dec-06 Jun-07 Dec-07 Jun-08 Dec-08 Jun-09 Dec-09 Jun-10
Bank
CDX
Bank’s CDS versus CDX index spread

2424
CVA desks
Some banks have opted for a central CVA desk Others have opted for various CVA desks deployed
within their main derivatives units CVA desks provide counterparty credit risk protection to
the derivatives trading desks They manage the risks of the CVA on an ongoing basis They are subject to market and credit risk limits and
usually do not have a revenue budget

2525
CVA risks
There are important risksthat often fall outside ofthe scope of the riskmeasurementframeworks: wrong way out of the money replacement costs dynamic hedging
“It is not what we know, butwhat we do not know whichwe must always address, toavoid major failures,catastrophes and panics.”Richard Feynman, physicist
2626
Wrong-way risks
There are wrong-risks that are specific to CVA hedging.Example: crowded counterparty risks
When a counterparty has entered into similar and largeOTC derivatives trades with many banks, the dynamichedging programs of the banks will create wrong-wayrisk
Usually, those wrong way risks do not show up untilcredit spreads and/or exposure have grown to somelarge levels
During the 2008 crisis this occurred with respect tomonoline insurers as well as other concentratedcounterparty exposures

2727
Wrong-way risks
The CVA wrong way risks are dynamic That is, they are a feature of dynamic hedging strategies They are different from the wrong way risks as usually
defined in the Banking Book context They can be large, i.e. non-local, if there is illiquidity in
exposure or credit spread hedges

2828
Out-of-the-money risks
Potential exposure models used for CVA calculation arenot good predictors of massive market dislocations
CVA traders need to be cautious in the pricing andhedging of out-the-money counterparty exposures
The ability to hedge those exposures in the future, asthey grow, needs to be assessed prudently consideringthe overall liquidity of the market
The profitability of such trades needs to be evaluatedconsidering the potential CVA risks and dynamichedging costs

2929
Replacement costs
Potential future exposure and CVA models account forthe benefits of collateral in the calculation of counterpartyexposures
The models measure the residual exposures after theconsideration of collateral
Banks should not underestimate the all-in costs ofreplacing trades with a defaulted counterparty
Especially when that counterparty is a large marketparticipant and its default can impair the liquidity andincrease the volatility of the markets where thederivatives trade (e.g. Lehman)

3030
Dynamic hedging costs
The risk management of CVAs requires dynamic re-balancing of the hedges
When the counterparty exposures and the credit spreadsof the counterparties are large and volatile, therebalancing requirements can be intense and costly
The high cost is due to illiquidity, wide bid-ask spreadsand overall market impact of the hedging program,especially when in crowded risk situations
Dynamic hedging costs are usually not explicitlycaptured in the CVA pricing models but they can be themost relevant cost component of large, concentratedCVA risks

3131
Simulation of dynamic hedging costs
We can use Monte Carlo simulation models to assessthe size of the costs of replication over the life of theCVA hedging program
The models incorporate the market frictions and providea realistic description of the probability distribution ofpotential CVA hedging costs
During the 2008 crisis, the costs of CVA hedging provedto be quite material in some cases
Eduardo Canabarro, Dynamic Hedging Costs of CVA, in Canabarro E.and M. Pykhtin, editors, Counterparty Credit Risk, Risk Books,forthcoming 2014.

3232
CVA Stress tests
Stress testing is a fundamental component of a soundCVA risk management program
The fundamental goals of the stress test frameworkshould be:- Identification of concentrations of market and credit
risks- Identification of out-of-the-money exposures- Identification of wrong-way risks- Identification of potentially large dynamic hedging
costs of CVA

3333
Basel 3 defines CVA using the Basel 2 IMM EE profiles.The market risk of CVA is then measured by the bank’sVaR model
Capital on CVA: advanced approach
IMM exposures for risk sensitivities VaR for credit spread risk Only spread risk; no exposure risk Single name and index hedges VaR and stressed VaR, times 3 Need IMM + VaR model approvals
3434
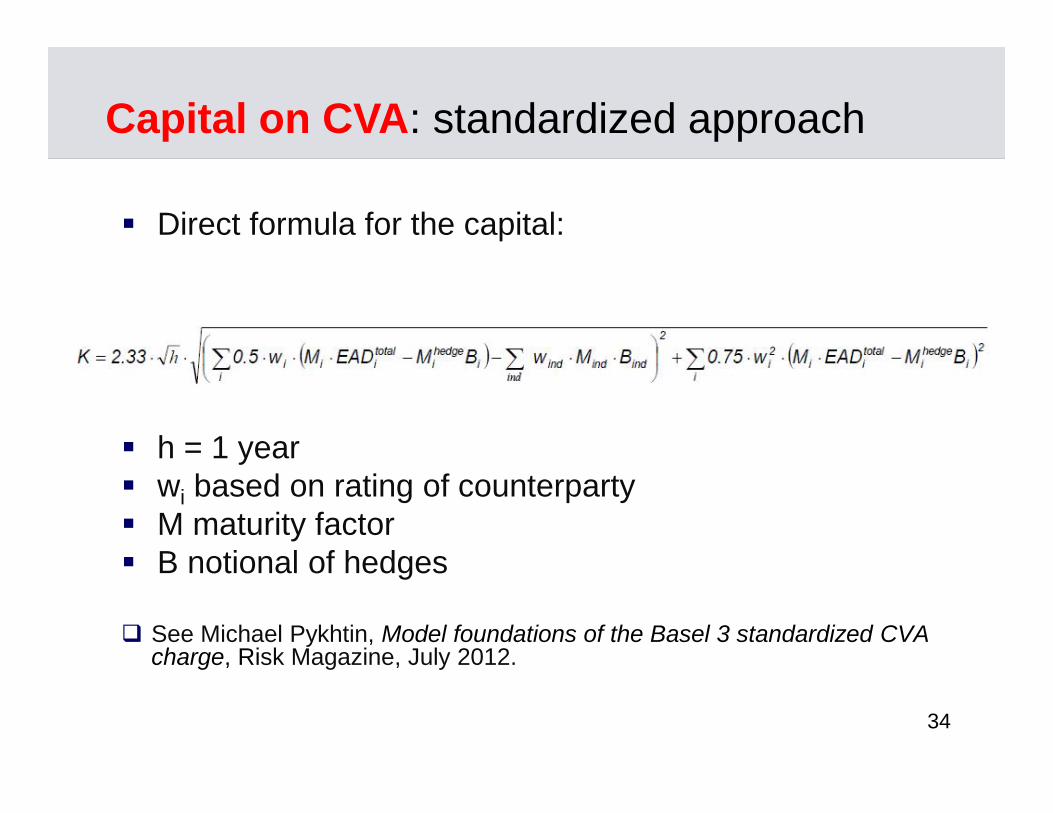
Capital on CVA: standardized approach
h = 1 year wi based on rating of counterparty M maturity factor B notional of hedges
See Michael Pykhtin, Model foundations of the Basel 3 standardized CVAcharge, Risk Magazine, July 2012.
Direct formula for the capital:

3535
Computational effort
Data Sourcing
Typically 2-10M trades, 2-10k netting sets and margin
agreements, market data
Trade Pricing
Typically 2-10M trades,over 1-2k paths at each of
100 dates
Simulation of Markets
Typically 1-2k paths of 2-5krisk factors over 100 future
dates per path
Exposure and CVAcalculations
Typically 10k nettingnodes
Back of envelope numbers: 2M trades x 2k paths x 100 dates/path = 400B pricings 400B pricings x 0.00001 sec/pricing = 400k secs = 111 CPU hours
This is just for one calculation … we need many more calculations toobtain CVA risk sensitivities.

3636
CVA systems
CVA systems are complex and computationallydemanding
Banks with large OTC derivatives franchises haveinvested large resources to build up these systems overthe last 10-15 years

3737
CVA systems
It is important to engineer the CVA system and modelsfor computational efficiency and speed
Various techniques have evolved to enable fastcalculations
Data storage strategies for trade and netting set dataand parallel processing are key elements

3838
The banks that implemented the most successful CVAsystems were the ones that pursued:
– Modularization– Parallel processing capability– Scalability– Pragmatic analytics
“… as simple as possible; but not simpler.”- Einstein
CVA systems

3939
Central Counterparties (CCPs)
Clearing Members (CMs)face a CPP instead offacing each other directly
Multilateral netting, marginrequirements, capitalbuffers, and highoperational standardsreduce the connectednessof the financial system
There will be trades leftoutside of the CCPs

4040
CCPs are critical components of the global financial andpayments systems
They are vital to financial stability They enable multilateral netting and collateralization They promote transparence and standardization of
trades They provide capital buffers to absorb counterparty
default losses They reduce connectedness and systemic risk
CCPs – favorable aspects
4141
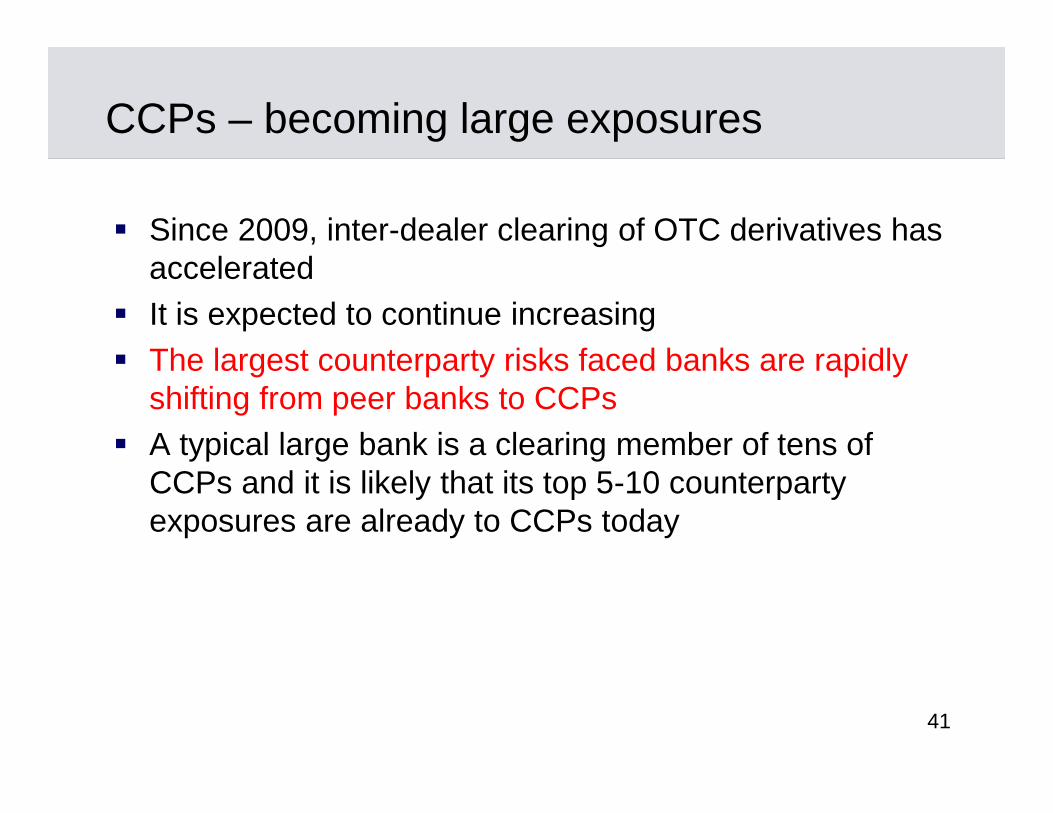
Since 2009, inter-dealer clearing of OTC derivatives hasaccelerated
It is expected to continue increasing The largest counterparty risks faced banks are rapidly
shifting from peer banks to CCPs A typical large bank is a clearing member of tens of
CCPs and it is likely that its top 5-10 counterpartyexposures are already to CCPs today
CCPs – becoming large exposures

4242
Basel 2 did not charge regulatory capital on CCPs Basel 3 charges capital on exposures to CCPs: about
20% EAD, IMM based
Initial margin for OTC is typically at 95-99% confidencelevel, 5-day market move
Margin may also consider liquidity characteristics, riskconcentration and product-specific features
CCPs – capital and margin

4343
Defaulting CM margin Defaulting CM’s guarantee fund CCP’s equity capital (small) Guarantee funds of non-defaulting CMs Additional calls for capital on non-defaulting CMs
(unlimited liability)
CCPs – loss waterfall
4444
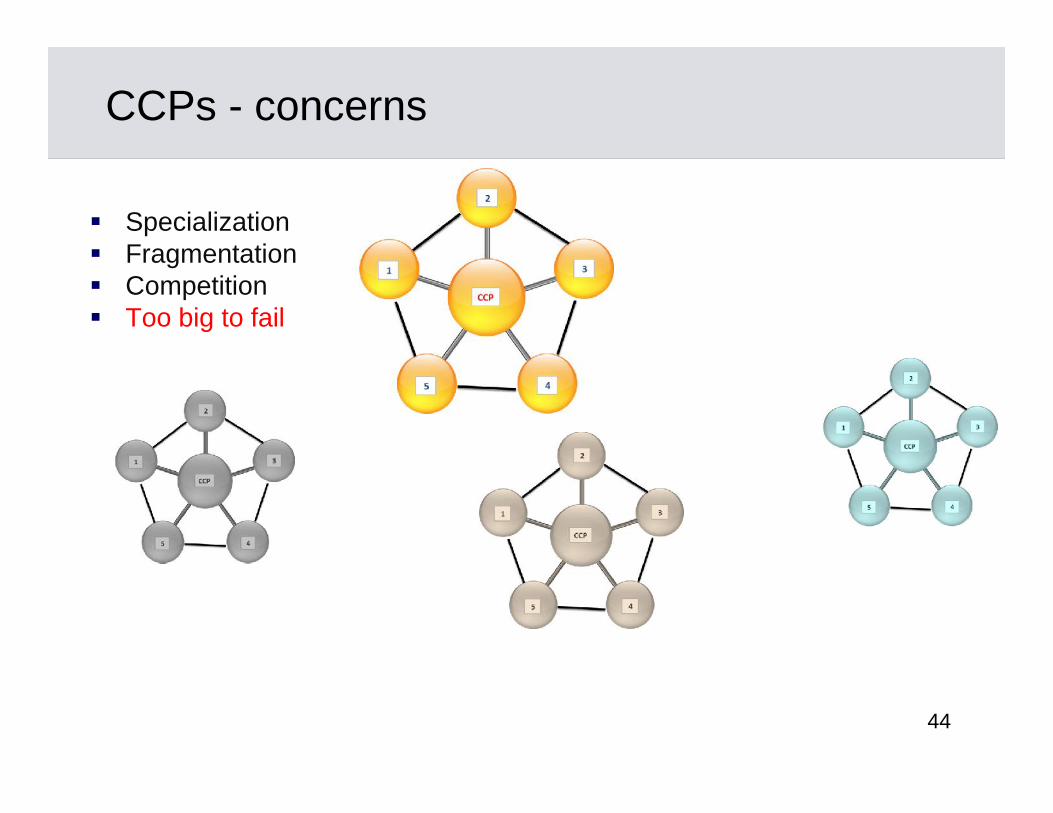
CCPs - concerns
Specialization Fragmentation Competition Too big to fail

This book describes the methods and practices used to manage OTCderivative counterparty risk and the performance of those methodsduring the 2008 financial crisis. It covers topics in counterparty riskmeasurement, CVA, CVA hedging, credit derivatives, collateralization,stress testing, back testing and integration of counterparty credit riskinto economic capital frameworks. Experiences and new ideas onmodels are discussed by a group of world-class experts. The contentof the book is particularly relevant in light of the Basel 3 rules on theregulatory capital on counterparty risks. The book contains a wealth ofinsights that can be useful for practitioners, regulators, consultants,accountants, lawmakers, auditors and researchers to understand thesubstantive, and often technical, issues related to counterparty riskmanagement.
Chapters by: Aaron Brown • Eduardo Canabarro • Guanghua Cao •Patrick Chen • Eduardo Epperlein • Jon Gregory • Andrew Hollings •Gregory Hopper • Sean Hrabak • Phillip Koop • Darren Measures •Shankar Mukherjee • Evan Picoult • Michael Pykhtin • Dan Rosen •David Rowe • David Saunders • Alan Smillie • Svein Stokke • Yi Tang •Lauren Teigland-Hunt • Dan Travers • Katsuichiro Uchiyama • AndrewWilliams • Wei Zhu
Counterparty Credit RiskMeasurement, Pricing and Hedging
Edited by Eduardo Canabarro
Online: riskbooks.com/counterparty-credit-risk-2ISBN: 978-1-906348-34-2