counting carbon - rethink plastic
TRANSCRIPT

COUNTING
CARBONA LIFECYCLE ASSESSMENT GUIDE
FOR PLASTIC FUELS
CO2
CO2
CO2
CO2
SUMMARY• Converting fossil plastics to fuels is sometimes marketed as a part of the solution to
the environmental and waste problems the plastic industry is currently facing.
These fuels are produced by converting plastics back to their original form, fossil
fuels (plastic refining). They are ultimately burnt and the fossil carbon is released to
the atmosphere, exacerbating climate change.
• Some proponents have claimed that plastic fuels could be labelled as low-carbon,
effectively using plastic production as a stepping stone to greenwash CO2 coming
from fossil oil and gas. Proponents of plastic fuels have tried to achieve this by
labelling the input as waste, therefore simply ignoring that fossil carbon in their
greenhouse gas (GHG) calculations.
• Favourable accounting, using selective life cycle assessment (LCA) (with narrow
boundaries such as cradle-to-gate or gate-to-gate), allows for the CO2 emissions
from the burning of plastics to be lost, giving the false impression that almost no
GHGs will be emitted to the atmosphere.
• By promoting plastic fuels through various channels, the oil, gas and petrochemical
industries can continue extracting and releasing fossil carbon into the atmosphere
without any economic or political consequences. Partial LCAs and mislabelling of
inputs for plastic fuels play into such narratives since they omit over 90% of the
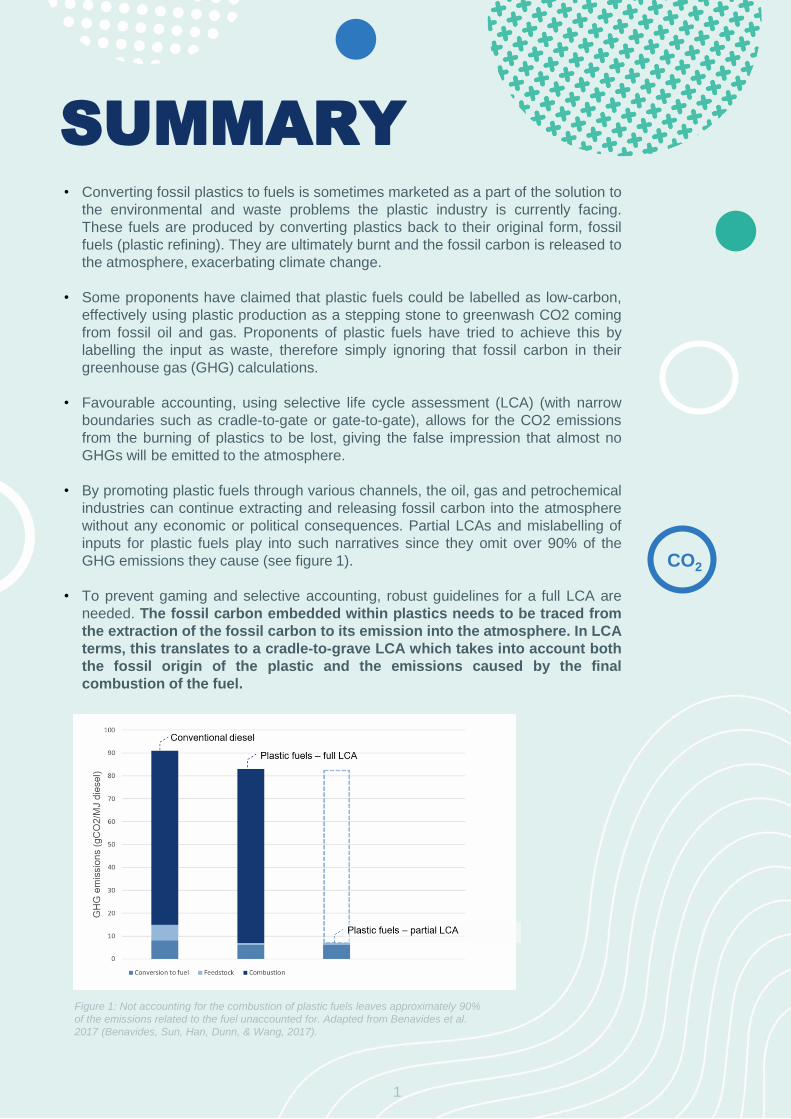
GHG emissions they cause (see figure 1).
• To prevent gaming and selective accounting, robust guidelines for a full LCA are
needed. The fossil carbon embedded within plastics needs to be traced from
the extraction of the fossil carbon to its emission into the atmosphere. In LCA
terms, this translates to a cradle-to-grave LCA which takes into account both
the fossil origin of the plastic and the emissions caused by the final
combustion of the fuel.
Figure 1: Not accounting for the combustion of plastic fuels leaves approximately 90%
of the emissions related to the fuel unaccounted for. Adapted from Benavides et al.
2017 (Benavides, Sun, Han, Dunn, & Wang, 2017).
CO2
1
1 INTRODUCTIONOver the past 50 years, plastic has become an
integral part of our society. It has transformed our
lives and ecosystems, both for better and for
worse.
Since the 1950s when we first started producing
plastic resins, we’ve produced approximately 9.2
billion tons of it. More than 70% of it has been
discarded in landfills or the environment (Geyer,
Jambeck, & Law, 2017).
Plastic has also been one of the major demand
drivers for petrochemical feedstock coming from
the oil and gas industry (IEA, The Future of
Petrochemicals, 2018). Nearly every piece of
plastic is manufactured from fossil fuels, kept in
circulation for a brief period of time and then
landfilled, incinerated or disposed of (Geyer,
Jambeck, & Law, 2017). The entire plastic value
chain, including its production, use and disposal
will add more than 850 million metric tons of
greenhouse gases to the atmosphere in 2019.
That is equivalent to 189 five-hundred-megawatt
coal power plants (CIEL, 2019), comparable to the
total emissions of Germany (UBA, 2018).
As one of the fastest growing culprits behind
climate change and environmental pollution (IEA,
The Future of Petrochemicals, 2018), plastics
production, consumption and disposal methods
are increasingly under scrutiny. In an effort to
continue their profitable business and prevent a
change in production and consumption patterns,
some plastic and fuel manufacturers have been
promoting fuels made out of plastic. They have
argued that liquid and gaseous fuels produced by
the gasification and/or pyrolysis of plastic can
reduce greenhouse gas (GHG) emissions when
compared to the production of conventional fuels
(The Explorer, 2019).
The purpose of this briefing is to assess the
greenhouse gas accounting methods used to
measure the climate impacts of such fuels.
Since there has been no example of a
comprehensive and impartial life-cycle
assessment to date, this briefing compares two
scenarios of accounting and shows how partial
assessments will not accurately estimate the total
increase of CO2 in the atmosphere.
To put the analysis into context, some key
information on plastics, thermal depolymerisation
and LCAs is given. Following these sections, the
briefing delves deeper into the LCA requirements
for plastic fuels and compares two scenarios: the
full LCA that accounts for all GHG emissions to the
atmosphere and the partial LCA which leaves 90%
of emissions unaccounted for. Finally, the briefing
concludes with policy recommendations on how to
set up the necessary environmental safeguards for
the LCA that will be used to analyse the impact of
plastic fuels.
Despite a lack of preliminary assessments, these
fuels are included in fuel targets under the revised
Renewable Energy Directive of the European
Union (REDII) as ‘’liquid and gaseous fuels that
are produced from liquid or solid waste streams of
non-renewable origin’’ (also referred to as
‘recycled carbon fuels’). The climate performance
of these fuels, along with other environmental
impacts, will be evaluated under a delegated act
by 2021 (Zero Waste Europe & Bellona, 2019).
Given this political context, the aim of this briefing
is to inform policymakers and help them establish
a blueprint for an impartial assessment of the
greenhouse gas footprint of such fuels.
CO2
2
KEY FACTS ABOUT PLASTIC
Virtually all synthetic polymers produced today
come from a fossil source. They are produced by
refining naphtha into monomers such as ethylene
and propylene, which are then used for the
production of polymers (Polyplastics, 2019;
Plastics Europe, 2019). In other words, crude oil is
refined into a product which is then either
discarded or incinerated at the end of its lifecycle
(UNEP, 2018). Regardless of the duration of their
use, most polymers produced so far have found
their way into the environment or landfills (Geyer,
Jambeck, & Law, 2017).
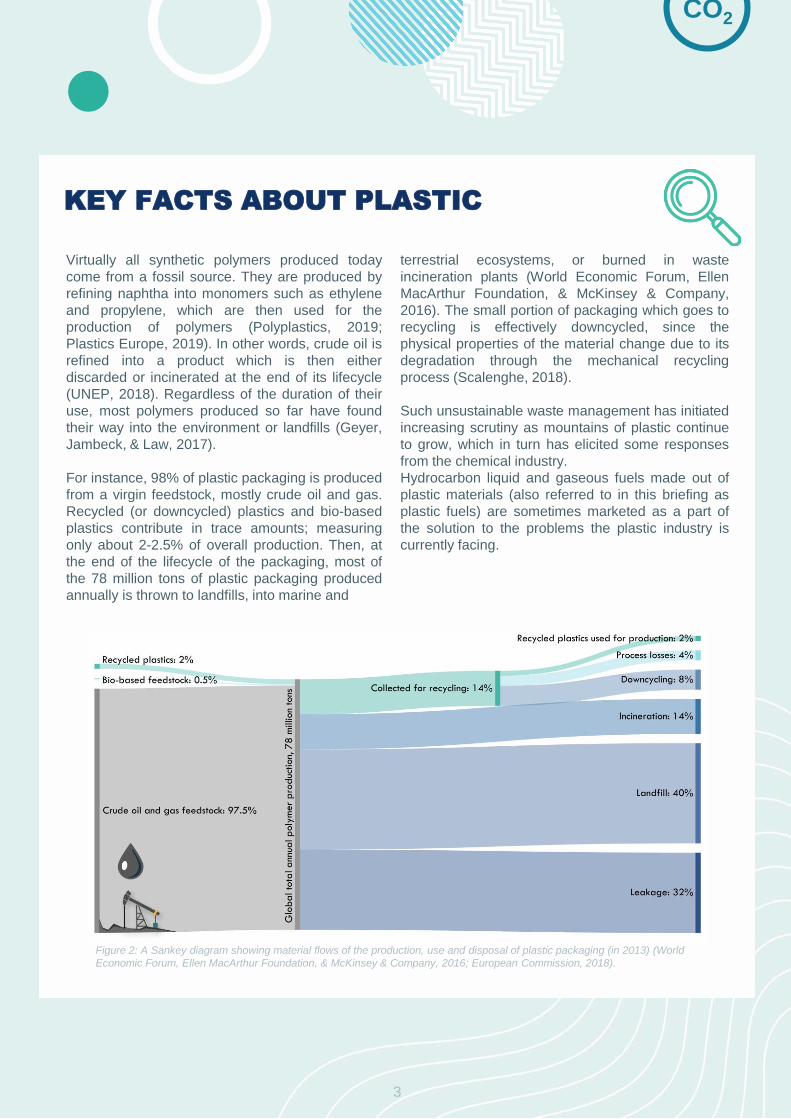
For instance, 98% of plastic packaging is produced
from a virgin feedstock, mostly crude oil and gas.
Recycled (or downcycled) plastics and bio-based
plastics contribute in trace amounts; measuring
only about 2-2.5% of overall production. Then, at
the end of the lifecycle of the packaging, most of
the 78 million tons of plastic packaging produced
annually is thrown to landfills, into marine and
terrestrial ecosystems, or burned in waste
incineration plants (World Economic Forum, Ellen
MacArthur Foundation, & McKinsey & Company,
2016). The small portion of packaging which goes to
recycling is effectively downcycled, since the
physical properties of the material change due to its
degradation through the mechanical recycling
process (Scalenghe, 2018).
Such unsustainable waste management has initiated
increasing scrutiny as mountains of plastic continue
to grow, which in turn has elicited some responses
from the chemical industry.
Hydrocarbon liquid and gaseous fuels made out of
plastic materials (also referred to in this briefing as
plastic fuels) are sometimes marketed as a part of
the solution to the problems the plastic industry is
currently facing.
Figure 2: A Sankey diagram showing material flows of the production, use and disposal of plastic packaging (in 2013) (World
Economic Forum, Ellen MacArthur Foundation, & McKinsey & Company, 2016; European Commission, 2018).
CO2
3

The production of these fuels entails the conversion of plastics back to their original form; fossil
fuels. All of these processes fall under the category of thermal depolymerisation: the breaking of polymer
bonds with heat and pressure. Such thermal reactions, unlike mechanical recycling, consume a
considerable amount of energy and consequently chip away at any potential GHG emission reductions
from recycling (Zero Waste Europe, 2019; GAIA, 2017; Rollinson & Oladejo, 2019).1
2 THERMAL DEPOLYMERISATION: BURNING OF FOSSIL CARBON RENAMED
KEY FACTS ABOUT THERMAL DEPOLYMERISATION
The thermal depolymerisation processes can be divided into three different categories2
(pyrolysis, gasification and hydrogenation). The process results in gaseous and solid
hydrocarbon fractions. Some of these outputs can be further refined to produce a fuel
suitable for combustion.3 However, most of the products resulting from these processes
need to be purified to remove impurities (e.g. ash).
Process Definition
Pyrolysis Decomposition of materials containing carbon in high temperatures in the absence of
oxygen – resulting in char, tar oil and uncondensed gases.
Gasification Partial oxidation of materials containing carbon - resulting in a mixture of carbon
monoxide and hydrogen (synthetic gas, also known as syngas).
Hydrogenation Treatment of materials containing carbon with hydrogen in the presence of a catalyst
– resulting in saturated liquid and gaseous hydrocarbons.
Table 1: Three energy intensive processes eligible to convert plastic into gaseous and liquid feedstock for fuels (ETC,
2018).
Pyrolysis, gasification and hydrogenation were developed decades ago (Garcia-Nunez, et al., 2017;
GAIA, 2017; GIZ, 2017). Despite their long history, they are not economically viable and do not
operate on a significant commercial scale (ETC, 2018; Rollinson & Oladejo, 2019).4 According to GIZ,
companies specialising in pyrolysis and gasification failed to scale up because they were not profitable
(GIZ, 2017).
Ultimately these processes and their outputs (plastic fuel) result in the release of fossil carbon to the
atmosphere, therefore increasing the overall amount of CO2 in the atmosphere and contributing to further
climate change. The production and use of plastic fuels via thermal depolymerisation is just another term
for burning fossil carbon. Redefining such a process as low-carbon is greenwashing. However, some
manufacturers have claimed that these fuels could be labelled as low-carbon, effectively using
plastic fuels to greenwash CO2 coming from fossil oil and gas.
To arrive at a favourable GHG footprint, some stakeholders have suggested the analysis of the impact of
the fuel through an LCA. However, the outcome of the LCA varies drastically depending on the goal and
scope of the analysis. In other words, as long as the goal and the boundaries remain arbitrary, the results
can be manipulated to anyone’s advantage.
1 The questionable climate impact of chemical recycling is not within the scope of this briefing, but should be analysed further in order to assess whether the
technology is compatible with EU’s climate goals.
2 Another method of thermal depolymerisation is plasma pyrolysis.
3 These hydrocarbons can also be used to produce polymers. This process is often referred to as chemical recycling (for more information on chemical
recycling: https://zerowasteeurope.eu/wp-content/uploads/edd/2019/08/2019_08_29_zwe_study_chemical_recycling.pdf)
4 Since the feedstock used by these processes is often heterogeneous waste, their operation generally results in high energy consumption, high maintenance
and cleaning costs & low yields
CO2
4

3 HOW AN LCA WORKS:THE USE AND ABUSE OF GREENHOUSE GAS ACCOUNTING METHODS
An LCA is a tool that evaluates the potential
environmental impacts associated with a product
(Ecochain, 2019; EEA, 1997). By collecting data
about the impact of a certain product, it quantifies
its effect on the environment (EC, 2019). An LCA
is normally done in several stages, starting off with
a definition of the goal and the scope, collection of
data needed for the analysis, inventory analysis
and finally the interpretation of the data collected.
In the context of the REDII, the most relevant
environmental impact category of the LCA is the
global warming potential (GWP), which describes
the greenhouse gas effect caused by the
production, distribution and use of the product.5
This briefing focuses specifically on this category
of environmental impacts.
Normally the assessment includes all of the stages
of the product; including the extraction of raw
materials, production process, distribution, use and
disposal (EEA, 1997). A full LCA considers all
emissions at all stages across the life cycle of a
product. Indirect and direct emissions are included
to ensure the product has a beneficial climate
change impact across its entire production chain.
This is commonly referred to as a cradle-to-grave
or a well-to-wheel assessment.
LCAs can also focus on a specific part of the
lifecycle of a product. However, this means that
the scope of the analysis is more narrow and might
leave out some emissions related to the product.
In other words, the smaller the scope of the
analysis, the better the products GHG footprint will
look. Since there is no obligation to include all of
the emissions related to a product (cradle-to-
grave), LCA boundaries are often arbitrary and
depending on their goal can lead to very different
results.
3.1 GOAL OF THE LCA
Particularly in the context of public policies, LCAs
are tailored to a specific purpose. The first step of
an LCA is to define a goal for the analysis. One of
the problematic aspects of an LCA, particularly
relevant for policy making, is that it may be
considered cradle-to-grave for one
purpose/context while only covering part of the
lifecycle in another context.
In the case of the delegated acts of the REDII
mentioned earlier, the LCAs are meant to inform
EU policies that aim to reach certain climate
targets. More precisely, the purpose of these
specific LCAs is to estimate “the potential for
Figure 3: A full lifecycle analysis includes all inputs, processes and outputs associated to a product (EEA, 1997).
5 More precisely, it is a measure which describes how much energy 1 ton of a greenhouse gas (e.g. CO2) emitted into the atmosphere will absorb over a
given period of time (EPA, 2017).
5
delivering substantial greenhouse gas emissions
savings compared to fossil fuels based on a
lifecycle assessment of emissions.’’ A partial LCA
that excludes key parts of the lifecycle of a product
which are relevant to the assessment of emissions
is therefore not in line with this goal.
Ultimately, looking at what comes out of the ground
and goes up into the atmosphere is the only way to
determine the additional GHG emissions to the
atmosphere. Plastic with embedded fossil carbon
needs to be traced from the extraction of the
fossil carbon all the way to its emission into the
atmosphere. In LCA terms, this translates to a
cradle-to-grave LCA which takes into account
both the fossil origin of the plastic and the
emissions caused by the final combustion of the
fuel.
3.2 SCOPE AND INVENTORY ANALYSIS
As illustrated in Figure 3: a full lifecycle analysis
includes all inputs, processes and outputs
associated to a product (EEA, 1997), therefore,
evaluating a product based on a full LCA raises
questions about (i) the inputs which are needed
(e.g. the embedded fossil carbon within the plastic
and electricity and energy inputs), (ii) the emissions
during the manufacturing of the product and (iii) the
emissions generated during the product end-of-life
processing and use (grave).
For instance, an LCA boundary designed to
show a beneficial climate performance of a fuel
can exclude emissions released by the
combustion of that fuel. The following section
focuses on how the boundaries of an LCA can be
drawn up to make a product seem like a better
alternative to its fossil equivalent.
3.3 THE ISSUE OF ALLOCATION TO
MULTIPLE PRODUCTS
In addition to a narrow scope for an LCA, allocation
of emissions to different products is another factor
that plays an important role in the final outcome.
For instance, if plastic is labelled as ‘waste’, some
argue that it doesn’t have to be counted as a
source of (fossil) carbon and therefore can be
renamed as carbon neutral. This argument is based
on the premise that the material would otherwise be
unused. This means that any product derived from
this fossil material would be counted as carbon
neutral or low carbon.
Some private certification mechanisms have
already started using this misleading argument. For
instance, one certification system counts the fossil
emissions of end-of-life products such as plastics as
zero: ‘[F]ossil end-of-life products and
production residues shall be considered to have
zero-life-cycle emissions up to the collection of
those materials. The calculation of greenhouse
gas emissions shall therefore start with the
collection of the material at the point of origin.’’
(RSB, 2018).
Since the boundaries of their LCA exclude the final
emissions of the fuel on the basis that the input is
zero carbon, the result of such an analysis gives a
false result that doesn’t correspond to real-world
emissions.
In their work on the quantification of GHG emission
savings, also focusing on the Recycled Carbon
Fuels in REDII, the Joint Research Centre (JRC)
has illustrated a similar example of fuels made out
of steel blast furnace gas: “’if you say blast
furnace gas is a “waste or residue” its
emissions are zero in RED (II): a game of
semantics.’’ (JRC ISPRA, 2019).
The examples in this report illustrate how such
narrow system boundaries and mislabelling can
lead to an inaccurate LCA of plastic fuels and
ultimately, a detrimental impact on EU climate
goals.
As stated earlier, the main aim of any fuels included
in the REDII is to achieve emission reductions. The
LCA should therefore be designed to make sure
that the product indeed has a beneficial climate
impact across its entire production and use. In other
words, the mitigation potential needs to be
assessed along the entire lifecycle of the
product (EC, 2019). In case of policy-related
environmental assessments the big picture needs to
be taken into account; including upstream and
downstream trade-offs (EC, 2019).
CO2
6

4 FULL LCA ACCURATELY ACCOUNTS FOR EMISSIONS TO THE ATMOSPHERE
In the case of plastic fuels, this assessment would
have to start from the part of the lifecycle that
contributes the most to its climate impact
(Benavides, Sun, Han, Dunn, & Wang, 2017); the
embedded carbon in plastic products.
Approximately 91% of the emissions from
plastic fuel can be attributed to the fossil
carbon embedded in the plastic input (see
Figure 5) (Benavides, Sun, Han, Dunn, & Wang,
2017).
As illustrated in Figure 4, a full LCA should track
the fossil carbon from its initial extraction to its final
emission. In order to measure the real net increase
of emissions to the atmosphere, the embedded
carbon in plastic materials should be counted as a
fossil input to the fuel production.
When the final combustion emissions are included
into the equation, the total CO2 increase in the
atmosphere is correctly accounted for. Using these
system boundaries and counting all the carbon
coming in and out of the system, the reduction of
emissions is only between 1-14% compared to
conventional diesel6 (Benavides, Sun, Han, Dunn,
& Wang, 2017).
As Figure 5 shows, most of the emissions
produced by combusting plastic fuels come from
the fossil plastic input: ‘’it is the use of the non-
recycled plastics-derived [...] fuel that emits the
fossil carbon contained in the non-recycled
plastics feedstock.’’ (Benavides, Sun, Han, Dunn,
& Wang, 2017).
A full LCA, including combustion, shows that the
atmospheric emissions caused by the combustion
of plastic fuels are very similar to those of
conventional diesel. In other words, when
measured correctly, plastic fuels ultimately result in
a substantial increase of emissions to the
atmosphere.
Figure 4: The fossil inputs to plastic fuel production, including the fossil carbon embedded in plastic, is a crucial element of the
full lifecycle analysis.
Figure 5: Comparison of full life-cycle GHG emissions of plastic
fuels with fossil diesel, adapted from Benavides et al. 2017
(Benavides, Sun, Han, Dunn, & Wang, 2017)
CO2
6 The study compared the difference in GHG emissions between the
petroleum ultra-low sulphur diesel and the ultra-low sulphur diesel
produced via pyrolysis of non-recycled plastics. The analysis uses a
well-to-wheel (cradle-to-grave) system boundary.
7
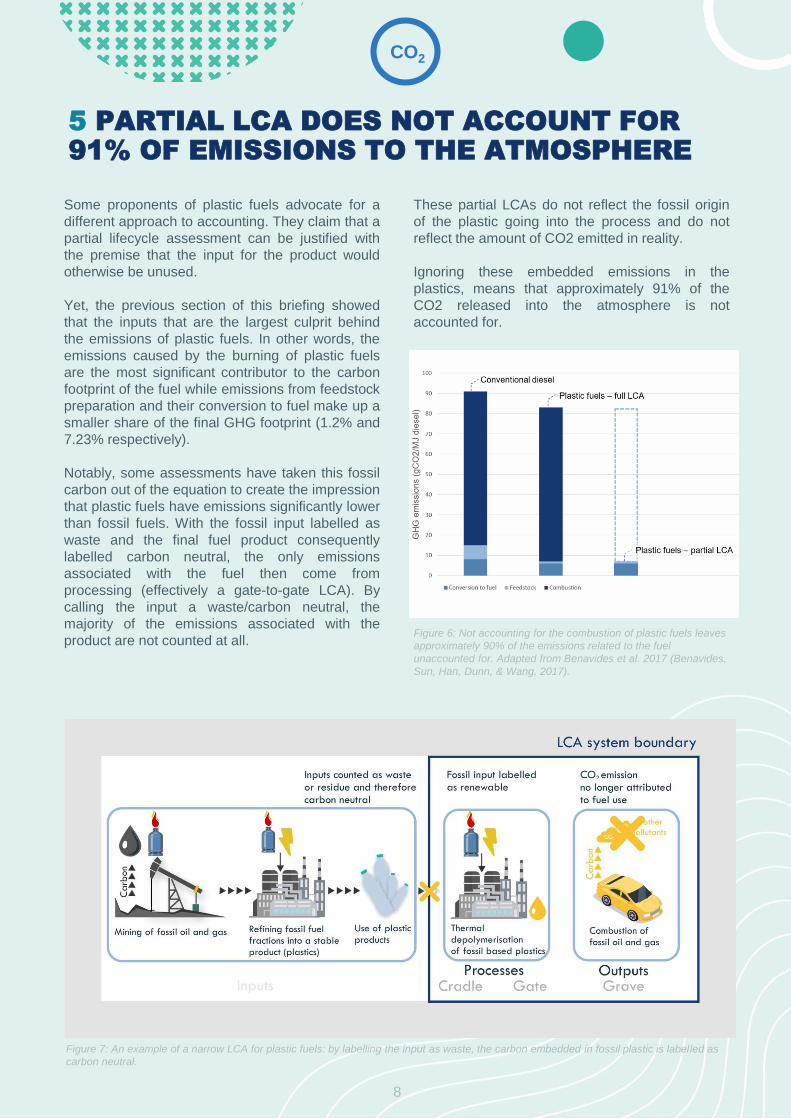
5 PARTIAL LCA DOES NOT ACCOUNT FOR 91% OF EMISSIONS TO THE ATMOSPHERE
Some proponents of plastic fuels advocate for a
different approach to accounting. They claim that a
partial lifecycle assessment can be justified with
the premise that the input for the product would
otherwise be unused.
Yet, the previous section of this briefing showed
that the inputs that are the largest culprit behind
the emissions of plastic fuels. In other words, the
emissions caused by the burning of plastic fuels
are the most significant contributor to the carbon
footprint of the fuel while emissions from feedstock
preparation and their conversion to fuel make up a
smaller share of the final GHG footprint (1.2% and
7.23% respectively).
Notably, some assessments have taken this fossil
carbon out of the equation to create the impression
that plastic fuels have emissions significantly lower
than fossil fuels. With the fossil input labelled as
waste and the final fuel product consequently
labelled carbon neutral, the only emissions
associated with the fuel then come from
processing (effectively a gate-to-gate LCA). By
calling the input a waste/carbon neutral, the
majority of the emissions associated with the
product are not counted at all.
These partial LCAs do not reflect the fossil origin
of the plastic going into the process and do not
reflect the amount of CO2 emitted in reality.
Ignoring these embedded emissions in the
plastics, means that approximately 91% of the
CO2 released into the atmosphere is not
accounted for.
Figure 7: An example of a narrow LCA for plastic fuels: by labelling the input as waste, the carbon embedded in fossil plastic is labelled as
carbon neutral.
Figure 6: Not accounting for the combustion of plastic fuels leaves
approximately 90% of the emissions related to the fuel
unaccounted for. Adapted from Benavides et al. 2017 (Benavides,
Sun, Han, Dunn, & Wang, 2017).
CO2
8

5.1 PARTIAL LCA WOULD NOT REFLECT
REAL-WORLD EMISSIONS: EXAMPLES
Some industries have claimed that their products
provide a significant reduction in emissions when
compared to conventional fossil fuels.
One plastic fuel producer claims a reduction of
75% GHG compared to traditional fossil fuels
(Renew, 2019). Another plastic fuel manufacturer
estimated a reduction in greenhouse gas
emissions of 90% compared to conventional fossil
fuel production (The Explorer, 2019). However,
just as it was illustrated above in Figure 7, their
LCA dismisses the emissions related or embedded
into the input by declaring it waste. Their
calculation is based on a certification mechanism
which leaves out the inputs and labels them as
carbon neutral (RSB, 2018). As a result, their
assessment of the GHG impact of their fuels is
misleading.
In the case of fossil plastic fuels, such reductions
are not possible to achieve without either a
restricted, narrow LCA boundary or allocation of
emissions to some other product within the value
chain.
In their research, Benavides et al. (2017) show
that these fuels, when produced with fossil plastic
waste, would result in an emission reduction in the
range of 1-14% when compared to fossil fuels. To
put this into perspective, other low-carbon fuels
have to meet a threshold of 70% emission
reductions compared to fossil fuels by 2021 (EC,
2018).
In LCA terms, a cradle-to-gate or gate-to-gate
analysis will not account for the burning of
fossil-based plastic fuels. This gives the false
impression that the fuels are low carbon, when
in fact they are produced from a fossil fuel
feedstock and their production and use leads
to significant additional emissions to the
atmosphere.
5.2 OTHER REASONS TO STEER CLEAR
FROM PLASTIC FUELS
Proponents of plastic fuels sometimes argue that
these fuels will displace an equivalent amount of
conventional fossil fuels from the system. This
argument also comes up in discussions about
accounting exercises, such as LCAs.
However, there is no scientific basis for the
assumption that the equivalent amount of fossil
fuels (as plastic fuels produced) will remain
unused. The use of other alternative fuels and
energy sources on a larger scale has shown that
they do not necessarily displace oil imports or
prevent the use of fossil fuels (Malça & Freire,
2011; York, 2012).
In other words, there has been no proof of
correlation between the substantial displacement
of fossil fuels and the production of ‘alternative’
drop-in fuels. On the contrary, their production
sometimes causes adverse effects. For instance,
biofuels have caused an increase in the supply of
petroleum products, causing a decline in the fuel
price by 1.07-1.1% and thus a 1.5-1.6.% increase
in total global fuel consumption (Hochman,
Rajagopal, & Zilberman, 2010).
Apart from causing adverse effects on the fuel
market, plastic fuels would have a negative impact
on the EU’s circular economy targets. These
targets aim to substantially reduce the non-
recyclable feedstock that these fuels rely on
(Council of the EU, 2019). Supporting the
conversion of fossil plastic to fuels would go
against these goals and instead incentivise
additional consumption of virgin plastics.
The EU has established increasingly ambitious
targets that tackle the issue of non-recyclable
plastic waste at its source (Council of the EU,
2019). The current European Strategy for Plastics
in a Circular Economy focuses on reuse and
improved product design and penalises non-
recyclable plastic products (EC, 2018).
CO2
9

Consequently, plastic fuel plants will face an
increasing scarcity of post-consumer non-
recyclable plastic, making them even less
profitable. The investments in plastic fuels
productions sites would also cause a continuous
demand for plastic, since the plants will have to
operate in order to justify and pay off the initial
expense.
For all these reasons, supporting plastic fuels
would go against EU’s current commitments
outlined in the EU Action Plan for a circular
economy and European Green Deal.
While it is out of the scope of the LCAs to account
for such indirect effects of plastic fuels, there is a
clear need for a full system perspective when it
comes to their assessment.
6 WHY DO MANUFACTURERS WANT TO PRODUCE PLASTIC FUELS?
Plastic fuels might be labelled as a waste disposal
solution, but in reality they are designed to support
some of the most lucrative markets in the world;
the petrochemical, oil and gas industries.
If fuels are produced from fossil plastic, these
industries will continue to profit from 1) production
and extraction of fossil crude oil and gas, 2)
production of fossil-based polymers and 3)
production of ‘low-carbon’ fuels.
Due to their limited scale and the competitive
nature of the global oil market, these fuels will only
supplement an already established fossil fuel
system (Malça & Freire, 2011; Hochman,
Rajagopal, & Zilberman, 2010). This will allow the
oil and gas sector to continue business as usual
and keep the global fossil fuel markets afloat.
The downstream segment of the oil and gas
industry also benefits from the production of plastic
fuels. The processing and refining industry, also
referred to as the petrochemical industry, produces
the main feedstock for the production of plastics.
According to the IEA, plastics are a key demand
driver for products of the petrochemical industry
(IEA, 2018). A spike in demand for plastic waste
would incentivise plastic production, thereby
creating additional revenue streams for
petrochemical refineries. Companies such as Shell
and Saudi Aramco are already ‘’funnelling billions
of dollars into petrochemical complexes as they
bank on growing demand for the materials used to
make items such as plastic packaging, washing
detergent and home insulation’’ (Financial Times,
2018). Ultimately, the fuel produced would be a
drop-in fuel and would hence perpetuate a system
of internal combustion engines and fossil fuel
blending.
In a nutshell, fossil plastic fuels would not only
perpetuate the use of fossil fuels and their
derivatives, but they would stimulate their
further uptake in the market.
Large oil and gas companies have already started
looking into plastic fuels and are developing pilot
projects (Shell, 2019). The industry has also
invested substantial resources to influence EU
policy making (CEO, Food & Water Europe, FoE
Europe, & Greenpeace, 2019). By promoting
plastic fuels through various channels, the oil, gas
and petrochemical industries can continue
extracting and releasing fossil carbon into the
atmosphere without any economic or political
consequences.
A partial LCA assessment of plastic fuels plays
into such narratives since it omits major culprits of
the GWP of plastic fuels. It is precisely due to this
context that robust guidelines for a full LCA are
needed.
CO2
10

7 RECOMMENDATIONSA FULL LCA WOULD AVOID GREENWASHING OF PLASTIC FUELS
Developing a robust accounting system for the GWP of recycled carbon fuels will be a crucial part of
the REDII and its implementation. With no time to spare and a looming climate crisis, establishing
robust accounting rules is crucial to incentivising truly low-carbon alternatives.
RECOMMENDATIONS
• In order to account for all emissions coming from plastic fuels, the LCA guidelines for the
REDII delegated acts should account for all direct and indirect emissions from cradle-to-
grave. This includes the fossil carbon embedded in the inputs for the fuels.
• The embedded fossil carbon in plastic is the largest contributor to the final GWP of plastic fuels.
Accordingly, the ‘cradle’ stage of the LCA should include the extraction, refining and
cracking process to include this fossil origin.
• If plastic is treated as waste, there is a risk that both the plastic material and the transport fuel
produced from it will be labelled as carbon neutral. Measures should be taken to prevent such
double counting of ‘emission reductions’ in the plastic and the transport sector.
• Public policy LCAs must be put into the wider context of EU policy making and adverse effects
on other climate policies must be mitigated (e.g. circular economy and waste prevention
targets).
For more information on plastic fuels and the environmental impacts of plastic waste visit the
following links:
1. On environmental criteria for recycled carbon fuels (the REDII fuel category including
plastic fuels): https://zerowasteeurope.eu/wp-content/uploads/2019/04/NGO-joint-
briefing-RCF.pdf
2. On chemical recycling: https://zerowasteeurope.eu/wp-
content/uploads/edd/2019/08/2019_08_29_zwe_study_chemical_recycling.pdf
3. On the impact of plastics on the climate: https://www.ciel.org/wp-
content/uploads/2019/05/Plastic-and-Climate-FINAL-2019.pdf
CO2
CO2
11

• Benavides, P. T., Sun, P., Han, J., Dunn, J. B., & Wang, M. (2017, April 27). Life-cycle analysis of fuels from post-use non-recycled plastics. Fuel, pp. 11-22.
• Break Free From Plastic, & Heinrich Böll Stiftung. (2019). Plastic Atlas.
• CEO, Food&Water Europe, FoE Europe, & Greenpeace. (2019, October 24). Retrieved from Big Oil and gas buying influence in Brussels: With money and
meetings, subsidies and sponsorships, the oil and gas lobby is fuelling the climate disaster: https://corporateeurope.org/sites/default/files/2019-
10/FFP%20Briefing%20-%20Big%20Oil%20and%20Gas%20buying%20influence%20in%20Brussels%20-%20Oct%202019.pdf
• CIEL. (2019). Plastic & Climate: The Hidden Costs of a Plastic Planet.
• Council of the EU. (2019). Retrieved from Council adopts ban on single-use plastics: https://www.consilium.europa.eu/en/press/press-
releases/2019/05/21/council-adopts-ban-on-single-use-plastics/
• EC. (2018, January 16). COMMUNICATION FROM THE COMMISSION TO THE EUROPEAN PARLIAMENT, THE COUNCIL, THE EUROPEAN
ECONOMIC AND SOCIAL COMMITTEE AND THE COMMITTEE OF THE REGIONS: A European Strategy for Plastics in a Circular Economy. Retrieved
from https://eur-lex.europa.eu/resource.html?uri=cellar:2df5d1d2-fac7-11e7-b8f5-01aa75ed71a1.0001.02/DOC_1&format=PDF
• EC. (2018, December 11). DIRECTIVE (EU) 2018/2001 OF THE EUROPEAN PARLIAMENT AND OF THE COUNCIL of 11 December 2018 on the
promotion of the use of energy from renewable sources. Retrieved from https://eur-lex.europa.eu/legal-
content/EN/TXT/PDF/?uri=CELEX:32018L2001&from=EN
• EC. (2019). Environment: Integrated Product Policy . Retrieved from European Platform on Life Cycle Assessment (LCA):
https://ec.europa.eu/environment/ipp/lca.htm
• EC. (2019). European Platform on Life Cycle Assessment (LCA). Retrieved from Environment: https://ec.europa.eu/environment/ipp/lca.htm
• Ecochain. (2019). Life Cycle Assessment (LCA) – Complete Beginner's Guide. Retrieved from https://ecochain.com/knowledge/life-cycle-assessment-lca-
guide/
• EEA. (1997). Life Cycle Assessment: A guide to approaches, experiences and information sources. Copenhagen: European Environment Agency.
• EPA. (2017, February 14). Greenhouse Gas Emissions. Retrieved from Understanding Global Warming Potentials:
https://www.epa.gov/ghgemissions/understanding-global-warming-potentials
• ETC. (2018). Mission Possible: Sectoral Focus - Plastics. The Energy Transitions Commission.
• European Commission. (2018). COMMUNICATION FROM THE COMMISSION TO THE EUROPEAN PARLIAMENT, THE COUNCIL, THE EUROPEAN
ECONOMIC AND SOCIAL COMMITTEE AND THE COMMITTEE OF THE REGIONS: A European Strategy for Plastics in a Circular Economy.
• Financial Times. (2018, June 10). Retrieved from Oil groups stand by bets on out-of-favour plastics: https://www.ft.com/content/f986fa62-6c94-11e8-92d3-
6c13e5c92914
• GAIA. (2017). WasteGasification & Pyrolysis: High Risk,Low Yield Processes for Waste Management.
• Garcia-Nunez, J., Pelaez-Semaniego, M., Garcia-Perez, M., Fonts, I., Abrego, J., Westerhof, R., & Garcia-Perez, M. (2017). Historical Developments of
Pyrolysis Reactors: A Review. Energy&Fuels, 5751−5775.
• Geyer, R., Jambeck, J. R., & Law, K. L. (2017). Production, use, and fate of all plastics ever made. Science Advances.
• GIZ. (2017). Waste-to-Energy Options in Municipal Solid Waste Management . Bonn: Deutsche Gesellschaft für Internationale Zusammenarbeit (GIZ) GmbH.
• Heyne, S., Bokinge, P., & Nyström, I. (2019). Global production of bio-methane and synthetic fuels -. CIT Industriell Energi AB.
• Hochman, G., Rajagopal, D., & Zilberman, D. (2010). The Effect of Biofuels on Crude Oil Markets. AgBioForum, 112-118.
• IEA. (2018). Retrieved from The Future of Petrochemicals: https://www.iea.org/reports/the-future-of-petrochemicals
• IEA. (2018). The Future of Petrochemicals. OECD/IEA.
REFERENCES
CO2
12
• IEA. (2018, December 7). The Future of Petrochemicals. Retrieved from EU Refining Forum: https://ec.europa.eu/energy/sites/ener/files/documents/iea-
the_future_of_petrochemicals.pdf
• JRC ISPRA. (2019). Some methodology principles for quantifying GHG emissions savings under the Innovation Fund.
• Malça, J., & Freire, F. (2011). Uncertainty Analysis of the Life-Cycle Greenhouse Gas Emissions and Energy Renewability of Biofuels. In M. A. Bernardes,
Environmental Impact of Biofuels. IntechOpen.
• Plastics Europe. (2019). Plastics Europe. Retrieved from How plastics are made: https://www.plasticseurope.org/en/about-plastics/what-are-plastics/how-
plastics-are-made
• Polyplastics. (2019). Retrieved from Plastics step-by-step: https://www.polyplastics.com/en/pavilion/beginners/01-05.html
• Renew. (2019). Retrieved from Economic & Environmental Benefits: http://renewlogy.com/renew-energy/
• Rollinson, A. N., & Oladejo, J. M. (2019). ‘Patented blunderings’, efficiency awareness, and self-sustainability claims in the pyrolysis energy from waste
sector. Resources, Conservation & Recycling, 233-242.
• RSB. (2018, December 7). Retrieved from RSB Standard for Advanced Products: https://rsb.org/wp-content/uploads/2018/12/18-12-11_RSB-STD-02-001-
v2.0-RSB-Standard-for-Advanced-Products.pdf
• Scalenghe, R. (2018). Resource or waste? A perspective of plastics degradation in soil with a focus on end-of-life options. Heliyon.
• Shell. (2019, November 21). Retrieved from SHELL USES PLASTIC WASTE TO PRODUCE CHEMICALS: https://www.shell.com/business-
customers/chemicals/media-releases/2019-media-releases/shell-uses-plastic-waste-to-produce-chemicals.html
• The Explorer. (2019). Retrieved from Giving harmful plastic waste a new life: https://www.theexplorer.no/solutions/giving-harmful-plastic-waste-a-new-life/
• Transport&Environment. (2015, March). Retrieved from Study: Reasons to change the zero-rated criteria for biomass in the EU ETS:
https://www.transportenvironment.org/sites/te/files/publications/2015%2001%20biomass%20ets_rating_FINAL.pdf
• UBA. (2018). Submission under the United Nations Framework Convention on Climate Change and the Kyoto Protocol 2018. Retrieved from National
Inventory Report for the German Greenhouse Gas Inventory 1990 – 2016:
https://www.umweltbundesamt.de/sites/default/files/medien/1410/publikationen/2018-05-24_climate-change_13-2018_nir_2018_en.pdf
• UNEP. (2018). THE STATE OF PLASTICS: World Environment Day Outlook .
• World Economic Forum, Ellen MacArthur Foundation, & McKinsey & Company. (2016). The New Plastics Economy — Rethinking the future of plastics.
• York, R. (2012). Do alternative energy sources displace fossil fuels? Nature Climate Change, 441–443.
• Zero Waste Europe. (2019). El Dorado of Chemical Recycling: State of play and policy challenges.
• Zero Waste Europe, & Bellona. (2019). Retrieved from Joint briefing: Recycled Carbon Fuels in the Renewable Energy Directive:
https://zerowasteeurope.eu/wp-content/uploads/2019/04/NGO-joint-briefing-RCF.pdf
13
CO2

Zero Waste Europe gratefully acknowledges financial assistance from the European
Union. The sole responsibility for the content of this event materials lies with Zero
Waste Europe. It does not necessarily reflect the opinion of the funder mentioned
above. The funder cannot be held responsible for any use that may be made of the
information contained therein.
Grateful thanks to the Children’s Investment Fund Foundation
for supporting Bellona’s work on industrial climate action.
Author: Ana Šerdoner
Reviewer: Janek Vahk
Editor: Eilidh Robb
Design: Blush
28th January 2020
ACKNOWLEDGEMENTS
Rethink Plastic, part of the Break Free From Plastic movement, is an alliance of leading
European NGOs, representing thousands of active groups, supporters and citizens in every
EU Member State.
Bellona Europa is the Brussels-based branch of the Norwegian Bellona Foundation, an
independent non-profit organisation working on the environmental, climate and social issues
of our time. We aim to identify, promote and help implement realisable solutions for the
protection of nature, the environment and health. To achieve these goals, Bellona continues
to work with – and against – relevant actors and stakeholders.
Zero Waste Europe is the European network of communities, local leaders, businesses,
experts, and change agents working towards the same vision: phasing out waste from our
society. We empower communities to redesign their relationship with resources, to adopt
smarter lifestyles and sustainable consumption patterns, and to think circular.

CO2
CO2
FOR ADDITIONAL GUIDANCE AND MORE DETAILED
RECOMMENDATIONS, PLEASE CONTACT:
Ana Šerdoner
Policy & Project Advisor at
Bellona Europa aisbl
Janek Vahk
Climate, Energy & Air Pollution
Coordinator at Zero Waste
Europe
CO2
CO2