counting the costs of crime in australia : technical report · australian institute of criminology...
TRANSCRIPT
Australian Institute of CriminologyTechnical and Background Paper Series
No. 4
Counting the Costs of Crime inAustralia: Technical Report
Pat Mayhew
© Australian Institute of Criminology 2003
ISSN 1445-7261ISBN 0 642 24296 8
Apart from any fair dealing for the purpose of private study, research, criticism or review, as permittedunder the Copyright Act 1968 (Cwlth), no part of this publication may in any form or by any means(electronic, mechanical, microcopying, photocopying, recording or otherwise) be reproduced, stored in aretrieval system or transmitted without prior written permission. Inquiries should be addressed to thepublisher.
Published by the Australian Institute of CriminologyGPO Box 2944Canberra ACT 2601Tel: (02) 6260 9221Fax: (02) 6260 9201Email: [email protected] site: http://www.aic.gov.au
Suggested citation:
Mayhew, P. 2003, Counting the Costs of Crime in Australia: Technical Report, Technical and BackgroundPaper Series, no. 4, Australian Institute of Criminology, Canberra,http://www.aic.gov.au/publications/tbp/tbp004.html.
3AIC Technical and Background Paper Series
Counting the Costs of Crime in Australia: Technical Report
Contents
List of Tables ................................................................................................................. 4Abbreviations ................................................................................................................ 61 Introduction............................................................................................................ 7
Some Costing Principles .......................................................................................... 7The Profile of Crime in Australia and England & Wales ....................................... 14
2 Studies Drawn Upon ............................................................................................. 16Australian Studies .................................................................................................. 16UK Studies ............................................................................................................ 18US Studies ............................................................................................................ 19
3 Homicide .............................................................................................................. 214 Assault ................................................................................................................... 235 Sexual Assault ........................................................................................................ 276 Robbery ................................................................................................................ 307 Burglary ................................................................................................................ 348 Thefts of Vehicles .................................................................................................. 389 Thefts from Vehicles ............................................................................................. 4110 Shop Theft ............................................................................................................ 4311 Other Theft and Handling .................................................................................... 4612 Criminal Damage .................................................................................................. 4813 Arson .................................................................................................................... 5014 Fraud .................................................................................................................... 5615 Drug Offences ....................................................................................................... 6316 Other Costs ........................................................................................................... 69
Criminal Justice System ........................................................................................ 69Lost Productivity of Prisoners ................................................................................ 71Victim Assistance .................................................................................................. 72Security Industry ................................................................................................... 74Insurance Administration ...................................................................................... 74
References ................................................................................................................... 75

4 Australian Institute of Criminology
List of Tables
Table 1.1: Mean victim seriousness score for different crimes (1992 and 2000ICVS) ...................................................................................................... 15
Table 1.2: Percentage victimised once or more in 1999 (2000 ICVS) ...................... 15
Table 3.1: Costs of homicide.................................................................................... 22
Table 3.2: Alternative intangible costs of homicide .................................................. 22
Table 4.1: Multipliers for assault .............................................................................. 24
Table 4.2: Estimated number of assaults in 2001 ..................................................... 24
Table 4.3: Costs of assaults—medical, lost output and intangible losses ................... 25
Table 4.4: Overall unit and total costs of assaults ..................................................... 25
Table 5.1: Multipliers for sexual assault .................................................................... 28
Table 5.2: Estimated number of sexual assaults in 2001 ........................................... 28
Table 5.3: Costs of sexual assaults—medical, lost output and intangible losses ......... 28
Table 5.4: Overall unit and total costs of sexual assaults ........................................... 29
Table 6.1: Multipliers for personal robbery .............................................................. 31
Table 6.2: Estimated number of robberies, 2001 ...................................................... 32
Table 6.3: Costs of robberies—medical, lost output and intangible losses ................ 33
Table 6.4: Overall unit and total costs of robberies................................................... 33
Table 7.1: Multipliers for residential burglary........................................................... 35
Table 7.2: Estimated number of burglaries, 2001 ..................................................... 35
Table 7.3: Costs of burglaries—property loss, lost output and intangible losses ........ 36
Table 7.4: Overall unit and total costs of burglary .................................................... 37
Table 8.1: Property loss and damage costs for vehicle thefts ..................................... 39
Table 8.2: Overall unit and total costs of motor vehicle thefts .................................. 40
Table 9.1: Multipliers for thefts from vehicles .......................................................... 41
Table 9.2: Costs of thefts from vehicles—property loss, lost output and intangiblelosses ....................................................................................................... 42
Table 9.3: Overall unit and total costs of thefts for motor vehicles ........................... 42
Table 10.1: Estimates for shop theft ........................................................................... 43
Table 10.2: Costs of shop theft .................................................................................. 44
Table 11.1: Estimates for other theft and handling .................................................... 46
Table 12.1: Costs of criminal damage—property loss, lost output and intangiblelosses ....................................................................................................... 49
Table 13.1: Estimates of the cost of arson .................................................................. 53
Table 13.2: Summary of arson costs ........................................................................... 55

5AIC Technical and Background Paper Series
Counting the Costs of Crime in Australia: Technical Report
Table 14.1: Business crime survey estimates of unit losses .......................................... 59
Table 14.2: The elements of the overall fraud cost ..................................................... 60
Table 14.3: Different estimates of insurance fraud ..................................................... 61
Table 15.1: Some human costs of drug misuse ........................................................... 66
Table 16.1: Criminal justice system costs in Australia 2001–02.................................. 71
Table 16.2: Estimated costs of provisions for victims ($million) ................................. 74
Table 16.3: Expenditure on private security in Australia, 2001–02............................. 74
6 Australian Institute of Criminology
Abbreviations
ABS Australian Bureau of Statistics
AFP Australian Federal Police
AIC Australian Institute of Criminology
AIHW Australian Institute of Health and Welfare
ANAO Australian National Audit Office
BCS British Crime Survey
BOCSAR Bureau of Crime Statistics and Research
BTE Bureau of Transport Economics
CARS Comprehensive Auto-theft Research System
CCS Commercial Crime Survey
CIC Criminal Injuries Compensation
COTSA Clients of Treatment Service Agencies
CSS Crime and Safety Survey
DUCO Drug Use Careers of Offenders project
DUMA Drug Use Monitoring in Australia project
ICA Insurance Council of Australia
ICVS International Crime Victims Survey
LRCV Law Reform Commission of Victoria
MUARC Monash University Accident Research Centre
NCVS National Crime Victimisation Survey
NERA National Economic Research Associates
NMVTRC National Motor Vehicle Theft Reduction Council
NSCB National Survey of Crime Against Business
OSW Office of the Status of Women
SAAP Supported Accommodation Assistance Program
SARCSS South Australian Retail Crime and Safety Survey
SBCS Small Business Crime Survey
SCRCSSP Steering Committee for the Review of Commonwealth/State ServiceProvision
UEWI unauthorised entry with intent
WSS Women’s Safety Survey
WTP willingness to pay

7AIC Technical and Background Paper Series
Counting the Costs of Crime in Australia: Technical Report
1 Introduction
This technical report lays out details of the assessments of the costs of crime in Australiareported in Trends and Issues paper no. 247, “Counting the Costs of Crime in Australia”(Mayhew 2003), which is available on the Australian Institute of Criminology’s web siteat www.aic.gov.au/publications/tandi/tandi247.html.
Details of how the costs were calculated are shown so that:
• the basis of the figures are transparent; and
• more up-to-date and fuller estimates, when they become available, can be addedto those shown, or can stand in place of them.
Discussed first are some general points about costing crime, and about the costingprinciples adopted. The main principles need describing, not least to allow comparisonswith other work where different approaches may be taken. There is also no completeconsensus as to the best approach, which heightens the need for transparency. Section 2gives some information on the major studies referred to and/or used in the currentanalysis. Sections 3 to 15 deal with the costings for the offences covered. Section 16deals with other costs (such as the criminal justice system).
Some Costing Principles
The full costs of crimes are myriad and not all of them are assessed. Box 1 lays out somethat have a claim to be included. It indicates which are taken into account, at least inpart. The costs fall into three main categories (cf. Brand & Price 2000):
• Costs in anticipation of crime. These fall mainly on people as potential victims—for instance, what they pay for security measures. There is also some element of“opportunity cost”. The time put into neighbourhood anti-crime activities, forinstance, might well be better spent.
• Costs incurred as a consequence of crime. These fall mainly on actual victims,particularly in terms of property loss and damage. But they can also mean time offwork, costs for health services and so on.
• Costs in response to crime. These fall mainly on the criminal justice system.
No study—in Australia or elsewhere—has ever fully assessed the myriad costs involved.Rather, the main focus has been on what countries spend on their criminal justicesystems (usually a matter of public record), and on some of the direct consequences ofcrime—though their full extent remains uncharted.

8 Australian Institute of Criminology
Estimating the Number of Crimes (the “Multiplier” Issue)
Sensible estimates need to allow for the fact that the number of crimes to be costed willbe greater than the number recorded by the police. This is because not all crimes arereported to the police and the police may not record all crimes that are reported tothem. Traditionally, two approaches have been taken to work out the number of crimesto cost. Both rely on victimisation survey data, but use it in different ways. Neither ofthe approaches is ideal, and they produce different estimates. The first is moreconservative than the second approach which, with some caution, was taken here.
(i) The Unreported Crime Adjustment
The first approach is the one used by Walker (1992, 1997) in his analysis of the costs ofcrime in Australia. It allows for a greater number of crimes than recorded by the police,but merely by inflating police figures by the proportion of offences measured by theAustralian Bureau of Statistics’ Crime and Safety Survey (CSS) that victims said werenot reported to the police. (For instance if there were 290,000 residential burglariesrecorded, and a reporting rate of 60 per cent, then the real number of burglaries wouldbe estimated as about 480,000.)
(ii) The “Face Value” Survey Count Approach
The second approach, which is adopted in US and UK work, is to take the “face value”victimisation survey count for a particular offence and then compare it to the number ofoffences of that type recorded by the police. For each crime a “multiplier” is constructedwhich is the ratio of the survey-estimated number of crimes to the number recorded bythe police over the same period (with a few adjustments made where necessary to
Box 1: Some of the various costs of crime
� =Taken into account
In anticipation of crimeSecurity expenditure �Insurance �Individual precautionary behaviour �Central and local government crime prevention activityCommunity defensive actionSocial costs of fear of crime and precautionary behaviour
As a consequence of crimeProperty stolen and damaged �Lost output �Health service costs �Intangible costs to victims (emotional and physical impact) �Victim support services �Lost earnings on the part of prisoners �Mental health costsCosts of supporting offenders and their families“Second generation” costs of offendingDisinvestment in high-crime areas
In response to crimeCriminal justice system (police, prosecution, courts etc) �Dealing with offenders (e.g. probation and prison) �Criminal injuries compensation �
9AIC Technical and Background Paper Series
Counting the Costs of Crime in Australia: Technical Report
improve comparability). For instance, suppose there were 800,000 residential burglarieson the basis of what victims say in the CSS, but only 290,000 recorded by the police.The ratio between the first and second number would be 2.8, which could be seen asthe appropriate “multiplier”. This can then be used to multiply up the number ofrecorded burglaries in the most recent year to estimate the current “real” level ofresidential burglaries.
The Pros and Cons
The first approach leaves an unexplained gap between the estimated number ofburglaries (480,000 in this example) and the number actually estimated by the survey(800,000). In effect then, it rejects the survey estimate, although accepts its results onthe proportion of offences reported to the police, which is arguably inconsistent.
The second approach accepts the survey measure, and thus presents the gap betweensurvey and police figures, “as it seems to be”. However, it invariably produces anothergap between the estimated number of crimes reported (in the example here, 480,000—60 per cent of 800,000), and the number recorded by the police (290,000 here). Thisgap is often known as “the recording shortfall”. The CSS shows this shortfall (ABS1999, p. 84). The number of recorded burglaries, for instance, is less than two-thirds ofthose said to have been reported, while the figures are lower still for robbery (half ), androbbery and sexual assault (about a third). Motor vehicle theft and homicide are theonly offences where reported and recorded numbers are similar.
The issue is to what extent the gap is a “real” one reflecting police under-recording, andto what extent is it about an inflated survey count. It is probably a bit of both. First, it isalmost certainly true that not all offences reported to the police are recorded by them(see, for example, the recent report from the AIC examining police recording practicesin Victoria—Carcach & Makkai 2002). There are several reasons why police may notrecord all the offences that come to their attention. They may think there was notsufficient evidence; they may comply with victims’ wishes not to proceed; someincidents may be seen as too trivial to warrant a formal record; or the police may feelthat the report is mistaken or disingenuous. Some reports of crime by victims mayactually be recorded, but under another offence category. An important study of policerecording practices in the UK testified to a “recording shortfall” (Burrows et al. 2000).In Australia, a police activity survey in Queensland showed that only about one-third ofcalls responded to by police resulted in a criminal offences report—although there is nosuggestion that all the calls would have been about crime (Criminal Justice Commission1996).
On the other side of the coin, though, there are grounds for thinking that the surveycount could be inflated. For one, survey respondents could “telescope” into the referenceperiod incidents that in fact happened before it. This would lead to a survey overcountfor a particular year (in other words, the 800,000 burglaries in the example above wouldbe too high). Second, some respondents may say they reported when in fact they didnot (seeing it as the “desirable” answer). This would also increase the apparent shortfallbetween the numbers of reported and recorded crimes.
10 Australian Institute of Criminology
In the event, the second approach was adopted in the current work, for one because itaccords with the UK work that is used as the basis of a number of estimates in theabsence of Australian data. As said, it leads to a higher count of crime than the firstapproach. However, while this will potentially inflate cost figures, it is balanced by aconservative approach taken to other elements of costings.
The Survey Data
The survey data for assault, sexual assault, robbery, burglary and motor vehicle theftcome from the Crime and Safety Survey (CSS), measuring crime in 1997–98 (ABS1999). The Women’s Safety Survey offers alternative figures for assault and sexualassault, and indeed suggests the number of offences would be higher than indicated bythe CSS. For consistency, however, the CSS is used throughout.
Other survey data are used on occasion, including the AIC’s Small Business CrimeSurvey (SBCS), and the International Crime Victimisation Survey (ICVS). The varioussurveys used are discussed in Section 2.
The Age/Gender Adjustment for CSS Figures
When comparing CSS and police figures to derive a multiplier for assault and robbery,an adjustment is needed to account for the fact that the CSS only covers victims aged 15or more (and in the case of sexual assault, women aged 18 or more only). The approachtaken was to compare the number of CSS-measured offences with the number recordedby the police, excluding younger victims and, in the case of sexual assault, men also.These figures are reported in Crime and Safety Australia (ABS 1999, p. 84).
Transfer Payments: Exchange of Goods
Economists would not necessarily consider the illegal exchange of goods and purchasingpower from victim to offender as a financial loss to society. Rather, they might see it as atransfer payment (the offender gains what the victim loses). However, the importantdistinction between transfer and loss turns on whether the transfer is wanted orunwanted. Since theft involves a transfer of property unwanted by the victim out of thelegal economy into the illegal one, it is conventional in costs of crime work to treat it asa cost of crime. This convention is followed here.
Transfer Payments: Insurance
Insurance claims also involve a transfer of resources but, unlike the transfer from victimto offender, it can be seen as wanted. Thus, in line with UK and US estimates, insuranceis treated as a transfer cost and not a loss to society. That is, premiums paid to insureagainst potential losses are seen as cancelled out by payments to victims. For this reason,gross costs to victims are taken, not costs after any insurance compensation. However,the cost to insurers of administering claims for crime victims is included. Theinformation for this came from Insurance Statistics Australia (David Minty, personalcommunication). It indicates a figure of $500 million in Australia in 2001–02. This isabout 15 per cent of the value of premiums for theft and damage.
11AIC Technical and Background Paper Series
Counting the Costs of Crime in Australia: Technical Report
Medical Costs
Medical costs are derived from estimates taken from a thorough study by the MonashUniversity Accident Research Centre (MUARC) of the costs of deaths and injuries inVictoria in 1993–94, one cause of which is interpersonal violence (more detail below).MUARC included medical costs for fatalities, hospitalised and non-hospitalised cases.
Lost Output
Lost output counts the costs of victims not being able to work. Ideally, it should alsoinclude lost productivity on the part of family and friends—although this is rarely done,and not here either.
Lost output is what in economic terminology is called human capital loss—commonlyused in Australia to cost accidents and disease. Both unpaid and paid work is usuallyaccounted for—that is, the lost production that a dead or injured victim would havecontributed, but in present values.1 Unpaid work losses come from the imputed worthof household services and voluntary community work.
The value of potential lifetime work is translated back to the year in which a death orinjury occurred using a “social discount rate”. The best rate to take is subject to debate.A feature of the human capital approach is that it yields low lost output values forchildren and retired people because valuations are based on market earnings.
In the present study, the approach taken to assessing lost output differed according towhether violent crime or property crime was involved.
• For homicide, assaults, sexual assaults and robbery involving injury, lost outputestimates are from MUARC’s study. MUARC used a discount rate of seven percent, which would now be seen as inappropriate (Gold et al. 2001). A socialdiscount rate of four per cent was used in the Bureau of Transport Economicsstudy of the costs of road accidents in Australia in 1996, which is also drawn onhere and described below (BTE 2000). The four per cent rate was applied toadjust MUARC’s figures.
• For no-injury assaults, robberies and property crime, lost output losses weremainly estimated using UK figures, although Australian survey data for thecommercial sector were also used. The UK estimates are derived from a questionin the British Crime Survey (BCS) that asked victims the amount of time theyhad to take off work.2 The assumption is made that the impact of these offences inAustralia is similar to that in the UK (there is discussion of this shortly).
1 Paid work is valued at average market earnings (plus labour “add-on” costs), with account taken of annual future productivitygains. Earnings specific to age and gender are applied to the estimated number of years a victim would have remained in thelabour force.
2 This was multiplied by the average wage rate from the 1999 New Earning Survey, with a factor added for employment “on-costs”.

12 Australian Institute of Criminology
Intangible Costs
Intangible costs of crime (such as fear, pain, suffering and lost quality of life) do notreflect any resource use, but are now usually included as a legitimate cost to estimate.Nonetheless, estimates of intangible costs are the most tenuous. Three main approachesto estimate them have been taken in costs of crime work elsewhere. There is no specificAustralian material.3
(i) Willingness to Pay
The “willingness to pay” (WTP) approach estimates intangible losses in terms of theamount that individuals are prepared to pay to reduce risks (either of dying or avoidingharm). The WTP approach is now fairly common in many countries in costing socialharms, particularly road accidents. It has featured less in Australia. People’s preferencescan be either stated or revealed (for instance by differentials in house prices in safe andunsafe neighbourhoods).
The use of stated preferences (or “contingent valuation”) is more common. The mainbenefit of this WTP approach is that it is based on a subjective assessment of whatpeople feel is the value of avoiding harm. A main criticism is that the public may bemisinformed about the extent and severity of the risk they confront, so that WTP forincreased safety may be higher than it needs to be based on actual risks. Anothercriticism is that answers can depend on whether respondents think they would have topay for increased safety (for example, through higher taxation). A third criticism is thatit is often unclear whether WTP figures include all or part of income and productionlosses, or just impaired quality of life.
(ii) Compensation Awards
This second approach measures intangible losses through jury or court awards for non-economic compensation to victims (or their survivors). An advantage is that awards areex post, reflecting the value of harm “after the fact” rather than the ex ante assessment inWTP figures. One criticism is that juries can make unreasonably high awards or reachcapricious judgments—though the evidence for this is less strong than might be thought(Cohen 2001a). In any event, the compensation award approach to costing intangiblelosses in road accident work generally gives much lower figures than contingentvaluation WTP figures.
Costs of crime work from the United States takes a jury award approach, and does so onthe basis of civil lawsuits in criminal injury cases (the US being litigious enough toproduce sufficient information). This is considerably better as regards what is “fair”
3 A survey of crime victims in Victoria in 1993–94 conducted by the Victorian Community Council Against Violence (1994)covered indirect losses, but does not provide precise enough information from which to extrapolate. It showed that almost halfof victims reported financial losses as a consequence of victimisation. Victims of attempted murder and burglary experiencedthe higher losses. About half of victims of robbery and assault experienced financial loss. The most common losses were fromlost income. Other losses included travelling expenses, replacing clothing and, in some cases, selling a business.
13AIC Technical and Background Paper Series
Counting the Costs of Crime in Australia: Technical Report
compensation than data from Criminal Injuries Compensation (CIC) awards would be.This is because both the economic and non-economic element of CIC awards is cappedby legislation, and—being funded from the public purse—is generally fairly low(Freckelton 2001). Moreover, in many Australian CIC schemes psychological harm isspecifically excluded.
(iii) Victims’ Desired Compensation
This is an unusual approach, apparently limited to the UK’s British Crime Survey(BCS), in which victims were asked to say what their desired compensation would be toaccount for the physical and emotional impact of what had happened. The questionwas: “Apart from your financial losses, what would be a reasonable financial sum tocompensate you for the upset and inconvenience you and/or your household suffered?”
For this study, intangible losses in violent crime and robbery incidents with injury arelinked to figures from compensation awards taken by BTE in costing road accidents.4
This is not ideal since the circumstances and consequences of criminal and road accidentinjury may differ. But it is much better than trying to use Criminal InjuryCompensation award figures since awards for road accidents are essentially funded bycompulsory third-party insurance, not by what state governments feel they can afford.
Because MUARC did not assess intangible costs, the ratio of BTE’s intangible costs totheir lost output costs for road fatalities and accidents requiring medical treatment wereapplied to MUARC’s lost output figures to given estimates of the intangible costs ofviolence. For instance, BTE shows a figure of intangible losses in slight and serious roadaccidents of nearly $5,500 at current prices. Their lost output figure was about $5,200,making the ratio 1.059. This was applied to MUARC’s lost output figure for non-fatalinterpersonal violence, which was also just over $5,000.
For property crime (and no-injury assaults and robberies), the UK estimates from BCSfigures on victims’ desired financial compensation were adapted.
Inflation
Cost figures for Australia in previous years are adjusted by means of the AustralianNational Accounts Chain Price Index for final consumption expenditure. This takesaccount of price changes across the whole economy (for example, wages), not justtradeable goods.
4 Intangible costs were assessed for death or injury by reference to compensation payments from the Victorian TransportAccidents Commission with additional adjustments made on the basis of New South Wales and Queensland data to accountfor reductions in awards due to other compensation having been paid through insurance (BTE 2000). Intangible costs borneby relatives and friends of crash victims are not costed by BTE.
14 Australian Institute of Criminology
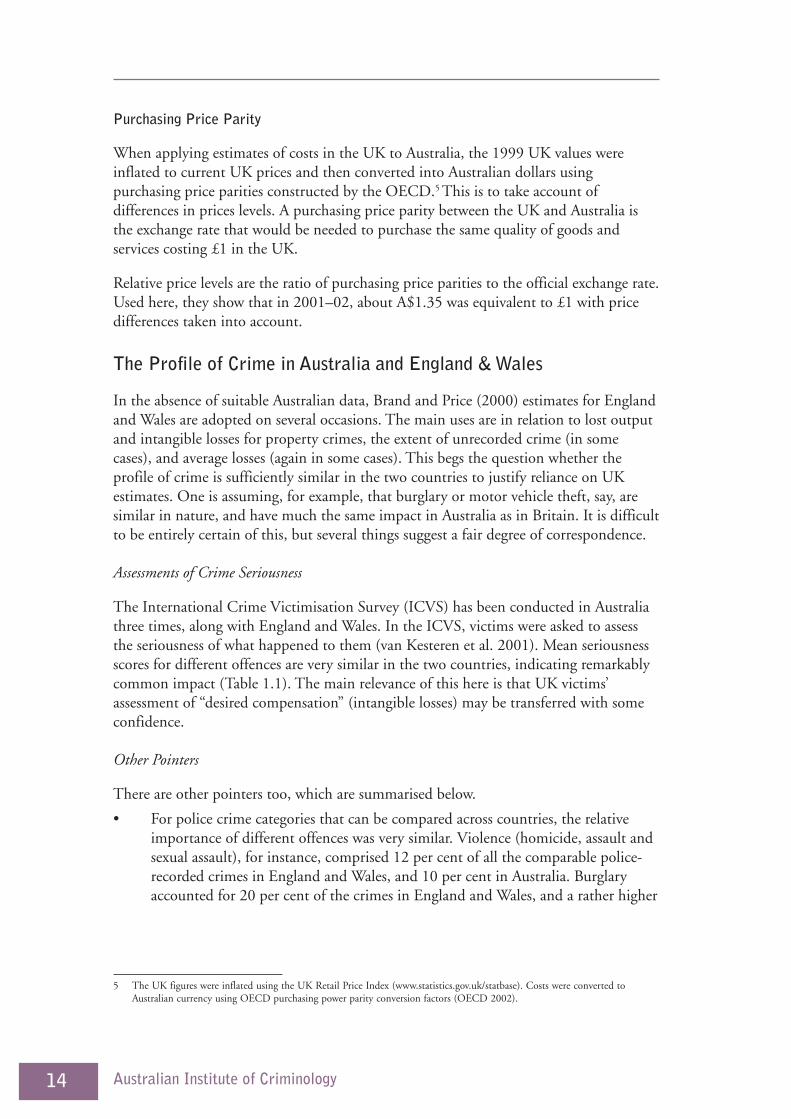
Purchasing Price Parity
When applying estimates of costs in the UK to Australia, the 1999 UK values wereinflated to current UK prices and then converted into Australian dollars usingpurchasing price parities constructed by the OECD.5 This is to take account ofdifferences in prices levels. A purchasing price parity between the UK and Australia isthe exchange rate that would be needed to purchase the same quality of goods andservices costing £1 in the UK.
Relative price levels are the ratio of purchasing price parities to the official exchange rate.Used here, they show that in 2001–02, about A$1.35 was equivalent to £1 with pricedifferences taken into account.
The Profile of Crime in Australia and England & Wales
In the absence of suitable Australian data, Brand and Price (2000) estimates for Englandand Wales are adopted on several occasions. The main uses are in relation to lost outputand intangible losses for property crimes, the extent of unrecorded crime (in somecases), and average losses (again in some cases). This begs the question whether theprofile of crime is sufficiently similar in the two countries to justify reliance on UKestimates. One is assuming, for example, that burglary or motor vehicle theft, say, aresimilar in nature, and have much the same impact in Australia as in Britain. It is difficultto be entirely certain of this, but several things suggest a fair degree of correspondence.
Assessments of Crime Seriousness
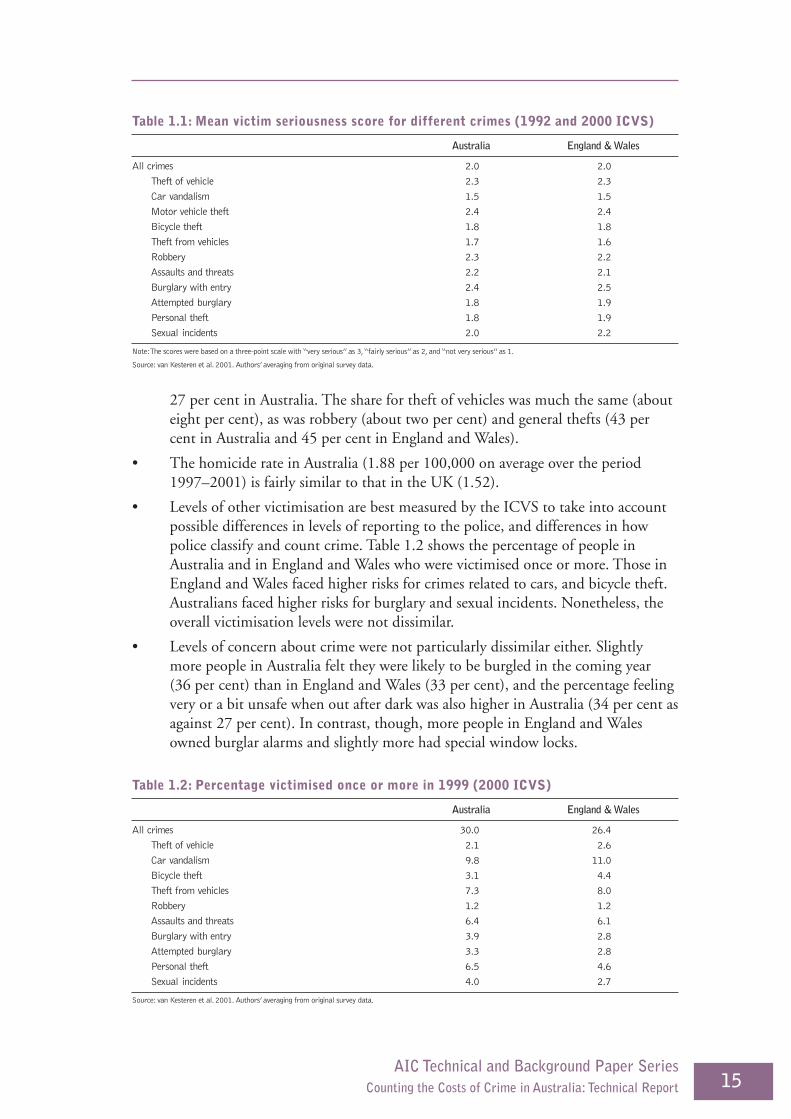
The International Crime Victimisation Survey (ICVS) has been conducted in Australiathree times, along with England and Wales. In the ICVS, victims were asked to assessthe seriousness of what happened to them (van Kesteren et al. 2001). Mean seriousnessscores for different offences are very similar in the two countries, indicating remarkablycommon impact (Table 1.1). The main relevance of this here is that UK victims’assessment of “desired compensation” (intangible losses) may be transferred with someconfidence.
Other Pointers
There are other pointers too, which are summarised below.
• For police crime categories that can be compared across countries, the relativeimportance of different offences was very similar. Violence (homicide, assault andsexual assault), for instance, comprised 12 per cent of all the comparable police-recorded crimes in England and Wales, and 10 per cent in Australia. Burglaryaccounted for 20 per cent of the crimes in England and Wales, and a rather higher
5 The UK figures were inflated using the UK Retail Price Index (www.statistics.gov.uk/statbase). Costs were converted toAustralian currency using OECD purchasing power parity conversion factors (OECD 2002).
15AIC Technical and Background Paper Series
Counting the Costs of Crime in Australia: Technical Report
27 per cent in Australia. The share for theft of vehicles was much the same (abouteight per cent), as was robbery (about two per cent) and general thefts (43 percent in Australia and 45 per cent in England and Wales).
• The homicide rate in Australia (1.88 per 100,000 on average over the period1997–2001) is fairly similar to that in the UK (1.52).
• Levels of other victimisation are best measured by the ICVS to take into accountpossible differences in levels of reporting to the police, and differences in howpolice classify and count crime. Table 1.2 shows the percentage of people inAustralia and in England and Wales who were victimised once or more. Those inEngland and Wales faced higher risks for crimes related to cars, and bicycle theft.Australians faced higher risks for burglary and sexual incidents. Nonetheless, theoverall victimisation levels were not dissimilar.
• Levels of concern about crime were not particularly dissimilar either. Slightlymore people in Australia felt they were likely to be burgled in the coming year(36 per cent) than in England and Wales (33 per cent), and the percentage feelingvery or a bit unsafe when out after dark was also higher in Australia (34 per cent asagainst 27 per cent). In contrast, though, more people in England and Walesowned burglar alarms and slightly more had special window locks.
Table 1.1: Mean victim seriousness score for different crimes (1992 and 2000 ICVS)
Australia England & Wales
All crimes 2.0 2.0
Theft of vehicle 2.3 2.3
Car vandalism 1.5 1.5
Motor vehicle theft 2.4 2.4
Bicycle theft 1.8 1.8
Theft from vehicles 1.7 1.6
Robbery 2.3 2.2
Assaults and threats 2.2 2.1
Burglary with entry 2.4 2.5
Attempted burglary 1.8 1.9
Personal theft 1.8 1.9
Sexual incidents 2.0 2.2
Note: The scores were based on a three-point scale with “very serious” as 3, “fairly serious” as 2, and “not very serious” as 1.
Source: van Kesteren et al. 2001. Authors’ averaging from original survey data.
Table 1.2: Percentage victimised once or more in 1999 (2000 ICVS)
Australia England & Wales
All crimes 30.0 26.4
Theft of vehicle 2.1 2.6
Car vandalism 9.8 11.0
Bicycle theft 3.1 4.4
Theft from vehicles 7.3 8.0
Robbery 1.2 1.2
Assaults and threats 6.4 6.1
Burglary with entry 3.9 2.8
Attempted burglary 3.3 2.8
Personal theft 6.5 4.6
Sexual incidents 4.0 2.7
Source: van Kesteren et al. 2001. Authors’ averaging from original survey data.

16 Australian Institute of Criminology
2 Studies Drawn Upon
This section describes some of the main studies drawn upon in this Australian cost ofcrime work.
Australian Studies
The Australian Crime and Safety Survey
The Australian Crime and Safety Survey (CSS) is used as the basis of many of the surveyfigures in this study. It was conducted by the Australian Bureau of Statistics in April1998 and measured crime over the previous 12 months (May 1997 to April 1998). Anationally representative sample of 42,200 people aged 15 or more provided self-completed questionnaires. This represented a response rate of 82 per cent (see ABS1999). The crimes asked about were rather more restricted than the British CrimeSurvey, covering burglary and attempts, theft of motor vehicles, robbery, assault, andsexual assault (women only). Details of what happened (such as injury or weapon use,for example) were collected for the last incident experienced, if there was more than one.
The main use of the survey here is for an alternative count of the “real” number ofoffences, which was discussed in detail in section 1. For comparisons with police figures,some adjustments are needed for offences involving personal victims to account for thefact that the CSS excludes young victims.
Other uses made of survey results are described at relevant points below. (For instancethe proportion of people injured in assault and robbery incidents is used in estimatingmedical costs.) A limitation of the survey is the lack of information on financial lossesfrom property theft and damage. The CSS has been repeated in 2002, but results are notyet available.
Women’s Safety Survey
An alternative estimate of the extent of assault and sexual assault against women isavailable from the Women’s Safety Survey (WSS). Conducted by the ABS early in 1996,it took a more “bespoke” approach to measuring violence and sexual assaults againstwomen (ABS 1996). It covered the experiences of women aged 18 or more.
The WSS results are not particularly in line with those from the CSS—illustrating thesensitivity of survey figures to measurement approaches (cf. Percy & Mayhew 1997).The WSS shows that 5.9 per cent of women were assaulted once or more in 1995(including attempts and threats). The equivalent figure from the CSS is lower, at 3.9 percent. For sexual assaults, the difference is more pronounced still, with a WSS figure of1.5 per cent—three times higher than the CSS figure of 0.4 per cent. Question wording
17AIC Technical and Background Paper Series
Counting the Costs of Crime in Australia: Technical Report
may explain some of the difference in the figures, but other factors will be the greaternumber of “prompts” in the WSS, and the fact that it was presented as solely concernedwith women’s safety. (The slight time difference between the surveys is unlikely to be afactor.)
Although the WSS may well lay claim to providing multipliers for assault and sexualassault, the CSS is nonetheless used in the present study. The CSS covers both men andwomen, and is consistently used as the basis of multipliers for other property crime inthis report. The 2002 repeat of the survey will in due course provide new data formultipliers.
Queensland Victim Survey
This 1991 survey of 6,300 Queensland householders is the only survey in Australia toproduce figures on the costs of property theft and damage to victims (QueenslandGovernment Statistician’s Office 1992). The losses are banded and this makes it difficultto set a value for $1,000 loss or more. Some use, nonetheless, is made of the Queenslandsurvey.
Small Business Crime Survey
Some use is made of a 1999 postal survey by the Australian Institute of Criminologythat covered crimes in 1998–99 against a nationally representative sample of 3,850 smallretailers (see Taylor & Mayhew 2002a). (Small retailers have fewer than 20 employeesand form the vast majority of retailers in Australia.) Retailers were asked about directand indirect losses, and the amount spent on crime prevention measures in the past year(Taylor & Mayhew 2002b). The response rate was 16 per cent.
1997 Retail Crime and Safety Survey (South Australia)
Commissioned by the South Australian Attorney-General’s Department, this surveycovered 445 businesses in a number of areas of retail activity, including 22 supermarketswith a turnover of $20 million or higher, and 21 major department stores and discountdepartment stores (Attorney-General 1998).
National Survey of Crime against Businesses
Another survey inspected but not used much was the Australian National Survey ofCrime against Business. The NSCB was conducted by the Australian Institute ofCriminology in 1993 and covered the victimisation experiences of a relatively smallsample of 1,000 retailers, manufacturers, primary industries, and tourism/recreationoperators (see Walker 1994, 1995).6 No response rate is given but this is probably less ofa difficulty than the small sample size.
6 Costs covered were the direct losses, security costs, indirect losses due to crime, and “leakage and shrinkage” (unexplainedstock losses including crime incidents already mentioned).
18 Australian Institute of Criminology
Monash University Accident Research Centre (MUARC) Study
MUARC studied the costs of fatal, hospitalised and non-hospitalised cases ofinterpersonal violence with injury in 1993–94 in Victoria (Watson & Ozanne-Smith1997). They were based on 57 fatalities and just over 20,800 non-fatal incidents, ofwhich 14 per cent were treated in hospital. MUARC included medical costs relating tothe treatment of injury (direct costs), and lost output costs relating to the loss or partialloss of the productive efforts of injury victims, and caregivers in the case of children. Noattempt was made to value other services of family and friends in caring for the injured,because of lack of data. However, this “informal care” cost is thought to be significant.
Loss of productivity was estimated in terms of earnings and labour on-costs of injuryvictims, the unpaid contribution of victims to their households and communities, andproductive time lost by caregivers of child injury victims. As said, MUARC’s socialdiscount rate was changed. No estimate was made for intangible losses.
Bureau of Transport Economics (BTE): Road Crash Costs
BTE did a comprehensive study of the cost of road accidents in Australia in 1996 (BTE2000). Costs are assessed for fatal, serious injury, minor injury, and property-damage-only accidents (which form the vast majority). There is an impressive array of costcomponents, but only lost output and intangible losses are drawn on here.7 Intangiblelosses were assessed through compensation paid to crash victims.
UK Studies
Brand and Price
The Social and Economic Costs of Crime (Brand & Price 2000) is a detailed assessment ofthe costs of crime in England and Wales in 1999 (referred to as the “UK estimates”hereon). They draw heavily on British Crime Survey (BCS) figures to estimate the “real”level of crime and thus give multipliers for police figures. The BCS also collects detailson the gross and net costs of criminal victimisation, and on victims’ desiredcompensation. These were used in the UK work to get the intangible cost of propertycrime and no-injury assaults. (The intangible costs of violent crime were based on UKfigures relating to road traffic accidents, based on a “willingness to pay” methodology—DETR 1999).8
Brand and Price treat insurance as a transfer cost, not a loss to society (as is done here).However, they take account of the cost to insurers of administering claims and—unlikethe current study—they do this in relation to individual crime types. Criminal justice
7 They included medical costs, workplace and household labour, intangible costs, legal services, workplace disruption, vehiclerepairs, travel delays and insurance administration.
8 The intangible cost of a homicide was set to the same value as a fatal road accident, the cost of a serious assault to a seriousroad accident, and a more minor assault to a more minor accident.
19AIC Technical and Background Paper Series
Counting the Costs of Crime in Australia: Technical Report
system costs were apportioned to different crimes principally on the basis of informationfrom a Flows and Costs Model. Victim services are also apportioned across differentcrimes.9
The main offences covered in the UK study were homicide, assault, sexual offences,robbery, burglary, thefts of and from vehicles, other theft, shoplifting, criminal damage,speeding offences, some other traffic offences, and drug offences. Fraud and forgerywere also covered, drawing on a special study by National Economic Research Associates(NERA 2000).
In terms of findings, the Brand and Price study showed intangible costs were about30 per cent of total costs, violent crime just over a third and fraud just under a quarter.
UK Commercial Crime Survey
Brand and Price also drew on results from the Commercial Crime Survey (CCS), whichsurveyed about 3,000 retailers and manufacturers in 1994 (Mirrlees-Black & Ross1995). The CCS used essentially the same questionnaire as the Australian NationalSurvey of Crimes against Businesses (Walker 1994, 1995), although this last coveredadditional sectors but with a much smaller sample. The CCS assessed gross financiallosses for the most part.
Scottish Business Crime Survey
This looked at the nature and costs of crime affecting Scottish businesses during 1998(Burrows et al. 1999). There were phone interviews with some 2,500 businesses, as wellas a postal “head office” survey of 150 large businesses. A useful feature was that fivebusiness sectors were covered: manufacturing, construction, wholesale and retail, hotelsand restaurants, and communications.
United States Studies
Miller, Cohen and Wiersema
A key US study on the costs of crime was sponsored by the National Institute of Justice(Miller, Cohen & Wiersema 1996). The “real” level of crime was taken largely from thenumber of victimisations in 1987 and 1990 measured by the National CrimeVictimisation Survey (NCVS). Much cost information also came from the NCVS.
Little direct use is made of this US study since estimates of some unit costs will differsimply because of the greater involvement of firearms. Social welfare arrangements alsodiffer. Nonetheless, some key features of the US estimates are worth mentioning.
9 Brand and Price used total financial support for victims from government, together with assumptions about the cost ofvolunteer time, to get an estimate of overall resource costs. These were allocated to different offence types of the basis of a BCSmeasure of relative seriousness. The total amount spent per crime was then divided by the estimated number of crimes to get aunit cost.
20 Australian Institute of Criminology
10 They were derived taking account of lost wages, fringe benefits, housework, and school days lost by victims and families. Thecosts also include lost productivity by co-workers. NCVS data are used as the initial basis for many of the calculations,although adjusted in various ways to take account of age and employment status, and the ratio of short-term costs (measuredby the NCVS) and longer-term ones.
11 Claims administration costs were added to property loss, with an estimate of 16 per cent added to incidents where losses wereinsured. For violent crime, insurance administration costs are subsumed under medical costs, and are based on a percentage ofthe medical costs covered under health insurance policies, and a percentage of workers’ compensation-related cases.
• Medical costs were mainly calculated using NCVS information on the nature ofinjuries and medical data on costs for given injuries.
• Mental health costs were assessed through a special study of mental healthprofessionals. (Brand and Price do not directly estimate mental health costs.)
• Costs of reduced productivity were included, and were complex.10
• Intangible losses for fatalities were based on a synthesis of estimates of the amountpeople routinely spend to reduce risk of death. For non-fatal injuries, costs aremainly based on jury awards in civil lawsuits to victims of physical and sexualassault (less punitive damages).
• An essentially similar approach was taken in handling insurance in relation tolosses.11
• There was some costing of victim support agencies, but no account was taken ofvoluntary services to victims.
• The US study excludes the cost of society’s response to crime (that is, privatesecurity expenditure) and criminal justice costs (with the exception of the costs ofthe initial police and fire service response).
The crimes covered are similar to those in the Brand and Price UK study, includinghomicide, assault, rape and sexual assault, robbery, larceny, burglary, and motor vehicletheft. The US study also covers arson (but not criminal damage), child abuse and drunkdriving (but not other traffic offences). There is no assessment of the costs of fraud ordrug abuse.
In terms of findings, the study produced very high intangible costs—more than 75 percent of total costs—much higher than the UK study. The cost of violent crime was alsovery high—more than 80 per cent of the total, and again much higher than in the UKstudy. The greater role of firearms in violence in the United States may play a part here.

21AIC Technical and Background Paper Series
Counting the Costs of Crime in Australia: Technical Report
3 Homicide
The Number of Homicides
The term homicide covers murder, attempted murder, manslaughter and driving causingdeath (unlawful killing through culpable, dangerous or negligent driving). In the presentstudy, though, attempted murder is costed as assault.
There were 589 homicides in Australia in 2001 (and 458 attempts). It is assumed allhomicides were known to the police—that is, there is a multiplier of 1.0. It is possiblethat the number of homicides is an underestimate. For instance, missing persons whosebodies have not been recovered may have been murdered. There could also be someundercounting of child deaths since the view is held that some children who allegedlydie of Sudden Infant Death Syndrome are actually abuse victims.
Medical Costs
MUARC costs suggest the present-day medical cost of a homicide is $7,600 or, on thebasis of the number of homicides in 2001, $4.5 million overall.
Lost Output
There is a much larger cost from lost output (the present value of foregone lifetimeearnings). It is estimated to be about $1.2 million per incident, or over $700 millionoverall (Table 3.1). Young persons just entering the workforce who die lose more yearsof life, and so the average cost for victims aged between 15 and 24 amounts to about$1.6 million.
Intangible Losses
An estimate was made here. As explained, BTE’s calculations of the value of intangiblelosses based on compensation payments for road accident fatalities were used as thestarting point. In the absence of anything better, the ratio of BTE’s quality of life figureto BTE’s lost output figure for fatal road accidents (0.32) was applied to MUARC’s lostoutput figure for homicide. This discounts the fact that the circumstances andconsequences of road accident fatalities and homicides may differ. The intangible costper homicide emerges at $400,000, or $225 million overall (Table 3.1).
Total Costs
The estimated total cost of homicide is $930 million.
22 Australian Institute of Criminology
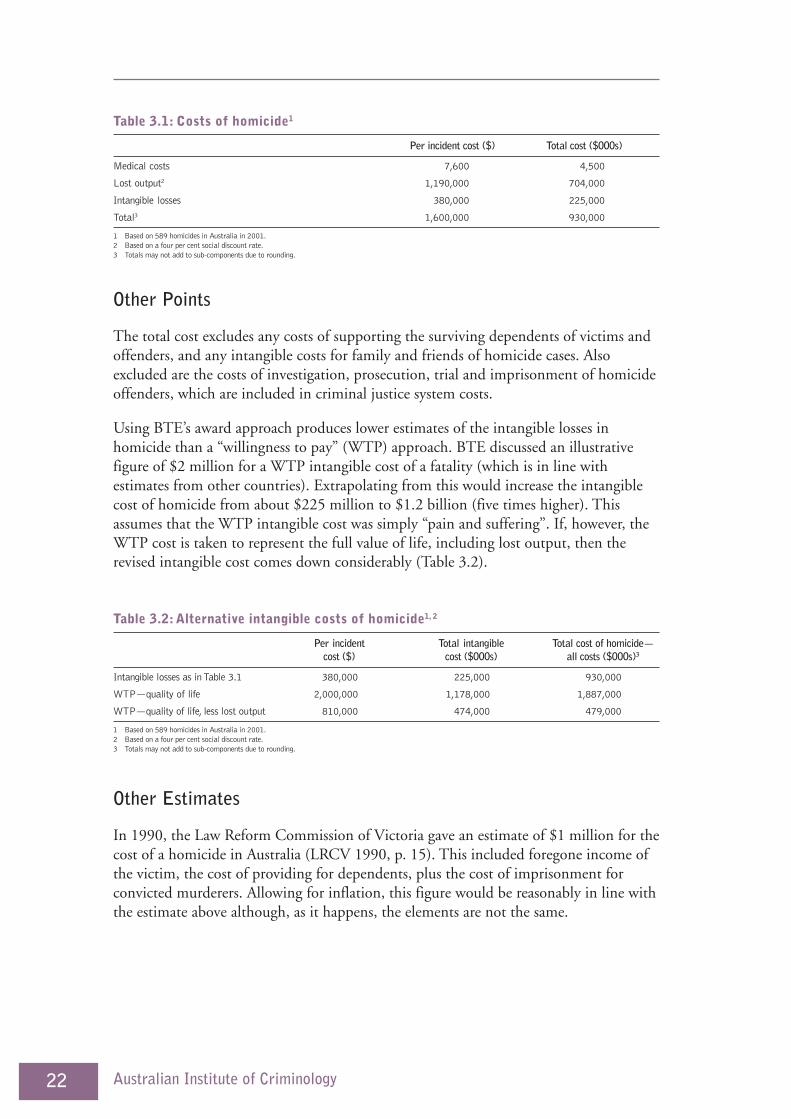
Other Points
The total cost excludes any costs of supporting the surviving dependents of victims andoffenders, and any intangible costs for family and friends of homicide cases. Alsoexcluded are the costs of investigation, prosecution, trial and imprisonment of homicideoffenders, which are included in criminal justice system costs.
Using BTE’s award approach produces lower estimates of the intangible losses inhomicide than a “willingness to pay” (WTP) approach. BTE discussed an illustrativefigure of $2 million for a WTP intangible cost of a fatality (which is in line withestimates from other countries). Extrapolating from this would increase the intangiblecost of homicide from about $225 million to $1.2 billion (five times higher). Thisassumes that the WTP intangible cost was simply “pain and suffering”. If, however, theWTP cost is taken to represent the full value of life, including lost output, then therevised intangible cost comes down considerably (Table 3.2).
Table 3.1: Costs of homicide1
Per incident cost ($) Total cost ($000s)
Medical costs 7,600 4,500
Lost output2 1,190,000 704,000
Intangible losses 380,000 225,000
Total3 1,600,000 930,000
1 Based on 589 homicides in Australia in 2001.2 Based on a four per cent social discount rate.3 Totals may not add to sub-components due to rounding.
Other Estimates
In 1990, the Law Reform Commission of Victoria gave an estimate of $1 million for thecost of a homicide in Australia (LRCV 1990, p. 15). This included foregone income ofthe victim, the cost of providing for dependents, plus the cost of imprisonment forconvicted murderers. Allowing for inflation, this figure would be reasonably in line withthe estimate above although, as it happens, the elements are not the same.
Table 3.2: Alternative intangible costs of homicide1, 2
Per incident Total intangible Total cost of homicide—cost ($) cost ($000s) all costs ($000s)3
Intangible losses as in Table 3.1 380,000 225,000 930,000
WTP—quality of life 2,000,000 1,178,000 1,887,000
WTP—quality of life, less lost output 810,000 474,000 479,000
1 Based on 589 homicides in Australia in 2001.2 Based on a four per cent social discount rate.3 Totals may not add to sub-components due to rounding.
23AIC Technical and Background Paper Series
Counting the Costs of Crime in Australia: Technical Report
4 Assault
Assaults Recorded by the Police
The ABS defines assault as the direct infliction of force, injury or violence, includingattempts and threats, provided the attempts/threats are in the form of a face-to-facedirect confrontation and there is reason to believe that the attempts/threats can beimmediately enacted.
There were 151,573 recorded assaults in Australia in 2001. The police also recorded 458attempted homicides, which are dealt with here.
Crime and Safety Survey
Assaults in the CSS are incidents other than robbery involving the use, attempted use orthreat of force or violence. Victims are asked whether they were injured (one-fifth were).If injured, they were asked whether they went to hospital, but not otherwise whetherthey had medical treatment.
Estimating the Number of Assaults
The CSS count of assault may well be inflated relative to police figures, even takingaccount of non-reporting. One reason is threats. Although threats are in principleincluded in police figures, the police probably take a conservative approach to recordingall threats brought to their attention. Another reason why CSS figures may be inflated ismultiple victimisation—this can be very pronounced in relation to assault. Thus, whilevictims may say they have been victimised several times (by the same person in allprobability), it is likely that if they go to the police, the police will not record the “facevalue” of the number of incidents, especially if they believe the incidents are highlyrelated.
Adjusting only for age coverage, the difference between CSS and police figures forassault in 1997–98 would, on the face of it, suggest a large multiplier. To get a morecautious multiplier, the number of victims of assault was taken, rather than the numberof incidents. This produces a multiplier of 5.3. This is reasonably in line with the UKmultiplier, which is 7.
CSS results allow a distinction to be made between assaults requiring hospitalisation(two per cent of the total), those in which there was some other injury (19 per cent),and those with no injury (79 per cent). They have different probabilities of beingreported to the police, as one would expect. Table 4.1 shows these, and the “multipliers”that have been calculated.

24 Australian Institute of Criminology
Applying the multiplier to the total number of assaults in 2001 produces an estimatedtotal of 810,000 assaults (Table 4.2). This includes 458 attempted homicides, for whichno multiplier has been applied.
Table 4.1: Multipliers for assault
No. of CSS assaults Probability Police-recorded Multiplier3
1997–981 of reporting assaults, 1997–982
Hospital 13,300 0.65 8,600 1.5
Other injury 115,000 0.38 34,800 3.3
No injury 490,000 0.24 72,900 6.7
Total4 618,000 0.24 116,300 5.3
1 Based on victims, not incidents. Victims over 15.2 Injury and non-injury assaults are estimated. Victims over 15.3 Different probabilities of being recorded if reported have been set for injury and non-injury incidents.4 Totals may not add to sub-components due to rounding.
Medical Costs
MUARC’s figures (see earlier) suggest the present-day medical cost of assault requiringhospitalisation is about $8,700, and an assault treated outside hospital about $400 (seeTable 4.3). Other than being asked whether they had been to hospital, injured victimsin the CSS were not actually asked if they had required medical treatment. Brand andPrice, however, cover this and their results are extrapolated here. (Three in 10 of thoseinjured are estimated to have had medical attention.)
Averaged over all assaults, the medical cost was just over $200 on average, with theoverall medical cost for assaults about $170 million.
Lost Output
MUARC’s costs for lost output are applied to those who had medical treatment. Thelost output of those who were injured, but not treated, is set at a quarter of the cost ofthose treated outside hospital. UK estimates suggest that no-injury assaults (whichBrand and Price call “common assaults”) carry some lost output cost, but a small one.The UK figure is adopted here.
Table 4.2: Estimated number of assaults in 2001
Assaults recorded by Total estimatedthe police, 20011 assaults
Hospital 11,700 18,000
Other injury 45,500 151,000
No injury 95,400 641,000
Total2 152,200 810,000
1 Including victims under 15. Injury and non-injury assaults are estimated. Attempted homicides are included in hospital assaults.2 Totals may not add to sub-components due to rounding.
25AIC Technical and Background Paper Series
Counting the Costs of Crime in Australia: Technical Report
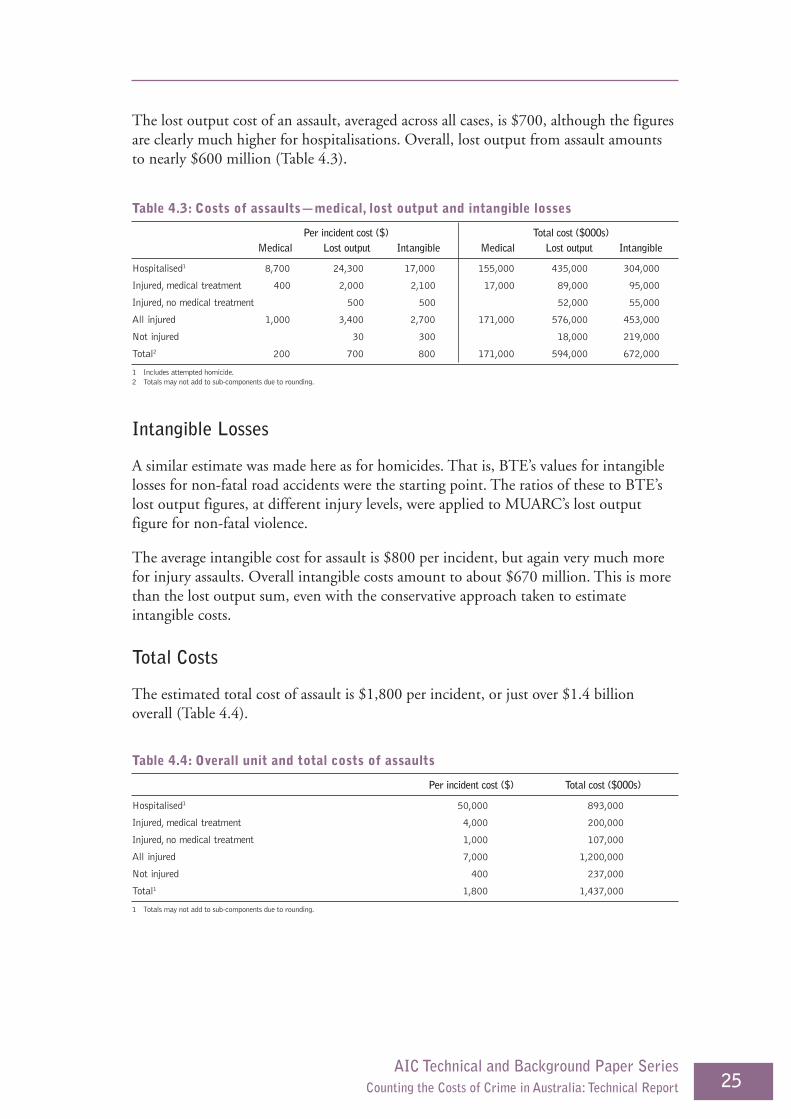
The lost output cost of an assault, averaged across all cases, is $700, although the figuresare clearly much higher for hospitalisations. Overall, lost output from assault amountsto nearly $600 million (Table 4.3).
Intangible Losses
A similar estimate was made here as for homicides. That is, BTE’s values for intangiblelosses for non-fatal road accidents were the starting point. The ratios of these to BTE’slost output figures, at different injury levels, were applied to MUARC’s lost outputfigure for non-fatal violence.
The average intangible cost for assault is $800 per incident, but again very much morefor injury assaults. Overall intangible costs amount to about $670 million. This is morethan the lost output sum, even with the conservative approach taken to estimateintangible costs.
Total Costs
The estimated total cost of assault is $1,800 per incident, or just over $1.4 billionoverall (Table 4.4).
Table 4.3: Costs of assaults—medical, lost output and intangible losses
Per incident cost ($) Total cost ($000s)Medical Lost output Intangible Medical Lost output Intangible
Hospitalised1 8,700 24,300 17,000 155,000 435,000 304,000
Injured, medical treatment 400 2,000 2,100 17,000 89,000 95,000
Injured, no medical treatment 500 500 52,000 55,000
All injured 1,000 3,400 2,700 171,000 576,000 453,000
Not injured 30 300 18,000 219,000
Total2 200 700 800 171,000 594,000 672,000
1 Includes attempted homicide.2 Totals may not add to sub-components due to rounding.
Table 4.4: Overall unit and total costs of assaults
Per incident cost ($) Total cost ($000s)
Hospitalised1 50,000 893,000
Injured, medical treatment 4,000 200,000
Injured, no medical treatment 1,000 107,000
All injured 7,000 1,200,000
Not injured 400 237,000
Total1 1,800 1,437,000
1 Totals may not add to sub-components due to rounding.

26 Australian Institute of Criminology
Omissions
These are much as for homicide (see above). There is probably also a considerablehidden cost relating to child abuse by adult carers that escapes the administrative recordsof the police.
There is no separate costing for domestic violence, although there is some account takenlater of services for victims (such as women’s refuges). Laing and Bobic (2002) haverecently drawn together various Australian studies on the economic cost of domesticviolence. They identify five main costs, although not surprisingly they differ inmethodology, the types of costs covered, and the estimated prevalence rate for domesticviolence—which is a key issue in assessing costs.
27AIC Technical and Background Paper Series
Counting the Costs of Crime in Australia: Technical Report
5 Sexual Assault
Sexual Assaults Recorded by the Police
The ABS defines sexual assault as physical assault of a sexual nature directed at someonewho:
1. does not give consent;
2. gives consent as a result of intimidation or fraud; or
3. is deemed incapable of giving consent.
There were nearly 16,750 sexual assaults recorded in Australia in 2001, with 83 per centperpetrated against females.
Crime and Safety Survey
Sexual assaults in the CSS are incidents of a sexual nature involving physical contact,including rape, attempted rape, indecent assault, and assault with intent to sexuallyassault. (Sexual harassment is excluded.) Only women aged 18 or more were asked aboutsexual assault.
Although survey definitions are modelled on those used by the police, incidentsrecorded by the police may differ somewhat to those revealed in surveys. On balance,incidents recorded by the police may be rather more serious.
Estimating the Number of Sexual Assaults
Police figures for the CSS period were taken for women only, and an adjustment madefor the survey age coverage. The multipliers, then, were based on adult females butapplied to all sexual assaults recorded by the police in 2001, assuming similar hiddencrime against men and younger people.
The difference between CSS incidents and police figures for sexual assault would on theface of it suggest a multiplier of 8.8. As with assault, a more cautious multiplier wastaken, based on victims of assault, producing a multiplier of 5.6.12
CSS results show that about one-fifth of sexual assaults involved injury, but there is noinformation on whether hospitalisation or medical treatment was necessary. Nor doesthe CSS show reporting levels by injury level, but a differential was estimated. Table 5.1shows the resulting multipliers.
12 The UK multiplier was 3.5, but this will be low as it is based on the British Crime Survey in which the main count of sexualoffences is thought to be low (see Myhill & Allen 2002).

28 Australian Institute of Criminology
Applying the multiplier to the total number of sexual assaults in 2001 produces anestimated total of about 93,000 sexual assaults (Table 5.2).
Table 5.2: Estimated number of sexual assaults in 2001
Sexual assaults recorded Total estimatedby the police, 20011 sexual assaults
Injury 7,800 21,700
No injury 8,900 71,600
Total2 16,700 93,300
1 Injury and non-injury assaults are estimated. Including victims under 18 and males.2 Totals may not add to sub-components due to rounding.
Medical Costs
The injury costs were taken from assault figures. This gives the present-day medical costof a sexual assault with injury as $1,000 (Table 5.3). Overall, the medical costs were$22 million.
Table 5.1: Multipliers for sexual assault
No. of CSS sexual assaults Probability Police-recorded sexual Multiplier1997–981, 2 of reporting3 assaults, 1997–982
Injury 7,000 0.60 2,500 2.8
No injury 23,100 0.24 2,900 8.0
Total4 30,100 0.33 5,400 5.6
1 Based on victims not incidents. Female victims over 18.2 Injury and non-injury assaults are estimated. Female victims over 18. Different probabilities of being recorded if reported have been set for injury and non-injury incidents.3 Estimated.4 Totals may not add to sub-components due to rounding.
Table 5.3: Costs of sexual assaults—medical, lost output and intangible losses
Per incident cost ($) Total cost ($000s)Medical Lost output Intangible Medical Lost output Intangible
Injury 1,000 4,500 3,600 22,000 99,000 78,000
No injury – 40 500 – 3,000 32,000
Total1 200 1,100 1,200 22,000 101,000 110,000
1 Totals may not add to sub-components due to rounding.
Lost Output
The lost output costs were again based on assault figures. However, it is quite possiblethat the impact of sexual offences is greater, on average, than assault. One empirical clueto this is from the International Crime Victimisation Survey (ICVS), in which victimsin 17 industrialised countries were asked to assess the seriousness of what happened tothem. For sexual assault victims, 54 per cent judged it “very serious” as against 41 per

29AIC Technical and Background Paper Series
Counting the Costs of Crime in Australia: Technical Report
cent of victims of assault—suggesting a weighting factor of about one-third (see vanKesteren et al. 2001, p. 44). This has been applied here to both lost output andintangible costs for sexual assaults to inflate them relative to non-sexual assault.
The unit cost of a sexual assault due to lost productive potential is $1,100 averagedacross all incidents, or about $4,500 for a sexual assault with injury. Overall, lost outputfrom sexual assault amounts to about $100 million (Table 5.3).
Intangible Losses
The figures for intangible losses from assaults were adapted for sexual assault, butinflated by one-third to account for a probably greater emotional toll. The overallaverage intangible cost for sexual assault is $1,200 per incident, with an overall cost of$110 million (Table 5.3).
Total Costs
The estimated total cost of sexual assault is in Table 5.4, amounting to just over$230 million. The average incident cost is $2,500.
Other Points
Sexual offences will differ in seriousness. Rape will generally incur the biggest humancosts. There seems to be no guide from other work, though, as to the cost of raperelative to other sexual assault.
Table 5.4: Overall unit and total costs of sexual assaults
Per incident cost ($) Total cost ($000s)
Injury 9,100 199,000
No injury 500 35,000
Total1 2,500 234,000
1 Totals may not add to sub-components due to rounding.

30 Australian Institute of Criminology
6 Robbery
Robberies Recorded by the Police
The ABS defines robbery as the unlawful taking of property, with intent to permanentlydeprive the owner, accompanied by the use and/or threatened use of immediate force orviolence. Attempts are included.
Personal and Organisational Victims
Victims of robbery can be persons or organisations.13 In 2001, ABS figures indicate that19 per cent of robberies had organisational victims. For present purposes, organisationalrobberies have been treated as a different count from those encompassed by the CSS.14
Robbery Details
The ABS makes a distinction between armed and unarmed robberies, and thisdistinction is also used here. Armed robberies are those in which a weapon is used, witha weapon being defined as any object used to cause injury or fear of injury. Weapons caninclude imitation weapons and implied weapons.
In 2001, ABS figures show that five per cent of personal robbery victims were under15 years of age—out of the scope of the CSS. The ABS does not collect informationfrom the police on whether property was stolen, or the dollar loss.
Crime and Safety Survey
The question asked in the CSS is: “In the last 12 months, has anyone stolen or tried tosteal anything from you?” This is followed by a question asking the number of times thishas happened. Those answering affirmatively to the initial question are asked: “In howmany of these incidents were you physically attacked or threatened with violence?”Victims are also asked whether they were injured and whether the offender used orthreatened to use a weapon.
Robbery Details
The CSS shows that 25 per cent of incidents involved a weapon. As would be expected,weapon robberies were more likely to be reported to the police than other robberies(Table 6.1).
13 The element of property ownership determines whether the organisation (or business) is the victim. Some crime incidentsmight include both organisational and personal victims. (For instance, when a post office is held up and both the cash registertakings and personal property of a staff member are stolen, both an organisational and personal victim would be counted.)
14 In fact, though, it is possible that victimisations measured by the CSS will include organisational robberies, since a bank tellerwho experienced a robbery might well report it in the CSS.
31AIC Technical and Background Paper Series
Counting the Costs of Crime in Australia: Technical Report
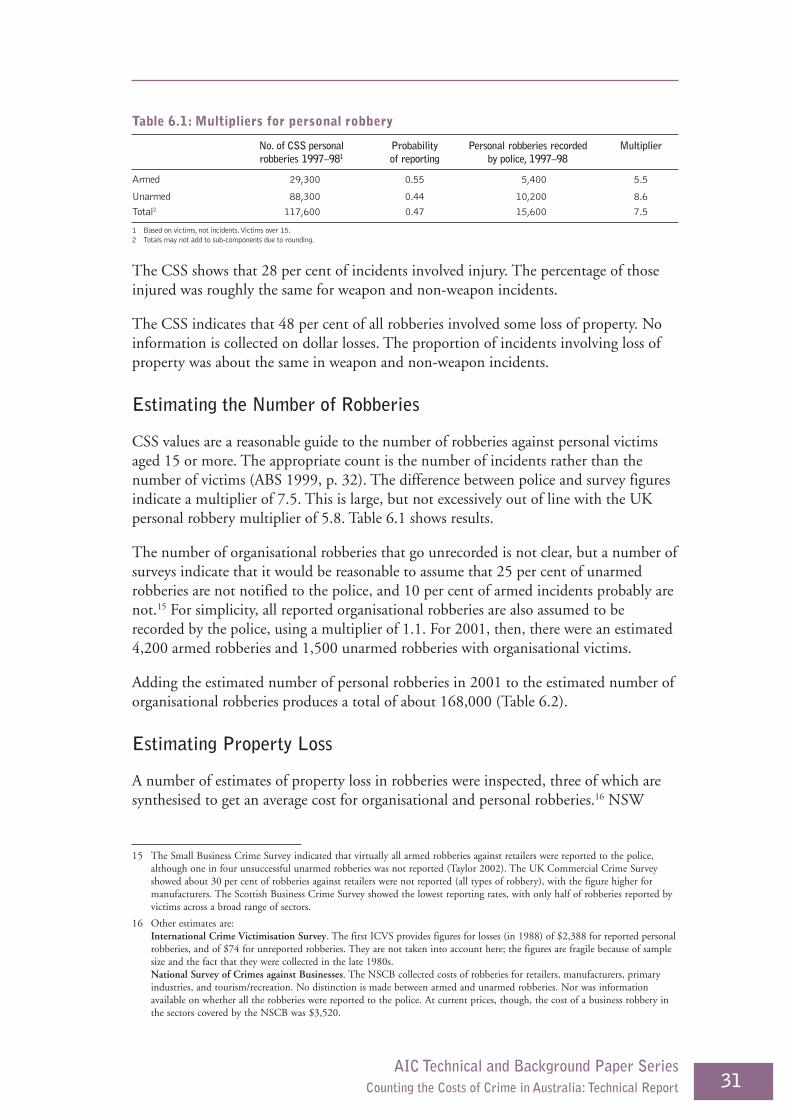
The CSS shows that 28 per cent of incidents involved injury. The percentage of thoseinjured was roughly the same for weapon and non-weapon incidents.
The CSS indicates that 48 per cent of all robberies involved some loss of property. Noinformation is collected on dollar losses. The proportion of incidents involving loss ofproperty was about the same in weapon and non-weapon incidents.
Estimating the Number of Robberies
CSS values are a reasonable guide to the number of robberies against personal victimsaged 15 or more. The appropriate count is the number of incidents rather than thenumber of victims (ABS 1999, p. 32). The difference between police and survey figuresindicate a multiplier of 7.5. This is large, but not excessively out of line with the UKpersonal robbery multiplier of 5.8. Table 6.1 shows results.
The number of organisational robberies that go unrecorded is not clear, but a number ofsurveys indicate that it would be reasonable to assume that 25 per cent of unarmedrobberies are not notified to the police, and 10 per cent of armed incidents probably arenot.15 For simplicity, all reported organisational robberies are also assumed to berecorded by the police, using a multiplier of 1.1. For 2001, then, there were an estimated4,200 armed robberies and 1,500 unarmed robberies with organisational victims.
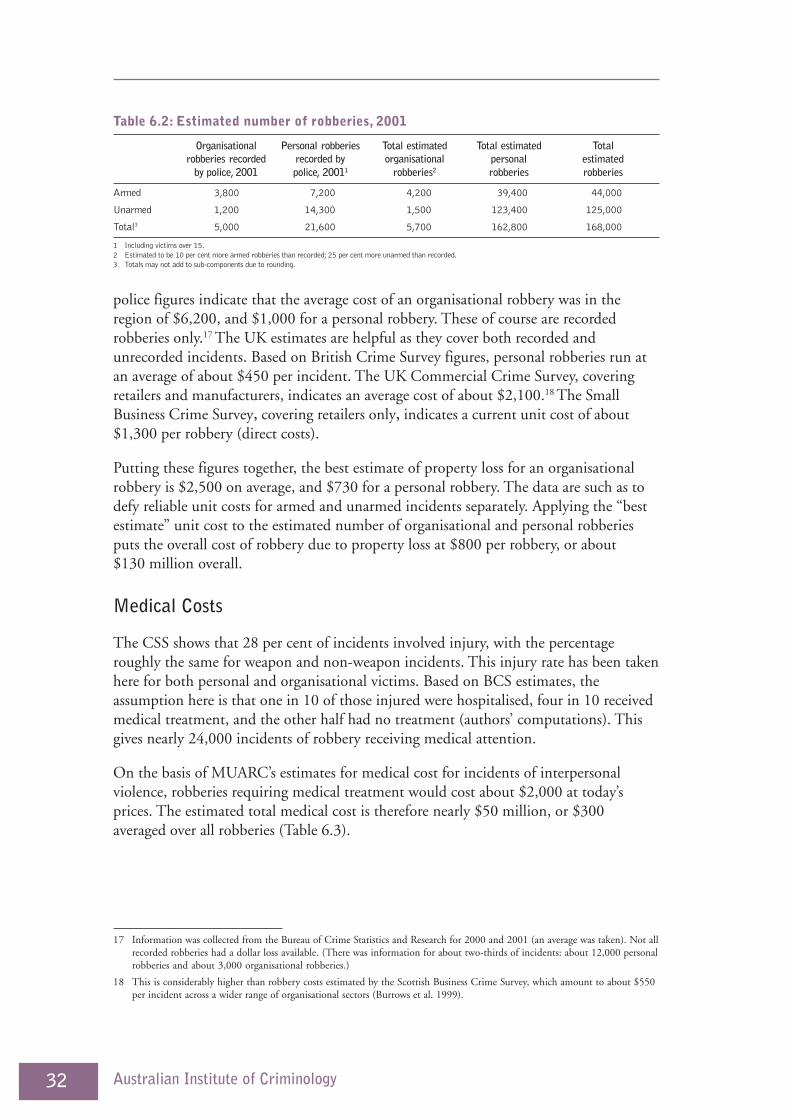
Adding the estimated number of personal robberies in 2001 to the estimated number oforganisational robberies produces a total of about 168,000 (Table 6.2).
Estimating Property Loss
A number of estimates of property loss in robberies were inspected, three of which aresynthesised to get an average cost for organisational and personal robberies.16 NSW
Table 6.1: Multipliers for personal robbery
No. of CSS personal Probability Personal robberies recorded Multiplierrobberies 1997–981 of reporting by police, 1997–98
Armed 29,300 0.55 5,400 5.5
Unarmed 88,300 0.44 10,200 8.6
Total2 117,600 0.47 15,600 7.5
1 Based on victims, not incidents. Victims over 15.2 Totals may not add to sub-components due to rounding.
15 The Small Business Crime Survey indicated that virtually all armed robberies against retailers were reported to the police,although one in four unsuccessful unarmed robberies was not reported (Taylor 2002). The UK Commercial Crime Surveyshowed about 30 per cent of robberies against retailers were not reported (all types of robbery), with the figure higher formanufacturers. The Scottish Business Crime Survey showed the lowest reporting rates, with only half of robberies reported byvictims across a broad range of sectors.
16 Other estimates are:International Crime Victimisation Survey. The first ICVS provides figures for losses (in 1988) of $2,388 for reported personalrobberies, and of $74 for unreported robberies. They are not taken into account here; the figures are fragile because of samplesize and the fact that they were collected in the late 1980s.National Survey of Crimes against Businesses. The NSCB collected costs of robberies for retailers, manufacturers, primaryindustries, and tourism/recreation. No distinction is made between armed and unarmed robberies. Nor was informationavailable on whether all the robberies were reported to the police. At current prices, though, the cost of a business robbery inthe sectors covered by the NSCB was $3,520.
32 Australian Institute of Criminology
police figures indicate that the average cost of an organisational robbery was in theregion of $6,200, and $1,000 for a personal robbery. These of course are recordedrobberies only.17 The UK estimates are helpful as they cover both recorded andunrecorded incidents. Based on British Crime Survey figures, personal robberies run atan average of about $450 per incident. The UK Commercial Crime Survey, coveringretailers and manufacturers, indicates an average cost of about $2,100.18 The SmallBusiness Crime Survey, covering retailers only, indicates a current unit cost of about$1,300 per robbery (direct costs).
Putting these figures together, the best estimate of property loss for an organisationalrobbery is $2,500 on average, and $730 for a personal robbery. The data are such as todefy reliable unit costs for armed and unarmed incidents separately. Applying the “bestestimate” unit cost to the estimated number of organisational and personal robberiesputs the overall cost of robbery due to property loss at $800 per robbery, or about$130 million overall.
Medical Costs
The CSS shows that 28 per cent of incidents involved injury, with the percentageroughly the same for weapon and non-weapon incidents. This injury rate has been takenhere for both personal and organisational victims. Based on BCS estimates, theassumption here is that one in 10 of those injured were hospitalised, four in 10 receivedmedical treatment, and the other half had no treatment (authors’ computations). Thisgives nearly 24,000 incidents of robbery receiving medical attention.
On the basis of MUARC’s estimates for medical cost for incidents of interpersonalviolence, robberies requiring medical treatment would cost about $2,000 at today’sprices. The estimated total medical cost is therefore nearly $50 million, or $300averaged over all robberies (Table 6.3).
Table 6.2: Estimated number of robberies, 2001
Organisational Personal robberies Total estimated Total estimated Totalrobberies recorded recorded by organisational personal estimated
by police, 2001 police, 20011 robberies2 robberies robberies
Armed 3,800 7,200 4,200 39,400 44,000
Unarmed 1,200 14,300 1,500 123,400 125,000
Total3 5,000 21,600 5,700 162,800 168,000
1 Including victims over 15.2 Estimated to be 10 per cent more armed robberies than recorded; 25 per cent more unarmed than recorded.3 Totals may not add to sub-components due to rounding.
17 Information was collected from the Bureau of Crime Statistics and Research for 2000 and 2001 (an average was taken). Not allrecorded robberies had a dollar loss available. (There was information for about two-thirds of incidents: about 12,000 personalrobberies and about 3,000 organisational robberies.)
18 This is considerably higher than robbery costs estimated by the Scottish Business Crime Survey, which amount to about $550per incident across a wider range of organisational sectors (Burrows et al. 1999).

33AIC Technical and Background Paper Series
Counting the Costs of Crime in Australia: Technical Report
Lost Output
On the basis of MUARC’s figures, the lost output cost of an incident with injuryrequiring hospital treatment would be nearly $25,000, and for medical treatmentoutside hospital about $2,000 at today’s prices. This gives an average lost output cost ofrobberies requiring medical treatment of about $6,400. A quarter of the lost outputcosts for those treated outside hospital is set for incidents involving injury but nomedical treatment. Across all incidents, the average cost is $1,000.
This costing approach is in line with that for the violent crimes already discussed.However, the UK estimates give a lower lost output figure for personal robbery of $600,based on victims’ time off work.
Intangible Costs
For robbery involving injury, the same approach to assessing intangible losses was takenas with assault. For non-injury robberies, the same intangible cost was taken as for non-injury assault. The intangible costs emerge as higher than for lost output.
Total Costs
The estimated total cost of robbery is in Table 6.4, amounting to $3,600 on average perincident and nearly $600 million overall.
Table 6.3: Costs of robberies—medical, lost output and intangible losses
Per incident cost ($) Total cost ($000s)Medical Lost output Intangible Medical Lost output Intangible
Injured, medical treatment 2,000 6,400 8,500 48,000 152,000 199,000
Injured, no medical treatment 500 500 12,000 11,000
All injured 1,000 3,500 4,500 48,000 164,000 210,000
Not injured 30 300 3,000 41,000
Total1 300 1,000 1,500 48,000 167,000 252,000
1 Totals may not add to sub-components due to rounding.
Table 6.4: Overall unit and total costs of robberies
Per incident cost ($) Total cost ($000s)
Property loss and damage 800 132,000
Medical 300 48,000
Lost output 1,000 167,000
Intangible 1,500 252,000
Total1 3,600 598,000
1 Totals may not add to sub-components due to rounding.
34 Australian Institute of Criminology
7 Burglary
Burglaries Recorded by the Police
Burglary in ABS terminology is unlawful entry with intent (UEWI) to commit anoffence. Structures entered must be capable of being secured in some way. A distinctionis drawn between UEWI involving the taking of property, and incidents where nothingis taken. The former are labelled “burglary with loss” hereon, the latter are “burglarywithout loss”—although this may not be strictly correct since some damage may haveoccurred.
Residential and Other Victims
ABS figures are presented for burglaries in residential locations, and those involving“community” and “other” targets, which can simply be called non-residential. Theseneed to be treated as a different count from those encompassed by the CSS.
Crime and Safety Survey
Burglaries in the CSS are similar, including burglaries to garages and sheds. There is adistinction between break-ins and attempts. The former are equated here with the ABSloss burglaries, although an entry might not have involved loss of property. In the CSS,just over 40 per cent of burglaries were attempts. The police figures show a lowerproportion of attempts, reflecting a lower reporting rate.
Estimating the Number of Burglaries
Residential Burglary
The CSS registered just over 800,000 burglaries in 1997–98 (Table 7.1). (Incidents aretaken, not victims.) The difference between the survey and police figures for residentialburglaries indicates a multiplier of 3.0, slightly smaller than the UK multiplier of 3.2.
Non-residential Burglary
The proportion of non-residential burglaries that go unreported is unclear, but fromsurvey evidence it might be reasonable to assume that 20 per cent of attempts are notnotified to the police, nor are five per cent of successful burglaries.19 For simplicity, all
19 The Small Business Crime Survey showed a reporting rate of 72 per cent for attempts against retailers, and 97 per cent forcompleted incidents (Taylor 2002). The UK Commercial Crime Survey showed 96 per cent of burglaries against retailers werereported and 92 per cent against manufacturers. (There was no distinction between attempts and completed incidents.) TheScottish Business Crime Survey showed a 72 per cent reporting rate for attempts, and 97 per cent for completed incidents.

35AIC Technical and Background Paper Series
Counting the Costs of Crime in Australia: Technical Report
reported non-residential burglaries are assumed to be recorded by the police. For 2001,then, there were an estimated 116,000 “non-residential burglaries with loss” and 60,000“no loss” burglaries.
Applying the multiplier to the total number of residential burglaries in 2001, andadding non-residential incidents, produces an estimated total of 994,000 (Table 7.2).
Table 7.1: Multipliers for residential burglary
No. of CSS burglaries Probability Residential burglaries recorded Multiplier1997–981 of reporting by police, 1997–982
Break-ins 460,400 0.76 238,000 1.9
Attempts 345,600 0.30 52,000 6.7
Total3 806,000 0.57 290,000 2.8
1 Based on incidents.2 Some estimation.3 Totals may not add to sub-components due to rounding.
Table 7.2: Estimated number of burglaries, 2001
Non-residential Residential Total estimated Total estimated Totalbuglaries recorded burglaries recorded non-residential residential estimated
by police, 2001 by police, 2001 burglaries1 burglaries burglaries
With loss 110,000 215,000 116,000 416,000 532,000
No loss 50,000 60,000 60,000 402,000 462,000
Total2 160,000 275,000 176,000 819,000 994,000
1 Estimated to be five per cent more with loss than recorded; 20 per cent more no loss than recorded.2 Totals may not add to sub-components due to rounding.
Estimating Property Loss
There are a number of estimates of property loss in burglary, and they were drawntogether to provide an average figure. How accurately victims can assess the value oftheir losses—or the police do it for them—is a moot point, but hardly grounds forrejecting the estimates.
Residential burglaries. UK estimates were used, along with NSW and Victoria policefigures, with an adjustment made to take account of the fact that they will be weightedtowards more expensive loss burglaries.20 The “best estimate” emerges as a $1,100 lossaveraged across all residential burglaries.21
20 Victoria showed an average loss for residential burglary of $2,550, and NSW just over $800 (figure for 2001)—a fairdifference. The UK estimates showed $2,100 for reported and unreported burglaries with loss, 14 times high than for attempts($150). Victoria and NSW police figures were adjusted to take account of the differential between loss burglaries and attempts,indicated by the UK estimates.
21 The 1991 Queensland Crime Victims Survey also showed some costs (Queensland Government Statistician’s Office 1992) forburglary and attempts. The losses are banded and this makes it difficult to set a value for $1,000 loss or more. For what it isworth, though, an estimate of average loss is $1,195 at current day prices—very close to what is taken.
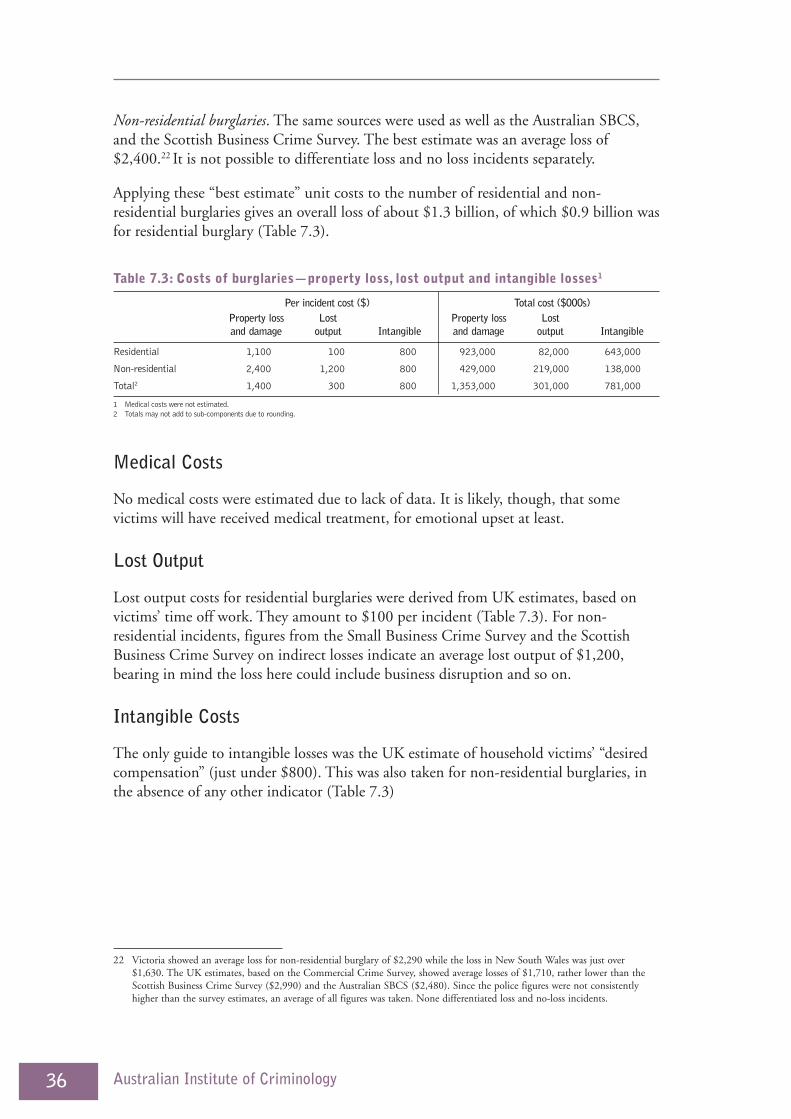
36 Australian Institute of Criminology
Non-residential burglaries. The same sources were used as well as the Australian SBCS,and the Scottish Business Crime Survey. The best estimate was an average loss of$2,400.22 It is not possible to differentiate loss and no loss incidents separately.
Applying these “best estimate” unit costs to the number of residential and non-residential burglaries gives an overall loss of about $1.3 billion, of which $0.9 billion wasfor residential burglary (Table 7.3).
22 Victoria showed an average loss for non-residential burglary of $2,290 while the loss in New South Wales was just over$1,630. The UK estimates, based on the Commercial Crime Survey, showed average losses of $1,710, rather lower than theScottish Business Crime Survey ($2,990) and the Australian SBCS ($2,480). Since the police figures were not consistentlyhigher than the survey estimates, an average of all figures was taken. None differentiated loss and no-loss incidents.
Table 7.3: Costs of burglaries—property loss, lost output and intangible losses1
Per incident cost ($) Total cost ($000s)Property loss Lost Property loss Lostand damage output Intangible and damage output Intangible
Residential 1,100 100 800 923,000 82,000 643,000
Non-residential 2,400 1,200 800 429,000 219,000 138,000
Total2 1,400 300 800 1,353,000 301,000 781,000
1 Medical costs were not estimated.2 Totals may not add to sub-components due to rounding.
Medical Costs
No medical costs were estimated due to lack of data. It is likely, though, that somevictims will have received medical treatment, for emotional upset at least.
Lost Output
Lost output costs for residential burglaries were derived from UK estimates, based onvictims’ time off work. They amount to $100 per incident (Table 7.3). For non-residential incidents, figures from the Small Business Crime Survey and the ScottishBusiness Crime Survey on indirect losses indicate an average lost output of $1,200,bearing in mind the loss here could include business disruption and so on.
Intangible Costs
The only guide to intangible losses was the UK estimate of household victims’ “desiredcompensation” (just under $800). This was also taken for non-residential burglaries, inthe absence of any other indicator (Table 7.3)

37AIC Technical and Background Paper Series
Counting the Costs of Crime in Australia: Technical Report
Total Costs
The estimated total cost of burglary amounts to $2,400 on average per incident, withthe higher average costs for non-residential burglaries. The total burglary bill is$2.43 billion. Residential burglaries account for two-thirds of the overall cost, but sincethe number of dwellings relative to other targets will be much greater than this, theburden falls more heavily on the non-residential sector.
Table 7.4: Overall unit and total costs of burglary
Per incident cost ($) Total cost ($000s)
Residential 2,000 1,648,000
Non-residential 4,500 786,000
Total1 2,400 2,434,000
1 Totals may not add to sub-components due to rounding.
38 Australian Institute of Criminology
8 Thefts of Vehicles
Vehicle Thefts Recorded by the Police
The ABS defines motor vehicle theft as the taking of a vehicle unlawfully or withoutpermission. Attempts are not included. Nor are thefts from vehicles, which are includedwithin the ABS category of “other theft”. “Vehicle” includes cars, motorcycles, trucksand lorries (the National Motor Vehicle Theft Reduction Council figures show thatmotorcycles account for five per cent of thefts). No distinction is made in ABS figuresbetween privately owned and commercial vehicles.
Crime and Safety Survey
The CSS covers incidents where a motor vehicle was stolen from any member of thehousehold. It includes privately owned vehicles as well as business/company vehiclesused exclusively by household members.
Vehicle theft has an unusually high reporting rate, but in the 1998 CSS not quite allvictims reported the theft (95 per cent did so). Some thefts may go unreported becausethe stolen vehicle was quickly found, or because it was uninsured due to old age or lowvalue. The Small Business Crime Survey (SBCS) showed that only 87 per cent ofretailers reported successful thefts (Taylor 2002).
Estimating the Number of Vehicle Thefts
ABS figures show that there were nearly 140,000 thefts reported in 2001. A multiplierof 1.05 (based on the 1998 CSS figures) has been taken to account for non-reporting. Itis assumed that all reported thefts are recorded by the police. The total number of thefts,then, is about 147,000.
Estimating Property Loss
Average losses need to take into account the fact that on current estimates 79 per cent ofstolen vehicles are recovered, although some may have suffered damage, or may have haditems stolen off or from the vehicle. There are a number of estimates of property lossand damage arising from stolen vehicles, but the best one is from the National MotorVehicle Theft Reduction Council (NMVTRC 2002).23
23 Other estimates are:NSW police data, which show an average loss over 2000 and 2001 of $10,500 per theft. However, this is likely to be theinitial loss, not the net loss. Victoria police data show an average loss of $7,300 in 2000–01. Again, though, this is a grossrather than net loss.Small Business Crime Survey: Retailers were asked to assess losses due to theft and damage for thefts of company vehicles.They were also asked to assess indirect losses due to business disruption, medical expenses and so on. The average direct cost ofvehicle theft was put at $4,200 and indirect costs at $1,600 (see Taylor & Mayhew 2002b). The direct costs will again not takelosses recovered in account.
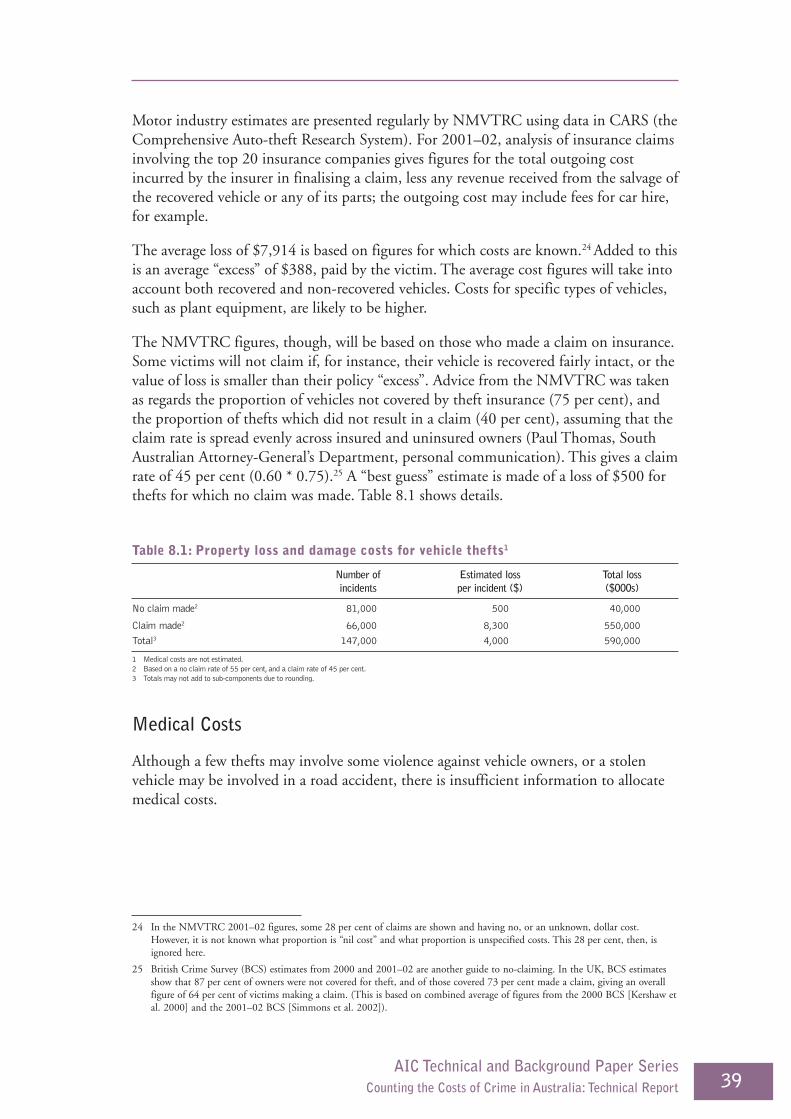
39AIC Technical and Background Paper Series
Counting the Costs of Crime in Australia: Technical Report
Motor industry estimates are presented regularly by NMVTRC using data in CARS (theComprehensive Auto-theft Research System). For 2001–02, analysis of insurance claimsinvolving the top 20 insurance companies gives figures for the total outgoing costincurred by the insurer in finalising a claim, less any revenue received from the salvage ofthe recovered vehicle or any of its parts; the outgoing cost may include fees for car hire,for example.
The average loss of $7,914 is based on figures for which costs are known.24 Added to thisis an average “excess” of $388, paid by the victim. The average cost figures will take intoaccount both recovered and non-recovered vehicles. Costs for specific types of vehicles,such as plant equipment, are likely to be higher.
The NMVTRC figures, though, will be based on those who made a claim on insurance.Some victims will not claim if, for instance, their vehicle is recovered fairly intact, or thevalue of loss is smaller than their policy “excess”. Advice from the NMVTRC was takenas regards the proportion of vehicles not covered by theft insurance (75 per cent), andthe proportion of thefts which did not result in a claim (40 per cent), assuming that theclaim rate is spread evenly across insured and uninsured owners (Paul Thomas, SouthAustralian Attorney-General’s Department, personal communication). This gives a claimrate of 45 per cent (0.60 * 0.75).25 A “best guess” estimate is made of a loss of $500 forthefts for which no claim was made. Table 8.1 shows details.
24 In the NMVTRC 2001–02 figures, some 28 per cent of claims are shown and having no, or an unknown, dollar cost.However, it is not known what proportion is “nil cost” and what proportion is unspecified costs. This 28 per cent, then, isignored here.
25 British Crime Survey (BCS) estimates from 2000 and 2001–02 are another guide to no-claiming. In the UK, BCS estimatesshow that 87 per cent of owners were not covered for theft, and of those covered 73 per cent made a claim, giving an overallfigure of 64 per cent of victims making a claim. (This is based on combined average of figures from the 2000 BCS [Kershaw etal. 2000] and the 2001–02 BCS [Simmons et al. 2002]).
Table 8.1: Property loss and damage costs for vehicle thefts1
Number of Estimated loss Total lossincidents per incident ($) ($000s)
No claim made2 81,000 500 40,000
Claim made2 66,000 8,300 550,000
Total3 147,000 4,000 590,000
1 Medical costs are not estimated.2 Based on a no claim rate of 55 per cent, and a claim rate of 45 per cent.3 Totals may not add to sub-components due to rounding.
Medical Costs
Although a few thefts may involve some violence against vehicle owners, or a stolenvehicle may be involved in a road accident, there is insufficient information to allocatemedical costs.
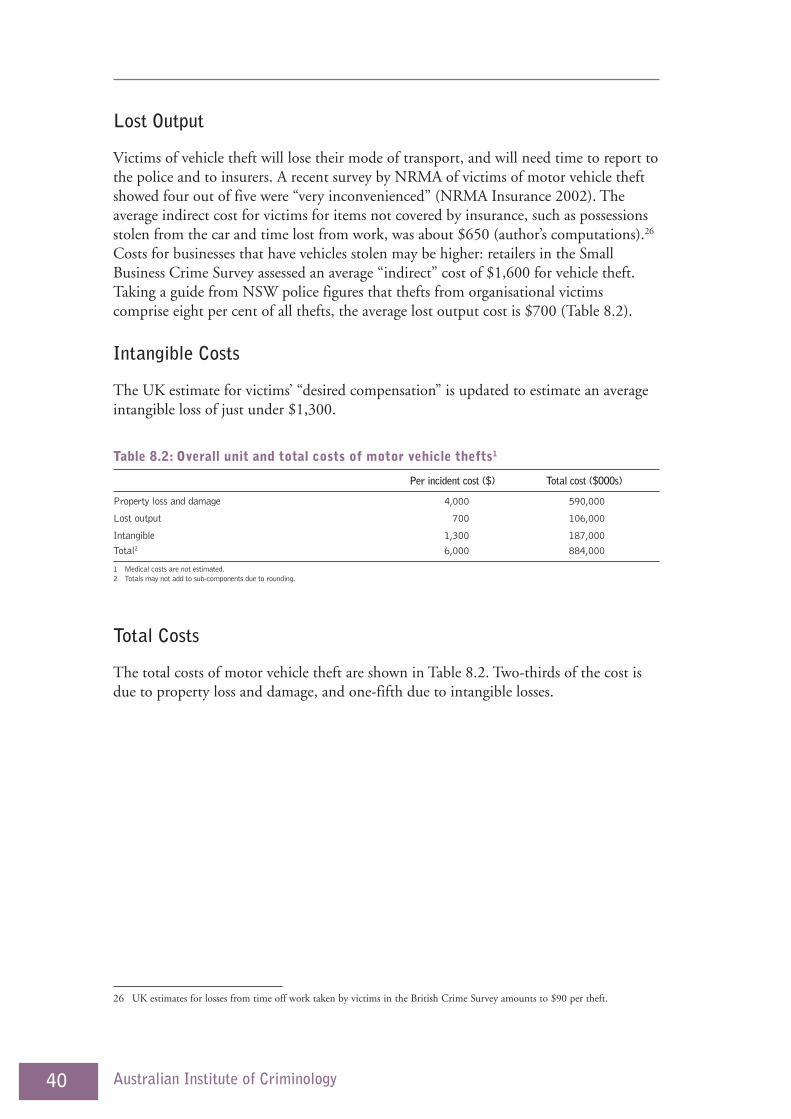
40 Australian Institute of Criminology
Lost Output
Victims of vehicle theft will lose their mode of transport, and will need time to report tothe police and to insurers. A recent survey by NRMA of victims of motor vehicle theftshowed four out of five were “very inconvenienced” (NRMA Insurance 2002). Theaverage indirect cost for victims for items not covered by insurance, such as possessionsstolen from the car and time lost from work, was about $650 (author’s computations).26
Costs for businesses that have vehicles stolen may be higher: retailers in the SmallBusiness Crime Survey assessed an average “indirect” cost of $1,600 for vehicle theft.Taking a guide from NSW police figures that thefts from organisational victimscomprise eight per cent of all thefts, the average lost output cost is $700 (Table 8.2).
Intangible Costs
The UK estimate for victims’ “desired compensation” is updated to estimate an averageintangible loss of just under $1,300.
26 UK estimates for losses from time off work taken by victims in the British Crime Survey amounts to $90 per theft.
Total Costs
The total costs of motor vehicle theft are shown in Table 8.2. Two-thirds of the cost isdue to property loss and damage, and one-fifth due to intangible losses.
Table 8.2: Overall unit and total costs of motor vehicle thefts1
Per incident cost ($) Total cost ($000s)
Property loss and damage 4,000 590,000
Lost output 700 106,000
Intangible 1,300 187,000
Total2 6,000 884,000
1 Medical costs are not estimated.2 Totals may not add to sub-components due to rounding.

41AIC Technical and Background Paper Series
Counting the Costs of Crime in Australia: Technical Report
9 Thefts from Vehicles
Estimating the Number of Thefts
Thefts from vehicles are subsumed in ABS figures for general thefts. Five states, however(NSW, Victoria, Queensland, South Australia and Tasmania), recorded about 225,000thefts from vehicles in the last year for which their figures were available. On the basis ofthese states’ share of all ABS thefts, the estimated national total is 266,000 thefts in2001.
By no means all thefts are reported to the police. For instance, the Queensland surveyshowed that—much the same as the BCS figure—about one-third of thefts fromhousehold vehicles are reported. Reporting seems to be higher for commercial vehicles:about two-thirds were reported, taking an average of the SBCS, the Scottish BusinessSurvey and the UK commercial theft results.27
The multiplier for thefts from commercial vehicles was derived simply by takingaccount of the non-reporting rate. This gave an estimated 53,000 thefts (Table 9.1). Forthefts involving householders’ vehicles, the UK multiplier (based on the BCS) of 3.9was used.28
27 The South Australia Retail Survey did not ask about thefts from vehicles.
28 This is the multiplier for thefts excluding attempts.
Table 9.1: Multipliers for thefts from vehicles
Estimated thefts from Multiplier2 Estimated totalvehicles recorded by police1 number of thefts
Commercial vehicles 34,000 1.5 53,000
Other 232,000 3.9 903,000
Total3 266,000 3.6 956,000
1 Based on NSW, Victoria, Queensland, South Australia and Tasmania.2 For commercial vehicle thefts, account is taken of the non-reporting rate (35%). The multiplier for other thefts is based on UK estimates.3 Totals may not add to sub-components due to rounding.
Estimating Property Loss
Again police figures will not give reliable estimates for the average value of thefts fromvehicles, because more expensive incidents are more likely to be reported. Nonetheless,New South Wales police figures suggest an average loss of about $1,100 for thefts fromcommercial vehicles, and $400 for other thefts. Victoria gives an average of about $750(with no distinction between different types of theft).
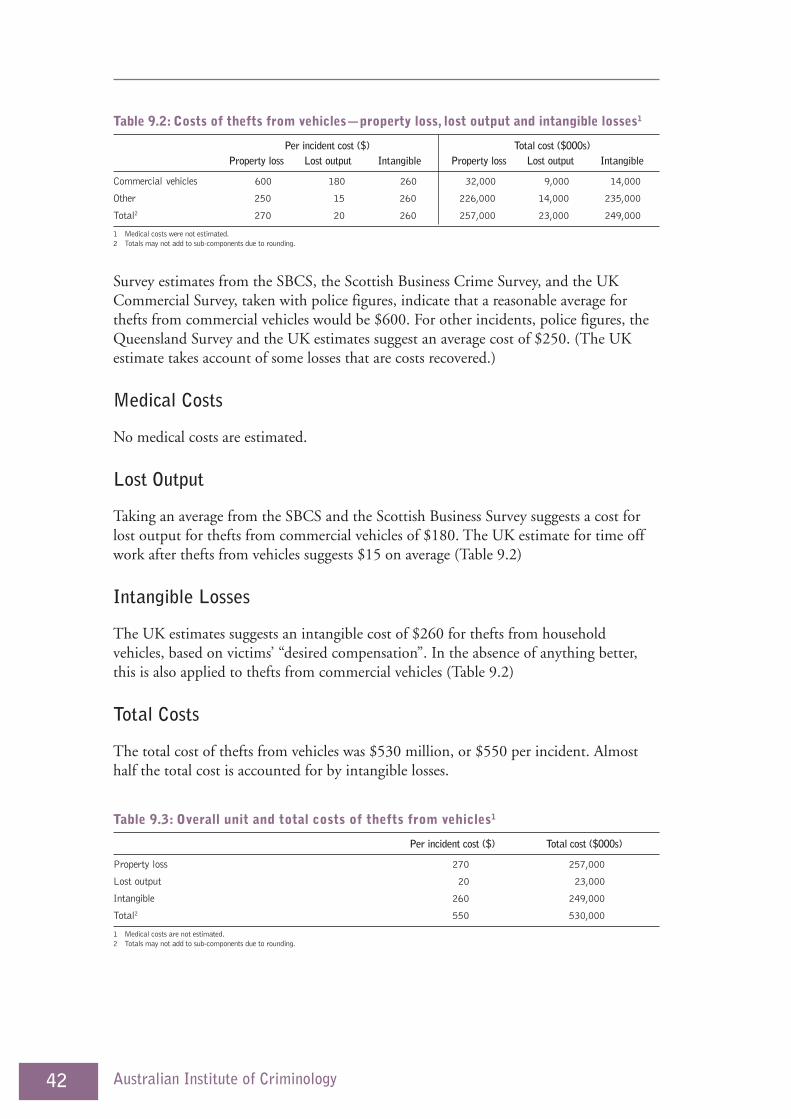
42 Australian Institute of Criminology
Survey estimates from the SBCS, the Scottish Business Crime Survey, and the UKCommercial Survey, taken with police figures, indicate that a reasonable average forthefts from commercial vehicles would be $600. For other incidents, police figures, theQueensland Survey and the UK estimates suggest an average cost of $250. (The UKestimate takes account of some losses that are costs recovered.)
Medical Costs
No medical costs are estimated.
Lost Output
Taking an average from the SBCS and the Scottish Business Survey suggests a cost forlost output for thefts from commercial vehicles of $180. The UK estimate for time offwork after thefts from vehicles suggests $15 on average (Table 9.2)
Intangible Losses
The UK estimates suggests an intangible cost of $260 for thefts from householdvehicles, based on victims’ “desired compensation”. In the absence of anything better,this is also applied to thefts from commercial vehicles (Table 9.2)
Total Costs
The total cost of thefts from vehicles was $530 million, or $550 per incident. Almosthalf the total cost is accounted for by intangible losses.
Table 9.2: Costs of thefts from vehicles—property loss, lost output and intangible losses1
Per incident cost ($) Total cost ($000s)Property loss Lost output Intangible Property loss Lost output Intangible
Commercial vehicles 600 180 260 32,000 9,000 14,000
Other 250 15 260 226,000 14,000 235,000
Total2 270 20 260 257,000 23,000 249,000
1 Medical costs were not estimated.2 Totals may not add to sub-components due to rounding.
Table 9.3: Overall unit and total costs of thefts from vehicles1
Per incident cost ($) Total cost ($000s)
Property loss 270 257,000
Lost output 20 23,000
Intangible 260 249,000
Total2 550 530,000
1 Medical costs are not estimated.2 Totals may not add to sub-components due to rounding.

43AIC Technical and Background Paper Series
Counting the Costs of Crime in Australia: Technical Report
10 Shop Theft
Estimating the Number of Shop Thefts
There is no sound estimate of the number of shop thefts (thefts by customers and staff ).It is not a discrete ABS recorded crime category, and although some police forcesseparate out shop theft (or shop stealing) from other thefts, it is evident that the policerecord very few incidents. For one, many incidents will go unnoticed by retailers, andeven those that are witnessed are not always reported. The SBCS and South AustralianRetail Survey, for instance, show that only 12 per cent of incidents are reported,although this will only be witnessed thefts.
The police in NSW, Victoria, Queensland and South Australia recorded about 60,000shop thefts in the last year for which figures are available. These states account for 82 percent of all thefts in ABS returns, so this was applied to give an estimated national totalof shop thefts of 73,000 in 2001.
A fairly well-aired multiplier for shop theft, based on Farrington’s (1999) extensivereview of shoplifting studies, is that one incident in a hundred that are committed endup recorded by the police. The UK estimates adopt this principle, and it is adopted heretoo. This gives an estimated 7.3 million thefts (Table 10.1). Given the number ofretailers in Australia currently, this indicates just over 40 thefts each in a year, onaverage.29
29 This is rather higher than some survey figures indicate. The NSCB shows an average of 21 shopliftings and staff thefts in theyear, although there is substantial extra “shrinkage and leakage” which might have been attributable to crime. The SBCSindicates an average of 8.8 shop thefts in total, whereas the South Australia Retail Crime Survey’s figure is 34. Like the NSCB,however, the retailers also report very high leakage and shrinkage losses. In the UK, the British Retail Consortium’s annualsurvey and the Commercial Victimisation Survey give an average of about 20 incidents per retailer. The Scottish BusinessCrime Survey, however, produces lower figures of about 2.5 incidents of customer and staff theft per premises—albeit coveringwholesalers and retailers.
Table 10.1: Estimates for shop theft
Estimate
Estimated number of shop thefts recorded by the police1 73,040
Multiplier2 100
Estimated number of shop thefts 7,304,000
Best estimate of value of theft per incident ($) 100
Best estimate of total property loss ($000s) 730,000
1 Based on NSW, Victoria, Queensland and South Australia, grossed up to Australia.2 Estimate.
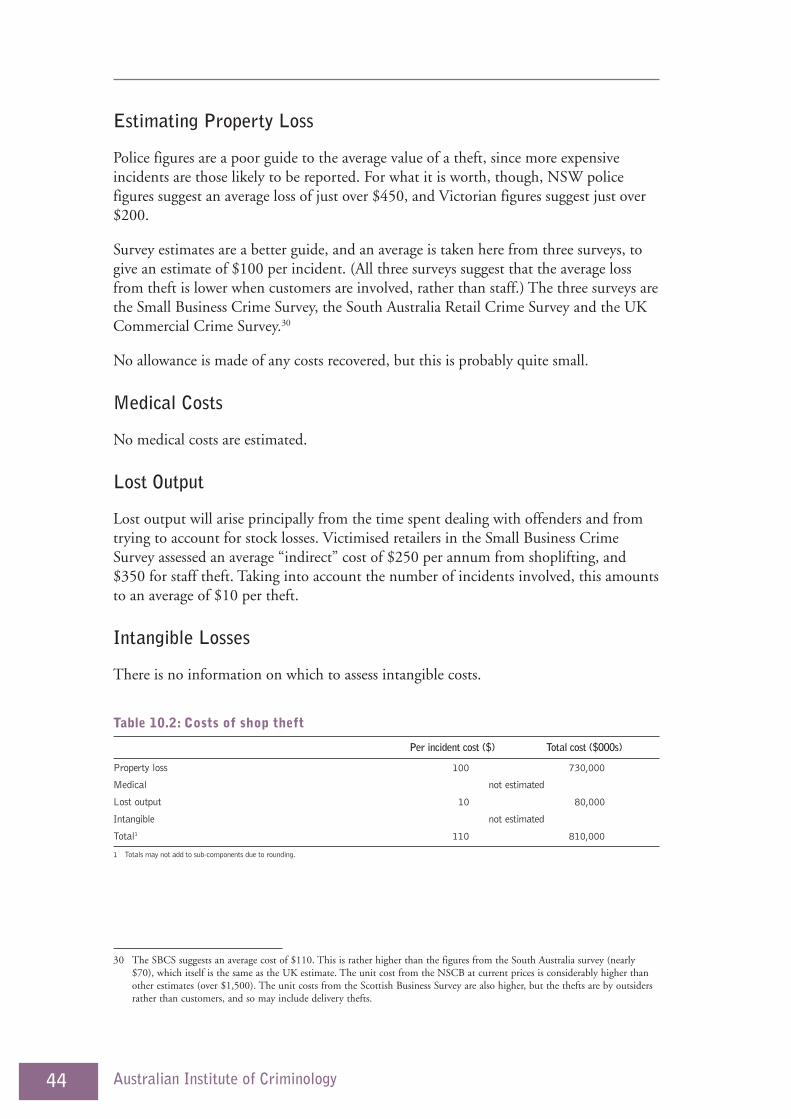
44 Australian Institute of Criminology
Estimating Property Loss
Police figures are a poor guide to the average value of a theft, since more expensiveincidents are those likely to be reported. For what it is worth, though, NSW policefigures suggest an average loss of just over $450, and Victorian figures suggest just over$200.
Survey estimates are a better guide, and an average is taken here from three surveys, togive an estimate of $100 per incident. (All three surveys suggest that the average lossfrom theft is lower when customers are involved, rather than staff.) The three surveys arethe Small Business Crime Survey, the South Australia Retail Crime Survey and the UKCommercial Crime Survey.30
No allowance is made of any costs recovered, but this is probably quite small.
Medical Costs
No medical costs are estimated.
Lost Output
Lost output will arise principally from the time spent dealing with offenders and fromtrying to account for stock losses. Victimised retailers in the Small Business CrimeSurvey assessed an average “indirect” cost of $250 per annum from shoplifting, and$350 for staff theft. Taking into account the number of incidents involved, this amountsto an average of $10 per theft.
Intangible Losses
There is no information on which to assess intangible costs.
30 The SBCS suggests an average cost of $110. This is rather higher than the figures from the South Australia survey (nearly$70), which itself is the same as the UK estimate. The unit cost from the NSCB at current prices is considerably higher thanother estimates (over $1,500). The unit costs from the Scottish Business Survey are also higher, but the thefts are by outsidersrather than customers, and so may include delivery thefts.
Table 10.2: Costs of shop theft
Per incident cost ($) Total cost ($000s)
Property loss 100 730,000
Medical not estimated
Lost output 10 80,000
Intangible not estimated
Total1 110 810,000
1 Totals may not add to sub-components due to rounding.
45AIC Technical and Background Paper Series
Counting the Costs of Crime in Australia: Technical Report
Total Costs
The total cost of shop theft amounts to $810 million, or $110 per incident. Forretailers, there would be a yearly bill of nearly $4,800 each.
Other Estimates
The Retail Traders’ Association’s rule of thumb is that 1.5 per cent of retail turnover goeson shrinkage and loss of all kinds. This would give a total loss estimate of just over$2 billion. This is appreciably higher than the current estimate, but is not strictlycomparable with it since the losses are not just from thefts by customers and staff, butalso include delivery thefts, damage to goods, burglary and refund frauds.
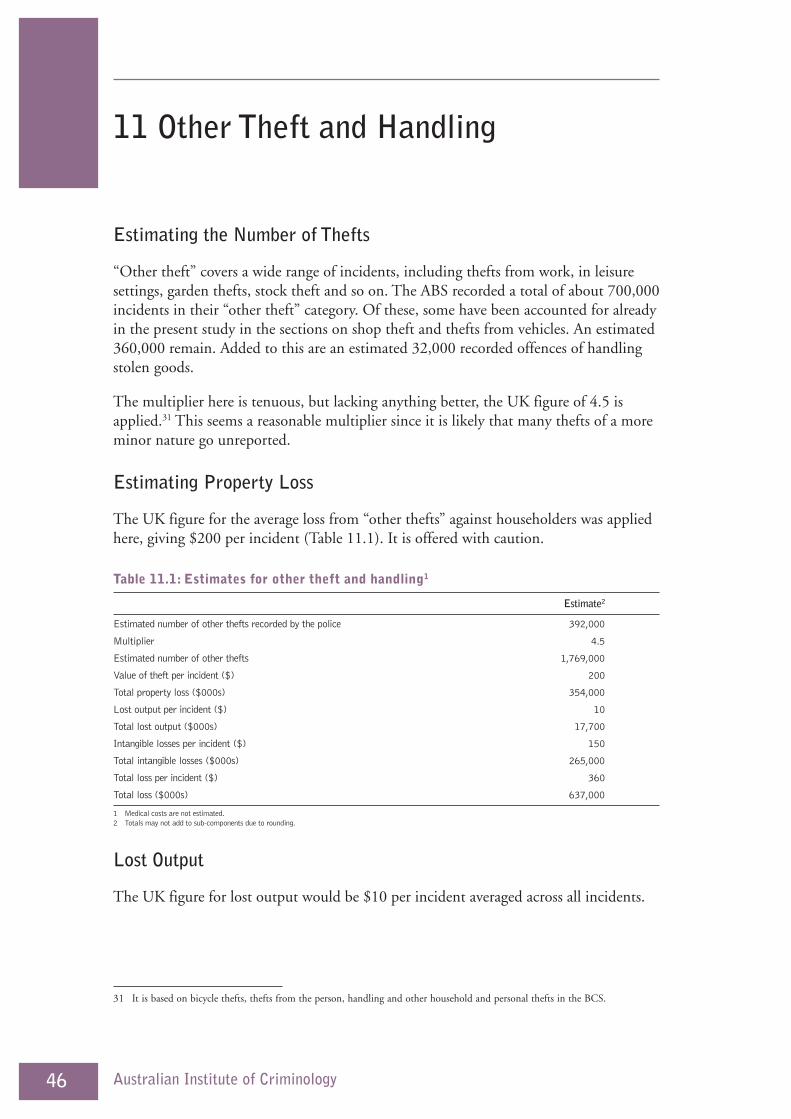
46 Australian Institute of Criminology
11 Other Theft and Handling
Estimating the Number of Thefts
“Other theft” covers a wide range of incidents, including thefts from work, in leisuresettings, garden thefts, stock theft and so on. The ABS recorded a total of about 700,000incidents in their “other theft” category. Of these, some have been accounted for alreadyin the present study in the sections on shop theft and thefts from vehicles. An estimated360,000 remain. Added to this are an estimated 32,000 recorded offences of handlingstolen goods.
The multiplier here is tenuous, but lacking anything better, the UK figure of 4.5 isapplied.31 This seems a reasonable multiplier since it is likely that many thefts of a moreminor nature go unreported.
Estimating Property Loss
The UK figure for the average loss from “other thefts” against householders was appliedhere, giving $200 per incident (Table 11.1). It is offered with caution.
Table 11.1: Estimates for other theft and handling1
Estimate2
Estimated number of other thefts recorded by the police 392,000
Multiplier 4.5
Estimated number of other thefts 1,769,000
Value of theft per incident ($) 200
Total property loss ($000s) 354,000
Lost output per incident ($) 10
Total lost output ($000s) 17,700
Intangible losses per incident ($) 150
Total intangible losses ($000s) 265,000
Total loss per incident ($) 360
Total loss ($000s) 637,000
1 Medical costs are not estimated.2 Totals may not add to sub-components due to rounding.
Lost Output
The UK figure for lost output would be $10 per incident averaged across all incidents.
31 It is based on bicycle thefts, thefts from the person, handling and other household and personal thefts in the BCS.
47AIC Technical and Background Paper Series
Counting the Costs of Crime in Australia: Technical Report
Intangible Losses
Based on victims’ “desired compensation”, the UK results suggest an average of $150 forintangible losses (Table 11.1).
Medical Costs
No medical costs are estimated.
Total Costs
The total cost of other theft is about $640 million, with an average total loss perincident of $360. These figures should be treated cautiously.

48 Australian Institute of Criminology
12 Criminal Damage
Estimating the Number of Incidents
Criminal damage (or vandalism) can range from fairly minor incidents of graffiti tocases involving considerable monetary losses. Arson is sometimes included as a form ofcriminal damage, but in this report is treated separately in the next section.
The ABS collects no figures on criminal damage, nor was it covered in the Crime andSafety Survey. Offences recorded by the police totalled about 320,000 in 2001. This willbe a large underestimate since vandalism has a typically low reporting rate. TheQueensland Crime Victims Survey showed 25 per cent of incidents of home vandalismwere reported, the same figure as in the South Australian Retail Crime and SafetySurvey. To take account of non-reporting and non-recording, a multiplier of 6.0 isapplied, drawing on the UK figure. Again, this multiplier is tenuous, but gives anestimated 1,914,000 incidents of criminal damage. Police figures give no indication ofthe proportion of incidents against residential as opposed to non-residential targets.
Estimating Property Loss
On the basis of a synthesis of a number of surveys, an average unit cost of $350 is set forincidents of criminal damage, both against household and other property (Table 12.1).32
Lost Output
Business survey figures and UK estimates for lost output in incidents againsthouseholders suggest that $50 per incident is reasonable (Table 12.1).
Intangible Losses
Based on victims’ “desired compensation” for incidents of household vandalism, the UKresults suggest an average of $300 for intangible losses (Table 12.1).
Medical Costs
No medical costs are estimated.
32 The surveys taken are the Small Business Crime Survey, the UK Commercial Crime Survey and the South Australian RetailersSurvey. Victoria police statistics show an average damage loss of $4,500, but a median value of $300.

49AIC Technical and Background Paper Series
Counting the Costs of Crime in Australia: Technical Report
Total Costs
Table 12.1 shows the cost element. The total cost of criminal damage is over$1.3 billion, with an average total loss per incident of $700. These figures should betreated carefully.
Table 12.1: Costs of criminal damage—property loss, lost output and intangible losses1
Per incident cost ($) Total cost ($000s)Property Lost Property Lost Total
loss output Intangible loss output Intangible cost2
Criminal damage 350 50 300 669,800 95,700 574,100 1,340,000
1 Medical costs were not estimated.2 Totals may not add to sub-components due to rounding.
50 Australian Institute of Criminology
13 Arson
Estimating the Number of Incidents
It is hard to know how many incidents of arson take place. Police figures indicate about17,500 incidents were recorded in 2001, although this may be less than the “real” total.Some victims may feel that there is no point reporting a fire to police if it was small, ifthey cannot be sure whether arson caused the fire, or if they are uninsured and not in aposition to make a claim. Moreover, the police may not record all reported incidents ifthey are not convinced arson was involved.
Nor are there readily available figures from insurance companies of the number of claimsfor arson (as opposed to fire damage). Some claims for supposedly accidental firedamage are believed to be fraudulent claims involving fires started deliberately. Also,many claims may in fact involve arson but cannot be assessed as such because of thedifficulty of knowing for certain how the fire started (Baldock 1997; Drabsch 2003).One somewhat dated estimate from the NSW Standing Committee on Arson is that forevery established case of arson, there are 3.25 other incidents considered to be arson,and another 7.5 counted as suspicious (BOCSAR 1990). This, though, applies more toincidents attended by brigades as opposed to incidents recorded by the police. Toaccount for the “dark figure” of cases of arson not recorded by the police, in the presentreport it is assumed that for each recorded case there are two others not recorded.
Estimating Loss
A number of tentative estimates of the cost of arson have been made, and are discussedbelow. Most focus on property loss and damage, thus excluding indirect losses from lostproductivity, business disruption and intangible costs. Albeit in the early 1980s, theInsurance Council of Australia estimated that property loss comprised only about 25 percent of total costs, taking indirect and intangible losses into account (BOCSAR 1990).Another estimate from Emergency Management Australia is that insured losses forbushfires comprise 35 per cent of total direct and indirect losses—an estimate used bythe Bureau of Transport Economics in their study of the economic cost of naturaldisasters in Australia (BTE 2001). The 35 per cent figure is used in estimates here whereappropriate to assess total costs. It is not considered by BTE to be particularly robust. Italso applies to bushfires costing $10 million or more, so its applicability to smaller arsonfires is unknown.
Insurance figures can give some guide to the extent of property loss for all fire damage.One caveat is that payouts for fire damage take no account of victims without insurancecover. It is estimated that 25 per cent of households and 17 per cent of small businesses
51AIC Technical and Background Paper Series
Counting the Costs of Crime in Australia: Technical Report
do not have contents insurance (Insurance Council of Australia 2002).33 Moreover, oneneeds to take account of the proportion of fire damage that is caused by arson. Ajudicious estimate would be about one-third of fires—lower than for bushfires (seebelow).
Deaths
Any deaths due to arson are assumed to have been counted within homicide costs.34
Vehicular Fires
Many cases of arson involve vehicles. The proportion was 30 per cent in the NSWStanding Committee on Arson study. Some of these fires (assumed to be one-third forthe purposes of this report) will involve cars that are stolen and then burnt either todestroy evidence that would link the theft to an offender, or for malicious reasons. Theseare likely to be recorded by the police as stolen vehicles, and thus costs will have beensubsumed under motor vehicle theft. An adjustment has been made for this whereappropriate.
Bushfires
The current estimate from the NSW Rural Fire Service is that about 50 per cent ofbushfires are deliberately lit (Richard Woods, NSW Rural Fire Service, personalcommunication). This is a useful check on the assumption that one-third of all firedamage insurance payouts are due to arson. However, it is not an ideal starting point forestimating costs since the number of bushfires in any one year is variable, and bushfiresaccount for only a proportion of fire costs (and an unknown proportion at that).
The Emergency Management Australia database shows that bushfires over the period1997–2002 cost an annual average of $60 million, taking account of all losses (GrahamParker, Emergency Management Australia, personal communication).35 Assuming halfwere deliberately lit, an annual figure of $30 million is obtained. Obviously, the cost ofbushfires can vary considerably from year to year.
A Synthesis of Estimates
A “best estimate” of arson costs synthesises a number of strands of evidence (seeTable 13.1).
33 Taking into account that the number of households is much larger than the number of businesses, this gives a 24 per cent non-insurance rate across the two sectors.
34 There were two homicides in 2001 involving arson.
35 The database records costs for major bushfires with a total cost of $10 million each, excluding deaths and injuries. However,on the basis of BTE (2001) estimates, the cost of these major fires can be taken to be 91 per cent of the total of all fires.

52 Australian Institute of Criminology
(i) Police-recorded Cases of Arson
One estimate can be made on the basis of cases of arson recorded by the policemultiplied by an average cost per incident. Victoria police figures indicate that anaverage case of arson in 2000–01 cost about $17,500, albeit with a much smallermedian value of $300.36 Insurance Statistics Australia indicates a lower $13,550 for theaverage cost of domestic fire claims, although arson incidents specifically are believed tocarry rather higher costs (Drabsch 2003).
Using an average cost of $17,500 suggests a national cost of about $300 million on thebasis of recorded cases of arson. For the estimated number of unrecorded cases (that is,using the multiplier of two) it is reasonable to take a lower average value. There is nogood guide to this, but one-fifth of the cost of recorded cases was taken ($3,500). Thisgives a total property loss bill of just over $420 million. Taking account of the fact thatproperty loss may be only 35 per cent of total costs gives an estimate of $1.2 billion.
As said, it is assumed here that cars reported as stolen and found burnt out by the policewill be recorded as motor vehicle thefts. They will thus have been counted in this reportunder costs for that offence.
(ii) Victoria Metropolitan Fire Brigade
On the basis of fire officer reports, the direct cost of deliberately lit fires in Victoria in2001–02 was $65 million (Ian Hunter, Victoria Metropolitan Fire Brigade, personalcommunication). Grossed-up according to population share, this would suggest anAustralian total of $230 million, making an adjustment to avoid double countingvehicle fires. Allowing for indirect and intangible losses brings the total to $670 million.These figures are sensitive to the picture in Victoria, and they leave aside any fires notattended by brigades.
(iii) Western Australia
Lampard (2000) estimated that the average annual dollar cost of deliberately lit andsuspicious fires attended by WA’s Fire Service was $18 million. Grossed-up and adjustingfor vehicle fires, this gives an Australian total of just over $160 million. Allowing forindirect and intangible losses brings the total to $470 million.
(iv) Insurance Payout Estimate for Victoria
The Insurance Council of Australia estimated a cost to Victoria in 1991 of $50 millionfor arson-related insurance payouts. This was inflated and grossed-up to Australia, withthe adjustment made for vehicle fires. The initial estimate will relate only to cases ofarson for which a claim is made. Taking into account non-insurance gives a figure ofabout $250 million. Allowing for indirect and intangible costs gives an estimate of
36 Few business crime surveys seem to have covered arson. The South Australia Retail Crime Survey was an exception. Fourincidents of arson were reported with an average value of $20,000.
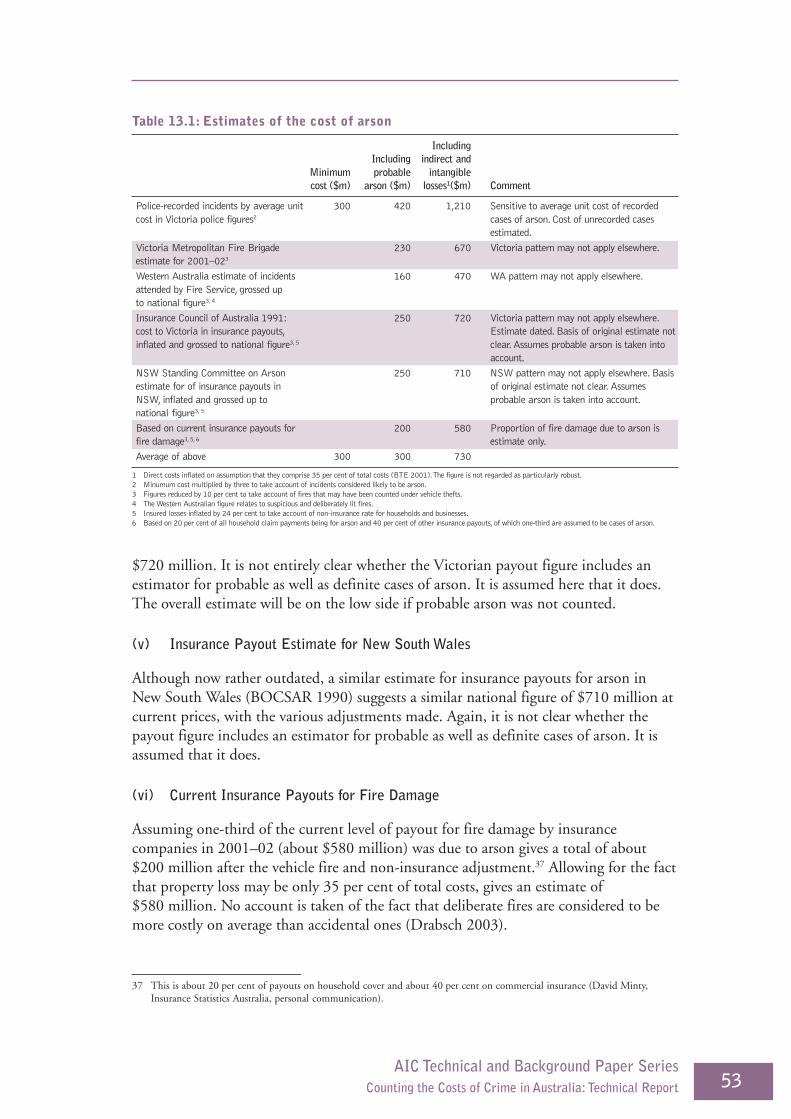
53AIC Technical and Background Paper Series
Counting the Costs of Crime in Australia: Technical Report
$720 million. It is not entirely clear whether the Victorian payout figure includes anestimator for probable as well as definite cases of arson. It is assumed here that it does.The overall estimate will be on the low side if probable arson was not counted.
(v) Insurance Payout Estimate for New South Wales
Although now rather outdated, a similar estimate for insurance payouts for arson inNew South Wales (BOCSAR 1990) suggests a similar national figure of $710 million atcurrent prices, with the various adjustments made. Again, it is not clear whether thepayout figure includes an estimator for probable as well as definite cases of arson. It isassumed that it does.
(vi) Current Insurance Payouts for Fire Damage
Assuming one-third of the current level of payout for fire damage by insurancecompanies in 2001–02 (about $580 million) was due to arson gives a total of about$200 million after the vehicle fire and non-insurance adjustment.37 Allowing for the factthat property loss may be only 35 per cent of total costs, gives an estimate of$580 million. No account is taken of the fact that deliberate fires are considered to bemore costly on average than accidental ones (Drabsch 2003).
37 This is about 20 per cent of payouts on household cover and about 40 per cent on commercial insurance (David Minty,Insurance Statistics Australia, personal communication).
Table 13.1: Estimates of the cost of arson
IncludingIncluding indirect and
Minimum probable intangiblecost ($m) arson ($m) losses1($m) Comment
Police-recorded incidents by average unit 300 420 1,210 Sensitive to average unit cost of recordedcost in Victoria police figures2 cases of arson. Cost of unrecorded cases
estimated.
Victoria Metropolitan Fire Brigade 230 670 Victoria pattern may not apply elsewhere.estimate for 2001–023
Western Australia estimate of incidents 160 470 WA pattern may not apply elsewhere.attended by Fire Service, grossed upto national figure3, 4
Insurance Council of Australia 1991: 250 720 Victoria pattern may not apply elsewhere.cost to Victoria in insurance payouts, Estimate dated. Basis of original estimate notinflated and grossed to national figure3, 5 clear. Assumes probable arson is taken into
account.
NSW Standing Committee on Arson 250 710 NSW pattern may not apply elsewhere. Basisestimate for of insurance payouts in of original estimate not clear. AssumesNSW, inflated and grossed up to probable arson is taken into account.national figure3, 5
Based on current insurance payouts for 200 580 Proportion of fire damage due to arson isfire damage3, 5, 6 estimate only.
Average of above 300 300 730
1 Direct costs inflated on assumption that they comprise 35 per cent of total costs (BTE 2001). The figure is not regarded as particularly robust.2 Minumum cost multiplied by three to take account of incidents considered likely to be arson.3 Figures reduced by 10 per cent to take account of fires that may have been counted under vehicle thefts.4 The Western Australian figure relates to suspicious and deliberately lit fires.5 Insured losses inflated by 24 per cent to take account of non-insurance rate for households and businesses.6 Based on 20 per cent of all household claim payments being for arson and 40 per cent of other insurance payouts, of which one-third are assumed to be cases of arson.
54 Australian Institute of Criminology
Medical Costs, Lost Output and Intangible Losses
Medical, lost output and intangible losses have in effect been taken into account in theBTE estimate that property loss amounts to 35 per cent of total costs. Since the numberof cases of arson is unknown, as well as the breakdown of additional total costs, it is notpossible to give a unit cost for these losses.
The Cost of Dealing with Fires
Productivity Commission figures for 2001–02 give a total cost of funding fires servicesof $1.3 billion (SCRCSSP 2003). It is estimated that 25 per cent can reasonably beallocated to the cost of dealing with arson fires—about $330 million. ProductivityCommission figures for ambulance services was $970 million. It is estimated thatfive per cent can reasonably be allocated to the cost of dealing with arson fires—nearly$50 million.
The Value of Volunteer Time
Volunteers play a significant role in the provision of emergency services in Australia.There is debate about whether voluntary effort should be given a monetary value since itis seen as inconsistent with the motivation of volunteers and the way they think of theircontribution (Industry Commission 1995). Nonetheless, the counter-argument is strongnotwithstanding the question of how volunteer time should be valued, if a valuation ismade.
The Country Fire Authority of Victoria made a detailed assessment of the dollar value ofthe volunteer contribution to fire and ambulance services in Victoria in 2001 (Hourigan2001). From a number of approaches, the preferred one was to value the contribution asequal to the level of funding that would be required to achieve the same service deliverywith paid personnel. The estimate for Victoria was $470 million. Fire-fighting voluntaryeffort in Victoria is particularly substantial and volunteers offer a large proportion(about 64 per cent) of the total number of volunteer hours in Australia (Leon Collett,Australasian Fire Authorities Council, personal communication). Taking this intoaccount gives an Australian figure of $740 million for the value of the contribution ofvoluntary effort. Of this, one-third is set for effort in dealing with arson fires—about$240 million. This figure excludes the costs of salaried personnel who deal withmobilising volunteer effort.

55AIC Technical and Background Paper Series
Counting the Costs of Crime in Australia: Technical Report
Total Costs
Table 13.2 summarises the “best estimate” cost of dealing with arson. It amounts to$1.35 billion. This takes no account of the additional costs of policing, courts and soon, which are subsumed under other costs of dealing with crime (see Section 16).
Table 13.2: Summary of arson costs
$ million
Best estimate of costs of arson1 730
Fire service 2 329
Ambulance service3 49
Volunteer effort4 244
Total 1,350
1 Includes property loss, and estimates for indirect costs and intangible losses.2 15 per cent of fire service costs.3 Five per cent of ambulance service costs.4 Based on 25 per cent of the average number of hours of voluntary work done per year across all sectors.
56 Australian Institute of Criminology
14 Fraud
The Main Costing
Fraud is a generic category of crime that covers a number of offences that have thecommon element of a perpetrator seeking to obtain property by deception (Smith1997). Estimating the cost of fraud is particularly difficult for a number of reasons:
• There are many types of fraud, including credit card fraud, small- and large-scaleemployee fraud, forgery, counterfeiting currency, a variety of welfare benefitfrauds, insurance fraud, identity fraud, Custom and Excise fraud, tax fraud, andcomputer and telecommunications fraud. Although one approach could be tobuild up the overall cost of fraud from estimates of each of these, lack of sounddata on costs precludes this.
• There is likely to be a large amount of “hidden” fraud that does not becomeknown to the police or other accounting agencies. Moreover, it is difficult to sayhow unrecorded frauds differ in value from those that get recorded, and estimateswill be sensitive to the assumption made. In particular, current work shows veryhigh values indeed for many detected serious frauds (for example, Smith 2003),and the extent to which these costs apply to “hidden” serious frauds willsubstantially affect overall fraud cost estimates.
• There are also other uncertainties about costs. For the most serious fraud cases, forexample, criminal courts are often reluctant or unable to make the detailedassessment of losses that might be done in civil proceedings. Victims, too, mightbe unable to calculate losses accurately.
In summary, the approach taken here was as follows.
a. The number of fraud offences recorded by the police in 2001 was multiplied bythe average value of fraud in NSW and Victoria as a guide for Australia as awhole.38
b. An estimate was made of the number of undetected frauds. The average value ofthese was set lower than recorded frauds, but an allowance was made for a smallnumber of very high-value cases.
c. To (a) and (b) were added the value of frauds against the Commonwealth that areinvestigated by the Australian Federal Police, assuming that there is little overlap.Also added was an estimate for undetected frauds against the Commonwealth.
d. (a) to (c) were adjusted to take rough account of lost output and intangible costs.
38 A few business crime surveys provide some figures, but unstable ones for national totals due to small sample sizes. The SmallBusiness Crime Survey (SBCS), for instance, suggests a total of about 50,000 credit card frauds against Australian retailers andabout 6,000 cases of employee fraud. Grossing up from the South Australian Retail Crime and Safety Survey (SARCSS) giveshigher figures: about 270,000 cheque and credit cards frauds and about 365,000 other frauds.
57AIC Technical and Background Paper Series
Counting the Costs of Crime in Australia: Technical Report
Some details are given below for Australian estimates of the costs of some particulartypes of fraud. These are not directly taken into account in the costings in the presentreport because some of the frauds will have been counted within police figures and somewithin the costings for unrecorded frauds.
Police Figures
Individual state police figures give a total of about 110,000 recorded cases of fraud in2001.39 The average cost of a fraud recorded by the police in NSW was nearly $16,700,whereas Victoria police figures suggest a much lower figure of just over $3,000 (with amedian cost of $500). Taking a straight average for the two states ($9,900) and applyingthis to the total number of recorded frauds gives a total of $1.09 billion losses overall forpolice-recorded frauds in Australia. It is assumed that this average takes into accountsome very high-value frauds apart from those dealt with by the Commonwealth (whichare discussed below).
Unrecorded Fraud
There are two elements in relation to unrecorded fraud. One is whether offences aredetected at all, and clearly many are not. The sophistication of fraud detection systemswill play a part here, as evidenced by the finding of an Australian National Audit Officesurvey in 2000 of fraud affecting the Australian public service. This survey found thatagencies reporting most fraud tended to be those with comprehensive fraud systems inplace (ANAO 2000).
The second element in unrecorded fraud is whether, if detected, frauds are then reportedto the police. A fair degree of non-reporting can be expected. Many businesses may feelthat fraud could be difficult or time-consuming to prove, while others may not want toexpose gaps in their business practices. In some cases, victims may not feel it worthbringing to the police’s attention because it is clear that fraudulently obtained moneyhas already been spent. That said, the available evidence gives mixed messages aboutreporting levels. In the Small Business Crime Survey, less than one-quarter of chequeand credit card frauds were reported, and only 14 per cent of employee frauds. Thelatest in a series of Ernst and Young fraud victimisation surveys, conducted in about 15countries, showed a reporting rate of between 20 per cent and 25 per cent (Ernst andYoung 2003). The Scottish Business Crime Survey shows a rather higher figure of 36 percent of frauds reported (Burrows et al. 1999), whereas the South Australia Retail Crimeand Safety Survey gives a much higher figure of 68 per cent, albeit on the basis of asmall sample. The Deakin University and Victoria Police Major Fraud Group’s survey of477 median and large businesses in Victoria found between 65 per cent and 90 per centof frauds were reported, depending on type (Deakin University 1994).
39 State police services define and count fraud in different ways. In Victoria, for instance, the offences are those of “deception”.Offences of “receiving” are included in Western Australia.
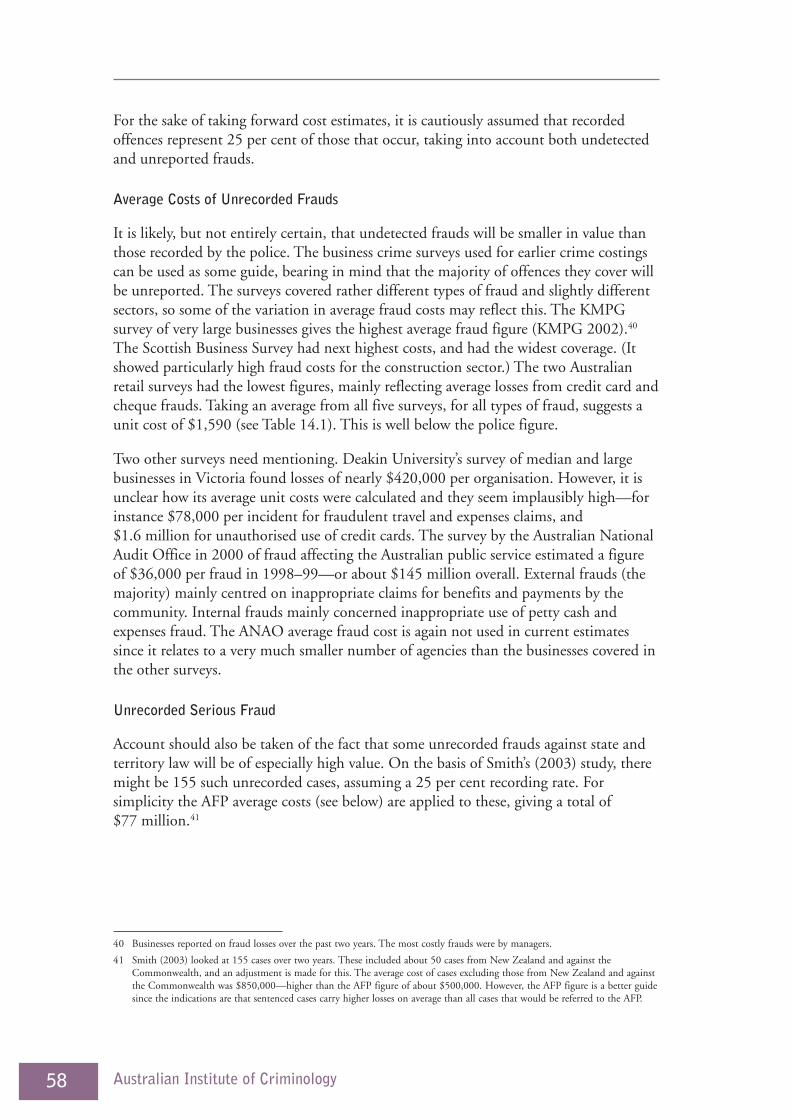
58 Australian Institute of Criminology
For the sake of taking forward cost estimates, it is cautiously assumed that recordedoffences represent 25 per cent of those that occur, taking into account both undetectedand unreported frauds.
Average Costs of Unrecorded Frauds
It is likely, but not entirely certain, that undetected frauds will be smaller in value thanthose recorded by the police. The business crime surveys used for earlier crime costingscan be used as some guide, bearing in mind that the majority of offences they cover willbe unreported. The surveys covered rather different types of fraud and slightly differentsectors, so some of the variation in average fraud costs may reflect this. The KMPGsurvey of very large businesses gives the highest average fraud figure (KMPG 2002).40
The Scottish Business Survey had next highest costs, and had the widest coverage. (Itshowed particularly high fraud costs for the construction sector.) The two Australianretail surveys had the lowest figures, mainly reflecting average losses from credit card andcheque frauds. Taking an average from all five surveys, for all types of fraud, suggests aunit cost of $1,590 (see Table 14.1). This is well below the police figure.
Two other surveys need mentioning. Deakin University’s survey of median and largebusinesses in Victoria found losses of nearly $420,000 per organisation. However, it isunclear how its average unit costs were calculated and they seem implausibly high—forinstance $78,000 per incident for fraudulent travel and expenses claims, and$1.6 million for unauthorised use of credit cards. The survey by the Australian NationalAudit Office in 2000 of fraud affecting the Australian public service estimated a figureof $36,000 per fraud in 1998–99—or about $145 million overall. External frauds (themajority) mainly centred on inappropriate claims for benefits and payments by thecommunity. Internal frauds mainly concerned inappropriate use of petty cash andexpenses fraud. The ANAO average fraud cost is again not used in current estimatessince it relates to a very much smaller number of agencies than the businesses covered inthe other surveys.
Unrecorded Serious Fraud
Account should also be taken of the fact that some unrecorded frauds against state andterritory law will be of especially high value. On the basis of Smith’s (2003) study, theremight be 155 such unrecorded cases, assuming a 25 per cent recording rate. Forsimplicity the AFP average costs (see below) are applied to these, giving a total of$77 million.41
40 Businesses reported on fraud losses over the past two years. The most costly frauds were by managers.
41 Smith (2003) looked at 155 cases over two years. These included about 50 cases from New Zealand and against theCommonwealth, and an adjustment is made for this. The average cost of cases excluding those from New Zealand and againstthe Commonwealth was $850,000—higher than the AFP figure of about $500,000. However, the AFP figure is a better guidesince the indications are that sentenced cases carry higher losses on average than all cases that would be referred to the AFP.
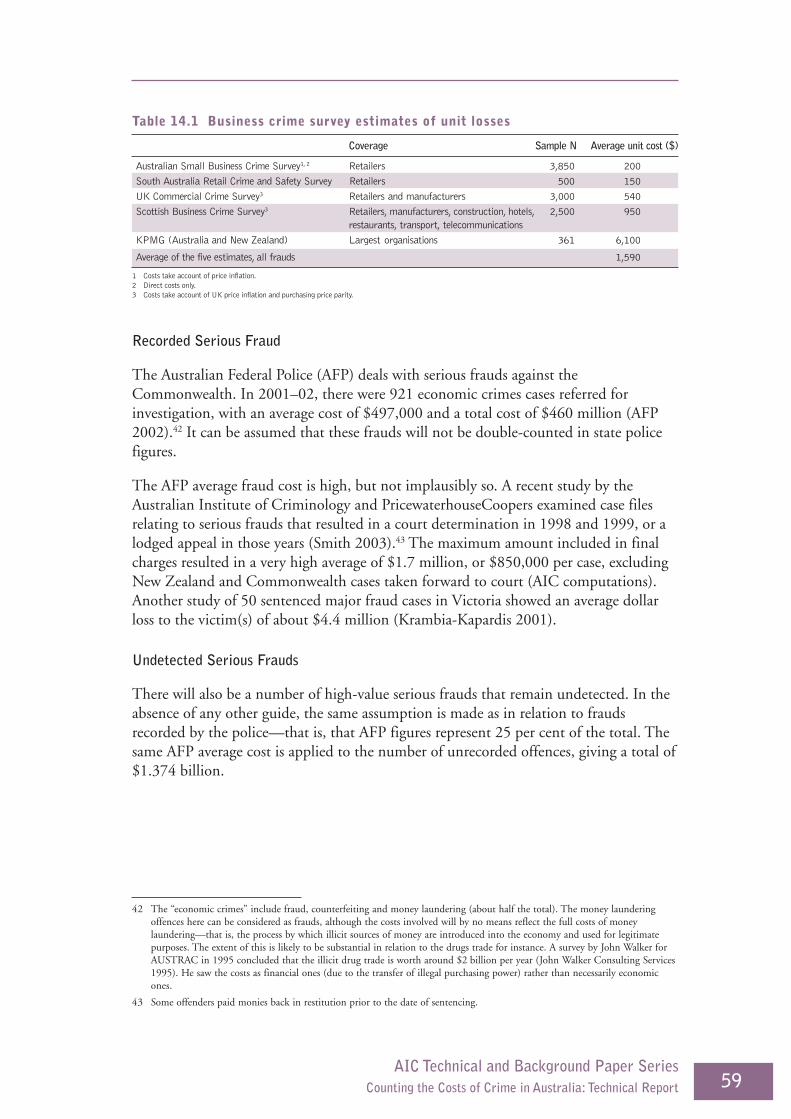
59AIC Technical and Background Paper Series
Counting the Costs of Crime in Australia: Technical Report
Recorded Serious Fraud
The Australian Federal Police (AFP) deals with serious frauds against theCommonwealth. In 2001–02, there were 921 economic crimes cases referred forinvestigation, with an average cost of $497,000 and a total cost of $460 million (AFP2002).42 It can be assumed that these frauds will not be double-counted in state policefigures.
The AFP average fraud cost is high, but not implausibly so. A recent study by theAustralian Institute of Criminology and PricewaterhouseCoopers examined case filesrelating to serious frauds that resulted in a court determination in 1998 and 1999, or alodged appeal in those years (Smith 2003).43 The maximum amount included in finalcharges resulted in a very high average of $1.7 million, or $850,000 per case, excludingNew Zealand and Commonwealth cases taken forward to court (AIC computations).Another study of 50 sentenced major fraud cases in Victoria showed an average dollarloss to the victim(s) of about $4.4 million (Krambia-Kapardis 2001).
Undetected Serious Frauds
There will also be a number of high-value serious frauds that remain undetected. In theabsence of any other guide, the same assumption is made as in relation to fraudsrecorded by the police—that is, that AFP figures represent 25 per cent of the total. Thesame AFP average cost is applied to the number of unrecorded offences, giving a total of$1.374 billion.
42 The “economic crimes” include fraud, counterfeiting and money laundering (about half the total). The money launderingoffences here can be considered as frauds, although the costs involved will by no means reflect the full costs of moneylaundering—that is, the process by which illicit sources of money are introduced into the economy and used for legitimatepurposes. The extent of this is likely to be substantial in relation to the drugs trade for instance. A survey by John Walker forAUSTRAC in 1995 concluded that the illicit drug trade is worth around $2 billion per year (John Walker Consulting Services1995). He saw the costs as financial ones (due to the transfer of illegal purchasing power) rather than necessarily economicones.
43 Some offenders paid monies back in restitution prior to the date of sentencing.
Table 14.1 Business crime survey estimates of unit losses
Coverage Sample N Average unit cost ($)
Australian Small Business Crime Survey1, 2 Retailers 3,850 200
South Australia Retail Crime and Safety Survey Retailers 500 150
UK Commercial Crime Survey3 Retailers and manufacturers 3,000 540
Scottish Business Crime Survey3 Retailers, manufacturers, construction, hotels, 2,500 950restaurants, transport, telecommunications
KPMG (Australia and New Zealand) Largest organisations 361 6,100
Average of the five estimates, all frauds 1,590
1 Costs take account of price inflation.2 Direct costs only.3 Costs take account of UK price inflation and purchasing price parity.
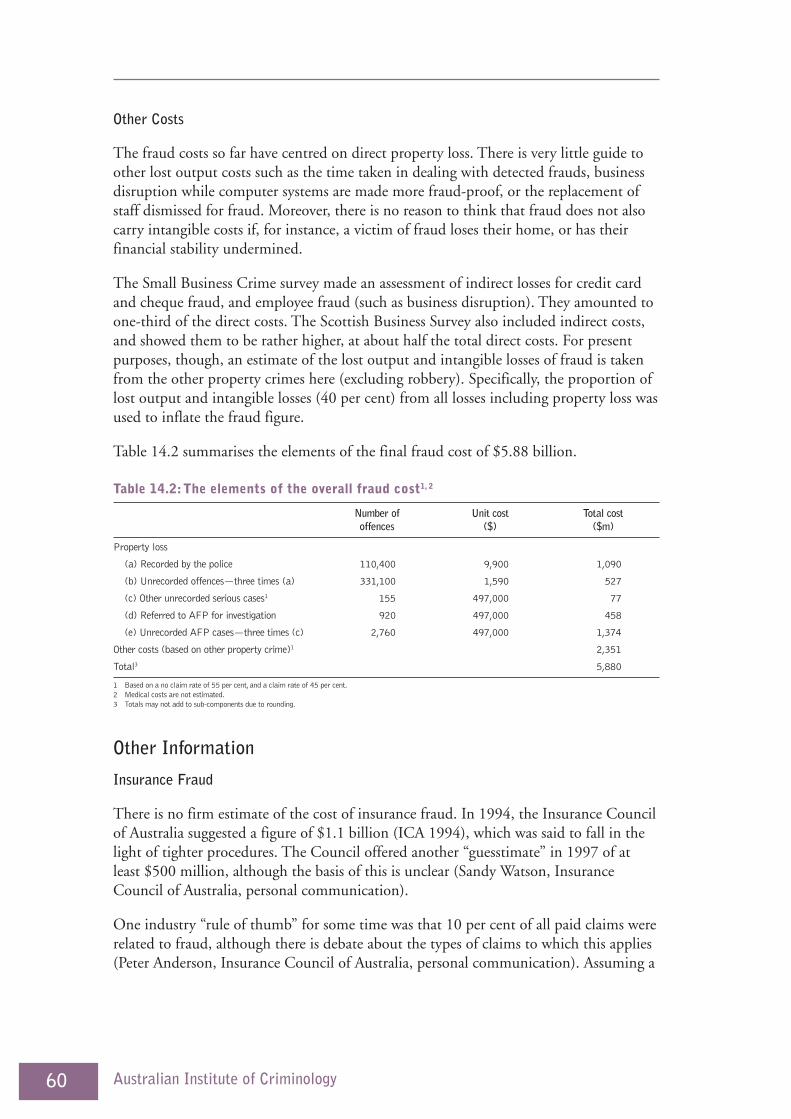
60 Australian Institute of Criminology
Other Costs
The fraud costs so far have centred on direct property loss. There is very little guide toother lost output costs such as the time taken in dealing with detected frauds, businessdisruption while computer systems are made more fraud-proof, or the replacement ofstaff dismissed for fraud. Moreover, there is no reason to think that fraud does not alsocarry intangible costs if, for instance, a victim of fraud loses their home, or has theirfinancial stability undermined.
The Small Business Crime survey made an assessment of indirect losses for credit cardand cheque fraud, and employee fraud (such as business disruption). They amounted toone-third of the direct costs. The Scottish Business Survey also included indirect costs,and showed them to be rather higher, at about half the total direct costs. For presentpurposes, though, an estimate of the lost output and intangible losses of fraud is takenfrom the other property crimes here (excluding robbery). Specifically, the proportion oflost output and intangible losses (40 per cent) from all losses including property loss wasused to inflate the fraud figure.
Table 14.2 summarises the elements of the final fraud cost of $5.88 billion.
Table 14.2: The elements of the overall fraud cost1, 2
Number of Unit cost Total costoffences ($) ($m)
Property loss
(a) Recorded by the police 110,400 9,900 1,090
(b) Unrecorded offences—three times (a) 331,100 1,590 527
(c) Other unrecorded serious cases1 155 497,000 77
(d) Referred to AFP for investigation 920 497,000 458
(e) Unrecorded AFP cases—three times (c) 2,760 497,000 1,374
Other costs (based on other property crime)1 2,351
Total3 5,880
1 Based on a no claim rate of 55 per cent, and a claim rate of 45 per cent.2 Medical costs are not estimated.3 Totals may not add to sub-components due to rounding.
Other Information
Insurance Fraud
There is no firm estimate of the cost of insurance fraud. In 1994, the Insurance Councilof Australia suggested a figure of $1.1 billion (ICA 1994), which was said to fall in thelight of tighter procedures. The Council offered another “guesstimate” in 1997 of atleast $500 million, although the basis of this is unclear (Sandy Watson, InsuranceCouncil of Australia, personal communication).
One industry “rule of thumb” for some time was that 10 per cent of all paid claims wererelated to fraud, although there is debate about the types of claims to which this applies(Peter Anderson, Insurance Council of Australia, personal communication). Assuming a
61AIC Technical and Background Paper Series
Counting the Costs of Crime in Australia: Technical Report
limited set covering fire, household and commercial claims, and employers’ liability(totally about $9.4 million in payouts in 2001–02), this would suggest a figure of$950 million for fraud.
A further adage is that fraud adds about $70 to $100 to each premium paid, though thisis not particularly helpful since it remains unclear which premiums are being referred to.Moreover, a different figure of $21 per premium is also in the arena. The total numberof policies in force in June 2001 was just short of 38 million (although this itself is notregarded as particularly reliable), with the figures for the more limited sectors abovetotalling nearly 26 million. Depending on which figures are used, then, the extent offraud could lie between $540 million and $3,770 million. For what it is worth, thesmaller figure is more in line with other estimates.
Insurance fraud appeared as a small category in Smith’s (2003) examination of seriousfraud cases. It is likely, too, that at least some frauds identified and acted upon byinsurance companies will be notified to the police, so there is some potential for double-counting.
A recent study in the UK by the Association of British Insurers estimated that $1 billionof fraudulent claims are submitted each year on “personal lines general insurance” alone(see ABI 2001; Wojciechowski & Newiss 2003). Adjusting for population andpurchasing price parity, this would suggest a figure of $270 million.
Table 14.3 summaries these various estimates.
Table 14.3 Different estimates of insurance fraud
$ million Comment
Insurance Council of Australia for 1993 1,100 Better procedures may have reduced the figure since 1993
1997 Insurance Council of Australia “guesstimate” 500
Ten per cent of payouts relate to fraudulent claims 950 Based on claims expenses for fire, household and commercialclaims, and employers’ liability
Fraud adds $x to each policy
$100 x 37.7 million policies 3,770
$21 x 25.7 policies 540 Based on policies for fire, household and commercial, andemployers’ liability
Association of British Insurers 270 Adjusted for purchasing price parity and population size.Personal lines general insurance only.
Benefit Fraud
Benefit fraud is likely to be substantial, with much of it undetected. Centrelink referrednearly 3,800 cases for possible prosecution, of which 2,900 (involving nearly$29 million) were taken forward (Charlton 2002). The extent of benefit fraud is likelyto be substantial. Figures for the UK showed that 17 per cent of total fraud costsbetween 2000 and 2002 were the result of fraudulent social benefit claims(Wojciechowski & Newiss 2003).
62 Australian Institute of Criminology
Other Estimates
Walker (1997)
Walker’s (1997) count of the costs of fraud—within the range of $3 billion to$3.5 billion—was based on an estimate by AFP research staff, although its source anddegree of sophistication is undocumented. Taking the mid-point, and allowing forinflation, would give a current figure of just under $3.7 billion. It is assumed that the AFPfigures would not have allowed for indirect or intangible losses, although this is uncertain.
UK Estimates
In the course of the Brand and Price (2000) study, a special costing for fraud in the UKwas commissioned from the National Economic Research Associates (NERA 2000). Itprovided estimates of expenditure on investigations, court proceedings, preventivemeasures and of the amount of money defrauded across the economy. Total estimatedcosts were in the range of £7 billion to £14 billion (1999 prices), with a large proportioncomprising defrauded money. The difficulty of detecting frauds and the limited data insome sectors led NERA to argue for the higher figure, which even then was thought toprobably be an underestimate. However, some of the £14 billion (about 12 per cent)was the cost of dealing with fraud, which under the costing principles here would becounted as part of the overall system costs. Of the remainder, a sizeable 40 per cent werebenefit frauds and 20 per cent Customs and Excise fraud (including the equivalent ofGST fraud), which suggest that these may have been undercounted in the presentAustralian costings. Adjusting for price levels and population size suggests a figure of$5.3 billion if UK figures could be directly read across to Australia.
Another estimate of the cost of fraud in the UK has emerged more recently, drawing ondata from a number of non-police sources (Wojciechowski & Newiss 2003). Theintention was not to estimate a total bill for fraud, and indeed some of the figures arebased simply on detected frauds. Nonetheless, the UK figures are of interest as a guideto the breakdown of different fraud costs. A full 57 per cent of the total ($12 billion)was Custom and Excise fraud. The main component of this (about half the Custom andExcise bill) was tobacco smuggling, which is an unusually attractive illegal option forexploiting European Union price differentials. Another third was GST-equivalent fraud.Again, adjusting for price levels and population size suggests a figure of $5.2 billion forAustralia (much in line with the NERA estimate), or $2.2 billion when Customs andExcise frauds are excluded.
New Developments
Under the new Commonwealth fraud control guidelines, all Commonwealth agenciesare required to report the level of fraud detected and dealt with each year. This willprovide a more accurate indication of fraud losses at least for the Commonwealth sector.There is also work started by the Securities Industry Centre for the Asia-Pacific on theAustralian cost of identity fraud—which is a key element in many fraudulenttransactions. This involves a complex modelling process that makes use of existingsources of information as well as surveys of relevant agencies and individuals.
63AIC Technical and Background Paper Series
Counting the Costs of Crime in Australia: Technical Report
15 Drug Offences
Drug offences fall into two main categories: (a) cultivation, manufacture, dealing andtrafficking, and (b) possession and use of illicit substances. For both, estimates of thenumber of offences are difficult, with police figures an unreliable guide. In any case, themain costs of illicit drug use arise principally from the consequences of abuse. There arethree main components:
• The “human costs” costs of drug abuse. These fall in part on health and socialservices since use of illicit drugs is a direct cause of death as well as a risk factor forHIV/AIDS, hepatitis C, suicide, self-inflicted injury and other health problems.An estimate is made below of some of these human costs.
• The cost of offences committed to fund a drug habit. This will have beenincluded within the relevant offence categories earlier in this report (burglary andshoplifting for instance), but there is some further discussion of this cost below.
• Considerable law enforcement costs in preventing trafficking and drug-relatedcriminal activity. These are picked up in the general criminal justice systemcosting in Section 16. They include the cost of the Australian Federal Police, andan estimate of five per cent of expenditure by the Australian Customs Servicespent on drug enforcement.
The Human Costs
Deaths
Ridolfo and Stevenson (2001) estimated that there were 1,023 deaths in Australia in1998 attributable to illicit drug misuse, including deaths from maternal drugdependence and suicide. This is a well established estimate (see, for example, AIHW2003; Mathers et al. 1999), but a higher one than the alternative count of deaths inwhich opioid overdoes is the underlying cause (Degenhardt 2002).44 The ratio of thefirst to the second in 1998 was 1.39. In 2001, there were 306 opioid overdose deaths (alarge fall on the previous year). These were inflated by 1.39 for a more completeestimate of deaths due to illicit drug misuse in 2001.
Taking the medical and lost-productivity costs that were used for homicide gives a costof about $510 million. There is room for debate as to whether lost productivity shouldbe counted at the same level as for victims, since it is likely that drug users lead lessproductive lives. The position here is that without drug misuse, productivity might beequal to that of the general population.
An additional number of deaths in which opioids were a contributory factor arediscounted.
44 These are deaths among 15–44-year-olds, but relatively few people older than this die as a result of opioid overdose.

64 Australian Institute of Criminology
Hospitalisation
Ridolfo and Stevenson (2001) provide a figure of 14,470 people treated in hospital fordrug dependence in 1998.45 Given the drop in serious drug misuse since then, in part asa result of the heroin shortage (Intergovernmental Committee on Drugs 2002), it isreasonable to assume that admissions to hospital will be lower than in 1998. The extentof the drop in opioid overdose deaths was taken as the best guide to this (they fell 42 percent between 1998 and 2001).46 The estimated number of hospitalisations was just over6,000.
Taking simply the current Productivity Commission average cost of someone admittedto hospital (about $2,800) gives an estimated cost of $17 million.47 Emergencyadmissions not leading to a stay in hospital outweigh separations by a factor of aboutseven to one for cases due to injury and poisoning (Helps et al. 2002). Adopting thissame ratio for drug dependence cases, and applying the current average cost ofemergency treatment gives an estimate of about $9 million.48 There will also be costs ofGP visits, but these are omitted due to lack of data. The total cost, then, ofhospitalisations and emergency department visits might cost in the region of$26 million.
Drug Users in Treatment
The Australian Institute of Health and Welfare provides figures for 2000–01 of thenumber of people registered as seeking treatment at publicly funded government andnon-government drug treatment centres (AIHW 2002). This is pilot-study data, andfigures for Queensland are not available. Data were provided by 93 per cent of “in-scope” agencies, excluding Queensland. Adjustments have been made for both under-counts. The AIHW figures will not provide a complete picture of resources devoted todrug users, but they are a useful start.49
• There were an estimated 67,000 clients who sought treatment for illicit drugdependence in 2000–01. There is no breakdown between those receivingresidential and non-residential community care, but a guide to this was takenfrom the 2001 one-day survey of Clients of Treatment Service Agencies (COTSA)(see Shand & Mattick 2002). The indications are that about 40 per cent weretreated in residential units. Taking the COTSA figure of an average stay of55 days, together with an indicative cost of $220 per day for treating mental
45 The Ridolfo and Stevenson approach is based on the aetiological fraction methodology that enables estimates of theproportion of cases of illness or injury that can be attributed to a risk factor—in this case illicit drug use.
46 With a more restricted coverage than Ridolfo and Stevenson, Grant and Petrie (2001) provide a figure of nearly 7,000 hospital“separations” in 1997–98 with a principal diagnosis of drug dependence. This will include those who die, and is thus fairlyclose to the present estimates.
47 This is the recurrent cost per casemix-adjusted separation in selected public hospitals (see Table 9A.26 in the 2003Productivity Commission report).
48 See Table 9A.29 in the 2003 Productivity Commission report
49 The data cover a wide variety of treatment services including detoxification and rehabilitation programs, pharmacological andpsychological treatments. Specialist drug units based in acute care hospital or psychiatric hospitals are included if they providetreatment on an outpatient basis. (Units that provide treatment to inpatients are also included.) Excluded are agencies whosemain function is to provide accommodation, needle and syringe exchange programs, treatment services in prison and othercorrectional institutions, and private treatment agencies not publicly funded. Also excluded are most Indigenous substance useservices and Aboriginal Health Services providing treatment for drug problems.

65AIC Technical and Background Paper Series
Counting the Costs of Crime in Australia: Technical Report
health patients in residential settings, gives an overall cost of about $320 million.Applying to the remainder the average case cost of about $1,200 for mental healthpatients treated in non-residential units, suggests an additional cost of just under$50 million.50 This gives an overall total of $370 million for out-of-hospital drugtreatment.
• These costs, while appreciable, are unlikely to be a full tally of the health resourcesspent on drug abuse. For one, mental health costs are not counted even thoughlonger-term use of drugs can exacerbate an existing tendency towards mentaldisorder, or cause it to occur. Nor is any allowance made for a range of services fordrug users such as the provision of accommodation, needle and syringe exchangeprograms, treatment services based in prison and other correctional institutions,and private treatment agencies that are not publicly funded.
Methadone Maintenance
An estimated 32,500 people were receiving methadone maintenance treatment in 2000–01 (AIHW 2002).51 The average cost of treatment is currently estimated to be about$3,000. There is uncertainty about retention rates and average duration of treatment,but simply multiplying the number under treatment by the average cost gives an overallcost of nearly $100 million.
Lost Productivity
Lost productivity due to drug misuse is hard to ascertain given that drug users may beeconomically under-productive. Nonetheless, taking MUARC’s lost productivityestimates for victims of violent crime as a guide suggests that lost output for thosehospitalised and treated in residential units may amount to about $800 million. Forthose treated in emergency departments and non-residential settings, there could be afurther bill of $160 million, bringing the total to $960 million. These figures leave asideany lost productivity from drug users not in treatment. Their numbers could beappreciable; present estimates indicate, for instance, that only about 30 per cent of illicitopioid users are in treatment.
Table 15.1 summarises the human costs of drug abuse presented above.
Drug-attributable Crime
There is much speculation about the proportion of crime that is committed to fund adrug habit (see, for example, Makkai 2002). This is not easy to guage. For one, it isdifficult to be sure that the need for “drug money” is the main cause of offending, ratherthan being simply a contributory factor. It is also necessary to know the rate at whichthose dependent on drugs offend relative to other offenders.
50 See Table 11A.60 in the 2003 Productivity Commission report, and Table 11A.51 for the costs of residential mental healthcare per day.
51 This includes those in prison receiving treatment.

66 Australian Institute of Criminology
The most useful data to assess the costs of drug-attributable crime come from theAustralian Institute of Criminology’s survey of police detainees—the Drug UseMonitoring in Australia (DUMA) project. This was used to provide information forCollins and Lapsley’s (2002) study of the economic effects of drug abuse (see below).Detainees’ reasons for why they committed the offence for which they were arrestedsuggest that 43 per cent of property crimes and 27 per cent of violent crimes are causallyattributable to illicit drug consumption—the so-called “attributable fractions” (Makkai& McGregor 2002).
One caveat about these figures is the veracity of the arrestees’ accounts; some arresteesmay “deny” that drug dependence led to offending. Another is the extent to whichdrug-using offenders might be differentially likely to be arrested—and there is someevidence that this might be the case (see, for example, Chaiken & Chaiken 1990). Athird caveat is that the data relate to offenders not offences. To the extent that drug-dependent offenders might commit more undetected offences than other offenders,then the attributable fractions will understate drug-attributable crime.
This said, applying the attributable fractions suggests that some $3.7 billion of the totalcosts of the property and violent crimes considered so far can be put down to drugdependency.52 This is in addition to the $1.9 billion cost of drug misuse already countedin Table 15.1, making a total of $5.6 billion. This amounts to 29 per cent of the$19 billion cost of crime that has been accounted for so far. Some proportion of othercosts that are considered in Section 16—policing for instance—can of course also be setagainst drug misuse, although no attempt is made to assess this.
Table 15.1: Some human costs of drug misuse
$ million
Opioid overdose deaths1 510
Medical costs of hospitalisation2 26
Drug treatment costs3 370
Methadone maintenance 100
Lost productivity4 960
Total5 1,960
1 Medical and lost productivity costs as estimated for homicide.2 Those admitted to hospital and emergency department non-inpatients.3 Those treated in residential and non-residential units.4 Those treated in hospital; residential and non-residential centres.5 Totals may not add to sub-components due to rounding.
52 This was calculated by (i) applying the attributable fraction of 43 per cent for property crime to burglary, thefts of and frommotor vehicles, shoplifting and other theft; (ii) the 27 per cent violent crime fraction to all robbery (although Makkai &McGregor 2002 used this only for armed robbery); and (iii) the eight per cent “other crime” fraction to criminal damage andarson. An adjustment was made for violent crime (homicide, assault and sexual assault); the 27 per cent attributable fractionwas halved on the assumption that drugs are involved less often in the large number of violent incidents which tend to goundetected by the police (for example, domestic violence). Another adjustment was made for fraud, where the 43 per centproperty crime attributable fraction was reduced by a factor of four on the assumption that drug-related fraud will tend to berelatively low in value.

67AIC Technical and Background Paper Series
Counting the Costs of Crime in Australia: Technical Report
Other Estimates
Collins and Lapsley
Collins and Lapsley (2002) have recently costed the economic effects of drug abuse(tobacco, alcohol and illicit drugs) in Australia.53 They estimated nearly $3 billion forthe crime-related costs of illicit drug abuse in Australia.54 The largest component of thiswas police costs (about 45 per cent of the total). Other significant components were thelost productivity of prisoners (about 25 per cent) and the value of property crime likelyto have been committed to sustain a drug habit (15 per cent). The full costs of illicitdrugs, taking into account costs to do with crime, health, lost productivity and roadaccidents, was estimated at just over $6 billion, of which 45 per cent were crime-relatedcosts.
For the crime costs, Collins and Lapsley evaluated the total cost of a particular activity(for example, policing) and then estimated the proportion causally attributable to (asopposed to related to) drug use—the attributable fractions. These were developed usingthe AIC’s Drug Use Monitoring in Australia (DUMA) survey of those detained by thepolice (referred to above), and the AIC’s Drug Use Careers of Offenders (DUCO)survey of prisoners in Australia. The drug-related cost of property crime was based onAIC estimates of the value of property theft attributable to illicit drug consumption in1991–02 (Carcach & Makkai 1998).
Collins and Lapsley’s figures are not readily comparable to the present estimates for anumber of reasons:
• In the present estimates, criminal justice system costs (such as police and courts)are estimated at aggregate level.
• Collins and Lapsley’s estimate of intangible costs is based on a “willingness to pay”approach, which produces higher values than the approach taken here for othercrimes (see Section 1).
• In estimating health costs and lost productivity, Collins and Lapsley adopt adifferent “demographic” approach, rather than the human capital approachadopted in the present report. The demographic approach compares the actualpopulation size and structure with the size and structure of a hypotheticalalternative no-abuse population. It produces costs in the year of study of past andpresent substance abuse and calculates the present production costs of abuse-induced deaths and impairment that occurred in past and present years. Thehuman capital approach, in contrast, calculates present and future productioncosts of events that occur in the present year. Collins and Lapsley adopt the
53 Their definition of the costs of drug abuse is: “The value of the net resources which in a given year are unavailable to thecommunity for consumption or investment purposes as a result of the effects of past and present drug abuse, plus intangiblecosts imposed by their abuse. This takes account of the fact that costs in a given year arise from abuse in earlier periods.”
54 The four models of drug-attributable crime are: (i) because the drugs themselves induce antisocial or criminal behaviour;(ii) drug dependency compels addicts to derive income from crime; (iii) crimes result from the involvement in the illegal economyrelated to drugs; or (iv) drug-related actions (for example, drink driving, drug manufacture) are themselves defined as criminal.
68 Australian Institute of Criminology
demographic approach since their intention was to estimate the costs of drugabuse that are borne in a given year. The human capital approach is morecommon in relation to estimating the costs of crime.
Australian Federal Police
The Intergovernmental Committee on Drugs (2002) provides a figure from the AFPDrug Harm Index that represents the dollar value of harm that would have ensued hadthe drugs seized by the AFP and Customs reached the community.55 The Index includesboth domestic and international seizures where Commonwealth law enforcement playeda significant role. The value of harm avoided was about $600 million in 2000–01, andwas expected to exceed $700 million in 2001–02.
This is a useful figure, but not one that can be readily used in the present study since theIndex subsumes costs already counted—for example, criminal justice costs.
Other Points
Money Laundering
No estimate has been made here of the costs of money laundering in relation to thedrug trade—that is, the process by which illicit sources of money from drugs areintroduced into the economy and used for legitimate purposes. A survey by John Walkerfor AUSTRAC in 1995 concluded that the illicit drug trade is worth around $2 billionper year (John Walker Consulting Services 1995). He saw the costs as financial ones(due to the transfer of illegal purchasing power) rather than necessarily economic ones.
Omissions
A number of omissions have been mentioned above. The following costs have also beenommitted:
• any health care costs or lost productivity incurred by victims who are injured bythose who are drug dependent;
• intangible costs, for one because drug abuse might be considered a “willingchoice”;
• social welfare payments for those who are drug dependent and their families; and
• drug abuse health care services such as drug awareness programs, training andresearch.
55 The Index is restricted to the major illicit imported drugs such as heroin and cocaine. It does not include other drugs seized(such as cannabis). The economic estimate of harm avoided was based on analysis of United States reports of direct economicmeasures of drug-related harm and total expenditures on illicit drugs (Office of National Drug Control Policy 2001). See alsoMcFadden et al. 2002.
69AIC Technical and Background Paper Series
Counting the Costs of Crime in Australia: Technical Report
16 Other Costs
Criminal Justice System
Productivity Commission figures for 2001–02 are used as the main basis of criminaljustice system costs (SCRCSSP 2003). They cover the police, court administration andcorrective services. The cost of juvenile justice is not included, and some estimation isnecessary. No account is taken of the fact that revenue is generated from criminal justicesystem employment.
Police
The total cost of the police in 2001–02 was assessed at $4,610 million. Since policeduties range wider than crime prevention and law enforcement, a reduction of 30 percent was made, which in part accounts for the 10 per cent of policing costs spent ontraffic safety and management. This gives a total of $3,230 million. The 30 per centreduction is without a particularly firm empirical base, but was taken with advice fromthe Australasian Centre for Policing Research.56
The reduction is broadly in line with an estimate derived by setting the time spent bythe police on the crimes covered here as a proportion of all detainee hours spent inpolice custody regarding those crimes (75 per cent).57 The detainee data came from the1995 National Police Custody Survey (Carcach & McDonald 1997).
Court Administration
The full cost of court administration was about $410 million. This includes the cost ofhandling juveniles in courts, as well as the cost of coronial courts. It does not include thecost of administering civil courts.
Corrective Services
Corrective services covers custody in both public and private prisons, and a range ofcommunity correctional orders and programs for adult offenders. The full costs amountto $1,590 million.
56 A police activity survey in 1995 in Queensland showed that only around one-third of calls responded to by the police led to acriminal offence being recorded—although admittedly many other calls required some kind of enforcement roles and not allcalls would have concerned crime (Criminal Justice Commission 1996).
57 Collins and Lapsley (2002) also used this apportioning approach in assessing policing costs in relation to drug-related crime.
70 Australian Institute of Criminology
Other Portfolios
There are a number of other agencies whose costs are taken into account. They includethe Commonwealth Attorney-General’s Department ($350 million), the AustralianFederal Police ($304 million), the Office of the Director of Public Prosecution($60 million), the National Crime Authority—now the Australian Crime Commission($59 million), and other agencies (such as AUSTRAC, the Australian Institute ofCriminology and the Criminology Research Council). The data come fromappropriation figures from the Attorney-General’s portfolio (departmental outputs andadministered expenses). The overall total is estimated to be $820 million.
Juvenile Justice
As said, the Productivity Commission report does not bring together the cost of dealingwith juvenile offenders. In New South Wales, juvenile justice is the responsibility of aseparate department, and their expenditure figures are available, amounting to nearly$120 million in 2001–02 (NSW Department of Juvenile Justice 2003). Accepting theNSW expenditure as indicative of that in other states gives an estimated total forAustralia of $350 million. This covers youth justice conferencing, community-basedservices, custodial services and the youth drug court.
Another estimate was made which is more speculative and produces a slightly lowerfigure of $286 million. This estimate, which is not relied on in this study, took accountof three main elements:
• The first was the likely number of juveniles dealt with under diversionaryprograms, case conferencing and supervision orders. The average adult cost of acommunity correction was applied to this. The number of juveniles so dealt withwas estimated from O’Connor and Cameron (2002), who looked at how juvenileswere dealt with in four states in 1999.58
• The second was the number of juveniles detained in correctional institutions, towhich twice the adult correctional institution cost was applied. (The doubling ofcosts was on the advice of the NSW Department of Juvenile Justice.)
• The third was an estimate of the proportion of costs spent on child protection,out-of-home care, and supported assistance and accommodation services thatmight be attributed to juvenile offenders. The proportion was set at 15 per cent.
Table 16.1 summaries the criminal justice system costs.
58 Rates of disposals were taken at the same level as in 1999, but applied to the number of juveniles in 2001.
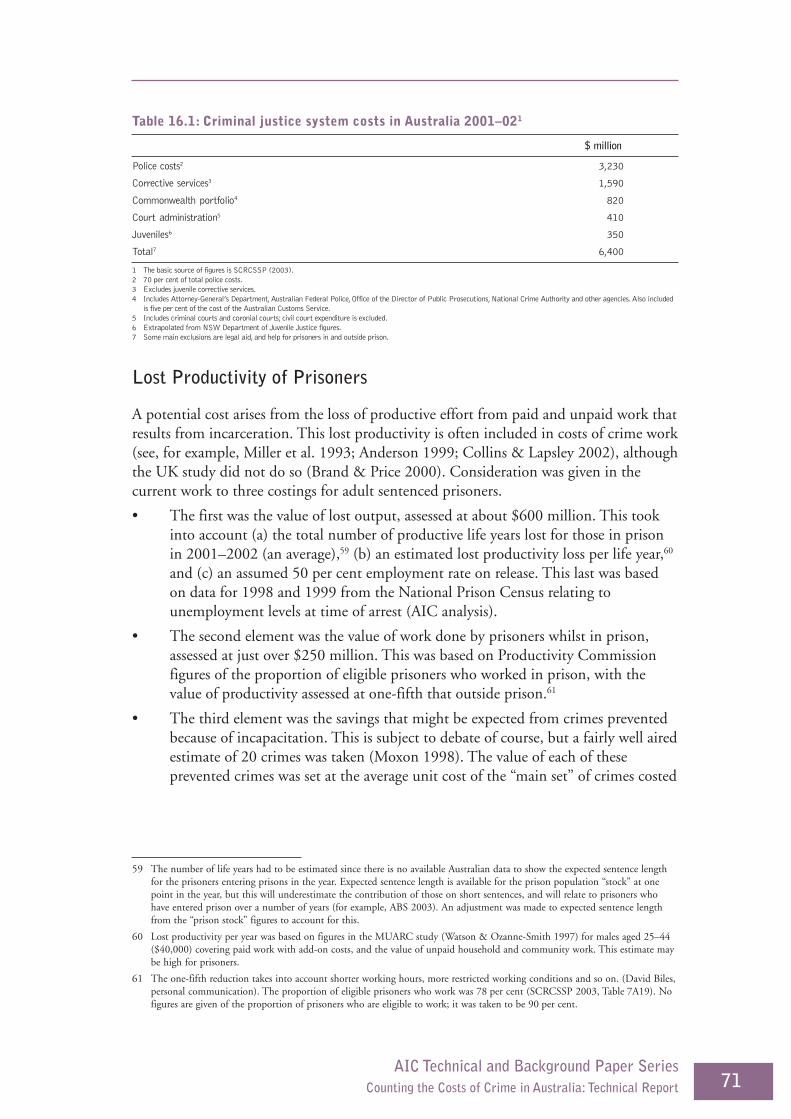
71AIC Technical and Background Paper Series
Counting the Costs of Crime in Australia: Technical Report
Lost Productivity of Prisoners
A potential cost arises from the loss of productive effort from paid and unpaid work thatresults from incarceration. This lost productivity is often included in costs of crime work(see, for example, Miller et al. 1993; Anderson 1999; Collins & Lapsley 2002), althoughthe UK study did not do so (Brand & Price 2000). Consideration was given in thecurrent work to three costings for adult sentenced prisoners.
• The first was the value of lost output, assessed at about $600 million. This tookinto account (a) the total number of productive life years lost for those in prisonin 2001–2002 (an average),59 (b) an estimated lost productivity loss per life year,60
and (c) an assumed 50 per cent employment rate on release. This last was basedon data for 1998 and 1999 from the National Prison Census relating tounemployment levels at time of arrest (AIC analysis).
• The second element was the value of work done by prisoners whilst in prison,assessed at just over $250 million. This was based on Productivity Commissionfigures of the proportion of eligible prisoners who worked in prison, with thevalue of productivity assessed at one-fifth that outside prison.61
• The third element was the savings that might be expected from crimes preventedbecause of incapacitation. This is subject to debate of course, but a fairly well airedestimate of 20 crimes was taken (Moxon 1998). The value of each of theseprevented crimes was set at the average unit cost of the “main set” of crimes costed
Table 16.1: Criminal justice system costs in Australia 2001–021
$ million
Police costs2 3,230
Corrective services3 1,590
Commonwealth portfolio4 820
Court administration5 410
Juveniles6 350
Total7 6,400
1 The basic source of figures is SCRCSSP (2003).2 70 per cent of total police costs.3 Excludes juvenile corrective services.4 Includes Attorney-General’s Department, Australian Federal Police, Office of the Director of Public Prosecutions, National Crime Authority and other agencies. Also included
is five per cent of the cost of the Australian Customs Service.5 Includes criminal courts and coronial courts; civil court expenditure is excluded.6 Extrapolated from NSW Department of Juvenile Justice figures.7 Some main exclusions are legal aid, and help for prisoners in and outside prison.
59 The number of life years had to be estimated since there is no available Australian data to show the expected sentence lengthfor the prisoners entering prisons in the year. Expected sentence length is available for the prison population “stock” at onepoint in the year, but this will underestimate the contribution of those on short sentences, and will relate to prisoners whohave entered prison over a number of years (for example, ABS 2003). An adjustment was made to expected sentence lengthfrom the “prison stock” figures to account for this.
60 Lost productivity per year was based on figures in the MUARC study (Watson & Ozanne-Smith 1997) for males aged 25–44($40,000) covering paid work with add-on costs, and the value of unpaid household and community work. This estimate maybe high for prisoners.
61 The one-fifth reduction takes into account shorter working hours, more restricted working conditions and so on. (David Biles,personal communication). The proportion of eligible prisoners who work was 78 per cent (SCRCSSP 2003, Table 7A19). Nofigures are given of the proportion of prisoners who are eligible to work; it was taken to be 90 per cent.
72 Australian Institute of Criminology
in this work ($690 per average incident, covering all forms of losses).62 On thebasis of the average number of people in prison in 2001 and 2002, the total crimesaving amounts to about nearly $300 million.
These calculations are suggestive only. For instance, actual labour force participationlevels after release are not certain. The relative value of work inside and outside prison isalso somewhat debatable. And the amount and value of crime prevented byincarceration is subject to a wide margin of error. Nonetheless, the three costings wouldsuggest a final lost productivity cost of about $50 million. Given the uncertainty, it isnot included as a cost of crime.
Victim Assistance
A number of elements of assistance to victims were costed, although they are unlikely toencompass anything like the full expenditure on dealing with the consequences ofvictimisation. Victim Support Australasia helped with the collection of informationfrom states and territories on some of the cost elements.
Criminal Injury Compensation
All states and territories have schemes to provide financial assistance or compensation tocrime victims, although they differ in detail. The total amount spent in 2001–02 wasnearly $180 million, although it is difficult in some cases to know whether the costscover simply awards made, or administrative costs as well.
Victim Support Services
Each jurisdiction has service networks for victims. Some are located within thegovernment sector and some outside it. Information on expenditure mainly covers theadministrative costs of running victim service units within government departments,with the total amounting to almost $15 million. (Where information was unavailable,expenditure was set to the average of jurisdictions for which costs were known.) Anylocal government or Health Department spend is unaccounted for.
The Value of Volunteer Time
The issue of costing volunteer time was taken up in relation to the contribution ofvolunteers in fighting arson fires.
There is no firm estimate of the amount of volunteer time spent on services for victims.However, the ABS (2000a) estimates that a total of just over 180 million voluntaryhours were spent in 2000 on community and welfare volunteering activities, about aquarter of the total volunteering time. An estimated five per cent of these hours havebeen taken here as being directed towards services for victims of crime (nine millionhours in total). This amounts to just over one per cent of all voluntary activity.
62 The main set of offences are the violent and property crimes excluding arson, fraud and drug misuse.
73AIC Technical and Background Paper Series
Counting the Costs of Crime in Australia: Technical Report
The ABS generally recommends a “market replacement cost” approach to costingvolunteer time, which is essentially the cost in wages of hiring others to do the work(ABS 2000b). Average hourly earnings can be taken as an approximation of this.Applying the current average hourly earning level gives a total value of about$200 million of voluntary time. This figure excludes the costs of salaried personnel involuntary organisations, although some of this may have been subsumed undergovernment funding for victim services.
Child Protection
The Productivity Commission accounts for some relevant spend in relation toprotection and support services concerning:
• child protection (child abuse and neglect);
• out-of-home care services (for children placed away from parents for protective orfamily welfare reasons); and
• the Supported Accommodation Assistance Program (SAAP), which assists thehomeless and those at risk.
The total bill in 2001–02 for child protection and out-of-care services was $796 million.The assumption is made that half of this can be set against criminal child abuse, giving atotal of nearly $400 million.
Housing Assistance for Domestic Violence
From agency figures, it appears that 25 per cent of SAAP expenditure was directed at“women escaping domestic violence”.63 This gives a total of just under $70 million.
Office of the Status of Women
An additional cost that can be added is the spend by the Office of the Status of Women(OSW) on support for a number of programs to tackle violence within the family. Thesum amounts to an estimated $20 million in 2001–02.64
Table 16.2 shows the spend on victims.
63 The proportion of SAAP expenditure for domestic violence was 23 per cent, but there was a further 20 per cent in the “crosstarget/multiple/and general” group. Most of the other SAAP spend is directed to assisting young people.
64 The elements are: (a) $1.875 million estimated for the “violence” area of the OSW budget; (b) $4.1 million as the one-yearspend on the National Initiative to Combat Sexual Assault; (c) $12.5 million for the one-year spend on Partnerships AgainstDomestic Violence; and (d) $1.5 million for the one-year spend on the National Indigenous Family Violence Grants program.

74 Australian Institute of Criminology
Security Industry
The Australian Security Industry Association Limited provided the following figures forprivate security turnover in 2001–02 (Brian de Caries, ASIAL, personal communication).
Table 16.2: Estimated costs of provisions for victims
$ million
Child protection 398
Volunteer effort 200
Criminal Injuries Compensation1 178
Housing assistance for victims of domestic violence 69
Office of the Status of Women 20
Victim support units2 15
Total 880
1 Estimate for Northern Territory. Queensland includes payments to secondary victims of crime.2 Estimates for Western Australia and Northern Territory.
Not all of these costs could be seen as attributable to the crimes covered here. Industryadvice is that it would be reasonable to attribute 80 per cent of these costs to crime. Thisgives a total of about $3,140 million.
Insurance Administration
Insurance Statistics Australia estimates a figure of $500 million in Australia in 2001–02as the costs of administering insurance for theft and damage—about 15 per cent of thevalue of premiums (David Minty, ISA, personal communication).
Table 16.3: Expenditure on private security in Australia, 2001–02
$ million
Hardware and electronics
Hardware and equipment (alarms, CCVT, access control) 590
Installation 675
Monitoring 260
Other 305
Total 1,830
Manpower
Including customer services, loss prevention, retail security, concierge and reception desks,corporate risk, investigation service, cash collection, armed escorts, client banking. ATMservices, security at special events and document and data storage and destruction 2,090
Overall total 3,920
75AIC Technical and Background Paper Series
Counting the Costs of Crime in Australia: Technical Report
References
Anderson, D.A. 1999, “The aggregate burden of crime”, Journal of Law and Economics, vol. 42, no. 1,pp. 611–42.
Association of British Insurers (ABI) 2001, Fraud: It Honestly Does Not Pay, Briefing Note, ABI, London.
Attorney-General 1998, 1997 Retail Crime and Safety Survey, South Australian Attorney-General’sDepartment, Crime Prevention Unit, Adelaide.
Australian Bureau of Statistics 1996 Women’s Safety Australia, cat. no. 4128.0, ABS, Canberra.
—— 1999, Crime and Safety Australia, cat. no. 4509.0, ABS, Canberra.
—— 2000a, Voluntary Work, Australia, cat. no. 4441.0, ABS, Canberra.
—— 2000b, Unpaid Work and the Australian Economy, 1997, cat. no. 5240.0, ABS, Canberra.
—— 2002, Recorded Crime, Australia, cat. no. 4510.0 (and companion tables), ABS, Canberra.
—— 2003, Prisoners in Australia, cat. no. 4517.0, ABS, Canberra.
Australian Federal Police (AFP) 2002, Annual Report 2000–2001, AFP, Canberra.
Australian Institute of Health and Welfare (AIHW) 2003, Statistics on Drug Use in Australia 2002,cat. no. PHE 43, Australian Institute of Health and Welfare, Canberra.
—— 2002, Alcohol and Other Drug Treatment Services in Australia 2000–01: First Report on the NationalMinimum Data Set, cat. no. HSE 22, Australian Institute of Health and Welfare, Canberra.
Australian National Audit Office (ANAO) 2000, Survey of Fraud Control Arrangement in APS Agencies,Audit Report No. 47, Australian National Audit Office, Canberra.
Baldock, T. 1997, “Insurance fraud”, Trends and Issues in Crime and Criminal Justice, no. 66, AustralianInstitute of Criminology, Canberra.
Brand, S. & Price, R. 2000, The Economic and Social Costs of Crime, Home Office Research StudyNo. 217, Home Office, London.
Bureau of Crime Statistics and Research (BOCSAR) 1990, “Arson in NSW”, Crime and Justice Bulletin,no. 7, NSW Bureau of Crime Statistics and Research, Sydney.
Bureau of Transport Economics (BTE) 2000, Road Crash Costs in Australia, Report 102, Bureau ofTransport Economics, Canberra.
—— 2001, Economic Costs of Natural Disasters in Australia, Report 103, Bureau of Transport Economics,Canberra.
Burrows, J., Anderson, S., Bamfield, J., Hopkins, M. & Ingram, D. 1999, Counting the Cost: Crimeagainst Business in Scotland, Scottish Executive, Central Research Unit, Edinburgh.
Burrows, J., Tarling, R., Mackie, A., Lewis, R. & Taylor, G. 2000, Review of Police Forces’ Crime RecordingPractices, Home Office Research Study No. 204, Home Office, London.
Carcach, C. & Makkai, T. 2002, Review of Victoria Police Crime Statistics, Research and Public PolicySeries, no. 45, Australian Institute of Criminology, Canberra.
—— 1998, “Cost of drug-related property crime in Australia”, Australian Institute of Criminology,Canberra, unpublished.
Carcach, C. & McDonald, D. 1997, National Police Custody Survey, Research and Public Policy Series,no. 9, Australian Institute of Criminology, Canberra.
76 Australian Institute of Criminology
Chaiken, J. & Chaiken, M. 1990, “Drugs and predatory crime”, in M. Tonry & J. Wilson (eds), Drugsand Crime, University of Chicago Press, Chicago.
Charlton, K. 2002, “Using the media to deter fraud”, paper presented at the Six Nations Benefit FraudConference, Canberra, 14–16 October.
Cohen, M. 2000a, “The crime victim’s perspective in cost–benefit analysis”, in B. Welsh, D.P. Farrington& L.W. Sherman (eds), Costs and Benefits of Preventing Crime, Westview Press, Boulder, pp. 23–50.
—— 2000b, “Measuring the costs and benefits of crime and justice” in Measurement and Analysis of Crimeand Justice, Criminal Justice 2000, Volume 4, Office of Justice Programs, US Department of Justice,Washington DC, pp. 263–315.
Collins, D.J. & Lapsley, H.M. 2002, Counting the Cost: Estimates of the Social Costs of Drug Abuse inAustralia in 1998–99, Commonwealth Department of Health and Ageing, Canberra.
Criminal Justice Commission 1996, “The nature of general police work”, Research Paper Series, vol. 3,no. 2, Criminal Justice Commission, Brisbane.
Deakin University 1994, Fraud against Organisations in Victoria, Deakin University, Geelong.
Degenhardt, L. 2002, Opioid Overdose Deaths in Australia in 2001, National Drug and Alcohol ResearchCentre, Sydney.
Department of the Environment, Transport and the Regions (DETR) 1999, Highways Economics Note,no. 1, DETR, London.
Drabsch, T. 2003, “Arson”, Briefing Paper 2/2003, New South Wales Parliamentary Library, Sydney.
Ernst and Young 2003, The Unmanaged Risk, Ernst and Young, London.
Farrington, D.P. 1999, “Measuring, explaining and preventing shoplifting”, Security Journal, vol. 12,no. 1, pp. 9–27.
Flood-Page, C. & Taylor, J. 2003, Crime in England and Wales 2001–2002: Supplementary Volume,Statistical Bulletin 01/03, Home Office, London.
Freckelton, I. 2001, Criminal Injuries Compensation: Law, Practice and Policy, LBC Information Services,Sydney.
Gold, M., Siegel, J. & Weinstein, M. 2001, Cost Effectiveness in Health and Medicine, Oxford UniversityPress, Oxford.
Grant, B. & Petrie, M. 2001, Alcohol and Other Drug Treatment Services: Development of a NationalMinimum Data Set, cat. no. HSE 12, Australian Institute of Health and Welfare, Canberra.
Helps, Y., Cripps, R. & Harrison, J. 2002, Hospital Separations due to Injury and Poisoning, Australia1999–00, Injury Research and Statistics Series, no. 15, Australian Institute of Health and Welfare,Adelaide.
Hourigan, M. 2001, The Value of the Volunteer Contribution, consultant’s report to Country Fire Authority(Victoria), Burwood East, September.
Industry Commission 1995, Charitable Organisations in Australia, Report No. 45, Australian GovernmentPublishing Service, Melbourne.
Insurance Council of Australia (ICA) 2002, Report on Non-insurance and Under-insurance in the Home andSmall Business Portfolio, ICA, Sydney.
—— 1994, Insurance Fraud in Australia, ICA, Sydney.
Intergovernmental Committee on Drugs 2002, National Drug Strategic Framework Annual Report 2001 tothe Ministerial Council on Drug Strategy, Commonwealth of Australia, Canberra.
John Walker Consulting Services 1995, The Extent of Money Laundering in and through Australia,AUSTRAC, Sydney.
77AIC Technical and Background Paper Series
Counting the Costs of Crime in Australia: Technical Report
Kershaw, C., Budd, T., Kinshott, G., Mattinson, J., Mayhew, P. & Myhill, A. 2000, The 2000 BritishCrime Survey, Statistical Bulletin 18/00, Home Office, London.
KPMG 2002, Fraud Survey 2002, KPMG, Sydney.
Krambia-Kapardis, M. 2001, Enhancing the Auditor’s Fraud Detection Ability, Peter Lang, New York.
Laing, L. & Bobic, M. 2002, Economic Costs of Domestic Violence: Literature Review, Australian Domesticand Family Violence Clearinghouse, University of New South Wales, Sydney.
Lampard, M. 2000, “Partnerships in arson prevention”, paper presented to the AIC conference onReducing Criminality: Partnerships and Best Practice, Perth.
Law Reform Commission of Victoria (LRCV) 1990, Homicide, report no. 40, LRCV, Melbourne.
Makkai, T. 2002, “Illicit drugs and crime”, in A. Graycar & P. Grabosky (eds), The Cambridge Handbookof Australian Criminology, Cambridge University Press, Melbourne.
Makkai, T. & McGregor, K. 2002, “Drugs and crime: Calculating attributable fractions from the DUMAproject”, Appendix D in D.J. Collins & H.M. Lapsley, Counting the Cost: Estimates of the SocialCosts of Drug Abuse in Australia in 1998–99, Monograph Series No. 49, CommonwealthDepartment of Health and Ageing, Canberra
Mathers, C., Vos, T. & Stevenson, C. 1999, The Burden of Disease and Injury in Australia, cat.no. PHE 17, Australian Institute of Health and Welfare, Canberra.
Mayhew, P. 2003, “Counting the Costs of Crime in Australia”, Trends and Issues in Crime and CriminalJustice, no. 247, Australian Institute of Criminology, Canberra, www.aic.gov.au/publications/tandi/tandi247.html.
Miller, T.R., Cohen, M. & Rossman, S.B. 1993, “Victim costs of violent crime and resulting injuries”,Health Affairs, vol. 12, no. 4, pp. 186–97.
Miller, T.R., Cohen, M. & Wiersema, B. 1996, Victim Costs and Consequences: A New Look, NationalInstitute of Justice Research Report, US Department of Justice, Washington DC.
McFadden, M., Mwesigye, S-E. & Williams, G. 2002, “Pricing outputs: A case study in law enforcement”,Australian Journal of Public Administration, vol. 61, no. 4, pp. 80–8.
Mirrlees-Black, C. & Ross, A. 1995, Crime Against Retail and Manufacturing Premises: Findings from the1994 Commercial Victimisation Survey, Research Study No. 146, Home Office, London.
Moxon, D. 1998, “Criminal justice interventions: The role of sentencing policy”, in C. Nuttall (ed.),Reducing Offending: An Assessment of Research Evidence on Ways of Dealing with OffendingBehaviour, Research Study No. 187, Home Office, London.
Myhill, A. & Allen, J. 2002, Rape and Sexual Assault of Women: The Extent and Nature of the Problem:Findings from the British Crime Survey, Research Study No. 237, Home Office, London.
National Economic Research Associates (NERA) 2000, The Economic Cost of Fraud, report for HomeOffice and Serious Fraud Office, London.
National Motor Vehicle Theft Reduction Council 2002, Comprehensive Auto-Theft Research System(CARS)—2001–2002, National CARS Project, Adelaide.
New South Wales Department of Juvenile Justice 2003, Annual Report 2001–2002, Department ofJuvenile Justice, Sydney.
NRMA Insurance 2002, “New survey reveals car theft wastes money and disrupts lives”, news release,16 October.
O’Connor, I. & Cameron, M. 2002, “Juvenile justice in Australia”, in A. Graycar & P. Grabosky (eds),The Cambridge Handbook of Australian Criminology, Cambridge University Press, Melbourne.
Office of National Drug Control Policy 2001, The Economic Costs of Drug Abuse in the United States,1992–1998, publication no. NCJ-190636, Executive Office of the President, Washington DC.

78 Australian Institute of Criminology
Organisation for Economic Cooperation and Development (OECD) 2002, Main Economic Indicators,http://www.oecd.org.
Percy, A. & Mayhew, P. 1997, “Estimating sexual victimisation in a national crime survey: A newapproach”, Studies in Crime and Crime Prevention, vol. 6, no. 2, pp. 125–50.
Queensland Government Statistician’s Office 1992, Crime Victims Survey, Queensland GovernmentStatistician’s Office, Brisbane.
Ridolfo, B. & Stevenson, S. 2001, The Quantification of Drug-caused Mortality and Morbidity in Australia,1998, Drug Statistics Series, no. 7, Australian Institute of Health and Welfare, Canberra.
Shand, F. & Mattick, R. 2002, Census of Treatment Service Agencies (COTSA) 2001, University of NewSouth Wales, Sydney.
Simmons, J. et al. 2002, Crime in England and Wales 2001–02, Statistical Bulletin 07/02, Home Office,London.
Smith, R. 2003, Serious Fraud in Australia and New Zealand, Research and Public Policy Series, no. 48,Australian Institute of Criminology, Canberra.
—— 1997, “Measuring the extent of fraud in Australia”, Trends and Issues in Crime and Criminal Justice,no. 74, Australian Institute of Criminology, Canberra.
Steering Committee for the Review of Commonwealth/State Service Provision (SCRCSSP) 2003, Reporton Government Services 2002, Productivity Commission, Melbourne.
Taylor, N. 2002, “Reporting of crime against small retail businesses”, Trends and Issues in Crime andCriminal Justice, no. 242, Australian Institute of Criminology, Canberra.
Taylor, N. & Mayhew, P. 2002a, “Patterns of victimisation among small retail businesses”, Trends and Issuesin Crime and Criminal Justice, no. 221, Australian Institute of Criminology, Canberra.
—— 2002b, “Financial and psychological costs of crime for small retail businesses”, Trends and Issues inCrime and Criminal Justice, no. 229, Australian Institute of Criminology, Canberra.
van Kesteren, J., Mayhew P. & Nieuwbeerta, P. 2001, Criminal Victimisation in Seventeen IndustrialisedCountries: Key Findings from the 2000 International Crime Victims Survey, Ministry of Justice, theHague.
Victorian Community Council Against Violence (VCCAV) 1994, Victims of Crime: Inquiry into Services,Victorian Community Council Against Violence, Melbourne.
Walker, J. 1997, “Estimates of the costs of crime in Australia in 1996”, Trends and Issues in Crime andCriminal Justice, no. 72, Australian Institute of Criminology, Canberra.
—— 1995, “Crimes against businesses in Australia”, Trends and Issues in Crime and Criminal Justice,no. 45, Australian Institute of Criminology, Canberra.
—— 1994, The First Australian National Survey of Crimes Against Businesses, Australian Institute ofCriminology, Canberra.
—— 1992, “Estimates of the costs of crime in Australia”, Trends and Issues in Crime and Criminal Justice,no. 3, Australian Institute of Criminology, Canberra.
Watson, W.L. & Ozanne-Smith, J. 1997, The Cost of Injury to Victoria, report no. 124, Monash UniversityAccident Research Centre, Melbourne.
Wojciechowski, T. & Newiss, G. 2003, “Fraud”, in C. Flood-Page & J. Taylor (eds), Crime in England andWales 2001–2002: Supplementary Volume, Statistical Bulletin 01/03, Home Office, London.