country brand index 2014-15 · country brand index 2014-15 8 qualiquant™ sample criteria as in...
TRANSCRIPT
3
12
CountryBrand Index 2014-15
FutureBrand ©2Country Brand Index 2014-15
Contents
1. Introduction2. Our methodology3. 2014-15 rankings4. Key findings5. What makes a country brand? 6. Regional rankings7. Future focus 8. Appendix
FutureBrand ©
1. Introduction
3Country Brand Index 2014-15
FutureBrand ©4Country Brand Index 2014-15
Introduction
The Country Brand Index has historically studied perceptions of 118 countries around the world in the same way we measure consumer or corporate brands – ranking them according to strength of perception across association dimensions.
FutureBrand was among the pioneers of this approach, exploring the hypothesis that countries can usefully be understood as the sum of their identity and reputation. And, just like brands, strength or weakness of perception of a country can influence peoples’ decisions to choose them as places to visit, live or invest in. This was assumed to provide a competitive advantage in a global market for tourism, education and investment, and built evidence for proactive country brand management.
Over the last 5 years, our work in country branding has highlighted the increasing importance of ‘country of origin’ in understanding country brand strength. In particular, its role as a driver of consumer choice became evident in our Made In research in 2013-14. This is not least because strong brands associated with a country make a significant contribution to perceptions of it, but also because people actively prefer products and services when they are from specific countries. Which means every time they buy a car, eat a type of food or wear a clothing brand, they can be consciously consuming an aspect of the country that made them. Countries that do not benefit from these ‘Made In’ associations are at a measurable disadvantage to their peers.
Not just that, but we are increasingly interested in the relationship between perception strength and behaviour when it comes to country brand measurement. In other words, can we prove that strong perceptions lead to decisions to visit, recommend and do business with a country?
Finally, the nature of our study has always implied that countries with stronger perceptions and higher rank position are also ‘stronger’ country brands, but that all countries qualify as brands by default. But, we have yet to explore the idea of a minimum threshold of perception strength determining the difference between a country and a ‘country brand’.
The value of measuring countries as brands
“Countries can usefully be understood as the sum of their identity and reputation.”
FutureBrand ©5Country Brand Index 2014-15
How is the 2014 report different? This year, we set out to test an emerging hypothesis that not all countries qualify as ‘brands’. But when they do, they have a measurable competitive advantage over their peer countries.
With this in mind, we evolved our approach to the research in two significant ways:
1. We measured attributes relating to ‘country of origin’ as an additional dimension of country brand strength.
2.We increased the focus on specific measures relating to decisions to visit, invest in and recommend a country.
In an addition to previous years, we also gathered data on cities to understand the relationship between country brand strength and city perception around the world, not least because of the growing urbanization of both developed and developing countries.
What did we find out? The results of this year’s research are striking. First of all, of the 75 countries included in our survey, only 22 qualify as ‘country brands’ by our measures. By this, we mean that people have stronger than average perceptions of the country across our six dimensions relating to ‘status’ and ‘experience’. In other words, they perceive it equally strongly in aspects relating to quality of life, values and business, as they do for its culture, history, tourism and ‘Made In’ expertise.
Importantly, we also discovered that when people rate a country as a ‘brand’ they are also more likely to visit, recommend and do business with it than the other countries in the ranking, demonstrating that being seen as a country brand provides a tangible competitive advantage. Not just that, but our respondents also have more confidence in and feel closer to country brands compared to countries in the study.
Critically, the main drivers of a ‘country brand’ are perceptions of making products of high quality, wanting to live or study there and infrastructure, all of which reinforce the idea that to qualify as a ‘country brand’, people need to want to consume your products and services and prefer you as a place to live and learn.
Who will benefit from this report? If you are a country brand manager or work in tourism, trade and investment at a national or international level, the Country Brand Index offers valuable insights into the levers you can pull for competitive advantage. It will also be of use to professional brand managers and leaders seeking to, or already harnessing, ‘country of origin’ associations for corporate and consumer brands.
The value of measuring countries as brands
“This year we set out to test the hypothesis that not all countries qualify as brands.”
Introduction
6Country Brand Index 2014-15 FutureBrand ©
2. Our methodology
7Country Brand Index 2014-15 FutureBrand ©
Our research approach
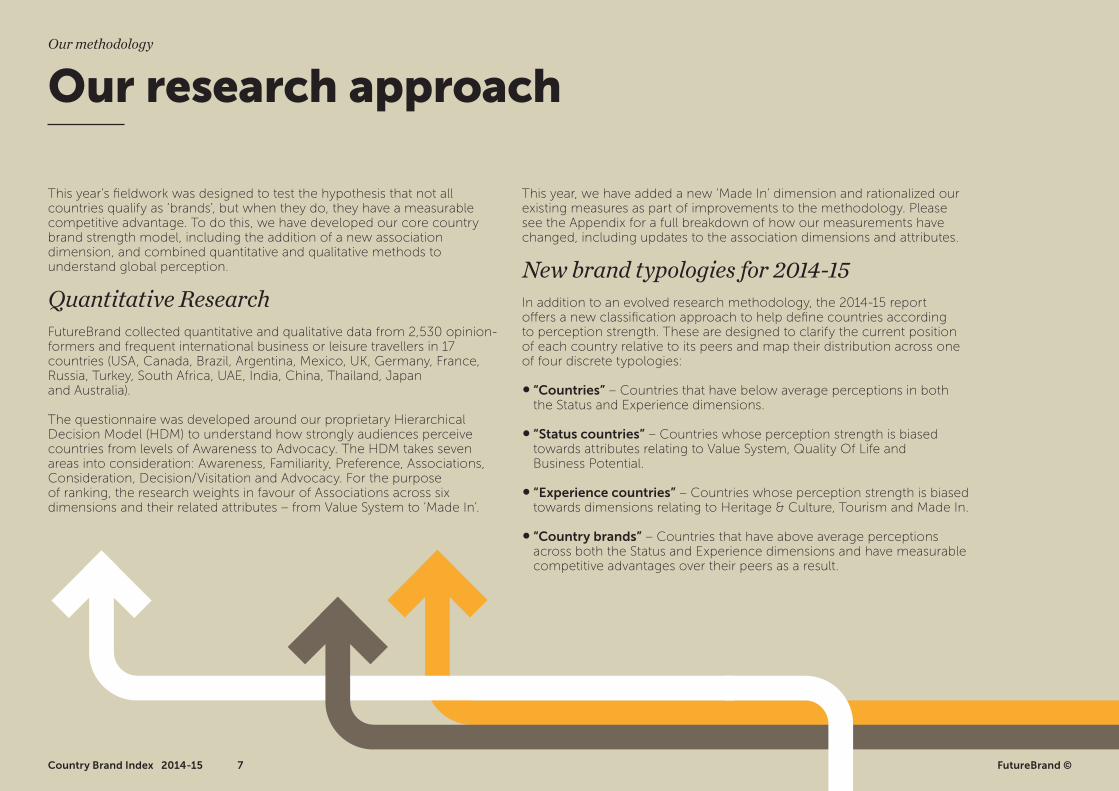
This year’s fieldwork was designed to test the hypothesis that not all countries qualify as ‘brands’, but when they do, they have a measurable competitive advantage. To do this, we have developed our core country brand strength model, including the addition of a new association dimension, and combined quantitative and qualitative methods to understand global perception.
Quantitative ResearchFutureBrand collected quantitative and qualitative data from 2,530 opinion-formers and frequent international business or leisure travellers in 17 countries (USA, Canada, Brazil, Argentina, Mexico, UK, Germany, France, Russia, Turkey, South Africa, UAE, India, China, Thailand, Japan and Australia).
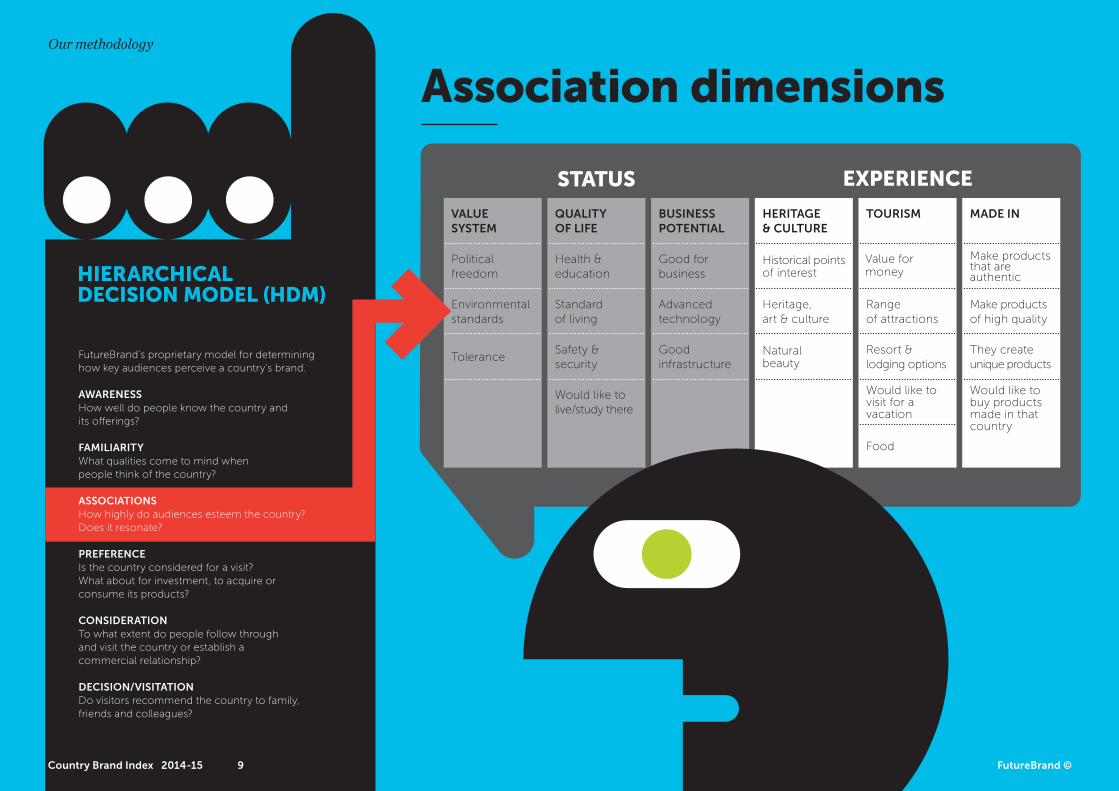
The questionnaire was developed around our proprietary Hierarchical Decision Model (HDM) to understand how strongly audiences perceive countries from levels of Awareness to Advocacy. The HDM takes seven areas into consideration: Awareness, Familiarity, Preference, Associations, Consideration, Decision/Visitation and Advocacy. For the purpose of ranking, the research weights in favour of Associations across six dimensions and their related attributes – from Value System to ‘Made In’.
This year, we have added a new ‘Made In’ dimension and rationalized our existing measures as part of improvements to the methodology. Please see the Appendix for a full breakdown of how our measurements have changed, including updates to the association dimensions and attributes.
New brand typologies for 2014-15In addition to an evolved research methodology, the 2014-15 report offers a new classification approach to help define countries according to perception strength. These are designed to clarify the current position of each country relative to its peers and map their distribution across one of four discrete typologies:
• “Countries” – Countries that have below average perceptions in both the Status and Experience dimensions.
• “Status countries” – Countries whose perception strength is biased towards attributes relating to Value System, Quality Of Life and Business Potential.
• “Experience countries” – Countries whose perception strength is biased towards dimensions relating to Heritage & Culture, Tourism and Made In.
• “Country brands” – Countries that have above average perceptions across both the Status and Experience dimensions and have measurable competitive advantages over their peers as a result.
Our methodology
8Country Brand Index 2014-15
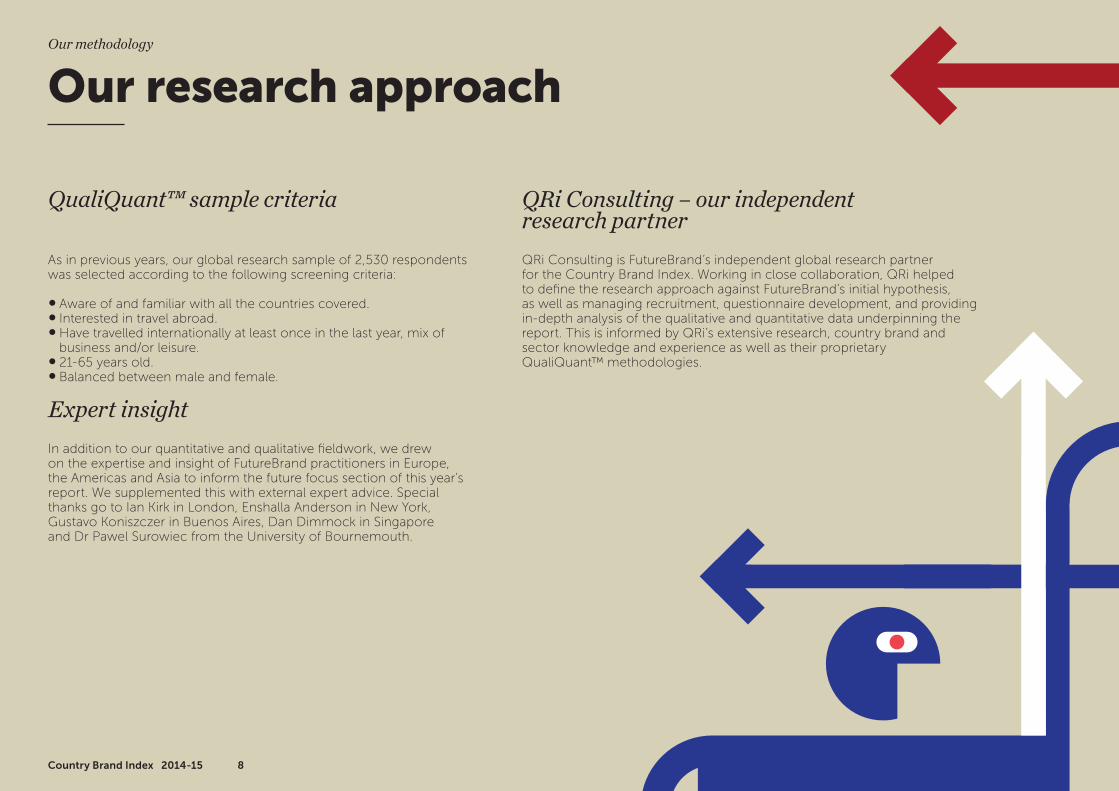
QualiQuant™ sample criteria
As in previous years, our global research sample of 2,530 respondents was selected according to the following screening criteria:
• Aware of and familiar with all the countries covered.• Interested in travel abroad.• Have travelled internationally at least once in the last year, mix of
business and/or leisure.• 21-65 years old.• Balanced between male and female.
Expert insightIn addition to our quantitative and qualitative fieldwork, we drew on the expertise and insight of FutureBrand practitioners in Europe, the Americas and Asia to inform the future focus section of this year’s report. We supplemented this with external expert advice. Special thanks go to Ian Kirk in London, Enshalla Anderson in New York, Gustavo Koniszczer in Buenos Aires, Dan Dimmock in Singapore and Dr Pawel Surowiec from the University of Bournemouth.
QRi Consulting – our independent research partnerQRi Consulting is FutureBrand’s independent global research partner for the Country Brand Index. Working in close collaboration, QRi helped to define the research approach against FutureBrand’s initial hypothesis, as well as managing recruitment, questionnaire development, and providing in-depth analysis of the qualitative and quantitative data underpinning the report. This is informed by QRi’s extensive research, country brand and sector knowledge and experience as well as their proprietary QualiQuant™ methodologies.
Our research approachOur methodology
FutureBrand ©
Association dimensions
HIERARCHICALDECISION MODEL (HDM)
FutureBrand's proprietary model for determininghow key audiences perceive a country's brand.
AWARENESSHow well do people know the country andits offerings?
FAMILIARITYWhat qualities come to mind whenpeople think of the country?
ASSOCIATIONSHow highly do audiences esteem the country?Does it resonate?
PREFERENCEIs the country considered for a visit?What about for investment, to acquire orconsume its products?
CONSIDERATIONTo what extent do people follow throughand visit the country or establish acommercial relationship?
DECISION/VISITATIONDo visitors recommend the country to family,friends and colleagues?
EXPERIENCESTATUS
VALUE SYSTEM
QUALITYOF LIFE
BUSINESS POTENTIAL
HERITAGE& CULTURE
TOURISM MADE IN
Political freedom
Health &education
Good for business
Historical points of interest
Value for money
Make products that areauthentic
Environmental standards
Standard of living
Advanced technology
Heritage, art & culture
Range of attractions
Make productsof high quality
ToleranceSafety &security
Good infrastructure
Would like to live/study there
Natural beauty
Resort &lodging options
Would like to visit for a vacation
Food
They create unique products
Would like tobuy productsmade in thatcountry
Our methodology
9Country Brand Index 2014-15
1
2
3FutureBrand ©
3. 2014-15 rankings
10Country Brand Index 2014-15
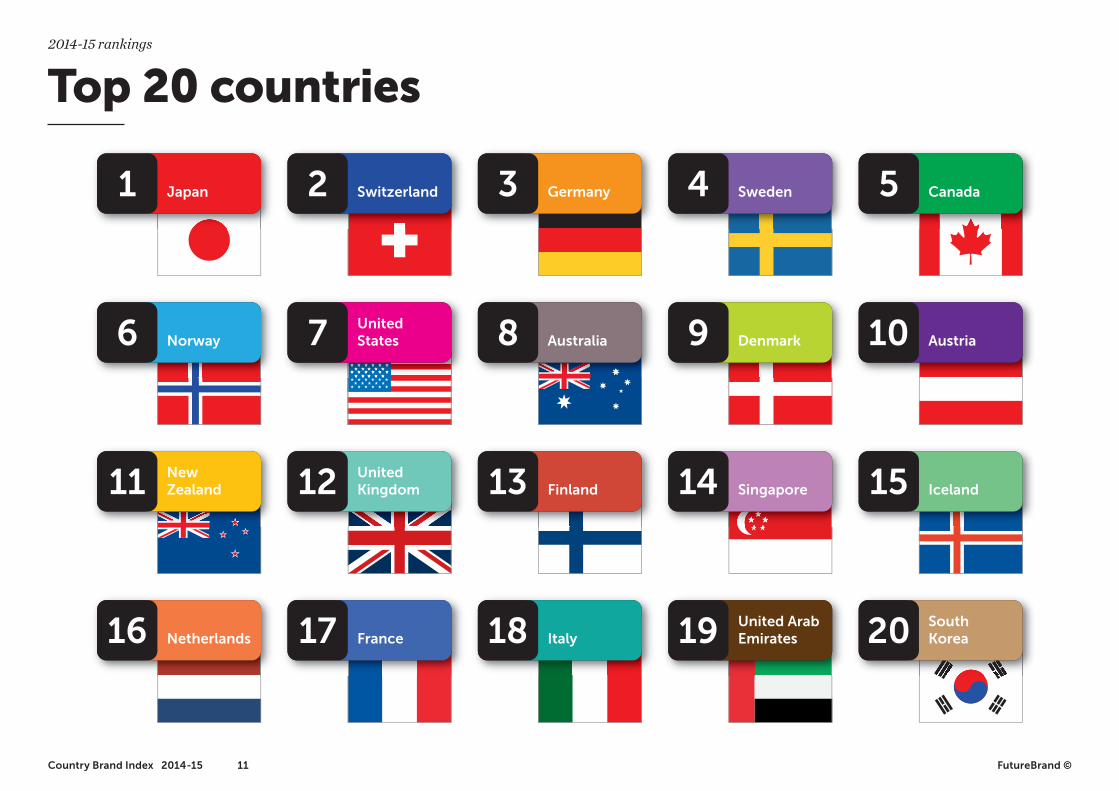
Japan1 Switzerland2 Germany3 Sweden4 Canada5
Norway6 United States7 Australia8 Denmark9 Austria10
NewZealand11 United
Kingdom12 Finland13 Singapore14 Iceland15
Netherlands16 France17 Italy18 United Arab
Emirates19 SouthKorea20
11Country Brand Index 2014-15 FutureBrand ©
Top 20 countries 2014-15 rankings
12 FutureBrand ©Country Brand Index 2014-15
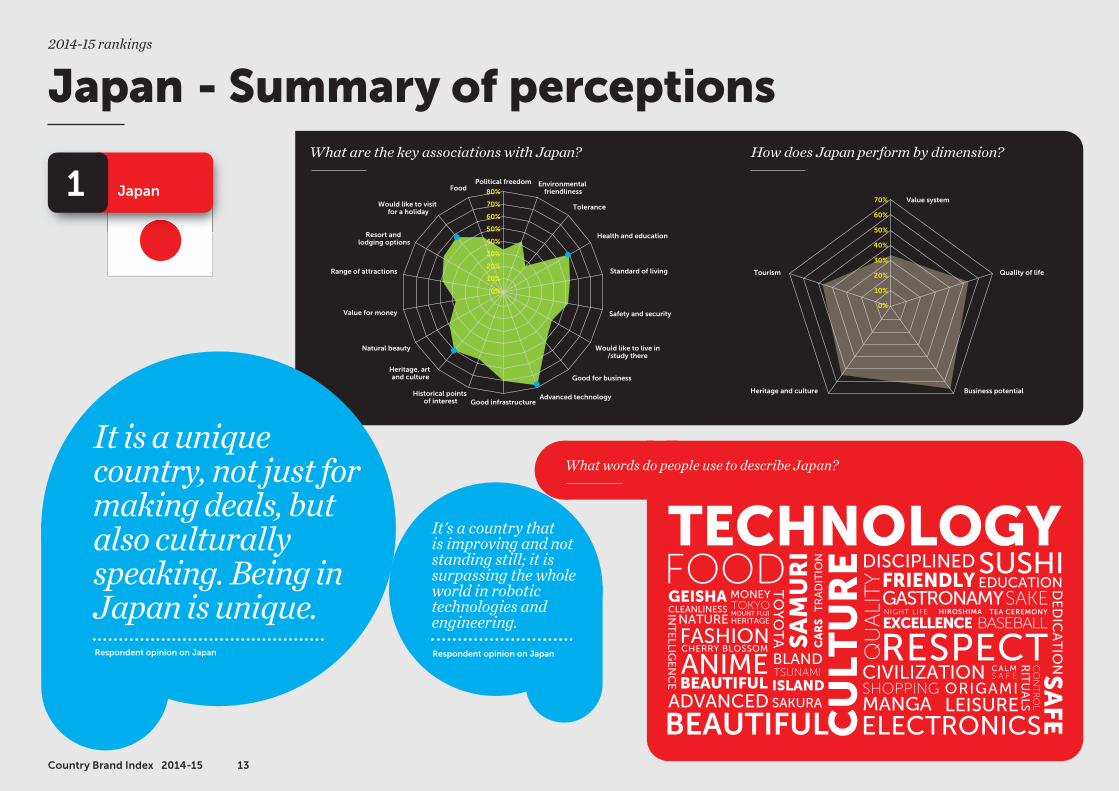
Japan2014-15 rankings
1 Japan
Political freedom Environmental friendlinessFood
Would like to visit for a holiday
Resort and lodging options
Range of attractions
Value for money
Natural beauty
Heritage, art and culture
Historical points of interest
Tolerance
Health and education
Standard of living
Safety and security
Would like to live in/study there
Good for business
Advanced technologyGood infrastructure
80%
70%
60%
50%
40%
30%
20%
10%
0%
Respondent opinion on Japan Respondent opinion on Japan
It is a unique country, not just for making deals, but also culturally speaking. Being in Japan is unique.
It's a country that is improving and not standing still; it is surpassing the whole world in robotic technologies and engineering.
TECHNOLOGY
CULT
UREFOOD
BEAUTIFULADVANCED
SAFE
DISCIPLINED SUSHI
QUALITY
TR
AD
ITIO
N
SAMURI
ELECTRONICS
RESPECTCARS
GEISHAEDUCATION
CLEANLINESSINT
ELLIG
EN
CE
DE
DIC
AT
ION
BEAUTIFUL
TO
YO
TA
FRIENDLY
SAKURA
HERITAGE
MONEY
MOUNT FUJI
ANIME
TOKYO
BLAND
MANGAISLANDTSUNAMI
NATURE
LEISURE
GASTRONAMYSAKE
CIVILIZATION
CONTROL
RIT
UA
LS
FASHIONCHERRY BLOSSOM
SHOPPING
EXCELLENCE BASEBALLNIGHT LIFE TEA CEREMONYHIROSHIMA
ORIGAMI
CALMS A F E
Value system
Quality of life
Business potentialHeritage and culture
Tourism
70%
60%
50%
40%
30%
20%
10%
0%
What are the key associations with Japan? How does Japan perform by dimension?
What words do people use to describe Japan?
13Country Brand Index 2014-15
Japan - Summary of perceptions2014-15 rankings
1 Japan
What brands do people associate with Japan?
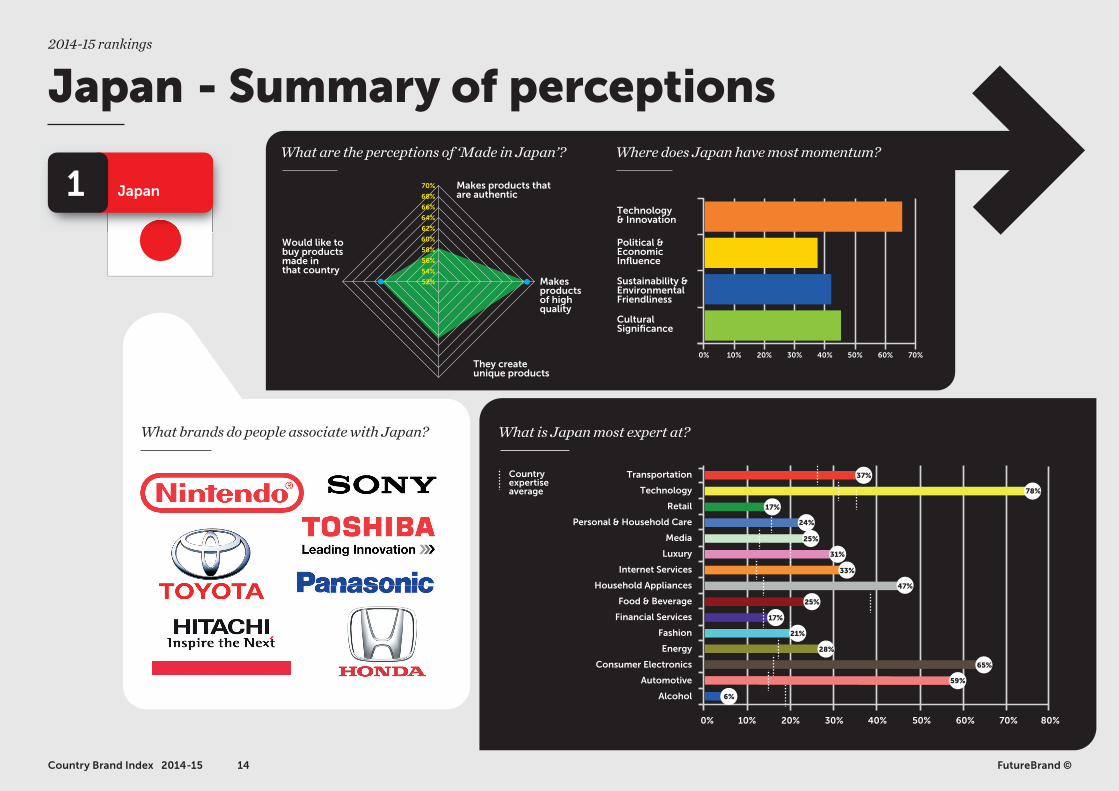
What are the perceptions of ‘Made in Japan’? Where does Japan have most momentum?
Makes productsof high quality
They createunique products
Makes products that are authentic
Would like tobuy productsmade inthat country
Technology& Innovation
Political &Economic Influence
Sustainability &EnvironmentalFriendliness
CulturalSignificance
0% 10% 20% 30% 40% 50% 60% 70%
70%
68%
66%
64%
62%
60%
58%
56%
54%
52%
What is Japan most expert at?
Transportation
Technology
Retail
Personal & Household Care
Media
Luxury
Internet Services
Household Appliances
Food & Beverage
Financial Services
Fashion
Energy
Consumer Electronics
Automotive
Alcohol
37%
78%
17%
25%
31%
33%
47%
25%
17%
59%
28%
65%
24%
Country expertise average
0% 10% 20% 30% 40% 50% 60% 70% 80%
21%
6%
14Country Brand Index 2014-15 FutureBrand ©
Japan - Summary of perceptions2014-15 rankings
15Country Brand Index 2014-15
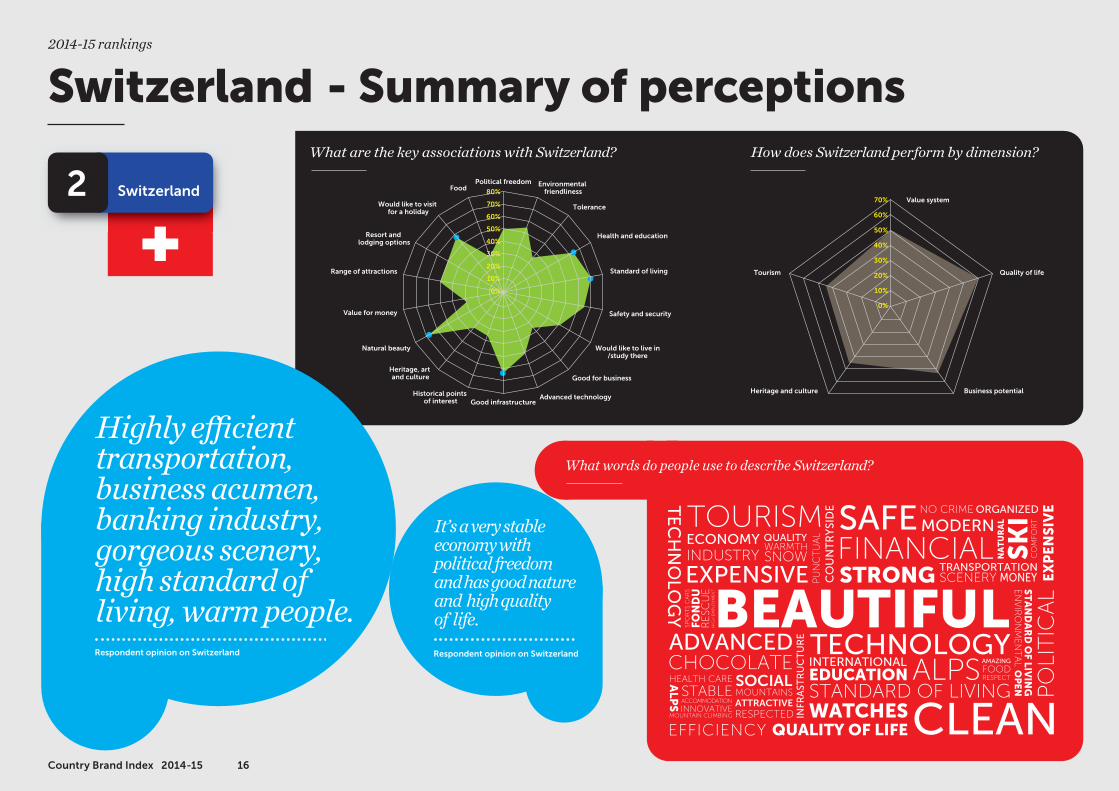
Switzerland2014-15 rankings
2 Switzerland
80%
70%
60%
50%
40%
30%
20%
10%
0%
Political freedom Environmental friendlinessFood
Would like to visit for a holiday
Resort and lodging options
Range of attractions
Value for money
Natural beauty
Heritage, art and culture
Historical points of interest
Tolerance
Health and education
Standard of living
Safety and security
Would like to live in/study there
Good for business
Advanced technologyGood infrastructure
Value system
Quality of life
Business potentialHeritage and culture
Tourism
70%
60%
50%
40%
30%
20%
10%
0%
BEAUTIFUL
CLEAN
ADVANCED
PO
LIT
ICA
L
QUALITY OF LIFE
TE
CH
NO
LOG
Y
TOURISM
SCENERYSTRONG EX
PE
NS
IVE
ST
AN
DA
RD
OF LIV
ING
EN
VIR
ON
ME
NT
AL
OP
EN
TRANSPORTATION
ECONOMY
CHOCOLATEHEALTH CARE
INFR
AST
RU
CT
UR
E
CO
UN
TR
YSI
DE
FINANCIAL
SOCIAL
TECHNOLOGYINTERNATIONAL
SAFE
EDUCATIONSTANDARD OF LIVING
NO CRIME
ALPS
INDUSTRY
MODERN
NA
TU
RA
L
ORGANIZED
SK
IC
OM
FOR
T
AMAZING
MOUNTAINS
FOODRESPECT
EFFICIENCY
ATTRACTIVEWATCHES
ACCOMMODATION
MOUNTAIN CLIMBING
STABLE
RESPECTEDINNOVATIVE
ALP
S
EXPENSIVE
QUALITYWARMTHSNOW
HIG
H E
MP
LOY
ME
NT
PU
NC
TU
AL
SPO
RT
S C
AR
S
FON
DU
RE
SCU
E
MONEY
Respondent opinion on Switzerland Respondent opinion on Switzerland
Highly e�cient transportation, business acumen, banking industry, gorgeous scenery, high standard of living, warm people.
It’s a very stable economy with political freedom and has good nature and high quality of life.
What are the key associations with Switzerland? How does Switzerland perform by dimension?
What words do people use to describe Switzerland?
16Country Brand Index 2014-15
Switzerland - Summary of perceptions2014-15 rankings
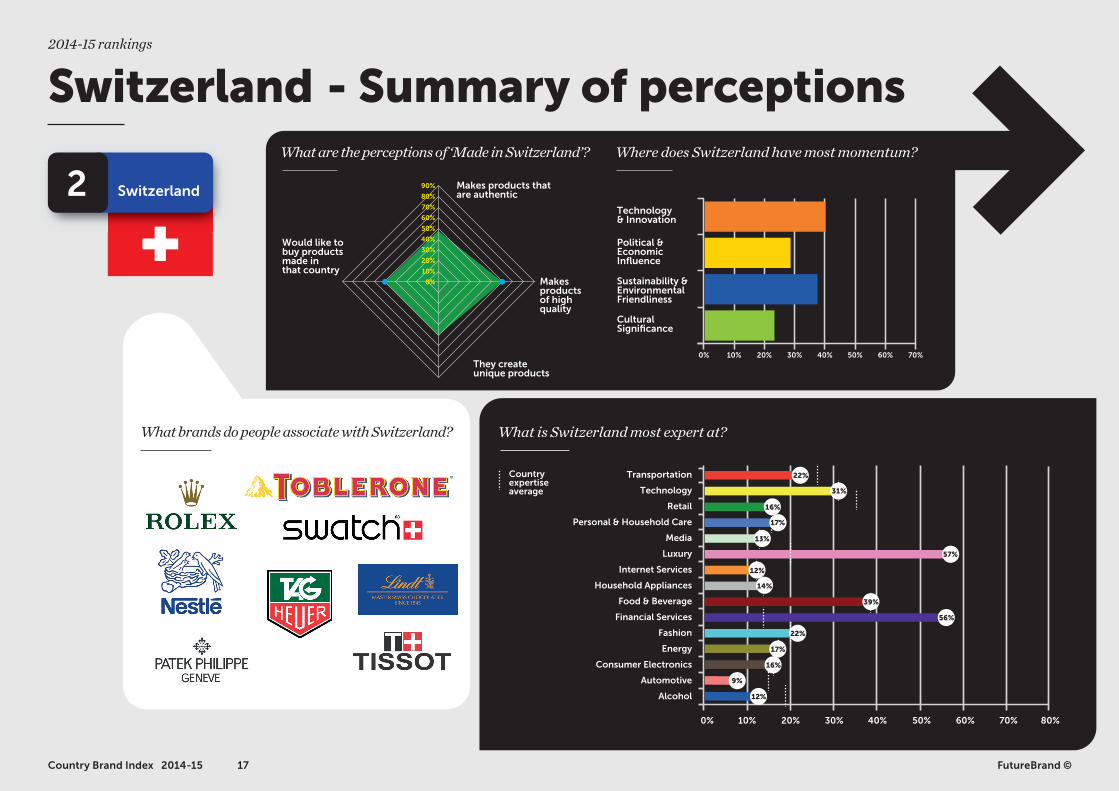
2 Switzerland
Makes productsof high quality
They createunique products
Makes products that are authentic
Would like tobuy productsmade inthat country
Technology& Innovation
Political &Economic Influence
Sustainability &EnvironmentalFriendliness
CulturalSignificance
0% 10% 20% 30% 40% 50% 60% 70%
90%
80%
70%
60%
50%
40%
30%
20%
10%
0%
22%
16%
13%
57%
56%
9%
22%
Country expertise average
0% 10% 20% 30% 40% 50% 60% 70% 80%
12%
31%
17%
12%
14%
39%
17%
16%
What brands do people associate with Switzerland?
What are the perceptions of ‘Made in Switzerland’? Where does Switzerland have most momentum?
What is Switzerland most expert at?
Transportation
Technology
Retail
Personal & Household Care
Media
Luxury
Internet Services
Household Appliances
Food & Beverage
Financial Services
Fashion
Energy
Consumer Electronics
Automotive
Alcohol
FutureBrand ©17Country Brand Index 2014-15
Switzerland - Summary of perceptions2014-15 rankings
Germany2014-15 rankings
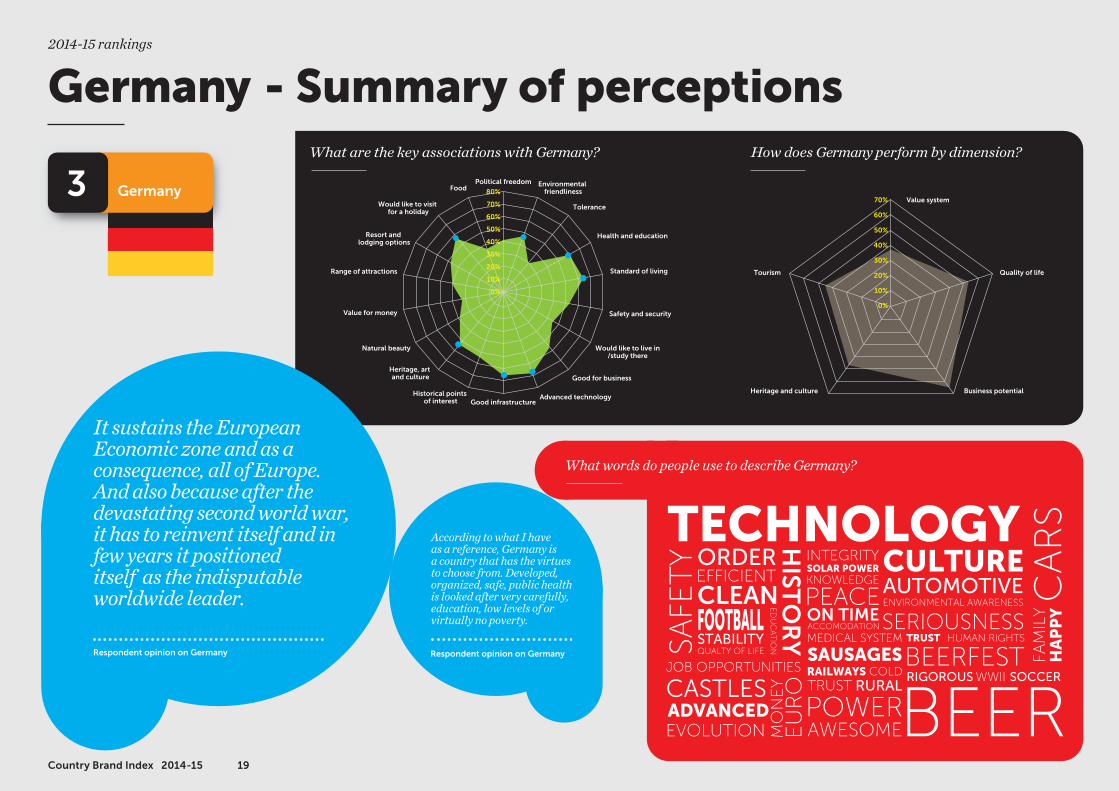
3 Germany
Respondent opinion on Germany Respondent opinion on Germany
Value system
Quality of life
Business potentialHeritage and culture
Tourism
70%
60%
50%
40%
30%
20%
10%
0%
It sustains the European Economic zone and as a consequence, all of Europe. And also because after the devastating second world war, it has to reinvent itself and in few years it positioneditself as the indisputable worldwide leader.
According to what I have as a reference, Germany is a country that has the virtues to choose from. Developed, organized, safe, public health is looked after very carefully, education, low levels of or virtually no poverty.
TECHNOLOGY
BEER
AUTOMOTIVECULTURE
CA
RS
SOCCER
ORDER
SAFE
TY
CLEANEFFICIENT
HIST
OR
Y
RIGOROUS
STABILITYFOOTBALLQUALTY OF LIFE
EVOLUTION
JOB OPPORTUNITIES
ENVIRONMENTAL AWARENESS
ADVANCEDCASTLES
ED
UC
AT
ION
MO
NE
Y
POWER
EU
RO
FAM
ILY
TRUST
HA
PP
Y
COLD
HUMAN RIGHTS
AWESOME
SERIOUSNESS
WWIIRURAL
KNOWLEDGE
RAILWAYS
TRUST
SOLAR POWER
BEERFEST
INTEGRITY
PEACE
SAUSAGES
ON TIMEMEDICAL SYSTEMACCOMODATION
Political freedom Environmental friendlinessFood
Would like to visit for a holiday
Range of attractions
Value for money
Historical points of interest
Tolerance
Health and education
Standard of living
Safety and security
Would like to live in/study there
Good for business
Advanced technologyGood infrastructure
Resort and lodging options
Natural beauty
Heritage, art and culture
80%
70%
60%
50%
40%
30%
20%
10%
0%
What are the key associations with Germany? How does Germany perform by dimension?
What words do people use to describe Germany?
19Country Brand Index 2014-15
Germany - Summary of perceptions2014-15 rankings
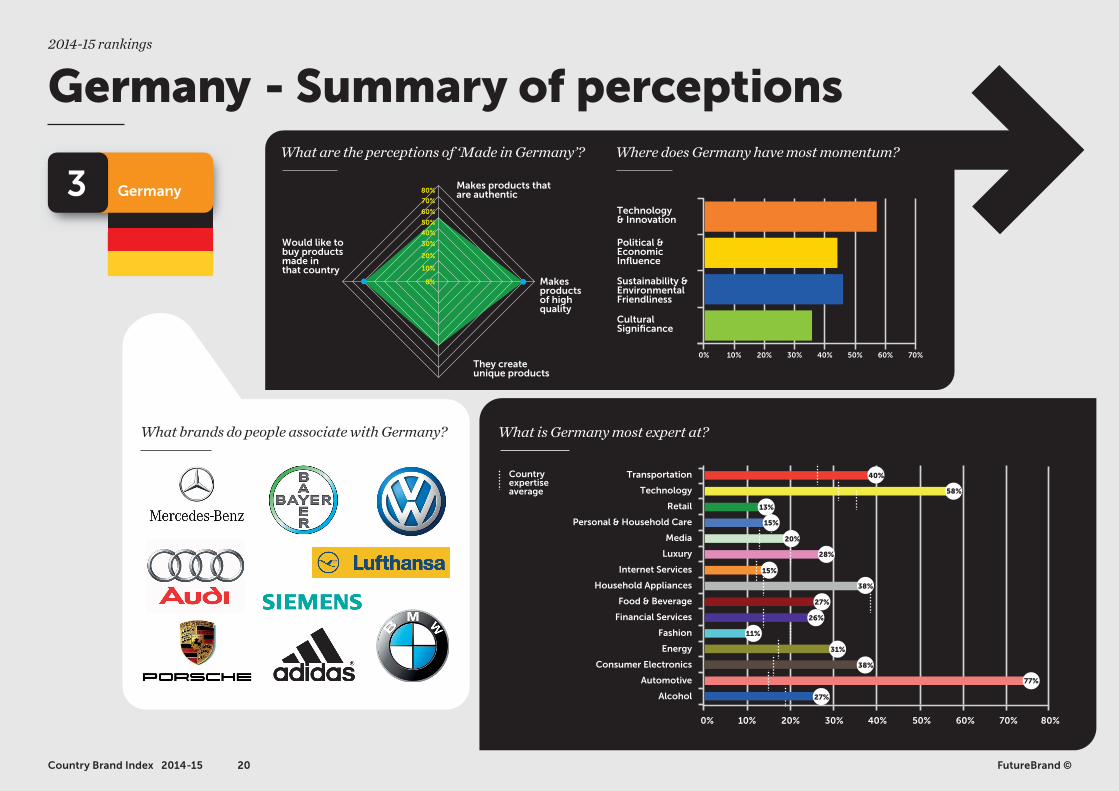
3 Germany
50%
40%
30%
20%
10%
0%
80%
70%
60%
Makes productsof high quality
They createunique products
Makes products that are authentic
Would like tobuy productsmade inthat country
Technology& Innovation
Political &Economic Influence
Sustainability &EnvironmentalFriendliness
CulturalSignificance
0% 10% 20% 30% 40% 50% 60% 70%
40%
13%
28%
15%
26%
Country expertise average
11%
58%
15%
20%
38%
27%
31%
38%
77%
0% 10% 20% 30% 40% 50% 60% 70% 80%
27%
What brands do people associate with Germany?
What are the perceptions of ‘Made in Germany’? Where does Germany have most momentum?
What is Germany most expert at?
Transportation
Technology
Retail
Personal & Household Care
Media
Luxury
Internet Services
Household Appliances
Food & Beverage
Financial Services
Fashion
Energy
Consumer Electronics
Automotive
Alcohol
20Country Brand Index 2014-15 FutureBrand ©
Germany - Summary of perceptions2014-15 rankings
21Country Brand Index 2014-15 FutureBrand ©
Sweden2014-15 rankings
4 Sweden
Value system
Quality of life
Business potentialHeritage and culture
Tourism
70%
60%
50%
40%
30%
20%
10%
0%
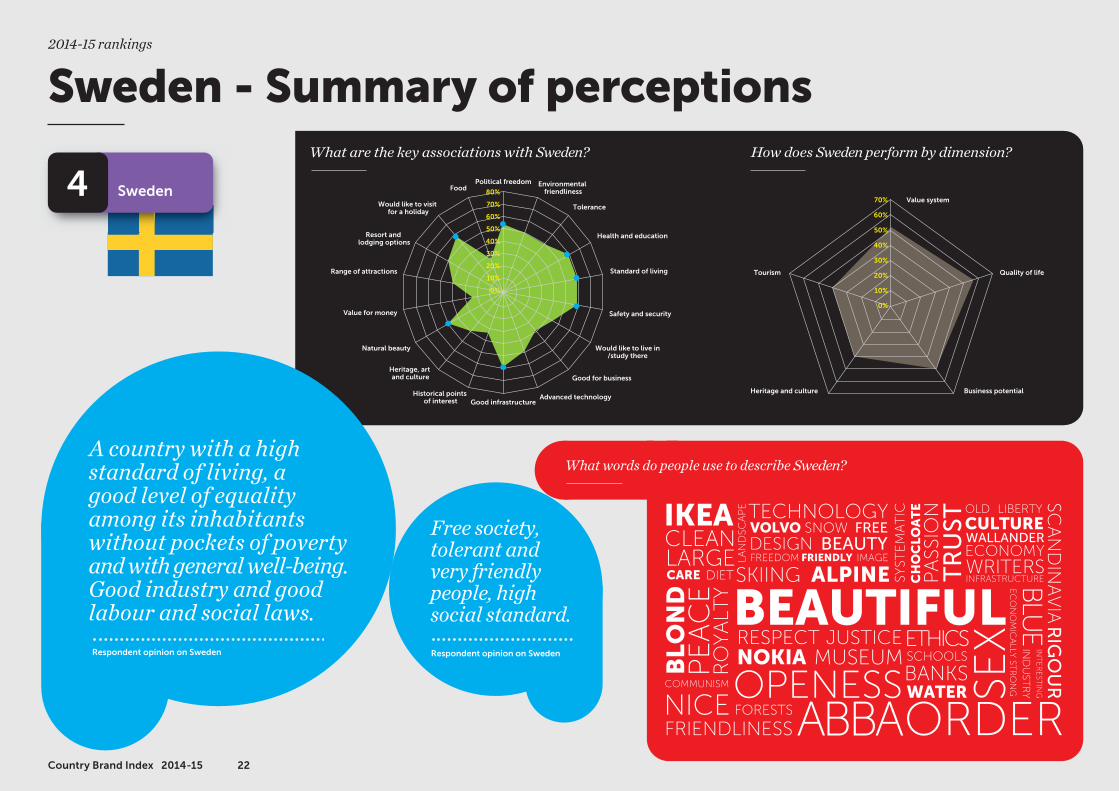
Respondent opinion on Sweden Respondent opinion on Sweden
A country with a high standard of living, a good level of equality among its inhabitants without pockets of povertyand with general well-being. Good industry and good labour and social laws.
Free society, tolerant and very friendly people, high social standard. BEAUTIFUL
ORDER
BEAUTYIKEA
DESIGNFREE
FRIENDLYLAN
DSC
AP
E TECHNOLOGYSNOW
FREEDOM
VOLVO
RESPECTMUSEUM SCHOOLS
JUSTICE
OPENESSETHICS
CULTURE
ECONOMY
NOKIA
WATERBANKS SE
X
OLD LIBERTY
WALLANDERCLEANLARGE
INFRASTRUCTUREWRITERSP
ASS
ION
FRIENDLINESS
SKIING TR
UST
SYST
EM
AT
ICCHOCLO
ATE
ALPINE
SCA
ND
INA
VIA
IMAGE
RIG
OU
R
PE
AC
E
CARE
NICECOMMUNISM
BLO
ND
DIET
RO
YA
LTY
IND
UST
RY
INT
ER
EST
ING
BLU
E
ABBA
EC
ON
OM
ICA
LLY ST
RO
NG
FORESTS
80%
70%
60%
50%
40%
30%
20%
10%
0%
Political freedom Environmental friendlinessFood
Would like to visit for a holiday
Resort and lodging options
Range of attractions
Value for money
Natural beauty
Heritage, art and culture
Historical points of interest
Tolerance
Health and education
Standard of living
Safety and security
Would like to live in/study there
Good for business
Advanced technologyGood infrastructure
What are the key associations with Sweden? How does Sweden perform by dimension?
What words do people use to describe Sweden?
22Country Brand Index 2014-15
Sweden - Summary of perceptions2014-15 rankings
4 Sweden
Makes productsof high quality
They createunique products
Makes products that are authentic
Would like tobuy productsmade inthat country
Technology& Innovation
Political &Economic Influence
Sustainability &EnvironmentalFriendliness
CulturalSignificance
0% 10% 20% 30% 40% 50% 60% 70%
90%
80%
70%
60%
50%
40%
30%
20%
10%
0%
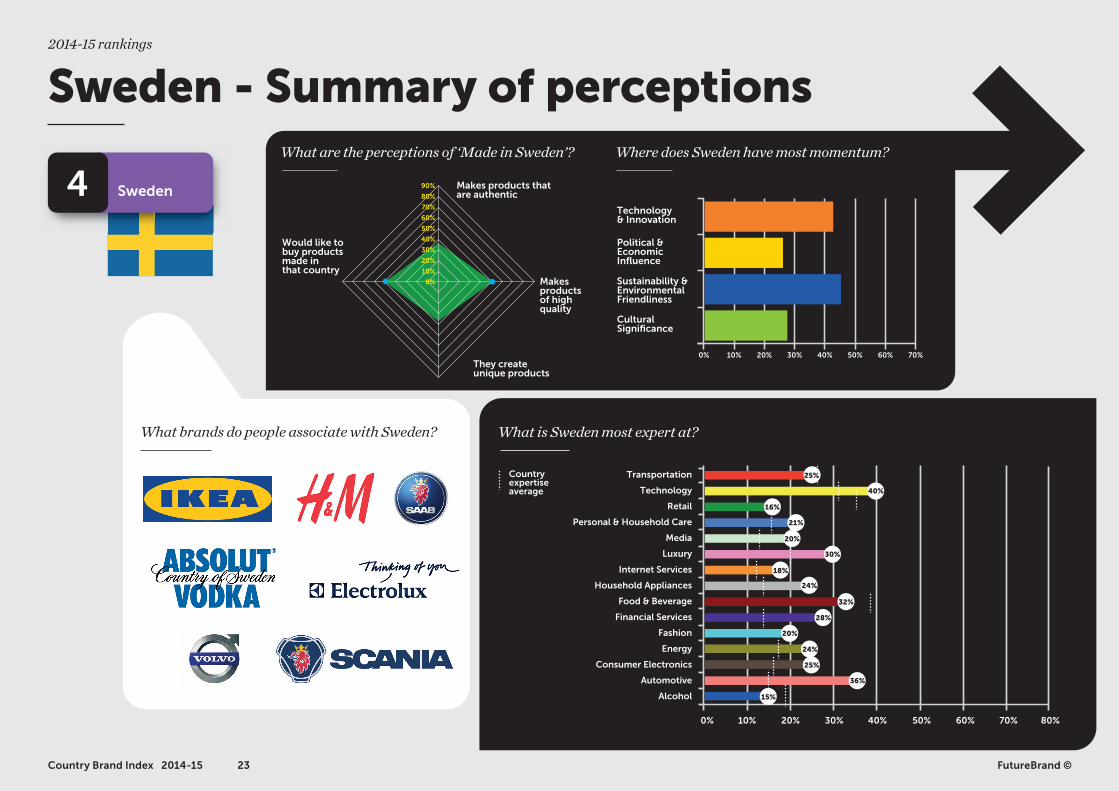
0% 10% 20% 30% 40% 50% 60% 70% 80%
16%
30%
18%
28%
Country expertise average
20%
40%
21%
20%
24%
32%
24%
25%
36%
15%
25%
What brands do people associate with Sweden?
What are the perceptions of ‘Made in Sweden’? Where does Sweden have most momentum?
What is Sweden most expert at?
Transportation
Technology
Retail
Personal & Household Care
Media
Luxury
Internet Services
Household Appliances
Food & Beverage
Financial Services
Fashion
Energy
Consumer Electronics
Automotive
Alcohol
23Country Brand Index 2014-15 FutureBrand ©
Sweden - Summary of perceptions2014-15 rankings
24Country Brand Index 2014-15 FutureBrand ©
Canada2014-15 rankings
5 Canada
Value system
Quality of life
Business potentialHeritage and culture
Tourism
70%
60%
50%
40%
30%
20%
10%
0%
Respondent opinion on Canada Respondent opinion on Canada
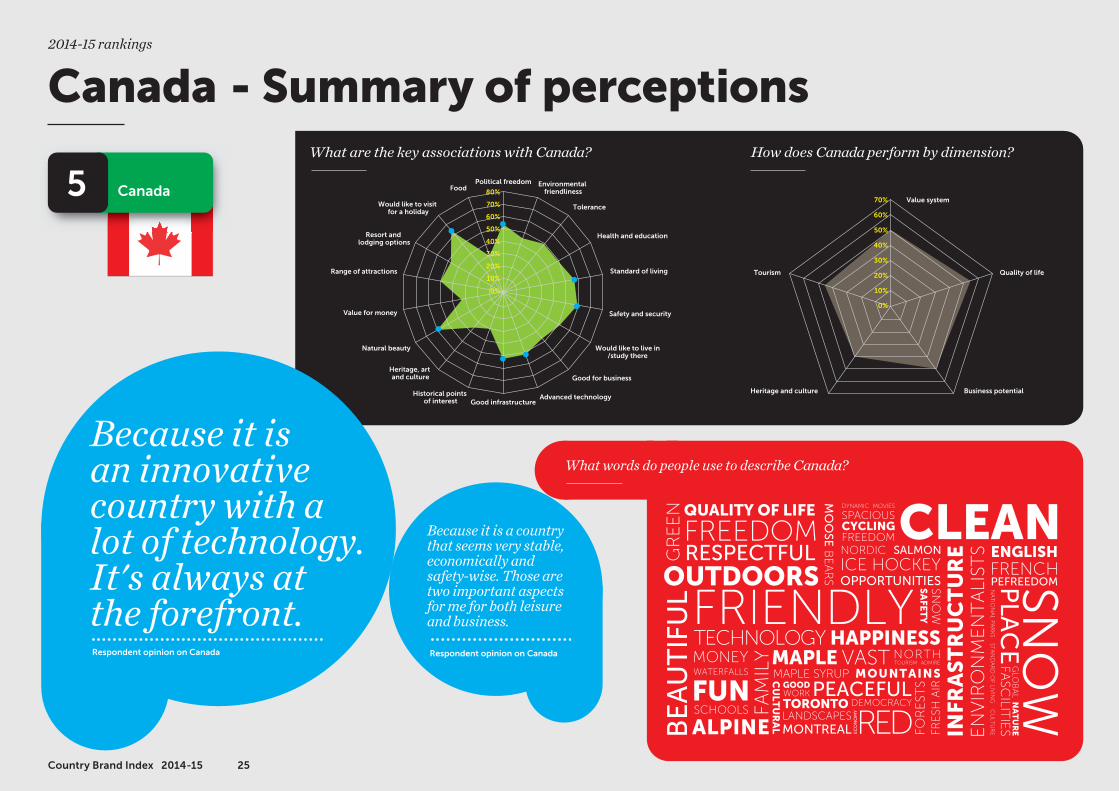
Because it is an innovative country with a lot of technology. It's always at the forefront.
Because it is a countrythat seems very stable,economically and safety-wise. Those are two important aspectsfor me for both leisureand business.
CLEAN
WATERFALLS
FREEDOM
BE
AU
TIF
UL
SNOW
GR
EE
NMONEY
ALPINE
FRIENDLY
FUN
RESPECTFUL
SCHOOLS
QUALITY OF LIFE
TECHNOLOGY HAPPINESS
MOUNTAINSVASTMAPLE
FAM
ILY
FOR
EST
S
MAPLE SYRUP
WORK PEACEFULGOOD
DEMOCRACY
EC
ON
OM
Y
CU
LTU
RA
L
FRENCHPEFREEDOM
ENGLISH
LANDSCAPESMONTREAL
TORONTO
RED FRE
SH A
IR
FASC
ILITIE
SP
LAC
EN
AT
UR
EEN
VIR
ON
ME
NT
ALI
STS
GLO
BA
L
INFR
AS
TR
UC
TU
RENORDIC
MO
OSE
ICE HOCKEY
BE
AR
S OPPORTUNITIES
SALMON
OUTDOORS SNO
WS
AFE
TY
TOURISMNORTH
FREEDOM
ADMIRE
NA
TIO
NA
L PA
RK
SST
AN
DA
RD
OF LIV
ING
CU
LTU
RE
CYCLING
MOVIES
SPACIOUSDYNAMIC
80%
70%
60%
50%
40%
30%
20%
10%
0%
Political freedom Environmental friendlinessFood
Would like to visit for a holiday
Resort and lodging options
Range of attractions
Value for money
Natural beauty
Heritage, art and culture
Historical points of interest
Tolerance
Health and education
Standard of living
Safety and security
Would like to live in/study there
Good for business
Advanced technologyGood infrastructure
What are the key associations with Canada? How does Canada perform by dimension?
What words do people use to describe Canada?
25Country Brand Index 2014-15
Canada - Summary of perceptions2014-15 rankings
5 Canada
50%
40%
30%
20%
10%
0%
80%
70%
60%
Makes productsof high quality
They createunique products
Makes products that are authentic
Would like tobuy productsmade inthat country
Technology& Innovation
Political &Economic Influence
Sustainability &EnvironmentalFriendliness
CulturalSignificance
0% 10% 20% 30% 40% 50% 60% 70%
0% 10% 20% 30% 40% 50% 60% 70% 80%
33%
28%
23%
25%
30%
Country expertise average
11%
44%
23%
27%
18%
28%
40%
23%
15%
13%
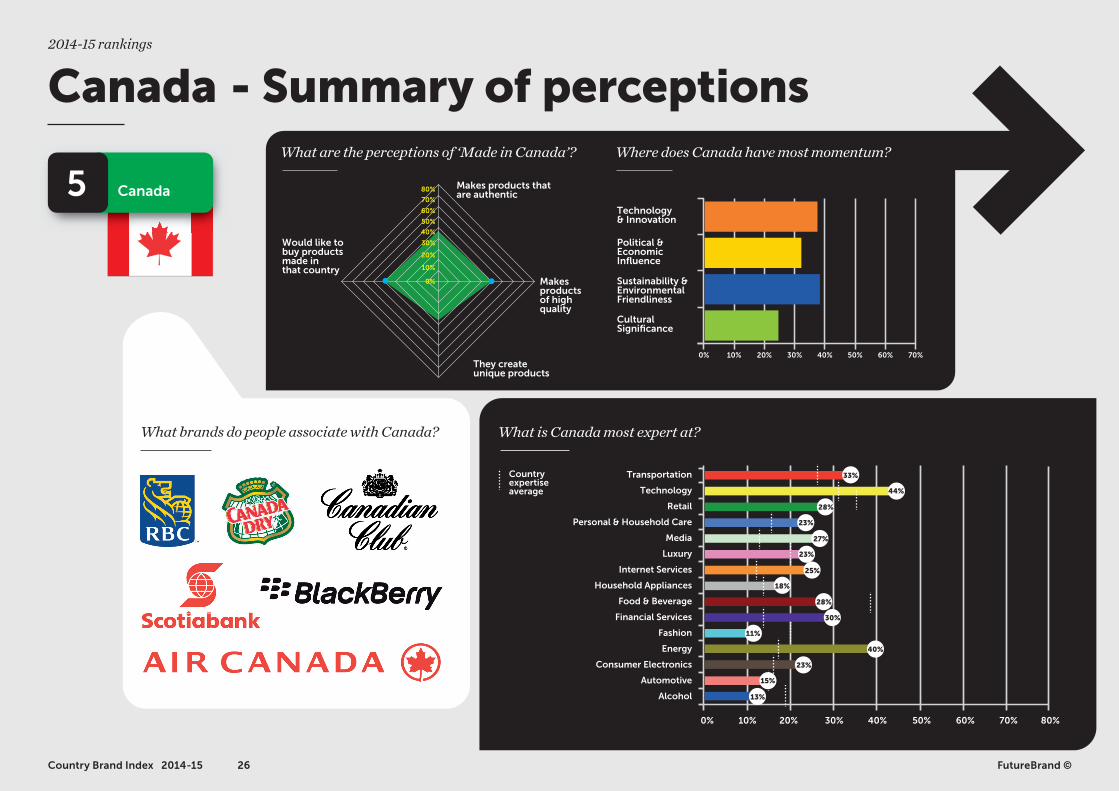
What brands do people associate with Canada?
What are the perceptions of ‘Made in Canada’? Where does Canada have most momentum?
What is Canada most expert at?
Transportation
Technology
Retail
Personal & Household Care
Media
Luxury
Internet Services
Household Appliances
Food & Beverage
Financial Services
Fashion
Energy
Consumer Electronics
Automotive
Alcohol
26Country Brand Index 2014-15 FutureBrand ©
Canada - Summary of perceptions2014-15 rankings
1 New York
2 London
3 Beijing
4 Washington
5 Moscow
6 Tokyo
7 Paris
8 Berlin
9 Shanghai
10 Dubai
11 Hong Kong
12 Singapore
13 New Delhi
14 São Paulo
15 Rio de Janeiro
16 Los Angeles
17 Rome
18 Toronto
19 Seoul
20 Mumbai
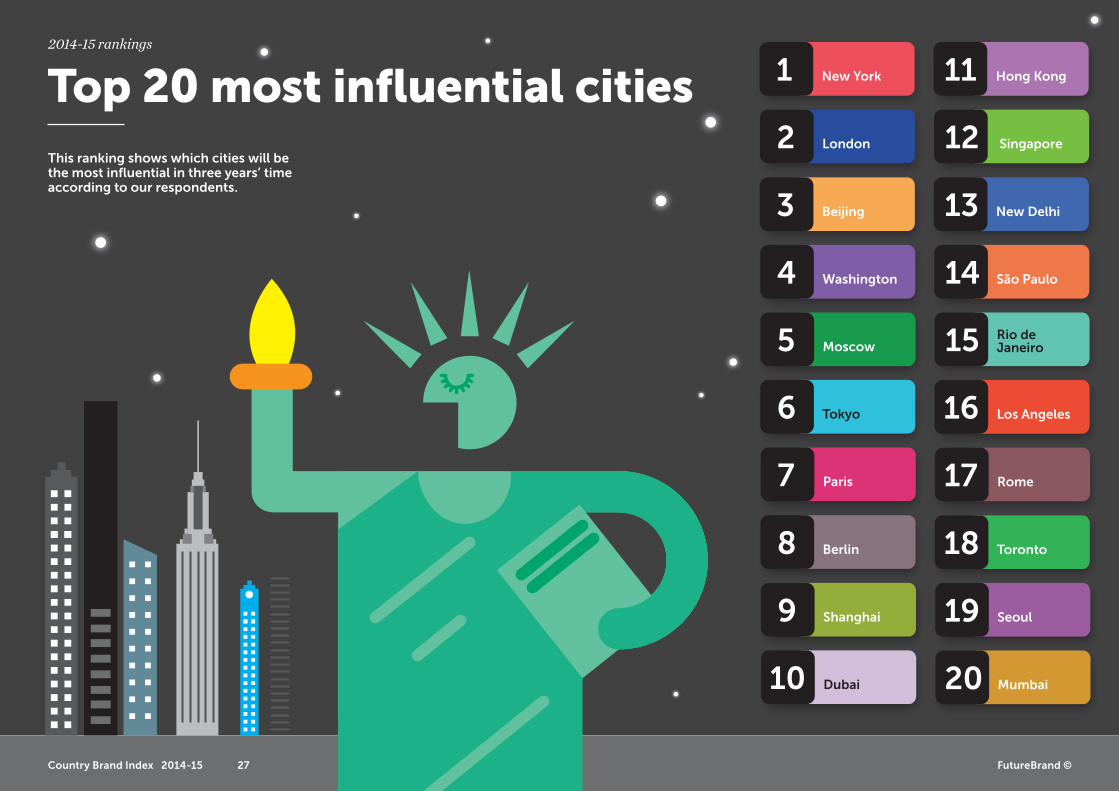
This ranking shows which cities will be the most infl uential in three years’ timeaccording to our respondents.
Top 20 most infl uential cities2014-15 rankings
FutureBrand ©27Country Brand Index 2014-15
28Country Brand Index 2014-15 FutureBrand ©
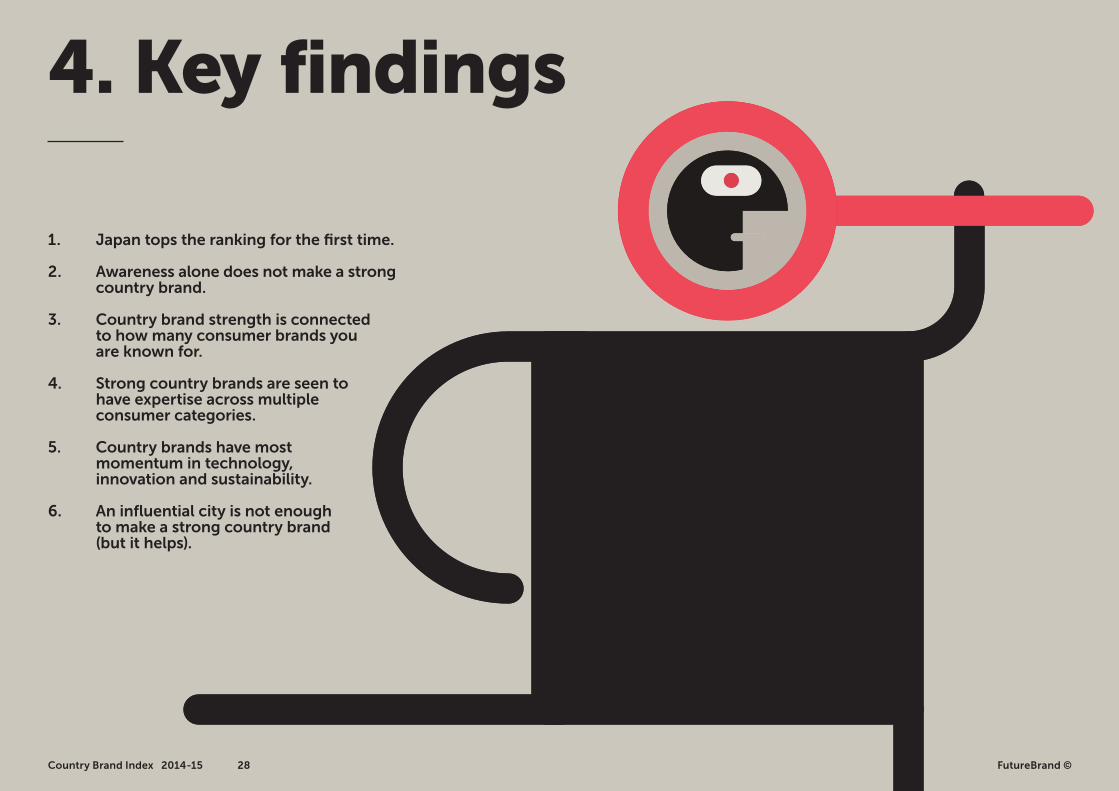
4. Key findings
1. Japan tops the ranking for the fi rst time.
2. Awareness alone does not make a strong country brand.
3. Country brand strength is connected to how many consumer brands you are known for.
4. Strong country brands are seen to have expertise across multiple consumer categories.
5. Country brands have most momentum in technology, innovation and sustainability.
6. An infl uential city is not enough to make a strong country brand (but it helps).
29Country Brand Index 2014-15
Key fi ndingsKey fi ndings
1. Japan tops the ranking for the fi rst time.Japan tops the ranking for the fi rst time this year and sets a new benchmark for country brand strength. It enjoys a top fi ve ranking in the Heritage & Culture and Tourism dimensions and leads perception strength in Business Potential and the newly created ‘Made In’ dimension. More than 65% of our respondents would consider visiting the country in the next fi ve years and 90% would recommend it to family and friends. Nearly nine out of ten of those asked think Japan is a good country to do business with and 63% are prepared to buy its products and services compared to the ‘countries’ average - 20%.
Whilst Japan has always enjoyed strong perceptions in the minds of international travellers, these results secure its place as the strongest ‘country brand’ by our measures. It is joined by other strong Asian country brands in the top 20 including South Korea and Singapore, each of which show perception strength in the Business Potential dimension, but are given particular credit against the ‘advanced technology’ attribute.
Otherwise, the top twenty is dominated by European country brands, led by Switzerland and Germany but supported, as in previous years, by Scandinavia. Whilst we are not able to make direct ranking comparisons against previous studies, it is interesting to see that the addition of the ‘Made In’ dimension has bolstered the relative performance of countries like Japan within the top 20 and introduced new middle eastern leaders like UAE, but the members of that group remain fairly stable year on year even if rank positions change slightly.
30Country Brand Index 2014-15 FutureBrand ©
2. Awareness alone does not make a strong country brand.This year’s study reinforces the perennial paradox of awareness: being well known does not always correlate to strong positive associations. For example, Italy enjoys higher awareness levels than Japan in our sample (89% compared to 84%) but is seventeen places lower in the rankings. Similarly, Mexico enjoys 80% awareness but is in the bottom third of the rankings. Conversely, Finland, Singapore, Iceland, the UAE and South Korea are all in the top twenty, but have awareness levels below 70%. So if being well known is not enough to drive positive perceptions, how should we understand the impact that global events can have on country brand strength?
There is no doubt that major international sporting and cultural events have a positive impact on awareness of the host country. We saw this with South Africa and Canada in 2010, which enjoyed signifi cant uplift in awareness following the FIFA World Cup™ and Vancouver 2010 Winter Olympic Games respectively in our study. Importantly, however, South Africa’s ranking position remained the same whereas Canada improved. This is particularly important in 2014 in light of the Sochi Winter Olympic Games and the 2014 FIFA World Cup Brazil™. Both countries enjoyed a positive increase in their levels of awareness from 2012, with Russia increasing from 63% to 80% and Brazil leaping 17 points to 83% awareness year on year. This must correlate to international coverage of their events, both positive and negative.
However, whilst we cannot make absolute ranking comparisons with 2012, Russia’s perception strength against equivalent dimensions has improved, whereas Brazil now has weaker perceptions in attributes like Standard of living, Safety and Value for money. And both countries continue to suff er from relatively weak perceptions in important areas like Quality Of Life and Value System. We can perhaps understand this in terms of improved understanding of each country, in which familiarity creates a more realistic image of a country, and tempers idealised traveller perceptions that might artifi cially improve scores. But Canada off ers a valuable case study of a country that deliberately used a major event to shape perceptions against its brand strategy and managed to connect improved awareness to the story it was keen to tell – all of which ultimately correlated to improved brand strength against our dimensions.
Key fi ndingsKey fi ndings
31Country Brand Index 2014-15 FutureBrand ©
Key findingsKey findings
3. Country brand strength is connected to how many consumer brands you are known for.There is a strong correlation between the ‘country brands’ in our study and spontaneous awareness of consumer brands associated with them. On average, our respondents demonstrated awareness of a larger number of brands across more categories for the 22 country brands, and those brands were often more international or global in reach. For example, Japan elicited associations with Toyota, Nintendo, Honda, Sony, Toshiba and Panasonic, reflecting perceptions of strong category expertise for the country in technology, consumer electronics and automotive. Conversely, countries with weaker perceptions in the ranking also tend to elicit fewer spontaneous consumer brand associations. Interestingly, flag carrying airlines were very frequently mentioned in association with countries across the study, and in the case of countries like Indonesia and Egypt, were the only brands respondents were able to recall, underscoring the important contribution air travel brands make towards building country brand perceptions.
4. Strong country brands are seen to have expertise across multiple consumer categories.We asked respondents to tell us how far each country has ‘expertise’ across fifteen categories of products and services – from alcohol to transportation. Interestingly, the average score of ‘country brands’ is higher in all categories than the average score of ‘countries’ with the exceptions of Retail and Food and Beverage where most countries in the ranking get some degree of credit. The United States leads, enjoying better than average perceptions across fourteen categories and being strongest in Technology (72%).
And different countries are more strongly associated with different things. For example, France is most strongly associated with Fashion (65%), Germany with Automotive (77%) and Japan with Technology (78% - the highest score of a country in a category).
The ‘country brands’ also all benefit from stronger than average perceptions (23%) of creating ‘products of high quality’, with Germany and Japan leading the group. So it would seem clear that country brand strength strongly correlates to perceptions of expertise in the categories of goods and services that global consumers purchase every day.
One anomaly in the research is the occasional gap between spontaneous category associations and brands among our respondents. For example, the word ‘beer’ was most frequently mentioned in descriptions of Germany, but no respondent offered a German beer brand as an example of this. Which indicates that sometimes a country is associated with a product or service generically, without people connecting that place directly to consumption choices.
FutureBrand ©
Key fi ndingsKey fi ndings
5. Country brands have most momentum in technology, innovation and sustainability. Perceptions of momentum – how far a country is moving forwards and in what ways – are an interesting bellwether of future success. Conventional wisdom might suggest the strongest country brands are those with greatest momentum in political and economic infl uence or cultural signifi cance. Interestingly, our study shows that most of the top ten country brands are seen to have more momentum in technology and innovation or sustainability and environmental friendliness, or both. In other words, the future drivers of competition for countries relate more to the contribution they are making to global progress and better management of the world’s resources, and ‘country brands’ are more keenly associated with these forces. Conversely, those ranked as ‘countries’ in our study are most likely to have the strongest momentum in cultural signifi cance.
6. An infl uential city is not enough to make a strong country brand (but it helps).Commentators sometimes assert that countries like the UK and the United States are synonymous with their most famous cities in people’s minds. To test this, we asked respondents to tell us which cities in the world will be the most infl uential in three years’ time – indicating their current strength and potential. Their answers demonstrated some interesting diff erences between country and city perception strength.
For example, our list of the twenty most infl uential cities does not include any in Norway or Denmark – both top ten country brands in this year’s study. And seven of the most infl uential cities are not even in the top twenty country brands, meaning that some cities rank higher in infl uence than their respective country brand position. Rio and São Paolo stand out against Brazil’s overall ranking of 43rd, New Delhi is the 13th most infl uential city compared to a bottom quartile country performance for India, and Beijing is seen as the world’s third most infl uential city compared to China’s overall ranking performance at 28th. Overall then, it seems that having an infl uential city does not guarantee country brand strength and brand strength does not depend on city perception alone.
The UK is often strongly identifi ed with London, not least in the afterglow of the London 2012 Olympic Games, but London far out-performs the UK overall. However, like London, the majority (13) of the most infl uential cities are either the capitals or second major cities of top ten country brands, which is a strong reminder that country brand strength and city infl uence, whilst not the same thing, are often part of the same story in people’s perceptions.
33Country Brand Index 2014-15 FutureBrand ©
5. What makes a country brand?
75Countries included in our survey
22Only 22 qualify as ‘country brands’ by our measures...
34Country Brand Index 2014-15
Not all countries are country brands
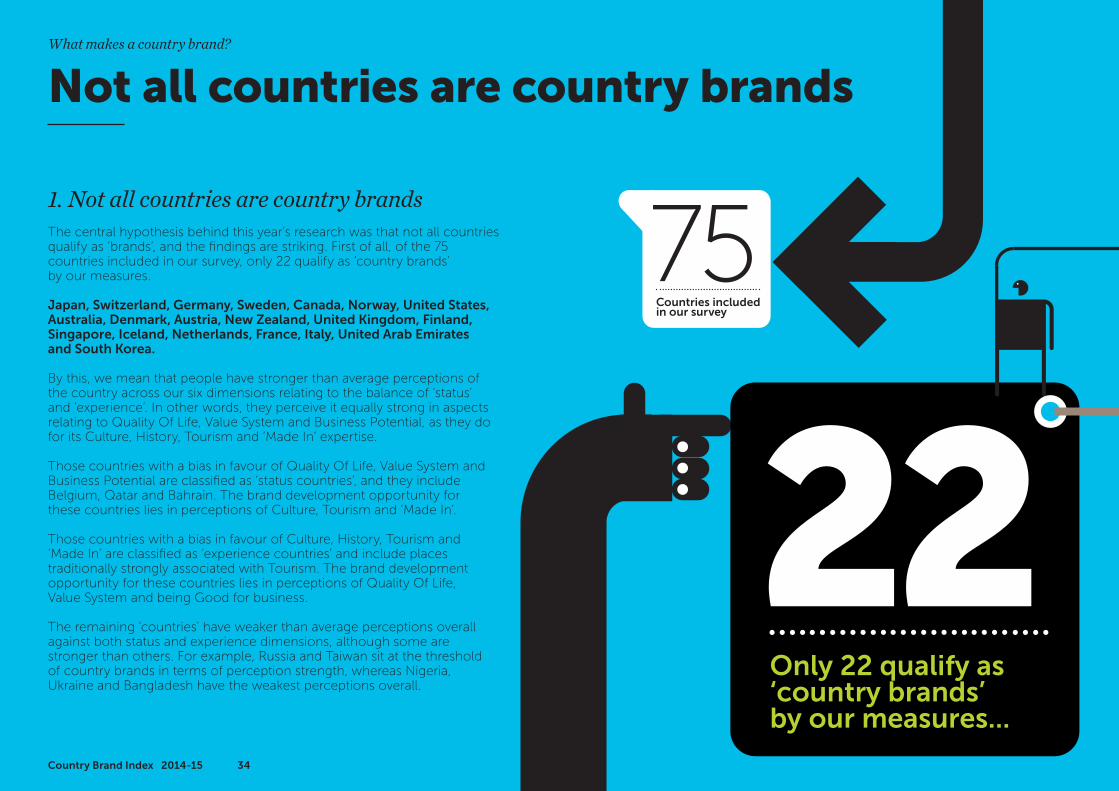
1. Not all countries are country brandsThe central hypothesis behind this year’s research was that not all countries qualify as ‘brands’, and the findings are striking. First of all, of the 75 countries included in our survey, only 22 qualify as ‘country brands’ by our measures.
Japan, Switzerland, Germany, Sweden, Canada, Norway, United States, Australia, Denmark, Austria, New Zealand, United Kingdom, Finland, Singapore, Iceland, Netherlands, France, Italy, United Arab Emirates and South Korea.
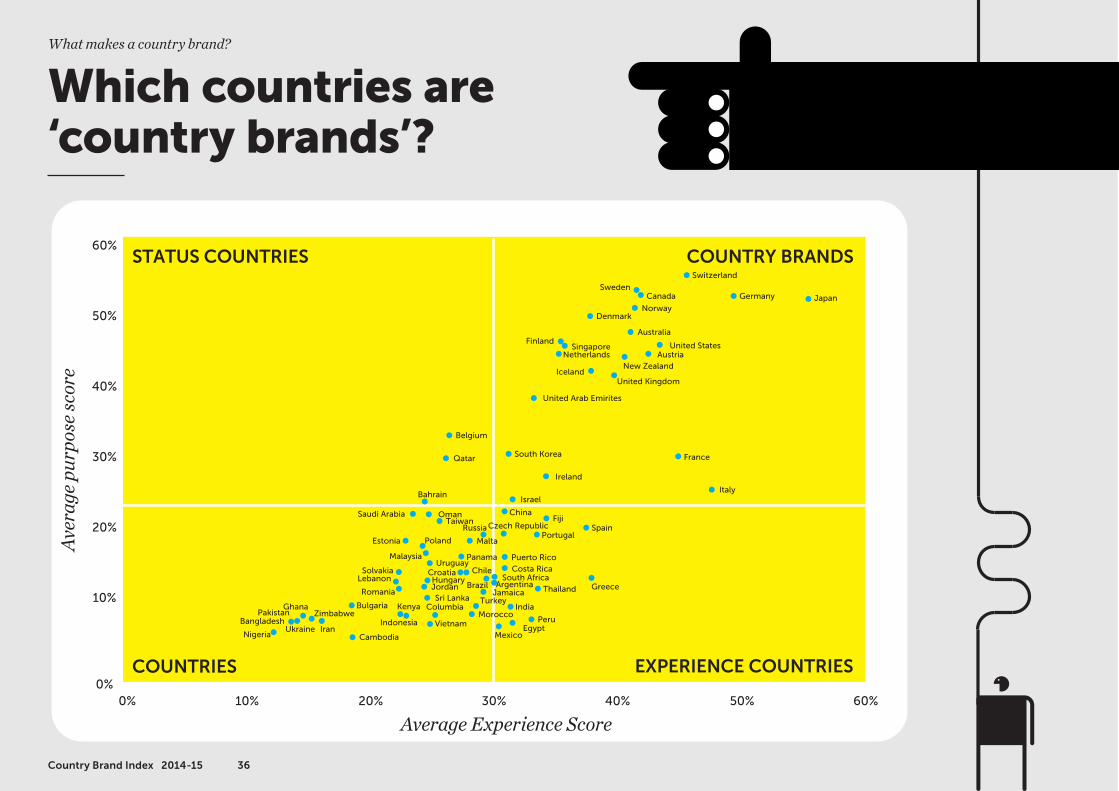
By this, we mean that people have stronger than average perceptions of the country across our six dimensions relating to the balance of ‘status’ and ‘experience’. In other words, they perceive it equally strong in aspects relating to Quality Of Life, Value System and Business Potential, as they do for its Culture, History, Tourism and ‘Made In’ expertise.
Those countries with a bias in favour of Quality Of Life, Value System and Business Potential are classified as ‘status countries’, and they include Belgium, Qatar and Bahrain. The brand development opportunity for these countries lies in perceptions of Culture, Tourism and ‘Made In’.
Those countries with a bias in favour of Culture, History, Tourism and ‘Made In’ are classified as ‘experience countries’ and include places traditionally strongly associated with Tourism. The brand development opportunity for these countries lies in perceptions of Quality Of Life, Value System and being Good for business.
The remaining ‘countries’ have weaker than average perceptions overall against both status and experience dimensions, although some are stronger than others. For example, Russia and Taiwan sit at the threshold of country brands in terms of perception strength, whereas Nigeria, Ukraine and Bangladesh have the weakest perceptions overall.
What makes a country brand?
60%
Visited / Consider visiting in the next 5 years:Country Brand vs Country Average
Recommended for Tourism & Business:Country Brand vs Country Average
COUNTRY BRANDSCOUNTRIES
COUNTRY BRANDSCOUNTRIES
COUNTRY BRANDSCOUNTRIES
COUNTRY BRANDSCOUNTRIES
0%
10%
20%
30%
40%
50%
VISITED IN THELAST 5 YEARS
WOULD CONSIDER VISITINGIN THE NEXT 5 YEARS
0%
10%
20%
30%
40%
50%
WOULD LIKE TO BUY PRODUCTS MADE IN THAT COUNTRY:
Would Like to Buy Products Made in that Country:Country Brand vs Country Average
60%
Closeness & Confidence:Country Brands vs Country Average
0%
10%
20%
30%
40%
50%
RELATIONSHIP:FEEL PASSIONATE
RELATIONSHIP:FEEL DISTANT
RELATIONSHIP:HAVE VERY
HIGH CONFIDENCE
RELATIONSHIP:LOW CONFIDENCE
100%
0%
10%
20%
30%
40%
50%
RECOMMENDED TOFAMILY & FRIENDS
GOOD TO DO BUSINESS WITH
60%
70%
80%
90%
41%
20%
27%
18%
48%
14% 7%
7%
3%
15%
91%
73%
85%
62%
46%
39%
56%
49%
35Country Brand Index 2014-15
Country brands have a competitive advantage
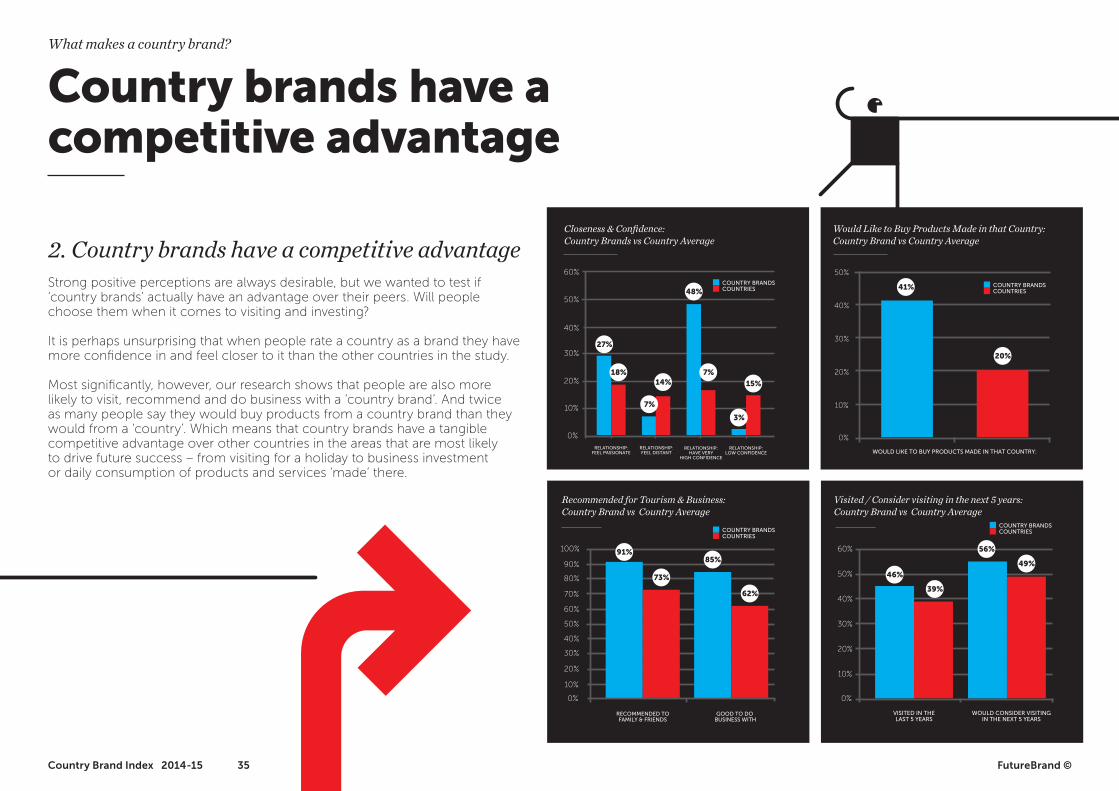
2. Country brands have a competitive advantageStrong positive perceptions are always desirable, but we wanted to test if ‘country brands’ actually have an advantage over their peers. Will people choose them when it comes to visiting and investing?
It is perhaps unsurprising that when people rate a country as a brand they have more confidence in and feel closer to it than the other countries in the study.
Most significantly, however, our research shows that people are also more likely to visit, recommend and do business with a ‘country brand’. And twice as many people say they would buy products from a country brand than they would from a ‘country’. Which means that country brands have a tangible competitive advantage over other countries in the areas that are most likely to drive future success – from visiting for a holiday to business investment or daily consumption of products and services ‘made’ there.
What makes a country brand?
FutureBrand ©
60%
50%
40%
30%
20%
10%
0%10%0% 20% 30% 40% 50% 60%
NigeriaUkraine
BangladeshPakistan
Ghana
Iran
Zimbabwe
Cambodia
Indonesia
Bulgaria Kenya
Romania
Vietnam
LebanonSolvakia
Malaysia
Estonia
Uruguay
Columbia
MexicoEgypt
Greece
PeruMorocco
IndiaTurkeySri Lanka
BrazilJordan Thailand
SpainPortugal
Puerto RicoCosta Rica
South Africa
Fiji
Malta
RussiaTaiwan
Panama
Czech Republic
ArgentinaJamaica
ChileCroatiaHungary
Poland
Saudi Arabia
Ireland
Qatar South Korea
Belgium
United Arab Emirites
France
United KingdomIceland
New Zealand
Finland
Denmark
Australia
SingaporeNetherlands Austria
United States
Norway
Germany Japan
Switzerland
CanadaSweden
STATUS COUNTRIES
EXPERIENCE COUNTRIES
COUNTRY BRANDS
COUNTRIES
ItalyIsrael
Oman
Bahrain
China
Which countries are ‘country brands’?
Aver
age p
urpo
se sc
ore
Average Experience Score
What makes a country brand?
36Country Brand Index 2014-15
FutureBrand ©37Country Brand Index 2014-15
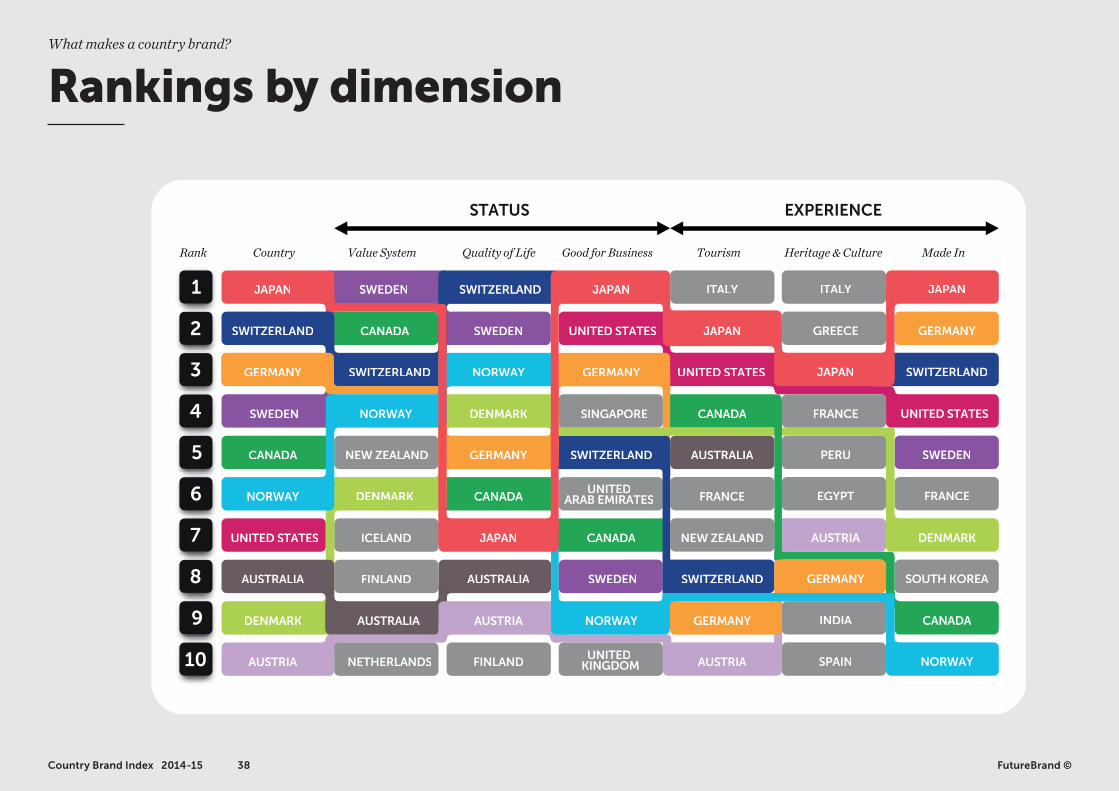
Rankings by dimensionWhat makes a country brand?
1
2
3
4
5
6
7
8
9
10
CANADA
UNITED STATES
AUSTRIA
SWEDEN
CANADA
NEW ZEALAND
ICELAND
FINLAND
SWEDEN
CANADA
AUSTRALIA
FINLAND
UNITEDARAB EMIRATES
CANADA
UNITED KINGDOM
ITALY
CANADA
FRANCE
NEW ZEALAND
AUSTRIA
ITALY
GREECE
EGYPT
AUSTRIA
SPAIN
JAPAN
GERMANY
SWITZERLAND
SWEDEN
FRANCE
SOUTH KOREA
NORWAY
UNITED STATES
SWITZERLAND
SWITZERLAND
SWEDEN
JAPAN
DENMARK
SWITZERLAND
NORWAY
NETHERLANDS
DENMARK CANADA
PERU
UNITED STATES
AUSTRALIA
UNITED STATES JAPAN
SWITZERLAND
AUSTRALIA
AUSTRALIA AUSTRIA
SWEDEN
JAPAN
GERMANY
GERMANY GERMANYNORWAY
DENMARKNORWAY SINGAPORE
SWITZERLAND
JAPAN
JAPAN
STATUS EXPERIENCE
Rank Country Value System Quality of Life Good for Business Tourism Heritage & Culture Made In
INDIA
DENMARK
GERMANY
FRANCE
GERMANYNORWAY
38Country Brand Index 2014-15 FutureBrand ©
Rankings by dimensionWhat makes a country brand?
6. Regional rankings
FutureBrand ©39Country Brand Index 2014-15
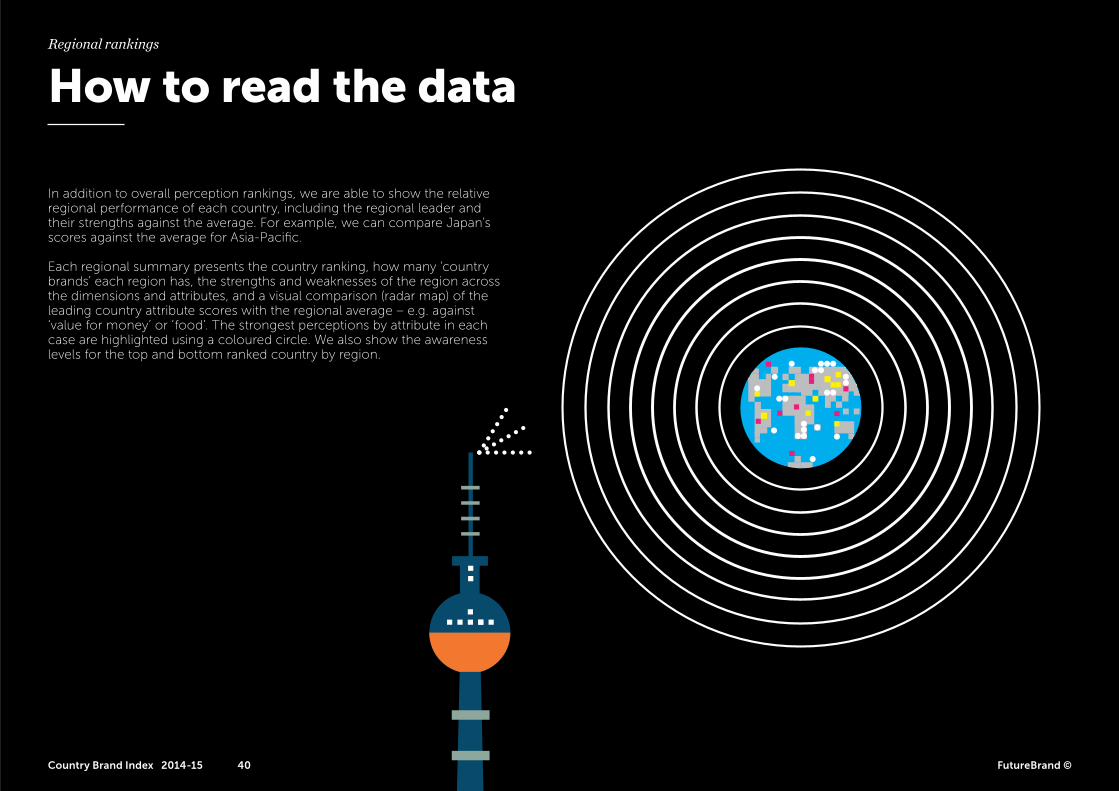
In addition to overall perception rankings, we are able to show the relative regional performance of each country, including the regional leader and their strengths against the average. For example, we can compare Japan’s scores against the average for Asia-Pacific.
Each regional summary presents the country ranking, how many ‘country brands’ each region has, the strengths and weaknesses of the region across the dimensions and attributes, and a visual comparison (radar map) of the leading country attribute scores with the regional average – e.g. against ‘value for money’ or ‘food’. The strongest perceptions by attribute in each case are highlighted using a coloured circle. We also show the awareness levels for the top and bottom ranked country by region.
Regional rankings
How to read the data
FutureBrand ©40Country Brand Index 2014-15
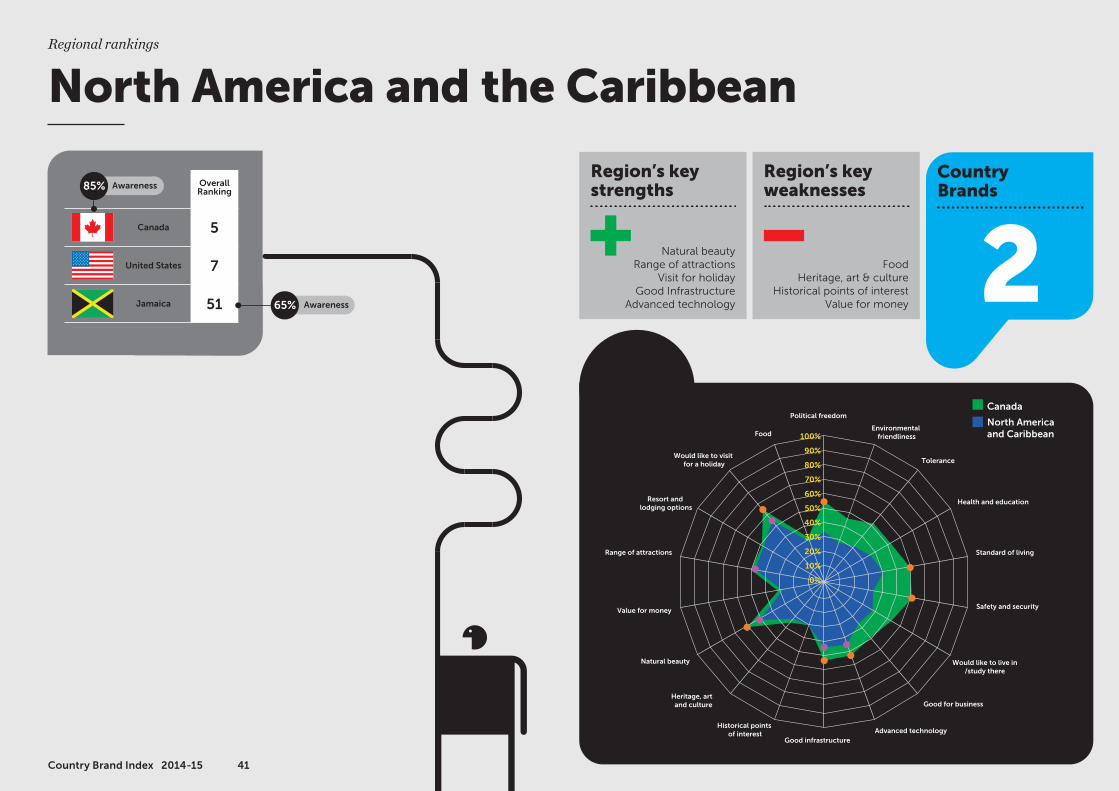
North Americaand Caribbean
Region’s key strengths
Region’s key weaknesses
Country Brands
Natural beautyRange of attractions
Visit for holidayGood Infrastructure
Advanced technology
FoodHeritage, art & culture
Historical points of interestValue for money
2OverallRanking
5Canada
7United States
51Jamaica
Political freedom
Environmental friendliness
Canada
Food
Would like to visit for a holiday
Resort and lodging options
Range of attractions
Value for money
Natural beauty
Heritage, art and culture
Historical points of interest
Tolerance
Health and education
Standard of living
Safety and security
Would like to live in/study there
Good for business
Advanced technologyGood infrastructure
80%
90%
100%
70%
60%
50%
40%
30%
20%
10%
0%
85%
65%
Awareness
Awareness
41Country Brand Index 2014-15
North America and the CaribbeanRegional rankings
OverallRanking
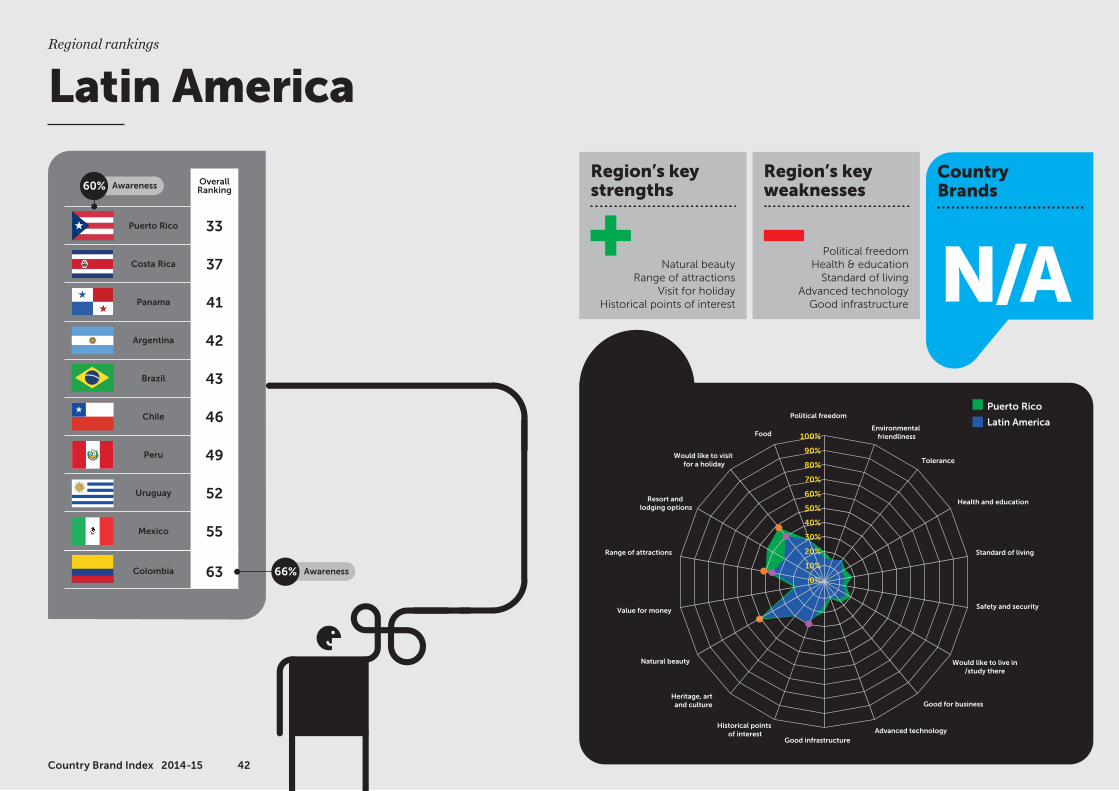
33Puerto Rico
37Costa Rica
41
42
43
Panama
Argentina
Brazil
46Chile
49Peru
52Uruguay
55Mexico
63Colombia
Latin America
80%
90%
100%
70%
60%
50%
40%
30%
20%
10%
0%
Political freedom
Environmental friendliness
Puerto Rico
Food
Would like to visit for a holiday
Resort and lodging options
Range of attractions
Value for money
Natural beauty
Heritage, art and culture
Historical points of interest
Tolerance
Health and education
Standard of living
Safety and security
Would like to live in/study there
Good for business
Advanced technologyGood infrastructure
66% Awareness
Region’s key strengths
Region’s key weaknesses
Country Brands
Natural beautyRange of attractions
Visit for holidayHistorical points of interest
Political freedomHealth & education
Standard of livingAdvanced technology
Good infrastructureN/A
60% Awareness
Latin AmericaRegional rankings
42Country Brand Index 2014-15
OverallRanking
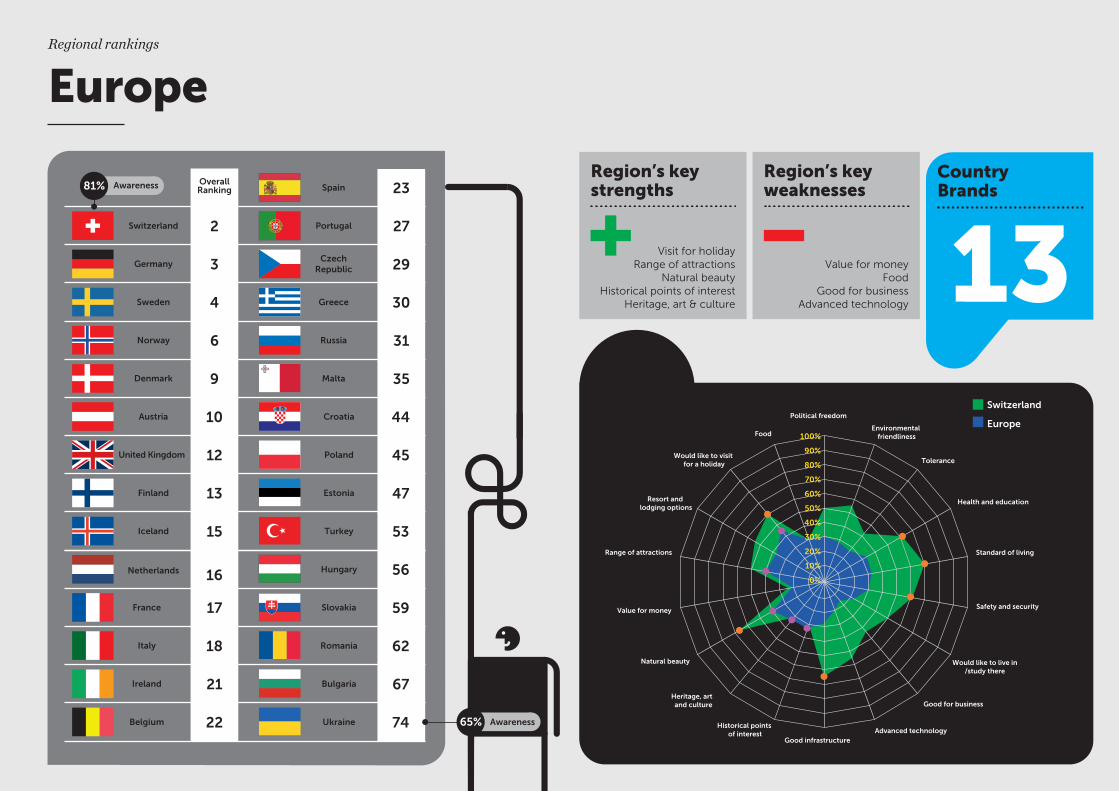
2Switzerland
3Germany
4
6
9
Sweden
Norway
Denmark
10Austria
12United Kingdom
13Finland
15Iceland
16Netherlands
23Spain
27Portugal
29CzechRepublic
30Greece
31Russia
35Malta
44Croatia
45Poland
47
53
56
Estonia
Turkey
Hungary
59Slovakia
62Romania
67Bulgaria
74Ukraine
17France
18Italy
21
22
Ireland
Belgium
Switzerland
80%
90%
100%
70%
60%
50%
40%
30%
20%
10%
0%
Political freedom
Environmental friendliness
EuropeFood
Would like to visit for a holiday
Resort and lodging options
Range of attractions
Value for money
Natural beauty
Heritage, art and culture
Historical points of interest
Tolerance
Health and education
Standard of living
Safety and security
Would like to live in/study there
Good for business
Advanced technologyGood infrastructure
81%
65% Awareness
AwarenessRegion’s key strengths
Region’s key weaknesses
Country Brands
Visit for holidayRange of attractions
Natural beautyHistorical points of interest
Heritage, art & culture
Value for moneyFood
Good for businessAdvanced technology
13
EuropeRegional rankings
OverallRanking
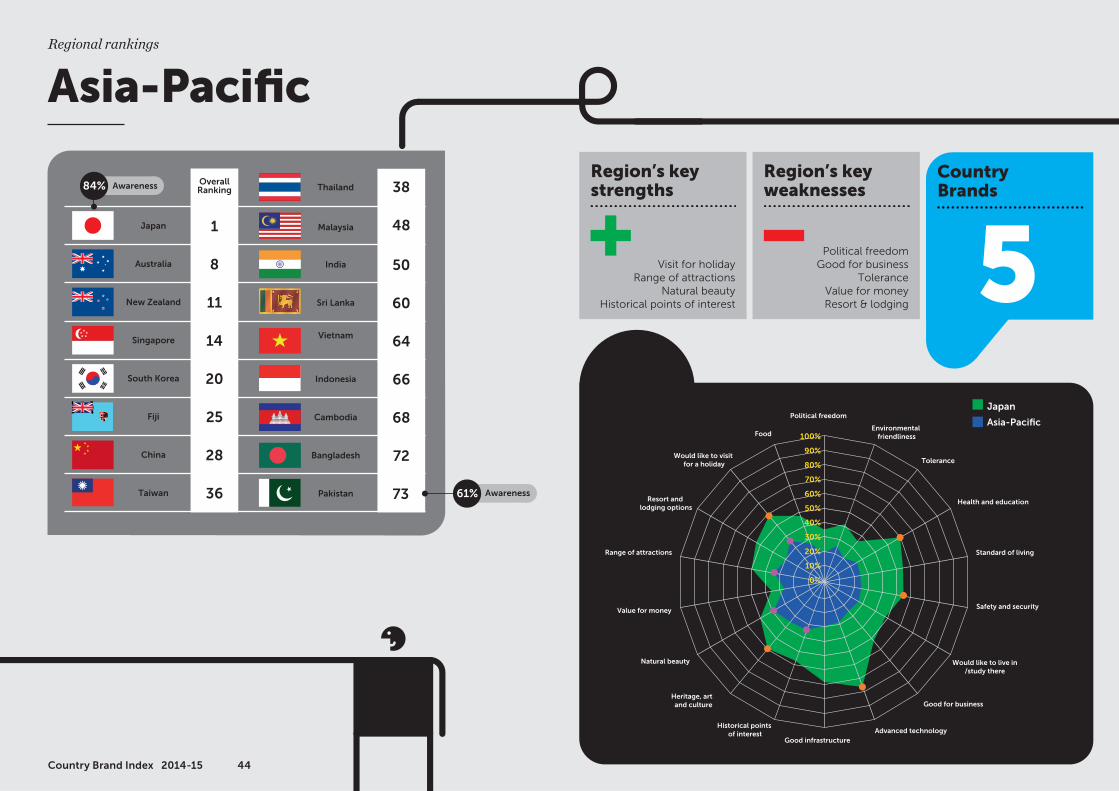
1Japan
8Australia
11
14
20
New Zealand
Singapore
South Korea
25Fiji
28China
36Taiwan
38Thailand
48Malaysia
50India
60Sri Lanka
64Vietnam
66Indonesia
68Cambodia
72Bangladesh
73Pakistan
Asia-Pacific
80%
90%
100%
70%
60%
50%
40%
30%
20%
10%
0%
Political freedom
Environmental friendliness
Japan
Food
Would like to visit for a holiday
Resort and lodging options
Range of attractions
Value for money
Natural beauty
Heritage, art and culture
Historical points of interest
Tolerance
Health and education
Standard of living
Safety and security
Would like to live in/study there
Good for business
Advanced technologyGood infrastructure
84%
61%
38
48
Awareness
Awareness
Region’s key strengths
Region’s key weaknesses
Country Brands
Visit for holidayRange of attractions
Natural beautyHistorical points of interest
Political freedomGood for business
ToleranceValue for moneyResort & lodging
5
44Country Brand Index 2014-15
Asia-Pacifi cRegional rankings
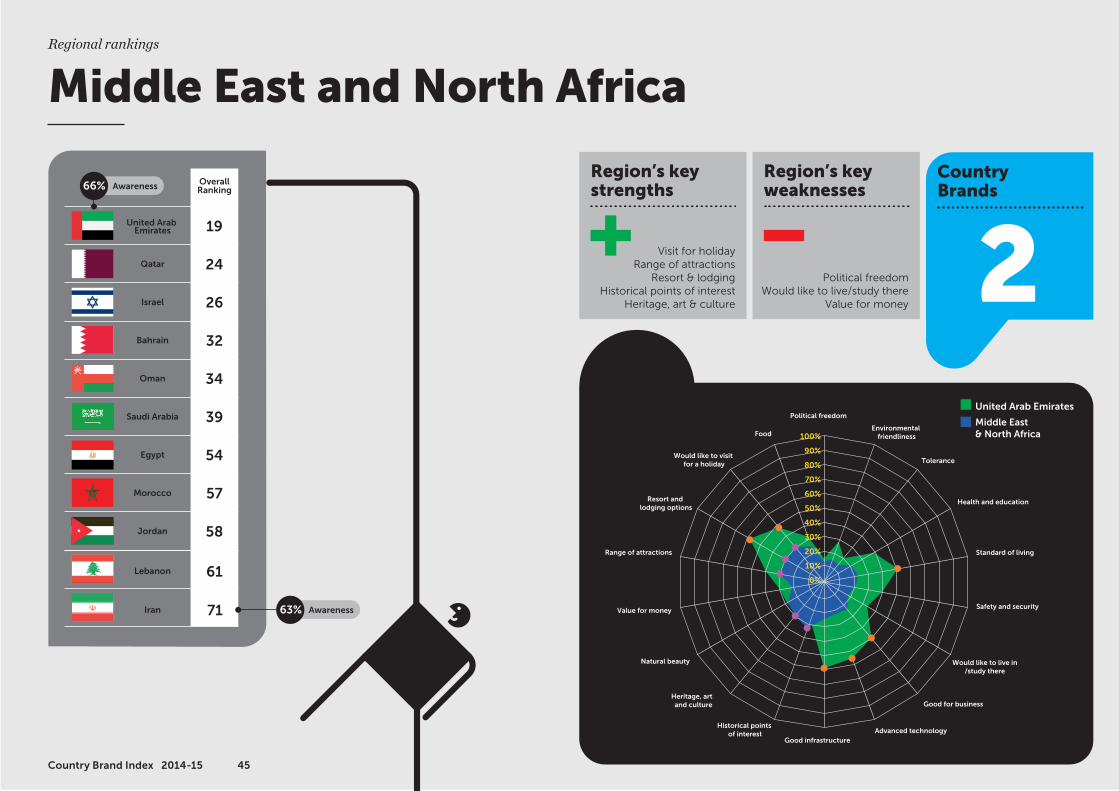
OverallRanking
19United Arab Emirates
24Qatar
26
32
34
Israel
Bahrain
Oman
39Saudi Arabia
54Egypt
57Morocco
58Jordan
61Lebanon
Middle East& North Africa
Political freedom
Environmental friendliness
United Arab Emirates
Food
Would like to visit for a holiday
Resort and lodging options
Range of attractions
Value for money
Natural beauty
Heritage, art and culture
Historical points of interest
Tolerance
Health and education
Standard of living
Safety and security
Would like to live in/study there
Advanced technologyGood infrastructure
80%
90%
100%
70%
60%
50%
40%
30%
20%
10%
0%
Good for business
71Iran
66%
63% Awareness
AwarenessRegion’s key strengths
Region’s key weaknesses
Country Brands
Visit for holidayRange of attractions
Resort & lodgingHistorical points of interest
Heritage, art & culture
Political freedomWould like to live/study there
Value for money2
45Country Brand Index 2014-15
Middle East and North AfricaRegional rankings
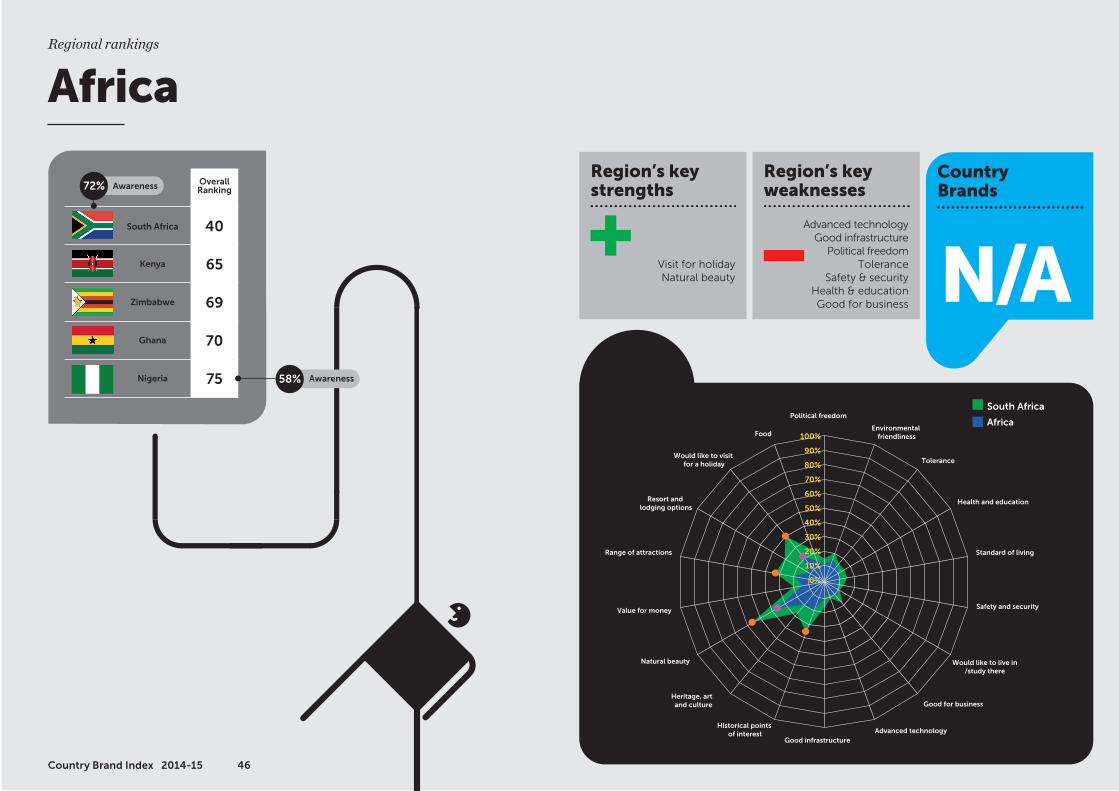
OverallRanking
40South Africa
65Kenya
69
70
75
Zimbabwe
Ghana
Nigeria
AfricaPolitical freedom
Environmental friendliness
South Africa
Food
Would like to visit for a holiday
Resort and lodging options
Range of attractions
Value for money
Natural beauty
Heritage, art and culture
Historical points of interest
Tolerance
Health and education
Standard of living
Safety and security
Would like to live in/study there
Advanced technologyGood infrastructure
Good for business
80%
90%
100%
70%
60%
50%
40%
30%
20%
10%
0%
72%
58% Awareness
AwarenessRegion’s key strengths
Region’s key weaknesses
Country Brands
Visit for holidayNatural beauty
Advanced technologyGood infrastructure
Political freedomTolerance
Safety & securityHealth & educationGood for business N/A
46Country Brand Index 2014-15
AfricaRegional rankings

7. Future focus
FutureBrand ©47Country Brand Index 2014-15

1
2
3
4
5
China
United ArabEmirates
SouthKorea
Israel
Qatar
Ones to watchFuture focus
China, the United Arab Emirates, South Korea, Israel and Qatar are the countries our respondents felt were most likely to be ‘moving forwards’ in three years’ time. These countries have strong perceptions around ‘Business Potential’ and are seen to have momentum in innovation as well as expertise in energy and technology – all of which correlate to country brand strength. And more than 50% of our respondents indicate they would consider visiting these countries in the next fi ve years – with China enjoying the highest consideration. Of the ‘ones to watch’, South Korea enjoys the highest ‘Made In’ ranking (#8 overall), perhaps not a surprise when we consider the signifi cant growth of Samsung and other South Korean brands and organizations over the last 10 years. Samsung enjoys a top 10 position in the FutureBrand Index study and is one of the largest companies in the world by market capitalization.
Future focusFuture focus
Ones to watch
FutureBrand ©49Country Brand Index 2014-15
FutureBrand ©50Country Brand Index 2014-15
Dominant themesFuture focus
This year’s research has surfaced three dominant themes that we believe will have an influence on the future of countries as brands:
ExtremismFrom the increased electoral significance of populist extremist parties like the National Front and the Austrian Freedom Party in Europe to Islamic fundamentalism and the rise of ISIS and Boko Haram in the Middle East and Africa, there is a growing preoccupation with extremism and polarization around economic, social and religious issues around the world. In this climate of uncertainty and social anxiety, we would expect to see an equivalent increase in freedom, stability and security as drivers of country brand strength. Countries that enjoy the strongest perceptions in the dimension of Political freedom like Canada #1, Sweden #2 and Denmark #3, and Tolerance, Safety and security (Switzerland #1) are important benchmarks for country brand managers seeking to encourage visitor confidence.
MigrationThe number of people living abroad around the world is increasing every year according to the UN (232 million in 2013 compared to 154 million in 1990). This rise correlates to factors like growing global middle class discretionary income and low cost travel and accommodation, but also country and regional cooperation around trade and migration across borders, driven by the search for the best work and education opportunities, or flight from economic or social difficulty. These migrants are naturally drawn to countries they perceive to be more open and tolerant, whose education and welfare systems are the most liberal and that enjoy the best infrastructure. With that in mind, the brand building activities of countries that enjoy the strongest perceptions in Infrastructure (Japan #1, Germany #2 and Switzerland #3), being Good for business (USA #1, Germany #2 and Japan #3) and Health and education (Switzerland #1, Sweden #2 and Germany #3) offer a guide to the levers countries can pull to capitalize on this trend.
Conscious consumption We are increasingly preoccupied with the impact our consumption has on the world around us and understand that whilst resources might come from specific countries – like food or energy or raw materials – their use effects the entire planet, and that some countries and regions have better access to those resources than others. In that context, companies are making an increased effort to improve transparency around their global supply chains, and consumers are taking a more active interest in the provenance and manufacturing processes behind the products and services they consume. This is a major factor in the increasing role of country of origin in consumption decisions as consumers and organizations seek to reconcile our perceptions of expertise, quality and provenance with the actual ownership and manufacturing base of the things we consume. In addition to reinforcing strength of perception around category expertise in this context, countries will do well to build stronger simultaneous associations in Environmental friendliness (Switzerland #1, Norway #2 and New Zealand #3) Standard of living (Switzerland #1, Norway #2 and Germany #3) and making High quality products (Germany #1, Japan #2 and Switzerland #3) in a world where people still want a good quality of life without it costing the earth.
FutureBrand ©51Country Brand Index 2014-15
Country brand driversFuture focus
We already know from our ‘Made In’ research that ‘Country of Origin’ is an increasingly important driver of consumer choice when it comes to goods and services. The evidence from this report suggests that the reverse is also true – a reputation for high quality products is a main driver of a ‘country brand’. For example, 70% of our respondents believe this about Germany – a top three country brand in this year’s rankings – compared to an average of 14% for those classifi ed as ‘countries’. The two other main drivers are a desire to visit or study in a country and perceptions of good infrastructure. These three factors make the most diff erence between a country and a country brand, and demonstrate the power of consumer desire in country brand strength. It is perhaps no coincidence that the top 100 ranking of World Universities is dominated by most of our ‘country brands’ (source: topuniversities.com). With that in mind, we would expect countries that prioritize developing and promoting high quality products, making it easy and attractive for visitors to study and work and investing in their core infrastructure – from communications to energy and transport links – to have a brand strength advantage over their peers in the next fi ve years.
FutureBrand ©
8. Appendix
52Country Brand Index 2014-15
OverallRanking
2Switzerland
3Germany
4
5
6
Sweden
Canada
Norway
7United States
8
9
Finland
10Austria
11
Netherlands 16
17
Portugal
18
19
Greece
20
Russia
21
22
Croatia
23
Poland
24
25
26
Estonia
Hungary
27
28
29
30
12
13
14
15
1Japan
Australia
New Zealand
Singapore
South Korea
Fiji
China
Taiwan
Thailand
Malaysia
India
Sri Lanka
Vietnam
Indonesia
Cambodia
Bangladesh
Pakistan
Puerto Rico
Panama
Argentina
Brazil
Chile
Mexico
Colombia
United Arab Emirates
Qatar
Israel
Bahrain
Oman
Saudi Arabia Egypt
Morocco
Jordan
Lebanon
Iran
Kenya
Zimbabwe
Ghana
Nigeria
OverallRanking
32
33
34
35
36
37
38
United Kingdom
39
40
41
46
Spain
47
48
CzechRepublic
49
50
51
52
53
54
55
56
Turkey
57
Slovakia
58
Romania
59
Bulgaria
60
Ukraine
42
43
Italy
44
45
31
OverallRanking
62
63
64
65
66
67
68
69
70
71
France
Ireland
Belgium
61
Jamaica
Denmark
Iceland
Malta
Costa Rica
South Africa
72
73
74
75
Peru
Uruguay
53Country Brand Index 2014-15
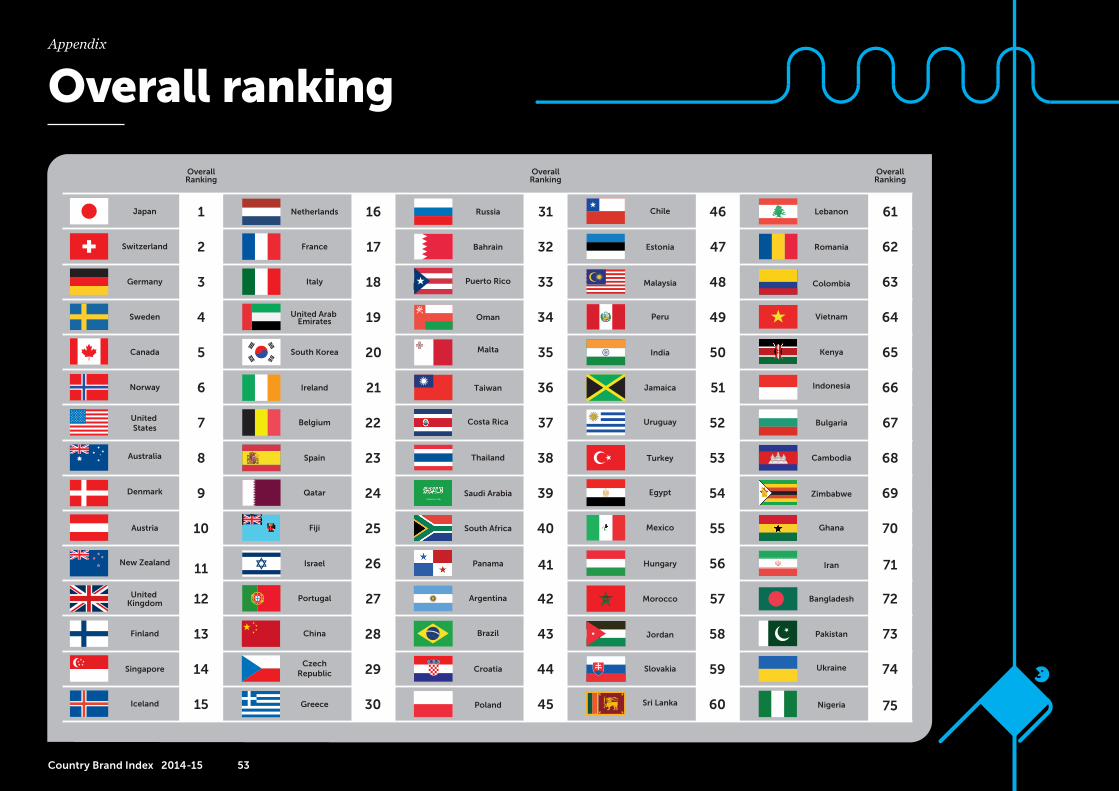
Overall ranking Appendix
54Country Brand Index 2014-15
Appendix
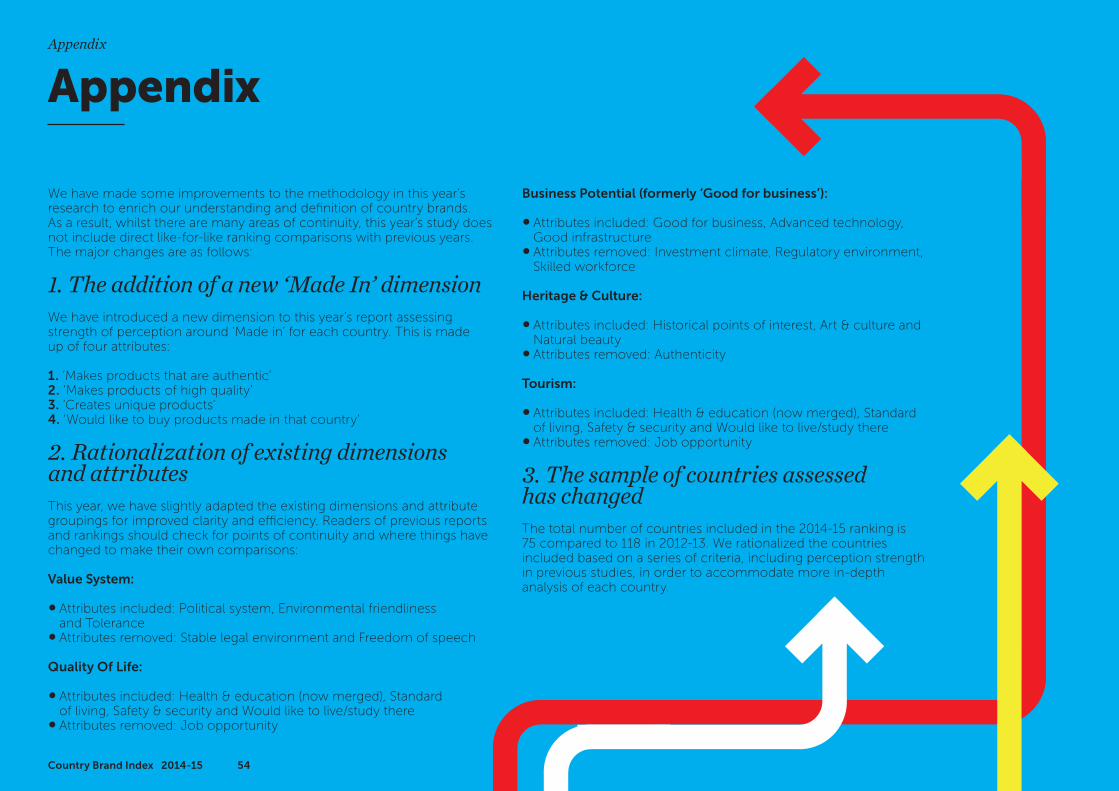
We have made some improvements to the methodology in this year’s research to enrich our understanding and definition of country brands. As a result, whilst there are many areas of continuity, this year’s study does not include direct like-for-like ranking comparisons with previous years. The major changes are as follows:
1. The addition of a new ‘Made In’ dimension We have introduced a new dimension to this year’s report assessing strength of perception around ‘Made in’ for each country. This is made up of four attributes:
1. ‘Makes products that are authentic’2. ‘Makes products of high quality’3. ‘Creates unique products’4. ‘Would like to buy products made in that country’
2. Rationalization of existing dimensions and attributesThis year, we have slightly adapted the existing dimensions and attribute groupings for improved clarity and efficiency. Readers of previous reports and rankings should check for points of continuity and where things have changed to make their own comparisons:
Value System:
• Attributes included: Political system, Environmental friendliness and Tolerance
• Attributes removed: Stable legal environment and Freedom of speech
Quality Of Life:
• Attributes included: Health & education (now merged), Standard of living, Safety & security and Would like to live/study there
• Attributes removed: Job opportunity
Business Potential (formerly ‘Good for business’):
• Attributes included: Good for business, Advanced technology, Good infrastructure
• Attributes removed: Investment climate, Regulatory environment, Skilled workforce
Heritage & Culture:
• Attributes included: Historical points of interest, Art & culture and Natural beauty
• Attributes removed: Authenticity
Tourism:
• Attributes included: Health & education (now merged), Standard of living, Safety & security and Would like to live/study there
• Attributes removed: Job opportunity
3. The sample of countries assessed has changedThe total number of countries included in the 2014-15 ranking is 75 compared to 118 in 2012-13. We rationalized the countries included based on a series of criteria, including perception strength in previous studies, in order to accommodate more in-depth analysis of each country.
Appendix
FutureBrand ©55Country Brand Index 2014-15
Thank you!
For further information please contact: Damien Moore-Evans Global Marketing Manager DD. +44 (0)20 7067 0595 M. +44 (0)7920 590345 Follow: @FutureBrand
2 Waterhouse Square 140 Holborn London EC1N 2AE fblog.futurebrand.com www.futurebrand.com