country by country reporting - handbook on effective tax ... · ... country-by-country reporting...
TRANSCRIPT
•
•
•
•
•
•

Country-by-Country Reporting
Handbook on Effective Tax Risk Assessment
September 2017

This document and any map included herein are without prejudice to the status of or sovereignty over any territory, to the delimitation of international frontiers and boundaries and to the name of any territory, city or area.
Please cite this publication as: OECD (2017), Country-by-Country Reporting: Handbook on Effective Tax Risk Assessment, OECD, Paris. www.oecd.org/tax/beps/country-by-country-reporting-handbook-on-effective-tax-risk-assessment.pdf
Photo credits: Cover © Olivier Le Moal – Shutterstock.com © OECD 2017 You can copy, download or print OECD content for your own use, and you can include excerpts from OECD publications, databases and multimedia products in your own documents, presentations, blogs, websites and teaching materials, provided that suitable acknowledgment of the source and copyright owner is given. All requests for public or commercial use and translation rights should be submitted to [email protected]. Requests for permission to photocopy portions of this material for public or commercial use shall be addressed directly to the Copyright Clearance Center (CCC) at [email protected] or the Centre français d'exploitation du droit de copie (CFC) at [email protected].

PREFACE – 3
COUNTRY-BY-COUNTRY REPORTING - HANDBOOK ON EFFECTIVE TAX RISK ASSESSMENT © OECD 2017
Preface
Next year will be the first time that tax authorities around the world will receive information on large MNE groups with operations in their country, breaking down a group's revenue, profits, tax and other attributes by tax jurisdiction. This information has never previously been available to tax authorities and represents a great opportunity for tax authorities to understand the structure of a group's business in a way that has not been possible before.
Country-by-Country Reporting (CbC Reporting) is one of the four minimum standards of the OECD/G20 Base Erosion and Profit Shifting (BEPS) Project to which over 100 countries have committed, covering the tax residence jurisdictions of nearly all large MNE groups. And the pace of implementation of CbC Reporting is impressive. As of today, more than 55 jurisdictions have already implemented an obligation for relevant MNEs to file CbC Reports. Jurisdictions have also moved quickly to ensure that CbCRs can be exchanged between tax administrations. To date, 65 jurisdictions have signed the Multilateral Competent Authority Agreement and some jurisdictions have entered into bilateral Competent Authority Agreements to operationalise the exchange of CbCRs with specific jurisdictions. With nine months to go until the first CbC Reports are exchanged, over 1 000 exchange relationships between pairs of jurisdictions have already been created.
The onus is now put on tax authorities to develop and implement solutions for the collection and handling of CbC Reports and to make effective and appropriate use of the information they contain. The Canada Revenue Agency, in the context of the OECD Forum on Tax Administration, has sponsored work on two new handbooks, to support countries in the effective implementation of CbC Reporting and on the use of the information contained in CbC Reports for the purposes of tax risk assessment.
The Country-by-Country Reporting: Handbook on Effective Implementation is a practical guide to the key elements that countries need to keep in mind when introducing CbC Reporting, including technical issues related to the filing, exchange and use of CbC Reports, as well as practical matters that tax authorities will need to deal with.
Following implementation of CbC Reporting, a tax authority will then need to start using the information they receive, either from a group directly or from a foreign tax authority. The Country-by-Country Reporting: Handbook on Effective Tax Risk Assessment explores how this can be done, taking into account the different approaches to tax risk assessment applied in different countries, the types of tax risk indicator that may be identified using information contained in CbC Reports, and the challenges that may be faced by tax authorities and that they need to be aware of. It shows that CbC Reports can be a very important tool for the detection and identification of transfer pricing risk and other BEPS-related risk in the hands of a tax administration, used alongside other information that it holds and as a basis for further enquiries, but also raises cautions about

4 – PREFACE
COUNTRY-BY-COUNTRY REPORTING - HANDBOOK ON EFFECTIVE TAX RISK ASSESSMENT © OECD 2017
the risk that simplistic and misleading conclusions may be drawn if CbC Reports are used in isolation.
These two handbooks will provide valuable support to countries introducing CbC Reporting and using the information they receive, but we do not see these handbooks as permanent, static tools. As time passes, tax authorities will gain in experience in collecting, handling and using CbC Reports and each of the handbooks will be updated periodically, to ensure that tax authorities in all countries can benefit from this experience.
Bob Hamilton
Commissioner of the Canada Revenue Agency

TABLE OF CONTENTS – 5
COUNTRY-BY-COUNTRY REPORTING - HANDBOOK ON EFFECTIVE TAX RISK ASSESSMENT © OECD 2017
Table of contents
Abbreviations and Acronyms ....................................................................................................................... 7
Chapter 1 Introduction and Background ................................................................................................... 9
Chapter 2 The Role of Tax Risk Assessment in Tax Administration .................................................... 15
Current developments in tax risk assessment processes ............................................................................ 16
Chapter 3 Overview of CbC Reporting .................................................................................................... 25
The information contained in an MNE group's CbC Report ..................................................................... 25 The advantages CbC Reports offer over other data sources ...................................................................... 27 Other standards for disclosure of country-by-country information ........................................................... 29
Chapter 4 Incorporating CbC Reports Into a Tax Authority's Tax Risk Assessment Framework .. 31
Using CbC Reports within different approaches to tax risk assessment .................................................... 31 Ways in which CbC Reports can be used to detect indicators of possible tax risk .................................... 33 Tax risk indicators that may be detected using information contained in CbC Reports ............................ 35
Chapter 5 Challenges to the Effective Use of CbC Reports for Tax Risk Assessment ......................... 45
Chapter 6 Using CbC Reports alongside data from other sources ........................................................ 55
Chapter 7 Using the Results of a Tax Risk Assessment Based on CbCR Information ........................ 59
Annex 1 Model template for a Country-by-Country Report ................................................................. 61
Annex 2 Tax risk indicators that may be detected using a CbC Report ............................................... 64
Annex 3 Example Use of a CbC Report for Tax Risk Assessment ........................................................ 66


ABBREVIATIONS AND ACRONYMS – 7
COUNTRY-BY-COUNTRY REPORTING - HANDBOOK ON EFFECTIVE TAX RISK ASSESSMENT © OECD 2017
Abbreviations and Acronyms
AEOI Automatic Exchange of Information
AIR Annual Information Return
ALBC Approach to Large Business Compliance
ANZSIC Australian and New Zealand Standard Industrial Classification
ATO Australian Taxation Office
BEPS Base Erosion and Profit Shifting
CAA Competent Authority Agreement
CASS Computer Assisted Scrutiny Selection
CbC Country-by-Country
CbCR Country-by-Country Reporting
CFC Controlled Foreign Company
CIB Centralised Information Branch
CGTP Transfer Pricing Coordination Group
CMCPC Compliance Management Centralized Processing Centre
CRA Canada Revenue Agency
CRD Capital Requirements Directive
CRS Common Reporting Standard
CTS Common Transmission System
DTCA Dutch Tax and Customs Administration
8 – ABBREVIATIONS AND ACRONYMS
COUNTRY-BY-COUNTRY REPORTING - HANDBOOK ON EFFECTIVE TAX RISK ASSESSMENT © OECD 2017
EITI Extractive Industries Transparency Initiative
ETR Effective Tax Rate
EU European Union
FATCA IGA Foreign Account Tax Compliance Act Inter Governmental Agreement
GDP Gross Domestic Product
INTRAC Income Tax Transaction Analysis Centre
IP Intellectual Property
IRAS Integrated Risk Assessment System
ISO International Organisation for Standardisation
ITD Income Tax Department
MNE Multinational Enterprise
NACE Statistical Classification of Economic Activities in the European Community
NAICS North American Industry Classification System
NMS Non-filers Monitoring System
OECD Organisation for Economic Co-operation and Development
PAN Permanent Account Number
R&D Research & Development
SII Servicio de Impuestos Internos
TDS/TCS Tax Deduction/Collection at Source
XML Extensible Markup Language

CHAPTER 1- INTRODUCTION AND BACKGROUND – 9
COUNTRY-BY-COUNTRY REPORTING - HANDBOOK ON EFFECTIVE TAX RISK ASSESSMENT © OECD 2017
Chapter 1
Introduction and Background
1. Action 13 is one of four minimum standards within the Base Erosion and Profit Shifting (BEPS) Action Plan. It requires the ultimate parent entities of large MNE groups to file a Country-by-Country Report (CbC Report) with the tax authority in their residence jurisdiction, containing information (CbCR information) relating to the global allocation of the group's income and taxes, together with indicators of the location of economic activity within the group. This tax authority shares the CbC Report with tax authorities in other jurisdictions where the MNE group has activities, subject to conditions including that CbCR information may only be used for the purposes of high level transfer pricing risk assessment, assessing other BEPS-related risks and, where appropriate, for statistical and economic analysis and that the jurisdiction has in force with the other jurisdiction both an international agreement that permits automatic exchange of information and a competent authority agreement for the exchange of CbC Reports. The timeline for the filing and exchange of CbC Reports is shown below, as it would apply to an MNE group that prepares its consolidated financial statements on a calendar year basis.
2. Country-by-Country Reporting (CbC Reporting) entails a significant investment on the part of MNE groups, to extract key information from their financial, regulatory or management accounts on a globally consistent basis, which has never been required previously. This means that tax authorities in all jurisdictions that are members of the OECD Inclusive Framework on BEPS and which satisfy the requirements for obtaining and using CbC Reports should in the future have access to valuable information on the regional and global activities of MNE groups with operations in their jurisdiction, which
31/12/2017
Deadline for filing 2016 CbC Report(12m after end of
fiscal year) 30/6/2018
Deadline for exchanging
2016 CbC Report (18 months after end of
fiscal year –first year only)
1/1/2016
Start of first fiscal year for CbC
Reporting (assuming fiscal year = calendar
year)
2016 2017 2018 2019
31/12//2016
End of first fiscal year for CbC
Reporting
31/12/2018
Deadline for filing 2017 CbC Report
6m 3m
31/3/2019
Deadline for exchanging
2017 CbC Report (15m after end of
fiscal year –subsequent years)

10 – CHAPTER 1 - INTRODUCTION AND BACKGROUND
COUNTRY-BY-COUNTRY REPORTING - HANDBOOK ON EFFECTIVE TAX RISK ASSESSMENT © OECD 2017
was not available before. This will allow tax officials, including those in developing and emerging jurisdictions, to better understand how local entities fit within the activities of large and complex MNE groups, and to conduct more effective risk assessments in order to identify taxpayers and arrangements that may pose a higher tax risk. Where these taxpayers and arrangements are identified, a tax authority's resources may be directed towards conducting further review or more extensive compliance interventions (possibly including, but not limited to, tax audits). Equally important, CbC Reports should also be used to identify taxpayers which pose a lower tax risk, requiring fewer or more targeted interventions, and correspondingly fewer resources.
3. Estimates of the scale of BEPS and the impact on jurisdictions differ, as shown in the table below. The OECD/G20 BEPS Action 11 Report Measuring and Monitoring BEPS (the Action 11 Report, OECD, 2015) in 2015 estimated that BEPS activity resulted in a loss of between 4% and 10% of global corporate income tax revenue.
Fiscal estimate approach Scope Range USD (billions) Year (level)
OECD aggregate tax rate differential Global 100-240 (4-10% of CIT) 2014
Other Estimates
IMF CIT efficiency 2014 Global 5% of CIT
UNCTAD offshore investment matrix 2015 Global 200 (8% of CIT)* 2012
IMF CIT efficiency 2014 Developing countries 13% of CIT
UNCTAD offshore investment matrix 2015 Developing countries 66-120 (7.5-14% of CIT)* 2012
* Only includes investment-related BEPS: not trade mispricing.
4. The Action 11 Report (OECD, 2015) also described six key indicators of BEPS activity at a macro level, which were updated for the first report of the OECD Inclusive Framework on BEPS (the IF Report), released in July 2017:
Indicator 1: Concentration of foreign direct investment relative to GDP
Indicator 2: High profit rates of low-taxed affiliates of top global MNEs
Indicator 3: High profit rates of MNE affiliates in lower-tax locations
Indicator 4: Effective tax rates of large MNE affiliates relative to non-MNE entities with similar characteristics
Indicator 5: Concentration of royalty receipts relative to R&D spending
Indicator 6: Interest expense to income ratios of MNE affiliates in countries with above average statutory tax rates
5. A number of these indicators use similar information to that contained in CbC Reports, either alone or in combination with other data, and so can also be incorporated into a risk assessment framework to identify possible indicators of BEPS in particular MNE groups. For example, indicator 2 suggests that, where BEPS is present, it may be expected that the profit rate (e.g. profit before tax/total assets or profit before tax/total employees) will be higher in jurisdictions where an MNE group has a lower effective tax

CHAPTER 1- INTRODUCTION AND BACKGROUND – 11
COUNTRY-BY-COUNTRY REPORTING - HANDBOOK ON EFFECTIVE TAX RISK ASSESSMENT © OECD 2017
rate compared with jurisdictions where the MNE group has a higher effective tax rate. Support for this at a macro level can be seen in the table below, which was calculated using data from 250 of the largest global MNE groups. However, CbC Reports also allow tax authorities to identify particular MNE groups which have these characteristics, which may be flagged for further review.
6. CbCR information is a powerful tool in the hands of a tax administration and provides a key opportunity for tax authorities to take a global perspective of MNE groups in their jurisdiction. CbC Reports have been designed with tax administrations in mind, as part of a three-tiered approach to transfer pricing documentation alongside a master file containing standardised information relevant for all members of an MNE group and a local file referring specifically to material transactions of members of a group in a particular jurisdiction. It is important that tax authorities use this information actively for high level risk assessment and as the basis for making enquiries in the course of a tax audit. CbC Reports do not by themselves provide evidence that an MNE group is engaged in BEPS but, read alongside the master file, local file and other information available to tax authorities, and interpreted in light of a tax authority's knowledge and experience of an MNE group's activities and attitude to tax risk, they can reveal important indicators of where tax risk may exist.
7. Each tax authority must determine how to make the best use of CbC Reports in conducting tax risk assessments, taking into account its existing risk assessment framework, its resources and its priorities. This includes a determination of the appropriate action to be taken following the completion of a risk assessment, and the level or nature of potential tax risk needed to trigger a tax audit or other compliance activity. This Country-by-Country Reporting: Handbook on Effective Tax Risk Assessment (OECD, 2017) has been prepared by the OECD Forum on Tax Administration, under the sponsorship of Canada, to provide tax authorities with guidance on ways to incorporate information obtained under CbC Reporting into their tax risk assessment processes, the types of tax risk indicators that may be identified using CbC Reports, and the challenges that may arise in the process. It contains the following elements.
Effe
ctive
tax r
ate d
iffer
entia
l
Profit rate differential
45% of total income
Lower ETR / higher profits
Higher ETR / lower profits
12% of total income
Higher ETR / higher profits
26% of total income
17% of total income
Lower ETR / lower profits
Negative 0 Positive
Nega
tive
0
Po
sitive

12 – CHAPTER 1 - INTRODUCTION AND BACKGROUND
COUNTRY-BY-COUNTRY REPORTING - HANDBOOK ON EFFECTIVE TAX RISK ASSESSMENT © OECD 2017
• Chapter 1 contains a high level introduction to CbC Reporting, which is designed for use by a tax authority alongside other information, as well as its knowledge and experience of an MNE group and its attitude to tax risk, for the purposes of high level risk assessment.
• Chapter 2 considers the role of tax risk assessment in tax administration and the core characteristics of an effective risk assessment system, including examples of the approaches used in different countries.
• Chapter 3 includes a description of the information that will be contained in the CbC Report of an MNE group, the primary process for how these are filed by groups and exchanged by tax authorities, and the advantages that CbC Reports have over other sources of information available to tax authorities. This chapter also looks at other standards for disclosure of country-by-country information, which apply to specific sectors.
• Chapter 4 explores the ways in which CbCR information can be incorporated into a tax authority's tax risk assessment framework, with the decision as to how this will be done left to each jurisdiction. This begins with a description of how CbC Reports can be used where tax authorities apply different approaches to risk assessment (e.g. pre-filing vs post-filing, or taxpayer-based vs arrangement-based), before looking at how CbCR information can be used to detect potential tax risk (e.g. by comparing an MNE group's results in a particular tax jurisdiction with those of the group as a whole, with those of a "typical" MNE group in its sector, or with those in the same jurisdiction in earlier periods). This chapter concludes by describing some of the main specific potential tax risk indicators that may be identified using CbC Reports, recognising that these may also be explained by non-BEPS factors.
• Chapter 5 concerns the challenges that may be faced by a tax authority in using CbC Reports for tax risk assessment, which among other things concern the quantity of information that some tax authorities will need to deal with, the comparability of data provided by different MNE groups, and transitional issues following the introduction of CbC Reporting.
• Chapter 6 sets out some of the other data sources that tax authorities should consider alongside CbC Reports, including the master file and local file, other information held by the tax authority, information available from other government sources, publicly available information and commercial sources of data.
• Chapter 7 describes how the results of a tax risk assessment using CbC Reports should be used. CbCR information is a powerful tool for high level risk assessment, but it can never by itself represent conclusive proof that transfer prices are incorrect or that an MNE group is engaged in BEPS. Where a risk assessment using CbC Reports identifies potential tax risks, this should trigger further reviews or requests for additional information and, if necessary, compliance action including possibly a tax audit.
• Annexes to the handbook include the model template for a CbC Report, a summary of the tax risk indicators described in Chapter 4, and an example illustrating how the CbC Report of a fictional MNE group may be used for high level tax risk assessment.

CHAPTER 1- INTRODUCTION AND BACKGROUND – 13
COUNTRY-BY-COUNTRY REPORTING - HANDBOOK ON EFFECTIVE TAX RISK ASSESSMENT © OECD 2017
8. Tax authorities are encouraged to provide training on the effective use of CbCR information to all staff involved in conducting tax risk assessments for entities in large MNE groups, as well as competent authorities that will be involved in the exchange of CbC Reports, and will be supported in providing this by the OECD. Training should also be considered for tax compliance staff, including tax auditors, which may not be involved in conducting risk assessments but may come into contact with a CbC Report or may be approached by an entity to discuss information contained in its group's CbC Report. At all times, tax authorities should ensure the confidentiality and appropriate use of information contained in CbC Reports, in accordance with their commitments under the Action 13 minimum standard.
9. This handbook is part of a suite of guidance prepared by the OECD and available to jurisdictions to assist in the implementation and operation of CbC Reporting. Other publications include guidance on the interpretation of elements of the Action 13 minimum standard1, on the appropriate use of CbC Reports2, on use of the OECD CbC XML schema3 and on the effective implementation of CbC Reporting.4
10. This handbook will be revised and updated periodically to reflect changes in the tax risk landscape and the findings of countries as they gain experience in using CbC Reports. Future editions of the handbook may also consider sector-specific aspects of tax risk assessment (e.g. tax risk indicators that may be more relevant or less relevant to particular sectors, such as the banking and insurance sectors), which are not discussed further in this first edition.
1 OECD (2017a), Guidance on the Implementation of Country-by-Country Reporting. This guidance is updated from time to time and the latest version may be found at www.oecd.org/tax/beps/guidance-on-country-by-country-reporting-beps-action-13.htm 2 OECD (2017b), Country-by-Country Reporting: Guidance on the Appropriate Use of Information Contained in Country-by-Country Reports, www.oecd.org/tax/beps/beps-action-13-on-country-by-country-reporting-appropriate-use-of-information-in-CbC-reports.pdf 3 OECD (2017), Country-by-Country Reporting XML Schema: User Guide for Tax Administrations and Taxpayers. This may be found at: www.oecd.org/tax/country-by-country-reporting-xml-schema-user-guide-for-tax-administrations.htm. 4 OECD, Country-by-Country Reporting: Handbook on Effective Implementation (www.oecd.org/tax/beps/country-by-country-reporting-handbook-on-effective-implementation.pdf )

14 – CHAPTER 1 - INTRODUCTION AND BACKGROUND
COUNTRY-BY-COUNTRY REPORTING - HANDBOOK ON EFFECTIVE TAX RISK ASSESSMENT © OECD 2017
Bibliography
OECD (2017a), Guidance on the Implementation of Country-by-Country Reporting, www.oecd.org/ctp/exchange-of-tax-information/guidance-on-country-by-country-reporting-beps-action-13.htm.
OECD (2017b), Country-by-Country Reporting: Guidance on the Appropriate Use of Information contained in Country-by-Country Reports, www.oecd.org/tax/beps/beps-action-13-on-country-by-country-reporting-appropriate-use-of-information-in-CbC-reports.pdf
OECD (2017), Country-by-Country Reporting XML Schema: User Guide for Tax Administrations and Taxpayers, www.oecd.org/tax/country-by-country-reporting-xml-schema-user-guide-for-tax-administrations.htm.
OECD (2015), Measuring and Monitoring BEPS, Action 11 - 2015 Final Report, OECD Publishing, Paris, http://dx.doi.org/10.1787/9789264241343-en.
CHAPTER 2 - THE ROLE OF TAX RISK ASSESSMENT IN TAX ADMINISTRATION – 15
COUNTRY-BY-COUNTRY REPORTING - HANDBOOK ON EFFECTIVE TAX RISK ASSESSMENT © OECD 2017
Chapter 2
The Role of Tax Risk Assessment in Tax Administration
11. Tax risk assessment is a key element of modern tax administration. Risk assessment tools allow tax authorities to identify indicators that suggest particular taxpayers or arrangements may pose an increased risk to their jurisdiction, where further compliance activity may be required, or a reduced risk, which may mean less compliance activity, or more targeted compliance activity, is possible. This should facilitate improvements in the allocation of limited resources to the areas of greatest risk, while at the same time giving a tax authority an indication of where economic activity has been taxed correctly, reducing the burden on lower-risk taxpayers.
12. Although in general in advanced tax administrations there is a trend towards greater use of automated methods for tax risk assessment, most risk assessment systems still include a manual element and some are primarily or wholly manual. Tax authorities also vary in terms of whether tax risk assessment is conducted centrally by a specialist risk assessment team incorporating input from the compliance function, or locally by the compliance team (or tax inspector). Risk assessment tools may be used to identify higher risk taxpayers, which are then subject to greater review of all of their business or of a specific area of their business (e.g. international issues), or to identify higher risk arrangements which are then flagged for further review irrespective of whether the relevant taxpayer is seen to be higher risk as a whole.
13. In identifying higher risk taxpayers, some tax authorities use a points-based system, which ranks groups based on the number of risk indicators present (with some indicators or combinations of indicators being worth more points). Alternatively, other tax authorities use size or complexity as a key indicator of potential risk, and then use risk assessment tools to identify areas to focus on within these groups. In order to give taxpayers greater certainty, some tax authorities are conducting more of their risk assessment in "real time" (i.e. before a tax return is filed), while others continue to risk assess taxpayers and arrangements mainly or entirely post-filing. In all cases, tax risk assessment can be a dynamic process, which is flexible to the level of tax risk identified. Where it appears clear at an early stage that the level of potential tax risk posed by a taxpayer is low, a decision may be made at that time that no further assessment or compliance action is required. Where such a decision cannot be reached, further analysis and enquiries may be conducted in order to determine the most appropriate next steps.
14. While the frameworks used by tax authorities vary, for risk assessment to operate effectively certain core characteristics should be present.
• Tax risk assessment tools should operate objectively. Algorithms and other risk assessment tools may be designed to detect risk in certain sectors or to target specific arrangements, but they should identify potential tax risks based on an objective assessment of available intelligence.

16 – CHAPTER 2 - THE ROLE OF TAX RISK ASSESSMENT IN TAX ADMINISTRATION
COUNTRY-BY-COUNTRY REPORTING - HANDBOOK ON EFFECTIVE TAX RISK ASSESSMENT © OECD 2017
• Officials involved in risk assessment should be adequately trained and experienced in key areas. These may vary from jurisdiction to jurisdiction depending upon the system in place, but are likely to include specialists in tax law, transfer pricing, risk management, accounting, economics, statistics and information technology, as well as sector specialists with an understanding of particular business models or industries that will assist the interpretation of data with respect to certain groups. This does not mean that jurisdictions which lack these specialists cannot conduct risk assessments, but they should take steps to improve the knowledge and experience of their experts over time.
• Risk assessment tools should be used to select and to de-select taxpayers for further investigation, possibly including tax audit or other compliance activity. They should not be used as a substitute for such activity, for the purposes of making tax adjustments or for directly assessing taxes.
• Risk assessment processes should be dynamic and responsive to feedback from within the tax authority, to ensure continuous improvement. Methods used should be revised and updated to reduce the risk of flags being raised for taxpayers and arrangements which are not in fact high risk (otherwise known as false positives) or expanded to deal with emerging risks which have not previously been identified.
• A risk assessment strategy should combine different tools and take into account different elements of a group's risk profile, to minimise the risk that a higher risk taxpayer is able avoid detection by putting in place elements to disguise a particular risk flag. For example, a group may hire low-cost employees or consultants in a jurisdiction to avoid a high profit before tax / number of employees ratio, but this would not disguise the fact that the group may also have a high proportion of related party revenues, a low cost-base and a low effective tax rate in that jurisdiction. Risk assessment tools should also evolve over time to reduce opportunities for higher risk taxpayers to develop strategies to avoid detection.
• Governance processes should be in place to ensure adequate monitoring of the risk assessment function. This should ensure that risk assessments are subject to appropriate levels of review and sign-off, and are fully documented so that a complete audit trail is available in the event of future enquiries.
• Tax risk assessment processes should form part of a tax authority's overall risk management framework. Principles and guidelines5 for risk management and risk assessment have been established by the International Organisation for Standardisation (ISO), containing guidance on the design of a risk management framework, the monitoring and review of the framework and the continual improvement of the framework. Specific to risk assessment, sections are included on the identification, analysis and evaluation of risk. A tax authority should consider the extent to which its existing or proposed risk management and tax risk assessment processes are aligned with this voluntary standard, and any improvements which may be made based on the ISO's recommendations.
Current developments in tax risk assessment processes
15. Many jurisdictions are in the process of implementing changes to their tax risk assessment processes. Some of these changes are directly connected to the introduction of
5 ISO 31000:2009 – Risk Management; www.iso.org/standard/43170.html

CHAPTER 2 - THE ROLE OF TAX RISK ASSESSMENT IN TAX ADMINISTRATION – 17
COUNTRY-BY-COUNTRY REPORTING - HANDBOOK ON EFFECTIVE TAX RISK ASSESSMENT © OECD 2017
CbC Reporting, to incorporate CbC Reports information into the tax risk assessment of large MNE groups while ensuring that the confidentiality and appropriate use of CbCR information is protected. Other changes concern improvements to the tax risk assessment of groups unrelated to CbC Reporting. A number of tax authorities have provided outlines of current developments in tax risk assessment in their jurisdiction, which are set out below. The OECD is also developing a Transfer Pricing Risk Assessment Toolkit, for release in 2018, to assist jurisdictions, in particular developing countries, in the design and implementation of tools for the assessment of transfer pricing risks posed by MNE groups.
Australia
The Australian Taxation Office (ATO) has a centralised risk management function that uses a variety of manual and automated risk detection techniques that focus on public and multinational businesses with cross-border intra-group dealings and structures. Intelligence on the manifestations of base erosion and profit shifting risk within this population is gathered through the ATO's extensive data modelling and analytics programs, and via the observations and contributions of specialists and other stakeholders.
The ATO uses a risk clusters management approach to address profit shifting risk among public and multinational businesses. Under this approach, risks that exhibit common factors, characteristics or behaviours within a population are treated and managed in a consistent manner. Each risk cluster has a strategy that outlines how we detect, deter and prevent these risks in the system, including strategic litigation, law reform, external and internal communication and capability building strategies.
With the implementation of CbC Reporting, the ATO will incorporate new datasets from the master file, local file, CbC Reports and exchanges of information with other jurisdictions. The ATO's approach to risk detection is an iterative one, and these new sources will support the refinement of existing strategies, risk detection techniques and in the development of new risk algorithms, risk clusters and risk typologies.
Risk typologies are used to represent transactions or arrangements that have been identified or observed in successful audit cases where the risk has been proven to exist and to erode the tax base. Typologies are developed to assist auditors in identifying comparable arrangements in other cases.
The ATO has over 100 international risk typologies and is reviewing these to see how many can be applied to CbCR information.

18 – CHAPTER 2 - THE ROLE OF TAX RISK ASSESSMENT IN TAX ADMINISTRATION
COUNTRY-BY-COUNTRY REPORTING - HANDBOOK ON EFFECTIVE TAX RISK ASSESSMENT © OECD 2017
Brazil
In general, the annual Brazilian tax risk assessment process occurs in three stages:
Stage I – definition of priority actions, taxes and special operations. Final product: Regional Risk Assessment Strategic Plan
Stage II – definition and consolidation of risk assessment criteria; data crossing. Final product: preliminary list of selected taxpayers
Stage III – individual analysis of taxpayers; confirmation (or not) of the risk indicators and further data crossing. Final product: final list of selected taxpayers and the relevant risk assessment reports
A decentralised approach
Brazil adopts a decentralised approach to tax risk assessment, which is currently undertaken on a regional basis (Brazilian tax administration’s structure comprises 10 unities, so called “tax regions”, composed by one or more States).
Automated tools
In general, automated tax risk assessment tools are used. However, the individual analysis in Stage III also includes some manual risk assessment processes alongside the relevant automated systems.
Classification of taxpayers
The Brazilian tax risk assessment approach identifies tax risk indicators across three categories of taxpayer: large taxpayers; medium-size taxpayers; and other taxpayers.
Use of CbC Reports
It is expected that CbC Reports will be used as an additional tool for crossing data, in particular during the individual analysis stage (Stage III).

CHAPTER 2 - THE ROLE OF TAX RISK ASSESSMENT IN TAX ADMINISTRATION – 19
COUNTRY-BY-COUNTRY REPORTING - HANDBOOK ON EFFECTIVE TAX RISK ASSESSMENT © OECD 2017
Canada
The Canada Revenue Agency (CRA) uses an integrated team approach to tax large business compliance referred to as the Approach to Large Business Compliance (ALBC). The ALBC takes into account the taxpayer's and tax intermediary's compliance risks and promotes responsible corporate tax management behaviour.
The CRA has implemented the Integrated Risk Assessment System (IRAS) which allows the Agency to consider risks in the large business population both at the economic entity level and at the legal entity level. This system links information from CRA databases and various forms and returns. It then applies risk algorithms to the data to risk score and rank the entire large business population.
IRAS uses approximately 200 algorithms in total for large business – domestic, international and abusive tax avoidance. It risk scores and ranks groups by each of these three program areas and as well as on an overall basis. These results are displayed in a user-friendly taxpayer viewer for further analysis.
The highest risk legal entities identified by IRAS can be selected and transferred to the CRA’s audit case system, Integras. Those taxpayers considered to be high to medium risk by IRAS (Tier I risk assessment), are then further analysed by Integrated Large Business Audit Teams using local knowledge to determine an overall risk profile of each particular taxpayer (Tier II risk assessment). The risk profile will determine the audit approach taken for a particular taxpayer. Those considered to be high risk at this stage will be included in the national workplan and subject to a full compliance audit.
Once the Tier II risk assessment process is complete, high to medium risk cases are assigned to Integrated Large Business Audit Teams comprising domestic, international and abusive tax avoidance auditors who conduct a Tier III risk assessment and validation at the early stage of the audit. This involves contacting the taxpayer, obtaining electronic records, conducting audit planning, and reviewing various sources of taxpayer information. The Tier III stage provides an opportunity to validate the risk indicators and/or audit issues identified in the Tier I and II risk assessment stages. The Tier III risk assessment and validation process is mandatory in determining whether to proceed with a full compliance audit, limited scope audit, or to close the case.
Business intelligence gathered at the Tier II and Tier III stages, and during the audit, will be used to improve the Agency’s large business risk assessment processes and systems as part of the feedback loop. In addition, the CRA will incorporate other sources of data including the Country-by-Country Reports into its risk algorithms and systems.
The risk profile will determine the audit approach taken for a particular taxpayer. Those considered to be high risk will be subject to a full compliance audit. Taxpayers in the medium risk category may be subject to a full compliance or limited scope audit, and taxpayers who are considered low risk may be subject to a compliance assurance review to further validate the taxpayer’s low risk ranking. The approach allows the CRA to focus its audit resources on the highest-risk cases of non-compliance within the large business population, and reduce the compliance burden for businesses that are considered low risk.

20 – CHAPTER 2 - THE ROLE OF TAX RISK ASSESSMENT IN TAX ADMINISTRATION
COUNTRY-BY-COUNTRY REPORTING - HANDBOOK ON EFFECTIVE TAX RISK ASSESSMENT © OECD 2017
Chile
In 2014, the Servicio de Impuestos Internos (SII) amended its compliance control model to one based on risk assessment, which emphasises that the selection of cases for review must be done taking into account a taxpayer's particular characteristics and associated risk.
This new model is centred on the concept of tax risk as a multi-factor phenomenon, where a taxpayer's conduct is influenced by its industry, business and activities, as well as economic, sociological and psychological factors. This promotes an improved knowledge of taxpayers and their environment, with the objective of designing and implementing processes and procedures that aim to address the causes of non-compliance. This model also distinguishes between the general tax risk (or global risk) posed by a particular taxpayer, and the specific risk posed by particular transactions.
Global tax risk Chile's current model defines four dimensions of a taxpayer's tax obligations:
• An obligation to register.
• An obligation to report information.
• An obligation to file taxes.
• An obligation to pay taxes.
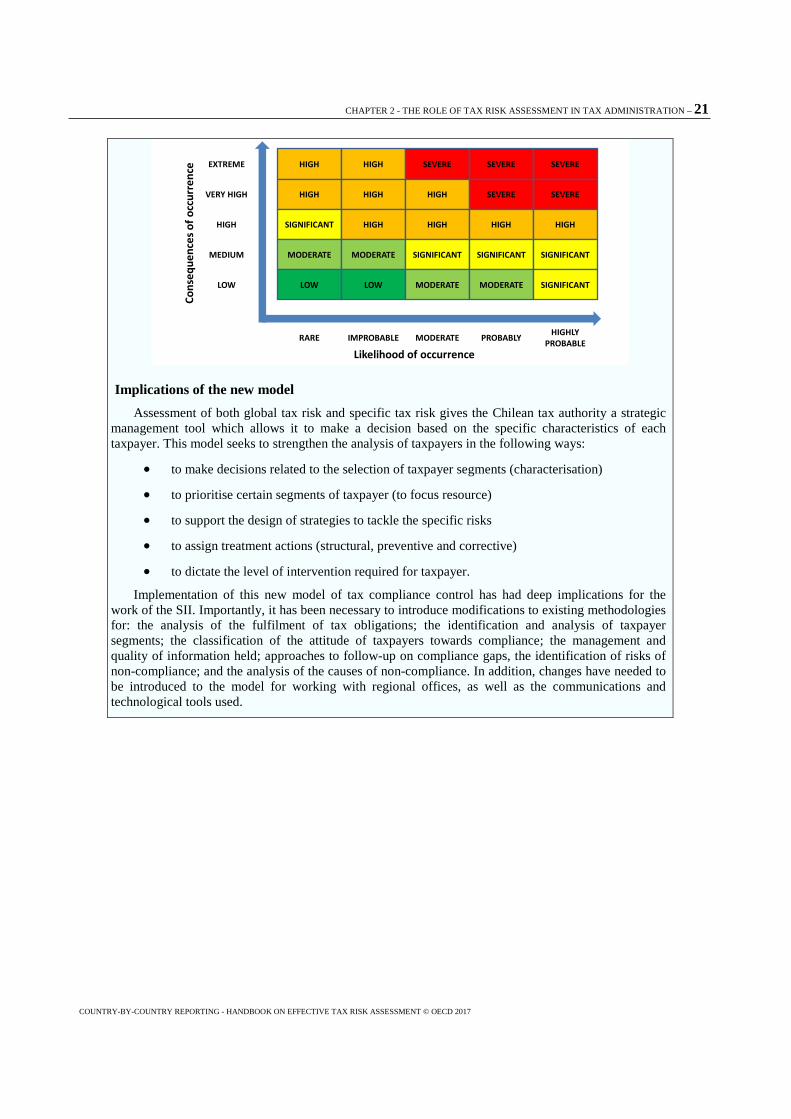
Tax compliance management requires the comprehensive measurement of the attitude of a taxpayer towards the fulfilment of each category of tax obligation. In combination, and taken together with other information, this allows the evaluation of more than 170 attributes. The tax authority then groups taxpayers into four categories depending upon the likelihood of non-compliance and the consequences of non-compliance (shown below) that require different treatment strategies, prioritising the allocation of resources.
Specific tax risk Specific tax risk, or transactional tax risk, is related to non-compliance with a particular regulation.
As with global tax risk, the assessment of this risk is based on a combination of the probability of non-compliance occurring and the consequence of this non-compliance when it does occur. Specific tax risks are categorised into five levels: low, moderate, significant, high and severe.
KEY TAXPAYERS
MEDIUM RISK TAXPAYERS
HIGH RISK TAXPAYERS
LOW RISK TAXPAYERS
Likelihood of occurrence
Cons
eque
nces
of o
ccur
renc
e
CHAPTER 2 - THE ROLE OF TAX RISK ASSESSMENT IN TAX ADMINISTRATION – 21
COUNTRY-BY-COUNTRY REPORTING - HANDBOOK ON EFFECTIVE TAX RISK ASSESSMENT © OECD 2017
Implications of the new model Assessment of both global tax risk and specific tax risk gives the Chilean tax authority a strategic
management tool which allows it to make a decision based on the specific characteristics of each taxpayer. This model seeks to strengthen the analysis of taxpayers in the following ways:
• to make decisions related to the selection of taxpayer segments (characterisation)
• to prioritise certain segments of taxpayer (to focus resource)
• to support the design of strategies to tackle the specific risks
• to assign treatment actions (structural, preventive and corrective)
• to dictate the level of intervention required for taxpayer.
Implementation of this new model of tax compliance control has had deep implications for the work of the SII. Importantly, it has been necessary to introduce modifications to existing methodologies for: the analysis of the fulfilment of tax obligations; the identification and analysis of taxpayer segments; the classification of the attitude of taxpayers towards compliance; the management and quality of information held; approaches to follow-up on compliance gaps, the identification of risks of non-compliance; and the analysis of the causes of non-compliance. In addition, changes have needed to be introduced to the model for working with regional offices, as well as the communications and technological tools used.
Likelihood of occurrence
Cons
eque
nces
of o
ccur
renc
e HIGH HIGH SEVERE SEVERE SEVERE
HIGH HIGH HIGH SEVERE SEVERE
SIGNIFICANT HIGH HIGH HIGH HIGH
MODERATE MODERATE SIGNIFICANT SIGNIFICANT SIGNIFICANT
LOW LOW MODERATE MODERATE SIGNIFICANT
RARE IMPROBABLE MODERATE PROBABLY HIGHLY PROBABLE
EXTREME
VERY HIGH
HIGH
MEDIUM
LOW

22 – CHAPTER 2 - THE ROLE OF TAX RISK ASSESSMENT IN TAX ADMINISTRATION
COUNTRY-BY-COUNTRY REPORTING - HANDBOOK ON EFFECTIVE TAX RISK ASSESSMENT © OECD 2017
India
In the last decade, India’s Income Tax Department (ITD) embarked on an ambitious computerisation plan which developed voluminous databases relating to Permanent Account Number (PAN), IT return, IT form, Tax Deduction/Collection at Source (TDS/TCS) statements, Annual Information Return (AIR), Centralised Information Branch (CIB) etc. ITD has been leveraging data analytics and risk assessment for promoting voluntary compliance and deterring tax evasion. Some key initiatives/projects are as under:
i. Computer Assisted Scrutiny Selection (CASS): The Department has been implementing a centralized, rule-based mechanism for selecting cases for scrutiny (audit). The suggestions received from field formations and the outcome in cases selected in prior years are reviewed by a cross functional committee (including representatives from assessment, investigation, intelligence, international taxation, transfer pricing, risk assessment, systems) to refine the scenarios and parameters. New scenarios are also introduced on the basis of analysis of information sources and environmental scanning.
ii. (NMS): The Non-filers Monitoring System (NMS) has been implemented since 2013 to prioritize action on non-filers with potential tax liabilities. Data analysis is carried out to identify potential non-filers about whom specific information is available in the TDS/TCS, AIR and CIB database. The cases are classified with P1, P2, P3, P4 and P5 priority ratings (P1 being the highest priority) for graded monitoring.
iii. Project Insight: The scope of Project Insight was conceptualized to enable ITD in meeting the three goals namely (i) to promote voluntary compliance and deter noncompliance; (ii) to impart confidence that all eligible persons pay appropriate tax; and (iii) to promote fair and judicious tax administration. Under this project an integrated data warehousing and business intelligence platform is being rolled out in a phased manner from May 2017.
The Project envisages operationalization of Income Tax Transaction Analysis Centre (INTRAC) for data integration, data processing, data quality monitoring, data warehousing, master data management, data analytics, web/text mining, alert generation, compliance management, enterprise reporting and research support. The new technical infrastructure will also be leveraged for implementation of requirements under the Foreign Account Tax Compliance Act Inter Governmental Agreement (FATCA IGA) and Common Reporting Standard (CRS)/Automatic Exchange of Information (AEOI). The platform is also being configured for a wide range of thematic risk assessments relating to transfer pricing, international taxation, operational risk etc.
A new Compliance Management Centralized Processing Centre (CMCPC) is also being set up under this project to use campaign management approach (consisting of emails, SMS, reminders, outbound calls, letters) to support voluntary compliance and resolution of compliance issues. A dedicated compliance portal would be used to capture response on compliance issues in a structured manner for effective compliance monitoring and evaluation.

CHAPTER 2 - THE ROLE OF TAX RISK ASSESSMENT IN TAX ADMINISTRATION – 23
COUNTRY-BY-COUNTRY REPORTING - HANDBOOK ON EFFECTIVE TAX RISK ASSESSMENT © OECD 2017
The Netherlands
Transfer pricing risk assessment Bottom up approach - For large businesses the local tax inspector performs a general assessment of
the transfer pricing risk of that business. Taxpayers can also proactively address transfer pricing issues with the local tax inspector. In both situations tax inspectors must involve a member of the specialist transfer pricing coordination group (CGTP) which is part of the Dutch Tax and Customs Administration (DTCA).
Top down approach - The CGTP operates on a national level, to ensure consistency and quality and to pro-actively define transfer pricing topics requiring extra action by tax inspectors when conducting their transfer pricing risk assessment (actions include desk audits, field audits, preliminary consultations). Taxpayers must provide information on business restructurings and intangibles in their tax return.
Part of the CGTP is the new CbC-reporting team. The CbC-reporting team is dedicated to CbCR Tax Risk Assessment and data analytics are an essential part of this risk assessment process. The process described below provides opportunities for a better selection of transfer pricing cases. The CbCR Tax Risk Assessment process also provides opportunities to include data from other (public or internal) data sources.
CbCR Tax Risk Assessment process 1. Automated selection of reports using data analytics to assess transfer pricing and other BEPS risks of
erosion of the Dutch corporate income tax base. Table 1, Table 2 and Table 3 are all in scope. Relevant factors for selecting CbC-reports are:
a) Footprint of the MNE in the Netherlands. b) Amount of corporate income tax at risk. c) Chances of success.
2. Capacity (FTE and availability, access, quality, complexity and volume of required additional data). Review of selected reports by CbCR-team. Four focus points:
a) Income (compare key figures and ratios). b) Expenses (compare key figures and ratios). c) Other BEPS risks (e.g., data inconsistency, hybrid PE’s, etc., combine data with other
information available). d) Information already available of the tax payer including the participation in the
cooperative compliance program
3. Discuss findings in CbCR-team, with other transfer pricing experts of the CGTP and the local tax inspector and decide on next steps.
4. The local tax inspector and transfer pricing experts (which can be the CbCR-experts) of the CGTP discuss findings with the taxpayer. During these discussions, the tax inspector can ask for the master file and local file and/or other relevant (transfer pricing) documentation.
From 2019, the DTCA will extend the data analysis on the CbC-reports to longitudinal data analysis (e.g., continuously loss-making Dutch constituent entities and regression analysis (trends at CbC report level, industry level, etc.).
24 – CHAPTER 2 - THE ROLE OF TAX RISK ASSESSMENT IN TAX ADMINISTRATION
COUNTRY-BY-COUNTRY REPORTING - HANDBOOK ON EFFECTIVE TAX RISK ASSESSMENT © OECD 2017
Spain
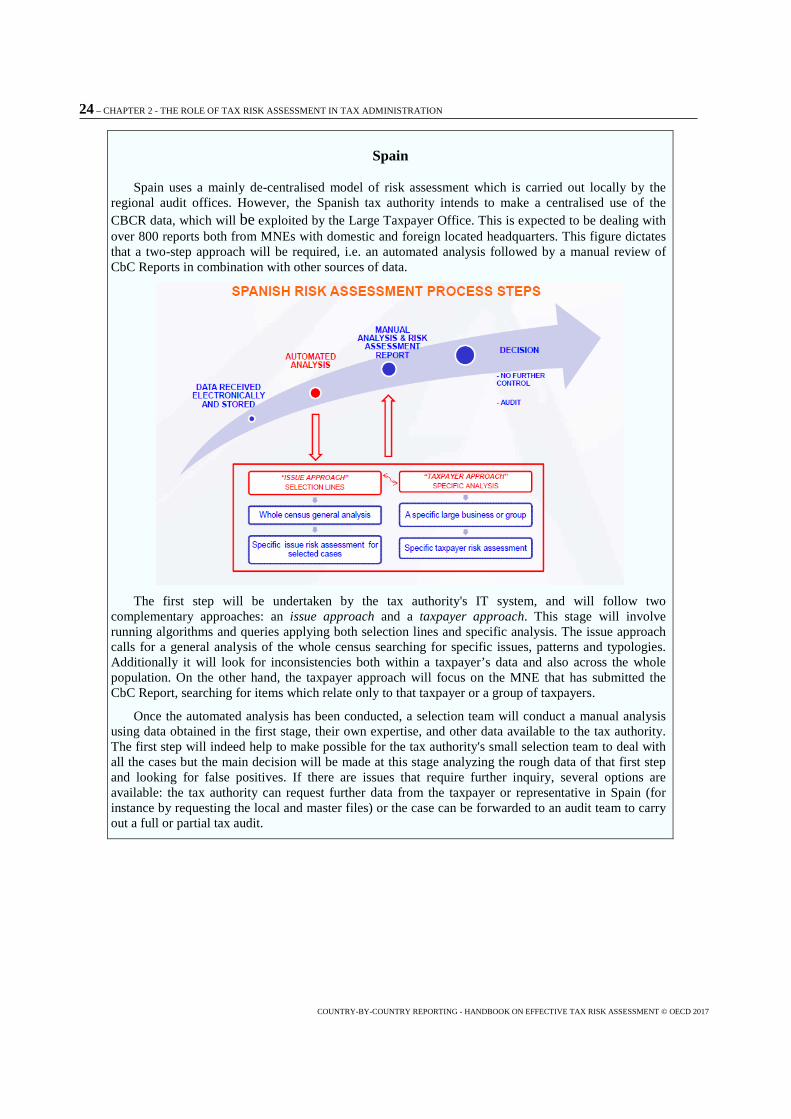
Spain uses a mainly de-centralised model of risk assessment which is carried out locally by the regional audit offices. However, the Spanish tax authority intends to make a centralised use of the CBCR data, which will be exploited by the Large Taxpayer Office. This is expected to be dealing with over 800 reports both from MNEs with domestic and foreign located headquarters. This figure dictates that a two-step approach will be required, i.e. an automated analysis followed by a manual review of CbC Reports in combination with other sources of data.
The first step will be undertaken by the tax authority's IT system, and will follow two
complementary approaches: an issue approach and a taxpayer approach. This stage will involve running algorithms and queries applying both selection lines and specific analysis. The issue approach calls for a general analysis of the whole census searching for specific issues, patterns and typologies. Additionally it will look for inconsistencies both within a taxpayer’s data and also across the whole population. On the other hand, the taxpayer approach will focus on the MNE that has submitted the CbC Report, searching for items which relate only to that taxpayer or a group of taxpayers.
Once the automated analysis has been conducted, a selection team will conduct a manual analysis using data obtained in the first stage, their own expertise, and other data available to the tax authority. The first step will indeed help to make possible for the tax authority's small selection team to deal with all the cases but the main decision will be made at this stage analyzing the rough data of that first step and looking for false positives. If there are issues that require further inquiry, several options are available: the tax authority can request further data from the taxpayer or representative in Spain (for instance by requesting the local and master files) or the case can be forwarded to an audit team to carry out a full or partial tax audit.

CHAPTER 3 – OVERVIEW OF CBC REPORTING – 25
COUNTRY-BY-COUNTRY REPORTING - HANDBOOK ON EFFECTIVE TAX RISK ASSESSMENT © OECD 2017
Chapter 3
Overview of CbC Reporting
The information contained in an MNE group's CbC Report
16. CbC Reports contain information on the location of revenue, profits, taxes and economic activity within large MNE groups, based on a standard template comprising three tables. A copy of this template is included in Annex 1. To assist MNE groups in preparing CbC Reports, the Transfer Pricing Documentation and Country-by Country Reporting, Action 13 – 2015 Final Report (Action 13 Report, OECD 2015) includes a number of definitions and instructions on how the template should be completed and the data that should be included. In order to improve consistency, subsequent to the release of the Action 13 Report (OECD, 2015), further guidance6 has been prepared by the OECD on elements of the template and how these definitions and instructions should be interpreted. In conducting a tax risk assessment, a tax authority should read the contents of an MNE group's CbC Report in light of the contents of the Action 13 Report (OECD, 2015) and interpretive guidance. To the extent possible, this should take into account how the Action 13 Report (OECD, 2015) and interpretative guidance has been interpreted and implemented in the jurisdiction where the CbC Report was submitted.
17. Table 1 contains ten fields of numeric information on an MNE group's economic activity, aggregated by jurisdiction. This data may be based on an MNE group's consolidated financial statements, entity statutory financial statements, regulatory financial statements, or internal management accounts. The fields included in Table 1 are:
• unrelated party revenues
• related party revenues
• total revenues
• profit/(loss) before income tax
• income tax paid (on cash basis)
• income tax accrued – current year
• stated capital
• accumulated earnings
• number of employees.
6 Guidance on the Implementation of Country-by-Country Reporting (OECD, 2017). This guidance is updated from time to time and the latest version may be found at www.oecd.org/tax/beps/guidance-on-country-by-country-reporting-beps-action-13.htm

26 – CHAPTER 3 – OVERVIEW OF CBC REPORTING
COUNTRY-BY-COUNTRY REPORTING - HANDBOOK ON EFFECTIVE TAX RISK ASSESSMENT © OECD 2017
• tangible assets other than cash and cash equivalents.
18. Table 2 contains further information on each constituent entity in the MNE group. This includes the jurisdiction where the entity is tax resident (or, in the case of a permanent establishment, where it is situated), as well as the jurisdiction in which it is organised or incorporated (if different). Table 2 also contains a description of each entity's main business activities. For convenience and consistency, the table contains a list of 12 common activities, including "dormant", as well as "other". A group may complete the table by placing a tick against the relevant activity or activities for each constituent entity or, if a particular activity is not included on the list, may place a tick against "other" and provide a description of the entity's activities.
19. Table 3 allows MNE groups to provide additional information to clarify the content of the CbC Report. In order to ensure that its CbC Report can be interpreted as accurately as possible, a group should provide a brief description of the sources of data used in completing Table 1 as well as anything else that it thinks will be useful to assist a tax authority in correctly interpreting the first two tables. The content of Table 3, and the potential benefits that may be achieved from standardised disclosures by groups, are considered in Chapter 4.
20. An MNE group's ultimate parent entity is typically required to file a CbC Report on behalf of its group with the tax authority in the jurisdiction where it is resident within 12 months of the end of the group's reporting fiscal year (i.e. the annual accounting period with respect to which the group prepares its consolidated financial statements), although some jurisdictions may require earlier filing (e.g. together with the ultimate parent entity's tax return). The tax authority receiving the CbC Report from the MNE group will exchange it with tax authorities in other jurisdictions where the group has activities (subject to conditions) within 18 months of the end of the fiscal year for the first year of exchanges, and within 15 months of the end of the fiscal year in subsequent years. This is illustrated in the diagram below. Action 13 provides for other forms of filing in limited circumstances (e.g. if the jurisdiction where the ultimate parent entity is resident has not implemented rules for CbC Reporting), but these are beyond the scope of this handbook.

CHAPTER 3 – OVERVIEW OF CBC REPORTING – 27
COUNTRY-BY-COUNTRY REPORTING - HANDBOOK ON EFFECTIVE TAX RISK ASSESSMENT © OECD 2017
21. An electronic template using extensible mark-up language (an XML schema) has been developed to facilitate the electronic preparation, filing and exchange of CbC Reports. This should further ensure that CbC Reports are prepared consistently and support the automated analysis of CbCR information, for example by requiring that jurisdictions be identified using standard two-digit ISO country codes which will avoid challenges that could arise if groups included the names of jurisdictions in different languages or using different spellings.
The advantages CbC Reports offer over other data sources
22. This guidance has been prepared in advance of the first filing and exchange of CbC Reports. It will be expanded and revised as jurisdictions grow in their experience of using CbCR information and have a better understanding of the benefits it brings. However, it is already clear that there are a number of ways in which the information in CbC Reports could improve the effectiveness of risk assessment processes, as well as challenges to the use of CbC Reports in risk assessment which are considered later in this handbook. In general, these benefits may be further enhanced where a CbC Report is used alongside other information on an MNE group's structure and activities, such as the master file and local file.
23. Firstly, and perhaps most simply, CbC Reports are typically prepared and filed by the ultimate parent entity in an MNE group. This means that CbCR information has been compiled by the entity which is usually in the best position to understand the global structure, activities and footprint of that group.
24. CbC Reports provide an overview of what is happening throughout the whole of an MNE group that may not be available, or not easily available, from existing data sources, including tax information. This will be valuable to all tax authorities, as it is highly unlikely

28 – CHAPTER 3 – OVERVIEW OF CBC REPORTING
COUNTRY-BY-COUNTRY REPORTING - HANDBOOK ON EFFECTIVE TAX RISK ASSESSMENT © OECD 2017
that any tax authority will currently receive the level of analysis by jurisdiction and entity that is provided in a group's CbC Report. In some cases, the tax authority in the residence jurisdiction of an MNE group's ultimate parent entity, or of its key operating subsidiaries, may already have access to some information on the group as a whole, if they have a good direct or indirect relationship with the group's head office functions (e.g. finance, financial reporting and tax). In contrast, it may be more difficult for tax authorities in other jurisdictions to obtain robust information on the activities and financial position of entities in other parts of a worldwide group (e.g. if a resident subsidiary is unable to obtain this information internally). Other sources of information on an MNE group's activities, such as the consolidated financial statements, may contain some analysis of the financial data for different parts of a group, but this often focuses on the group's key markets or on broad geographical regions. Where the activities in a particular jurisdiction are not significant in proportion to the rest of the MNE group, it may be difficult to use this region-level data for jurisdiction-level risk assessment. CbC Reports address this issue for the categories of information they cover, by analysing data at the level of each jurisdiction. As CbC Reports are received on an annual basis, this will also allow tax authorities to improve their understanding of the MNE group's overall structure and activities and how this changes over time.
25. This information should help tax authorities in identifying those MNE groups whose structure and activities give them greater opportunities to engage in BEPS, as well as those who may have fewer BEPS opportunities. It should also help to improve the quality of conversations between tax authorities and MNE groups, as tax officials will be in a better position to understand how activities in their jurisdiction fit into the overall group. They will therefore be able to ask better questions, informed by changes occurring throughout the global group, to understand how these might impact domestic entities. This may be particularly important where historically an MNE group has not been willing to engage collaboratively with the tax authority, and has not voluntarily provided information on a group's worldwide activities.
26. The fact that CbC Reports contain substantially consistent information on different MNE groups over time, broken down by tax jurisdiction, means they may be used in a variety of ways to detect potential tax risks (e.g. to compare an MNE group's profile in one jurisdiction with that in another jurisdiction or with the group as a whole, to benchmark MNE groups against their sector, and to identify changes within a group over time). These approaches to using CbC Reports are considered in more detail in the next chapter. Differences between the structure, accounting policies and business models of MNE groups, and flexibility in how CbC Reports may be completed mean that, in general, CbC Reports should not be used to directly compare specific groups. However, where the same risk is identified across different MNE groups, CbCR information may make it easier for a tax authority to determine the materiality of that risk posed by each group, and direct further compliance actions towards those groups where the tax at risk is higher. In addition, because the information contained in CbC Reports is presented in a standardised format using (with the exception of Table 3) numerical data, tick boxes and country codes, this facilitates the use of automated risk assessment tools which are currently used or being introduced in many jurisdictions.
27. Tax risk assessment is generally a process conducted unilaterally by a tax authority using available information, which may include information obtained during a consultation between the tax authority and members of an MNE group in that jurisdiction. However, the fact that an MNE group's CbC Report will be available to the tax authority in each jurisdiction where the group has activities could facilitate the development of multilateral components to the risk assessment of certain MNE groups, involving the tax authority from

CHAPTER 3 – OVERVIEW OF CBC REPORTING – 29
COUNTRY-BY-COUNTRY REPORTING - HANDBOOK ON EFFECTIVE TAX RISK ASSESSMENT © OECD 2017
more than one jurisdiction. This could include, for example, joint meetings with staff from a group's central finance function, co-ordinated requests for information that may be relevant to the group's tax risk in more than one jurisdiction, or consultation between tax authorities concerning the interpretation of information contained in a group's CbC Report. Such an approach may not be necessary or appropriate for all MNE groups and, similarly, there may be tax authorities which for policy or operational reasons may not wish to, or may not be able to, participate in multilateral risk assessments. Therefore it is likely that a unilateral risk assessment will continue to be conducted in the majority of cases. However, for MNE groups where a multilateral element is possible and appropriate, benefits could arise in terms of improving the effectiveness of a tax authority's risk assessment while providing greater certainty for groups. The possibility of multilateral consultations between an MNE group and tax authorities in different countries is also considered in Chapter 7.
28. As well as using information in CbC Reports to identify potential risks posed by specific MNE groups, tax authorities may use aggregated data taken from the CbC Reports of multiple groups to provide information on the profile of large MNE groups in general, or of those within a particular population (e.g. by sector or region). This could be used to identify potential tax risks in the economy, which may then be investigated in particular groups, as well as in the development of tax policy.
Other standards for disclosure of country-by-country information
29. This guidance focuses on CbCR information that will be made available to tax authorities by MNE groups in accordance with the Action 13 minimum standard. CbC Reports contain important information that should be used by tax authorities for risk assessment purposes only, alongside other available data. This other data might include information made available by groups under other country-by-country reporting standards which apply in specific sectors, such as requirements on certain financial institutions in the European Union under the EU Capital Requirements Directive (2013/36/EU) (CRD IV), or requirements on governments and extractive industry companies under the Extractive Industries Transparency Initiative (EITI) and the EU Accounting Directive (2013/34/EU). Information required under these standards is prepared on an annual basis and is publicly available.
30. Of these standards, the requirements under CRD IV are the most similar to those under Action 13. CRD IV requires credit institutions and investment firms to disclose, by EU Member State and by third country, the following information for a financial year: the name, the nature of activities and geographical location; turnover; number of employees in a full time equivalent basis; profit or loss before tax; tax on profit or loss; and public subsidies received. With the exception of public subsidies received, each of these categories of information will also be included in a group's CbC Report. However, differences in how information must be calculated under a jurisdiction's domestic law to implement CRD IV, and its law to implement the Action 13 minimum standard, may mean that information provided under the two regimes may not always be determined in precisely the same way (e.g. if turnover is reported on a consolidated basis under CRD IV but on an aggregated basis under Action 13, or if a group includes contractors in the calculation of employees under Action 13, but not under CRD IV). In some cases, identifying the cause of differences in numbers reported for different purposes may improve a tax authority's understanding of both sets of information, improving the effectiveness of their use in risk assessment. However, under the Action 13 minimum standard, MNE groups are not required to reconcile the revenue, profits and tax reporting in a CbC Report to its consolidated financial statements.
30 – CHAPTER 3 – OVERVIEW OF CBC REPORTING
COUNTRY-BY-COUNTRY REPORTING - HANDBOOK ON EFFECTIVE TAX RISK ASSESSMENT © OECD 2017
31. Where a tax authority has experience of using information provided by groups under different country-by-country reporting standards, this may help in identifying the best ways in which CbCR information under Action 13 may be incorporated into its tax risk assessment processes. Where a tax authority does not currently take this information into account in conducting tax risk assessments, it should consider incorporating it into these processes.
Bibliography
OECD (2017), Guidance on the Implementation of Country-by-Country Reporting, www.oecd.org/tax/beps/country-by-country-reporting.htm
OECD (2015), OECD/G20 Base Erosion and Profit Shifting Project - Transfer Pricing Documentation and Country-by Country Reporting – Action 13: 2015 Final Report, OECD Publishing, Paris, http://dx.doi.org/10.1787/9789264241480-en.

CHAPTER 4 – INCORPORATING CBC REPORTS INTO A TAX AUTHORITY’S TAX RISK ASSESSMENT FRAMEWORK – 31
COUNTRY-BY-COUNTRY REPORTING - HANDBOOK ON EFFECTIVE TAX RISK ASSESSMENT © OECD 2017
Chapter 4
Incorporating CbC Reports Into a Tax Authority's Tax Risk Assessment Framework
32. This chapter considers how CbC Reports may be incorporated into a jurisdiction's tax risk assessment framework, looking at three levels of detail, considering:
• at a high level, different approaches to tax risk assessment that may be applied
• at a middle level, different ways in which CbCR information can be used to detect indicators of tax risk within these approaches
• at a detailed level, different tax risk indicators that may be detected.
Using CbC Reports within different approaches to tax risk assessment
33. Tax authorities currently adopt a variety of approaches to tax risk assessment and may look to make changes to these approaches following the introduction of CbC Reporting (e.g. some tax authorities have introduced centralised processes for risk assessment using CbC Reports in order to ensure the appropriate use of CbCR information). For jurisdictions with mature transfer pricing risk assessment and audit procedures, CbCR information will play a useful role in enhancing and corroborating those processes. For other jurisdictions, CbC Reports together with the master file and local file will provide a strong basis for developing such procedures. Irrespective of the overall framework for tax risk assessment applied, CbCR information can be incorporated into it and has the potential to add important value in each case. This is in particular where CbCR information is used alongside and in combination with data from other sources, as considered later in this guidance.
34. The ways in which CbC Reports can be incorporated into a tax authority's risk assessment processes will depend upon the overall framework in place, but examples of how this may be done include the following.
• The tax authority in the jurisdiction where the ultimate parent entity of an MNE group is resident will typically receive the group's CbC Report within 12 months of the end of the group's reporting fiscal year, with the exact timing depending upon the filing deadline under domestic rules. This tax authority then exchanges the CbC Report with other jurisdictions where the group has activity (subject to conditions) within 15 months of the end of the group's reporting fiscal year (or within 18 months in the first year of reporting). Where a tax authority conducts a risk assessment before a taxpayer's tax return is filed, the group's CbC Report will not yet have been received for the year under consideration. However, once the CbC Report is received, it may be used by the tax authority to test the assumptions used and conclusions reached in the pre-filing risk assessment. The CbC Report could

32 – CHAPTER 4 – INCORPORATING CBC REPORTS INTO A TAX AUTHORITY’S TAX RISK ASSESSMENT FRAMEWORK
COUNTRY-BY-COUNTRY REPORTING - HANDBOOK ON EFFECTIVE TAX RISK ASSESSMENT © OECD 2017
also form part of the tax authority's underlying information on the group's structure and activities, to improve the pre-filing risk assessment of later periods.
• Where a tax authority conducts a tax risk assessment of taxpayers following the filing of tax returns, CbC Reports may be used as part of an initial screening of MNE groups to determine those which have a limited footprint in the jurisdiction and which, taking into account other relevant information, may be filtered from further assessment. CbCR information may then be used in more comprehensive automated and manual risk assessment processes to identify indicators of possible tax risk in a jurisdiction. Once higher risk taxpayers have been identified, CbCR information may be used to plan tax audits or other interventions, and may be the basis for further enquiries.
• Where a tax authority does not require all MNE groups to file a master file and local file in each period, the information contained in Tables 1 and 2 may be used together with other information as the basis for performing a high level initial functional analysis of a group. The information in Tables 1 and 2 may only be used for risk assessment purposes, but it could identify cases where the location of revenues and profits in an MNE group may not be appropriately aligned with the location of the group's activities, which could indicate possible BEPS risk, and so further transfer pricing documentation (such as the master file and local file) should be requested in order to conduct a more detailed analysis.
• Tax authorities in jurisdictions where an MNE group's holding companies are resident may use the information in Table 1 to calculate effective tax rates for each jurisdiction in which the group has operations. This may form the basis for an initial controlled foreign company (CFC) risk assessment to identify jurisdictions where the group may be paying a lower level of tax, although this assessment will be limited as the information on entities in a particular jurisdiction is presented on an aggregated basis (i.e. the results of entities with a low effective tax rate will be aggregated with the results of entities with a higher effective tax rate in the same jurisdiction) and does not include profit calculations based on tax numbers.
• A number of jurisdictions do not currently use detailed tax risk assessment tools to select taxpayers for audit, but may, for example, audit all taxpayers, or all taxpayers above a certain size threshold. In this case, CbCR information may be used to identify indicators of particular risks or arrangements in MNE groups that may require greater attention during an audit, as well as areas that may pose less concern.
• Where a tax authority has identified specific arrangements which pose a BEPS risk, it may develop a "profile" or "typology" of features which are characteristic of groups engaged in those arrangements, based on those features identified or observed in successful audits. These typologies, which may include structure diagrams, descriptions of typical arrangements and other indicators, may then be used to assist auditors in identifying comparable arrangements in other cases. They may also be used to scan CbC Reports (together with data from other sources) across a population of taxpayers, to identify those which meet the identified profile, for further consideration.
• Jurisdictions may also use CbCR information to identify trends in BEPS activity across different sectors. For example, key ratios may be calculated for different industries by taking an average ratio for MNE groups in each sector. Where these ratios show that differences exist across different sectors, this may indicate either of

CHAPTER 4 – INCORPORATING CBC REPORTS INTO A TAX AUTHORITY’S TAX RISK ASSESSMENT FRAMEWORK – 33
COUNTRY-BY-COUNTRY REPORTING - HANDBOOK ON EFFECTIVE TAX RISK ASSESSMENT © OECD 2017
two things. First, patterns in ratios may be used to identify sectors where particular types of BEPS activity are more common, which may be taken into account when risk assessing other groups in these sectors. Second, where a particular pattern in ratios does not derive from BEPS activity, this knowledge may be used by a tax authority to identify possible false risk indicators and de-select certain groups from further compliance interventions. Whether a particular pattern indicates an increased BEPS risk or a reduced BEPS risk in a particular sector may be determined using other available data, including the knowledge held by experienced tax officials within the compliance function.
35. Annex 3 includes an example of how a CbC Report may be used by a tax authority to identify possible tax risks within an MNE group.
Ways in which CbC Reports can be used to detect indicators of possible tax risk
36. Transfer pricing risk arises in three broad scenarios. First, where entities engage in recurring transactions with related parties which have the potential to erode a jurisdiction's tax base over time. This risk can involve any tax deductible related party payments, including large volume sales or purchases of products or services, but there is a particular risk where intragroup payments are of a type which can be hard to value. These might include payments of interest, insurance premiums, service fees, management fees and royalties. Second, transfer pricing risk can arise from large or complex one-off transactions, including business restructurings and transfers of key income producing assets. These transactions can have a significant effect on the tax position of entities in the year the transaction occurs, but also on an ongoing basis as new related party payments are put in place which need to be priced. Third, transfer pricing risk may be greater where a group does not have effective tax governance processes in place to control, document and review the pricing of related party transactions on an ongoing basis. Out of these three scenarios, CbC Reports contain data that can assist tax authorities in detecting risk indicators arising from recurring transactions and one-off transactions. Risk indicators deriving from a group's tax controls and governance processes may be detected using information contained in the master file, local file and other transfer pricing documentation where available (e.g. transfer pricing returns and questionnaires), as well as the tax authority's knowledge and experience of the group, including its attitude to tax risk.
37. The next section of this chapter does not include a comprehensive list of tax risk indicators that can be derived from an MNE group's CbC Report, but illustrates the range of risk areas that can be uncovered. For a number of the risk indicators, example ratios have been included to suggest how the level of risk may be assessed, but in practice it is anticipated that tax authorities may develop more complex algorithms taking into account different attributes. In a number of instances, information contained in a CbC Report may be taken into account directly for risk assessment purposes (e.g. where an MNE group has activities in a particular jurisdiction). However, in most cases it will be necessary to compare two or more pieces of data in order to identify patterns that may suggest a higher or lower level of tax risk, and ways in which this might be done are set out below. The identification of patterns (and cases where an entity or jurisdiction falls outside of an expected pattern) may be made easier where data analysis tools are used to present information visually.
• An MNE group's profile in a particular jurisdiction may be compared with that in other jurisdictions, with part of the group (e.g. a geographical region) or with the group as a whole. This may allow a tax authority to identify jurisdictions which appear to be out of line with other parts of the group, although a risk assessment

34 – CHAPTER 4 – INCORPORATING CBC REPORTS INTO A TAX AUTHORITY’S TAX RISK ASSESSMENT FRAMEWORK
COUNTRY-BY-COUNTRY REPORTING - HANDBOOK ON EFFECTIVE TAX RISK ASSESSMENT © OECD 2017
should also take into account that differences between jurisdictions could be explained by purely economic or other non-tax considerations (e.g. differences in the scale of the business, in the market or in the types of activity carried out between jurisdictions).
• An MNE group's profile in a jurisdiction may be compared with that of a "typical" MNE group in the same sector (i.e. based on the profiles of all MNE groups operating in a particular sector). This could allow a tax authority to identify groups where the profile in a jurisdiction differs from what would be expected in the sector. This would involve greater resources on the part of the tax authority if it needs to compile a set of appropriate benchmark data on a specific sector for comparison, which would also need to take into account the fact that groups may use different sources for data contained in CbC Reports (e.g. financial statements vs management accounts), or may apply different policies in calculating the amounts to be included in certain fields (e.g. including or excluding contractors in determining the number of employees), which could impact the comparability of data. Alternatively, benchmarking data may be available from third party sources but, again, the data underlying the analysis may not be prepared on a consistent basis. It should also be recognised that, even where data is produced consistently, within a sector there can be wholly commercial factors that lead to significant differences between the profiles of entities in different MNE groups, including differences in strategy or business model. Further analysis would therefore be required to take account of these. It is currently anticipated that all of these potential differences mean that no two MNE groups are likely to be directly comparable, and so individual groups should generally not be benchmarked against each other.
• An MNE group's profile in a jurisdiction can be compared with CbCR information for the same jurisdiction in earlier periods. This would allow a tax authority to identify changes in the nature or level of activity in a jurisdiction over time, as well as one-off events which might trigger a temporary increase or reduction in revenues or profits. In comparing data in Table 1 from different periods, it may be necessary to take into account factors that may vary from period to period. For example, differences in exchange rates or high levels of inflation could explain some changes over time (e.g. where information on constituent entities in a group has been translated into the functional currency of the group in completing the CbC Report).
38. A key feature of using CbC Reports for risk assessment in the first years following introduction of CbC Reporting will be the need to be flexible in terms of the approaches used and in the design of algorithms, which may need to be revisited and revised as tax authorities gain experience. This may be particularly important with respect to tax authorities' ability to use "text mining" of data in Table 3 (as well as the "other" column for business activities of constituent entities in Table 2) to search for specific words or phrases that may be indicators of an increased or reduced level of tax risk. The free text contained in Table 3 is likely to be extremely important in interpreting the contents of the CbC Report as a whole for many MNE groups, and may be helpful in allowing groups to explain apparent anomalies and potential risk indicators, but tax authorities will need to develop processes for how to incorporate this into standardised and automated risk assessment tools. These may depend on how Table 3 is used by MNE groups, the types of additional information included and the way this information is presented. This will only be seen once MNE groups begin to prepare and file their CbC Reports, but greater consistency in how Table 3 is used is likely to facilitate its use in risk assessment. One option could be for guidance to be given to MNE groups in the use of Table 3, including the development of

CHAPTER 4 – INCORPORATING CBC REPORTS INTO A TAX AUTHORITY’S TAX RISK ASSESSMENT FRAMEWORK – 35
COUNTRY-BY-COUNTRY REPORTING - HANDBOOK ON EFFECTIVE TAX RISK ASSESSMENT © OECD 2017
standardised disclosures to identify known common false positives, which could be incorporated into automated risk assessment processes. This may be particularly beneficial for tax authorities which lack the resources required for a detailed consultation with members of an MNE group in their jurisdiction, in order for them to better understand the content of the group's CbC Report.
39. Although tax risk assessment tools may flag a number of potential tax risks across an MNE group, a tax authority should determine which of these pose a possible risk to its jurisdiction before concluding that further action should be taken. In particular, a tax authority should seek to identify activities or arrangements in its jurisdiction or connected to its jurisdiction that may be impacted by the potential risk indicators that have been flagged. In broad terms, a tax authority is likely to take an interest in all risks arising in its own jurisdiction or those of foreign subsidiaries of entities in the jurisdiction (i.e. potential tax risks lower down the group structure), but may only be concerned by those in other parts of the group where there is a link to entities in that jurisdiction. For example, the tax authority in the jurisdiction of an MNE group's ultimate parent entity is likely to consider all potential risks flagged throughout the group (e.g. to ensure that its controlled foreign company rules are being applied correctly). However, the fact that an MNE group has a significant level of profit before tax in a foreign jurisdiction where it appears to have few activities and no or low accrued income tax may not be viewed as a relevant risk to the tax authority in the jurisdiction of a subsidiary in the group, unless the subsidiary has dealings with an entity in that foreign jurisdiction or there is other evidence that profits are being diverted from that tax authority's jurisdiction.
Tax risk indicators that may be detected using information contained in CbC Reports
40. The list below includes a number of potential tax risk indicators that could be derived from the information contained in an MNE group's CbC Report. None of these potential indicators should be taken by themselves to suggest that a group poses an increased tax risk in a jurisdiction, but they may be combined in different ways to build an overall picture of the level of tax risk posed by a group. Methods for interpreting combinations of indicators, including the weight that should be given to each indicator within a particular combination, will vary depending on the approach to risk assessment used and is something which may change over time. Where ratios are referred to as "high" or "low" this means that the relevant ratio is materially higher or lower than that of the chosen potential comparable (e.g. other jurisdictions in the group, the group as a whole, sector averages, or earlier periods). A summary of these potential tax risk indicators is included in Annex 2.
1. The footprint of a group in a particular jurisdiction
2. A group's activities in a jurisdiction are limited to those that pose less risk
3. There is a high value or high proportion of related party revenues in a particular jurisdiction
4. The results in a jurisdiction deviate from potential comparables
5. The results in a jurisdiction do not reflect market trends
6. There are jurisdictions with significant profits but little substantial activity
7. There are jurisdictions with significant profits but low levels of tax accrued
8. There are jurisdictions with significant activities but low levels of profit (or losses)

36 – CHAPTER 4 – INCORPORATING CBC REPORTS INTO A TAX AUTHORITY’S TAX RISK ASSESSMENT FRAMEWORK
COUNTRY-BY-COUNTRY REPORTING - HANDBOOK ON EFFECTIVE TAX RISK ASSESSMENT © OECD 2017
9. A group has activities in jurisdictions which pose a BEPS risk
10. A group has mobile activities located in jurisdictions where the group pays a lower rate or level of tax
11. There have been changes in a group's structure, including the location of assets
12. Intellectual property (IP) is separated from related activities within a group
13. A group has marketing entities located in jurisdictions outside its key markets
14. A group has procurement entities located in jurisdictions outside its key manufacturing locations
15. Income tax paid is consistently lower than income tax accrued
16. A group includes dual resident entities
17. A group includes entities with no tax residence
18. A group discloses stateless revenues in Table 1
19. Information in a group's CbC Report does not correspond with information previously provided by a constituent entity
The footprint of a group in a particular jurisdiction
41. Although the size of an MNE group's operations in a jurisdiction is not by itself a good indicator of whether entities in the group pose a high level of tax risk, many tax authorities use size as an initial filter to identify which groups have the potential to pose more risk. For example, where a CbC Report indicates that a group has total revenues in the jurisdiction above a set threshold, this may flag the group for further risk assessment. In contrast, where a group has a very low level of revenues in the jurisdiction, and this appears to be appropriate given the activities in the jurisdiction identified in Table 2 and the tax authority's knowledge and experience of the group, including its attitude to tax risk, this may suggest that the potential tax at risk in the jurisdiction is low.
42. Where CbCR information suggests that a group's footprint in a jurisdiction is low, this should be corroborated using other information sources, such as the information contained in the master file and local file, where available, which include a high level functional analysis for the entire group by entity, as well as a detailed description of the business and strategy of entities in the jurisdiction.
A group's activities in a jurisdiction are limited to those that pose less risk
43. A tax authority may also use a CbC Report to filter MNE groups where the nature of activities in the jurisdiction suggest the tax at risk is likely to be low. For example, where a group only has a holding company in a particular jurisdiction (or has only limited other activities), the tax authority may see this as an indicator of low risk, if a participation exemption or other domestic rules mean that the level of taxable income in the jurisdiction is likely to be low.
44. The fact that an entity's main activities in a jurisdiction are limited to those that typically pose a lower level of tax risk, does not necessarily mean the entity is not engaged in BEPS, for example, where other available information suggests that an entity should recognise a higher level of taxable income from these activities.

CHAPTER 4 – INCORPORATING CBC REPORTS INTO A TAX AUTHORITY’S TAX RISK ASSESSMENT FRAMEWORK – 37
COUNTRY-BY-COUNTRY REPORTING - HANDBOOK ON EFFECTIVE TAX RISK ASSESSMENT © OECD 2017
There is a high value or high proportion of related party revenues in a particular jurisdiction
45. The fact that an entity receives revenue from related parties does not by itself mean that the entity poses a high tax risk to other jurisdictions where the MNE group has activities. However, where an entity receives a significant amount of related party revenue, this increases the potential that an error in the transfer prices applied could give rise to a significant tax difference. Intragroup payments also increase the potential that other BEPS risks could be present, such as intragroup hybrid financial instruments or excessive interest payments on related party debt.
46. In determining whether a risk flag is raised, a tax authority may take into account both the amount of intragroup revenues in a foreign jurisdiction and the proportion of total revenues that are generated from related parties. Where one or both of these is high, the tax authority may look at other factors, such as whether there are substantial activities in the foreign jurisdiction, the nature of those activities, and the effective tax rate, before deciding whether the group could pose a higher tax risk in its own jurisdiction. The tax authority should then use other information on the group to determine the extent and nature of transactions and payments between domestic entities and related parties in the foreign jurisdiction, to determine whether any of these could give rise to BEPS.
47. The fact that a particular jurisdiction has a high value or proportion of related party revenues is not by itself an indicator of increased tax risk. Groups often include entities involved in activities such as manufacturing, providing services, group finance or investment holding, that transact largely or wholly with related parties for commercial purposes.
The results in a jurisdiction deviate from potential comparables
48. Key financial ratios for a jurisdiction where an MNE group has activities may be compared with those of other jurisdictions within the group; with the group as a whole; with potentially comparable entities outside the group; or with industry averages. Information on other parts of the group may be taken from the CbC Report, while information on other groups and industry ratios may be obtained from commercial databases or built up using a tax authority's own data. Ratios for comparison could include:
• profit margin
− e.g. profit before tax / total revenues
• effective tax rate
− e.g. income tax accrued / profit before tax
• revenue or profits per unit of economic activity
− e.g. total revenues or profit before tax / number of employees
− e.g. total revenues or profit before tax / tangible assets
• pre-tax return on equity
− e.g. profit before tax / (stated capital + accumulated earnings)
• post-tax return on equity

38 – CHAPTER 4 – INCORPORATING CBC REPORTS INTO A TAX AUTHORITY’S TAX RISK ASSESSMENT FRAMEWORK
COUNTRY-BY-COUNTRY REPORTING - HANDBOOK ON EFFECTIVE TAX RISK ASSESSMENT © OECD 2017
− e.g. (profit before tax - income tax accrued) / (stated capital + accumulated earnings).
49. Where these comparisons show significant differences, this could be an indicator of possible tax risk. However, there are many non-tax reasons why the results of a particular jurisdiction are better or worse than others (e.g. the size of the market in a particular jurisdiction, the level of competition, the market penetration of the group, its bargaining power, the cost of labour and other inputs, etc.). Therefore, other indicators of tax risk should be considered before a decision is reached to conduct compliance interventions.
The results in a jurisdiction do not reflect market trends
50. There are many tax and non-tax reasons why an MNE group's performance in a jurisdiction may be better or worse than that in other jurisdictions or in other groups. However, in broad terms, changes in that performance would typically be expected to reflect market trends. Where this is not the case, it might suggest that the group's performance in a particular jurisdiction is being driven by BEPS rather than simply by the business activities undertaken in the jurisdiction. For example, if the market for a group's products is expanding, and the level of sales by the group is growing, it would be expected that the profitability of entities contributing to those sales would increase. If the group's results are not consistent with these expectations, this could indicate a possible transfer pricing or other BEPS-related risk which might warrant further investigation.
51. Before reaching a decision on any further compliance activity, a tax authority should consider commercial reasons for any variance from market trends, for example where a group has made significant investment in a jurisdiction with a growing market, which has reduced profits in the current period but should give rise to greater returns in the future.
There are jurisdictions with significant profits but little substantial activity
52. CbC Reports contain useful information on the level of revenues, profits and activity, which can be used as initial indicators that MNE groups have entities in certain jurisdictions with earnings that appear to be disproportionate to their level of economic activity. This may pose a particular tax risk if these earnings are largely derived from related party revenues, which could indicate that profit has been diverted from other parts of the group. For example, flags may be raised where a group has operations in a jurisdiction with some or all of the following characteristics.
• High proportion of related party revenues
− e.g. related party revenues / total revenues = high
• Low substantial activities in proportion to revenues or profit before tax
− e.g. total revenues or profit before tax / total employees = high
− e.g. total revenues or profit before tax / tangible assets = high
• High return on equity
− e.g. profit before tax / (stated capital + retained earnings) = high
− e.g. (profit before tax – income tax accrued) / (stated capital + retained earnings) = high

CHAPTER 4 – INCORPORATING CBC REPORTS INTO A TAX AUTHORITY’S TAX RISK ASSESSMENT FRAMEWORK – 39
COUNTRY-BY-COUNTRY REPORTING - HANDBOOK ON EFFECTIVE TAX RISK ASSESSMENT © OECD 2017
• Low cost base
− e.g. profit before tax / total revenues = high
• Profitability exceeds that of the group as a whole
− e.g. (profit before tax / total revenues) > (sum of profit before tax / sum of total revenues)
• Low effective tax rate
− e.g. income taxes accrued / profit before tax = low
53. Where these characteristics are present, a tax authority may consider other sources of information to establish whether this can be reasonably explained (e.g. if total revenue or profit before tax / tangible assets is high because the accounting carrying value of tangible assets is low following substantial depreciation, or the group also holds intangible assets in the jurisdiction, the value of which is not disclosed in the CbC Report).
There are jurisdictions with significant profits but low levels of tax accrued
54. A potential tax risk may be highlighted where an MNE group has substantial profits in a particular jurisdiction, but has no tax or only a low level of tax accrued for the period, in particular where this is substantially lower than the headline rate of corporate tax in that jurisdiction. This may be indicated where the following characteristics are present.
• Substantial profits in a jurisdiction
− e.g. a tax authority may apply a de minimis threshold to avoid raising a potential risk flag where the level of profit before tax in a jurisdiction is low and this appears appropriate based on the level of total revenues, number of employees, tangible assets, etc.
• Low effective tax rate
− e.g. income taxes accrued / profit before tax = low
55. Where these characteristics are present, the tax authority in that jurisdiction and in other jurisdictions where the group has activities, may consider other sources of information to establish whether this can be reasonably explained (e.g. if the group had incurred significant capital expenditure in the jurisdiction which qualifies for accelerated tax depreciation, reducing profit for tax purposes but not for accounting purposes) or if further enquiries are needed.
There are jurisdictions with significant activities but low levels of profit (or losses)
56. Where an established entity has a persistently low (or negative) profit before tax which cannot be readily explained, the tax authority in that jurisdiction may flag this for further enquiry to ensure there is no BEPS reason. This may be determined where a jurisdiction has a number of the following characteristics.
• The jurisdiction includes entities engaged in profit-generating activities
− e.g. manufacturing or production; sales, marketing or distribution; provision of services to unrelated parties; regulated financial services
• High proportion of unrelated party revenues

40 – CHAPTER 4 – INCORPORATING CBC REPORTS INTO A TAX AUTHORITY’S TAX RISK ASSESSMENT FRAMEWORK
COUNTRY-BY-COUNTRY REPORTING - HANDBOOK ON EFFECTIVE TAX RISK ASSESSMENT © OECD 2017
− e.g. unrelated party revenues / total revenues = high
• High cost base
− e.g. profit before tax / total revenues = low or negative
• The effective tax rate is not low
− e.g. accrued income tax / profit before tax is typically high or average
• This is not the result of start-up losses or recent expansion within the jurisdiction
− e.g. the above characteristics persist for several years, not including the first three years after activities are established or expanded in the jurisdiction.
57. In performing a risk analysis, a tax authority should recognise that some entities may appear to perform poorly relative to others in a group based on certain measures for wholly business or commercial reasons. For example, a particular entity may be involved in activities which require a significant number of employees but which typically earn low profit margins (e.g. IT support or administrative centres).
A group has activities in jurisdictions which pose a BEPS risk
58. Where, in a tax authority's view, MNE groups are able to use certain foreign jurisdictions for BEPS purposes, CbC Reports could be an important tool to help the tax authority identify groups with activities in these jurisdictions. This may include, for example, foreign jurisdictions with a low or zero level of corporate tax, or those with tax rules and treaty policies which facilitate the use of entities as conduits to pass through payments within a group.
59. Where a group includes entities with activities in these "jurisdictions of interest", other information contained in a CbC Report, such as the nature of the group's activities and the level of economic activity in the jurisdiction, may be used to assess whether in practice the group poses a BEPS risk.
A group has mobile activities located in jurisdictions where the group pays a lower rate or level of tax
60. A tax authority may view an MNE group's tax risk as increased where the group has located globally mobile activities in a foreign jurisdiction where it pays a low level of tax. This would be assessed taking into account the group's effective tax rate in the jurisdiction using data from Table 1, and the activities in that jurisdiction described in Table 2. The low level of taxation could be because the headline rate of corporate tax in the foreign jurisdiction is low (or zero), because a particular type of income or activity benefits from a reduced tax rate, as a result of planning by the group, or for some other reason.
• Low effective tax rate
− e.g. income taxes accrued / profit before tax = low
• Mobile activities
− Table 2 lists activities in the jurisdiction as including holding or managing IP; purchasing or procurement; sales, marketing or distribution; internal group finance or insurance

CHAPTER 4 – INCORPORATING CBC REPORTS INTO A TAX AUTHORITY’S TAX RISK ASSESSMENT FRAMEWORK – 41
COUNTRY-BY-COUNTRY REPORTING - HANDBOOK ON EFFECTIVE TAX RISK ASSESSMENT © OECD 2017
61. The simple fact that a group has a low effective tax rate in a particular jurisdiction does not mean that the group is engaged in BEPS. There is significant variance in the headline tax rate in different jurisdictions, and a number of jurisdictions have tax regimes which provide for a lower rate of tax on certain forms of income but which are not harmful. If a foreign jurisdiction with a low effective tax rate has sufficient activity to support the level of revenue and profit, transfer prices with the jurisdiction appear to be at arm's length, and there are no other indicators that profit has been shifted, then a tax authority may conclude that the level of tax risk posed is low.
There have been changes in a group's structure, including the location of assets
62. Table 2 contains a comprehensive list of entities in an MNE group and changes in this list from year to year would indicate changes in the group's structure, such as acquisitions or incorporations (where new entities are added to Table 2), disposals or liquidations (where entities are removed from the table) or migrations (where the residence jurisdiction of an entity changes). In particular, potential risks may be identified where there are frequent changes in the number of entities in a jurisdiction (which may indicate that entities are being established for the purposes of specific transactions) or where a temporary increase in the number of entities in a jurisdiction is mirrored by a temporary increase in revenues in that jurisdiction.
63. Changes on Table 2 may also indicate changes to the activities carried on in different parts of the group, such as where ownership of the group's IP moves to a different jurisdiction (or a new IP holding entity is established). This may have implications for other parts of the group, either because it indicates that assets may have moved into or out of a jurisdiction, or because intragroup payments for use of the group's IP may now be made to an entity in a different jurisdiction than before. For example, this may have an impact on the application of transfer pricing rules or on the level of withholding tax which may be applied to a payment, which may depend on the terms of the applicable tax treaty. A tax authority may therefore wish to ask for further information as part of its risk assessment.
64. Changes in a group's structure do not necessarily indicate an increase in tax risk, but a tax authority may use this as an indicator that further information is required (e.g. where the changes involve entities resident or with activities in the jurisdiction; entities that are subsidiaries of entities resident in the jurisdiction; or entities which are or were party to transactions with entities resident in the jurisdiction). Even where a re-structuring results in less tax paid in a particular jurisdiction, this does not mean the group is involved in BEPS and may be explained by other factors. Additional information on important business restructurings, including acquisitions, disposals and transfers of interests in IP within a group should be contained in a group's master file, where available.
IP is separated from related activities within a group
65. In many cases, an MNE group's IP will be among the group's most valuable assets, which can generate significant value for the entity holding an asset, as a result of its use by other members of the group. However, the valuation of IP is extremely challenging. Therefore, this has been used by some groups for the purposes of shifting profits away from the jurisdictions where a group has underlying economic activity.
66. Table 2 of a CbC Report can help tax authorities to quickly identify which entities hold IP within a group, the jurisdiction where these entities are resident, and the level of related party revenues in the jurisdiction. The table also shows whether the ownership and management of IP is in a different jurisdiction to the group's activities that give rise to the
42 – CHAPTER 4 – INCORPORATING CBC REPORTS INTO A TAX AUTHORITY’S TAX RISK ASSESSMENT FRAMEWORK
COUNTRY-BY-COUNTRY REPORTING - HANDBOOK ON EFFECTIVE TAX RISK ASSESSMENT © OECD 2017
IP or use it to create value, including research and development, manufacturing or production, sales, marketing or distribution, and the provision of services to unrelated parties.
67. In a complex multinational group, it may be efficient for non-tax reasons to hold IP in a single entity or jurisdiction. Although BEPS risk may be indicated where this jurisdiction has no or limited other business activities, the fact that a domestic entity is making payments to an IP holding entity in another jurisdiction may not be a BEPS concern, so long as these payments are at arm's length and there are no other indicators of BEPS.
A group has marketing entities located in jurisdictions outside its key markets
68. MNE groups may use centralised marketing companies for commercial or operational reasons. However, there is also a risk that marketing companies are used to reduce the level of income subject to tax in the jurisdiction where sales occur. Therefore, where a CbC Report shows that a group includes entities engaged in marketing located in jurisdictions where the group does not have a significant level of sales, this may indicate a possible tax risk in the jurisdictions where sales take place, for consideration by those tax authorities.
69. Before concluding that a transfer pricing risk exists, a tax authority should use its knowledge of a group and its business to determine if there are any historic or other business reasons for the use of a marketing entity in a particular jurisdiction, despite the fact that this jurisdiction is not a significant market for the group's sales.
A group has procurement entities located in jurisdictions outside its key manufacturing locations
70. A possible tax risk may also arise where a CbC Report shows that an MNE group includes procurement entities in jurisdictions where the group does not have significant manufacturing operations. Again, there can be good business reasons for the use of centralised procurement entities, but there is also a risk that this can be used to reduce the level of taxable income in the jurisdictions where manufacturing occurs.
71. As with the potential risk posed by marketing entities, before concluding that a transfer pricing risk is posed by a procurement entity, a tax authority should consider if any business reasons exist for the use by a group of a procurement entity in a particular jurisdiction.
Income tax paid is consistently lower than income tax accrued
72. An MNE group's CbC Report includes two income tax fields. The first, income tax paid (on a cash basis) includes the actual amount of cash tax paid by the group in a financial reporting year, by jurisdiction. This is not necessarily directly related to the profit before tax reported in a jurisdiction, and takes into account payments (and repayments) of tax with respect to profits earned in earlier periods, as well as advance payments made in the current year and withholding tax incurred on payments to a jurisdiction. On the other hand, income tax accrued for the current year is more directly related to the amount of profit before tax reported in a specific period.
73. There are a number of reasons why the figures for income tax paid and income tax accrued will differ for a particular fiscal year. However, in most cases and over time, it

CHAPTER 4 – INCORPORATING CBC REPORTS INTO A TAX AUTHORITY’S TAX RISK ASSESSMENT FRAMEWORK – 43
COUNTRY-BY-COUNTRY REPORTING - HANDBOOK ON EFFECTIVE TAX RISK ASSESSMENT © OECD 2017
should be expected that the level of a group's tax accrued in a jurisdiction, and the level of tax paid in that jurisdiction, should broadly align. Where this does not happen, and in particular where the level of tax paid in a jurisdiction is materially and persistently lower than the level of tax accrued, this may be an indicator of possible tax risk, for example where a group is making significant provisions against uncertain tax provisions which it expects to be challenged, or where there are ongoing tax disputes which have not been settled for a number of years.
74. Although, in general, a group's accrued tax and tax paid may be expected to align over time, there are non-BEPS reasons why this may not be the case. For example, where there are tax losses in an earlier period, this would not typically impact tax accrued in a later period but could reduce tax paid. Alternatively, where there is legitimate uncertainty in the level of income tax payable in a jurisdiction, a group may take a conservative position and recognise a current year tax charge in its financial statements for a particular period, which is higher than the actual tax liability that is ultimately paid (or which results in a tax refund in a later period). Once the final tax position is agreed, any reduction in the tax charge for a prior period may not be reflected in the current year accrued tax figure in a group's CbC Report, but is likely to be taken into account in calculating the cash tax paid.
A group includes dual resident entities
75. Table 2 includes a list of all constituent entities in an MNE group, listed against their tax residence (or, in the case of permanent establishments, where they are situated). In some cases, an entity would be treated as tax resident under the laws of two jurisdictions (e.g. where a company is resident in one jurisdiction buts its effective management is in another jurisdiction). In most cases, the tax treaty between the two jurisdictions will include a "tie-breaker clause" which determines the tax residence. Where there is no tax treaty in place, the entity remains resident in both jurisdictions, and this fact has been used for tax planning purposes by a number of groups. For the purposes of a CbC Report, an entity that is resident in more than one jurisdiction should be listed in Table 2 under the jurisdiction where its effective management is conducted. In most cases, where an entity is "dual resident" this will be different from the incorporation jurisdiction, and so Table 2 will also disclose the jurisdiction in which the entity was incorporated.
76. Typically it is difficult for a tax authority to identify dual resident entities, unless there are other indicators that suggest the entity is engaged in BEPS. The information contained in Table 2 may make this easier, in particular for the tax authority in the incorporation jurisdiction, which would otherwise expect to see the entity listed as resident in its jurisdiction. Tax authorities in other jurisdictions may also use Table 2 to identify possible dual resident entities (e.g. where they have identified a specific BEPS risk involving dual resident entities and are seeking to identify groups that may be party to such arrangements), but this should be done with caution.
77. In practice, in the majority of cases, a tax treaty will be in place to determine the residence of the entity and so, even though an entity reports both a residence jurisdiction and an incorporation jurisdiction, it would not be dual resident.
A group includes entities with no tax residence
78. In a small number of cases, an MNE group may include an entity which is not tax resident in any jurisdiction. This arises because of differences in jurisdictions' rules for determining residence, and opportunities for entities to avoid being tax resident anywhere have reduced as jurisdictions introduce more comprehensive rules. Where a group does

44 – CHAPTER 4 – INCORPORATING CBC REPORTS INTO A TAX AUTHORITY’S TAX RISK ASSESSMENT FRAMEWORK
COUNTRY-BY-COUNTRY REPORTING - HANDBOOK ON EFFECTIVE TAX RISK ASSESSMENT © OECD 2017
include an entity with no tax residence, this should be apparent from Table 2 of the group's CbC Report, which should also list the jurisdiction in which the entity is incorporated or established. Tax authorities in jurisdictions where the group has operations should then consider whether the entity poses a tax risk for their jurisdiction.
79. Although the presence of entities in a group that have no tax residence poses a potential tax risk, it is expected that in most cases this will be explained in Table 3 (e.g. where an entity is transparent for tax purposes and its profits are subject to tax on other entities within the group).
A group discloses stateless revenues in Table 1
80. Table 1 includes a summary of the revenues, profits, assets and other attributes of constituent entities in an MNE group, listed by the jurisdiction in which an entity is tax resident. Where an entity in the group is not resident in any jurisdiction, its attributes are categorised in Table 1 as "stateless". Any material level of stateless revenues on Table 1 is likely to be flagged as a potential risk by all tax authorities in jurisdictions where the group has operations, which would then need to consider whether this is a risk to their particular jurisdiction.
81. As with respect to entities with no tax residence it is expected that, in most cases, the presence of stateless income in a group may be explained in Table 3 (e.g. where the revenues are earned by an entity that is transparent for tax purposes, and are subject to tax in other entities within the group).
Information in a group's CbC Report does not correspond with information previously provided by a constituent entity
82. There may be cases where information contained in an MNE group's CbC Report either differs from information previously provided by constituent entities resident in a jurisdiction, or does not appear to be consistent with that information. For example, an entity may have previously indicated in the master file, local file or in other documentation, that the group has substantial activities in a particular jurisdiction, but this might not be supported by information provided by the group's ultimate parent entity in the group's CbC Report.
83. It may be difficult to identify potentially conflicting information provided by a group using automated risk assessment tools. However, where a possible conflict becomes apparent during the manual phase of a risk assessment when the experience of tax compliance staff may be taken into account, this would be a clear indicator that further enquiries are necessary in order to understand the correct position of the group. In many cases, an apparent inconsistency may be explained, for example as the result of a change in the group's structure or activities over time.

CHAPTER 5 – CHALLENGES TO THE EFFECTIVE USE OF CBC REPORTS FOR TAX RISK ASSESSMENT – 45
COUNTRY-BY-COUNTRY REPORTING - HANDBOOK ON EFFECTIVE TAX RISK ASSESSMENT © OECD 2017
Chapter 5
Challenges to the Effective Use of CbC Reports for Tax Risk Assessment
84. CbC Reports contain valuable information to assist tax authorities in assessing transfer pricing and other BEPS-related risks to their jurisdiction. However, a number of features of the framework for CbC Reporting, the design of CbC Reports and the information they contain, pose challenges for tax authorities. In using CbCR information for the purposes of risk assessment, a tax authority will need to consider ways to minimise these challenges or take them into account when interpreting the outcomes of risk assessment processes. Future versions of this handbook will include approaches that may be adopted to address these challenges, based on the experience of tax authorities.
1. The volume of CbCR information to be processed
2. The need for systems and training to be developed or revised following the introduction of CbC Reporting
3. Issues concerning consistency in CbCR information
4. Inclusion of profits of non-consolidated entities
5. Constituent entities joining or leaving a group during a reporting fiscal year
6. Issues concerning the use of stated equity as a measure of a group's level of activity in a jurisdiction
7. The risk that CbCR information may be used inappropriately
8. Lack of information concerning a group's sector
9. Organisation of Table 1 by jurisdiction rather than by sector or activity
10. Information on specific entities may be concealed within jurisdiction-level information in Table 1
11. Lack of information on specific transactions undertaken by a group
12. Issues concerning disclosure of an entity's main business activity or activities
13. Challenges concerning the use of Table 3 in risk assessments
14. Differences between a jurisdiction's tax risk assessment cycle and the timing of CbC Reports
15. Differences in tax risk assessment processes depending on the size of taxpayers in a jurisdiction
16. Differences between the constituent entities in a jurisdiction and those included in the local tax group
17. Transitional issues following the introduction of CbC Reporting
46 – CHAPTER 5 – CHALLENGES TO THE EFFECTIVE USE OF CBC REPORTS FOR TAX RISK ASSESSMENT
COUNTRY-BY-COUNTRY REPORTING - HANDBOOK ON EFFECTIVE TAX RISK ASSESSMENT © OECD 2017
The volume of CbCR information to be processed
85. One of the most basic challenges faced by tax authorities will be the sheer volume of information provided. CbC Reports are prepared by the largest MNE groups, many of which include hundreds or even thousands of entities, across a large number of jurisdictions. In addition, jurisdictions will vary in terms of the number of CbC Reports they will receive, but some large jurisdictions are expecting to receive several thousand reports (including those received from foreign tax authorities). This quantity of information will pose a particular problem for tax authorities that rely on manual processes, but even those which currently use automated systems may find it challenging to determine information relevant to their jurisdiction, to apply risk assessment tools and to identify risk flags among such a large volume of data.
The need for systems and training to be developed or revised following the introduction of CbC Reporting
86. Following the introduction of CbC Reporting, existing risk assessment processes may need to be revised, or new processes developed, to take into account the CbCR information that will become available. Similarly, staff involved in risk assessment in a tax authority will need to be trained in how to use CbCR information within their work. Both of these will take time and will require an investment on the part of a tax authority, although there will be an important benefit to a jurisdiction from this investment. The OECD is taking steps to assist countries in this regard (e.g. through this guidance; through the development of a Toolkit on Transfer Pricing Risk Assessment; and through the Country-by-Country Reporting: Handbook on Effective Implementation (OECD, 2017a), which is supported by a CBC Clearspace site which may be used by jurisdictions to share resources relevant to the implementation and operation of CbC Reporting).
Issues concerning consistency in CbCR information
87. A number of tax risk assessment tools involve the comparison of key characteristics between entities or groups. These allow taxpayers to be benchmarked against other entities in the same MNE group as well as against those in other groups, to identify discrepancies which may be indicators of increased risk in a particular jurisdiction. One of the benefits of CbCR information for use in risk assessment is that groups are required to provide the same categories of information in a consistent format, which should facilitate such benchmarking within a group. However, there may be cases where similar groups provide information that is not directly comparable, either because the source of the information or the method used to calculate the information differs.
• CbC Reporting information may be based on information taken from an MNE group's consolidated reporting packages, from separate entity statutory financial statements, from regulatory financial statements or from internal management accounts, so long as this is consistent from year to year. A brief description of the sources of information used should be included in Table 3.
• Action 13 provides flexibility to groups for how the information under certain fields may be calculated. For example, groups may use different bases for the calculation of the number of employees in a jurisdiction, including deciding whether to treat independent contractors as employees, so long as this is done consistently.

CHAPTER 5 – CHALLENGES TO THE EFFECTIVE USE OF CBC REPORTS FOR TAX RISK ASSESSMENT – 47
COUNTRY-BY-COUNTRY REPORTING - HANDBOOK ON EFFECTIVE TAX RISK ASSESSMENT © OECD 2017
• In the Action 13 Report (OECD, 2015), "consistency" is one of the three conditions underpinning the obtaining and use of CbC Reports. CbC Reports must contain all of the information required in the standardised template, and a jurisdiction may not require that any additional information is included. However, there may still be some differences between the CbC Reports filed in different jurisdictions. For example, the language and currency of a CbC Report may vary, depending upon the requirements in the jurisdiction where it is submitted. There may also be differences in how jurisdictions interpret some of the information to be included. For example, jurisdictions may take different views as to whether a permanent establishment exists given a particular fact pattern, and this may influence how information is presented in a group's CbC Report.
• The OECD continues to develop guidance on the interpretation of Action 13, including the information to be included within certain fields of a group's CbC Report. It is anticipated that areas where there is currently a lack of clarity will be resolved before groups are required to file their first CbC Reports. However, there remains a risk that groups may interpret elements of Action 13 differently, resulting in inconsistencies in how CbC Reports are prepared. As any inconsistencies are identified, further guidance will be developed if needed.
• Action 13 generally requires groups to use aggregated data on a group's position in a particular jurisdiction. For some types of information, such as taxes paid and accrued, and tangible assets, this does not pose any particular challenge. However, if a group's CbC Report includes intragroup revenue in a particular jurisdiction, it may not be clear to what extent this revenue includes payments from other parts of the group or is the result of payments within the jurisdiction (i.e. between group entities resident in the same jurisdiction). This could significantly inflate the level of total revenues in a jurisdiction, if there are intra-group payments between constituent entities in that jurisdiction.
• Guidance released by the OECD subsequent to the Action 13 Report (OECD, 2015) sets out a possible derogation from the general rule that aggregated data must be used in completing a CbC Report, which may apply where the jurisdiction of a group's ultimate parent entity allows consolidated reporting for tax purposes, and this includes consolidation at the level of individual line items. Where this applies, the jurisdiction may allow the ultimate parent entity to complete Table 1 using data which is consolidated at jurisdictional level, so long as this is done consistently for all jurisdictions and from year to year. In this case, Table 3 must include a disclosure of which fields in Table 1 have been completed using consolidated data. This could address the concerns posed by the use of aggregated data in analysing the CbC Report of a particular group. However, as this means that some groups will complete Table 1 using aggregated data, and others using consolidated data (depending on the rules applied in the jurisdiction of the ultimate parent entity), this introduces an additional challenge in comparing information on different groups.
Inclusion of profits of non-consolidated entities
88. Under financial accounting rules, the ultimate parent of a group will typically consolidate all entities over which it has direct or indirect control. Where the parent is able to exercise significant influence over an entity, but this is not sufficient to establish control, the entity may not be consolidated into the group's financial statements, but the group's

48 – CHAPTER 5 – CHALLENGES TO THE EFFECTIVE USE OF CBC REPORTS FOR TAX RISK ASSESSMENT
COUNTRY-BY-COUNTRY REPORTING - HANDBOOK ON EFFECTIVE TAX RISK ASSESSMENT © OECD 2017
share of the entity's net profit or loss may be included in a single line of the group's consolidated income statement. This may arise where the group jointly controls an entity with another investor (a joint venture entity) or where a group controls between 20% and 50% of an entity's voting stock and there is no joint control (an associate or affiliate).
89. If the group uses its consolidated financial statements as the source of data for completing its CbC Report, the group's share of the net profit or loss of a joint venture entity or an associate/affiliate may be included in the group's profit before tax in the relevant jurisdiction when completing Table 1, aggregated with other profit before tax the group has in that jurisdiction. However, the group's CbC Report will not include details of the entity's revenues, tax, stated capital, employees or tangible assets, and the entity will not be included as a constituent entity in Table 2. This will have an impact on any ratios that compare a jurisdiction's profit before tax with any other data contained in the CbC Report.
90. There is no obligation on an MNE group to disclose the existence of joint venture entities or associates/affiliates in its CbC Report. However, this information will typically be disclosed in the group's consolidated financial statements where material.
Constituent entities joining or leaving a group during a reporting fiscal year
91. There may be cases where the constituent entities in an MNE group change during a reporting fiscal year, with one or more constituent entities joining a group (e.g. on acquisition or incorporation) or leaving a group (e.g. on disposal or liquidation).
• Where a constituent entity joins an MNE group during the year, the group's CbC Report will include the entity's revenues, profit before tax, tax accrued and tax paid to the extent this relates to the period where the entity is a constituent entity, but will include all of the entity's stated capital, accrued earnings, employees and fixed assets.
• Where a constituent entity leaves an MNE group during the year, the group's CbC Report will include the entity's revenues, profit before tax, tax accrued and tax paid to the extent this relates to the period where the entity is a constituent entity, as well as gains or losses arising on the disposal or liquidation, but will not include any of the entity's stated capital, accrued earnings, employees and fixed assets.
92. This will impact any ratios calculated using this information. The fact that a constituent entity has joined or left the group will be visible to a tax authority by comparing the entities included in Table 2 in different periods, and this should be taken into account when using this data.
Issues concerning the use of stated equity as a measure of a group's level of activity in a jurisdiction
93. Chapter 4 includes a number of risk indicators which involve comparing the level of an MNE group's revenue or profit before tax in a jurisdiction, with its level of stated capital, equity (including retained earnings), total employees or tangible assets. Each of these measures of economic activity (capital, equity, employees and assets) may be subject to criticism, but there are particular concerns over the use of stated capital and equity (which includes stated capital) for the purposes of tax risk assessment.
• Table 1 includes information on the level of stated capital in a jurisdiction, but it does not include information on dividends received from constituent entities.

CHAPTER 5 – CHALLENGES TO THE EFFECTIVE USE OF CBC REPORTS FOR TAX RISK ASSESSMENT – 49
COUNTRY-BY-COUNTRY REPORTING - HANDBOOK ON EFFECTIVE TAX RISK ASSESSMENT © OECD 2017
Therefore, the stated capital of a holding entity will be included against the relevant jurisdiction in a group's CbC Report, but a key source of the holding entity's income will not be included. Where a jurisdiction includes both holding entities and operating entities, it will be difficult for a tax authority to determine how much of this stated capital is funding holding activity and how much is funding operating activity.
• Where an MNE group operates through permanent establishments in some jurisdictions, stated capital and retained earnings are included against the residence jurisdiction of the relevant legal entity in the group, whereas all other items are included against the jurisdiction of the legal entity or the permanent establishment, as appropriate. This will impact the return on stated capital and return on equity of the group in both of these jurisdictions.
• Tax authorities have raised concerns that MNE groups may inject additional capital into certain jurisdictions for BEPS-related purposes (e.g. to reduce the impact of thin capitalisation rules based on a fixed debt/equity ratio). This would also impact the calculation of other ratios which used stated capital or equity.
94. Stated capital and equity can be useful indicators of the scale of an MNE group's footprint in a jurisdiction, but there are several concerns that these may be unreliable measures in some cases. In conducting a tax risk assessment, a tax authority should therefore take into account the level of different measures of activity in a jurisdiction (such as capital, equity, employees, assets and revenues), with the weight given to each varying depending on factors including the group's sector, its activities in a jurisdiction, its structure, its business model, its accounting policies and the tax authority's knowledge and experience of the group, including its attitude to tax risk.
The risk that CbCR information may be used inappropriately
95. Under the Action 13 minimum standard, CbC Reports may be used by tax authorities for the purposes of high level transfer pricing risk assessment, the assessment of other BEPS-related risks, and economic and statistical analysis, where appropriate. CbCR information should not be used as a substitute for a detailed transfer pricing analysis of individual transactions and prices based on a full functional analysis and a full comparability analysis. It should also not be used by tax administrations to propose transfer pricing adjustments based on a global formulary apportionment of income. The requirement that CbCR information is used appropriately is a condition that must be met in order for a tax authority to obtain and use CbC Reports.
96. The commitment by jurisdictions to the appropriate use of CbC Reports is clear and is set out in the competent authority agreements used by tax authorities to operationalise the automatic exchange of CbC Reports. However, there is a risk that, in practice, tax authority staff may use CbCR information in ways that do not comply with this condition, for example to propose adjustments to an entity's income on the basis of an income allocation formula based on the data from the CbC Report. The OECD has released guidance7 to tax
7 OECD, 2017b, Country-by-Country Reporting: Guidance on the Appropriate Use of Information contained in Country-by-Country Reports, www.oecd.org/tax/beps/beps-action-13-on-country-by-country-reporting-appropriate-use-of-information-in-CbC-reports.pdf.

50 – CHAPTER 5 – CHALLENGES TO THE EFFECTIVE USE OF CBC REPORTS FOR TAX RISK ASSESSMENT
COUNTRY-BY-COUNTRY REPORTING - HANDBOOK ON EFFECTIVE TAX RISK ASSESSMENT © OECD 2017
authorities which describes approaches which may be used to ensure the appropriate use of CbCR information, as well as the consequences of non-compliance.
Lack of information concerning a group's sector
97. Another challenge to effective benchmarking may be that CbC Reports do not contain information on an MNE group's sector, although to an extent this may be discerned from information contained in Table 2. Some jurisdictions are in part addressing this issue by linking CbC Reports filed in a jurisdiction to the ultimate parent entity's tax return, which may include industry codes (such as a North American Industry Classification System (NAICS) code, a Statistical Classification of Economic Activities in the European Community (NACE) code or an Australian and New Zealand Standard Industrial Classification (ANZSIC) code). However, only information contained in an MNE group's CbC Report will be automatically exchanged under a jurisdiction's commitment to the Action 13 minimum standard. As these codes do not form part of the CbC Report, they will not be automatically exchanged with tax authorities in other jurisdictions where the group has operations.
Issues concerning disclosure of an entity's main business activity or activities
98. Where an entity in an MNE group is engaged in multiple activities, its group will need to make a subjective assessment as to which of these should be included as the entity's main business activity or activities when completing Table 2. This choice could impact the selection of potential comparables for the entity and influence how a tax authority interprets potential risk indicators.
99. A related risk arises where entities in an MNE group are engaged in different activities, and a tax authority relies on the industry code included in an entity's tax return as part of its risk assessment processes. In this scenario, there is a risk that a particular entity may report in its tax return the industry code of its group (e.g. manufacturing, retail, etc.) or that relevant to its specific activity within the group (e.g. holding company, business support services, etc.). Again, this could impact how the outcomes of a tax risk assessment are interpreted.
Organisation of Table 1 by jurisdiction rather than by sector or activity
100. Many large MNE groups are organised for operational reasons by region and/or sector. Organisation by sector is particularly common in MNE groups which are diversified or have clearly separable activities. The information contained in Table 1 is arranged by tax jurisdiction, making it possible to analyse this data separately for each geographical region. However, where a group has entities engaged in different sectors within a jurisdiction, information on these entities in Table 1 will be aggregated. This makes analysis of the group by sector using CbCR information more difficult.
Information on specific entities may be concealed within jurisdiction-level information in Table 1
101. Other issues connected to the use of CbCR information relate to how the information is presented. One example is that, although the activities of each constituent entity are provided in Table 2, the data contained in Table 1 is compiled at a jurisdictional level. Therefore, where a potential risk indicator would be triggered by a particular characteristic in a certain entity (such as a low number of employees or high proportion of

CHAPTER 5 – CHALLENGES TO THE EFFECTIVE USE OF CBC REPORTS FOR TAX RISK ASSESSMENT – 51
COUNTRY-BY-COUNTRY REPORTING - HANDBOOK ON EFFECTIVE TAX RISK ASSESSMENT © OECD 2017
related party revenue), this may not be evident if there are also other constituent entities in the same jurisdiction. For example, a jurisdiction may include an entity with a very high profit before tax but only a small number of employees, but this may not be apparent from the aggregated data in the MNE group's CbC Report if there are other entities in the group in the same jurisdiction with a large number of employees.
Lack of information on specific transactions undertaken by a group
102. Table 1 and Table 2 contain information on an MNE group analysed at the level of a jurisdiction and at the level of an entity respectively, but do not contain any information on specific transactions. Although Table 1 includes details of the level of aggregated related party revenues in a jurisdiction, the source and precise nature of these revenues is not disclosed. Therefore, although CbC Reports contain useful information for the purposes of conducting a high level risk assessment, this is not sufficient by itself to understand particular transactions within a group. In order to fully understand the risk profile of a group, CbCR information should be read alongside other information held by the tax authority or available from other sources, such as the master file and local file (which contain details of important service arrangements within a group and information on all material categories of controlled transactions involving entities in the jurisdiction). Where a tax authority's analysis of an MNE group's CbC Report indicates a possible tax risk within the group, it is important that the tax authority then identifies transactions in, or connected with, the local jurisdiction that may be impacted by this risk, in order for follow-up questions and further analysis to be properly directed.
Challenges concerning the use of Table 3 in risk assessments
103. Table 3 of the Template allows MNE groups to provide additional information to supplement data contained in Table 1 and Table 2. It is anticipated that many groups will use this Table, which is completed as free text, to explain potential risk flags that may be raised by information in other parts of a return. However, Table 3 poses a number of particular issues for jurisdictions using CbCR information for risk assessment.
104. Many jurisdictions are moving towards increasingly automated systems, which can be designed to incorporate numeric or other defined data fields (e.g. check boxes, country names) into risk assessment tools. However, incorporating free text descriptions into this analysis is significantly more challenging, especially as CbC Reports may be completed in different languages. Tools incorporating "text mining" may be used to search for combinations of key words, but identifying the different combinations that may be used for any given risk is likely to be difficult and this difficulty is multiplied as more risks are investigated. This will also depend on the extent to which Table 3 is used by groups, the types of additional information included and how this information is presented. Greater consistency in how information is presented in Table 3 would facilitate its use in risk assessment. This could be helped through guidance to MNE groups in the use of Table 3, such as the development of standardised disclosures to identify known common false positives, which may be incorporated into automated risk management processes.
105. Where a tax authority uses automated tools to conduct an initial risk assessment, this is usually followed by a manual review before compliance activities are undertaken. Table 3 may be incorporated into this manual review in order to de-select taxpayers which have been flagged by the automated stage for further analysis. However, it is less likely that information in this Table could be used to identify possible high risk taxpayers or arrangements. In other words, if the automated stage does not flag a risk for further
52 – CHAPTER 5 – CHALLENGES TO THE EFFECTIVE USE OF CBC REPORTS FOR TAX RISK ASSESSMENT
COUNTRY-BY-COUNTRY REPORTING - HANDBOOK ON EFFECTIVE TAX RISK ASSESSMENT © OECD 2017
analysis, it is unlikely that the taxpayer will be considered during the manual review phase when Table 3 information may be taken into account. However, jurisdictions may plan to wait until they see how groups use Table 3 in practice before investing in sophisticated text mining technology. This risk may be mitigated where tax authorities incorporate a broad range of different data sources into their risk assessment processes, including Table 1 and Table 2, as well as the master file and local file and other sources referred to in this guidance.
Differences between a jurisdiction's tax risk assessment cycle and the timing of CbC Reports
106. Some challenges with the use of CbCR information for risk assessment are specific to particular jurisdictions. A number of jurisdictions assess all corporate taxpayers based on the same tax year, and aim to conduct their annual risk assessment process and select taxpayers for audit in line with this cycle. Where a tax authority receives a CbC Report directly from the ultimate parent entity of a group, it can time the filing of this report in line with its risk assessment cycle (e.g. by requiring that the CbC Report is filed together with the ultimate parent entity's tax return). However, where a constituent entity in a jurisdiction is not the ultimate parent entity of its group, the group's CbC Report will be filed in accordance with rules in the jurisdiction of the ultimate parent entity, which may permit filing up to 12 months after the group's fiscal year end. These reports will be exchanged with other tax authorities up to 18 months after the group's fiscal year end in the first year of filing, and 15 months after the fiscal year end in subsequent years. Any tax authority may therefore receive CbC Reports throughout the year, and will need to find a way to incorporate these reports into its annual risk assessment, getting maximum value from the reports without disrupting the timing of its ability to select the right number of taxpayers for audit.
Differences in tax risk assessment processes depending on the size of taxpayers in a jurisdiction
107. Many tax authorities limit detailed risk assessment to the largest taxpayers in a jurisdiction, with smaller taxpayers subject to less comprehensive reviews. In these jurisdictions, it is likely that the tax authority will focus on incorporating CbCR information into its risk assessment processes for large taxpayers. However, there may be entities which do not meet the threshold to be considered a large taxpayer in a jurisdiction, but which are nevertheless part of a very large MNE group which files a CbC Report in the jurisdiction of its ultimate parent entity. In these cases, a tax authority may need to find a way to incorporate these entities into the risk assessment process for large taxpayers, either in their entirety or to the extent needed in order to conduct a risk assessment taking into account information contained in a group's CbC Report.
Differences between the constituent entities in a jurisdiction and those included in the local tax group
108. The constituent entities included in an MNE group's CbC Report are those entities which are consolidated into the group's financial accounts under the relevant accounting standards. Under most accounting standards this is likely to be any entity which is more than 50% directly or indirectly controlled by the group's ultimate parent entity. This could include entities which are not treated as part of the tax group in a particular jurisdiction (e.g. because the threshold for forming a tax group is higher than 50%, or because two
CHAPTER 5 – CHALLENGES TO THE EFFECTIVE USE OF CBC REPORTS FOR TAX RISK ASSESSMENT – 53
COUNTRY-BY-COUNTRY REPORTING - HANDBOOK ON EFFECTIVE TAX RISK ASSESSMENT © OECD 2017
entities in the jurisdiction are not directly related and the jurisdiction does not allow tax groups to be formed via an indirect relationship, etc.). Similarly, there may be cases where an entity is part of the tax group in a jurisdiction but is not consolidated into the group's financial accounts (e.g. because the relevant account standards have exemptions from consolidation for certain entities, such as special purpose entities). Any differences in the definition of a group for CbC Reporting purposes and for tax purposes would need to be taken into account when comparing information on the activities in a jurisdiction contained in Table 1 with information on the position of the tax group in that jurisdiction held by the tax authority.
Transitional issues following the introduction of CbC Reporting
109. Some of the challenges to using CbC Reports in risk assessment, in particular around data integrity and consistency, will be a particular issue in the early years of CbC Reporting, as systems are introduced by jurisdictions and groups. For these years, groups may make errors in the preparation of CbCR information which could be difficult for jurisdictions to detect, as they will not have received comparable information previously. This could distort the outcome of a risk assessment for the groups concerned, as well as for those of other groups as the benchmarking for all groups becomes less accurate. Another issue could be if some jurisdictions do not have automated filing systems in place for the first round of CbC Reporting at the end of 2017. This could require some groups to provide reports in a different format, which would impact the ability of tax administrations to use automated systems for risk assessment.
Bibliography
OECD (2017a), Country-by-Country Reporting: Handbook on Effective Implementation, www.oecd.org/tax/beps/country-by-country-reporting-handbook-on-effective-implementation.pdf
OECD (2017b), Country-by-Country Reporting: Guidance on the Appropriate Use of Information contained in Country-by-Country Reports, www.oecd.org/tax/beps/beps-action-13-on-country-by-country-reporting-appropriate-use-of-information-in-CbC-reports.pdf
OECD (2015), OECD/G20 Base Erosion and Profit Shifting Project - Transfer Pricing Documentation and Country-by Country Reporting – Action 13: 2015 Final Report, OECD Publishing, Paris, http://dx.doi.org/10.1787/9789264241480-en.


CHAPTER 6 – USING CBC REPORTS ALONGSIDE DATA FROM OTHER SOURCES – 55
COUNTRY-BY-COUNTRY REPORTING - HANDBOOK ON EFFECTIVE TAX RISK ASSESSMENT © OECD 2017
Chapter 6
Using CbC Reports alongside data from other sources
110. CbC Reports contain important high level information that can be used to identify scenarios which may indicate that an MNE group poses a higher level of tax risk or a lower level of tax risk to a jurisdiction. However, a number of important challenges exist to using this information effectively for the tax risk assessment of groups and arrangements, in particular if it is considered in isolation. Tax authorities currently differ in the extent to which they are able to, or plan to, link the information in CbC Reports to data from other sources. If this can be done, a more effective risk assessment may be conducted by using CbCR information together with other available information on an entity and its group. A tax authority may use CbCR information on its own as an initial filter (e.g. to de-select groups which only have a small presence in the jurisdiction), but other data should also be considered before drawing conclusions that a group poses a material tax risk in a jurisdiction. Information from a variety of sources may be available to assist a tax authority in conducting this analysis. Additional guidance on the content and use of this data in tax risk assessment alongside CbCR information will be included in future editions of this handbook, drawing on tax authority experience.
• Information held by the tax authority
• Information available from other government sources
• Publicly available information
• Commercially available information.
Information held by the tax authority
111. Tax authorities may already hold additional information that may be used alongside a group's CbC Report for risk assessment. The types of information held will vary between tax authorities, but could include the following.
• Tax returns
• Other domestic tax reporting requirements (e.g. disclosures related to CFCs; dealings with related parties; high value transactions; details of interest, dividends and royalties paid; etc.)
• Transfer pricing documentation
− Master file
− Local file
− Transfer pricing returns and questionnaires
56 – CHAPTER 6 – USING CBC REPORTS ALONGSIDE DATA FROM OTHER SOURCES
COUNTRY-BY-COUNTRY REPORTING - HANDBOOK ON EFFECTIVE TAX RISK ASSESSMENT © OECD 2017
− Other transfer pricing documentation required under domestic law
• Information provided by the taxpayer for the purposes of obtaining domestic rulings, APAs, etc.
• Information provided by the taxpayer under a cooperative compliance programme
• Information on tax rulings, etc. granted by foreign tax authorities
• Information received under the Common Reporting Standard / FATCA
• Information received under mandatory disclosure regimes
• Indirect tax information
• Taxpayer file and historic tax records, including tax audit files from prior years
• Other relevant information received from foreign tax authorities under automatic exchange of information or spontaneous exchange of information
• Knowledge held by compliance staff based on their knowledge and experience with the taxpayer, including its attitude to tax risk.
Information available from other government sources
• Reports of large financial transactions held by the Financial Intelligence Unit
• Information held by registers of companies
• Customs information.
Publicly available information
• Financial reports for listed groups (and non-listed groups in some jurisdictions)
• Stock exchange and other public filings
• Annual reports
• Information made available under other country-by-country reporting standards, including CRD IV and EITI, and the EU Accounting Directive8 as it applies to extractive and logging companies.
• Information on the group's website, including published statements on tax policy
• Statistics published by public bodies
• Press reports, the financial and business press and trade magazines.
8 Directive 2013/34/EU.

CHAPTER 6 – USING CBC REPORTS ALONGSIDE DATA FROM OTHER SOURCES – 57
COUNTRY-BY-COUNTRY REPORTING - HANDBOOK ON EFFECTIVE TAX RISK ASSESSMENT © OECD 2017
Commercial sources of information
• Ratings agencies information
• Commercial databases.


CHAPTER 7 - USING THE RESULTS OF A TAX RISK ASSESSMENT BASED ON CBCR INFORMATION – 59
COUNTRY-BY-COUNTRY REPORTING - HANDBOOK ON EFFECTIVE TAX RISK ASSESSMENT © OECD 2017
Chapter 7
Using the Results of a Tax Risk Assessment Based on CbCR Information
112. Risk assessment processes are used to determine the level of risk posed by a particular taxpayer or arrangement to a specific jurisdiction, which can result in a range of potential outcomes. Where no material risk indicators are identified, or indicators identified are not enough to suggest a sufficient level of risk in that jurisdiction, the outcome could be that no further action is required. This should also include that no further information is requested. The mere fact that an MNE group's CbC Report does not provide a clear picture of all of a group's activities and transactions should not be used as the basis for requesting this information, unless the information the CbC Report does contain (together with other available data) suggests that a potential tax risk exists.
113. Where risk indicators are identified, this should trigger an additional manual review, to establish whether the risk flags are incorrect or can be explained taking into account other available information. This review should also focus on whether a potential risk within a group involves entities which are resident or have activities in the jurisdiction undertaking the risk assessment (e.g. where entities in the jurisdiction are making intragroup payments where the transfer pricing may be incorrect). Where transactions involving entities in a jurisdiction appear to be at arm's length, a tax authority should not seek a transfer pricing adjustment simply because CbCR information suggests there may be an unexplained profit elsewhere in the group, although it may initiate a functional and comparability analysis if indicators are present that profit may have been diverted from the tax authority's jurisdiction. Where a tax authority has identified a potential tax risk to a different jurisdiction, it may flag this risk to the tax authority in that jurisdiction using spontaneous exchange of information powers in an applicable tax convention or tax information exchange agreement, but should not seek to make a tax adjustment in its own jurisdiction.
114. The ultimate decision as to whether any compliance intervention is required, and the form this should take, should be made collaboratively between the risk assessment team, the compliance function and other relevant stakeholders within the tax administration. This ensures that the decision takes into account the views of specialists with an understanding of the risks flagged and with experience of the taxpayer, their business and their attitude to tax risk. For example, it may be the case that information held by the tax compliance function can be used to clarify that a potential risk may in fact be explained by wholly commercial considerations. Where the information contained in a CbC Report flags a risk which is inconsistent with the tax compliance function's understanding of the risk profile of the group, this should be thoroughly analysed before subjecting a group to significant compliance activity which may not be warranted, for example, to ensure that any potential risk within the group concerns transactions with or connected to entities which are resident or which have activities in the jurisdiction. Other factors relevant in the decision as to whether further action is required may be the potential amount of tax at stake; the likelihood of success; and the resources that may be required in order to achieve a successful outcome.

60 – CHAPTER 7 - USING THE RESULTS OF A TAX RISK ASSESSMENT BASED ON CBCR INFORMATION
COUNTRY-BY-COUNTRY REPORTING - HANDBOOK ON EFFECTIVE TAX RISK ASSESSMENT © OECD 2017
115. While recognising that a tax authority's resources are limited, tax authorities are encouraged, to the extent possible, to include as part of this review stage consultation with entities within a group, to clarify the information contained in a CbC Report and to understand the possible business reasons underlying factors that appear to pose a potential tax risk. In the majority of cases it will be most practical for these consultations to be conducted unilaterally between a particular tax authority and the local entities in a group. However, given an MNE group's CbC Report may be available to tax authorities in all jurisdictions where the group has operations, and a number of these tax authorities are likely to identify the same or similar potential tax risks, there may also be benefits from a multilateral consultation involving the group and tax authorities from several jurisdictions. This could take different forms, such as joint meetings with the group, co-ordinated information requests, or consultations between tax authorities to discuss issues of interpretation concerning a group's CbC Report. These approaches would have an added advantage in that they could allow tax authorities in different jurisdictions to discuss potential issues directly with the ultimate parent entity of a group, which may have a better understanding of the information contained in the group's CbC Report. They could also allow tax authorities to consult with each other, to ensure a consistent interpretation of the information contained in a CbC Report (or subsequently provided by the group) or an improved understanding of where differences in interpretation exist. However, any multilateral consultation would require some level of resource commitment and co-ordination between the tax authorities involved, and is unlikely to be suitable for all jurisdictions or for use with respect to the assessment of all groups in a jurisdiction.
116. Where it is agreed that the risk assessment process has resulted in incorrect or misleading tax risk indicators being flagged, this should be fed back into the risk assessment process to enable risk assessment tools to be updated and improved. Where the tax risk indicators identified are correct, but a decision is made that no further action should be taken, this decision should be recorded to ensure that a full audit trail is maintained.
117. If a risk assessment does trigger further compliance action, which may include but is not limited to a tax audit, this should be documented and any tax adjustment should be supported by sufficient evidence which is not derived from the CbC Report of the taxpayer's group. The CbC Report is a risk assessment tool which may direct compliance activities but is not a substitute for such activities.
118. A jurisdiction should ensure that governance processes are in place to cover all of the above steps, to ensure that the correct procedures are followed and each decision is fully documented.

ANNEX 1 - MODEL TEMPLATE FOR A CBC REPORT - 61
COUNTRY BY COUNTRY REPORTING: HANDBOOK ON EFFECTIVE TAX RISK ASSESSMENT © OECD 2017
Annex 1
Model template for a Country-by-Country Report
Table 1. Overview of allocation of income, taxes and business activities by tax jurisdiction
Name of the MNE group: Fiscal year concerned:
Currency used:
Tax Jurisdiction Revenues Profit (Loss)
Before Income Tax
Income Tax Paid (on cash
basis)
Income Tax Accrued –
Current Year Stated capital
Accumulated earnings
Number of Employees
Tangible Assets other than Cash
and Cash Equivalents
Unrelated Party Related Party Total

62 – ANNEX 1 - MODEL TEMPLATE FOR A CBC REPORT
COUNTRY-BY-COUNTRY REPORTING - HANDBOOK ON EFFECTIVE TAX RISK ASSESSMENT © OECD 2017
Table 2. List of all the Constituent Entities of the MNE group included in each aggregation per tax jurisdiction
Name of the MNE group: Fiscal year concerned:
Tax Jurisdiction Constituent Entities resident in the Tax
Jurisdiction
Tax Jurisdiction of organisation or
incorporation if different from Tax Jurisdiction of
Residence
Main business activity(ies)
Rese
arch
and D
evelo
pmen
t
Holdi
ng or
Man
aging
intel
lectua
l pr
oper
ty
Purch
asing
or P
rocu
reme
nt
Manu
factur
ing or
Pro
ducti
on
Sales
, Mar
ketin
g or D
istrib
ution
Admi
nistra
tive,
Mana
geme
nt or
Su
ppor
t Ser
vices
Prov
ision
of S
ervic
es to
unre
lated
pa
rties
Inter
nal G
roup
Fina
nce
Regu
lated
Fina
ncial
Ser
vices
Insur
ance
Holdi
ng sh
ares
or ot
her e
quity
ins
trume
nts
Dorm
ant
Othe
r9
1.
2.
3.
1.
2.
3.
9 Please specify the nature of the activity of the Constituent Entity in the “Additional Information” section.

ANNEX 1 - MODEL TEMPLATE FOR A CBC REPORT - 63
COUNTRY BY COUNTRY REPORTING: HANDBOOK ON EFFECTIVE TAX RISK ASSESSMENT © OECD 2017
Table 3. Additional Information
Name of the MNE group: Fiscal year concerned:
Please include any further brief information or explanation you consider necessary or that would facilitate the understanding of the compulsory information provided in the country-by-country report.

64 – ANNEX 2 - TAX RISK INDICATORS THAT MAY BE DETECTED USING A CBC REPORT
COUNTRY-BY-COUNTRY REPORTING - HANDBOOK ON EFFECTIVE TAX RISK ASSESSMENT © OECD 2017
Annex 2
Tax risk indicators that may be detected using a CbC Report
Potential tax risk indicator What this could mean How else it might be explained
The footprint of a group in a jurisdiction A group with a small footprint may have less potential to pose significant tax risk
A low footprint on a CbC Report could be misleading if the activities in a jurisdiction are more significant. This should be corroborated against other information and the experience of the tax compliance team.
A group's activities in a jurisdiction are limited to those that pose less risk
A group's activities in a jurisdiction may be of a type that are subject to a lower level of tax (e.g. where dividends and gains earned by a holding entity benefit from a participation exemption)
An entity whose main activity would typically pose lower tax risk may still engage in BEPS. Other available information should be considered for indicators that taxable income in the jurisdiction should be higher.
There is a high value or high proportion of related party revenues in a particular jurisdiction
A high value or proportion of related party revenues might mean that even a small transfer pricing error could have a significant tax impact.
Groups may include entities that deal wholly or mainly with related parties for commercial reasons
The results in a jurisdiction deviate from potential comparables Differences between a jurisdiction and the chosen comparable could be driven by BEPS
The chosen comparable may be unreliable, or there may be commercial factors to explain any difference
The results in a jurisdiction do not reflect market trends Results may be being distorted by BEPS activity Results may be being impacted by commercial considerations
There are jurisdictions with significant profits but little substantial activity
Profits may have been shifted away from the jurisdiction where the underlying economic activity is occurring
There may be commercial reasons why results in a jurisdiction may seem high relative to the activity measures in a CbC Report (e.g. due to tangible assets being heavily depreciated, or intangible assets that are not disclosed)
There are jurisdictions with significant profits but low levels of tax accrued
A low effective tax rate to indicate that a group is using BEPS to shelter taxable income
Non-BEPS reasons may explain low levels of tax accrued (e.g. accelerated tax depreciation)
There are jurisdictions with significant activities but low levels of profit (or losses)
Profits that are attributable to a jurisdiction may be being shifted to a jurisdiction where they are taxed more favourably
Some activities within a group may be more asset-intensive or staff-intensive than others (e.g. administrative functions may have a low profit per employee compared to the group)
A group has activities in jurisdictions which pose a BEPS risk A group may be engaged in a known BEPS-related activity There may be non-BEPS reasons to explain why a group has activities in a particular jurisdiction

ANNEX 2 - TAX RISK INDICATORS THAT MAY BE DETECTED USING A CBC REPORT - 65
COUNTRY BY COUNTRY REPORTING: HANDBOOK ON EFFECTIVE TAX RISK ASSESSMENT © OECD 2017
Potential tax risk indicator What this could mean How else it might be explained
A group has mobile activities located in jurisdictions where the group pays a lower rate or level of tax
A group may have shifted mobile activities to a jurisdiction to benefit from a favourable tax regime
Profit from mobile activities may be correctly attributable to the low tax jurisdiction so long as there is sufficient activity, transfer prices are at arm's length and there is no other indicator of BEPS
There have been changes in a group's structure, including the location of assets
Changes in a group's structure may be an opportunity for a group to engage in BEPS and could mean a need to revisit existing transfer pricing policies and methodologies, and re-consider the identification and pricing of related party transactions
Changes in a group's structure may be driven wholly by commercial considerations, even where the result is less tax paid in a particular jurisdiction.
IP is separated from related activities within a group Valuable IP may be used to strip taxable profit from other jurisdictions
IP may be held in a particular jurisdiction for non-BEPS purposes. So long as the royalties paid for use of IP are arm's length and there are no other indicators of BEPS, the tax risk to a jurisdiction may be low.
A group has marketing entities located in jurisdictions outside its key markets
Marketing entities could be earning profits that are not attributable to the jurisdictions where they are resident
Historic or commercial factors may explain the use of marketing entities in particular jurisdictions
A group has procurement entities located in jurisdictions outside its key manufacturing locations
Procurement entities could be earning profits that are not attributable to the jurisdictions where they are resident
Historic or commercial factors may explain the use of procurement entities in particular jurisdictions
Income tax paid is consistently lower than income tax accrued A group may be making high tax accruals for uncertain tax positions, which could indicate BEPS-related behaviour
Non-BEPS factors such as tax losses carried forward or legitimate uncertainty in a tax position could explain differences between current year tax accrued and tax paid
A group includes dual resident entities Dual resident entities can be used for a number of BEPS purposes Most entities that list different jurisdictions of residence and incorporation in Table 2 will not be dual resident (due to the operation of a tie-breaker in the applicable tax treaty)
A group includes entities with no tax residence No residence entities can be used for a number of BEPS purposes In many cases, an entity that is not tax resident anywhere will be transparent for tax purposes, and its profit may be taxable on a constituent entity elsewhere in the group
A group discloses stateless revenues in Table 1 Stateless revenue may indicate a BEPS risk if the revenue is not taken into account for tax purposes in any jurisdiction
In many cases, the revenue may be taxable on a constituent entity elsewhere in the group
Information in a group's CbC Report does not correspond with information previously provided by a constituent entity
This could question the accuracy of both the CbC Report and the information previously provided by a constituent entity
Other reasons may be identified to explain a potential difference, such as changes in a group's structure or activities since information was previously provided to a tax authority

66 – ANNEX 3 - EXAMPLE USE OF A CBC REPORT FOR TAX RISK ASSESSMENT
COUNTRY-BY-COUNTRY REPORTING - HANDBOOK ON EFFECTIVE TAX RISK ASSESSMENT © OECD 2017
Annex 3
Example Use of a CbC Report for Tax Risk Assessment10
119. MNE SA is the ultimate parent entity in a fictional multinational group involved in the manufacture and sale of consumer goods. MNE SA is resident in Country A, and the group has entities based in 26 jurisdictions across Europe, the Americas and Asia-Pacific. The group has a fiscal year end of 31 December. At the time of this Example, MNE SA has submitted two CbC Reports (for the year ended 31 December 2016 and 31 December 2017), which were filed with the Country A tax authority and exchanged with tax authorities in other jurisdictions where the group has operations. This Example illustrates how these tax authorities could use the information contained in Table 1 and Table 2 of the CbC Reports within an initial assessment to identify potential tax risks, or areas where additional information is required. It is anticipated that, in many jurisdictions, the initial tax assessment will look at many of the same potential risk indicators, although the specific algorithms used will vary. However, once the potential risks indicators have been identified, tax authorities will vary in terms of which they see as posing a possible tax risk in their jurisdiction. For example, as the residence jurisdiction of the ultimate parent entity, the Country A tax authority may request further information on many or all of the potential issues flagged in the initial assessment. However, tax authorities in other jurisdictions should limit their enquiries to risks that concern resident entities, or which concern transactions that a resident entity may be party to.
Tax risk assessment processes used
120. This example illustrates how an initial tax risk assessment could be conducted using a group's CbC Report. For these purposes it is assumed that the initial risk assessment does not take into account any other information available to a tax authority. The risk assessment uses simple tools to test the group for the various risk indicators described in this guidance. This assessment may be conducted manually, but there are benefits to a more automated approach in terms of the ability to process large quantities of data quickly, as well as the ability to detect possible patterns taking into account multiple indicators, which may then be considered during a manual second stage. To reflect the fact that in many jurisdictions the initial stage will be automated, and the difficulties currently anticipated in incorporating the free text contained in Table 3 into an automated process, this Example relies solely on information contained in Table 1 and Table 2. It is expected that other data available to the tax authority, such as additional information provided in Table 3, will be taken into account by tax officials in the relevant jurisdiction in deciding whether potential risk indicators can be explained or if further review is needed in order to determine if any compliance action is required and the nature of that action.
121. The initial risk assessment comprises the following steps:
10 Further examples will be included in future editions of this handbook, based on the experience of jurisdictions in using CbC Reports in tax risk assessment.
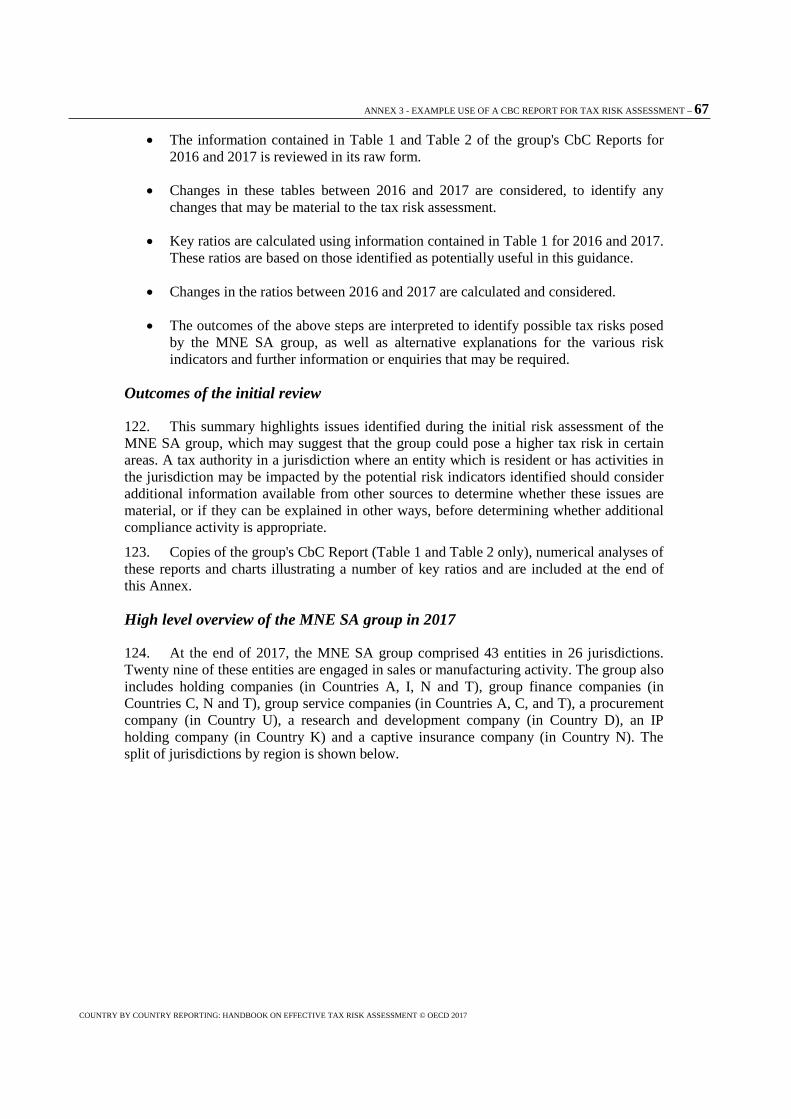
ANNEX 3 - EXAMPLE USE OF A CBC REPORT FOR TAX RISK ASSESSMENT – 67
COUNTRY BY COUNTRY REPORTING: HANDBOOK ON EFFECTIVE TAX RISK ASSESSMENT © OECD 2017
• The information contained in Table 1 and Table 2 of the group's CbC Reports for 2016 and 2017 is reviewed in its raw form.
• Changes in these tables between 2016 and 2017 are considered, to identify any changes that may be material to the tax risk assessment.
• Key ratios are calculated using information contained in Table 1 for 2016 and 2017. These ratios are based on those identified as potentially useful in this guidance.
• Changes in the ratios between 2016 and 2017 are calculated and considered.
• The outcomes of the above steps are interpreted to identify possible tax risks posed by the MNE SA group, as well as alternative explanations for the various risk indicators and further information or enquiries that may be required.
Outcomes of the initial review
122. This summary highlights issues identified during the initial risk assessment of the MNE SA group, which may suggest that the group could pose a higher tax risk in certain areas. A tax authority in a jurisdiction where an entity which is resident or has activities in the jurisdiction may be impacted by the potential risk indicators identified should consider additional information available from other sources to determine whether these issues are material, or if they can be explained in other ways, before determining whether additional compliance activity is appropriate.
123. Copies of the group's CbC Report (Table 1 and Table 2 only), numerical analyses of these reports and charts illustrating a number of key ratios and are included at the end of this Annex.
High level overview of the MNE SA group in 2017
124. At the end of 2017, the MNE SA group comprised 43 entities in 26 jurisdictions. Twenty nine of these entities are engaged in sales or manufacturing activity. The group also includes holding companies (in Countries A, I, N and T), group finance companies (in Countries C, N and T), group service companies (in Countries A, C, and T), a procurement company (in Country U), a research and development company (in Country D), an IP holding company (in Country K) and a captive insurance company (in Country N). The split of jurisdictions by region is shown below.

68 – ANNEX 3 - EXAMPLE USE OF A CBC REPORT FOR TAX RISK ASSESSMENT
COUNTRY-BY-COUNTRY REPORTING - HANDBOOK ON EFFECTIVE TAX RISK ASSESSMENT © OECD 2017
Europe Americas Asia-Pacific
A
B
C
D
E
F
G
H
I
J
K
L
M
N
O
P
Q
R
S
T
U
V
W
X
Y
Z
125. In 2017, all jurisdictions where the group has activities were profitable. In Europe, the group's performance was largely stable, possibly reflecting the fact that this may be a mature market for the group. In the Americas, all key jurisdictions experienced growth in revenues and a small improvement in profit margins. In Asia-Pacific, all jurisdictions experienced growth in revenues but a number of these also saw a fall in profit margins. The exceptions to this are Countries T, U and Z which increased in profitability.
126. Between 2016 and 2017 there were two changes to the group structure. First, an IP holding company in Country Q is included in Table 2 in 2016 but not in 2017. Following this change, Country K is the only IP holding jurisdiction in the group. Second, there is a new manufacturing entity in Country H. It is not known whether this was established by the group or acquired from outside.
Sales and manufacturing activity in Asia-Pacific earns lower returns than that in other regions
127. The group has operating entities (i.e. those engaged in sales, manufacturing and related activities) in 21 jurisdictions across Europe, the Americas and Asia-Pacific. In 2017, most of these entities earned total revenues per employee ratio of between EUR 92 000 and EUR 172 000 and within this range there is no noticeable difference between entities in the three regions.
128. However, although sales and manufacturing entities earn similar levels of revenue per employee across the group, there is a marked difference between the profit margins earned by entities in different regions.
• In Europe, most jurisdictions with sales or manufacturing activities earn a profit margin of between 10% and 14%. The exception is Country H (with a profit margin of 2%), but this is a new member of the group in 2017 and is discussed below.
• In the Americas, all jurisdictions with sales or manufacturing activities earn a profit margin of between 9% and 11%.

ANNEX 3 - EXAMPLE USE OF A CBC REPORT FOR TAX RISK ASSESSMENT – 69
COUNTRY BY COUNTRY REPORTING: HANDBOOK ON EFFECTIVE TAX RISK ASSESSMENT © OECD 2017
• In Asia-Pacific, all jurisdictions with sales or manufacturing entities (other than Countries U and Z) earn a profit margin of between 3% and 5%. Country U earns a profit margin of 58% and Country Z earns a profit margin of 29%).
129. There are a number of reasons why entities engaged in similar activities may earn different margins in different regions (e.g. differences in production costs or market penetration). However, the fact that the two entities in Countries U and Z have significantly higher profit margins than other entities in the region could flag a possible tax risk. This is supported by a number of other factors:
• Both of these entities earn substantially all of their revenues from related parties (95% in Country U and 98% in Country Z). The Country U entity is engaged in procurement. The Country Z entity is described as involved in "sales, marketing and distribution" in Table 2, but the fact that it earns its income from related parties suggests that its activities are more likely to be either marketing or distribution on behalf of other group entities, rather than sales.
• Assuming the Country Z entity is engaged in marketing or distribution, the group has no sales or manufacturing activity in either Country U or Country Z. This raises a question as to why the group would place its procurement and marketing/distribution centres in these jurisdictions.
• Activities in Countries U and Z have a significantly lower effective tax rate that those in other jurisdictions in the region.
• Between 2016 and 2017, the revenues of sales and manufacturing entities in the Asia-Pacific region increased by between 15% and 55%, while profit before tax increased by between 2% and 9%. On the other hand, in Country U revenues increased by 23% and profits increased by 29%, while in Country Z revenues increased by 9% and profits by 15%. Therefore while revenues increased in all entities, profit margins increased in Countries U and Z but fell in all of the other jurisdictions.
130. Tax authorities in jurisdictions where the group has sale or manufacturing activities in the Asia-Pacific region may request further information on the activities of the entities in Countries U and Z and on the pricing of intragroup payments to these entities.
Disposal or liquidation of MNE IP Holdings (Q) Co and possible transfer of IP from Country Q to Country K
131. In 2016, Table 2 includes both a Country K resident entity and a Country Q resident entity, whose activities include the holding or management of IP. In 2017, the Country Q resident entity is not included in the CbC Report. This could be explained in a number of ways, including
• The Country Q entity, together with the IP it was holding, may have been disposed of outside the group.
• The Country Q entity could have been liquidated, and the IP it held transferred to Country K.

70 – ANNEX 3 - EXAMPLE USE OF A CBC REPORT FOR TAX RISK ASSESSMENT
COUNTRY-BY-COUNTRY REPORTING - HANDBOOK ON EFFECTIVE TAX RISK ASSESSMENT © OECD 2017
• A combination of the above (i.e. part of the IP held by Country Q could have been transferred to the Country K, followed by the disposal of the Country Q entity and any remaining IP).
132. Tax authorities in Countries K and Q will be interested to ensure that any intragroup transfer of IP has been priced correctly. The Country Q tax authority will want to ensure that any gains or losses on the disposal of the Country Q entity and/or the sale or transfer of IP have been correctly taxed. Tax authorities in Country K and in other jurisdictions where the IP is used will need to ensure that any royalties paid to Country K are correctly priced in 2017 and future years.
Substantial differences between the increase in revenues, profits and accrued income tax in Country K between 2016 and 2017
133. In Country K, between 2016 and 2017 total revenues increased by 44%, profit before tax increased by 106% and accrued income tax for the current year increased by 52%. This means that the profit margin for the Country K sub-group has increased from 10% to 14%, while the effective tax rate has fallen from 21% to 16%.
134. The Country K tax authority would require more information to understand the drivers behind these changes. One possible explanation for the increase in profit margin could be if valuable IP has been transferred from Country Q to Country K. As the margins for managing and holding IP are typically higher than those from sales and manufacturing (the other activities in Country K), this could explain why profit before tax has increased more rapidly than revenues over this period. This would be supported by the fact that most of the increase in revenues is from related parties.
135. The fall in effective tax rate may also be explained if the income generated by IP benefits from the Country K IP box (which reduces the tax rate applied to income from certain IP assets). If this is the case then, as it appears the IP may have been transferred from outside Country K, the authority may wish to make enquiries to confirm that the IP qualifies for the reduced tax rate.
Newly acquired Country H entity with very low profit margin
136. Table 2 for 2017 includes a Country H resident entity which was not included in the table in 2016. This could be a newly incorporated entity, or one acquired from outside the group. For 2017, the entity has total revenues of EUR 47 842 000, and profit before tax of EUR 836 000. This gives the Country H operations a profit margin of 2%, significantly lower than the average profit margin for the European region, which is approximately 11%.
137. The Country H tax authority may require further information to understand this very low level of margin compared to the rest of the region. It may be connected to high start-up costs, or legitimate business costs incurred in assimilating an acquired entity into the group. However, it may also be due to tax planning, such as an excessive debt pushdown (beyond that needed to align net interest expense with taxable economic activity) or an intragroup hybrid financial instrument.
In Country I, revenues increase but profit margins fall significantly
138. Table 1 shows that the Country I holding company increased its revenues by 313% between 2016 and 2017, while its profit before tax increased by 44%. This means that the group's profit margin in Country I fell from 11% to 4%. The reason for this is not clear, and
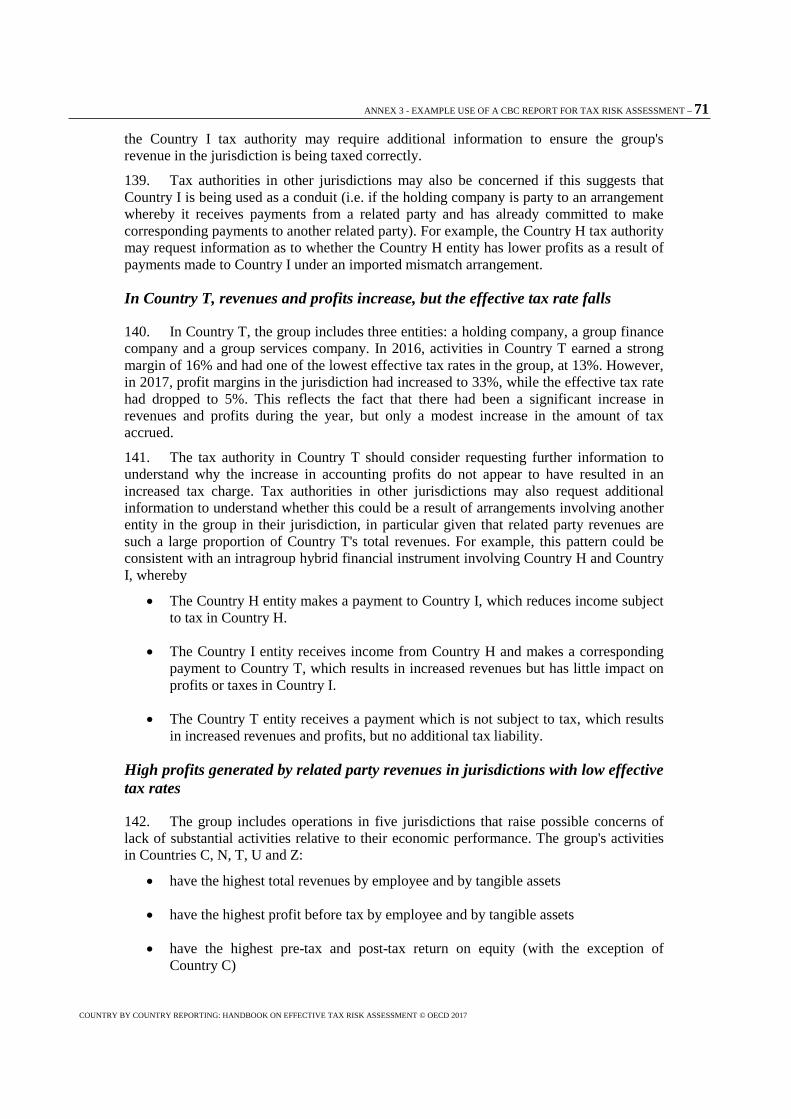
ANNEX 3 - EXAMPLE USE OF A CBC REPORT FOR TAX RISK ASSESSMENT – 71
COUNTRY BY COUNTRY REPORTING: HANDBOOK ON EFFECTIVE TAX RISK ASSESSMENT © OECD 2017
the Country I tax authority may require additional information to ensure the group's revenue in the jurisdiction is being taxed correctly.
139. Tax authorities in other jurisdictions may also be concerned if this suggests that Country I is being used as a conduit (i.e. if the holding company is party to an arrangement whereby it receives payments from a related party and has already committed to make corresponding payments to another related party). For example, the Country H tax authority may request information as to whether the Country H entity has lower profits as a result of payments made to Country I under an imported mismatch arrangement.
In Country T, revenues and profits increase, but the effective tax rate falls
140. In Country T, the group includes three entities: a holding company, a group finance company and a group services company. In 2016, activities in Country T earned a strong margin of 16% and had one of the lowest effective tax rates in the group, at 13%. However, in 2017, profit margins in the jurisdiction had increased to 33%, while the effective tax rate had dropped to 5%. This reflects the fact that there had been a significant increase in revenues and profits during the year, but only a modest increase in the amount of tax accrued.
141. The tax authority in Country T should consider requesting further information to understand why the increase in accounting profits do not appear to have resulted in an increased tax charge. Tax authorities in other jurisdictions may also request additional information to understand whether this could be a result of arrangements involving another entity in the group in their jurisdiction, in particular given that related party revenues are such a large proportion of Country T's total revenues. For example, this pattern could be consistent with an intragroup hybrid financial instrument involving Country H and Country I, whereby
• The Country H entity makes a payment to Country I, which reduces income subject to tax in Country H.
• The Country I entity receives income from Country H and makes a corresponding payment to Country T, which results in increased revenues but has little impact on profits or taxes in Country I.
• The Country T entity receives a payment which is not subject to tax, which results in increased revenues and profits, but no additional tax liability.
High profits generated by related party revenues in jurisdictions with low effective tax rates
142. The group includes operations in five jurisdictions that raise possible concerns of lack of substantial activities relative to their economic performance. The group's activities in Countries C, N, T, U and Z:
• have the highest total revenues by employee and by tangible assets
• have the highest profit before tax by employee and by tangible assets
• have the highest pre-tax and post-tax return on equity (with the exception of Country C)

72 – ANNEX 3 - EXAMPLE USE OF A CBC REPORT FOR TAX RISK ASSESSMENT
COUNTRY-BY-COUNTRY REPORTING - HANDBOOK ON EFFECTIVE TAX RISK ASSESSMENT © OECD 2017
• have the highest profit margins (with the exception of the Country K, which holds the group's IP in 2017)
• have the lowest effective tax rates (with the exception of Country G)
• receive most of their revenues from related parties.
143. Countries C, N, and T include entities engaged in group finance, providing administrative, management or support services and/or holding companies. Country N also includes an entity providing insurance services to other members of the group. These activities naturally involve dealing with related parties, and typically require a small number of employees (compared with the manufacturing and sales activities in other parts of the group). However, tax authorities in all jurisdictions where the group has operations may request further information to establish whether resident group members make payments to these entities. Where payments to these entities are made, further information may be required to better understand the extent of the activities in these three jurisdictions, and the pricing of the intragroup payments.
144. The entity in Country U provides procurement services and the entity in Country Z provides marketing and/or distribution to entities in the Asia-Pacific region. Potential tax risks posed by these entities are discussed elsewhere.
Next steps
145. The information contained in a group's CbC Report may be used for high level transfer pricing risk assessment and the assessment of other BEPS-related risks. Where the potential tax risks raised in this initial assessment concern a particular jurisdiction, the tax authority in that jurisdiction may make further enquiries in order to establish whether a material risk does exist and, if so, what further compliance actions are required. The results of this assessment using CbCR information cannot be taken as conclusive evidence that the submitted tax position is incorrect and cannot be used as a basis for the global formulary apportionment of income. Therefore no tax adjustments should be proposed on the basis of this initial analysis.

ANNEX 3 - EXAMPLE USE OF A CBC REPORT FOR TAX RISK ASSESSMENT - 73
COUNTRY BY COUNTRY REPORTING - HANDBOOK ON EFFECTIVE TAX RISK ASSESSMENT © OECD 2017
Unrelated party Related Party Total
A 610315000 515510000 1125825000 114565000 41300000 38870000 87500000 450000000 8965 874385000B 29271000 412000 29683000 3678000 1344000 1231000 4000000 15629000 260 5973000C 6313000 19053000 25366000 3293000 619000 508000 3500000 12111000 15 1023000D 81851000 188351000 270202000 29040000 8510000 8266000 22000000 80380000 2074 273981000E 15667000 1456000 17123000 1728000 486000 378000 2000000 8570000 150 2645000F 65224000 52533000 117757000 13502000 3424000 3320000 10500000 46161000 949 109317000G 14022000 1622000 15644000 1659000 231000 185000 1000000 7669000 96 2531000H 1450000 46392000 47842000 836000 296000 248000 7000000 526000 520 82512000I 89000 5527000 5616000 216000 56000 34000 500000 1536000 10 775000J 14226000 1320000 15546000 1727000 318000 281000 2000000 10852000 131 3062000K 57694000 111743000 169437000 23394000 4182000 3700000 15000000 64200000 987 129300000L 23785000 512000 24297000 2351000 934000 850000 4000000 5016000 241 3725000M 64962000 98833000 163795000 15951000 5898000 5543000 20000000 36199000 1520 129902000N 7373000 39803000 47176000 22288000 0 0 1750000 3498000 13 544000O 57292000 5823000 63115000 5629000 1583000 1421000 12000000 12851000 615 8163000P 13981000 128000 14109000 1582000 389000 376000 2500000 2634000 134 2265000Q 110896000 125595000 236491000 24415000 9142000 8466000 30000000 60414000 1840 279533000R 34811000 247000 35058000 1841000 712000 502000 6000000 3084000 313 3645000S 56989000 87390000 144379000 6943000 1970000 1741000 20000000 14794000 1296 11202000T 1945000 17537000 19482000 6338000 475000 321000 4000000 2201000 28 1274000U 379000 6812000 7191000 4189000 198000 165000 1000000 505000 7 812000V 31299000 70120000 101419000 5343000 1720000 1530000 14000000 8641000 939 79505000W 75998000 4012000 80010000 2598000 837000 799000 3000000 8099000 565 4593000X 3871000 841000 4712000 212000 89000 49000 500000 461000 31 446000Y 7562000 912000 8474000 327000 154000 107000 1200000 698000 63 806000Z 814000 34379000 35193000 10274000 1295000 1217000 383000 5576000 16 3372000
Accumulated Earnings
Number of Employees
Tangible Assets other than Cash and Cash
Equivalents
Table 1. Overview of allocation of income, taxes and business activities by tax jurisdiction
Name of the MNE Group: MNE SAFiscal year concerned: 31 12 2017
Currency used: EURTax jurisdiction Revenues Profit (Loss)
before Income Tax
Income Tax Paid (on Cash
Basis)
Income Tax Accrued -
Current Year
Stated Capital
MNE SA Group – CbC Reports and Analyses
CbC Report for Year Ended 31 December 2017

74 – ANNEX 3 - EXAMPLE USE OF A CBC REPORT FOR TAX RISK ASSESSMENT
COUNTRY-BY-COUNTRY REPORTING - HANDBOOK ON EFFECTIVE TAX RISK ASSESSMENT © OECD 2017
Rese
arch
and
Dev
lopm
ent
Hold
ing
or M
anag
ing
Inte
llect
ual P
rope
rty
Purc
hasi
ng o
r Pro
cure
men
t
Man
ufac
turin
g or
Pro
duct
ion
Sale
s, M
arke
ting
or
Dist
ribut
ion
Adm
inis
trativ
e,
Man
agem
ent o
r Sup
port
Serv
ices
Prov
isio
n of
Ser
vice
s to
Un
rela
ted
Parti
es
Inte
rnal
Gro
up F
inan
ce
Regu
late
d Fi
nanc
ial
Serv
ices
Insu
ranc
e
Hold
ing
Shar
es o
r Oth
er
Equi
ty In
stru
men
ts
Dorm
ant
Oth
er
MNE Manufacturing (A) Co XMNE Sales (A) Co XMNE Services (A) Co XMNE Holdings (A) Co X
B MNE Sales (B) Co XMNE Services (C) Co XMNE Finance (C) Co XMNE Research & Development (D) Co XMNE Manufacturing (D) Co XMNE Sales (D) Co X
E MNE Sales (E) Co XMNE Manufacturing (F) Co XMNE Sales (F) Co X
G MNE Sales (G) Co XH MNE Manufacturing (H) Co XI MNE Holdings (I) Co XJ MNE Sales (J) Co X
MNE IP Holdings (K) Co XMNE Manufacturing (K) Co XMNE Sales (K) Co X
L MNE Sales (L) Co XMNE Sales (M) Co XMNE Manufacturing (M) Co XMNE Finance (N) Co XMNE Insurance (N) Co XMNE Holdings (N) Co X
O MNE Sales (O) Co XP MNE Sales (P) Co X
MNE Manufacturing (Q) Co X XMNE Sales (Q) Co
R MNE Sales (R) Co XMNE Manufacturing (S) Co XMNE Sales (S) Co XMNE Services (T) Co XMNE Finance (T) Co XMNE Holdings (T) Co X
U MNE Procurement (U) Co XMNE Manufacturing (V) Co XMNE Sales (V) Co X
W MNE Sales (W) Co XX MNE Sales (X) Co XY MNE Sales (Y) Co XZ MNE Sales (Z) Co X
Table 2: List of all the Constituent Entities of the MNE group included in each aggregation per tax jurisdiction
Name of the MNE group: MNE SA
Fiscal year concerned: 31 12 2017
Tax jurisdictionConstituent Entities Resident in the Tax
Jurisdiction
Tax Jurisdiction of Organisation or
Incorporation if Different from Tax Jurisdiction of
Residence
Main Business Activity(ies)
A
T
V
K
Q
N
C
S
D
F
M

ANNEX 3 - EXAMPLE USE OF A CBC REPORT FOR TAX RISK ASSESSMENT - 75
COUNTRY BY COUNTRY REPORTING - HANDBOOK ON EFFECTIVE TAX RISK ASSESSMENT © OECD 2017
Unrelated party Related Party Total
A 601745000 509460000 1111205000 111920000 41995000 36920000 87500000 405660000 8260 822825000B 28955000 465000 29420000 3678000 1276000 1189000 4000000 14337000 241 5738000C 5866000 19258000 25124000 3166000 537000 472000 3500000 11162000 14 998000D 80782000 186283000 267065000 30390000 8336000 8135000 22000000 72787000 1940 253666000E 16411000 1250000 17661000 1893000 475000 420000 2000000 7872000 140 2896000F 64051000 53053000 117104000 11983000 3275000 3029000 10500000 41893000 879 99670000G 13909000 1522000 15431000 1429000 192000 172000 1000000 7588000 91 2387000I 96000 1265000 1361000 150000 57000 34000 500000 1394000 8 721000J 13772000 1550000 15322000 1850000 288000 275000 2000000 9884000 120 2859000K 56374000 61101000 117475000 11352000 2651000 2429000 8000000 52730000 905 121536000L 21760000 540000 22300000 1964000 721000 700000 4000000 4572000 228 3535000M 58886000 89944000 148830000 13404000 5283000 4784000 20000000 34031000 1420 126110000N 5956000 34958000 40914000 18452000 0 0 1750000 2989000 12 512000O 52809000 5411000 58220000 5045000 1543000 1322000 12000000 11748000 576 7633000P 11502000 150000 11652000 1025000 299000 280000 2500000 2359000 126 1643000Q 101071000 162955000 264026000 29271000 10736000 10136000 34000000 58839000 1717 259366000R 28750000 260000 29010000 1802000 498000 469000 6000000 2710000 295 3164000S 46137000 79344000 125481000 6752000 1779000 1574000 20000000 13480000 1217 10421000T 2155000 11859000 14014000 2253000 421000 304000 4000000 1994000 30 1217000U 340000 5500000 5840000 3250000 190000 160000 1000000 462000 6 738000V 26071000 61140000 87211000 5024000 1767000 1622000 14000000 7865000 869 72071000W 66581000 4301000 70882000 2389000 845000 765000 3000000 7330000 521 4275000X 3420000 752000 4172000 205000 76000 56000 500000 421000 27 412000Y 4599000 875000 5474000 310000 102000 94000 1200000 631000 59 645000Z 982000 31165000 32147000 8963000 1847000 1000000 383000 5043000 16 3169000
Accumulated Earnings
Number of Employees
Tangible Assets other than Cash and Cash
Equivalents
Table 1. Overview of allocation of income, taxes and business activities by tax jurisdiction
Name of the MNE Group: MNE SAFiscal year concerned: 31 12 2016
Currency used: EURTax jurisdiction Revenues Profit (Loss)
before Income Tax
Income Tax Paid (on Cash
Basis)
Income Tax Accrued -
Current Year
Stated Capital
CbC Report for year ended 31 December 2016

76 – ANNEX 3 - EXAMPLE USE OF A CBC REPORT FOR TAX RISK ASSESSMENT
COUNTRY-BY-COUNTRY REPORTING - HANDBOOK ON EFFECTIVE TAX RISK ASSESSMENT © OECD 2017
Rese
arch
and
Dev
lopm
ent
Holdi
ng o
r Man
aging
In
telle
ctua
l Pro
perty
Purc
hasin
g or
Pro
cure
men
t
Man
ufac
turin
g or
Pro
duct
ion
Sales
, Mar
ketin
g or
Di
strib
ution
Adm
inist
rativ
e,
Man
agem
ent o
r Sup
port
Serv
ices
Prov
ision
of S
ervic
es to
Un
relat
ed P
artie
s
Inte
rnal
Grou
p Fi
nanc
e
Regu
lated
Fina
ncial
Se
rvice
s
Insu
ranc
e
Holdi
ng S
hare
s or
Oth
er
Equit
y In
stru
men
ts
Dorm
ant
Othe
r
MNE Manufacturing (A) Co XMNE Sales (A) Co XMNE Services (A) Co XMNE Holdings (A) Co X
B MNE Sales (B) Co XMNE Services (C) Co XMNE Finance (C) Co XMNE Research & Development (D) Co XMNE Manufacturing (D) Co XMNE Sales (D) Co X
E MNE Sales (E) Co XMNE Manufacturing (F) Co XMNE Sales (F) Co X
G MNE Sales (G) Co XI MNE Holdings (I) Co XJ MNE Sales (J) Co X
MNE IP Holdings (K) Co XMNE Manufacturing (K) Co XMNE Sales (K) Co X
L MNE Sales (L) Co XMNE Sales (M) Co XMNE Manufacturing (M) Co XMNE Finance (N) Co XMNE Insurance (N) Co XMNE Holdings (N) Co X
O MNE Sales (O) Co XP MNE Sales (P) Co X
MNE Manufacturing (Q) Co XMNE Sales (Q) Co XMNE IP Holdings (Q) Co X
R MNE Sales (R) Co XMNE Manufacturing (S) Co XMNE Sales (S) Co XMNE Services (T) Co XMNE Finance (T) Co XMNE Holdings (T) Co X
U MNE Procurement (U) Co XMNE Manufacturing (V) Co XMNE Sales (V) Co X
W MNE Sales (W) Co XX MNE Sales (X) Co XY MNE Sales (Y) Co XZ MNE Sales (Z) Co X
V
T
A
Table 2: List of all the Constituent Entities of the MNE group included in each aggregation per tax jurisdiction
Main Business Activity(ies)
Tax jurisdictionConstituent Entities Resident in the Tax
Jurisdiction
Tax Jurisdiction of Organisation or
Incorporation if Different from Tax Jurisdiction of
Residence
Fiscal year concerned: 31 12 2016
Name of the MNE group: MNE SA
F
S
C
N
M
D
Q
K

ANNEX 3 - EXAMPLE USE OF A CBC REPORT FOR TAX RISK ASSESSMENT - 77
COUNTRY BY COUNTRY REPORTING - HANDBOOK ON EFFECTIVE TAX RISK ASSESSMENT © OECD 2017
Proporation of revenues
from unrelated
parties
Proportion of revenues
from related parties
Revenues generated per
employee
Pre-tax profit generated per
employee
Revenues generated per
EUR of tangible assets
Pre-tax profit generated per
EUR of tangible assets
Pre-tax return on equity
Post-tax return on
equityProfit margin Effective tax
rate
Unrelated party revenues /
Total revenues
Related party revenues /
Total revenues
Total revenues / Number of employees
'000
Profit before tax / Number of employees
'000
Total revenues / Tangible
assets '000
Profit before tax / Tangible
assets '000
Profit before tax / (Stated
capital + retained earnings)
(Profit before tax - Income tax accrued) / (Stated capital + accumulated
earnings)
Profit before tax / Total revenues
Income tax accrued /
Profit before tax
A 54% 46% 126 13 1.29 0.13 21% 14% 10% 34%B 99% 1% 114 14 4.97 0.62 19% 12% 12% 33%C 25% 75% 1 691 220 24.80 3.22 21% 18% 13% 15%D 30% 70% 130 14 0.99 0.11 28% 20% 11% 28%E 91% 9% 114 12 6.47 0.65 16% 13% 10% 22%F 55% 45% 124 14 1.08 0.12 24% 18% 11% 25%G 90% 10% 163 17 6.18 0.66 19% 17% 11% 11%H 3% 97% 92 2 0.58 0.01 11% 8% 2% 30%I 2% 98% 562 22 7.25 0.28 11% 9% 4% 16%
J 92% 8% 119 13 5.08 0.56 13% 11% 11% 16%K 34% 66% 172 24 1.31 0.18 30% 25% 14% 16%L 98% 2% 101 10 6.52 0.63 26% 17% 10% 36%M 40% 60% 108 10 1.26 0.12 28% 19% 10% 35%N 16% 84% 3 629 1 714 86.72 40.97 425% 425% 47% 0%O 91% 9% 103 9 7.73 0.69 23% 17% 9% 25%P 99% 1% 105 12 6.23 0.70 31% 23% 11% 24%Q 47% 53% 129 13 0.85 0.09 27% 18% 10% 35%R 99% 1% 112 6 9.62 0.51 20% 15% 5% 27%S 39% 61% 111 5 12.89 0.62 20% 15% 5% 25%T 10% 90% 696 226 15.29 4.97 102% 97% 33% 5%U 5% 95% 1 027 598 8.86 5.16 278% 267% 58% 4%V 31% 69% 108 6 1.28 0.07 24% 17% 5% 29%W 95% 5% 142 5 17.42 0.57 23% 16% 3% 31%X 82% 18% 152 7 10.57 0.48 22% 17% 4% 23%Y 89% 11% 135 5 10.51 0.41 17% 12% 4% 33%Z 2% 98% 2 200 642 10.44 3.05 172% 152% 29% 12%
Tax jurisdiction
Key ratios by tax jurisdiction
Name of the MNE Group: MNE SAFiscal year concerned: 31 12 2017
Currency used: EUR
Key ratios for year ended 31 December 2017
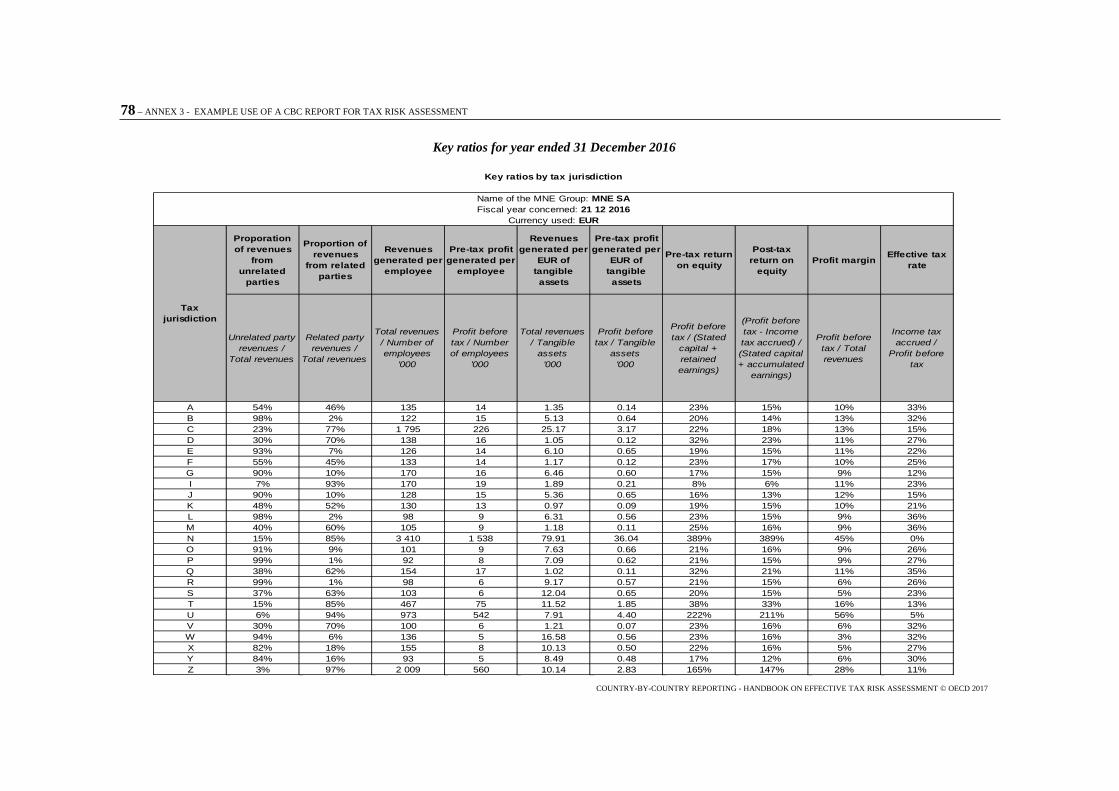
78 – ANNEX 3 - EXAMPLE USE OF A CBC REPORT FOR TAX RISK ASSESSMENT
COUNTRY-BY-COUNTRY REPORTING - HANDBOOK ON EFFECTIVE TAX RISK ASSESSMENT © OECD 2017
Key ratios for year ended 31 December 2016
Proporation of revenues
from unrelated
parties
Proportion of revenues
from related parties
Revenues generated per
employee
Pre-tax profit generated per
employee
Revenues generated per
EUR of tangible assets
Pre-tax profit generated per
EUR of tangible assets
Pre-tax return on equity
Post-tax return on
equityProfit margin Effective tax
rate
Unrelated party revenues /
Total revenues
Related party revenues /
Total revenues
Total revenues / Number of employees
'000
Profit before tax / Number of employees
'000
Total revenues / Tangible
assets '000
Profit before tax / Tangible
assets '000
Profit before tax / (Stated
capital + retained earnings)
(Profit before tax - Income tax accrued) / (Stated capital + accumulated
earnings)
Profit before tax / Total revenues
Income tax accrued /
Profit before tax
A 54% 46% 135 14 1.35 0.14 23% 15% 10% 33%B 98% 2% 122 15 5.13 0.64 20% 14% 13% 32%C 23% 77% 1 795 226 25.17 3.17 22% 18% 13% 15%D 30% 70% 138 16 1.05 0.12 32% 23% 11% 27%E 93% 7% 126 14 6.10 0.65 19% 15% 11% 22%F 55% 45% 133 14 1.17 0.12 23% 17% 10% 25%G 90% 10% 170 16 6.46 0.60 17% 15% 9% 12%I 7% 93% 170 19 1.89 0.21 8% 6% 11% 23%J 90% 10% 128 15 5.36 0.65 16% 13% 12% 15%K 48% 52% 130 13 0.97 0.09 19% 15% 10% 21%L 98% 2% 98 9 6.31 0.56 23% 15% 9% 36%M 40% 60% 105 9 1.18 0.11 25% 16% 9% 36%N 15% 85% 3 410 1 538 79.91 36.04 389% 389% 45% 0%O 91% 9% 101 9 7.63 0.66 21% 16% 9% 26%P 99% 1% 92 8 7.09 0.62 21% 15% 9% 27%Q 38% 62% 154 17 1.02 0.11 32% 21% 11% 35%R 99% 1% 98 6 9.17 0.57 21% 15% 6% 26%S 37% 63% 103 6 12.04 0.65 20% 15% 5% 23%T 15% 85% 467 75 11.52 1.85 38% 33% 16% 13%U 6% 94% 973 542 7.91 4.40 222% 211% 56% 5%V 30% 70% 100 6 1.21 0.07 23% 16% 6% 32%W 94% 6% 136 5 16.58 0.56 23% 16% 3% 32%X 82% 18% 155 8 10.13 0.50 22% 16% 5% 27%Y 84% 16% 93 5 8.49 0.48 17% 12% 6% 30%Z 3% 97% 2 009 560 10.14 2.83 165% 147% 28% 11%
Key ratios by tax jurisdiction
Name of the MNE Group: MNE SAFiscal year concerned: 21 12 2016
Currency used: EUR
Tax jurisdiction

ANNEX 3 - EXAMPLE USE OF A CBC REPORT FOR TAX RISK ASSESSMENT - 79
COUNTRY BY COUNTRY REPORTING - HANDBOOK ON EFFECTIVE TAX RISK ASSESSMENT © OECD 2017
Changes between 2016 and 2017
Unrelated party Related Party Total
A 8 570 000 6 050 000 14 620 000 2 645 000 -695 000 1 950 000 0 44 340 000 705 51 560 000B 316 000 -53 000 263 000 0 68 000 42 000 0 1 292 000 19 235 000C 447 000 -205 000 242 000 127 000 82 000 36 000 0 949 000 1 25 000D 1 069 000 2 068 000 3 137 000 -1 350 000 174 000 131 000 0 7 593 000 134 20 315 000E -744 000 206 000 -538 000 -165 000 11 000 -42 000 0 698 000 10 -251 000F 1 173 000 -520 000 653 000 1 519 000 149 000 291 000 0 4 268 000 70 9 647 000G 113 000 100 000 213 000 230 000 39 000 13 000 0 81 000 5 144 000H 1 450 000 46 392 000 47 842 000 836 000 296 000 248 000 7 000 000 526 000 520 82 512 000I -7 000 4 262 000 4 255 000 66 000 -1 000 0 0 142 000 2 54 000J 454 000 -230 000 224 000 -123 000 30 000 6 000 0 968 000 11 203 000K 1 320 000 50 642 000 51 962 000 12 042 000 1 531 000 1 271 000 7 000 000 11 470 000 82 7 764 000L 2 025 000 -28 000 1 997 000 387 000 213 000 150 000 0 444 000 13 190 000M 6 076 000 8 889 000 14 965 000 2 547 000 615 000 759 000 0 2 168 000 100 3 792 000N 1 417 000 4 845 000 6 262 000 3 836 000 0 0 0 509 000 1 32 000O 4 483 000 412 000 4 895 000 584 000 40 000 99 000 0 1 103 000 39 530 000P 2 479 000 -22 000 2 457 000 557 000 90 000 96 000 0 275 000 8 622 000Q 9 825 000 -37 360 000 -27 535 000 -4 856 000 -1 594 000 -1 670 000 -4 000 000 1 575 000 123 20 167 000R 6 061 000 -13 000 6 048 000 39 000 214 000 33 000 0 374 000 18 481 000S 10 852 000 8 046 000 18 898 000 191 000 191 000 167 000 0 1 314 000 79 781 000T -210 000 5 678 000 5 468 000 4 085 000 54 000 17 000 0 207 000 -2 57 000U 39 000 1 312 000 1 351 000 939 000 8 000 5 000 0 43 000 1 74 000V 5 228 000 8 980 000 14 208 000 319 000 -47 000 -92 000 0 776 000 70 7 434 000W 9 417 000 -289 000 9 128 000 209 000 -8 000 34 000 0 769 000 44 318 000X 451 000 89 000 540 000 7 000 13 000 -7 000 0 40 000 4 34 000Y 2 963 000 37 000 3 000 000 17 000 52 000 13 000 0 67 000 4 161 000Z -168 000 3 214 000 3 046 000 1 311 000 -552 000 217 000 0 533 000 0 203 000
Accumulated Earnings
Number of Employees
Tangible Assets other than Cash and Cash
Equivalents
Changes in allocation of income, taxes and business activities by tax jurisdiction (nominal)
Name of the MNE Group: MNE SAFiscal years concerned: comparing 31 12 2016 and 31 12 2017
Currency used: EURTax jurisdiction Revenues Profit (Loss)
before Income Tax
Income Tax Paid (on Cash
Basis)
Income Tax Accrued -
Current Year
Stated Capital

80 – ANNEX 3 - EXAMPLE USE OF A CBC REPORT FOR TAX RISK ASSESSMENT
COUNTRY-BY-COUNTRY REPORTING - HANDBOOK ON EFFECTIVE TAX RISK ASSESSMENT © OECD 2017
Unrelated party Related Party Total
A 1% 1% 1% 2% -2% 5% 0% 11% 9% 6%B 1% -11% 1% 0% 5% 4% 0% 9% 8% 4%C 8% -1% 1% 4% 15% 8% 0% 9% 7% 3%D 1% 1% 1% -4% 2% 2% 0% 10% 7% 8%E -5% 16% -3% -9% 0% 0% 0% 9% 7% -9%F 2% -1% 1% 13% 5% 10% 0% 10% 8% 10%G 1% 7% 1% 16% 20% 8% 0% 1% 5% 6%H I -7% 337% 313% 44% -2% 0% 0% 10% 25% 7%J 3% -15% 1% -7% 10% 2% 0% 10% 9% 7%K 2% 83% 44% 106% 58% 52% 88% 22% 9% 6%L 9% -5% 9% 20% 30% 21% 0% 10% 6% 5%M 10% 10% 10% 19% 12% 16% 0% 6% 7% 3%N 24% 14% 15% 21% 0% 0% 0% 17% 8% 6%O 8% 8% 8% 12% 3% 7% 0% 9% 7% 7%P 22% -15% 21% 54% 30% 34% 0% 12% 6% 38%Q 10% -23% -10% -17% -15% -16% -12% 3% 7% 8%R 21% -5% 21% 2% 43% 7% 0% 14% 6% 15%S 24% 10% 15% 3% 11% 11% 0% 10% 6% 7%T -10% 48% 39% 181% 13% 6% 0% 10% -7% 5%U 11% 24% 23% 29% 4% 3% 0% 9% 17% 10%V 20% 15% 16% 6% -3% -6% 0% 10% 8% 10%W 14% -7% 13% 9% -1% 4% 0% 10% 8% 7%X 13% 12% 13% 3% 17% -13% 0% 10% 15% 8%Y 64% 4% 55% 5% 51% 14% 0% 11% 7% 25%Z -17% 10% 9% 15% -30% 22% 0% 11% 0% 6%
Accumulated Earnings
Number of Employees
Tangible Assets other than Cash and Cash
Equivalents
Newly acquired or incorporated entity, so a relative comparison is not possible
Changes in allocation of income, taxes and business activities by tax jurisdiction (relative)
Name of the MNE Group: MNE SAFiscal year concerned: comparing 31 12 2016 and 31 12 2017
Currency used: EURTax jurisdiction Revenues Profit (Loss)
before Income Tax
Income Tax Paid (on Cash
Basis)
Income Tax Accrued -
Current Year
Stated Capital

ANNEX 3 - EXAMPLE USE OF A CBC REPORT FOR TAX RISK ASSESSMENT - 81
COUNTRY BY COUNTRY REPORTING - HANDBOOK ON EFFECTIVE TAX RISK ASSESSMENT © OECD 2017
Proporation of revenues
from unrelated
parties
Proportion of revenues
from related parties
Revenues generated per
employee
Pre-tax profit generated per
employee
Revenues generated per
EUR of tangible assets
Pre-tax profit generated per
EUR of tangible assets
Pre-tax return on equity
Post-tax return on
equityProfit margin Effective tax
rate
Unrelated party revenues /
Total revenues
Related party revenues /
Total revenues
Total revenues / Number of employees
'000
Profit before tax / Number of
employees '000
Total revenues / Tangible
assets '000
Profit before tax / Tangible
assets '000
Profit before tax / (Stated
capital + retained earnings)
(Profit before tax - Income
tax accrued) / (Stated capital + accumulated
earnings)
Profit before tax / Total revenues
Income tax accrued / Profit
before tax
A 0.06% -0.06% -8.95 -0.77 -0.06 0.00 -1.38% -1.13% 0.10% 0.94%B 0.19% -0.19% -7.91 -1.12 -0.16 -0.03 -1.32% -1.11% -0.11% 1.14%C 1.54% -1.54% -103.50 -6.61 -0.38 0.05 -0.50% -0.53% 0.38% 0.52%D 0.04% -0.04% -7.38 -1.66 -0.07 -0.01 -3.70% -3.19% -0.63% 1.70%E -1.43% 1.43% -12.00 -2.00 0.38 0.00 -2.83% -2.15% -0.63% -0.31%F 0.69% -0.69% -9.14 0.60 -0.10 0.00 0.96% 0.88% 1.23% -0.69%G -0.50% 0.50% -6.61 1.58 -0.28 0.06 2.50% 2.37% 1.34% -0.89%H 3.03% 96.97% 92.00 1.61 0.58 0.01 11.11% 7.81% 1.75% 29.67%I -5.47% 5.47% 391.48 2.85 5.36 0.07 2.69% 2.81% -7.18% -6.93%
J 1.63% -1.63% -9.01 -2.23 -0.28 -0.08 -2.13% -2.00% -0.97% 1.41%K -13.94% 13.94% 41.86 11.16 0.34 0.09 10.85% 10.17% 4.14% -5.58%L 0.31% -0.31% 3.01 1.14 0.21 0.08 3.16% 1.90% 0.87% 0.51%M 0.09% -0.09% 2.95 1.05 0.08 0.02 3.58% 2.57% 0.73% -0.94%N 1.07% -1.07% 219.42 176.79 6.81 4.93 35.33% 35.33% 2.14% 0.00%O 0.07% -0.07% 1.55 0.39 0.10 0.03 1.41% 1.26% 0.25% -0.96%P 0.38% -0.38% 12.81 3.67 -0.86 0.07 9.72% 8.16% 2.42% -3.55%Q 8.61% -8.61% -25.24 -3.78 -0.17 -0.03 -4.53% -2.97% -0.76% 0.05%R 0.19% -0.19% 13.67 -0.23 0.45 -0.06 -0.42% -0.56% -0.96% 1.24%S 2.70% -2.70% 8.30 -0.19 0.85 -0.03 -0.21% -0.52% -0.57% 1.76%T -5.39% 5.39% 228.65 151.26 3.78 3.12 64.62% 64.52% 16.46% -8.43%U -0.55% 0.55% 53.95 56.76 0.94 0.76 56.04% 56.02% 2.60% -0.98%V 0.97% -0.97% 7.65 -0.09 0.07 0.00 0.62% 1.28% -0.49% -3.65%W 1.05% -1.05% 5.56 0.01 0.84 0.01 0.28% 0.49% -0.12% -1.27%X 0.18% -0.18% -2.52 -0.75 0.44 -0.02 -0.20% 0.78% -0.41% -4.20%Y 5.22% -5.22% 41.73 -0.06 2.03 -0.07 0.30% -0.21% -1.80% 2.40%Z -0.74% 0.74% 190.38 81.94 0.29 0.22 7.23% 5.23% 1.31% 0.69%
Changes in key ratios by tax jurisdiction (nominal)
Name of the MNE Group: MNE SAFiscal year concerned: Comparing 31 12 2016 and 31 12 2017
Currency used: EURTax jurisdiction

82 – ANNEX 3 - EXAMPLE USE OF A CBC REPORT FOR TAX RISK ASSESSMENT
COUNTRY-BY-COUNTRY REPORTING - HANDBOOK ON EFFECTIVE TAX RISK ASSESSMENT © OECD 2017
Proporation of revenues
from unrelated
parties
Proportion of revenues
from related parties
Revenues generated per
employee
Pre-tax profit generated per
employee
Revenues generated per
EUR of tangible assets
Pre-tax profit generated per
EUR of tangible assets
Pre-tax return on equity
Post-tax return on
equityProfit margin Effective tax
rate
Unrelated party revenues /
Total revenues
Related party revenues /
Total revenues
Total revenues / Number of employees
Profit before tax / Number of
employees
Total revenues / Tangible
assets
Profit before tax / Tangible
assets
Profit before tax / (Stated
capital + retained earnings)
(Profit before tax - Income
tax accrued) / (Stated capital + accumulated
earnings)
Profit before tax / Total revenues
Income tax accrued / Profit
before tax
A 0% 0% -7% -6% -5% -4% -6% -7% 1% 3%B 0% -12% -6% -7% -3% -4% -7% -8% -1% 4%C 7% -2% -6% -3% -2% 1% -2% -3% 3% 3%D 0% 0% -5% -11% -6% -12% -12% -14% -6% 6%E -2% 20% -10% -15% 6% 0% -15% -14% -6% 0%F 1% -2% -7% 4% -8% 3% 4% 5% 12% -3%G -1% 5% -4% 10% -4% 9% 15% 16% 15% -7%H I -78% 6% 230% 15% 284% 34% 34% 46% -65% -31%
J 2% -16% -7% -14% -5% -13% -14% -15% -8% 9%K -29% 27% 32% 89% 36% 94% 58% 69% 43% -26%L 0% -13% 3% 13% 3% 14% 14% 13% 10% 1%M 0% 0% 3% 11% 7% 16% 14% 16% 8% -3%N 7% -1% 6% 11% 9% 14% 9% 9% 5% 0%O 0% -1% 2% 5% 1% 4% 7% 8% 3% -4%P 0% -30% 14% 45% -12% 12% 46% 53% 27% -13%Q 22% -14% -16% -22% -17% -23% -14% -14% -7% 0%R 0% -21% 14% -4% 5% -11% -2% -4% -15% 5%S 7% -4% 8% -3% 7% -4% -1% -3% -11% 8%T -35% 6% 49% 201% 33% 169% 172% 198% 102% -62%U -9% 1% 6% 10% 12% 17% 25% 27% 5% -20%V 3% -1% 8% -2% 5% -4% 3% 8% -9% -11%W 1% -17% 4% 0% 5% 1% 1% 3% -4% -4%X 0% -1% -2% -10% 4% -4% -1% 5% -8% -15%Y 6% -33% 45% -1% 24% -16% 2% -2% -32% 8%Z -24% 1% 9% 15% 3% 8% 4% 4% 5% 6%
Newly acquired or incorporated entity, so a relative comparison is not possible
Tax jurisdiction
Changes in key ratios by tax jurisdiction (relative)
Name of the MNE Group: MNE SAFiscal years concerned: Comparing 31 12 2016 and 31 12 2017
Currency used: EUR

ANNEX 3 EXAMPLE USE OF A CBC REPORT FOR TAX RISK ASSESSMENT – 83
COUNTRY BY COUNTRY REPORTING - HANDBOOK ON EFFECTIVE TAX RISK ASSESSMENT © OECD 2017

84 – ANNEX 3 - EXAMPLE USE OF A CBC REPORT FOR TAX RISK ASSESSMENT
COUNTRY-BY-COUNTRY REPORTING - HANDBOOK ON EFFECTIVE TAX RISK ASSESSMENT © OECD 2017

ANNEX 3 EXAMPLE USE OF A CBC REPORT FOR TAX RISK ASSESSMENT – 85
COUNTRY BY COUNTRY REPORTING - HANDBOOK ON EFFECTIVE TAX RISK ASSESSMENT © OECD 2017

86 – ANNEX 3 - EXAMPLE USE OF A CBC REPORT FOR TAX RISK ASSESSMENT
COUNTRY-BY-COUNTRY REPORTING - HANDBOOK ON EFFECTIVE TAX RISK ASSESSMENT © OECD 2017
•
•
•
•
•
•