country fact sheet on food and agriculture policy trends - guatemala
TRANSCRIPT
Socio-economic context and role of agriculture
The Republic of Guatemala is a lower middle income country in Central America, with a GDP per capita of USD 3 331
in 2012. Almost half of the population is rural (49.7 percent) and indigenous account a large stake of the population
(over 40 percent of total).
The country has made great progress since the 1996 Peace Accords, which put an end to a 36-year civil war and has
led to increased macroeconomic and democratic stability. Nevertheless, Guatemala has the highest level of poverty
among Latin American countries. Chronic malnutrition among children is also alarmingly high (49.8 percent), being
the highest in the region and among the highest in the world. Contrary to the regional trend, this rate further
increased during the review period (2007-2013). In 2012, the Human Development Index for Guatemala was 0.581,
placing the country among the most under-developed in the region, above only Haiti.1
The agricultural sector is vital for economic and social development, with about 70 percent of total land area
dedicated to agricultural and forestry activities. Guatemala has the second most unequal land distribution in the
region, with 1.86 percent of the farms owning 52 percent of arable land. Conversely, 45 percent of all holdings are
smaller than 0.7 ha in size.2
Bananas, sugar, coffee, and palm oil are some of Guatemala’s main agricultural exports, although export of non-
traditional products has grown significantly during the period.
Country faCt Sheet on food and agriCulture poliCy trendS | September 2014
food
and
agr
icul
ture
po
licy
dec
isio
n a
naly
sis
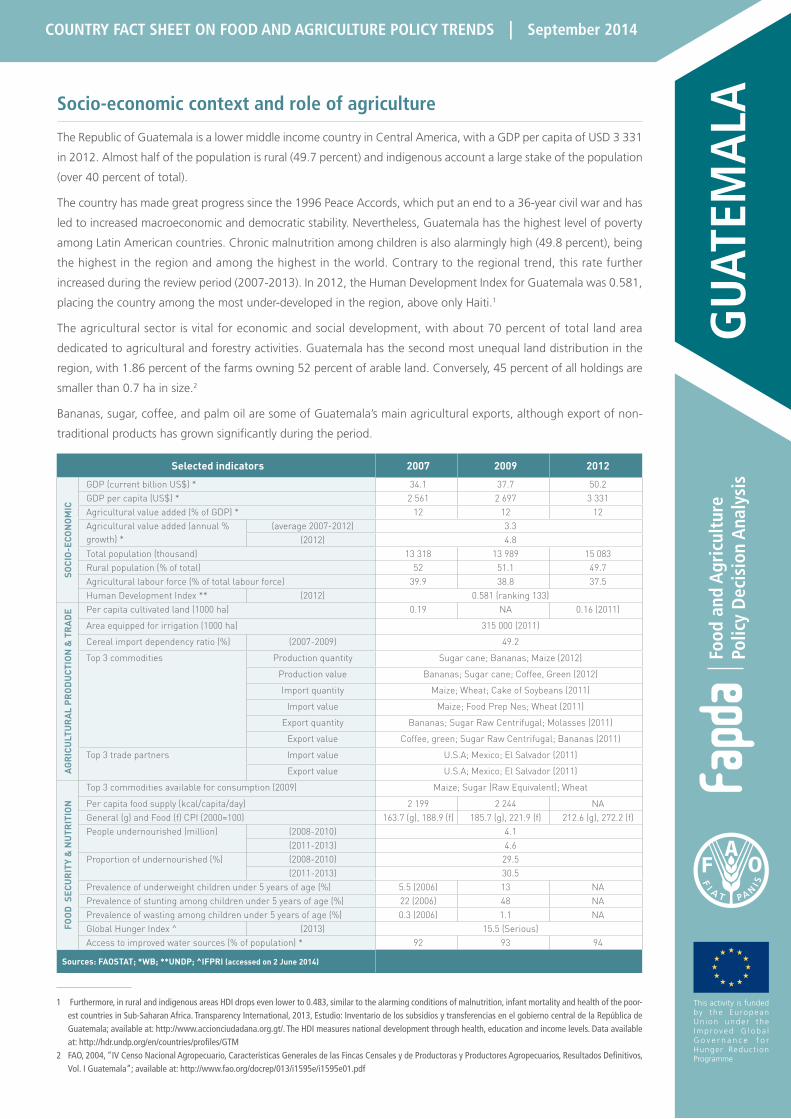
Selected indicators 2007 2009 2012
SOCI
O-E
CON
OM
IC
GDP (current billion US$) * 34.1 37.7 50.2GDP per capita (US$) * 2 561 2 697 3 331Agricultural value added (% of GDP) * 12 12 12Agricultural value added (annual % growth) *
(average 2007-2012) 3.3(2012) 4.8
Total population (thousand) 13 318 13 989 15 083Rural population (% of total) 52 51.1 49.7Agricultural labour force (% of total labour force) 39.9 38.8 37.5Human Development Index ** (2012) 0.581 (ranking 133)
AGR
ICU
LTU
RAL
PR
OD
UCT
ION
& T
RAD
E Per capita cultivated land (1000 ha) 0.19 NA 0.16 (2011)
Area equipped for irrigation (1000 ha) 315 000 (2011)
Cereal import dependency ratio (%) (2007-2009) 49.2
Top 3 commodities Production quantity Sugar cane; Bananas; Maize (2012)
Production value Bananas; Sugar cane; Coffee, Green (2012)
Import quantity Maize; Wheat; Cake of Soybeans (2011)
Import value Maize; Food Prep Nes; Wheat (2011)
Export quantity Bananas; Sugar Raw Centrifugal; Molasses (2011)
Export value Coffee, green; Sugar Raw Centrifugal; Bananas (2011)
Top 3 trade partners Import value U.S.A; Mexico; El Salvador (2011)
Export value U.S.A; Mexico; El Salvador (2011)
FOO
D S
ECU
RIT
Y &
NU
TRIT
ION
Top 3 commodities available for consumption (2009) Maize; Sugar (Raw Equivalent); Wheat
Per capita food supply (kcal/capita/day) 2 199 2 244 NAGeneral (g) and Food (f) CPI (2000=100) 163.7 (g), 188.9 (f) 185.7 (g), 221.9 (f) 212.6 (g), 272.2 (f)People undernourished (million) (2008-2010) 4.1
(2011-2013) 4.6Proportion of undernourished (%) (2008-2010) 29.5
(2011-2013) 30.5Prevalence of underweight children under 5 years of age (%) 5.5 (2006) 13 NAPrevalence of stunting among children under 5 years of age (%) 22 (2006) 48 NAPrevalence of wasting among children under 5 years of age (%) 0.3 (2006) 1.1 NAGlobal Hunger Index ^ (2013) 15.5 (Serious)Access to improved water sources (% of population) * 92 93 94
Sources: FAOSTAT; *WB; **UNDP; ^IFPRI (accessed on 2 June 2014)
1 Furthermore, in rural and indigenous areas HDI drops even lower to 0.483, similar to the alarming conditions of malnutrition, infant mortality and health of the poor-est countries in Sub-Saharan Africa. Transparency International, 2013, Estudio: Inventario de los subsidios y transferencias en el gobierno central de la República de Guatemala; available at: http://www.accionciudadana.org.gt/. The HDI measures national development through health, education and income levels. Data available at: http://hdr.undp.org/en/countries/profiles/GTM
2 FAO, 2004, “IV Censo Nacional Agropecuario, Características Generales de las Fincas Censales y de Productoras y Productores Agropecuarios, Resultados Definitivos, Vol. I Guatemala”; available at: http://www.fao.org/docrep/013/i1595e/i1595e01.pdf
This activity is funded by the Eu ropean Un ion unde r the I m p ro v e d G l o b a l G o v e r n a n c e f o r Hunger Reduct ion Programme
gua
teM
ala
2 FAPDA country FAct sheet on FooD AnD Agriculture Policy trenDs | guAtemAlA
3 FAO/WFP, 2010, Crop and Food Security Assessment Mission to Guatemala, available at: http://www.fao.org/docrep/012/ak344e/ak344e00.pdf4 During the 1996-2006 period, Guatemala received US$ 3.3 billion in Official Development Assistance (ODA) from external donors. Source: UNDP, 2009, “Assessment of Development Results,
Evaluation of UNDP Contribution – Guatemala”; available at: http://www.oecd.org/countries/guatemala/46820221.pdf5 Priority subjects are identified as the rural population living in poverty and extreme poverty, focusing on indigenous and peasant communities with insufficient land, indigenous and peasant
women, micro and small rural entrepreneurs among others.6 Although researches demonstrate that in many areas there is no evidence of technical assistance provided to farmers. ASIES, 2012, Metodologías aplicadas en el Programa de Entrega de Fer-
tilizantes -PEF- en Guatemala 2000-2012, available at: http://www.asies.org.gt/sites/default/files/articulos/publicaciones/asies_metodologias_del_programa_de_entrega_de_fertilizantes_in-forme_final.pdf
Overall, Guatemala is a food consumption deficit country, being a
net importer of maize, rice, black beans and other staple foods.3
Guatemala still faces major challenges in achieving sustainable
growth in income and poverty reduction, relying heavily on
remittances (particularly from the US) and on external aid.4
1. government objectives in agriculture, food and nutrition security
Following the elections and the change of the Government in
January 2012, some national programmes have undergone
a reformulation and changed their names, although their
nature has not substantially varied. Relevant national policies
and programmes related to agriculture and food and nutrition
security, and the objectives they serve, are the following:
i. The National Policy on Integrated Rural Development
(2009), which has the overall objective of “achieving a
progressive and permanent progress in the quality of life of the
priority subjects5 […] through the equitable and sustainable
use of productive resources for integrated human development
in rural areas”;
ii. The National Agricultural Policy 2011-2015 has the goal of
creating the conditions for productive actors to generate an
equitable and sustainable economic development, fostering
employment and reducing poverty and inequality. It prioritizes
the promotion of rural economies, indigenous and peasant
communities, in order for them to become surplus producers
and to invigorate local economies.
iii. The National Food and Nutrition Security System (2005)
focuses on the right of all the population to sustainable access
to sufficient and quality food. It establishes the Secretariat for
Food and Nutrition Security of the Presidency of the Republic
(SESAN), responsible for managing all national food security
and nutrition programmes and plans.
iv. The Zero Hunger Pact (2012) expresses the government’s
ambitious commitment to eradicate hunger and malnutrition,
and to reduce chronic malnutrition by 10 percent by 2015. To
achieve these actions, provision of micronutrients, nutritional
counseling, and promotion of basic hygiene are included in
social programmes;
v. The Family Farming Programme to Strengthen the Rural
Economy (PAFFEC) 2012-2015, which is the Ministry of
Agriculture, Livestock and Food (MAGA) flagship programme
and acts under all the above frameworks. The aim is to create
dynamic rural economies through: (i) technical assistance to
farmers through the National System of Rural Extension; (ii)
strategic territorial interventions at municipality level and (iii)
improvement of logistics. A total of 1.3 million Guatemalans
are currently assisted by this programme.
2. trends in key policy decisions (2007-2013)
2.1 producer-oriented policy decisions
Government policies primarily support small-scale farmers and
seek to improve their living conditions, and to increase agricultural
production, mainly through input and agricultural modernization
programmes. The government does not directly intervene in the
market through price support interventions.
input distribution continued to be the main policy to support farmers
The National Fertilizers Programme (Programa Nacional de
Fertilizantes - PNF), launched in the year 2000, is one of the
main public programmes targeting small farmers of staple
grains, aiming to transform them into surplus producers. The
programme continued with few variations throughout the
years: fertilizers have been directly distributed to farmers, with
the exception of the period 2009-2011 where input vouchers
were utilized. Formally, the programme supplies its beneficiaries
with free fertilizers often supplemented with seeds, farming
tools and technical assistance.6 From 2000 to 2013, cumulative
budgetary allocations of the PNF amounted to US$ 355 million.
The budget for 2012 was around US$ 70 million, benefiting 932
000 families but was reduced in 2013 to about US$ 50 million.
Notwithstanding the large budgetary cost, official data shows
that maize productivity has decreased in recent years, partly due
to climate change, diseases, and poor technical assistance.7 The
government has distributed fertilizers to small farmers also under
other programmes, such as the PAFFEC.
3FAPDA country FAct sheet on FooD AnD Agriculture Policy trenDs | guAtemAlA
7 MAGA, 2013, Informe de situación del maíz blanco; available at http://web.maga.gob.gt/wp-content/uploads/pdf/home/diplan/maiz/informe_situacion_maiz_blanco.pdf8 Ministerio de Agricultura, Ganadería y Alimentación, Política Agropecuaria 2011-2015; available at: http://web.maga.gob.gt/wp-content/uploads/pdf/home/politica_agropecuaria_2011-15.pdf9 “Fideicomiso de apoyo Financiero para los Productores del Sector Cafetalero Guatemalteco”, started in 2001 and extended in 2013 for additional ten years.10 Through the programme “Creciendo Mejor” (Growing Better), see more details in the section 2.2.11 The Framework is accessible at: http://web.maga.gob.gt/wp-content/uploads/pdf/home/politica_riego.pdf12 The newly created Ministry substituted the former ‘Council of Social Cohesion’, which was led by the First Lady, posing therefore problems of politicization of programmes and lack of trans-
parency.13 “Informe Especial: Mi Familia Progresa a punto de colapsar”, available at: http://vimeo.com/27780512; and Acción Cuidadana, 2012, “Informe de Auditoría Social de Mi Familia Progresa”
available at: www.accionciudadana.org.gt.14 Transparency International, ibidem.
new agricultural credit schemes introduced
Although new programmes have been implemented in recent
years, access to public financing for productive activities in
rural areas is still weak (agriculture receives only 6.5 per cent of
national bank credit as of 20118). The most relevant institution
managing rural credit (first and second tier bank) is “Banrural”,
a public-private rural development bank created in 1997 through
the conversion of a former public bank. Besides this, special credit
lines were available during the period, such as trust funds for
coffee farmers9, micro-credit for women engaged in productive
activities10, and micro-credit for vulnerable rural communities.
The last two were implemented through the programmes Mi
Comunidad Produce, in place since 2009, and Pro Rural, launched
in 2008 but discontinued in 2011.
Moving towards more efficient irrigation systems
A new strategy implemented by the government is promoting the
modernization of irrigation systems. The “Irrigation Development
Framework 2013-2023” aims at improving both irrigation
efficiency and sustainability for increasing food production
through a plan of public investment in irrigation. It comprises:
promotion of modern technologies in water use; incentives to
use water efficiently (such as better credit conditions for farmers
who invest in efficiency improvements); development of water
regulation works and off-farm infrastructure for water collection
and storage.11 The strategic goal of this policy for the first five
years is to increase by eight times the area under pressurized
irrigation systems, benefitting 50 000 vulnerable families in dry
areas. A national baseline Information System for Irrigation Water
(SIAGua_riego) will also be established in order to measure and
evaluate efficiency gains. Since 2012, public funds by MAGA to
irrigation have increased considerably and shifted away from the
traditional small-scale irrigation systems (“mini-riego”) which
had been until then the main irrigation system adopted since
the 1980s.
2.2 Consumer-oriented policy decisions
Progress has been made in institutionalizing social development
programmes in recent years. In January 2012, the Ministry
of Social Development (MIDES) was created. The Ministry is
responsible for social programmes for segments of the population
in poverty and extreme poverty and is intended to provide
greater transparency and articulation in these schemes.12 Rural
and indigenous communities, especially pregnant women and
children, have continued to be the main beneficiaries, although
programmes were reformulated to better target the population.
introduction and strengthening of conditional cash transfer (CCt) programmes
The first nation-wide CCT programme, “Mi Familia Progresa”,
was instituted in the country in 2008, providing poor families with
children from 0 to 15 years with regular conditional cash transfers
(conditions include sending children to school and completing
regular health checks). Benefitting over 872 000 families with a
total budget of over US$ 360 million from 2008 to 2012, it has
been the government’s flagship programme for the reduction of
poverty and malnutrition. However, it has been criticized for lack
of transparency (beneficiary list was not public) and clientelism, as
investigations revealed that in certain municipalities beneficiaries
were required to be affiliated with the government party.13 In
2012, the programme was substituted by “Mi Bono Seguro”,
which aimed at addressing transparency lack and other issues. For
example, the list of beneficiaries was reviewed in order to ensure
that only families in need would receive the transfer and the total
budget for the programme was reduced from US$ 114 million in
2011 to US$ 97 million in 2013.14
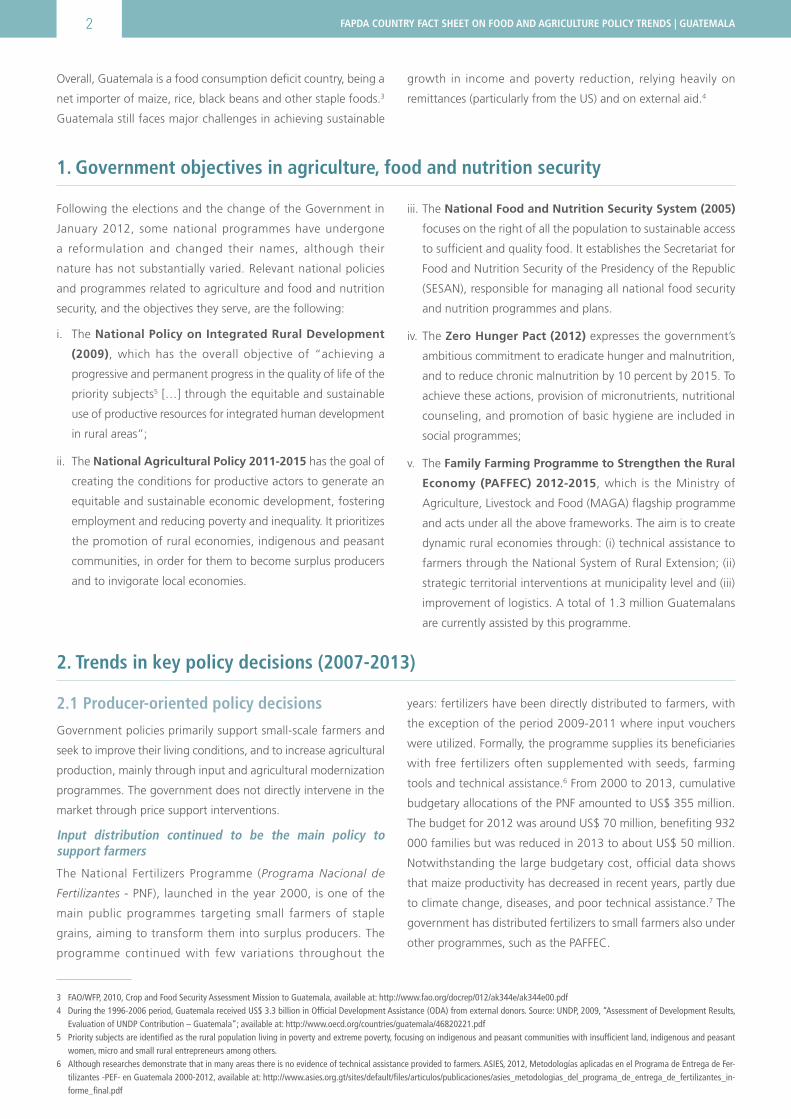
A local market scene in Guatemala City where small farmers sell their products. Great contrasts are visible in agriculture in the country: modern, export oriented farming opposes subsistence agricul-ture, often marginalized and excluded from technology and international markets.
©FA
O p
hoto
/ FA
O
4 FAPDA country FAct sheet on FooD AnD Agriculture Policy trenDs | guAtemAlA
15 Soup kitchens were scaled up from 2 in 2008 (both in the Department of Guatemala) to 20 in 2013 and extended to prioritized rural departments of the country.16 CACM implies free trade among its members (harmonized to a current 96 per cent of total products, with the exclusion of sensitive products such as coffee, sugar, alcoholic beverages and
petroleum derivatives) and a common external tariff system towards third countries.17 The FTAs with Panama and Mexico are part of the Central America – Panama FTA the Central America – Mexico FTA, respectively.18 It was only in January 2014 that the government created a Unified Register of Users (RUU), listing all users of social programmes (more than 92) from the various ministries and secretaries.
institutionalization and scaling up of free food distribution
Food distribution operations have been regularly implemented
in Guatemala, targeting the poorest sectors of the population.
In 2008, such distributions were institutionalized through the
creation of the programme “Bolsas Solidarias” (Solidarity Bags)
which consisted of monthly provision of basic food to the
poorest families on a national scale. In 2012, the programme was
substituted by “Mi Bolsa Segura”, which maintained the same
objective but redefined beneficiaries. Food-for-work programmes
have also been implemented since 2009 (“Programa Alimentos
por Trabajo”) and soup kitchens have been in place since 2010
(Comedores solidarios, converted to Mi Comedor Seguro in 2012),
both with the support from the World Food Programme (WFP).15
Most of these programmes are donors funded or co-funded.
programmes to foster nutrition and sanitation increased
The programme “Creciendo bien”, launched in 2005, delivered
basic training and workshops on hygiene, health and nutrition
to women in rural areas for reducing malnutrition rates among
children under the age of 5 and women of reproductive age.
In early 2008, the programme was transformed into “Creciendo
Mejor”, which additionally included the delivery of micro-credits
to rural women for productive activities. In 2012, flour enriched
with vitamins A and B and other nutrients was distributed to
children and pregnant women, as part of the Zero Hunger Pact.
2.3 trade-oriented policy decisions
Since the 1990s, the government has pursued a trade
liberalization policy. No export or import bans on major staple
foods were implemented.
active role in regional integration processes
Guatemala has been a member of the Central American Common
Market (CACM) since 1960, which provides the framework for
its trade policy.16 Three quarters of Guatemala’s trade in goods is
intra-regional. In 2006, the free trade agreement (FTA) among
Central American countries, the United States and the Dominican
Republic (DR-CAFTA) entered into force. The agreement provides
that, with the exception of white maize, within 10 to 15 years
all products will freely move within the bloc. Furthermore, during
the review period, Guatemala signed free or preferential trade
agreements with other countries in the region such as Colombia
(FTA in 2008), Panama (FTA in 2009), El Salvador (Customs Union
in 2009), Chile (FTA in 2010) and Mexico (FTA in 2011).17
Sustained application of tariff-rate quotas on main staples
In June 2008, in the wake of the international food and fuel
crisis, the government adopted a zero-tariff import quota for 10
basic food staples and for fertilizers, a common policy in Central
America. These temporary tariff-rate quotas on basic staples, such
as maize, wheat, wheat flour, rice, poultry, have been extended
continuously throughout the entire review period in an attempt
to increase supply and curb domestic prices.
3. emerging issues
Food security and nutrition have been high on the political
agenda in recent years, with a certain degree of continuity among
the two governments ruling the country from 2007 to 2013.
Despite that, malnutrition has increased (see page 1). Attempts
to further institutionalize government programmes to reduce
ad-hoc interventions in favour of long-term and comprehensive
strategies have been observed.18 Target groups have remained
unvaried (rural farmers and vulnerable sectors such as women
and children), as well as the overall strategy of fostering social
inclusion with the aim of reducing the alarming rates of poverty,
malnutrition and marginalization of a large sector of population.
increased attention to young people. In 2008, the
programme “Escuelas Abiertas” (Open Schools) was launched
as a supplementary education programme based on the
Brazilian Escola Abierta programme. It aims at providing youth
in vulnerable areas with alternatives to poverty, violence and
crime. It was implemented in 220 schools in 155 municipalities.
In 2012, the programme was renamed “Jóvenes Protagonistas”
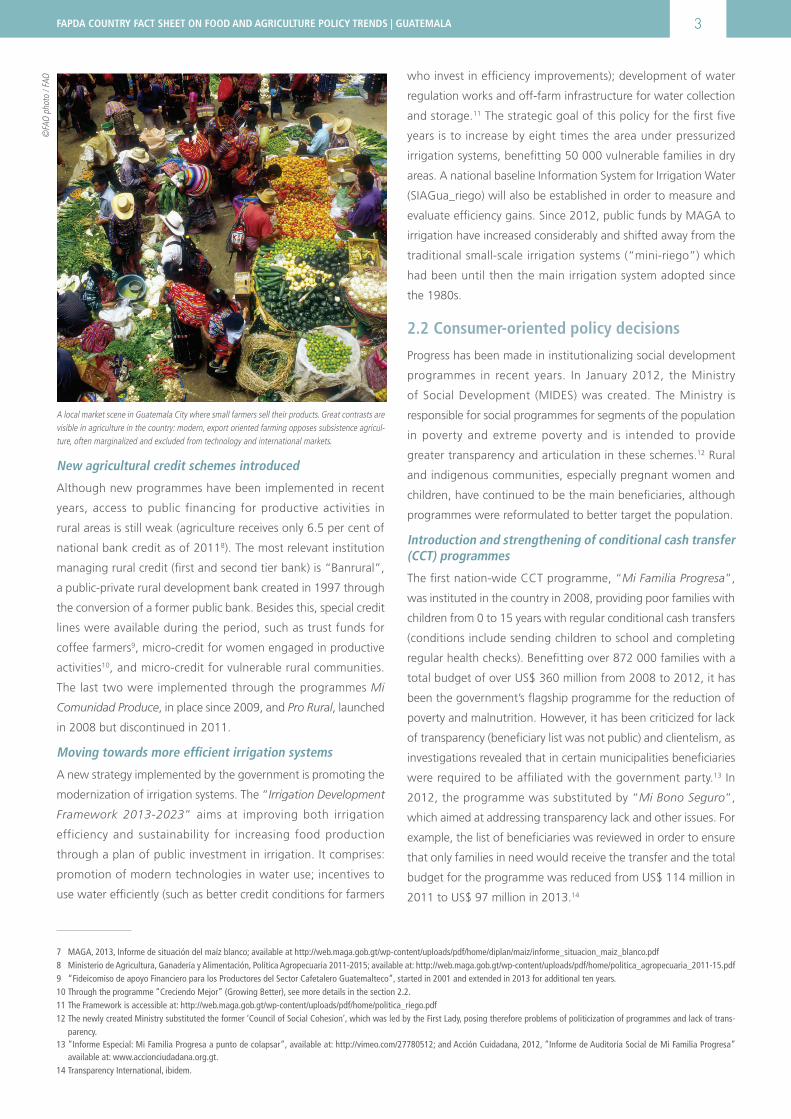
Guatemala has the highest rates of chronic malnutrition among children in the region, particu-larly among rural and indigenous populations. Targeted programmes such as ‘Creciendo Mejor’ (Growing Better), have been recently implemented to provide them with basic nutrition, sanitation and hygiene levels.
©FA
O p
hoto
/ FA
O
5FAPDA country FAct sheet on FooD AnD Agriculture Policy trenDs | guAtemAlA
19 Acción Ciudadana, 2013, “Riesgo de corrupción en los Programas Sociales implementados por el Ministerio de Desarrollo Social en Guatemala”.20 World Bank, 2010, “Agricultural insurance in Latin America, developing the market”; available at: http://www.fao.org/fileadmin/user_upload/AGRO_Noticias/docs/619630ESW0WHIT0nce0in-
0LAC0web0FINAL.pdf21 More information at: http://web.maga.gob.gt/blog/seguro-agricola-beneficiara-la-produccion-guatemalteca/22 International Policy Centre for Inclusive Growth, 2012, “Guatemala and Integrated Rural development: Towards Inclusive Growth in the Rural Sector”; available at: http://www.ipc-undp.org/
pub/IPCPolicyResearchBrief37.pdf
(Young Actors), though with less budget allocated, reducing the
coverage to 191 schools in 131 municipalities. Nevertheless,
positive changes were introduced to the programme, which now
involves other age groups of the population such as interested
adults and seniors.19 The programme “Mi Beca Segura” (My Safe
Scholarship) was also launched in 2012 as an additional CCT
programme for families with children from 12 to 24 years with a
school attendance of at least 90 percent.
Weak institutionalization of some fundamental services. Agricultural insurance is still at a starting phase in the country;
with the exception of traditional agro-exporting companies, small
and medium farmers have little access to the insurance market
which still operates a traditional portfolio. Penetration rates of
agricultural insurance are very low, with less than 1 percent of the
crop area insured.20 It was not until 2013 that MAGA promoted
the project “Development of Agricultural Insurance Market in
Guatemala” with support from the World Bank to extend the
same insurance coverage to small farmers.21
lack of ambition on land policy reform. Guatemala still suffers
from severe land inequality (see introduction) and little progress
has been made since the Peace Accords of 1996. The Fondo
Nacional de Tierras (FONTIERRAS), an autonomous decentralized
State body created in 1997 to facilitate and coordinate a market-
led land reform, has had a marginal impact on redistribution
of land. No other relevant initiatives or policies have been
implemented by the government to address this issue and the
country lacks a general land registry covering a significant part of
its territory. Opposition of large estate owners and the increased
control of illegal entities in some regions further undermine this
reform process.22
This brief was prepared by the Food and Agriculture Policy Decision Analysis
(FAPDA) team at FAO with the contribution of the FAO Regional Office for
Latin America and the Caribbean. Information reported derives from the
FAPDA tool and the review of primary and secondary data sources.
© FAO, 2014
The FAPDA initiative promotes evidence-based decision making by
collecting and disseminating information on policy decisions through a
freely accessible web-based tool. For more information, please visit:
www.fao.org/economic/fapda
www.fao.org/economic/fapda/tool
or contact us at: [email protected]
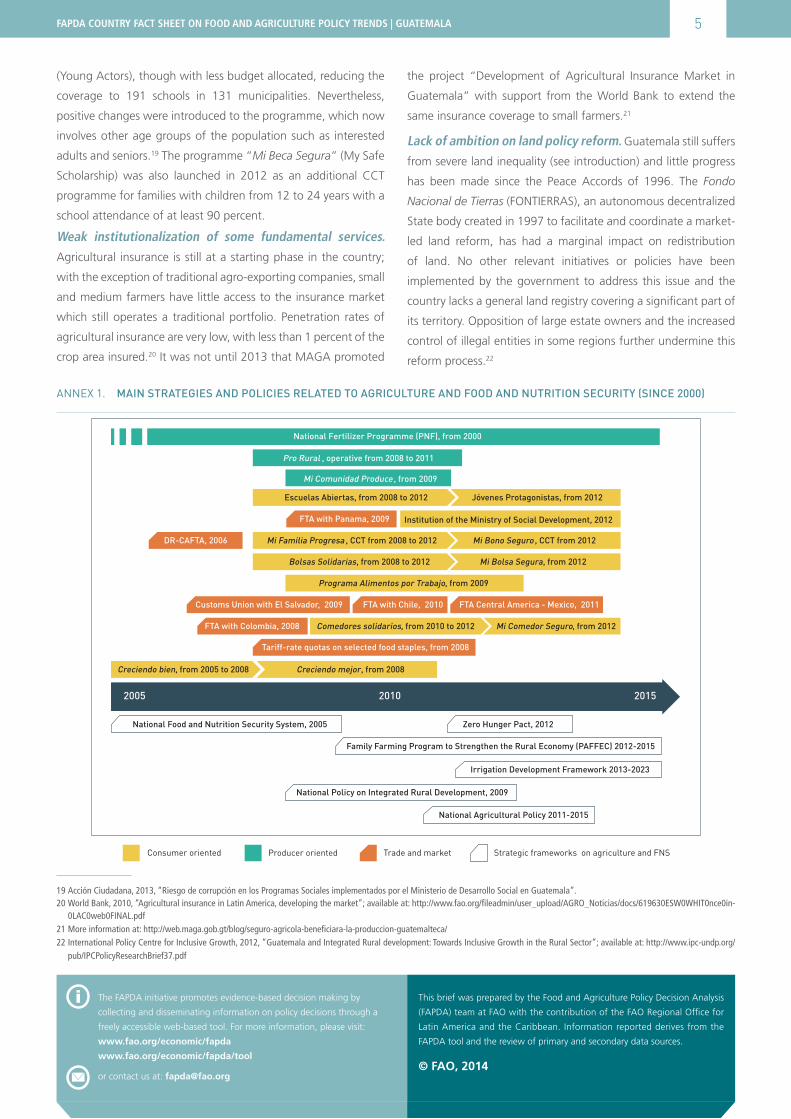
National Fertilizer Programme (PNF), from 2000
Mi Comunidad Produce
Institution of the Ministry of Social Development, 2012
Programa Alimentos por Trabajo, from 2009
, operative from 2008 to 2011Pro Rural
, from 2009
Escuelas Abiertas, from 2008 to 2012 Jóvenes Protagonistas, from 2012
, CCT from 2008 to 2012Mi Familia Progresa Mi Bono Seguro , CCT from 2012
Bolsas Solidarias, from 2008 to 2012 Mi Bolsa Segura, from 2012
Comedores solidarios, from 2010 to 2012 Mi Comedor Seguro, from 2012
Creciendo bien, from 2005 to 2008 Creciendo mejor, from 2008
DR-CAFTA, 2006
FTA with Colombia, 2008
FTA with Panama, 2009
Customs Union with El Salvador, 2009 FTA Central America - Mexico, 2011FTA with Chile, 2010
Tariff-rate quotas on selected food staples, from 2008
National Food and Nutrition Security System, 2005
National Policy on Integrated Rural Development, 2009
National Agricultural Policy 2011-2015
Irrigation Development Framework 2013-2023
Family Farming Program to Strengthen the Rural Economy (PAFFEC) 2012-2015
Zero Hunger Pact, 2012
2005 2010 2015
Consumer oriented Producer oriented Trade and market Strategic frameworks on agriculture and FNS
Annex 1. Main strategies and policies related to agriculture and food and nutrition security (since 2000)