country profile saudi arabia - fao.org · saudi arabia engineering consult, gave an estimate of...
TRANSCRIPT

Country profile – Saudi Arabia
Version 2008

Recommended citation: FAO. 2008. AQUASTAT Country Profile – Saudi Arabia.
Food and Agriculture Organization of the United Nations (FAO). Rome, Italy
The designations employed and the presentation of material in this information product do not imply the expression of any opinion whatsoever on the part of the Food and Agriculture Organization of the United Nations (FAO) concerning the legal or development status of any country, territory, city or area or of its authorities, or concerning the delimitation of its frontiers or boundaries. The mention of specific companies or products of manufacturers, whether or not these have been patented, does not imply that these have been endorsed or recommended by FAO in preference to others of a similar nature that are not mentioned. The views expressed in this information product are those of the author(s) and do not necessarily reflect the views or policies of FAO. FAO encourages the use, reproduction and dissemination of material in this information product. Except where otherwise indicated, material may be copied, downloaded and printed for private study, research and teaching purposes, or for use in non-commercial products or services, provided that appropriate acknowledgement of FAO as the source and copyright holder is given and that FAO’s endorsement of users’ views, products or services is not implied in any way. All requests for translation and adaptation rights, and for resale and other commercial use rights should be made via www.fao.org/contact-us/licencerequest or addressed to [email protected]. FAO information products are available on the FAO website (www.fao.org/ publications) and can be purchased through [email protected]. © FAO 2008


1
Saudi Arabia
GEOGRAPHY, CLIMATE AND POPULATION
Geography
The Kingdom of Saudi Arabia, with a total area of about 2.15 million km2, is by far the largest country
on the Arabian Peninsula. It is bordered in the north by Jordan, Iraq and Kuwait, in the east by the
Persian Gulf with a coastline of 480 km, in the southeast and south by Qatar, the United Arab Emirates,
Oman and Yemen, and in the west by the Red Sea with a coastline of 1 750 km.
It can be divided into four main physiographic units:
the Western Mountains, called the Arabian Shield, with the highest peak at 2 000 metres above
sea level and crossed by deep valleys;
the Central Hills, which run close to the western mountains and lie in the centre of the country.
Their elevation ranges from 900 to 1 800 metres above sea level;
the Desert Regions, which lie to the east of the Central Hills, with elevations ranging from 200
to 900 metres. Sand dunes are commonly found in these deserts;
the Coastal Regions, which include the coastal strip along the Red Sea with a width of 16 to
65 km. The important part is the Tahama Plain in the south. The plain on the eastern side
overlooks the Persian Gulf, is generally wide and includes the region of oases
The cultivable area has been estimated at 52.7 million ha, which is almost 25 percent of the total area.
In 2005, the cultivated area was 1 213 586 ha, of which 1 011 923 ha consisted of annual crops and
201 663 ha of permanent crops (Table 1). The cultivated area in 2005 was 23 percent less than it was in
1992. The area under annual crops decreased by 33 percent, while the area covered by permanent crops
increased by 111 percent.
Climate
Saudi Arabia lies in the tropical and subtropical desert region. The winds reaching the country are
generally dry, and almost all the area is arid. Because of the aridity, and hence the relatively cloudless
skies, there are great extremes of temperature, but there are also wide variations between the seasons
and regions. In the central region, the summer (May to October) is overwhelmingly hot and dry, with
maximum temperatures of over 50 °C, while the winter is dry and cool with night temperatures close to
freezing. There can be severe frost generally and even weeks of snow in the mountains. The western
and eastern regions are hot and humid in the summer months, with maximum temperatures around 42
°C, while the winters are warm. Prevailing winds are from the north and when they blow coastal areas
become bearable in the summer and even pleasant in winter. The northwardly wind produces sand and
dust storms that can decrease visibility to a few metres in some areas.
In the north, annual rainfall varies between 100 and 200 mm. Further in the south, except near the coast,
annual rainfall drops below 100 mm. The higher parts of the west and south do, however, experience
appreciable rainfalls and over some small areas 500 mm/year is not uncommon. Long-term average
annual precipitation has been estimated at 245.5 km3/year, which is equal to 114 mm/year over the whole
country.

2 Irrigation in the Middle East in figures - AQUASTAT Survey – 2008
FIGURE 1 Map of Saudi Arabia

Saudi Arabia 3
TABLE 1 Basic statistics and population
Physical areas
Area of the country 2005 214 969 000 ha
Cultivated area (arable land and area under permanent crops) 2005 1 213 586 ha
as % of the total area of the country 2005 0.6 %
arable land (annual crops + temp. fallow + temp. meadows) 2005 1 011 923 ha
area under permanent crops 2005 201 663 ha
Population
Total population 2005 24 573 000 inhabitants
of which rural 2005 11.5 %
Population density 2005 11.4 inhabitants/km2
Economically active population 2005 8 694 000 inhabitants
as % of total population 2005 35.4 %
female 2005 21 %
male 2005 79 %
Population economically active in agriculture 2005 600 000 inhabitants
as % of total economically active population 2005 6.9 %
female 2005 9 %
male 2005 91 %
Economy and development
Gross Domestic Product (GDP) (current US$) 2007 381 680 million US$/yr
value added in agriculture (% of GDP) 2007 3 %
GDP per capita 2005 12 843 US$/yr
Human Development Index (highest = 1) 2005 0.812
Access to improved drinking water sources
Total population 1990 89 %
Urban population 2006 97 %
Rural population 1990 63 %
Population
The total population is 24.6 million (2005) of which 11.5 percent is rural (Table 1). In 2005, about 76
percent were estimated to be Saudi nationals. During the period 2000-2005, the annual demographic
growth rate in Saudi Arabia was 2.7 percent.
In 2006, 97 percent of the urban population had access to improved water sources. In 2006, the whole
urban population had access to improved sanitation.
ECONOMY, AGRICULTURE AND FOOD SECURITY
In 2007, the national Gross Domestic Product (GDP) was US$ 381.7 billion. The share of GDP
accounted for by agriculture rose during the 1980s, mainly as a result of the decline in revenue from the
petroleum sector and government efforts to pursue a policy of greater self-sufficiency in agriculture. It
was 8.8 percent in 1993. Since the late 1990s it has fallen again, mainly as a result of the decline in
subsidies from the government to national farmers in an effort to reduce water consumption in
agriculture. In 2007, agriculture accounted for only 3 percent of GDP. The total economically active
population was 8.7 million or over 35 percent of the total population (2005). The population
economically active in agriculture was estimated at 600 000 in 2005, of which only 9 percent was
female.
Even though environmental conditions are not ideal, Saudi Arabia has always attached great importance
to the agricultural sector and has given it priority in its various development plans. The sector is expected
to achieve the goals of economic development among which food security, diversification of the
production base and minimization of the reliance on petroleum as a main source for the national income.

4 Irrigation in the Middle East in figures - AQUASTAT Survey – 2008
Various government policies and programmes have been devised and implemented in the past so as to
permit the achievement of such goals.
These policies and programmes included a great deal of support and encouragement for the private
sector to invest in the agricultural sector, such as subsidies, interest-free loans, and free distribution of
uncultivated land, in addition to the development of infrastructure (roads, dams, irrigation and drainage
canals), extension services, protection, quarantine, research services and training of agricultural
workers, farmers and their sons. All this led to the achievement of self-sufficiency for some important
food crops such as wheat, dates, table eggs, fresh milk and some vegetable products, besides increasing
the levels of self-sufficiency for other vegetables, fruits, poultry meat and lean meat (FAO, 2007).
WATER RESOURCES
Heavy rainfall sometimes results in flash floods of short duration. River beds are dry for the rest of the
time. Part of the surface runoff percolates through the sedimentary layers in the valleys and recharges
the groundwater, while some is lost through evaporation. The largest quantity of runoff occurs in the
western region, which represents 60 percent of the total runoff although it covers only 10 percent of the
total area of the country. The remaining 40 percent of the total runoff occurs in the far south of the
western coast (Tahama), which only covers 2 percent of the total area of the country. Total renewable
surface water resources have been estimated at 2.2 km3/year, most of which infiltrates to recharge the
aquifers. Total renewable groundwater resources have been estimated at 2.2 km3/year and the overlap
at 2 km3/year, which brings the total Internal Renewable Water resources (IRWR) to 2.4 km3/year. Total
groundwater reserves (including fossil groundwater) have been estimated at about 500 km3 of which
340 km3 are probably abstractable at an acceptable cost in view of the economic conditions of the
country.
Groundwater is stored in six major consolidated sedimentary old-age aquifers located in the eastern and
central parts of the country. This fossil groundwater, formed some 20 000 years ago, is confined in sand
and limestone formations of a thickness of about 300 m at a depth of 150 – 1 500 m. Fossil aquifers
contain large quantities of water trapped in fissures. For example, the Saq aquifer in the eastern part of
the country extends over 1 200 km northwards. Nevertheless all of these aquifers are poorly recharged
(water entered these aquifers thousands of years ago), yet continuously ‘mined’. The natural recharge
of these aquifers is only about 3.5 million m3/day, or 1.28 km3/year. These resources are precious as
they are not the product of an ongoing hydrological cycle. According to the Water Atlas of Saudi Arabia,
these resources are estimated at 253.2 km3 as proven reserves, while the probable and possible reserves
of these aquifers are 405 and 705 km3 respectively. In a similar study the Ministry of Planning (MOP)
showed that the reserves amount to 338 km3 with secondary reserves reaching 500 km3 (probable).
Estimates made by the Scientific Research Institute’s Water Resources Division at Dahran city of
36 000 km3 are more than seventy times higher than the above estimates. However, they estimated
870 km3 as being economically abstractable which is somewhat closer to the above figures. Furthermore,
they stressed that with technological advances more amounts could be utilized. An engineering firm, the
Saudi Arabia Engineering Consult, gave an estimate of about 2 175 km3. These studies may indicate
that the estimates of the ministries are very conservative (Al-Mogrin, 2001). In total, an estimated
394 million m3/year flow from aquifers from Saudi Arabia to Jordan (180), Bahrain (112), Iraq (80),
Kuwait (20), and Qatar (2).
In 2004, there were approximately 223 dams of various sizes for flood control, groundwater recharge
and irrigation, with a collective storage capacity of 835.6 million m3. A major dam, the King Fahd dam
in Bisha in the southwest with a capacity of 325 million m3, was built in 1997 and there are plans to
build another 17 dams.
Saudi Arabia is the largest producer of desalinated water from the sea. In 2004 there were 30 desalination
and power plants. There were 24 plants on the west coast and six on the east coast. In 2006, 1.03 km3 of
desalinated water were produced (Table 2). The water produced is used for municipal purposes. The

Saudi Arabia 5
quantities produced cover some 48 percent of municipal uses. In fact, the desalinated water produced is
sometimes exported to distant cities. For instance, in 2004 some 528 million m3 were produced on the
western coast of which over 50 percent was exported to the city of Jiddah, while 536 million m3 were
produced on the eastern coast, of which over 65 percent was exported to the city of Riyadh, which is
located in the centre of the country at about 400 km from the sea on both sides. The total length of
pipelines used for the transmission of desalinated water is about 4 156 km. The capacity of desalinated
water reservoirs amounted to 9.38 million m3.
TABLE 2 Water resources
Renewable freshwater resources
Precipitation (long-term average) - 114 mm/yr
- 245.1 109 m3/yr
Internal renewable water resources (long-term average) - 2.4 109 m3/yr
Total actual renewable water resources - 2.4 109 m 3/yr
Dependency ratio - 0 %
Total actual renewable water resources per inhabitant 2005 98 m3/yr
Total dam capacity 2004 835.6 106 m3
In 2002 total treated wastewater reached almost 548 million m3, of which 123 million m3 were reused.
In 2003 70 sewage treatment plants were in operation. The use of treated wastewater is still limited at
present (166 million m3 in 2006), but it represents a potentially important source of water for irrigation
and other uses.
WATER USE
It is estimated that in 2006 total water withdrawal was at 23.7 km3, an increase of 40 percent compared
to 1992, shared between the various sectors as follows: agriculture 88 percent, municipal 9 percent, and
industry 3 percent (Table 3 and Figure 2). The boom in desert agriculture tripled the volume of water
used for irrigation from about 6.8 km3 in 1980 to about 21 km3 in 2006. The total surface water and
groundwater withdrawal represented 943 percent of the total renewable water resources. Groundwater
resources of Saudi Arabia are being depleted at a very fast rate. Most water withdrawn comes from
fossil, deep aquifers and some predictions suggest that these resources may not last more than about 25
years. The quality of the abstracted water is also likely to deteriorate with time because of the flow of
low quality water in the same aquifers towards the core of the depression at the point of use. In 2003
there were 5 661 government wells assigned for municipal purposes and 106 370 multipurpose private
wells. Treated wastewater is used to irrigate non-edible crops, for landscape irrigation and for industrial
cooling, while desalinated water is used for municipal purposes (Figure 3).
TABLE 3 Water use
Water withdrawal
Total water withdrawal 2006 23 666 106 m3/yr
- irrigation + livestock 2006 20 826 106 m3/yr
- municipalities 2006 2 130 106 m3/yr
- industry 2006 710 106 m3/yr
per inhabitant 2006 963 m3/yr
Surface water and groundwater withdrawal 2006 22 636 106 m3/yr
as % of total actual renewable water resources 2006 943 %
Non-conventional sources of water
Produced wastewater 2000 730 106 m3/yr
Treated wastewater 2002 547.5 106 m3/yr
Reused treated wastewater 2006 166 106 m3/yr
Desalinated water produced 2006 1 033 106 m3/yr
Reused agricultural drainage water - 106 m3/yr

6 Irrigation in the Middle East in figures - AQUASTAT Survey – 2008
FIGURE 2 Water withdrawal by sector Total 23.666 km3 in 2006
FIGURE 3 Water withdrawal by source Total 23.666 km3 in 2006
IRRIGATION AND DRAINAGE
Evolution of irrigation development
In 2000, 1 730 767 ha were equipped for irrigation, meaning an average increase of 0.9 percent per year
since 1992. Only around 70 percent were actually irrigated (Table 4 and Table 5). The source of water
is almost exclusively fossil groundwater (more than 95 percent) (Figure 4).

Saudi Arabia 7
TABLE 4 Irrigation and drainage
Irrigation potential - ha
Irrigation
1. Full or partial control irrigation: equipped area 2000 1 730 767 ha
- surface irrigation 1992 547 000 ha
- sprinkler irrigation 1992 1 029 000 ha
- localized irrigation 1992 32 000 ha
% of area irrigated from primary surface water 2000 0 %
% of area irrigated from primary groundwater 2000 97 %
% of area irrigated from mixed surface water and groundwater 2000 0 %
% of area irrigated from non-conventional sources of water 2000 3 %
area equipped for full or partial control irrigation actually irrigated 1999 1 191 351 ha
- as % of full/partial control area equipped 2000 69 %
2. Equipped lowlands (wetland, ivb, flood plains, mangroves) 2000 0 ha
3. Spate irrigation - ha
Total area equipped for irrigation (1+2+3) 2000 1 730 767 ha
as % of cultivated area - %
% of total area equipped for irrigation actually irrigated 2000 69 %
average increase per year over the last 8 years 1992–2000 0.9 %
power irrigated area as % of total area equipped 2000 97 %
4. Non-equipped cultivated wetlands and inland valley bottoms 2000 0 ha
5. Non-equipped flood recession cropping area 2000 0 ha
Total water-managed area (1+2+3+4+5) 2000 1 730 767 ha
as % of cultivated area - %
Full or partial control irrigation schemes Criteria
Small-scale schemes < 5 ha 1992 450 000 ha
Medium-scale schemes 1992 730 000 ha
large-scale schemes > 200 ha 1992 428 000 ha
Total number of households in irrigation 1992 188 370
Irrigated crops in full or partial control irrigation schemes
Total irrigated grain production (wheat and barley) 2006 2 538 000 metric tons
as % of total grain production 2006 100 %
Harvested crops:
Total harvested irrigated cropped area 2006 1 213 587 ha
Annual crops: total 2006 1 011 924 ha
- Wheat 2006 490 272 ha
- Sorghum 2006 143 745 ha
- Barley 2006 22 091 ha
- Maize 2006 12 123 ha
- Millet 2006 6 119 ha
- Other cereals 2006 229 ha
- Vegetables 2006 113 122 ha
- Potatoes 2006 14 709 ha
- Sesame 2006 2 216 ha
- Fodder 2006 207 298 ha
Permanent crops: total 2006 201 663 ha
- Citrus 2006 10 848 ha
- Fruit 2006 190 815 ha
Irrigated cropping intensity (on full/partial control area actually irrigated) 1999 101 %
Drainage - Environment
Total drained area 2007 10 850 ha
- part of the area equipped for irrigation drained - ha
- other drained area (non-irrigated) - ha
drained area as % of cultivated area - %
Flood-protected areas - ha
Area salinized by irrigation - ha
Population affected by water-related diseases - inhabitants

8 Irrigation in the Middle East in figures - AQUASTAT Survey – 2008
TABLE 5 Total actually irrigated area by irrigation method and region (Agricultural census, 1999)
Region
Traditional irrigation Modern irrigation Total
Area (ha) % Area (ha) % Area (ha) %
Riyad 43 010 15 243 275 85 286 286 24
Makkah 43 924 98 1 032 2 44 957 4
Madinah 26 618 93 2 020 7 28 638 2
Quassim 15 541 7 208 712 93 224 253 19
Eastern 16 081 15 92 987 85 109 067 9
Asir 22 232 99 296 1 22 527 2
Tabuk 5 113 11 42 057 89 47 169 4
Hail 12 368 10 116 139 90 128 507 11
Northern 19 14 114 86 133 0
Jazan 177 375 99 1 995 1 179 370 15
Najran 8 811 69 4 008 31 12 819 1
Baha 2 658 98 55 2 2 713 0
Jouf 11 688 11 93 224 89 104 912 9
Total (*) 385 438 32 805 913 68 1 191 351 100
(*)The area for grains, vegetables, and forage grown under permanent crops is not included Modern irrigation generally refers to trickle irrigation for trees and sprinkler irrigation for grains and forage.
FIGURE 4 Irrigation techniques Total 1 730 767 ha in 2000
Localized and sprinkler irrigation, called modern irrigation, covers about 66 percent, while the
remaining 34 percent is under surface irrigation, called traditional irrigation (Figure 5). The largest
irrigated areas are located in the regions of Riyadh, Quassim, Jazan, Hail, Eastern, and Al Jouf.

Saudi Arabia 9
FIGURE 5 Irrigation techniques Total 1 608 000 ha in 1992
There are three types of schemes that differ in terms of size, level of modernization and ownership
(Figure 6):
1. Very large private societies, such as National Agricultural Development Societies and
Companies, are owned by private firms belonging to one or several owners. Some of these
farms have an area of tens of square kilometers.
2. Large to medium size farms of a few hundred hectares owned by private individuals.
3. Medium to small farms, most of which existed prior to the agricultural development boom that
started in the mid-1970s.
FIGURE 6 Type of irrigation schemes Total 1 608 000 ha in 1992
The first two categories of farms are located in regions with important and good quality groundwater
aquifers and are specialized in terms of production, depending on the region and its vocational
production potential. The most important crops are fodder for dairy production, date palms, vegetables,
cereals, citrus fruits, olives and tropical fruits. They originate from the land distribution by the
government in the late 1970s and early 1980s as part of the policy to develop agriculture.
10 Irrigation in the Middle East in figures - AQUASTAT Survey – 2008
Both categories are equipped with pressurized or modern irrigation technologies and are run as
‘capitalist’ enterprises by foreign managers and technicians, with the exception of a few cases where
surface irrigation methods still prevail. The existence of modern irrigation techniques is not however
necessarily an indication of high water use efficiency. No data are available on the amounts of water
used by these farms, but as a general rule there is overuse in most, if not all, farms.
The existence of such large estates may not be compatible with the available water resources. Non-
sustainability of the water resources used jeopardizes the sustainability of the farms themselves and puts
at stake the profitability of the investments made. In many regions of the country several of these farms
have already abandoned business as a result of groundwater depletion or non-profitability of the
investments made. Based on the information and data available, all farms have been installed with no
prior sound assessment of water resources to determine the extent of safe use or even the rate and
duration of use in the case of limited fossil water.
As far as the third category is concerned, some of these farms went out of business either because of
their non-viable sizes or the incapacity of their owners to drill wells or both. They are less specialized
in production compared with the first two and less modernized. Their irrigation systems and practices
are essentially traditional, with low efficiency surface irrigation methods (FAO, 2007).
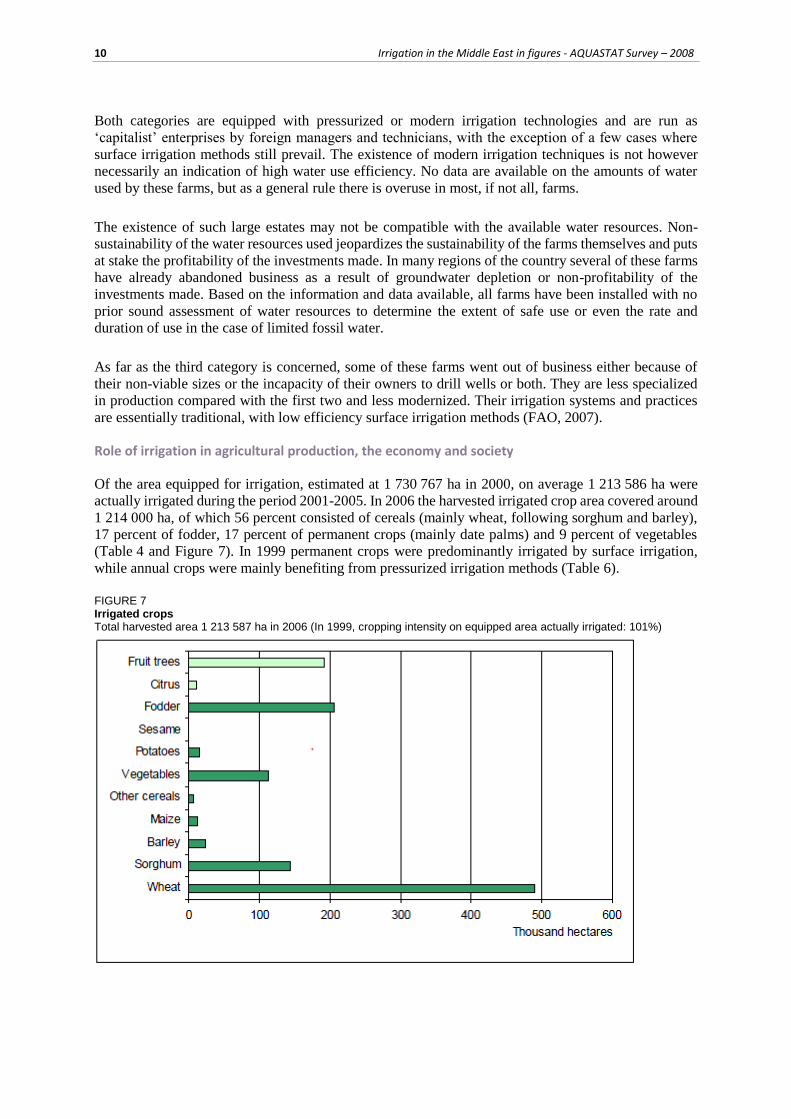
Role of irrigation in agricultural production, the economy and society
Of the area equipped for irrigation, estimated at 1 730 767 ha in 2000, on average 1 213 586 ha were
actually irrigated during the period 2001-2005. In 2006 the harvested irrigated crop area covered around
1 214 000 ha, of which 56 percent consisted of cereals (mainly wheat, following sorghum and barley),
17 percent of fodder, 17 percent of permanent crops (mainly date palms) and 9 percent of vegetables
(Table 4 and Figure 7). In 1999 permanent crops were predominantly irrigated by surface irrigation,
while annual crops were mainly benefiting from pressurized irrigation methods (Table 6).
FIGURE 7 Irrigated crops Total harvested area 1 213 587 ha in 2006 (In 1999, cropping intensity on equipped area actually irrigated: 101%)

Saudi Arabia 11
TABLE 6 Total harvested irrigated area by crop type and irrigation method (Agricultural census, 1999)
Traditional irrigation Modern irrigation Total
Area (ha) % Area (ha) % Area (ha) %
Permanent crops 136 177 74 47 368 26 183 545 15
- Date Palm 117 473 83 24 098 17 141 571 12
- Citrus 3 320 41 4 708 59 8 028 1
- Grapes 3 463 46 4 088 54 7 551 1
- Olives 4 047 39 6 434 61 10 481 1
Temporary crops 273 053 27 748 361 73 1 021 413 85
- Cereals 182 342 26 510 544 74 692 886 58
- Vegetables 34 658 38 55 703 62 90 361 7
- Fodder 56 053 24 182 114 76 238 166 20
Total (*) 409 229 34 795 728 66 1 204 958 100
(*)The area for grains, vegetables, and forage grown under permanent crops is not included Modern irrigation generally refers to trickle irrigation for trees and sprinkler irrigation for grains and forage. The area for modern vegetables includes 3 214 ha of cultivation in greenhouses.
Irrigation development in Saudi Arabia was the result of government policies to boost agricultural
production in the 1970s. Well digging permits were granted to farmers and private companies in the
regions where explorations by the public sector had revealed the existence of groundwater. The permits
allowed farmers to drill wells with interest-free loans and with a subsidy of 50 percent of the cost of
pumping stations. In addition, farmers could get interest free-loans for equipping their farms with
modern irrigation systems, such as centre pivots, as well as for other purposes. At present about two
thirds of the irrigated area is equipped with modern irrigation systems.
To promote the generalization of modern irrigation techniques, the Ministry of Agriculture (MOA) is
currently providing subsidized tree seedlings, but only to those farms already equipped with these
systems. In fact, subsidized seedlings have been provided for around twenty years in order to promote
the production of fruit crops, such as citrus trees in Najran, tropical species in Jizan, palm trees in several
regions and other types elsewhere (olive trees, etc.) This is actually encouraging farmers to switch from
wheat to fruit trees as a result of the government policy to reduce the area cropped by wheat by reducing
the quantity of wheat purchased from farmers. However, depending on the area involved in the shift
from wheat to fruit trees, it may well be that reducing the wheat area will actually result in putting more
pressure on water resources once the trees become adult. Being perennial crops, fruit trees require more
water than the annual cereals on an equal area basis.
Reducing the quantity of wheat purchased by the government from farmers has resulted in a gradual
decrease in annual production over more than five years from over 4 million tonnes at the beginning of
the 1990s to about 2 million tonnes. Other measures taken by the government with the objective of
‘reducing pressure on water’ include: banning wheat and forage exports and not purchasing barley from
farmers (FAO, 2007). In general, the production of cereals is about 60 percent of what it was at the
beginning of the 1990s.
Status and evolution of drainage systems
Drainage problems occur in several parts of the country because of the existence of shallow,
impermeable layers. About 10 850 ha, equivalent to 0.6 percent of the equipped area for irrigation, have
drainage facilities under governmental management (Table 4). The drainage systems mainly consist of
open drainage canals. In several projects, such as the Al-Hassa irrigation project in the east, agricultural
drainage water is reused for irrigation after being mixed with fresh groundwater.
Soil salinity is being noticed in parts of the newly developed areas because of poor irrigation water
quality and the poor drainage conditions of some soils.

12 Irrigation in the Middle East in figures - AQUASTAT Survey – 2008
WATER MANAGEMENT, POLICIES AND LEGISLATION RELATED TO WATER USE IN AGRICULTURE
Institutions
In 2001 a Ministry of Water was created to contain part of the Ministry of Municipal and Rural Affairs
(MOMRA) and part of the former Ministry of Agriculture and Water (MOAW). This new ministry was
responsible for supervising the water sector, developing water related policies and setting up
mechanisms and instruments aimed at managing the water resources and water services delivery in an
efficient and sustainable way. In 2004 the Ministry of Water also became responsible for the electricity
sector and was restructured as the Ministry of Water and Electricity (MOWE) in order to ensure
optimum coordination between the development of water desalination and electricity production.
The Water Sector within the MOWE has two main programmes:
Water resources development, which includes all activities related to geological and
hydrological studies, wastewater reuse investigations, well drilling and dam construction, and
the preparation of the national water plan
Drinking water supply, which includes the construction of drinking water supply networks to
various towns and cities that do not have local water authorities or municipalities
The Ministry of Agriculture (MOA) is responsible for the scheme’s operation and maintenance
programme, while on-farm water management is the farmers’ responsibility. The Ministry is responsible
for issues affecting more than one farmer, such as for example irrigation networks, drainage, pest control
and so on.
In January 2005 the MOA created the General Administration of Irrigation Affairs (GAIA), following
the creation of the MOWE that inherited the MOA’s water sector. The GAIA is responsible for
organizing, planning, monitoring, developing, operating and maintaining irrigation and drainage
projects and programs, together with the application of modern systems, the determination of crop water
requirements, as well as ensuring that irrigation water will have no harmful effects on public health.
The National Irrigation Authority (NIA) started operating in 1982 in the Province of Riyadh to reuse the
largest amount of treated wastewater in Saudi Arabia, amounting to 33 percent of the total annually
treated effluent, mainly for irrigation. The NIA is responsible for the operation of the infrastructure and
the monitoring of water reuse practices and the compliance of farmers with standards and guidelines. In
2004 it covered a total of 455 farms for a total area of 17 429 ha (about 12 000 ha irrigated). The average
distributed volume of wastewater is about 50 million m3 per year.
The Al-Hassa Irrigation and Drainage Authority (HIDA) is part of the MOA and is in charge of
hydrological studies and data collection to improve the use of water for irrigation. It is also responsible
for irrigation water conservation, estimation of crop water requirements, irrigation water distribution to
the farms and the operation and maintenance of irrigation and drainage canal systems in the irrigation
schemes managed by the MOA.
The Irrigation and Drainage project in Domat AI Jandal (IDD) started in 1989. It consists of a collective
project covering a designated area of 1 600 ha, serving about 2 000 farms in Al-Jouf in the northern part
of the country.
The Saline Water Conversion Corporation (SWCC) is responsible for the construction, operation and
maintenance of desalination plants.

Saudi Arabia 13
Water management
Due to the government’s awareness of the scarcity of water, the MOA implemented several measures
to encourage farmers to apply irrigation water saving techniques. Furthermore, some of the subsidies
and support programmes that contributed to the depletion of groundwater resources in agriculture have
been discontinued or revised. A collaborative programme has been initiated with the World Bank to
provide technical assistance in reorganizing the water sector as a whole.
The MOA provides technical training courses and workshops regarding irrigation water management
for its employees as well as others in different public and private sectors. Some courses are coordinated
with international organizations, such as the FAO. Unfortunately the MOA lacks sound and effective
extension services, has no strategy for capacity building, and has weak information management
systems. Furthermore, no water user associations exist in the country.
An academic association was recently created, the Saudi Water Science Society hosted by the King Fahd
University of Petroleum and Minerals. Its main purpose is to provide a union of experts, scientists,
businessmen, and so on, all of whom have an interest in water concerns and issues in the country.
Policies and legislation
Since the creation of the MOWE, various water laws are under revision and reformulation to assure
institutional compatibility with the new institutional structure. At the same time the MOA is reviewing
agricultural policy. Currently there still are grey areas with overlapping responsibilities regarding
irrigation and the control and implementation of water reuse for irrigation.
PROSPECTS FOR AGRICULTURAL WATER MANAGEMENT
Irrigated agriculture has reached a stage where it needs a reform that focuses on productivity and
sustainability of the investment made by the public sector and private farmers, as well as the rational
use of its limited water resources. Irrigated agriculture is leading to the depletion of several aquifers and
is putting the sustainability of the investments made at risk. Water productivity is still relatively low
despite the introduction of modern irrigation techniques. The Ministry of Agriculture is developing a
new agriculture strategy geared towards a greater macro-economic development of the sector, while
sustaining the basic resources and increasing their productivity.
A “Future Plan for Agriculture” (draft version of November 2004) was developed in studies carried out
by the PARCI (King Saud University). With regard to land and water resources, the plan calls for (FAO,
2007):
Reducing water demand through a policy of diversification of agricultural production, taking
into account the comparative advantages of each region in the country;
Stopping expansion of high water consuming crops such as dates and forage;
Concentrating on high added value crops;
Stopping the distribution of agricultural land except in regions with sufficient renewable water
resources;
Improving irrigation water management and using modern irrigation methods, and stopping
any support for well digging or water extraction;
Estimating crop water requirements;
Encouraging farmers to make use of tools that help manage irrigation water better, such as soil
probes for a better scheduling of irrigation water deliveries;
Respecting standards set by the MOA for digging wells, in collaboration with well digging
companies;
Taking a decision to solve the situation of open hand-dug wells, either through the use of
adequate piping systems or closing these wells and digging others;

14 Irrigation in the Middle East in figures - AQUASTAT Survey – 2008
Controlling water consumption through the use of meters for measuring the amount of water
flowing out of the wells;
Water pricing for all water used above the crop water requirements, starting with agricultural
companies and specialized farms;
Intensifying agricultural extension so as to make farmers more aware of the need to conserve
water resources and to encourage a new dynamic in the role of agricultural associations and
cooperatives in this respect;
Establishing as a condition for the issuance of permits for agricultural projects the use of water
conserving irrigation techniques, as well as an assessment of the relative characteristics of the
region and its water potential;
Expanding the use of treated wastewater in the agriculture and industry sector;
Orienting and supporting research aimed at producing crop varieties that are resistant to
drought, salinity or acid soils.
The next step for the MOA is to create an irrigation strategy that includes all its actions and activities in
order to achieve the goals developed in the agriculture plan by 2020.
MAIN SOURCES OF INFORMATION
Abdallah E. Dabbagh and Walid A. Abderrahman. 1996. Management of groundwater resources in Saudi
Arabia under various irrigation water use scenarios. In: Arabian Journal of Science and Engineering.
Alamoud, A. and Aldakheel, Y. 2003. The importance of renewable water in agricultural development in Saudi
Arabia (in Arabic). Presented at the Symposium on Water as a Strategic Challenge Facing Humanity. Ministry of
Electricity and Water and Ministry of Higher Education, Riyadh.
Aldakheel, Y. 2005. Water governance as part of IWRM in arid regions: a case study of Saudi Arabia. Seminar
on Water Governance: Role of Stakeholders. ESCWA, UN. 14–15 November 2005. Beirut, Lebanon.
Ali A. Al Jaloud. 1991. Agriculture and fertilizer use in Saudi Arabia. Research Institute of Natural Resources
and Environment. Country paper for expert consultation on fertigation/chemigation, Cairo, Egypt, 8–11 September
1991.
Al-Mogrin, S. 2001. Treatment and reuse of wastewater in Saudi Arabia. In: Proceedings, Expert Consultation
for Launching the Regional Network on Wastewater in the Near East.
Department of Economical Studies and Statistics. 2006. Agricultural statistical yearbook. Ministry of
Agriculture.
FAO. 2007. Improvement of irrigation water management in the Kingdom of Saudi Arabia. UTFN/SAU/011/SAU.
General Statistics Authority. 2005. General population census. Ministry of Economics and Planning.
Library of Congress. 2006. Country profile: Saudi Arabia, September 2006. Federal Research Division.
Ministry of Agriculture and Water. 1984. Water Atlas of Saudi Arabia.
Ministry of Higher Education. 1999. Atlas of Saudi Arabia.
Ministry of Water and Electricity. 2004. Water projects in Saudi Arabia.
Saline Water Conversion Corporation. 2002 and 2003. Annual reports.
Walid A. Abderrahman. 1994. Advanced and modern efficient irrigation technology in the Arab World.