country reptrak reputation index 2015
TRANSCRIPT
Country RepTrak®
2015 Country RepTrak®The World’s Most Reputable Countries
July 2015
RepTrak® is a registered trademark of Reputation Institute. Copyright © 2015 Reputation Institute. All rights reserved.The World’s View on Countries: An Online Study of the Reputation of 55 Countries
Country RepTrak®About Reputation Institute
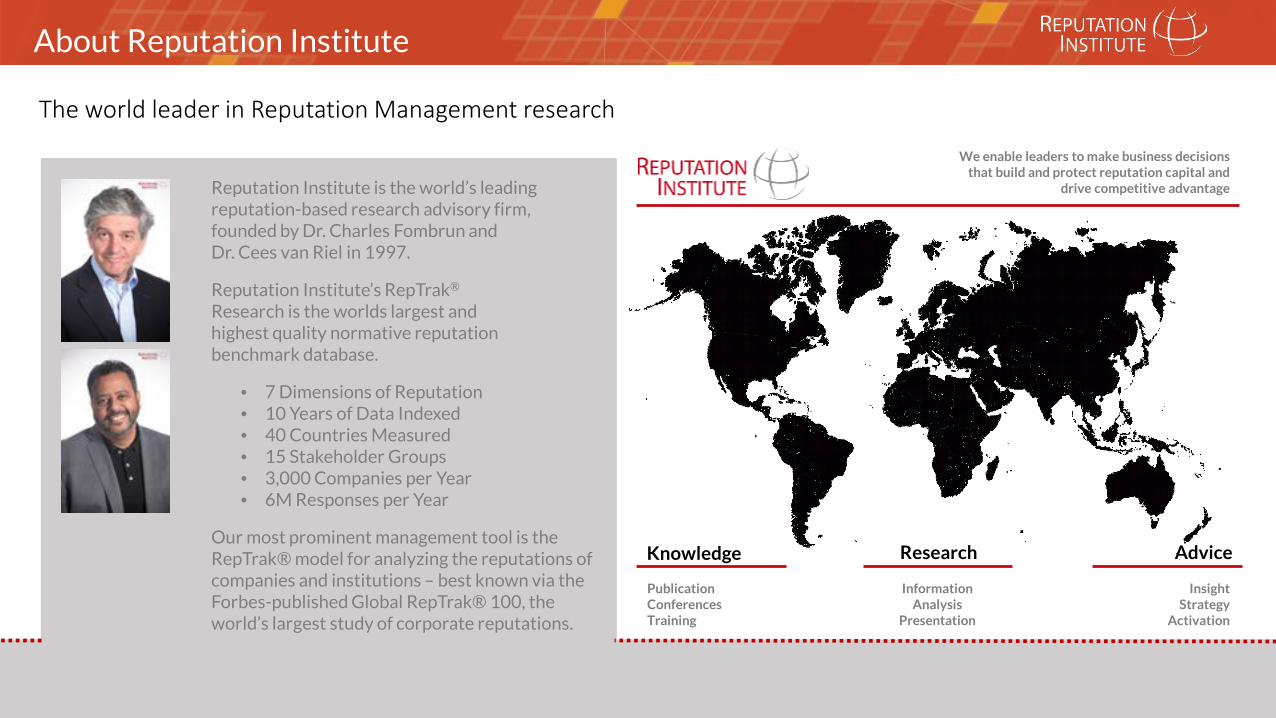
Reputation Institute is the world’s leading reputation-based research advisory firm, founded by Dr. Charles Fombrun and Dr. Cees van Riel in 1997.
Reputation Institute’s RepTrak®
Research is the worlds largest and highest quality normative reputation benchmark database.
• 7 Dimensions of Reputation• 10 Years of Data Indexed• 40 Countries Measured• 15 Stakeholder Groups• 3,000 Companies per Year• 6M Responses per Year
Our most prominent management tool is the RepTrak® model for analyzing the reputations of companies and institutions – best known via the Forbes-published Global RepTrak® 100, the world’s largest study of corporate reputations.
We enable leaders to make business decisions that build and protect reputation capital and
drive competitive advantage
Knowledge AdviceResearch
InsightStrategy
Activation
PublicationConferencesTraining
InformationAnalysis
Presentation
The world leader in Reputation Management research
c
Country RepTrak®
• Country RepTrak® methodology
• The most reputed countries
• Why is a country’s reputation important?
Agenda
Country RepTrak®
4
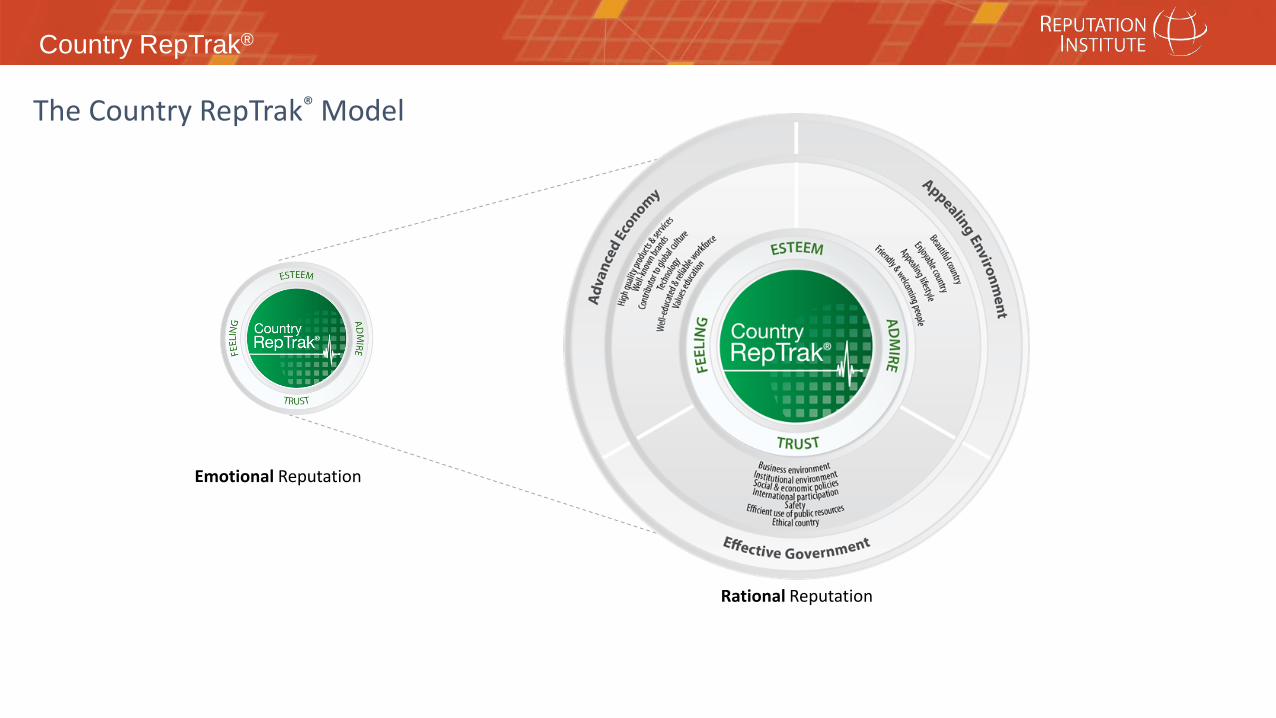
Emotional Reputation
Rational Reputation
The Country RepTrak® Model

Country RepTrak®
5
The Reputation Economy
SupportiveBehaviours
ValueCreation
PerceptionsDirect Experiences
Country Actions & Communications
3rd-party Influence
Stereotypes
Country RepTrak®
6
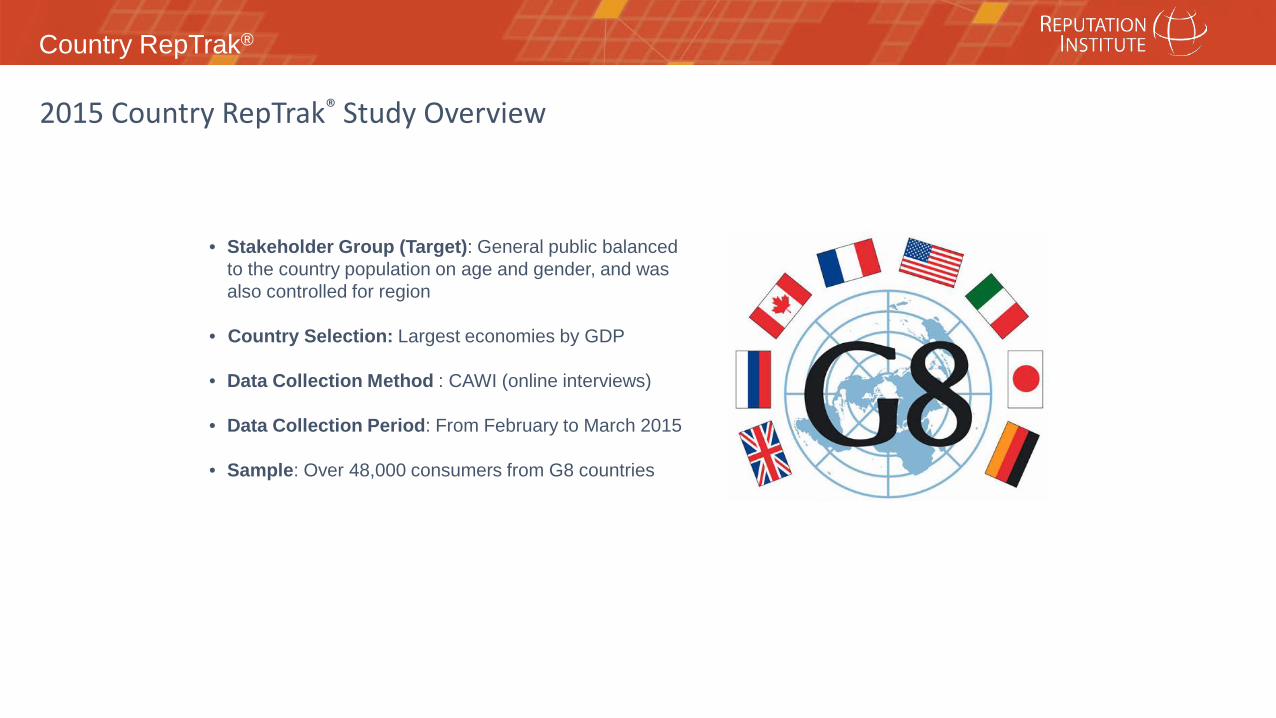
2015 Country RepTrak® Study Overview
• Stakeholder Group (Target): General public balanced to the country population on age and gender, and was also controlled for region
• Country Selection: Largest economies by GDP
• Data Collection Method : CAWI (online interviews)
• Data Collection Period: From February to March 2015
• Sample: Over 48,000 consumers from G8 countries

Country RepTrak®
• Country RepTrak® methodology
• The most reputed countries in 2015
• Why is a country’s reputation important?
Agenda
Country RepTrak®
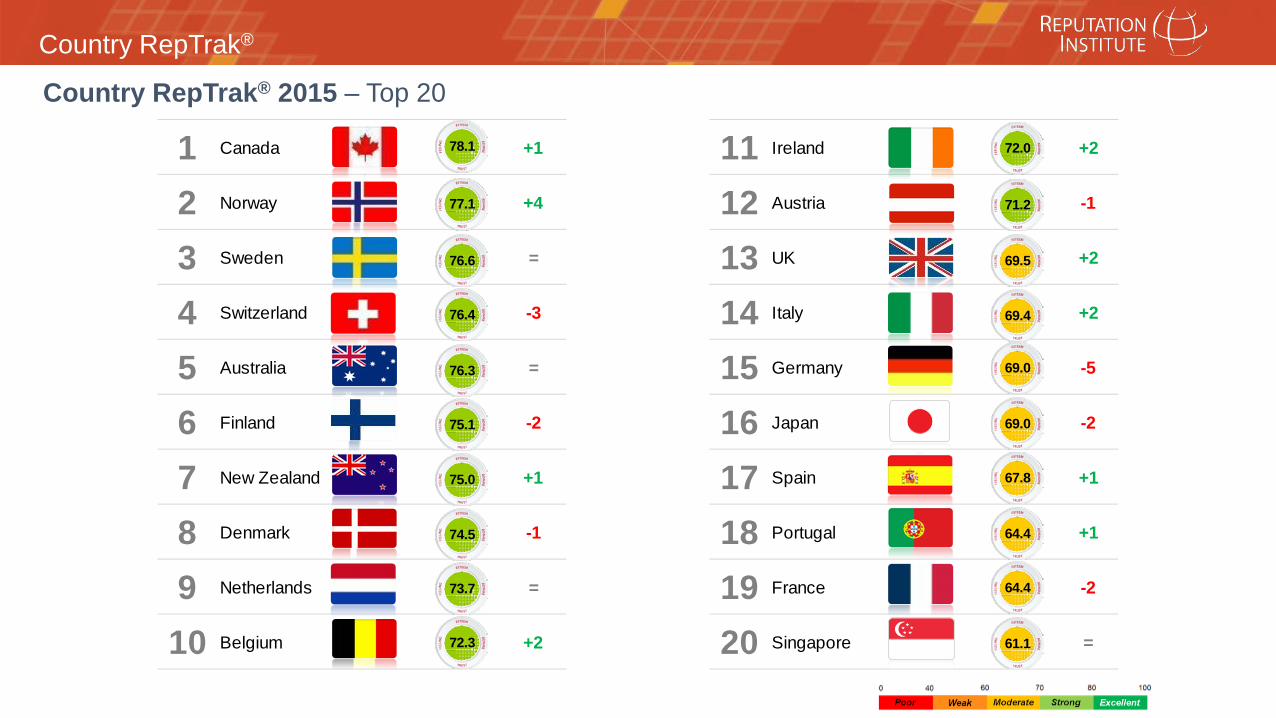
1 Canada +1 11 Ireland +2
2 Norway +4 12 Austria -1
3 Sweden = 13 UK +2
4 Switzerland -3 14 Italy +2
5 Australia = 15 Germany -5
6 Finland -2 16 Japan -2
7 New Zealand +1 17 Spain +1
8 Denmark -1 18 Portugal +1
9 Netherlands = 19 France -2
10 Belgium +2 20 Singapore =
78.1
77.1
76.6
76.4
76.3
75.1
75.0
74.5
73.7
72.3
72.0
71.2
69.5
69.4
69.0
69.0
67.8
64.4
64.4
61.1
Country RepTrak® 2015 – Top 20
Country RepTrak®
9
123456789
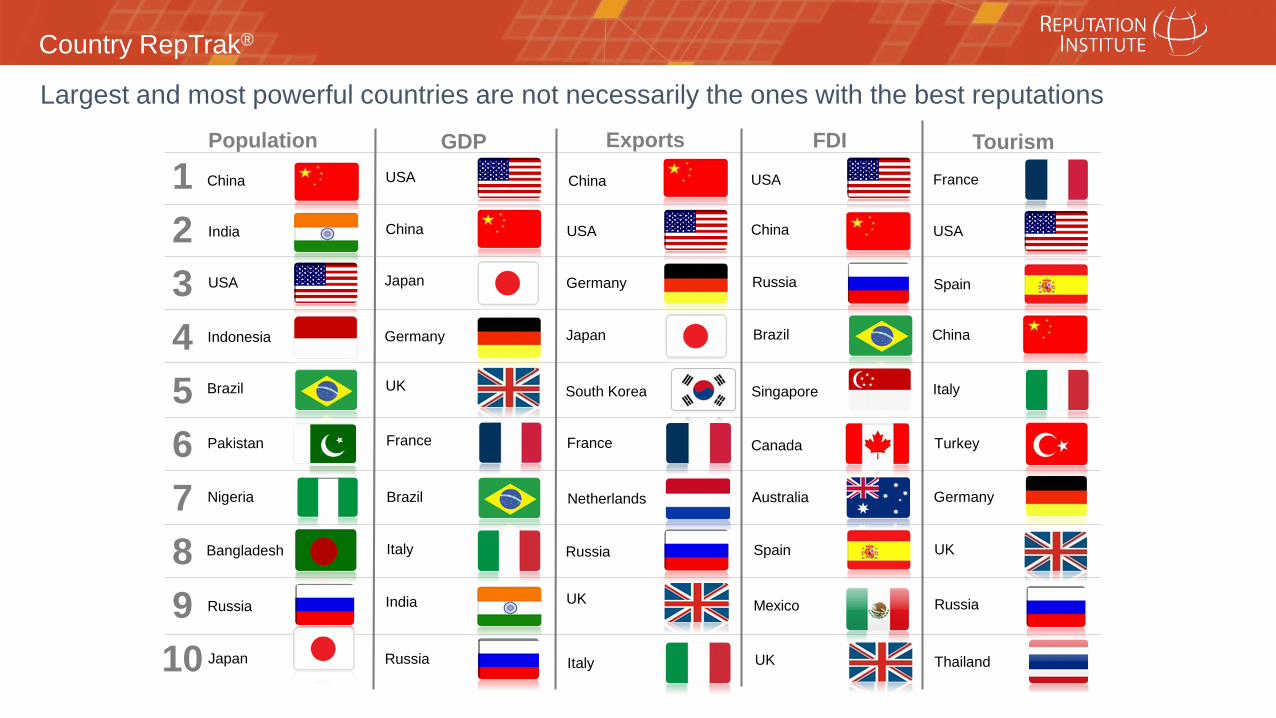
10*Based on World Bank, IMF, WTO, UNCTAD & UNWTO data.
USA
China
Japan
Germany
France
Brazil
UK
Italy
India
Russia
GDPPopulation TourismFDI
China France
Brazil
Germany
China
India
UK
China
USAUSA China
Indonesia
Spain
Japan
USA
Brazil
TurkeyFrance
Australia
USA
Pakistan
Italy
Bangladesh
Germany
Singapore
Russia Russia
Italy
UK
South Korea
Russia
Japan
Russia
Canada
Nigeria Netherlands
UK
Exports
Spain
Mexico
Thailand
Largest and most powerful countries are not necessarily the ones with the best reputations
Country RepTrak®
10
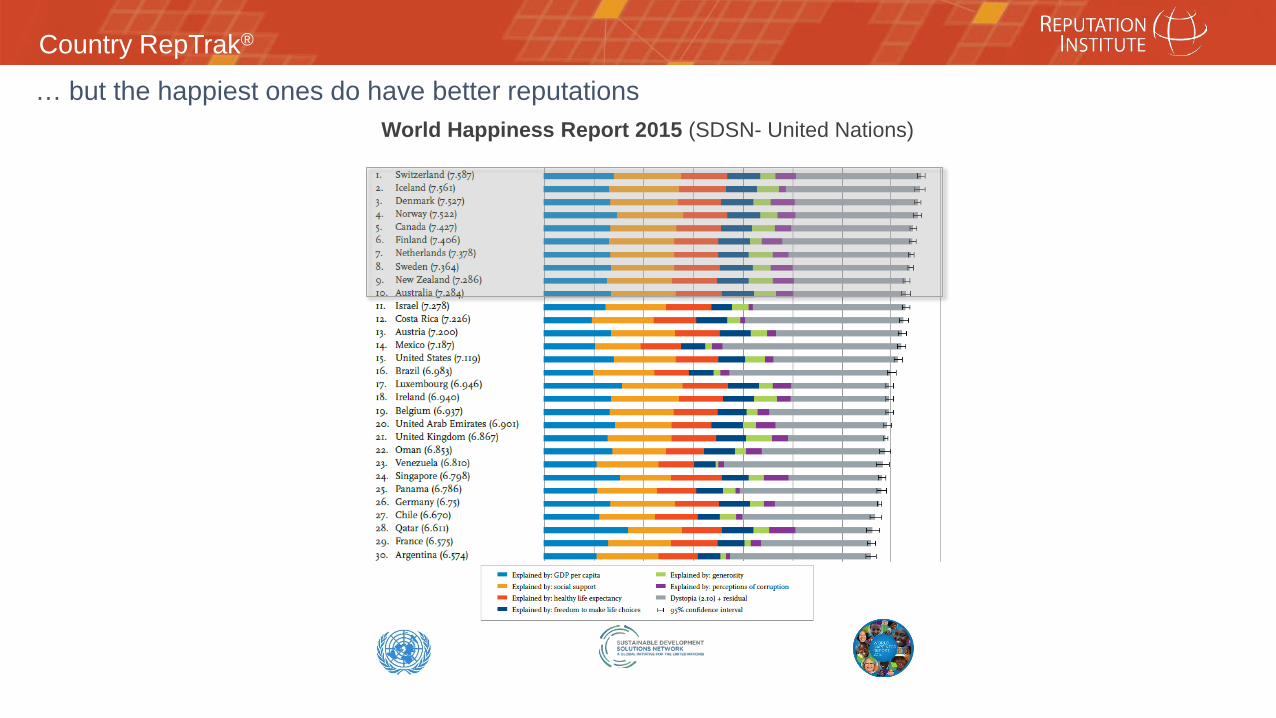
World Happiness Report 2015 (SDSN- United Nations)
… but the happiest ones do have better reputations
Country RepTrak®
11
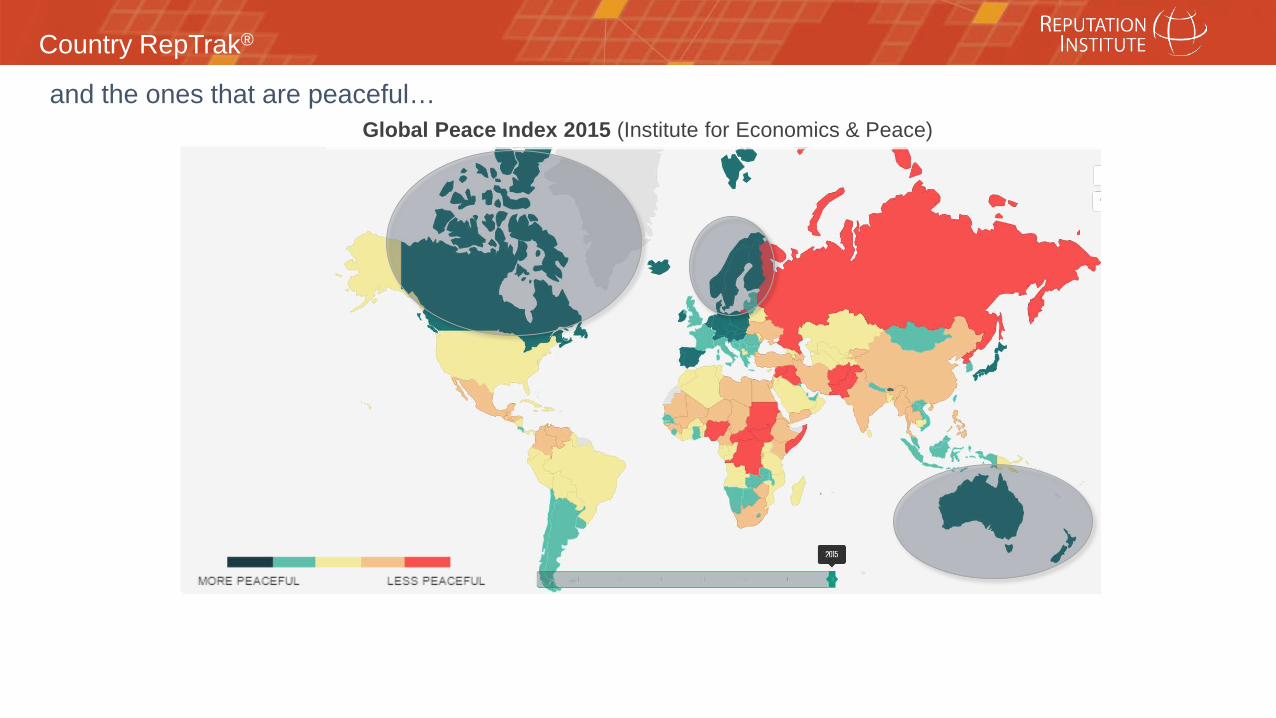
Global Peace Index 2015 (Institute for Economics & Peace)and the ones that are peaceful…
Country RepTrak®
12
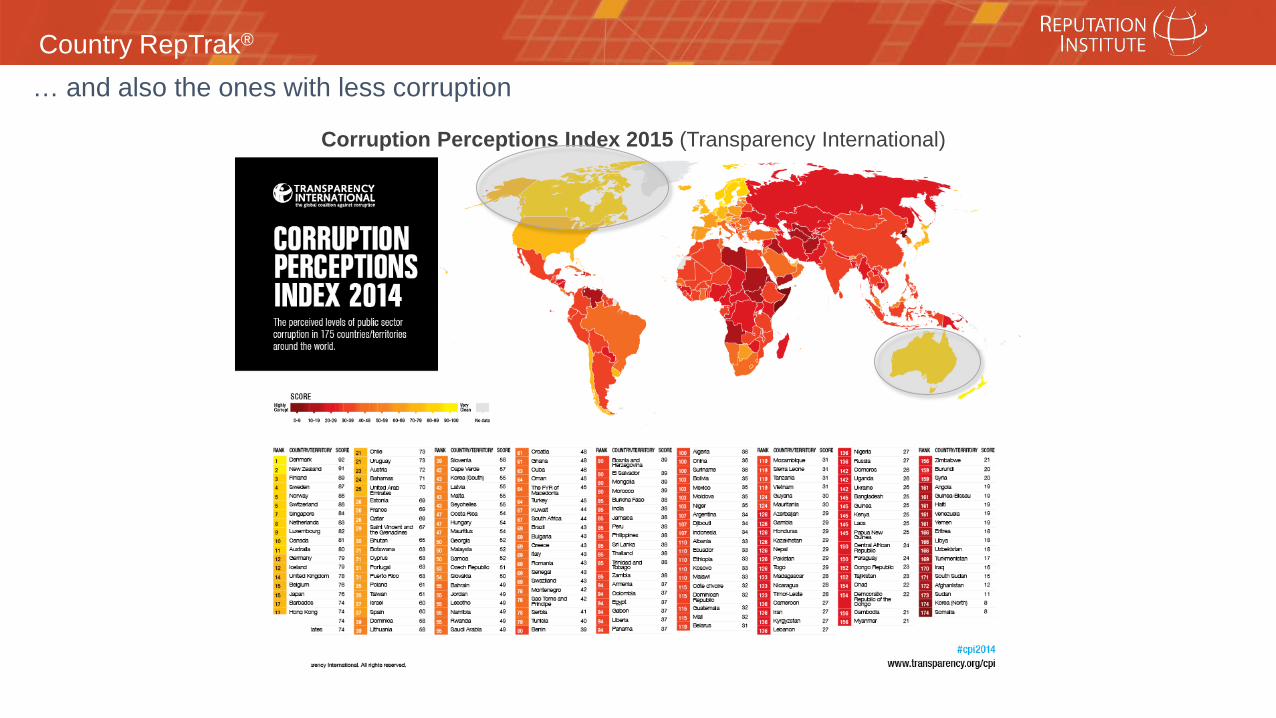
Corruption Perceptions Index 2015 (Transparency International)
… and also the ones with less corruption
Country RepTrak®
13
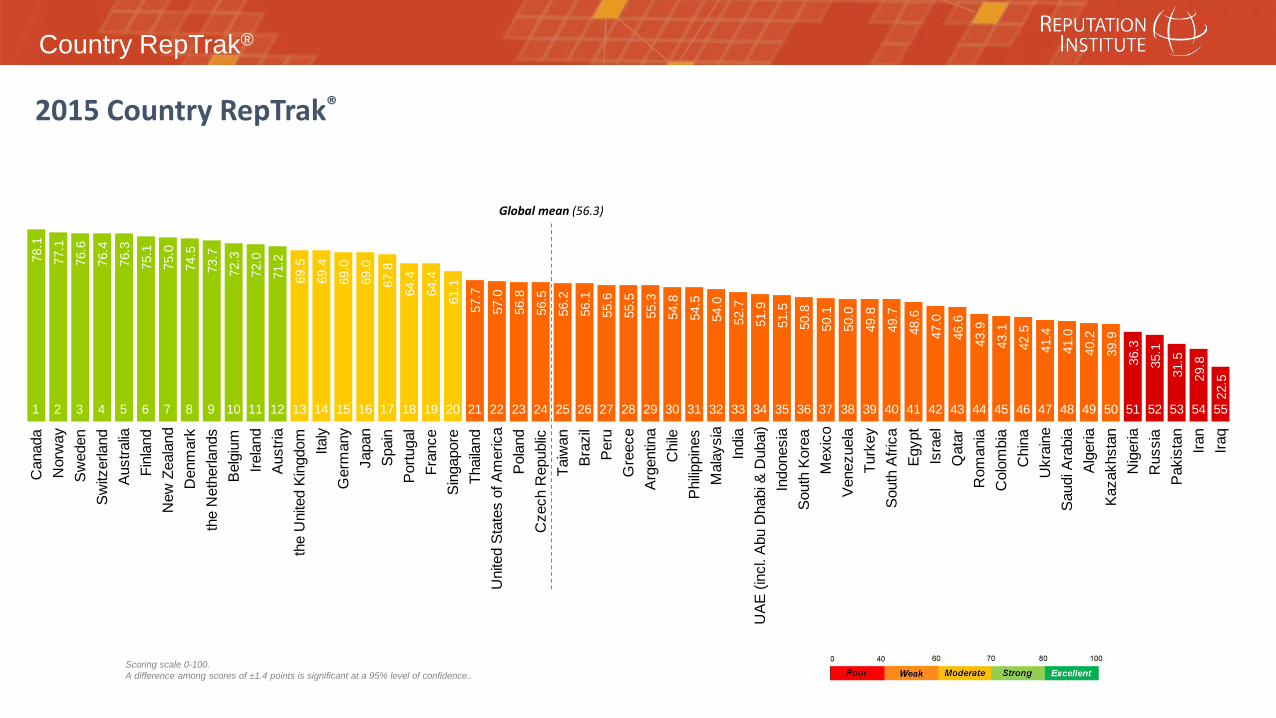
2015 Country RepTrak®
Scoring scale 0-100.A difference among scores of ±1.4 points is significant at a 95% level of confidence..
Can
ada
Nor
way
Sw
eden
Sw
itzer
land
Aus
tralia
Finl
and
New
Zea
land
Den
mar
kth
e N
ethe
rland
sB
elgi
umIre
land
Aus
tria
the
Uni
ted
Kin
gdom Ita
lyG
erm
any
Japa
nS
pain
Por
tuga
lFr
ance
Sin
gapo
reTh
aila
ndU
nite
d S
tate
s of
Am
eric
aP
olan
dC
zech
Rep
ublic
Taiw
anB
razi
lP
eru
Gre
ece
Arg
entin
aC
hile
Phi
lippi
nes
Mal
aysi
aIn
dia
UA
E (i
ncl.
Abu
Dha
bi &
Dub
ai)
Indo
nesi
aS
outh
Kor
eaM
exic
oV
enez
uela
Turk
eyS
outh
Afri
caE
gypt
Isra
elQ
atar
Rom
ania
Col
ombi
aC
hina
Ukr
aine
Sau
di A
rabi
aA
lger
iaK
azak
hsta
nN
iger
iaR
ussi
aP
akis
tan
Iran
Iraq
78.1
77.1
76.6
76.4
76.3
75.1
75.0
74.5
73.7
72.3
72.0
71.2
69.5
69.4
69.0
69.0
67.8
64.4
64.4
61.1
57.7
57.0
56.8
56.5
56.2
56.1
55.6
55.5
55.3
54.8
54.5
54.0
52.7
51.9
51.5
50.8
50.1
50.0
49.8
49.7
48.6
47.0
46.6
43.9
43.1
42.5
41.4
41.0
40.2
39.9
36.3
35.1
31.5
29.8
22.5
1 2 3 4 5 6 7 8 9 10 11 12 13 14 15 16 17 18 19 20 21 22 23 24 25 26 27 28 29 30 31 32 33 34 35 36 37 38 39 40 41 42 43 44 45 46 47 48 49 50 51 52 53 54 55
Global mean (56.3)
Country RepTrak®
14
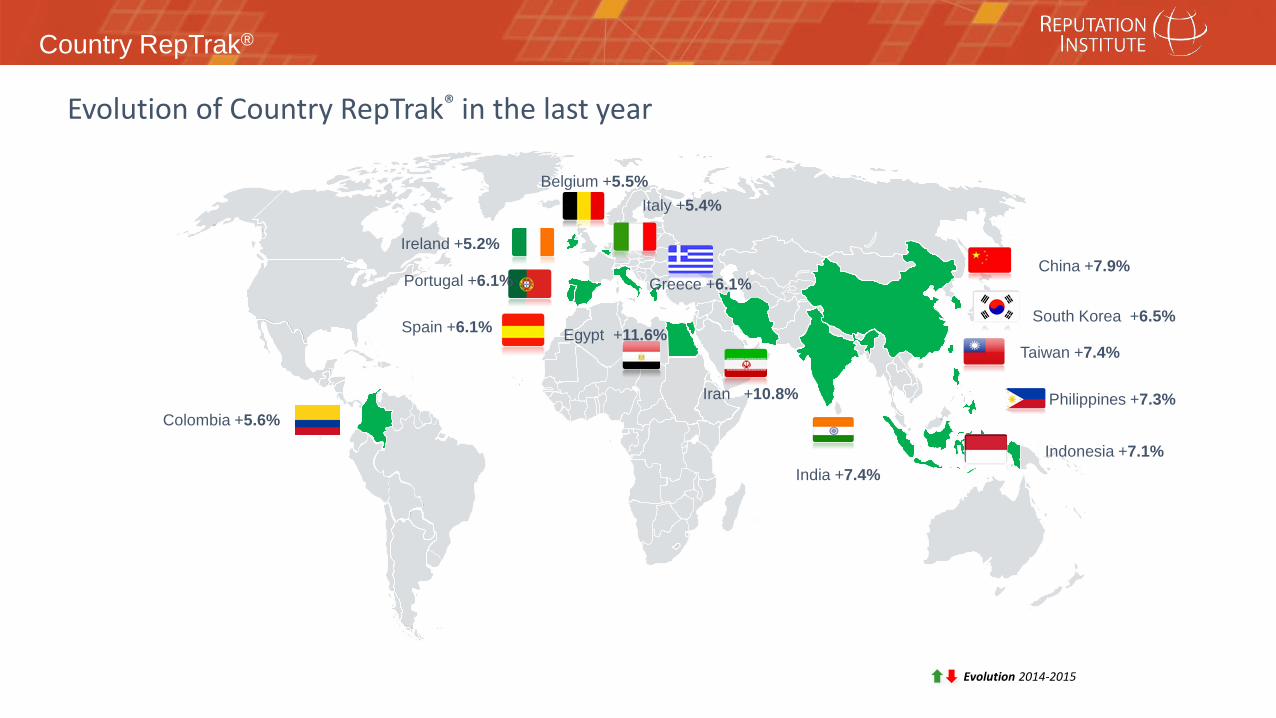
Evolution 2014-2015
Evolution of Country RepTrak® in the last year
Iran +10.8%
Egypt +11.6%
China +7.9%
India +7.4%
Taiwan +7.4%
Indonesia +7.1%
Philippines +7.3%
South Korea +6.5%Spain +6.1%
Portugal +6.1% Greece +6.1%
Belgium +5.5%
Ireland +5.2%
Italy +5.4%
Colombia +5.6%
Country RepTrak®
15
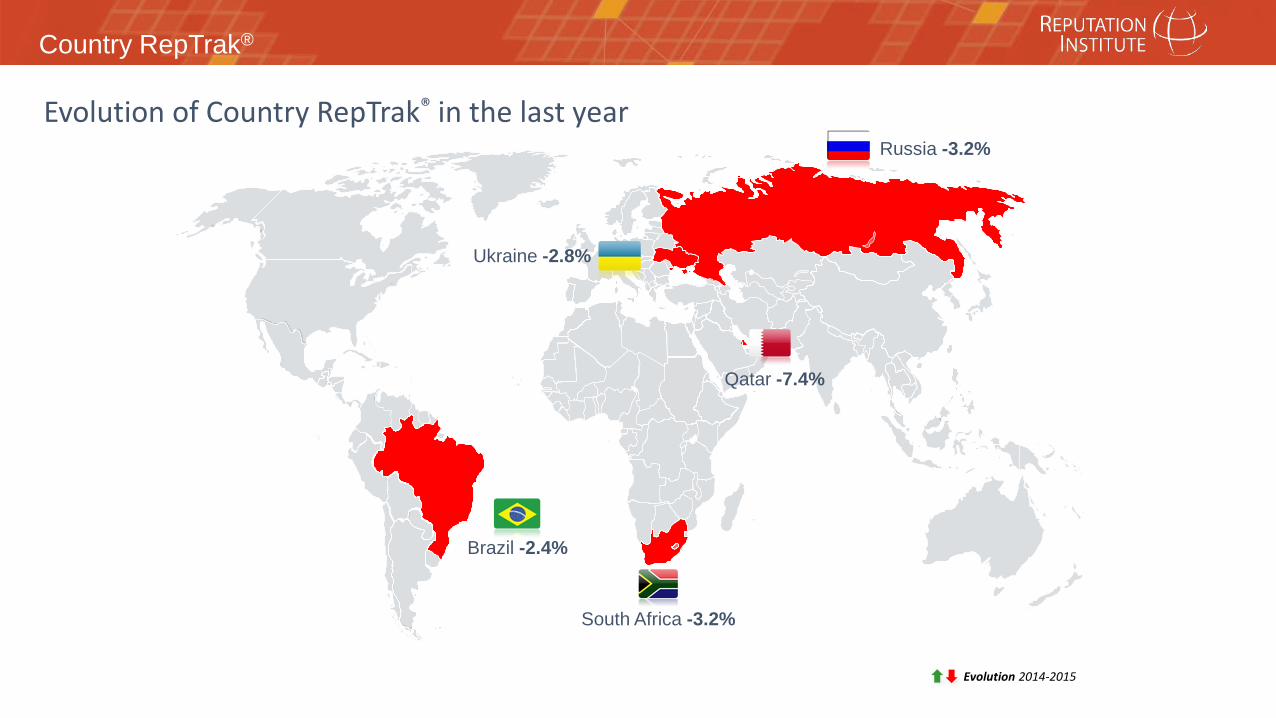
Evolution 2014-2015
Evolution of Country RepTrak® in the last year
Qatar -7.4%
South Africa -3.2%
Russia -3.2%
Ukraine -2.8%
Brazil -2.4%
Country RepTrak®
16
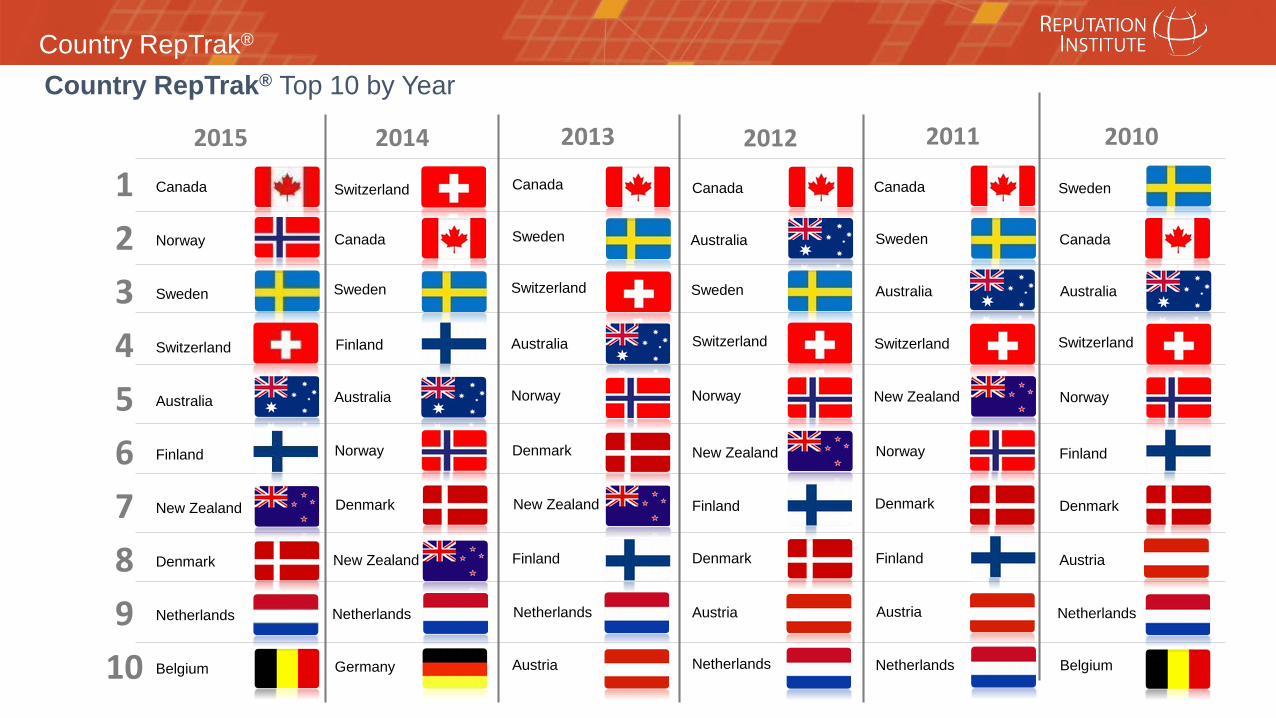
123456789
10
Canada
Sweden
Switzerland
Australia
Norway
New Zealand
Denmark
Netherlands
Austria
Finland
2014 2013 2012 2011 2010
Canada Canada
Australia
AustraliaAustralia
Australia
Sweden
Sweden
Sweden CanadaCanada
Switzerland Switzerland Switzerland
Switzerland
Norway
Norway
Norway
Finland
Sweden
New Zealand
New Zealand
Finland
Finland
FinlandNorway
Austria Austria
AustriaNew Zealand
Denmark DenmarkDenmark
Netherlands Netherlands
NetherlandsNetherlands
Denmark
BelgiumGermany
Canada
Norway
Sweden
Switzerland
Australia
Finland
New Zealand
Denmark
Netherlands
Belgium
2015
Country RepTrak® Top 10 by Year
Country RepTrak®
17
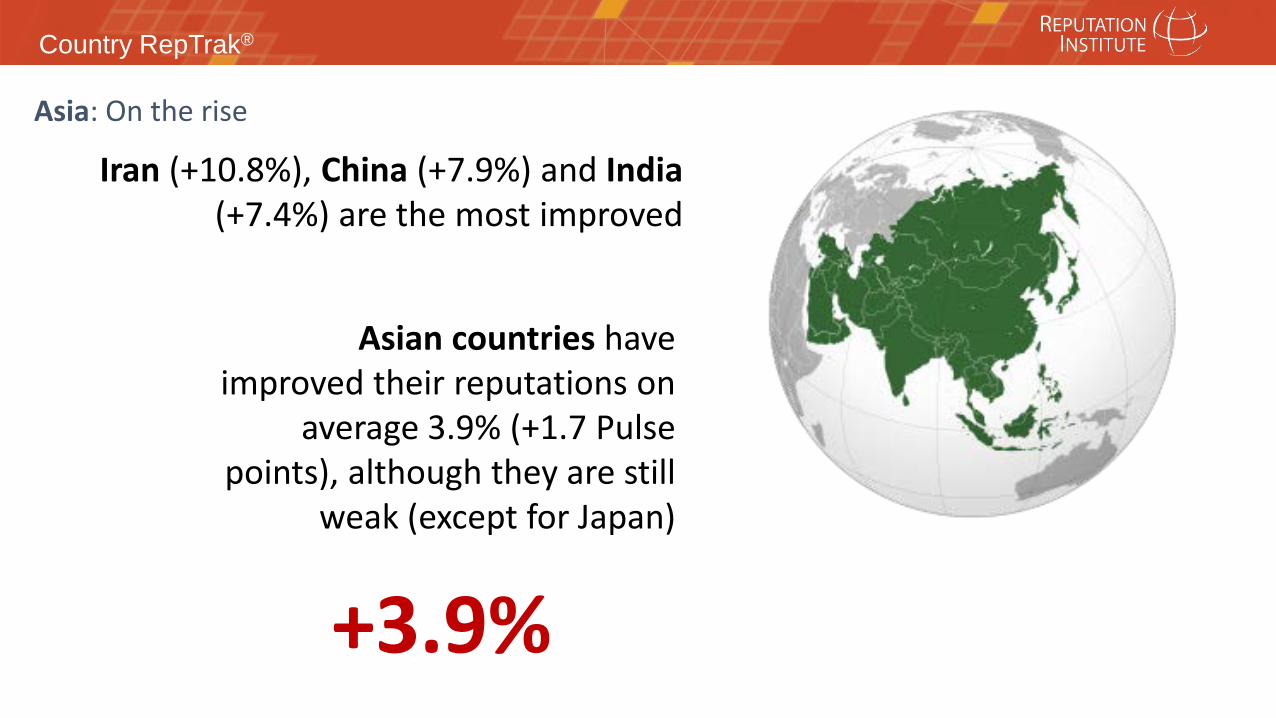
Asia: On the rise
Asian countries have improved their reputations on
average 3.9% (+1.7 Pulse points), although they are still
weak (except for Japan)
+3.9%
Iran (+10.8%), China (+7.9%) and India(+7.4%) are the most improved
Country RepTrak®
18
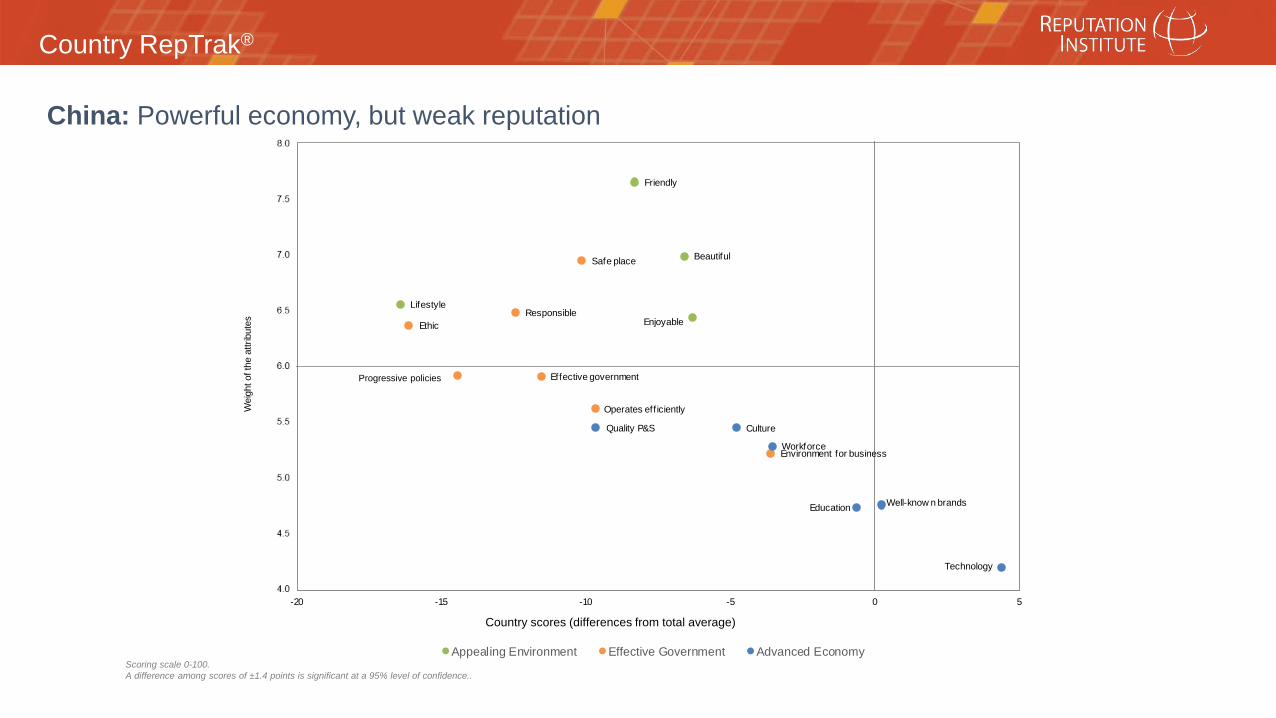
Scoring scale 0-100.A difference among scores of ±1.4 points is significant at a 95% level of confidence..
China: Powerful economy, but weak reputation
Score of the attributes
Wei
ght o
f the
attr
ibut
esSafe place
Responsible Ethic
Orogressive policies Effective government
Operates eff iciently
Environment for business
Friendly
Beautiful
Lifestyle
Enjoyable
Quality P&S Culture
Workforce
Well-know n brandsEducation
Technology
4,0
4,5
5,0
5,5
6,0
6,5
7,0
7,5
8,0
-20 -15 -10 -5 0 5
Appealing Environment Effective Government Advanced Economy
Progressive policies
Country scores (differences from total average)
Country RepTrak®
19
Scoring scale 0-100.A difference among scores of ±1.4 points is significant at a 95% level of confidence..
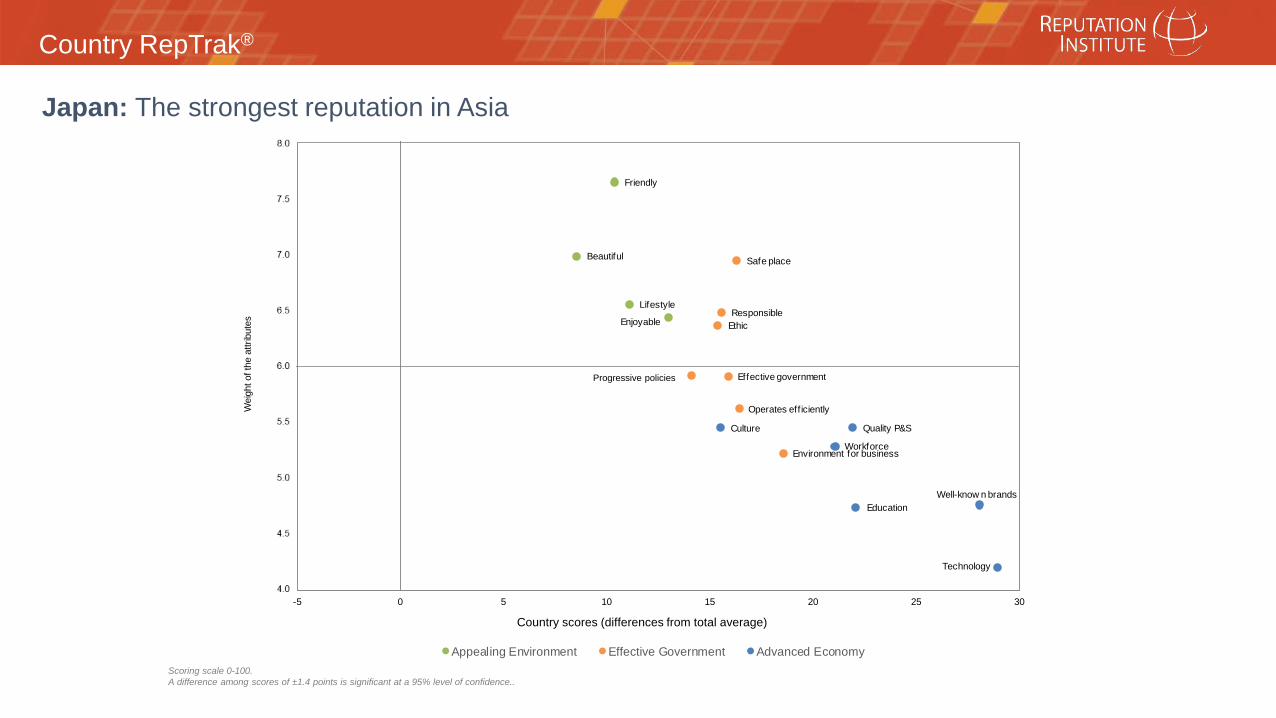
Japan: The strongest reputation in Asia
Score of the attributes
Wei
ght o
f the
attr
ibut
esSafe place
Responsible Ethic
Orogressive policies Effective government
Operates eff iciently
Environment for business
Friendly
Beautiful
Lifestyle
Enjoyable
Quality P&SCulture
Workforce
Well-know n brandsEducation
Technology
4,0
4,5
5,0
5,5
6,0
6,5
7,0
7,5
8,0
-5 0 5 10 15 20 25 30
Appealing Environment Effective Government Advanced Economy
Progressive policies
Country scores (differences from total average)
Country RepTrak®
20
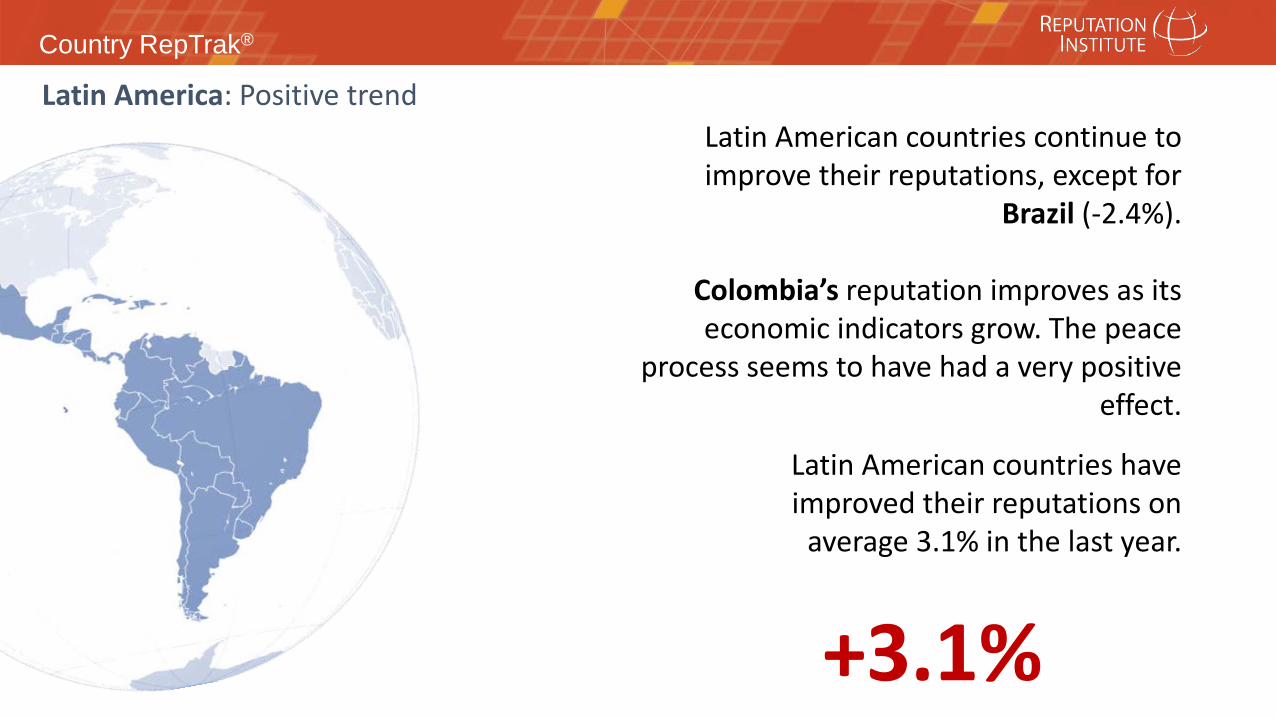
Latin America: Positive trendLatin American countries continue to improve their reputations, except for
Brazil (-2.4%).
Colombia’s reputation improves as its economic indicators grow. The peace
process seems to have had a very positive effect.
Latin American countries have improved their reputations on
average 3.1% in the last year.
+3.1%
Country RepTrak®
21
Scoring scale 0-100.A difference among scores of ±1.4 points is significant at a 95% level of confidence..
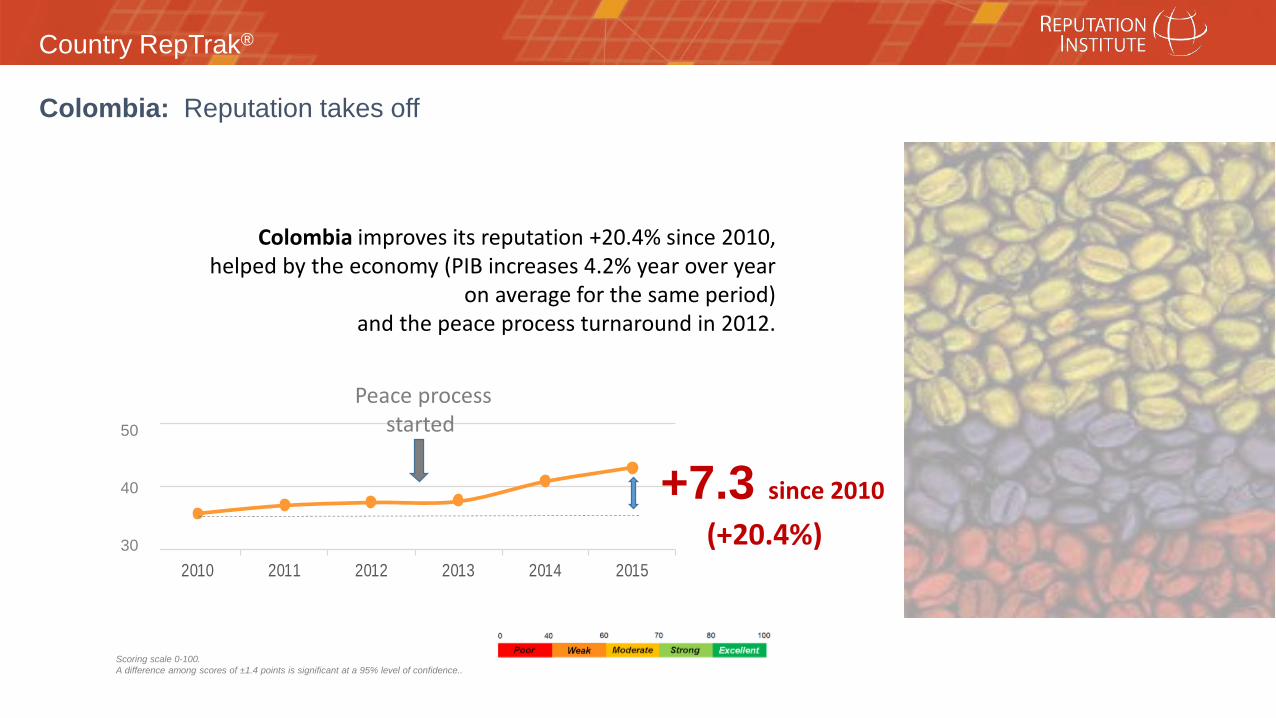
Colombia: Reputation takes off
2010 2011 2012 2013 2014 2015
50
40
30
Colombia improves its reputation +20.4% since 2010, helped by the economy (PIB increases 4.2% year over year
on average for the same period) and the peace process turnaround in 2012.
+7.3 since 2010
(+20.4%)
Peace processstarted
Country RepTrak®
22
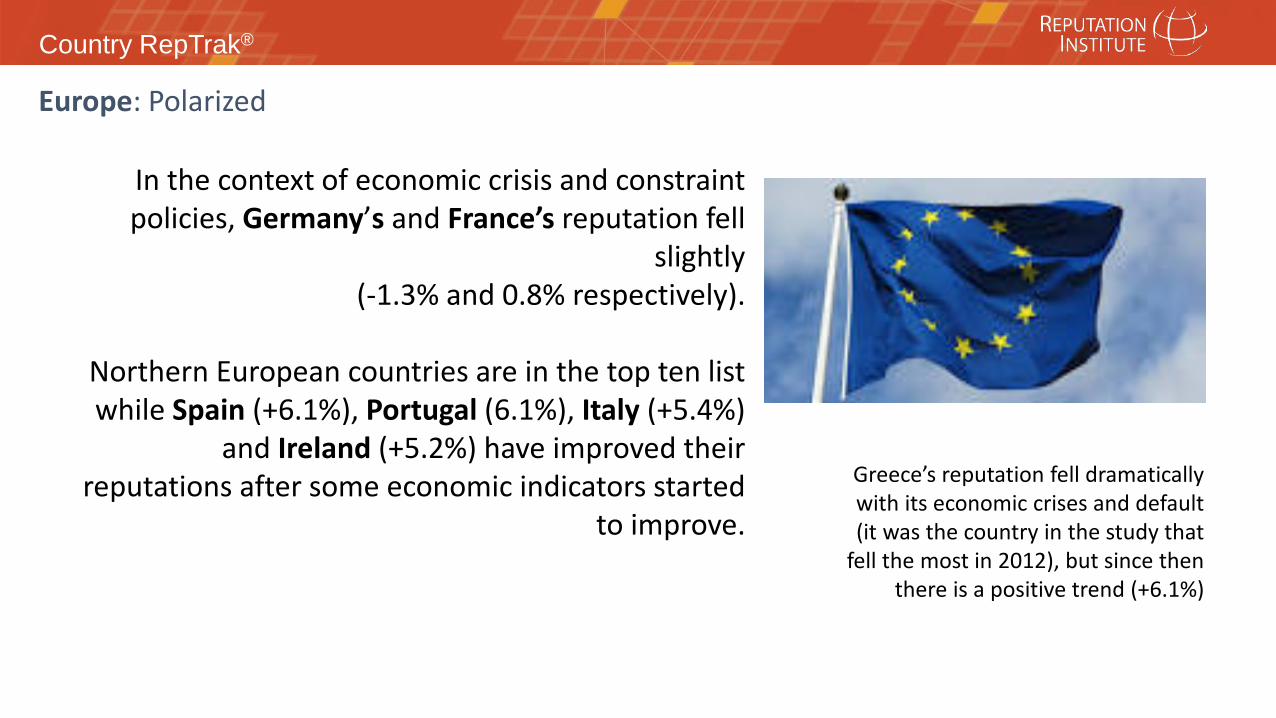
Greece’s reputation fell dramatically with its economic crises and default (it was the country in the study that
fell the most in 2012), but since then there is a positive trend (+6.1%)
Europe: Polarized
In the context of economic crisis and constraint policies, Germany’s and France’s reputation fell
slightly (-1.3% and 0.8% respectively).
Northern European countries are in the top ten list while Spain (+6.1%), Portugal (6.1%), Italy (+5.4%)
and Ireland (+5.2%) have improved their reputations after some economic indicators started
to improve.
Country RepTrak®
23
Relevance
1
4
6
2
12
3
15
11
13
8
5
10
16
14
17
9
7
6.0
5.4
4.4
3.8
3.6
3.3
2.8
1.1
-1.5
-1.9
-2.0
-3.2
-3.8
-4.1
-5.0
-5.7
-5.9
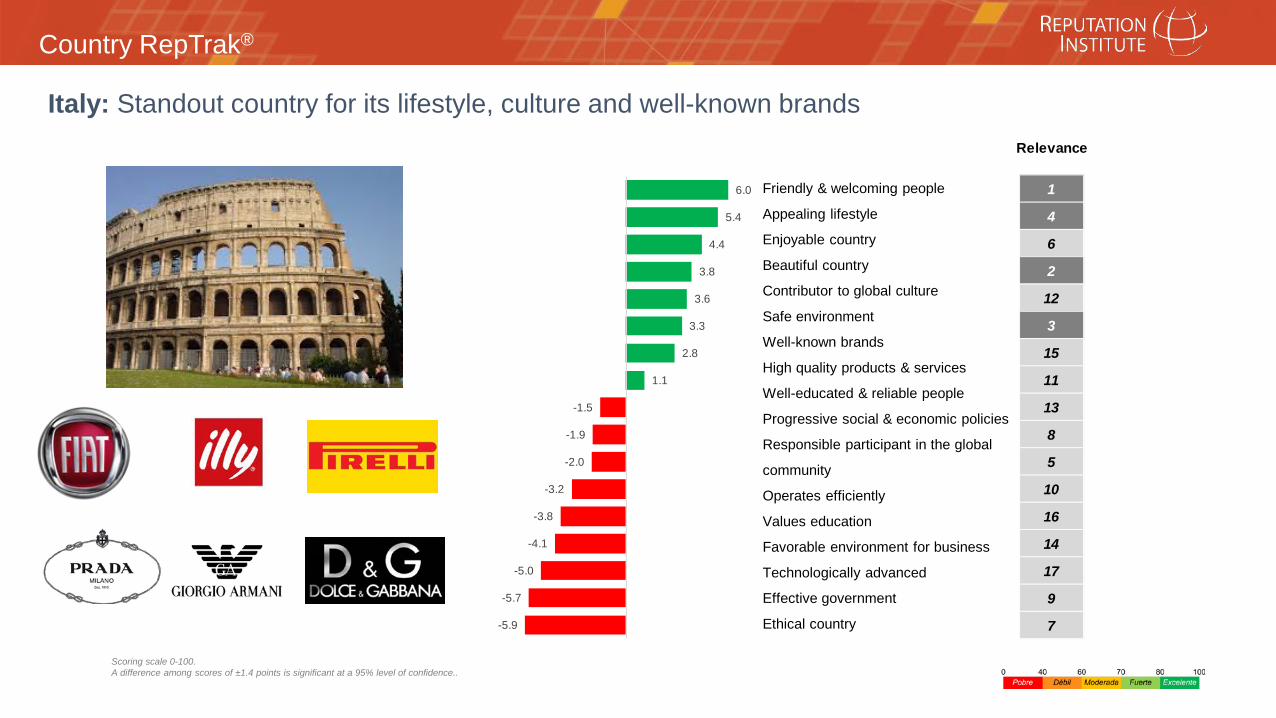
Italy: Standout country for its lifestyle, culture and well-known brands
Scoring scale 0-100.A difference among scores of ±1.4 points is significant at a 95% level of confidence..
Friendly & welcoming people
Appealing lifestyle
Enjoyable country
Beautiful country
Contributor to global culture
Safe environment
Well-known brands
High quality products & services
Well-educated & reliable people
Progressive social & economic policies
Responsible participant in the global
community
Operates efficiently
Values education
Favorable environment for business
Technologically advanced
Effective government
Ethical country
Country RepTrak®
24
Russia: Worsening…
Ukraine’s reputation is also affected (-2.8%)
Crimea annexation and the Ukrainian crisis are costing Russia its reputation, worsening its
downward trend (-3.2%)
Country RepTrak®
25
France Germany
the United Kingdom
Italy
United States of America
Canada
Japan
Spain
Australia
MexicoChina
Argentina
Brazil
Chile
Colombia
India
South Korea
Peru
-60%
-40%
-20%
0%
20%
40%
60%
-100% -80% -60% -40% -20% 0% 20% 40% 60% 80% 100%
Diffe
renc
e be
twee
n re
puta
tion
scor
e in
the
coun
try
and
G8 a
vera
ge
Difference between country's reputation score and G8 average
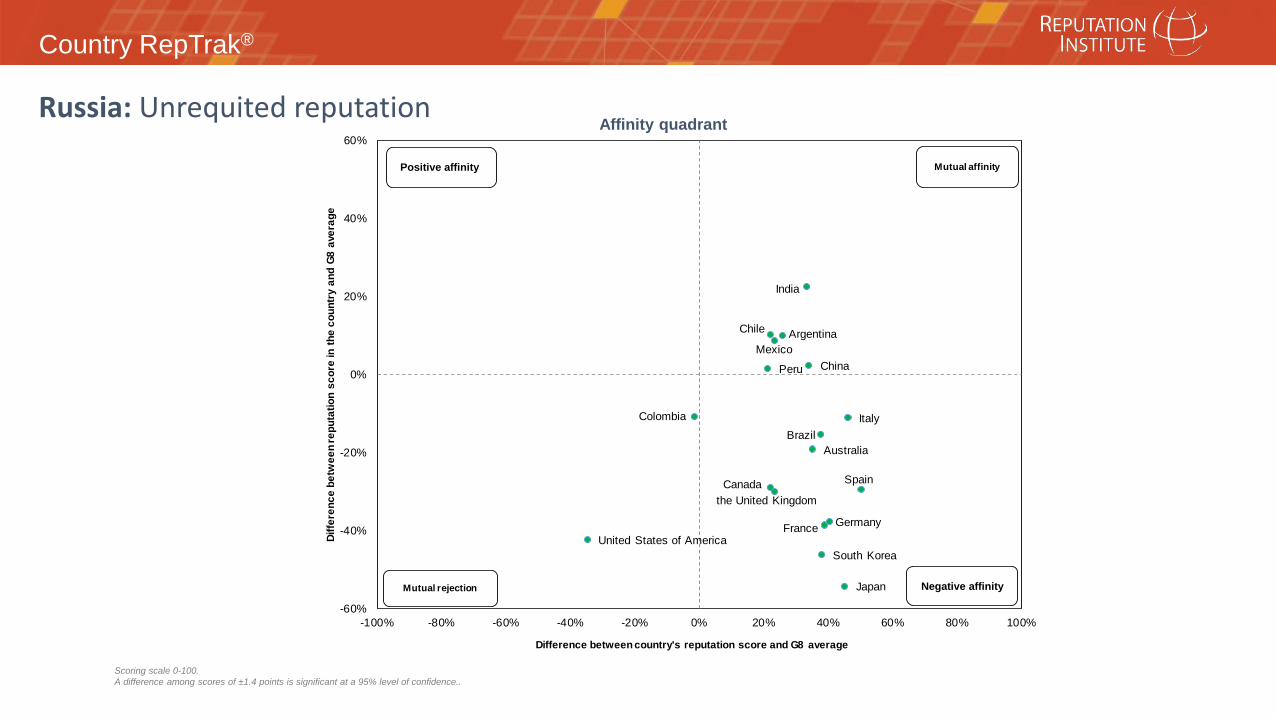
Positive equivalence Mutual affinity
Mutual rejectionNegative
equivalence
Affinity quadrantRussia: Unrequited reputation
Positive affinity
Negative affinity
Scoring scale 0-100.A difference among scores of ±1.4 points is significant at a 95% level of confidence..
Country RepTrak®
26
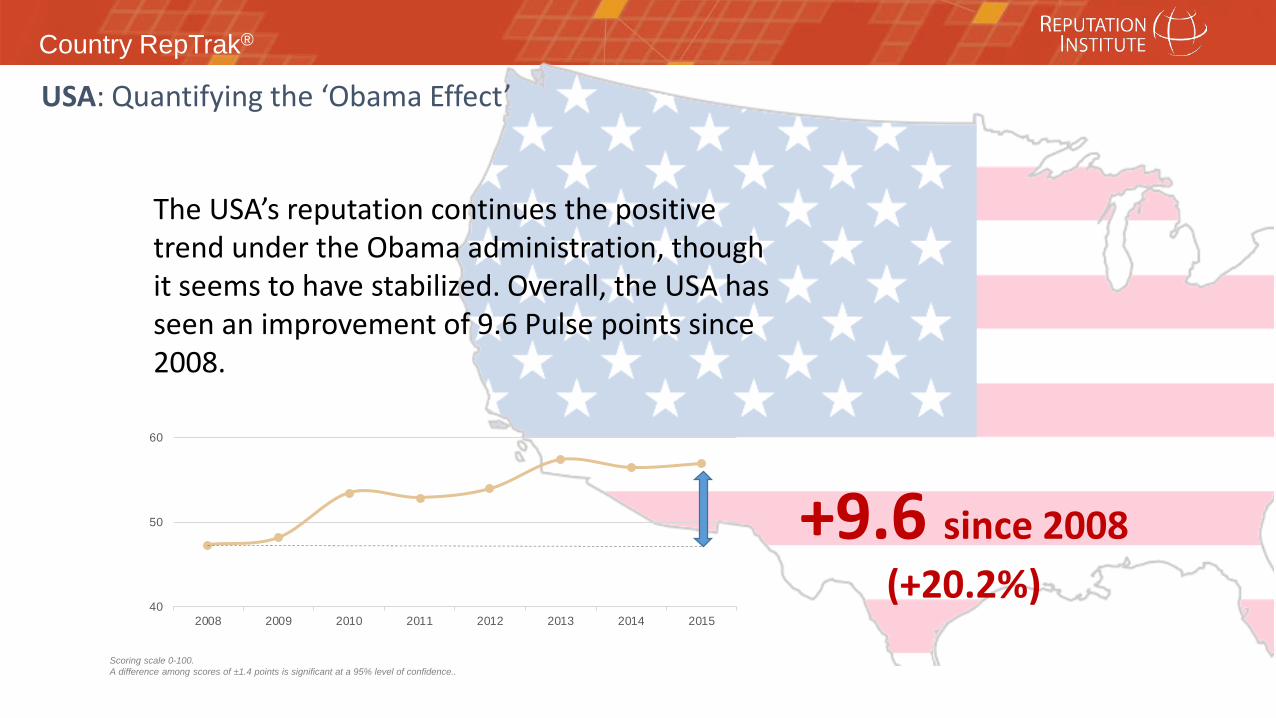
The USA’s reputation continues the positive trend under the Obama administration, though it seems to have stabilized. Overall, the USA has seen an improvement of 9.6 Pulse points since 2008.
+9.6 since 2008 (+20.2%)
USA: Quantifying the ‘Obama Effect’
40
50
60
2008 2009 2010 2011 2012 2013 2014 2015
Scoring scale 0-100.A difference among scores of ±1.4 points is significant at a 95% level of confidence..
Country RepTrak®
27
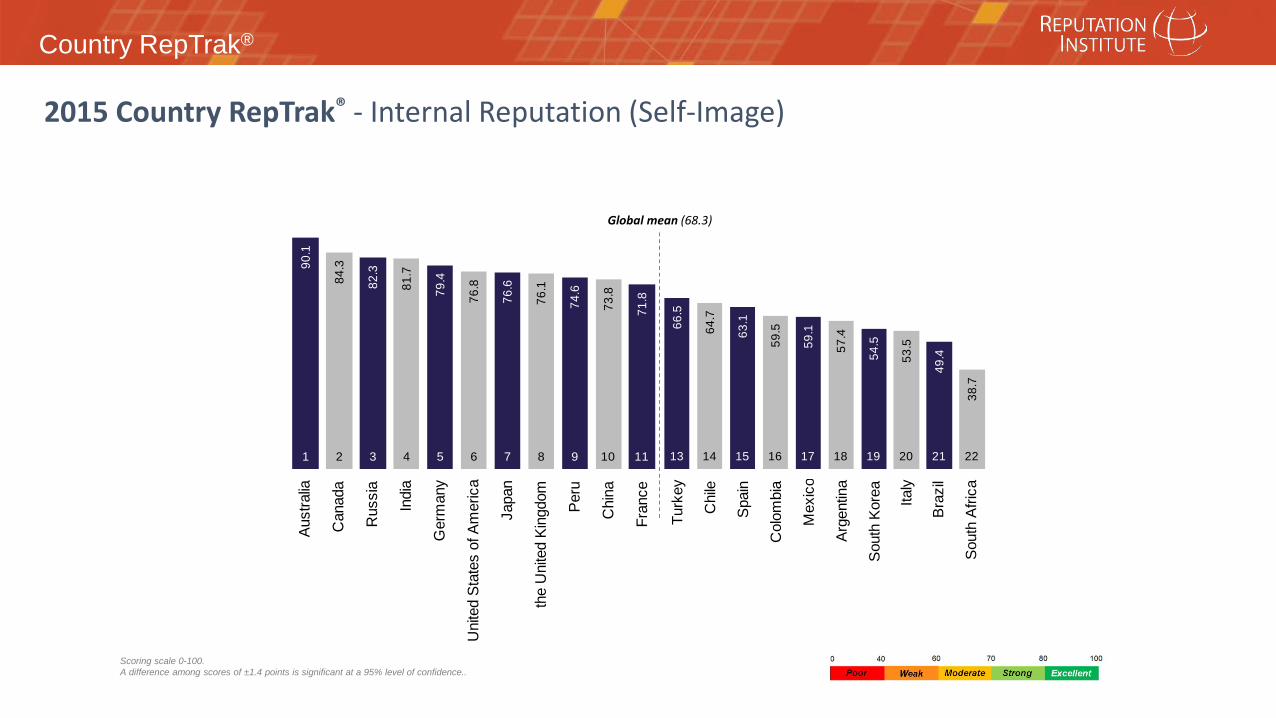
Global mean (68.3)
2015 Country RepTrak® - Internal Reputation (Self-Image)
Scoring scale 0-100.A difference among scores of ±1.4 points is significant at a 95% level of confidence..
Aust
ralia
Can
ada
Rus
sia
Indi
a
Ger
man
y
Uni
ted
Stat
es o
f Am
eric
a
Japa
n
the
Uni
ted
King
dom
Peru
Chi
na
Fran
ce
90.1
84.3
82.3
81.7
79.4
76.8
76.6
76.1
74.6
73.8
71.8
1 2 3 4 5 6 7 8 9 10 11
Turk
ey
Chi
le
Spa
in
Col
ombi
a
Mex
ico
Arg
entin
a
Sou
th K
orea Italy
Bra
zil
Sou
th A
frica
66.5
64.7
63.1
59.5
59.1
57.4
54.5
53.5
49.4
38.7
13 14 15 16 17 18 19 20 21 22
Country RepTrak®
28
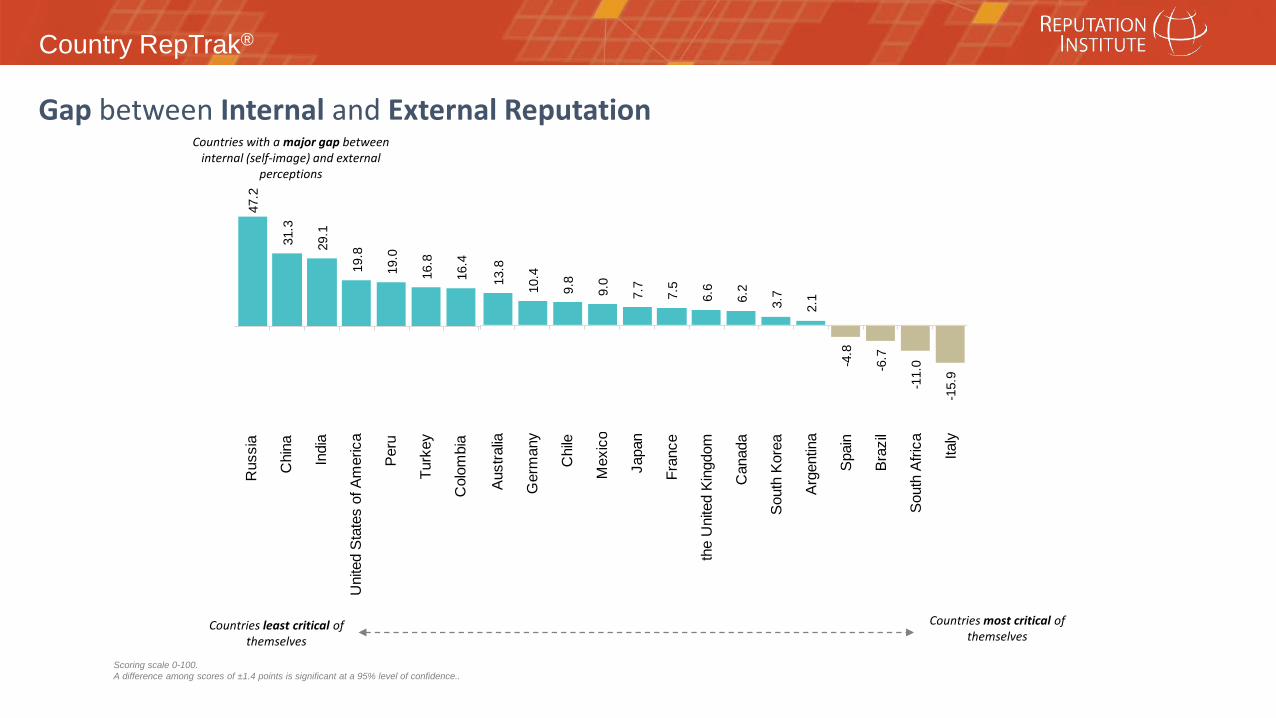
Gap between Internal and External Reputation Countries with a major gap between
internal (self-image) and external perceptions
Countries most critical of themselves
Countries least critical of themselves
Scoring scale 0-100.A difference among scores of ±1.4 points is significant at a 95% level of confidence..
Rus
sia
Chi
na
Indi
a
Uni
ted
Sta
tes
of A
mer
ica
Per
u
Turk
ey
Col
ombi
a
47.2
31.3
29.1
19.8
19.0
16.8
16.4
Aus
tralia
Ger
man
y
Chi
le
Mex
ico
Japa
n
Fran
ce
the
Uni
ted
Kin
gdom
Can
ada
Sou
th K
orea
Arg
entin
a
Spa
in
Bra
zil
Sou
th A
frica Italy
13.8
10.4
9.8
9.0
7.7
7.5
6.6
6.2
3.7
2.1
-4.8
-6.7
-11.
0
-15.
9

Country RepTrak®
29
50
60
70
80
2009 2010 2011 2012 2013 2014 2015
Externa Interna
12.5
2.3
4.1
2.8
7.3 10.9
4.8
External Internal
Gap between Internal and External Reputation for Spain by Year
GAP
Scoring scale 0-100.A difference among scores of ±1.4 points is significant at a 95% level of confidence..
Country RepTrak®
30
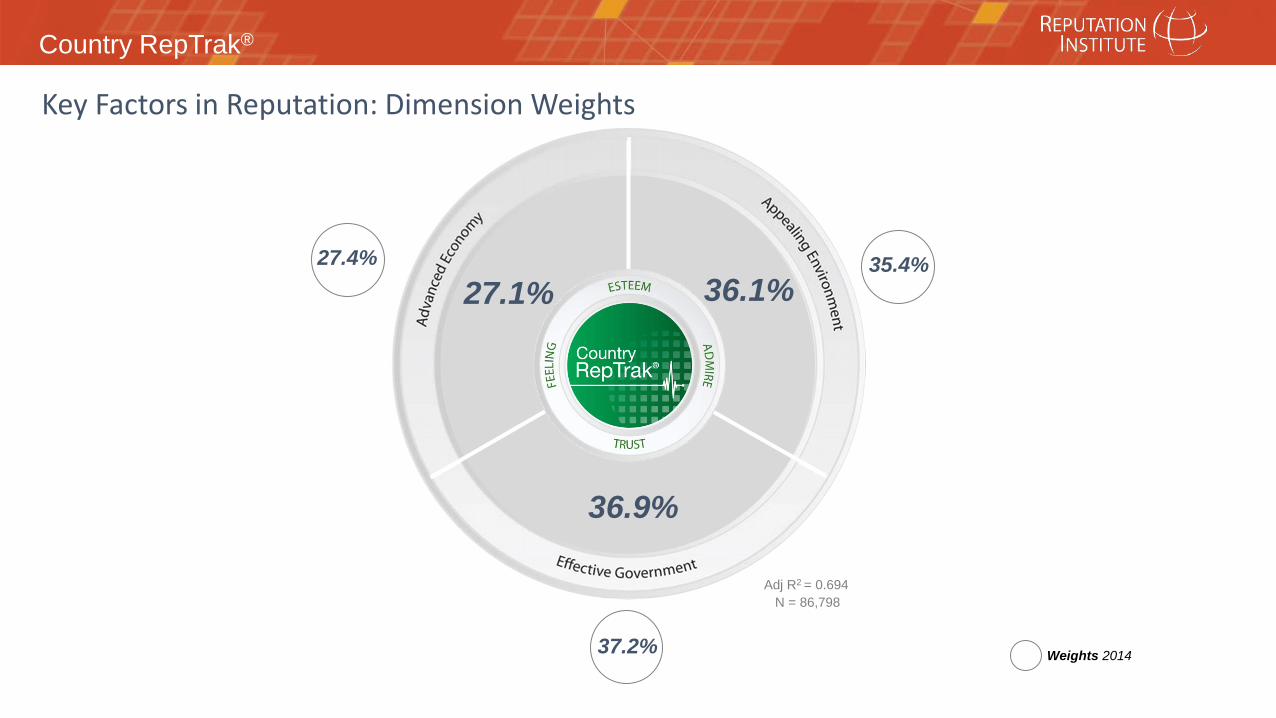
Key Factors in Reputation: Dimension Weights
36.9%
36.1%27.1%
Adj R2 = 0.694N = 86,798
37.2%
35.4%27.4%
Weights 2014
Country RepTrak®
31
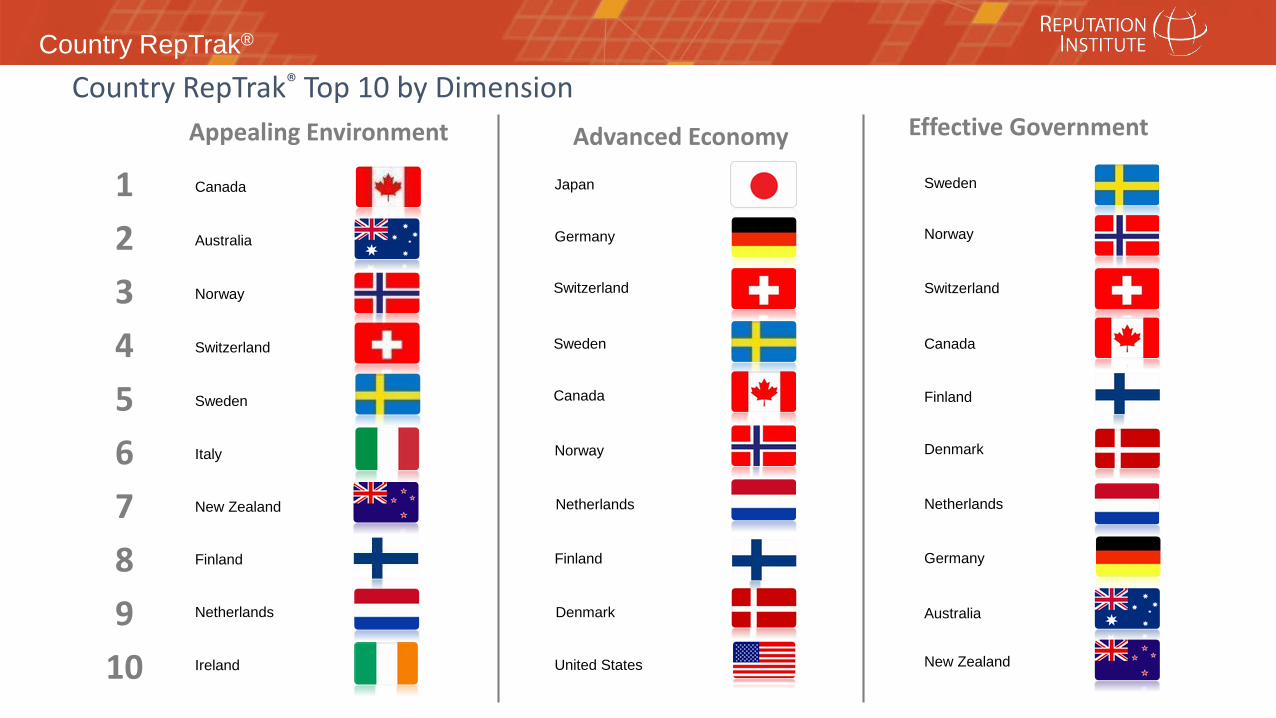
123456789
10
Japan
Germany
Switzerland
Sweden
Canada
Netherlands
Norway
Denmark
United States
Finland
Advanced Economy Effective Government
Australia
Sweden
Canada
Switzerland
Norway
New Zealand
Finland
Denmark
Netherlands
Canada
Australia
Norway
Switzerland
Sweden
Italy
New Zealand
Finland
Netherlands
Ireland
Appealing Environment
Country RepTrak® Top 10 by Dimension
Germany
Country RepTrak®
32
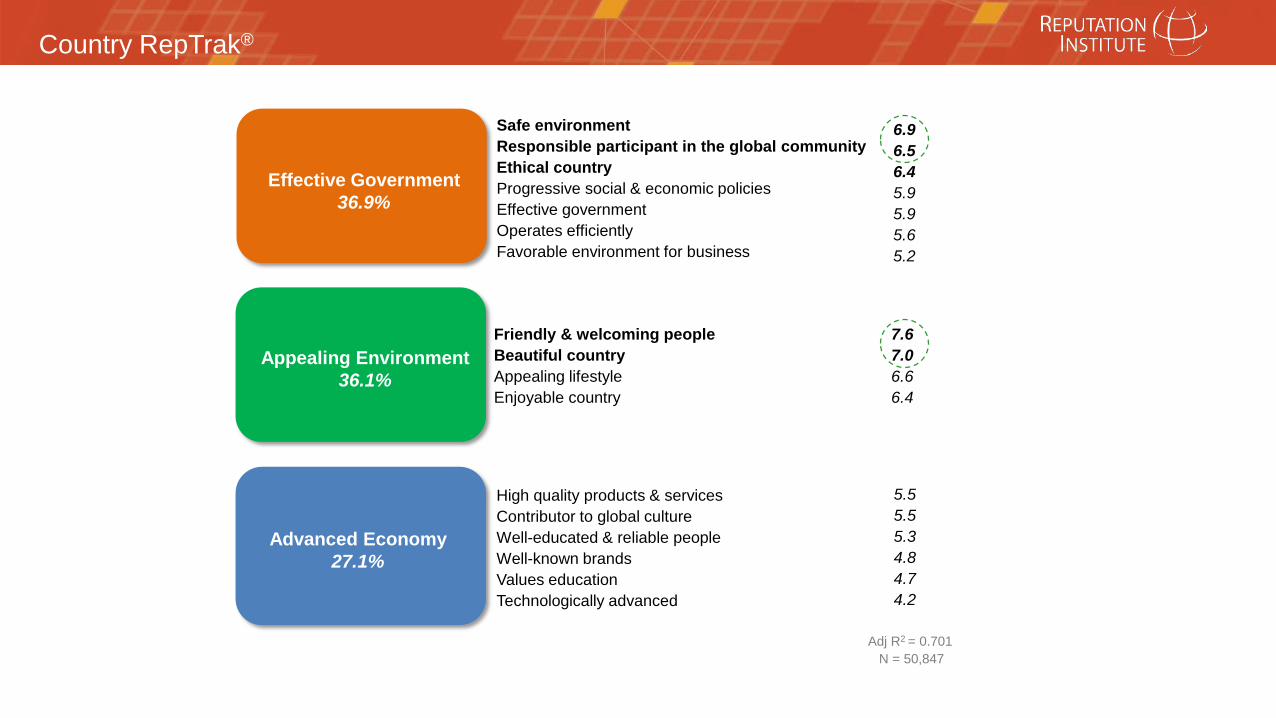
Advanced Economy27.1%
Friendly & welcoming peopleBeautiful countryAppealing lifestyleEnjoyable country
Safe environmentResponsible participant in the global communityEthical countryProgressive social & economic policiesEffective governmentOperates efficiently Favorable environment for business
High quality products & servicesContributor to global cultureWell-educated & reliable peopleWell-known brandsValues educationTechnologically advanced
Appealing Environment36.1%
Effective Government36.9%
6.96.56.45.95.95.65.2
7.67.06.66.4
5.55.55.34.84.74.2
Adj R2 = 0.701N = 50,847

Country RepTrak®
Argentina
Australia
Austria Belgium
Brazil
CanadaChile
China
Colombia
Denmark
Egypt
Finland
France Germany
Greece
India
Iran
Iraq
Ireland
Israel
Italy
Japan
Mexico
New Zealand
Nigeria
Norway
Pakistan
Peru Portugal
Russia
Saudi Arabia
Singapore
South Africa
South Korea
SpainSweden
Switzerland
Taiwan
Thailand Netherlands
United Kingdom
Venezuela
Turkey
United Arab Emirates
United States of America
Algeria
Kazakhstan
Malaysia
Qatar
Culture
Lifestyle
Technology
Safety
EfficientFriendly
Education
Ethical
Beautiful
Enjoyable
Business
Government
Progressive policies
Responsible
P&S
Brands
Countries reputation mapping
Country RepTrak®
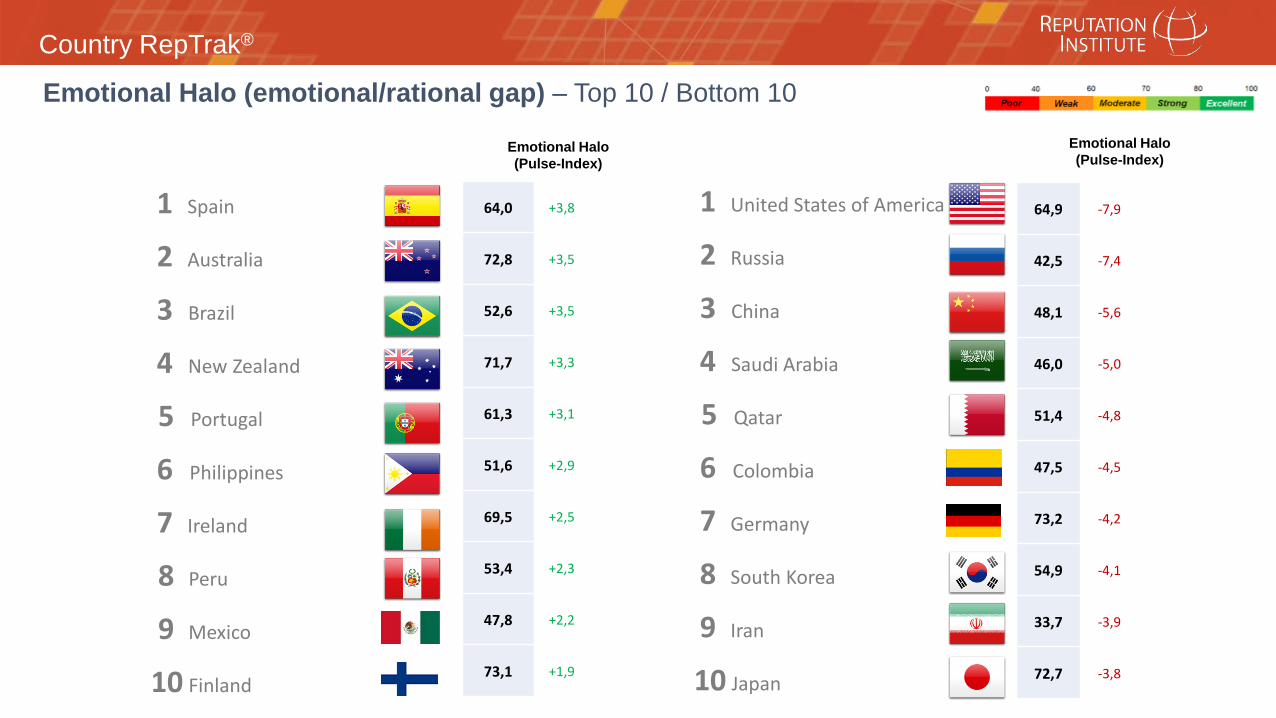
Emotional Halo (emotional/rational gap) – Top 10 / Bottom 10
Emotional Halo (Pulse-Index)
Emotional Halo (Pulse-Index)
1 Spain
2 Australia
3 Brazil
4 New Zealand
5 Portugal
6 Philippines
7 Ireland
8 Peru
9 Mexico
10 Finland
1 United States of America
2 Russia
3 China
4 Saudi Arabia
5 Qatar
6 Colombia
7 Germany
8 South Korea
9 Iran
10 Japan
64,0 +3,8
72,8 +3,5
52,6 +3,5
71,7 +3,3
61,3 +3,1
51,6 +2,9
69,5 +2,5
53,4 +2,3
47,8 +2,2
73,1 +1,9
64,9 -7,9
42,5 -7,4
48,1 -5,6
46,0 -5,0
51,4 -4,8
47,5 -4,5
73,2 -4,2
54,9 -4,1
33,7 -3,9
72,7 -3,8
Country RepTrak®
• Country RepTrak® methodology
• The most reputed countries
• Why is a country’s reputation important?
Agenda
Country RepTrak®
36
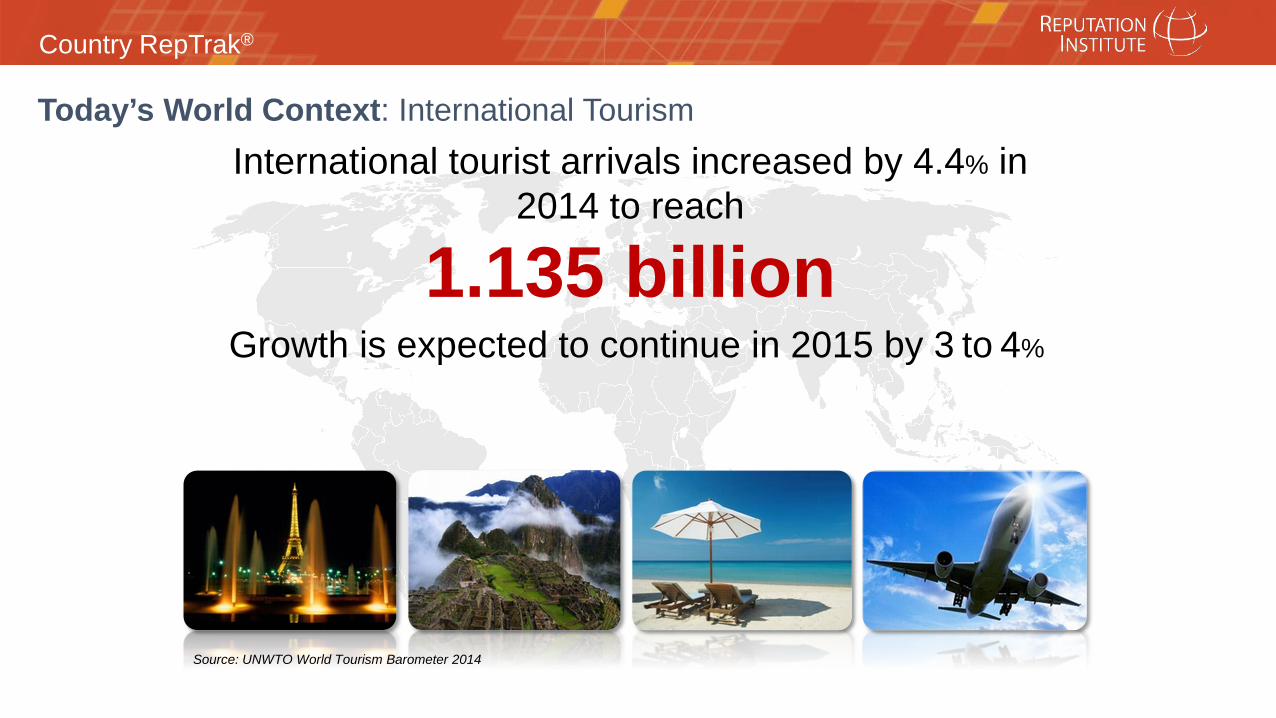
International tourist arrivals increased by 4.4% in 2014 to reach
1.135 billionGrowth is expected to continue in 2015 by 3 to 4%
Source: UNWTO World Tourism Barometer 2014
Today’s World Context: International Tourism
Country RepTrak®
37
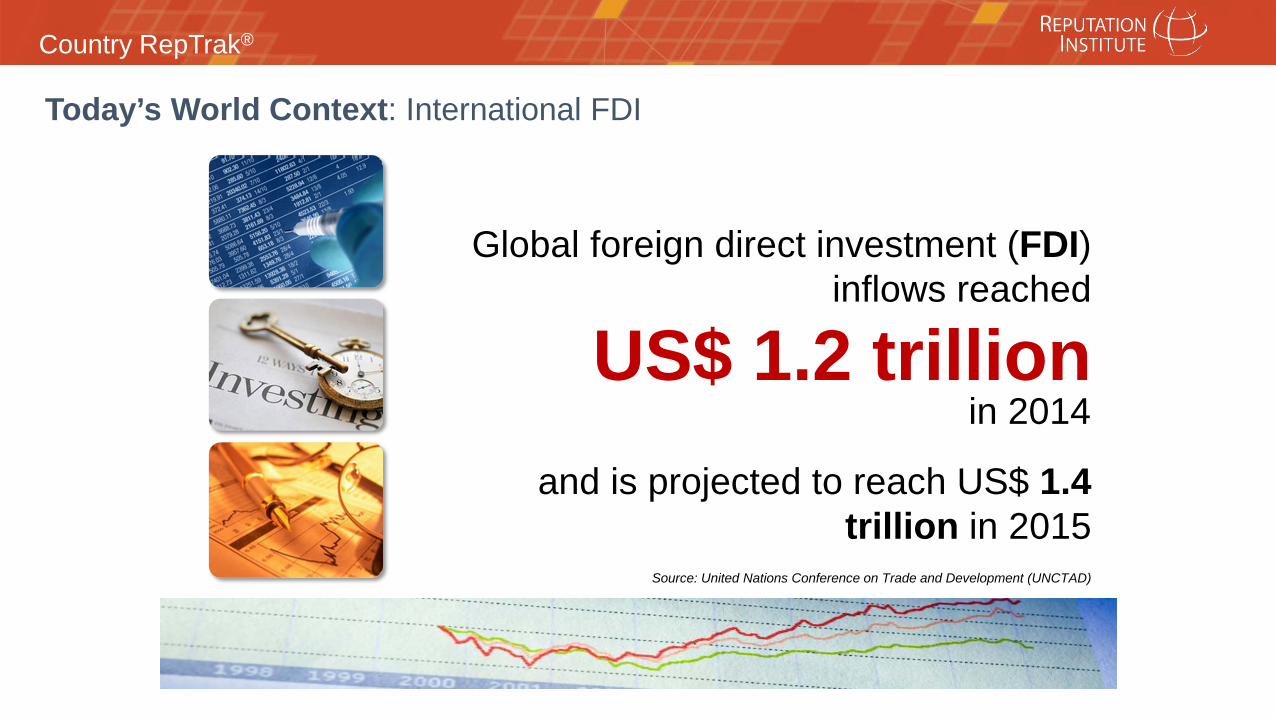
Global foreign direct investment (FDI) inflows reached
US$ 1.2 trillionand is projected to reach US$ 1.4
trillion in 2015Source: United Nations Conference on Trade and Development (UNCTAD)
Today’s World Context: International FDI
in 2014

Country RepTrak®
38
Today’s World Context: International Trade
3.4% for global GDP
Sources: WTO Secretariat and IMF
International trade in 2014 is forecasted
to grow by 2.8% and

Country RepTrak®
39
Why Is Country Reputation Important?As in the case of companies, countries also have their own reputation and that has an impact on their
performance.Countries with a good reputation
welcome more tourists
Countries with a good reputation attract FDI
Countries with a good reputation attract foreign knowledge & talent
Countries with a good reputation increase exports
Countries with a good reputation improve their public diplomacy
Country RepTrak®
40
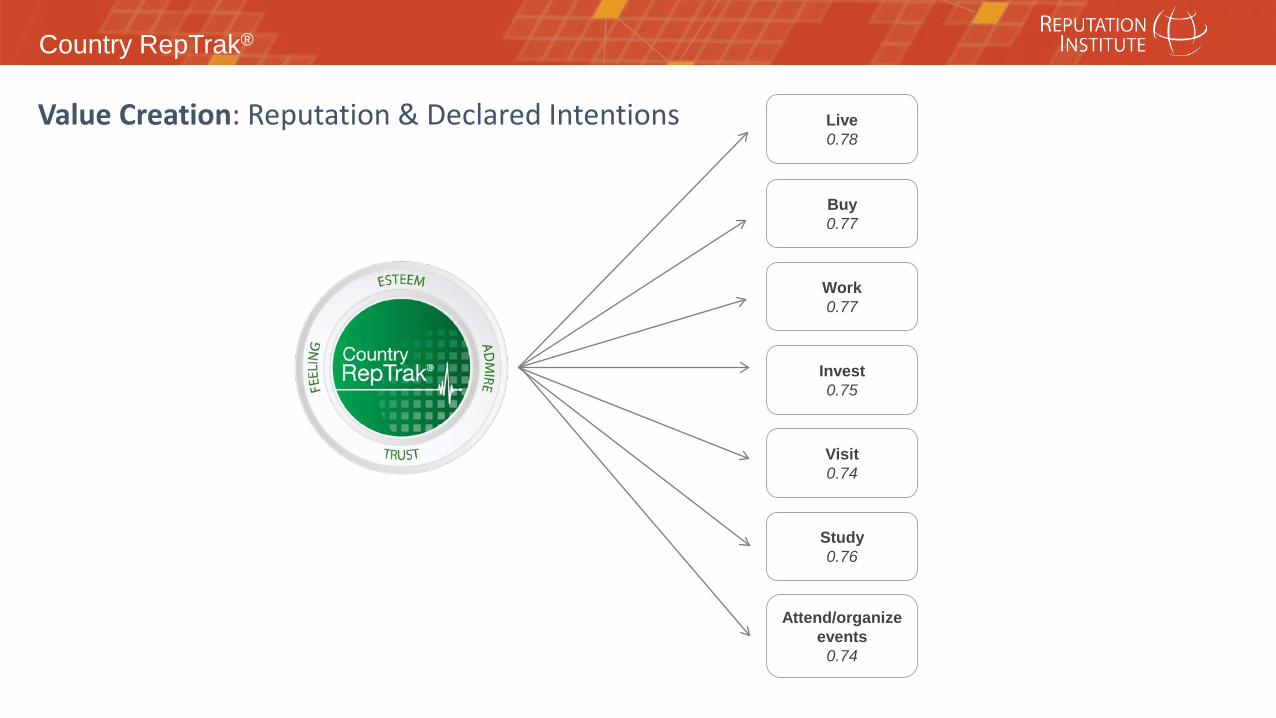
Live0.78
Buy0.77
Work0.77
Invest0.75
Visit0.74
Study0.76
Attend/organizeevents
0.74
Value Creation: Reputation & Declared Intentions
Country RepTrak®
41
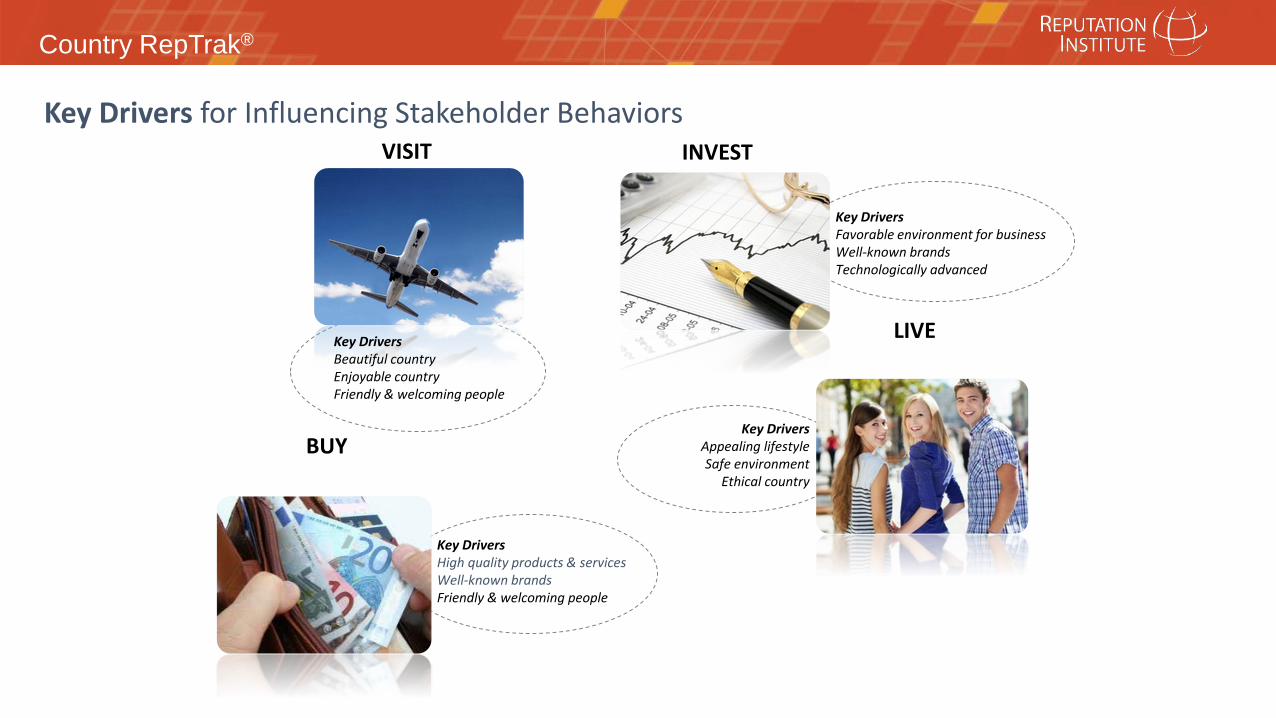
Key Drivers for Influencing Stakeholder Behaviors
Key DriversBeautiful countryEnjoyable countryFriendly & welcoming people
Key DriversAppealing lifestyleSafe environment
Ethical country
Key DriversFavorable environment for businessWell-known brandsTechnologically advanced
VISIT INVEST
LIVE
BUY
Key DriversHigh quality products & servicesWell-known brandsFriendly & welcoming people
Country RepTrak®
42
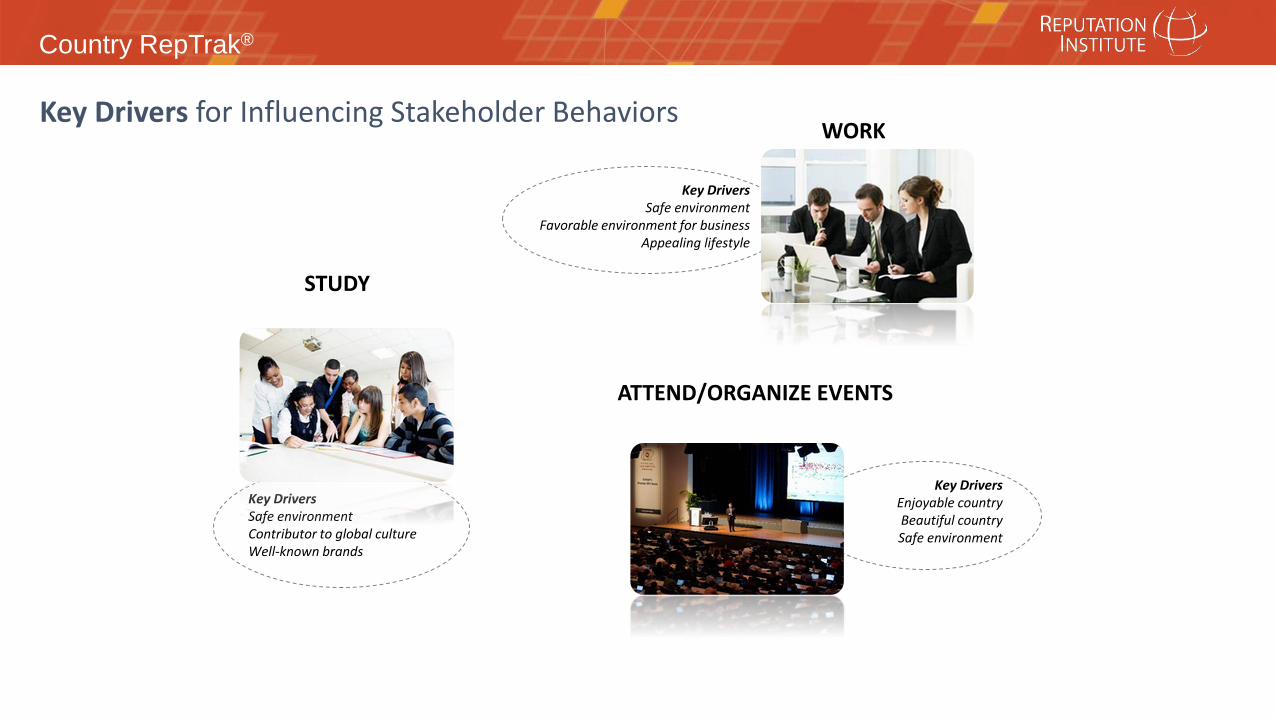
Key Drivers for Influencing Stakeholder Behaviors
Key DriversEnjoyable countryBeautiful countrySafe environment
ATTEND/ORGANIZE EVENTS
WORK
STUDY
Key DriversSafe environmentContributor to global cultureWell-known brands
Key DriversSafe environment
Favorable environment for businessAppealing lifestyle
Country RepTrak®
43
Switzerland
Germany
Sweden
Japan
Canada
Norway
Italy
Finland
the Netherlands
Denmark
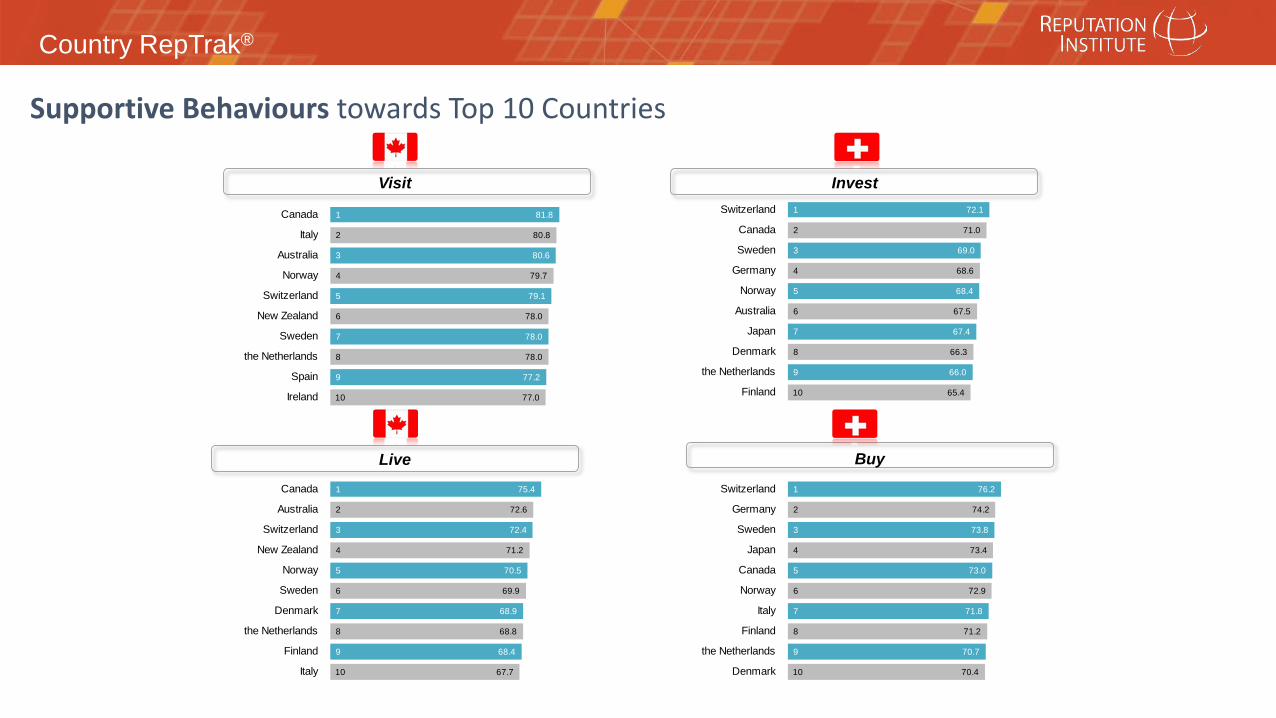
76.2
74.2
73.8
73.4
73.0
72.9
71.8
71.2
70.7
70.4
1
2
3
4
5
6
7
8
9
10
Canada
Australia
Switzerland
New Zealand
Norway
Sweden
Denmark
the Netherlands
Finland
Italy
75.4
72.6
72.4
71.2
70.5
69.9
68.9
68.8
68.4
67.7
1
2
3
4
5
6
7
8
9
10
Switzerland
Canada
Sweden
Germany
Norway
Australia
Japan
Denmark
the Netherlands
Finland
72.1
71.0
69.0
68.6
68.4
67.5
67.4
66.3
66.0
65.4
1
2
3
4
5
6
7
8
9
10
Canada
Italy
Australia
Norway
Switzerland
New Zealand
Sweden
the Netherlands
Spain
Ireland
81.8
80.8
80.6
79.7
79.1
78.0
78.0
78.0
77.2
77.0
1
2
3
4
5
6
7
8
9
10
Visit Invest
Live
Supportive Behaviours towards Top 10 Countries
Buy
Country RepTrak®
44
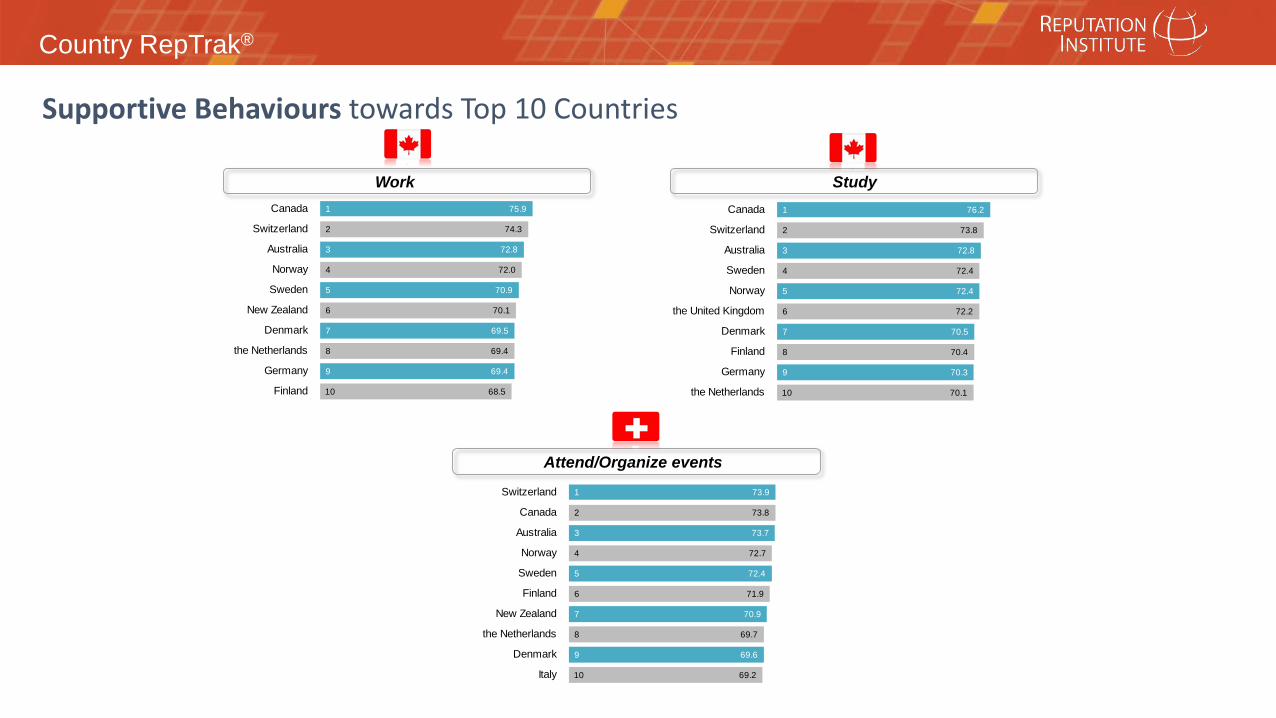
Switzerland
Canada
Australia
Norway
Sweden
Finland
New Zealand
the Netherlands
Denmark
Italy
73.9
73.8
73.7
72.7
72.4
71.9
70.9
69.7
69.6
69.2
1
2
3
4
5
6
7
8
9
10
Canada
Switzerland
Australia
Sweden
Norway
the United Kingdom
Denmark
Finland
Germany
the Netherlands
76.2
73.8
72.8
72.4
72.4
72.2
70.5
70.4
70.3
70.1
1
2
3
4
5
6
7
8
9
10
Canada
Switzerland
Australia
Norway
Sweden
New Zealand
Denmark
the Netherlands
Germany
Finland
75.9
74.3
72.8
72.0
70.9
70.1
69.5
69.4
69.4
68.5
1
2
3
4
5
6
7
8
9
10
Work Study
Attend/Organize events
Supportive Behaviours towards Top 10 Countries
Country RepTrak®
45
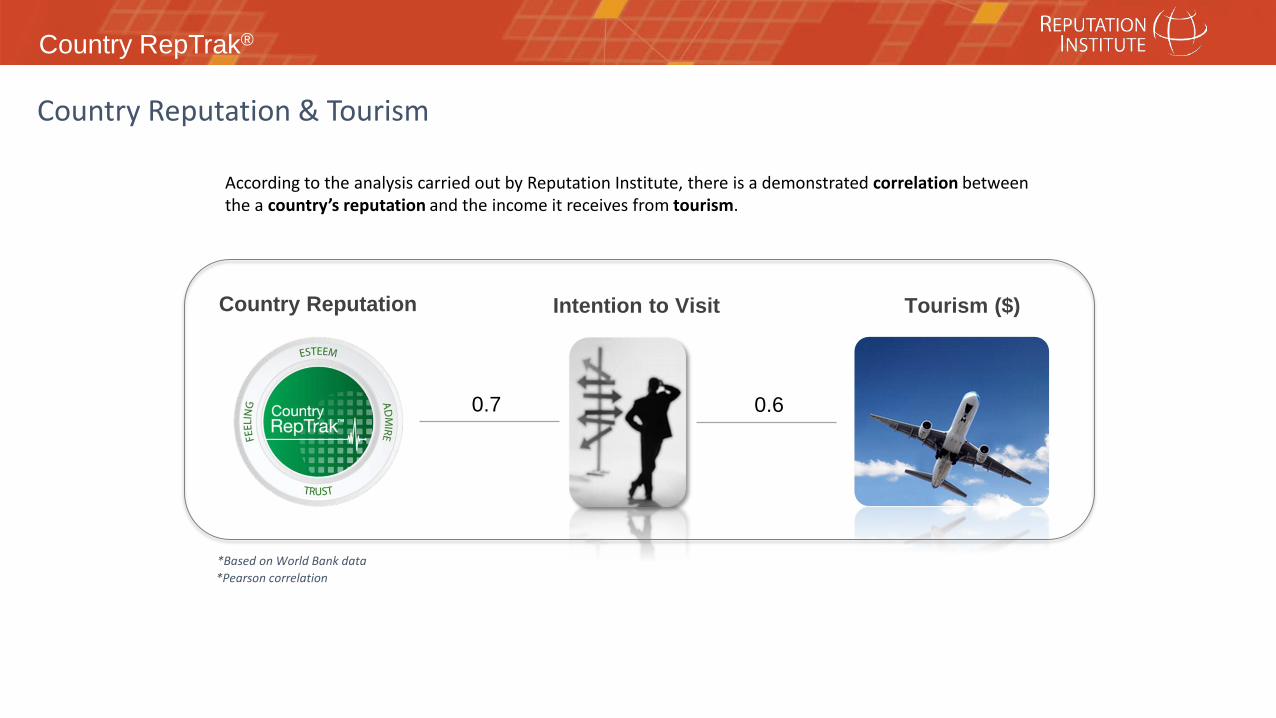
Intention to VisitCountry Reputation Tourism ($)
0.7 0.6
*Based on World Bank data
Country Reputation & Tourism
According to the analysis carried out by Reputation Institute, there is a demonstrated correlation between the a country’s reputation and the income it receives from tourism.
*Pearson correlation
Country RepTrak®
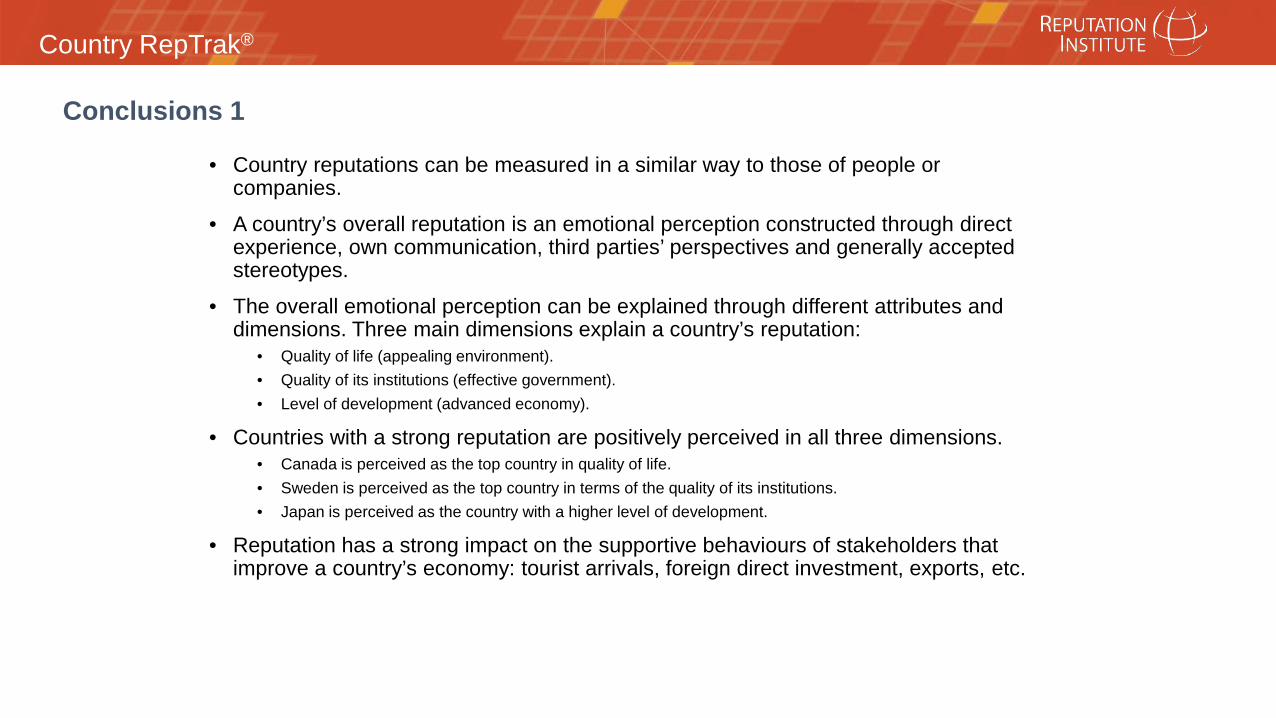
Conclusions 1
• Country reputations can be measured in a similar way to those of people or companies.
• A country’s overall reputation is an emotional perception constructed through direct experience, own communication, third parties’ perspectives and generally accepted stereotypes.
• The overall emotional perception can be explained through different attributes and dimensions. Three main dimensions explain a country’s reputation:
• Quality of life (appealing environment).• Quality of its institutions (effective government).• Level of development (advanced economy).
• Countries with a strong reputation are positively perceived in all three dimensions.• Canada is perceived as the top country in quality of life.• Sweden is perceived as the top country in terms of the quality of its institutions.• Japan is perceived as the country with a higher level of development.
• Reputation has a strong impact on the supportive behaviours of stakeholders that improve a country’s economy: tourist arrivals, foreign direct investment, exports, etc.

Country RepTrak®
Conclusions 2
• Canada takes first place in the ranking, recovering the leadership it had between 2011 and 2013.
• Canada, Norway, Switzerland, Sweden and Australia are the best perceived countries among the population of the most relevant economies of the world.
• Latin American countries still maintain a growth path (average +3.1%), headed by Colombia. On the other hand, Brazil’s reputation fell (-2.4%) as a consequence of institutional and economic crisis.
• Asian countries keep improving their reputations, led by Iran (10.8%), although still at very low levels. India and China have relevant increases in 2015 (+7.4% and +7.9%, respectively).
• European countries are changing trends: Germany’s reputation starts to erode (-1.3%), while Spain (+6.1%), Portugal (6.1%), Italy (+5.4%) and Ireland (+5.2%) improved their reputations after their economic indicators started to improve.
• Russia’s reputation shows a negative trend, damaged by the Ukrainian crisis and Crimea’s annexation.
• USA’s reputation seems to have stabilized after the positive trend under the Obama administration, improving 9.6 Pulse points since 2008.
Country RepTrak®
48
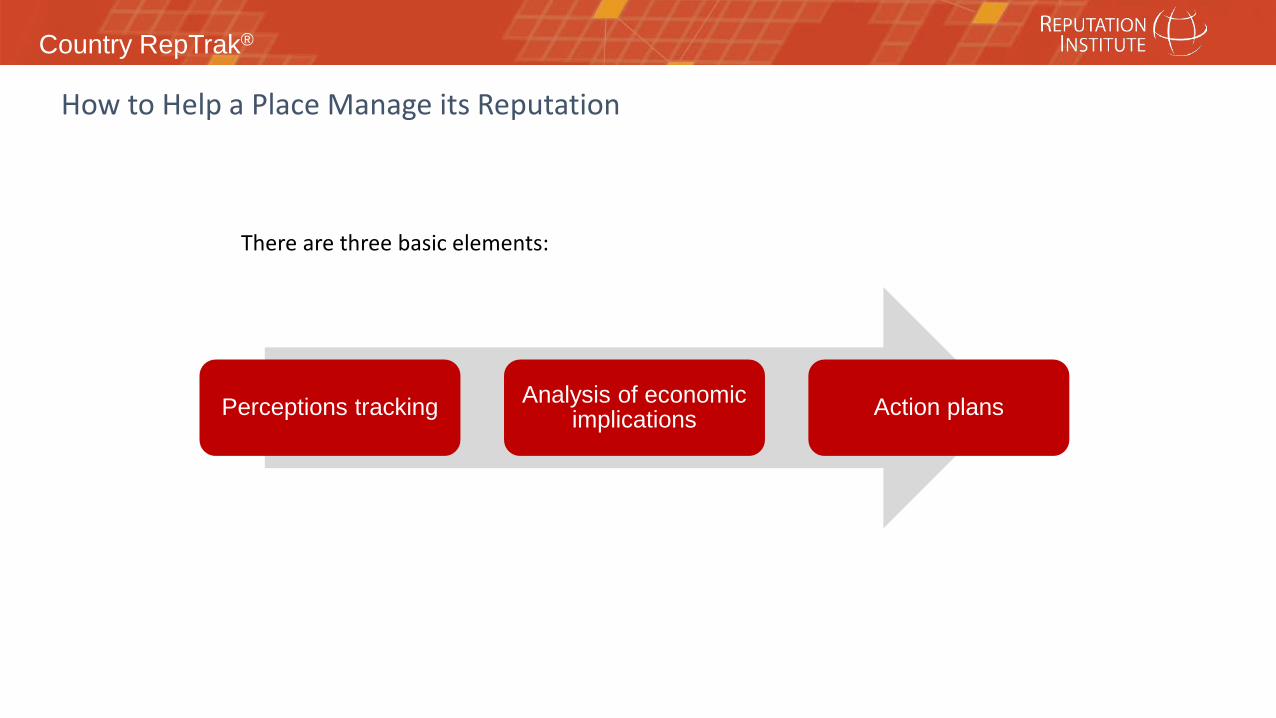
How to Help a Place Manage its Reputation
There are three basic elements:
Perceptions tracking Analysis of economic implications Action plans
Country RepTrak®
49
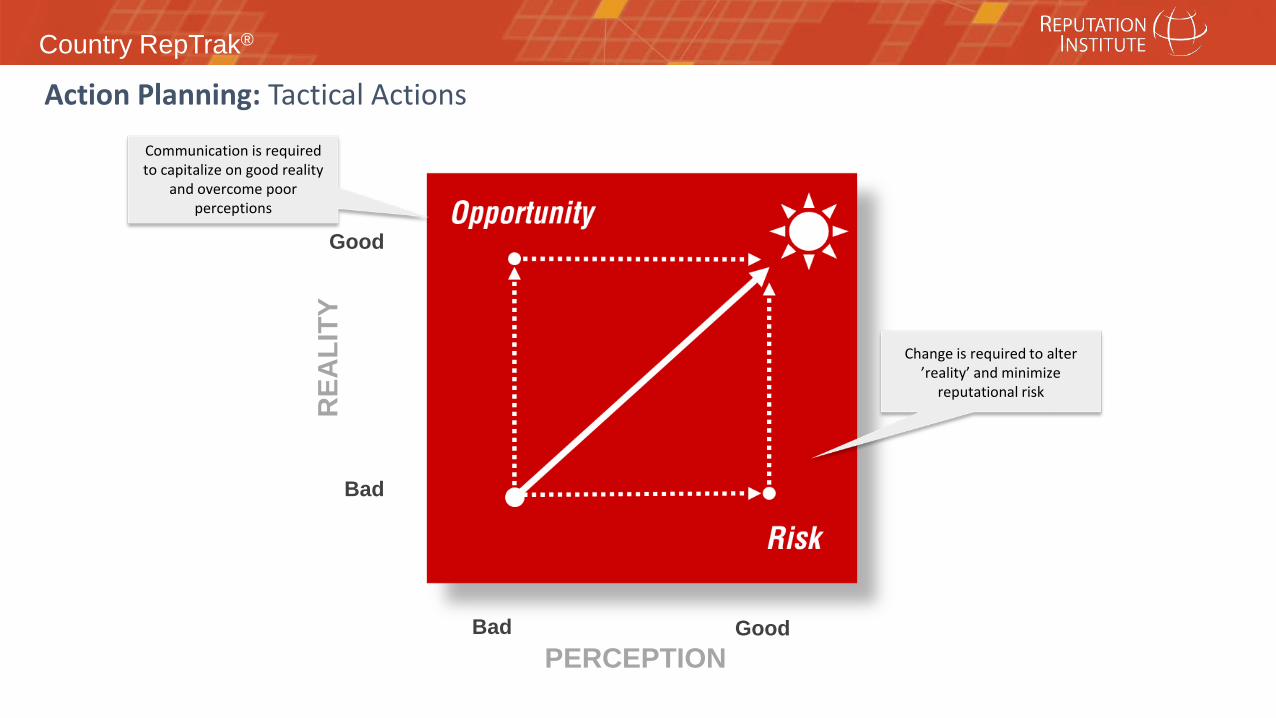
Action Planning: Tactical Actions
PERCEPTION
Bad
Good
Good
REA
LITY
Communication is required to capitalize on good reality
and overcome poor perceptions
Change is required to alter ’reality’ and minimize
reputational risk
Bad
Country RepTrak®
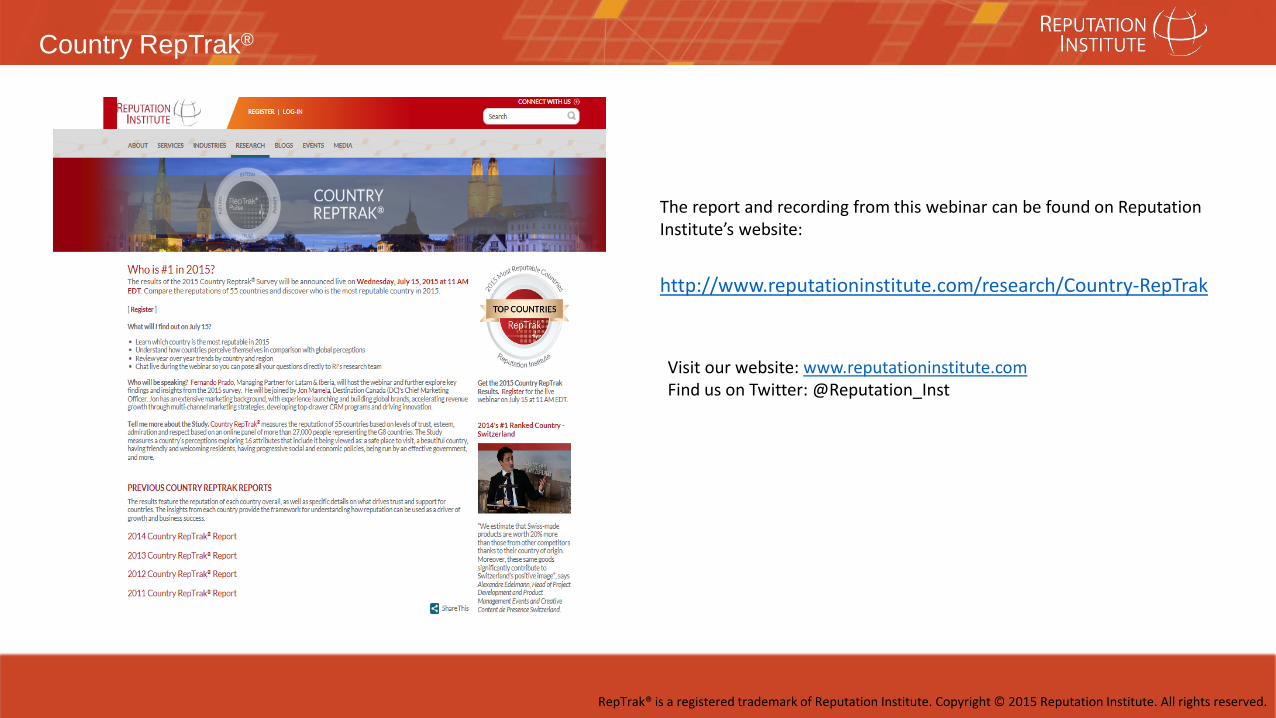
The report and recording from this webinar can be found on Reputation Institute’s website:
http://www.reputationinstitute.com/research/Country-RepTrak
Visit our website: www.reputationinstitute.comFind us on Twitter: @Reputation_Inst
RepTrak® is a registered trademark of Reputation Institute. Copyright © 2015 Reputation Institute. All rights reserved.