country tables - unctadunctad.org/en/docs/poiteiiad3_moz-sol.en.pdf · cartonagem de mocambique l d...
TRANSCRIPT

S o u r c e s a n d D e f i n i t i o n s3 1
Country Tables

Mozambique9 3
Area (‘000 km2): 801.6Population (millions): 2000 19.6Capital city: MaputoOfficial language: PortugueseCurrency: Metical Exchange rate (period average): 1999 MT12,775.1=$1GDP in current prices (millions of dollars): 1999 4,169.3Exports of goods and services (millions of dollars): 1998 479.3Imports of goods and services (millions of dollars): 1998 1,131.8Official development assistance (millions of dollars): 1999 593.2External debt (millions of dollars): 1998 8,208
Mozambique
Inward FDI: geographical breakdown, by source(Millions of dollars)
Region/economy Inflows Year Inward stock Year
Developed economiesBelgium/Luxembourg -0.2 1996 .. ..France 5.0 1999 .. ..Japan .. .. 38.2 a 1998Portugal 24.1 1994 .. ..Sweden 0.2 1992 .. ..United States -4.0 1999 1.0 1999
Developing economiesChina .. .. 1.1b 1995Malaysia 0.8 1998 1.3 1998
a Approval/notified data.b Approval data.
Inward FDI: industrial breakdown a
(Millions of dollars)
Sector/industry Inflows Year Inward stock Year
TOTAL 122.0 1999 .. ..Primary 90.3 1999 .. ..
Agriculture 10.2 1999 .. ..Fishing 62.0 1999 .. ..
Secondary 18.1 1999 .. ..Tertiary 17.6 1999 .. ..
Construction 8.2 1999 .. ..Transport, storage and communications 0.7 1999 .. ..Banking and insurance 0.3 1999 .. ..Hotel and restaurants 8.4 1999 .. ..
Unspecified 14.1 1999 .. ..a Investment projects approved by Investment Promotion Centre.
FDI inflows, 1985-1999 (Millions of dollars)
FDI inflows as a percentage of gross fixed capital formation, 1985-1999

FDI in Least Developed Countries at a Glance9 4
Cross-border M&As, sales and purchases, 1987-1999 (Millions of dollars)
Largest cross-border M&A deals, 1987-1999
ValueAcquired company Industry Acquiring company Home economy ($ million) Year
Cia de Cimentos de Mocambique Stone, clay, glass and Cimpor-Cimentos de concrete products Portugal EP Portugal 20.0 1994
Cimentos de Mozambique Stone, clay, glass and Cimpor-Cimentos de concrete products Portugal EP Portugal 20.0 1994
MacMahon Brewery,Beira Brewery Food and kindred products Indol International (South Africa) South Africa 14.0 1995Industrias Florestais de Manic Agriculture, forestry
and fishing Sonae Industria SGPS Portugal 13.1 1998Commercial Bank of Mozambique Commercial banks, bank
holding companies Investor Group Portugal 10.7 1996Banco Popular de Desenvolvimen Commercial banks, bank
holding companies Southern Bank and Invester Malaysia .. 1997Banco Standard Totta Banks, non-US chartered Stanbic South Africa .. 1996Banco Standard Totta Banks, non-US chartered Banco Totta e Acores SA Portugal .. 1995Geoloski,Kenmare-Mineral Sands Construction sand and gravel Kenmare Resources Ireland .. 1989Navique (Mozambique) Transportation and
shipping (except air) Investor Group Portugal .. 1997Vidreira (Mozambique) Stone, clay, glass and
concrete products Barbosa e Almeida Portugal .. 1996
BITs, 1 January 2000
Economy Date of signature
Algeria 12 December 1998Egypt 8 December 1998Indonesia 26 March 1999Mauritius 14 February 1997Portugal 28 May 1996South Africa 6 May 1997United States 1 December 1998
DTTs, 1 January 2000
Economy Date of signature
Mauritius 14 February 1997Portugal 21 March 1991
Largest foreign affiliates, 1999
Sales Year ofCompany Home economy Industry ($ million) Employment establishment
Banco Standard Totta De Mocambique Sarl United Kingdom Commercial banks 4.7 400 ..Brithol Michcoma Mocambique Limitda United Kingdom Office equipment 4.4 87 1987Cartonagem De Mocambique L D A South Africa Converted paper
products general 3.0 200 1964Quintas and Quintas Mocambique SARL Portugal Electrical appliances 1.5 15 ..Entreposto Frigorifiqcio de Pesca de Mozambique Ltda. Japan .. .. 632 1978Banco Standard Totta De Mocambique SARL Spain Commercial banks .. 415 1966Construtora Norberto Odebrecht S A Brazil Engineering services .. 300 ..Colgate Palmolive Mocambique L D A United States Soap and other detergents .. 95 1993Construcoes Edgar Miller Mocambique Limitada Portugal Nonresidential construction .. 22 ..Ami Mocambique S A R L Belgium Transport .. .. ..Empresa Quimica De Mocambique Ltd. South Africa Chemicals .. .. ..Pandrol Ltd. United Kingdom .. .. .. ..Pfizer Limitado United States Chemicals .. .. ..
Other relevant information
• Membership of relevant international agreements as of April 2001: CREFAA, ICSID, MIGA, TRIMs, GATS,TRIPS.
• Address and website of investment promotion agency: Centro de Promoçao de Investimentos, Rua da Imprensanº 332, R/C Maputo Mozambique; Tel: (258) 1 422525/30; Fax: (258) 1 422604; http//www.mozbusiness.gov.mz
• Fortune 500 investors: Pfizer.
• Member of WAIPA as of March 2001: No
Mynmar9 5
Area (‘000 km2): 676.6Population (millions): 2000 45.6Capital city: YangonOfficial language: BurmeseCurrency: Kyat Exchange rate (period average): 1999 K16.3=$1GDP in purchasing power parity (millions of dollars): 1999 59,400.0Exports of goods and services (millions of dollars): 1999 1,072.9Imports of goods and services (millions of dollars): 1999 2,220.2Official development assistance (millions of dollars): 1999 44.7External debt (millions of dollars): 1998 5,608
Myanmar
Inward FDI: geographical breakdown, by source a
(Millions of dollars)
Region/economy Inflows Year Inward stock Year
TOTAL WORLD 1 367 1994 7 736.2 1998Developed economies 1 077.6 1994 3 939.3 1998European Union 1 057.8 1994 2 161.4 1998
Austria .. .. 72.5 1998Denmark .. .. 13.4 1998France 455.0 1994 470.4 1998Germany .. 1994 15.0 1998Netherlands 3.0 1994 237.8 1998United Kingdom 599.8 1994 1 352.3 1998
North America 4.0 1994 1 390.1 1998Canada .. .. 37.8 1998United States 4.0 1994 1 352.3 1998
Other developed economies 15.7 1994 387.8 1998
Australia 1.0 1994 82.1 1998Israel .. .. 2.4 1998Japan 14.7 1994 303.3 1998
Developing economies 289.4 1994 3 796.9 1998Latin America and the Caribbean .. .. 30.5 1998
Panama .. .. 30.5 1998Asia 289.4 1994 3 766.4 1998
Bangladesh .. .. 3.0 1998China 4.4 1994 29.3 1998Hong Kong, China 6.5 1994 121.3 1998Indonesia .. .. 236.4 1998Macau .. .. 2.4 1998Malaysia 15.8 1994 587.2 1998Philippines 6.7 1994 6.7 1998Republic of Korea 0.2 1994 96.3 1998Singapore 55.1 1994 1 445.8 1998Sri Lanka 1.0 1994 1.0 1998Thailand 199.8 1994 1 237.2 1998
a Approval data.
Inward FDI: industrial breakdown a (Millions of dollars)
Sector/industry Inflows Year Inward stock Year
TOTAL 2 814.2 1996 .. ..Primary 873.9 1996 .. ..
Mining, quarrying and petroleum 873.9 1996 .. ..
Secondary 923.6 1996 .. ..Tertiary 919.5 1996 .. ..
Hotels and restaurants 114.9 1996 .. ..Business activities 623.5 1996 .. ..Other services 181.1 1996 .. ..
Unspecified 97.2 1996 .. ..
a Approval data.
FDI inflows, 1985-1999 (Millions of dollars)

FDI in Least Developed Countries at a Glance9 6
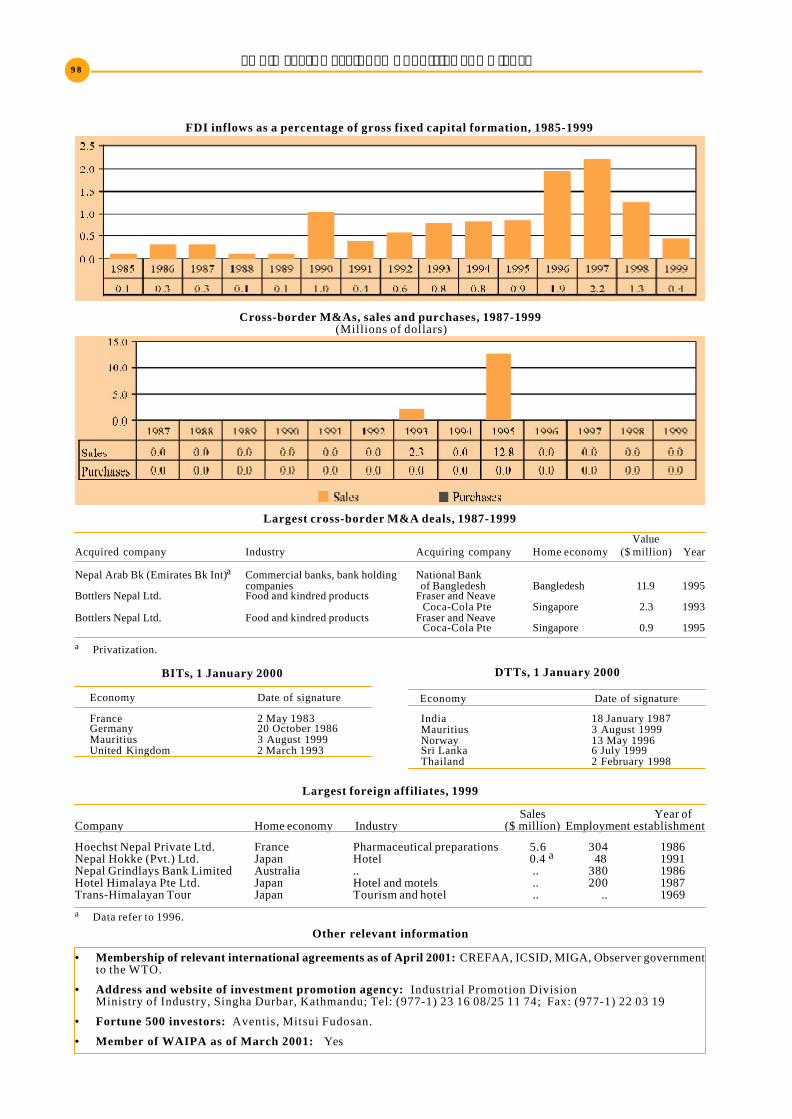
Cross-border M&As, sales and purchases, 1987-1999 (Millions of dollars)
FDI inflows as a percentage of gross fixed capital formation, 1985-1999
Largest cross-border M&A deals, 1987-1999
ValueAcquired company Industry Acquiring company Home economy ($ million) Year
Texaco Inc-Yetagun Natural Oil and gas field exploration services Premier Oil PLC United Kingdom 259.9 1997Myanmar Airways (Myanmar) a Air Transportation and Shipping Investor Group Singapore 10.0 1993Air Mandalay (Techmat Holdings) Air Transportation and Shipping Kemayan Synergy
(Kemayan Corp) Malaysia 7.2 1995FairPrice Intl (NTUC FairPrice) Investment and Commodity Firms, Singapore Investment
Dealers,Exchanges Corp Singapore 1.8 1995Premier Cnsld-Myanmar Op Oil and Gas; Petroleum Refining Investor Group United States .. 1991Premier Oil-Yetagun Gas Field Crude petroleum and natural gas Petronas Carigali
Overseas Sdn Malaysia .. 1997TOTAL-Myanmar Tract Oil and Gas; Petroleum Refining Unocal Corp United States .. 1993Unocal Canada Corp-Block ‘F’ Oil and Gas; Petroleum Refining PTT Exploration
and Production Thailand .. 1991
a Privatization.
BITs, 1 January 2000
Economy Date of signature
Philippines 17 February 1998
DTTs, 1 January 2000
Economy Date of signature
Mauritius 9 March 1998Singapore 23 February 1999United Kingdom 13 March 1950
Largest foreign affiliates, 1999
Sales Year ofCompany Home economy Industry ($ million) Employment establishment
Myanmar Kasho Co., Ltd. Japan Trading 41 a 8 1995Myanmar Brewery Ltd. Singapore Malt beverages .. 200 1995Myanmar Cheil Co., Ltd. Republic of Korea Manufacturing industries .. 85 1996Myanmar Nissan Co., Ltd. Japan Automobile sales .. 47 1994Myanmar Motors Ltd. Singapore New and used car dealers .. 21 1990Myanmar Bpl Resources Ltd. Singapore .. .. .. ..Myanmar Jurong Engineering (Pte) Ltd. Singapore .. .. .. ..Myanmar National Industrial Gases Ltd. Singapore .. .. .. ..Myanmar Posco Steel Co., Ltd. Republic of Korea Blast furnace & steel mills .. .. ..a Data refer to 1997.
Other relevant information
• Membership of relevant international agreements as of April 2001: MIGA, TRIMs, GATS, TRIPS.
• Address and website of investment promotion agency: The Office of Myanmar Investment CommissionMinistry of National Planning and Economic Development; Tel: (951) 241 918; Fax: (951) 282 101
• Fortune 500 investors: Pohang Iron & Steel.
• Member of WAIPA as of March 2001: No

Nepal9 7
Area (‘000 km2): 147.2Population (millions): 2000 23.9Capital city: KathmanduOfficial language: NepaliCurrency: Nepalese rupee Exchange rate (period average): 1999 NRs68.2=$1GDP in current prices (millions of dollars): 1999 4,904.2Exports of goods and services (millions of dollars): 1999 1,084.4Imports of goods and services (millions of dollars): 1999 1,415.4Official development assistance (millions of dollars): 1999 204.8External debt (millions of dollars): 1998 2,646
Nepal
Inward FDI: geographical breakdown, by source a
(Millions of dollars)
Region/economy Inflows Year Inward stock Year
TOTAL WORLD 40.9 1997 194.3 1999Developed economies 9 .6 1997 77.0 1998European Union 5 .6 1997 14.1 1999
Austria 0.03 1997 0 .4 1999Belgium/Luxembourg .. .. 0 .1 1999Denmark .. .. 0 .4 1999France 0 .1 1997 1 .3 1999Germany 0 .3 1997 3 .0 1999Italy .. .. 2 .4 1999Netherlands 5 .1 1997 5 .7 1999United Kingdom 0.1 1997 0 .9 1999
Other Western Europe 2 .2 1997 15.5 1999Norway 2 .0 1997 14.4 1999Switzerland 0 .2 1997 1 .1 1999
North America 0 .4 1997 35.1Canada 0 .1 1997 0 .1 1999United States 0 .3 1997 35.0 1999
Other developed economies 1 .4 1997 12.3 1999Australia 0 .1 1997 1 .3 1999Japan 1 .3 1997 10.8 1999New Zealand .. .. 0 .2 1999
Developing economies 31.4 1997 117.3 1999Latin America and the Caribbean .. .. 2 .1 1999
Bermuda .. .. 1 .7 1999Panama .. .. 0 .4 1999
Asia 31.4 1997 114.5 1999Bangladesh 1 .6 1997 1 .4 1999Bhutan .. .. 0 .1 1999China 3 .1 1997 12.4 1999Hong Kong, China .. .. 7 .3 1999India 25.4 1997 75.8 1999Malaysia .. .. 0 .1 1999Pakistan 0 .2 1997 1 .5 1999Philippines .. .. 0 .7 1999Republic of Korea 0 .1 1997 7 .3 1999Singapore 0 .9 1997 4 .2 1999Sri Lanka .. .. 0 .4 1999Taiwan Province of China .. .. 1 .4 1999Thailand 0 .2 1997 1 .3 1999United Arab Emirates .. .. 0 .7 1999
Central and Eastern Europe .. .. 0 .7 1999Russian Federation .. .. 0 .5 1999Ukraine .. .. 0 .2 1999
a Approval data.
Inward FDI: industrial breakdowna
(Millions of dollars)
Sector/industry Inflows Year Inward stock Year
Total 40.9 1997 .. ..Primary 5 .4 1997 .. ..
Agriculture, hunting, forestry and fishing 5 .4 1997 .. ..
Secondary 7 .4 1997 .. ..Tertiary 28.0 1997 .. ..
Construction 3 .4 1997 .. ..Hotels and restaurants 8 .6 1997 .. ..Transport, storage and communications 13.9 1997 .. ..Business activities 0 .2 1997 .. ..Other services 1 .9 1997 .. ..
a Approval data.
FDI inflows, 1985-1999 (Millions of dollars)
FDI in Least Developed Countries at a Glance9 8
FDI inflows as a percentage of gross fixed capital formation, 1985-1999
Cross-border M&As, sales and purchases, 1987-1999 (Millions of dollars)
Largest cross-border M&A deals, 1987-1999
ValueAcquired company Industry Acquiring company Home economy ($ million) Year
Nepal Arab Bk (Emirates Bk Int)a Commercial banks, bank holding National Bankcompanies of Bangledesh Bangledesh 11.9 1995
Bottlers Nepal Ltd. Food and kindred products Fraser and Neave Coca-Cola Pte Singapore 2.3 1993
Bottlers Nepal Ltd. Food and kindred products Fraser and Neave Coca-Cola Pte Singapore 0.9 1995
a Privatization.
BITs, 1 January 2000
Economy Date of signature
France 2 May 1983Germany 20 October 1986Mauritius 3 August 1999United Kingdom 2 March 1993
DTTs, 1 January 2000
Economy Date of signature
India 18 January 1987Mauritius 3 August 1999Norway 13 May 1996Sri Lanka 6 July 1999Thailand 2 February 1998
Largest foreign affiliates, 1999
Sales Year ofCompany Home economy Industry ($ million) Employment establishment
Hoechst Nepal Private Ltd. France Pharmaceutical preparations 5.6 304 1986Nepal Hokke (Pvt.) Ltd. Japan Hotel 0.4 a 48 1991Nepal Grindlays Bank Limited Australia .. .. 380 1986Hotel Himalaya Pte Ltd. Japan Hotel and motels .. 200 1987Trans-Himalayan Tour Japan Tourism and hotel .. .. 1969
a Data refer to 1996.
Other relevant information
• Membership of relevant international agreements as of April 2001: CREFAA, ICSID, MIGA, Observer governmentto the WTO.
• Address and website of investment promotion agency: Industrial Promotion DivisionMinistry of Industry, Singha Durbar, Kathmandu; Tel: (977-1) 23 16 08/25 11 74; Fax: (977-1) 22 03 19
• Fortune 500 investors: Aventis, Mitsui Fudosan.
• Member of WAIPA as of March 2001: Yes
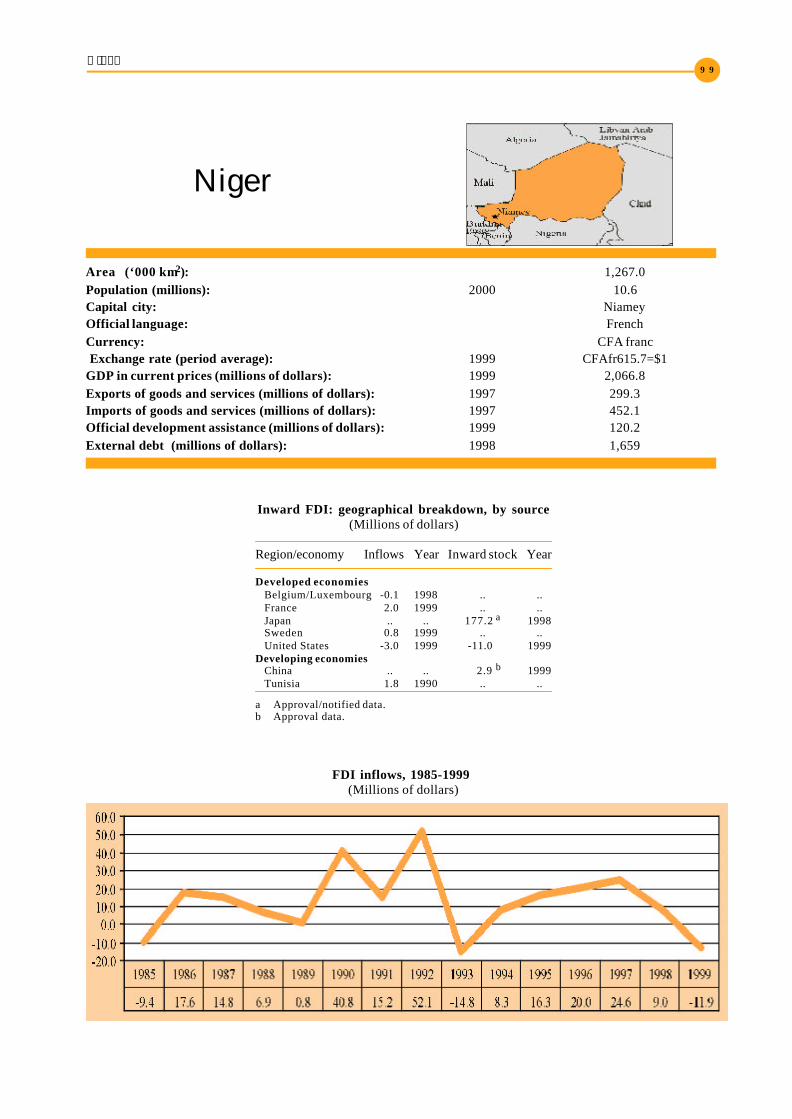
Niger9 9
Area (‘000 km2): 1,267.0Population (millions): 2000 10.6Capital city: NiameyOfficial language: FrenchCurrency: CFA franc Exchange rate (period average): 1999 CFAfr615.7=$1GDP in current prices (millions of dollars): 1999 2,066.8Exports of goods and services (millions of dollars): 1997 299.3Imports of goods and services (millions of dollars): 1997 452.1Official development assistance (millions of dollars): 1999 120.2External debt (millions of dollars): 1998 1,659
Niger
Inward FDI: geographical breakdown, by source(Millions of dollars)
Region/economy Inflows Year Inward stock Year
Developed economiesBelgium/Luxembourg -0.1 1998 .. ..France 2.0 1999 .. ..Japan .. .. 177.2 a 1998Sweden 0.8 1999 .. ..United States -3.0 1999 -11.0 1999
Developing economiesChina .. .. 2.9 b 1999Tunisia 1.8 1990 .. ..
a Approval/notified data.b Approval data.
FDI inflows, 1985-1999 (Millions of dollars)

FDI in Least Developed Countries at a Glance1 0 0
Largest cross-border M&A deals, 1987-1999
ValueAcquired company Industry Acquiring company Home economy ($ million) Year
GW Sohlberg-Prodn Equip,1 Oth Chemicals and Dynoplast Ltd. Allied Products (Dyno Industrier) Norway .. 1992
Info-Rama ANS Investment and Commodity Firms,Dealers,Exchanges Bergesen DY A/S Norway .. 1991
BITs, 1 January 2000
Economy Date of signature
Algeria 16 March 1998Egypt 4 March 1998Germany 29 October 1964Switzerland 28 March 1962Tunisia 5 June 1992
DTTs, 1 January 2000
Economy Date of signature
France 2 June 1965
Largest foreign affiliates, 1999
Sales Year ofCompany Home economy Industry ($ million) Employment establishment
La compagnie minière d'Akouta Japan Mining 89.9 a 1 255 1978Total Texaco Niger S A France Petroleum products
except bulk terminals 25.2 45 ..Compagnie Francaise De L' Afrique Occidentale France New and used car dealers 10.1 45 1963Transafricaine Auto Luxembourg Vehicle supplies and
new parts .. 5 1973Bull Niger France .. .. .. ..Herlicq ( Nigerienn Des Ets ) France .. .. .. ..
a Data refer to 1996.Other relevant information
• Membership of relevant international agreements as of April 2001: CREFAA, ICSID, TRIMs,GATS, TRIPS, Country in the process of fulfilling membership requirements to the MIGA.
• Address and website of investment promotion agency: Centre de Promotion des Investissement (CPI)B.P. 12 129 Niamey; Tel: (227) 73 6836/ 73 6416; Fax: (227) 73 2150
• Fortune 500 investors: Groupe Pinault-Printemps, Total Fina Elf.
• Member of WAIPA as of March 2001: No
FDI inflows as a percentage of gross fixed capital formation, 1985-1999
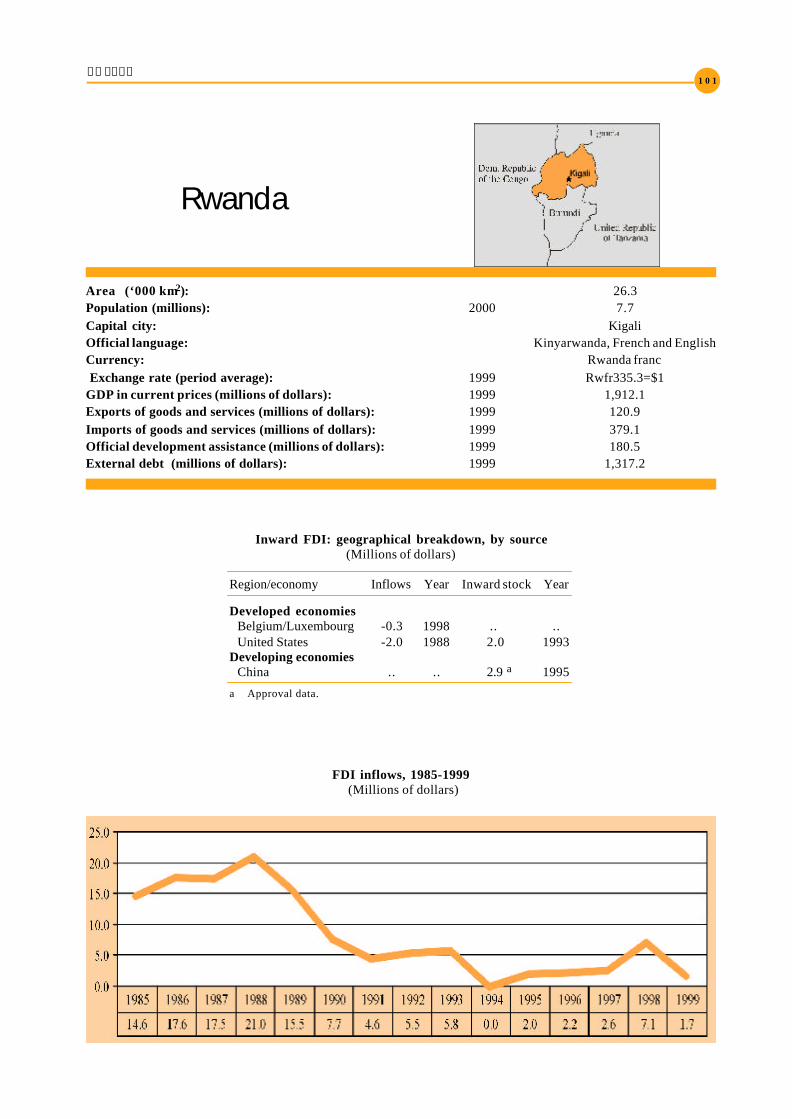
1 0 1Rwanda1 0 1
Area (‘000 km2): 26.3Population (millions): 2000 7.7Capital city: KigaliOfficial language: Kinyarwanda, French and EnglishCurrency: Rwanda franc Exchange rate (period average): 1999 Rwfr335.3=$1GDP in current prices (millions of dollars): 1999 1,912.1Exports of goods and services (millions of dollars): 1999 120.9Imports of goods and services (millions of dollars): 1999 379.1Official development assistance (millions of dollars): 1999 180.5External debt (millions of dollars): 1999 1,317.2
Rwanda
Inward FDI: geographical breakdown, by source(Millions of dollars)
Region/economy Inflows Year Inward stock Year
Developed economiesBelgium/Luxembourg -0.3 1998 .. ..United States -2.0 1988 2.0 1993
Developing economiesChina .. .. 2.9 a 1995
a Approval data.
FDI inflows, 1985-1999 (Millions of dollars)

FDI in Least Developed Countries at a Glance1 0 2
BITs, 1 January 2000
Economy Date of signature
Belgium/Luxembourg 2 November 1983Germany 18 May 1967Switzerland 15 October 1963
Largest foreign affiliates, 1999
Sales Year ofCompany Home economy Industry ($ million) Employment establishment
Brasseries Et Limonaderies Du Rwanda S A Netherlands Malt beverages 6 494.3 1 000 ..Hatton And Cookson S A United Kingdom Construction materials .. 36 ..
Other relevant information
• Membership of relevant international agreements as of April 2001: ICSID, TRIMs, GATS,TRIPS, Country in the process of fulfilling membership requirements to the MIGA.
• Address and website of investment promotion agency: None.
• Fortune 500 investors: None
• Member of WAIPA as of March 2001: No
FDI inflows as a percentage of gross fixed capital formation, 1985-1999
Samoa1 0 3
Area (‘000 km2): 2.8Population (millions): 2000 0.2Capital city: ApiaOfficial language: Samoan and EnglishCurrency: Tala Exchange rate (period average): 1999 Tala3.0=$1GDP in current prices (millions of dollars): 2000 246Exports of goods and services (millions of dollars): 2000 85.8Imports of goods and services (millions of dollars): 2000 116.2Official development assistance (millions of dollars): 2000 25.9External debt (millions of dollars): 2000 154
Samoa
Inward FDI: geographical breakdown, by source(Millions of dollars)
Region/economy Inflows Year Inward stock Year
United States .. .. 2.0 1999Japan 26.4 a 1997 61.7 a 1998
a Approval/notified data.
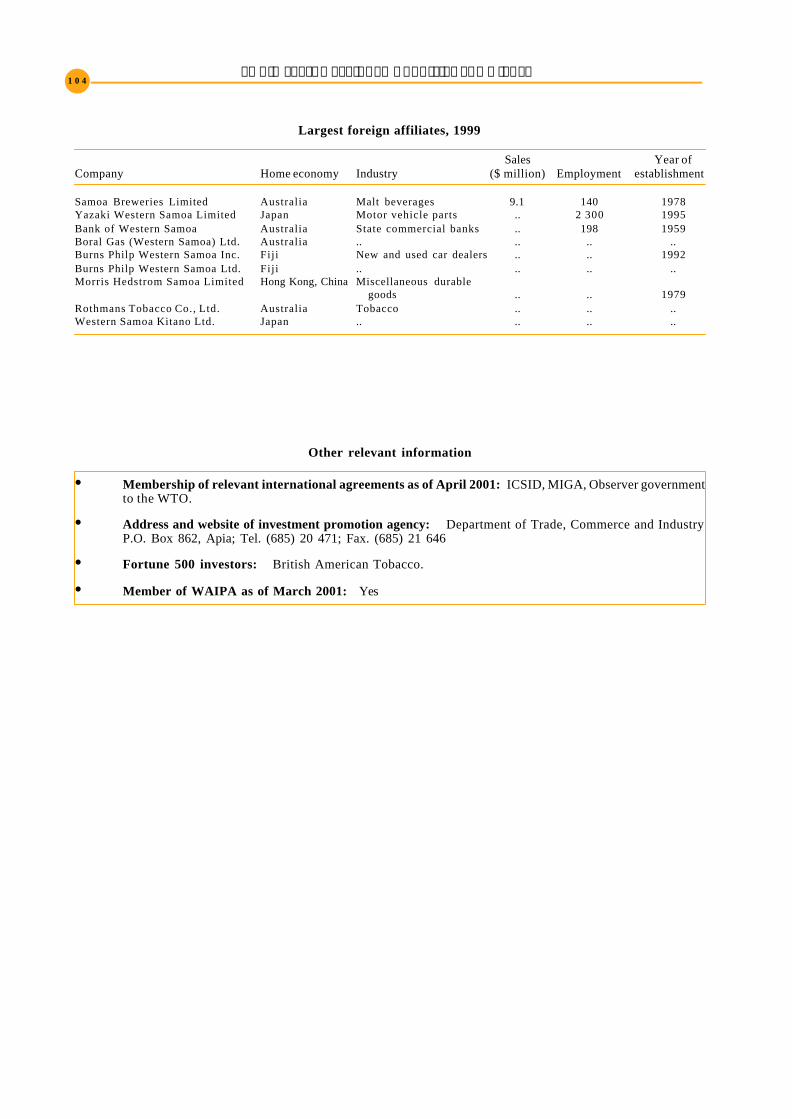
FDI inflows, 1985-1999 (Millions of dollars)
FDI in Least Developed Countries at a Glance1 0 4
Largest foreign affiliates, 1999
Sales Year ofCompany Home economy Industry ($ million) Employment establishment
Samoa Breweries Limited Australia Malt beverages 9.1 140 1978Yazaki Western Samoa Limited Japan Motor vehicle parts .. 2 300 1995Bank of Western Samoa Australia State commercial banks .. 198 1959Boral Gas (Western Samoa) Ltd. Australia .. .. .. ..Burns Philp Western Samoa Inc. Fiji New and used car dealers .. .. 1992Burns Philp Western Samoa Ltd. Fiji .. .. .. ..Morris Hedstrom Samoa Limited Hong Kong, China Miscellaneous durable
goods .. .. 1979Rothmans Tobacco Co., Ltd. Australia Tobacco .. .. ..Western Samoa Kitano Ltd. Japan .. .. .. ..
Other relevant information
• Membership of relevant international agreements as of April 2001: ICSID, MIGA, Observer governmentto the WTO.
• Address and website of investment promotion agency: Department of Trade, Commerce and IndustryP.O. Box 862, Apia; Tel. (685) 20 471; Fax. (685) 21 646
• Fortune 500 investors: British American Tobacco.
• Member of WAIPA as of March 2001: Yes

1 0 5Sao Tome and Principe
1 0 5
Area (‘000 km2): 1.0Population (millions): 2000 0.2Capital city: Sao TomeOfficial language: PortugueseCurrency: Dobra Exchange rate (period average): 1999 Db7,119.0=$1GDP in current prices (millions of dollars): 1999 169.0Exports of goods and services (millions of dollars): 1999 4.9Imports of goods and services (millions of dollars): 1999 19.5Official development assistance (millions of dollars): 1999 19.1External debt (millions of dollars): 1998 245.8
Sao Tome andPrincipe
Inward FDI: geographical breakdown, by source(Millions of dollars)
Region/economy Inflows Year Inward stock Year
Belgium/Luxembourg -0.03 1994 .. ..
FDI inflows, 1985-1999 (Millions of dollars)
FDI in Least Developed Countries at a Glance1 0 6
BITs, 1 January 2000
Economy Date of signature
Portugal 18 July 1997
Largest foreign affiliates, 1999
Sales Year ofCompany Home economy Industry ($ million) Employment establishment
Companhia Sao Tomense Business consulting De Telecomunicacoes S A R L Portugal services 1.0 160 1990
Other relevant information
• Membership of relevant international agreements as of April 2001: MIGA, TRIMs, GATS, TRIPS
• Address and website of investment promotion agency: None
• Fortune 500 investors: None
• Member of WAIPA as of March 2001: No

Senegal1 0 7
Area (‘000 km2): 196.7Population (millions): 2000 9.3Capital city: DakarOfficial language: FrenchCurrency: CFA franc Exchange rate (period average): 1999 CFAfr615.7=$1GDP in current prices (millions of dollars): 1999 4,752.1Exports of goods and services (millions of dollars): 1999 1,027.1Imports of goods and services (millions of dollars): 1999 1,372.9Official development assistance (millions of dollars): 1999 416.2External debt (millions of dollars): 1999 3,231
Senegal
Inward FDI: geographical breakdown, by source(Millions of dollars)
Region/economy Inflows Year Inward stock Year
Developed economiesBelgium/Luxembourg 0.6 1998 .. ..France 64.0 1999 157.7 1999Germany .. .. 7.6 1987Japan 1.5 a 1998 37.4 a 1998United States 9.0 1999 75.0 1999
Developing economiesChina .. .. 0.2 b 1995Tunisia 0.6 1991 .. ..
a Approval/notified data.b Approval data.
FDI inflows, 1985-1999 (Millions of dollars)
FDI inflows as a percentage of gross fixed capital formation, 1985-1999

FDI in Least Developed Countries at a Glance1 0 8
Cross-border M&As, sales and purchases, 1987-1999 (Millions of dollars)
Largest cross-border M&A deals, 1987-1999Value
Acquired company Industry Acquiring company Home economy ($ million) Year
Sonatel (Senegal) a Telecommunications France Cables et Radiob France c 126.4 1997Sonatel (Senegal) a Telecommunications France Cables et Radiob Francec 45.1 1998Societe Nationale d'Electricitea Electric, gas and water distribution Elyo/Hdro-Quebec France 63.5 1999Sotiba Simpafric Broadwoven fabric mills, cotton UBI United Kingdom .. 1995
BITs, 1 January 2000
Economy Date of signature
Argentina 6 April 1993Egypt 5 March 1998France 29 March 1974Germany 24 January 1964Korea, Republic of 12 July 1984Malaysia 11 February 1999Netherlands 3 August 1979Qatar 10 June 1998Romania 19 April 1980South Africa 5 June 1998Sweden 24 February 1967Switzerland 16 August 1962Taiwan Province of China 24 October 1997Tunisia 17 May 1984United Kingdom 7 May 1980United States 6 December 1983
DTTs, 1 January 2000
Economy Date of signature
Belgium 29 September 1987France 29 March 1974Mauritania 9 January 1971Norway 4 July 1994Taiwan Province of China 10 June 1999Tunisia 5 May 1984
Largest foreign affiliates, 1999
Sales Year ofCompany Home economy Industry ($ million) Employment establishment
Manufacture de Tabacs de l'Ouest Africaine France Tobacco 48.8 410 ..Nestle Senegal S A Switzerland Fluid milk 27.2 230 ..Nouvelles Savonneries de l'Ouest Africain S A United States Cleaning polishing and
sanitation preparations 20.0 200 1994Societe Senegalaise d'Oxygene et d'Acetylene France Natural gas liquids 8.6 80 ..Nord Electricite S A France Electric services 6.5 9 ..Valdafrique Laboratoires Canonne S A France Pharmaceutical preparations 5.7 60 ..Dakar Metallurgie S A France Metal mining services 4.6 50 1993Societe de Fourniture pour L'industrie et Heating and air Les Constructions Africaines S A France condition supplies 4.3 45 ..Collchimie Senegal S A R L England Chemicals and allied products 3.6 18 1990Senousiap Senegal France Miscellaneous durable goods 3.5 120 1994A B B Herlicq S A India Electrical work 2.9 90 ..La Seigneurie d'Afrique United Kingdom Paints and allied products 1.9 30 ..Societe Africaine de Raffinage Netherlands Drilling oil and gas wells 0.2 228 ..Banque Internationale Pour Le Commerce et l' Industrie Du Senegal France Commercial banks .. 449 ..Compagnie Francaise de l'Afrique Occidentale S A France Piece goods .. 250 ..Societe Ouest Africaine d'enterprises Maritimes Luxembourg Freight transport arrangers .. 180 ..Societe Tropicale de Distribution de Drugs proprietaries Produits Pharmaceutiques S A France and sundries .. 80 ..Etaperu Afrique de l' Ouest S A France Vehicle supplies and new parts .. 70 ..Societe Africaine d' Impression Industrielle S A France Commercial printing .. 66 1961Unocal Senegal United States Oil and gas exploration .. 22 ..Bull Senegal France .. .. .. ..Gras Savoye Senegal Sa France .. .. .. ..Jean Lefebvre Senegal France .. .. ..Segeca France .. .. .. ..Seitacen France .. .. .. ..Sosecode S A France .. .. .. ..Total Senegal Sa France .. .. .. ..
Other relevant information
• Membership of relevant international agreements as of April 2001: ICSID, MIGA, Observer government to the WTO.
• Address and website of investment promotion agency: Agence nationale pour la promotion des investissements et des grandstravaux (APIX); 52-54 rue Mohamed VI, BP 430, Dakar; Tel: (221) 823 94 75; Fax: (221) 823 94 89
• Fortune 500 investors: Groupe Pinault-Printemps, Nestlé, Suez Lyonnaise des Eaux, Total Fina Elf.
• Member of WAIPA as of March 2001: Yes
a Privatization. b Include also other foreign investors. c Include also other unspecified countries.

1 0 9Sierra Leone
1 0 9
Area (‘000 km2): 71.7Population (millions): 2000 4.9Capital city: FreetownOfficial language: EnglishCurrency: Leone Exchange rate (period average): 1999 Le1,804.2=$1GDP in current prices (millions of dollars): 1999 669.4Exports of goods and services (millions of dollars): 1995 269.0Imports of goods and services (millions of dollars): 1999 129.2Official development assistance (millions of dollars): 1999 59.9External debt (millions of dollars): 1998 1,243
Sierra Leone
Inward FDI: geographical breakdown, by source(Millions of dollars)
Region/economy Inflows Year Inward stock Year
Developed economiesBelgium/Luxembourg -0.03 1998 .. ..France 0.2 1994 .. ..Japan .. .. 0.8 a 1998Sweden 0.8 1999 .. ..United Kingdom 7.1 1988 3.1 1994United States -10.0 1998 60.0 1999
Developing economiesChina .. .. 1.1 b 1995
a Approval/notified data.b Approval data.
FDI inflows, 1985-1999 (Millions of dollars)
FDI inflows as a percentage of gross fixed capital formation, 1985-1999

FDI in Least Developed Countries at a Glance1 1 0
Cross-border M&As, sales and purchases, 1987-1999 (Millions of dollars)
Largest cross-border M&A deals, 1987-1999
ValueAcquired company Industry Acquiring company Home economy ($ million) Year
Bennimix Food Co (Sierra Leone)a Food and kindred products Marz Chemicals Lebanon 0.1 1996Gem World Ltd. Mining Gold King
Consolidated Inc. United States .. 1996Sierra Rutile Ltd. Mining Renison Gold Corp. Australia .. 1996
a Privatization.
BITs, 1 January 2000
Economy Date of signature
Germany 8 April 1965United Kingdom 8 December 1981
DTTs, 1 January 2000
Economy Date of signature
Denmark 22 December 1954India 23 June 1956Norway 18 May 1955United Kingdom 19 December 1947
Largest foreign affiliates, 1999
Sales Year ofCompany Home economy Industry ($ million) Employment establishment
Person Zochonis Sierra Leone Ltd. United Kingdom .. .. .. ..
Other relevant information
• Membership of relevant international agreements as of April 2001: ICSID, MIGA, TRIMs,GATS, TRIPS.
• Address and website of investment promotion agency: Ministry of Trade, Industry and State EnterprisesMinisterial Building, George Street, FreetownTel: (232-22) 22 65 22; Fax: (232-22) 22 83 73
• Fortune 500 investors: None
• Member of WAIPA as of March 2001: Yes

Solomon Islands1 1 1
Area (‘000 km2): 28.9Population (millions): 2000 0.4Capital city: HoniaraOfficial language: EnglishCurrency: Solomon Islands dollar Exchange rate (period average): 1999 SI$4.8=$1GDP in current prices (millions of dollars): 1999 349.0Exports of goods and services (millions of dollars): 1998 196.9Imports of goods and services (millions of dollars): 1998 214.4Official development assistance (millions of dollars): 1999 20.5External debt (millions of dollars): 1998 152.4
Solomon Islands
Inward FDI: geographical breakdown, by source a
(Millions of dollars)
Region/economy Inflows Year Inward stock Year
TOTAL WORLD 206.8 1996 .. ..Developed economies 32.2 1996 .. ..European Union 0.05 1996 .. ..
France 0.41 1996 .. ..Germany 0.04 1996 .. ..United Kingdom 0.02 1996 .. ..North America 0.06 1996 .. ..Canada 0.01 1996 .. ..United States 0.05 1996 .. ..
Other developed economies 32.1 1996 .. ..
Australia 30.9 1996 .. ..New Zealand 1.2 1996 .. ..
Developing economies 174.3 1996The Pacific 16.0 1996 .. ..
Fiji 0.4 1996 .. ..New Caledonia 0.6 1996 .. ..Papua New Guinea 0.3 1996 .. ..Solomon Islands 12.7 1996 .. ..Vanuatu 1.9 1996 .. ..
Asia 158.3 1996 .. ..Bangladesh 0.04 1996 .. ..Hong Kong, China 0.4 1996 .. ..Malaysia 0.4 1996 .. ..Philippines 0.3 1996 .. ..Republic of Korea 0.3 1996 .. ..Singapore 155.4 1996 .. ..Sri Lanka 0.1 1996 .. ..
Taiwan Province of China 1.3 1996 .. ..
Central and EasternEurope 0.4 1996 .. ..Russian Federation 0.4 1996 .. ..
a Approval data.
Inward FDI: industrial breakdowna
(Millions of dollars)
Sector/industry Inflows Year Inward stock Year
Total 206.8 1996 .. ..Primary 130.3 1996 .. ..
Agriculture, hunting, forestry and fishing 126.3 1996 .. ..Mining, quarrying and petroleum 4.0 1996
Secondary 0 .6 1996 .. ..Tertiary 75.9 1996 .. ..
Electricity, gas and water .. 1996Construction 0 .2 1996 .. ..Transport, storage and communications 13.6 1996Business activities 14.4 1996 .. ..Other services 47.7 1996 .. ..
a Approval data.
FDI in Least Developed Countries at a Glance1 1 2
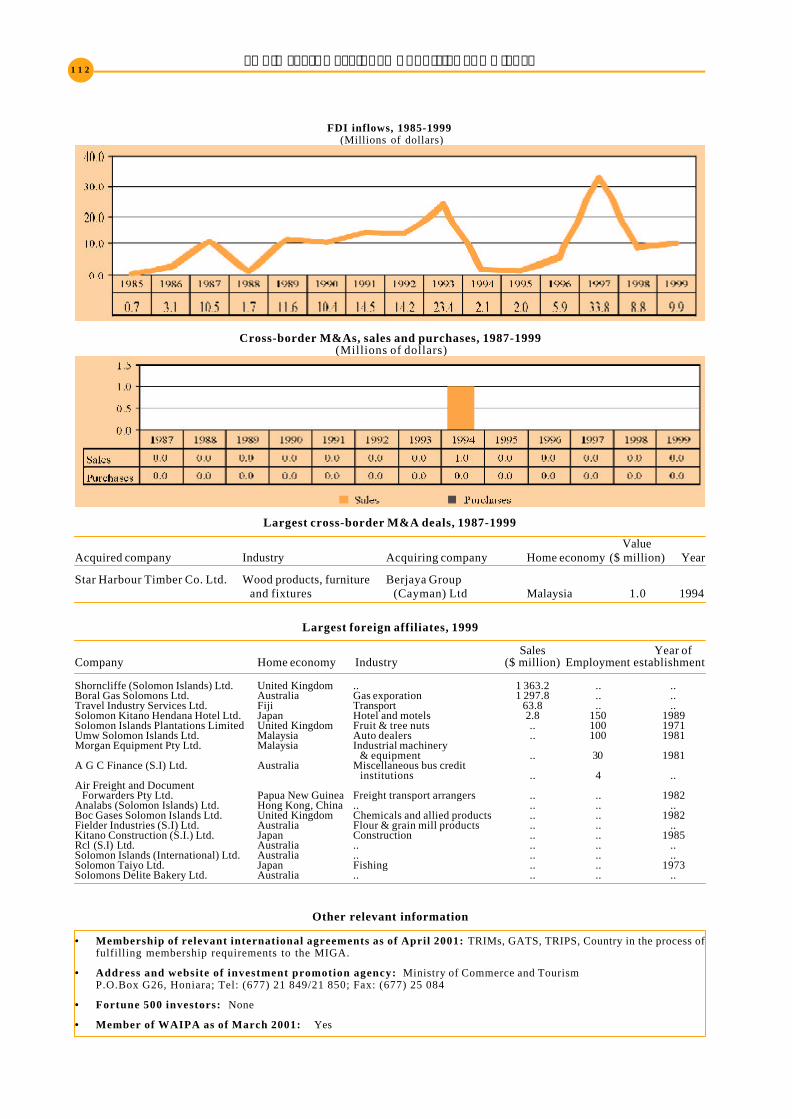
Cross-border M&As, sales and purchases, 1987-1999 (Millions of dollars)
Largest cross-border M&A deals, 1987-1999
ValueAcquired company Industry Acquiring company Home economy ($ million) Year
Star Harbour Timber Co. Ltd. Wood products, furniture Berjaya Group and fixtures (Cayman) Ltd Malaysia 1.0 1994
Largest foreign affiliates, 1999
Sales Year ofCompany Home economy Industry ($ million) Employment establishment
Shorncliffe (Solomon Islands) Ltd. United Kingdom .. 1 363.2 .. ..Boral Gas Solomons Ltd. Australia Gas exporation 1 297.8 .. ..Travel Industry Services Ltd. Fiji Transport 63.8 .. ..Solomon Kitano Hendana Hotel Ltd. Japan Hotel and motels 2.8 150 1989Solomon Islands Plantations Limited United Kingdom Fruit & tree nuts .. 100 1971Umw Solomon Islands Ltd. Malaysia Auto dealers .. 100 1981Morgan Equipment Pty Ltd. Malaysia Industrial machinery
& equipment .. 30 1981A G C Finance (S.I) Ltd. Australia Miscellaneous bus credit
institutions .. 4 ..Air Freight and Document Forwarders Pty Ltd. Papua New Guinea Freight transport arrangers .. .. 1982Analabs (Solomon Islands) Ltd. Hong Kong, China .. .. .. ..Boc Gases Solomon Islands Ltd. United Kingdom Chemicals and allied products .. .. 1982Fielder Industries (S.I) Ltd. Australia Flour & grain mill products .. .. ..Kitano Construction (S.I.) Ltd. Japan Construction .. .. 1985Rcl (S.I) Ltd. Australia .. .. .. ..Solomon Islands (International) Ltd. Australia .. .. .. ..Solomon Taiyo Ltd. Japan Fishing .. .. 1973Solomons Delite Bakery Ltd. Australia .. .. .. ..
Other relevant information
• Membership of relevant international agreements as of April 2001: TRIMs, GATS, TRIPS, Country in the process offulfilling membership requirements to the MIGA.
• Address and website of investment promotion agency: Ministry of Commerce and TourismP.O.Box G26, Honiara; Tel: (677) 21 849/21 850; Fax: (677) 25 084
• Fortune 500 investors: None
• Member of WAIPA as of March 2001: Yes
FDI inflows, 1985-1999 (Millions of dollars)