countyfinanceppt 2017 garland · • garland county has a similar share of revenue that comes from...
TRANSCRIPT

Presenter
[Insert Date]

Garland County

How can Garland County continue to provide services for its citizens?
• Understand Today’s Budget: Take stock of factors impacting county services and funding sources.
• Look Forward: Anticipate changes that might affect the county budget in the future.
• Prepare and Plan: Assess what the county might do to take advantage of anticipated changes (in the short-term and the long-term).

Garland County Population Estimates & Projections, 1999-2031
Data Source: Population Estimates, U.S. Census Bureau; Population Projections, Woods & Poole
• From the start of the Great Recession in 2007 to 2018, the population in Garland County has gone up 5% (or by 4,435 people).
0
20000
40000
60000
80000
100000
120000
Po
pu
lati
on
Actual Projections

Population Change, 1999-2018
Data Source: Population Estimates, U.S. Census Bureau

Population Change, 2010-2018
Data Source: Population Estimates, U.S. Census Bureau

Garland County Total Employment Estimates, 1999-2018
Data Source: Employment Estimates, Regional Economic Accounts, Bureau of Economic Analysis, Woods & Poole
• From the start of the Great Recession in 2007 to 2018, employment in Garland County has gone up .6% (or by 304 jobs).
0
10000
20000
30000
40000
50000
60000
70000
To
tal Em
plo
ym
en
t
Actual Projections
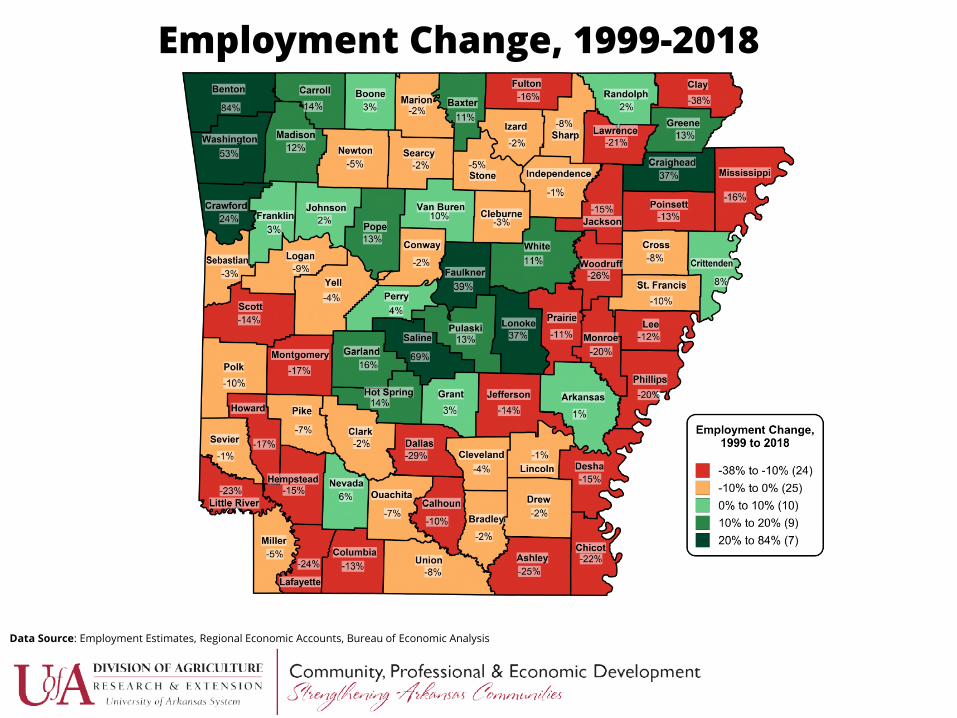
Employment Change, 1999-2018
Data Source: Employment Estimates, Regional Economic Accounts, Bureau of Economic Analysis

Employment Change, 2010-2018
Data Source: Employment Estimates, Regional Economic Accounts, Bureau of Economic Analysis


Garland County Total Revenue & Expenditures, 1999-2017
*Due to rounding, bars may appear slightly higher or lower than the values stated on this slide.Data Sources: Revenue and Expenditure Statements, Arkansas Legislative Audit; South Urban CPI, Bureau of Labor Statistics
• From 2007 to 2017, the Total Revenue in Garland County has gone up 42% (or by $14,839,220).
• From 2007 to 2017, the Total Expenditures in Garland County have gone up 44% (or by $15,221,777).
$0
$10
$20
$30
$40
$50
$60
$70
$80
$90
1999 2000 2001 2002 2003 2004 2005 2006 2007 2008 2009 2010 2011 2012 2013 2014 2015 2016 2017
Co
nst
an
t 2
017
Do
llars
(Millio
ns)
Total Revenue Total Expenditures

Change in Total Revenue, 1999-2017
Data Sources: Revenue and Expenditure Statements, Arkansas Legislative Audit; South Urban CPI, Bureau of Labor Statistics

Change in Total Expenditures, 1999-2017
Data Sources: Revenue and Expenditure Statements, Arkansas Legislative Audit; South Urban CPI, Bureau of Labor Statistics
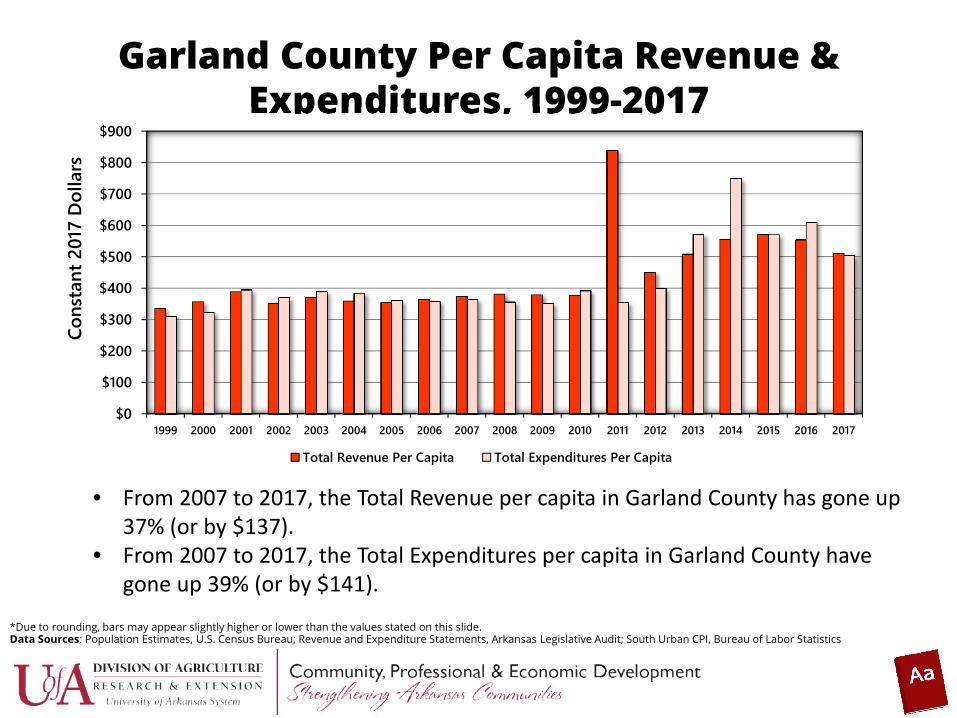
Garland County Per Capita Revenue & Expenditures, 1999-2017
*Due to rounding, bars may appear slightly higher or lower than the values stated on this slide.Data Sources: Population Estimates, U.S. Census Bureau; Revenue and Expenditure Statements, Arkansas Legislative Audit; South Urban CPI, Bureau of Labor Statistics
• From 2007 to 2017, the Total Revenue per capita in Garland County has gone up 37% (or by $137).
• From 2007 to 2017, the Total Expenditures per capita in Garland County have gone up 39% (or by $141).
$0
$100
$200
$300
$400
$500
$600
$700
$800
$900
1999 2000 2001 2002 2003 2004 2005 2006 2007 2008 2009 2010 2011 2012 2013 2014 2015 2016 2017
Co
nst
an
t 2
017
Do
llars
Total Revenue Per Capita Total Expenditures Per Capita
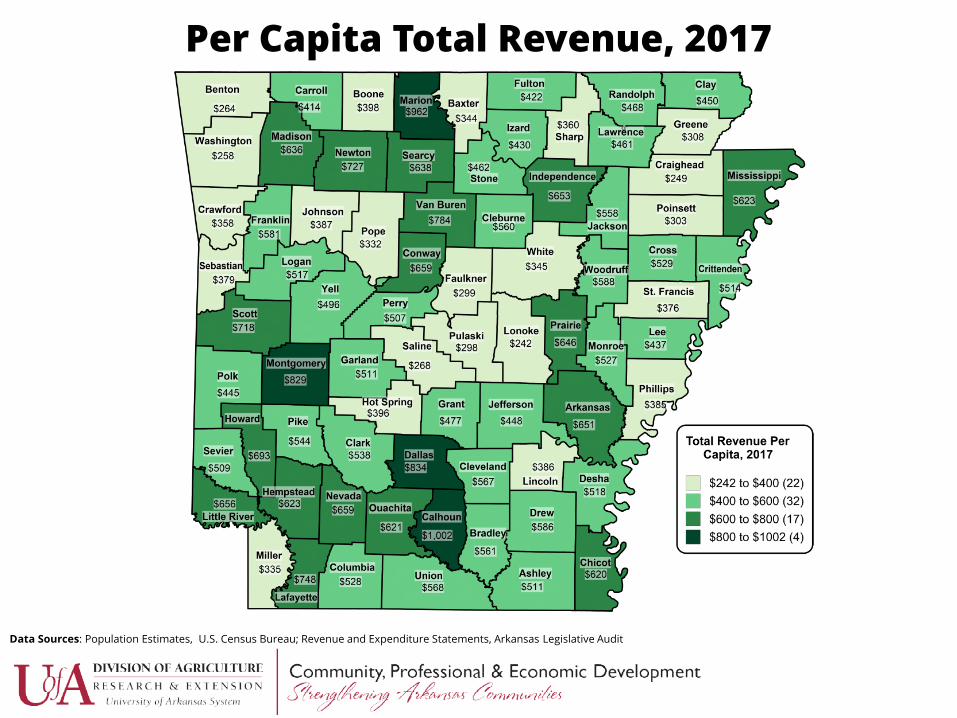
Per Capita Total Revenue, 2017
Data Sources: Population Estimates, U.S. Census Bureau; Revenue and Expenditure Statements, Arkansas Legislative Audit

Per Capita Total Expenditures, 2017
Data Sources: Population Estimates, U.S. Census Bureau; Revenue and Expenditure Statements, Arkansas Legislative Audit


Garland County Revenue Source as a Percent of Total Revenue, 1999-2017
*Due to rounding, bars may appear slightly higher or lower than the values stated on this slide.Data Source: Revenue and Expenditure Statements, Arkansas Legislative Audit
• The share of revenue coming from Sales Tax and taxable services, which grew from 1999 to 2017, is the largest source of revenue for the county.
• This suggests that the county is heavily dependent on the sales taxes generated from retail trade for county operations.
0%
10%
20%
30%
40%
Intergovernmental
Revenue
Property Tax Sales Tax and
taxable services
Officers, Jail & 911
fees
Commissions &
Taxes Apportioned
Fines, Forfeitures &
Franchise Taxes
Other Revenue
Sh
are
of
To
tal R
even
ue
1999 2017

Garland County Revenue Sources Compared to State Average Share, 2017
*Due to rounding, bars may appear slightly higher or lower than the values stated on this slide.Data Source: Revenue and Expenditure Statements, Arkansas Legislative Audit
• Garland County has a similar share of revenue that comes from Intergovernmental Revenues compared to other counties in Arkansas (12% compared to 22% for the state average).
• Garland County has a similar share of revenue that comes from Property Taxes compared to other counties in Arkansas (11% compared to 23% for the state average).
• Garland County has a higher share of revenue that comes from Sales Taxes compared to other counties in Arkansas (35% compared to 25% for the state average).
0%
10%
20%
30%
40%
Intergovermental
Revenue
Property Tax Sales Tax Officers, Jail & 911
fees
Commissions &
Taxes Apportioned
Fines, Forfeitures &
Franchise Taxes
Other Revenue
Sh
are
of
To
tal
Reven
ue
Garland State

Garland County Major Sources of Revenue, 1999-2017
Data Sources: Revenue and Expenditure Statements, Arkansas Legislative Audit; South Urban CPI, Bureau of Labor Statistics
• From 2007 to 2017, Intergovernmental Revenue in Garland County has gone up 14% (or by $759,487).
• From 2007 to 2017, Property Tax Revenue in Garland County has gone up 53% (or by $1,844,310).
• From 2007 to 2017, Sales Tax Revenue in Garland County has gone up 102%
$0.0
$5.0
$10.0
$15.0
$20.0
$25.0
$30.0
1999 2000 2001 2002 2003 2004 2005 2006 2007 2008 2009 2010 2011 2012 2013 2014 2015 2016 2017
Consta
nt 2017
Dolla
rs
(Mill
ions)
Intergovermental Revenue Property Tax Sales Tax
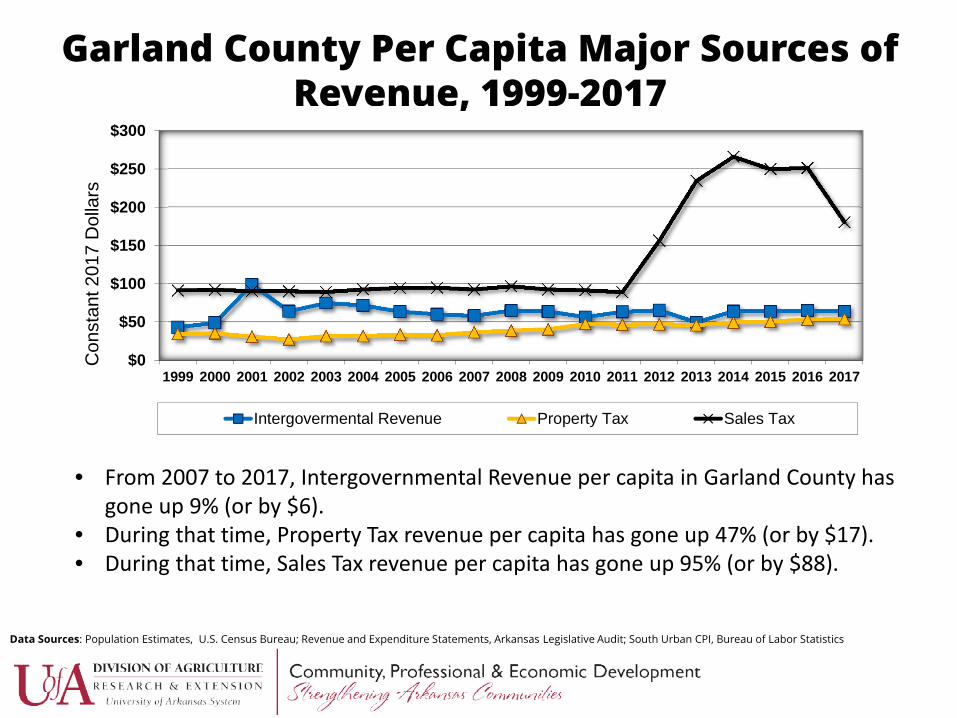
Garland County Per Capita Major Sources of Revenue, 1999-2017
Data Sources: Population Estimates, U.S. Census Bureau; Revenue and Expenditure Statements, Arkansas Legislative Audit; South Urban CPI, Bureau of Labor Statistics
• From 2007 to 2017, Intergovernmental Revenue per capita in Garland County has gone up 9% (or by $6).
• During that time, Property Tax revenue per capita has gone up 47% (or by $17).• During that time, Sales Tax revenue per capita has gone up 95% (or by $88).
$0
$50
$100
$150
$200
$250
$300
1999 2000 2001 2002 2003 2004 2005 2006 2007 2008 2009 2010 2011 2012 2013 2014 2015 2016 2017
Co
nsta
nt 2017 D
olla
rs
Intergovermental Revenue Property Tax Sales Tax

Per Capita Intergovernmental Revenue, 2017
Data Sources: Population Estimates, U.S. Census Bureau; Revenue and Expenditure Statements, Arkansas Legislative Audit

Change in Per Capita Intergovernmental Revenue, 1999-2017
Data Sources: Population Estimates, U.S. Census Bureau; Revenue and Expenditure Statements, Arkansas Legislative Audit; South Urban CPI, Bureau of Labor Statistics
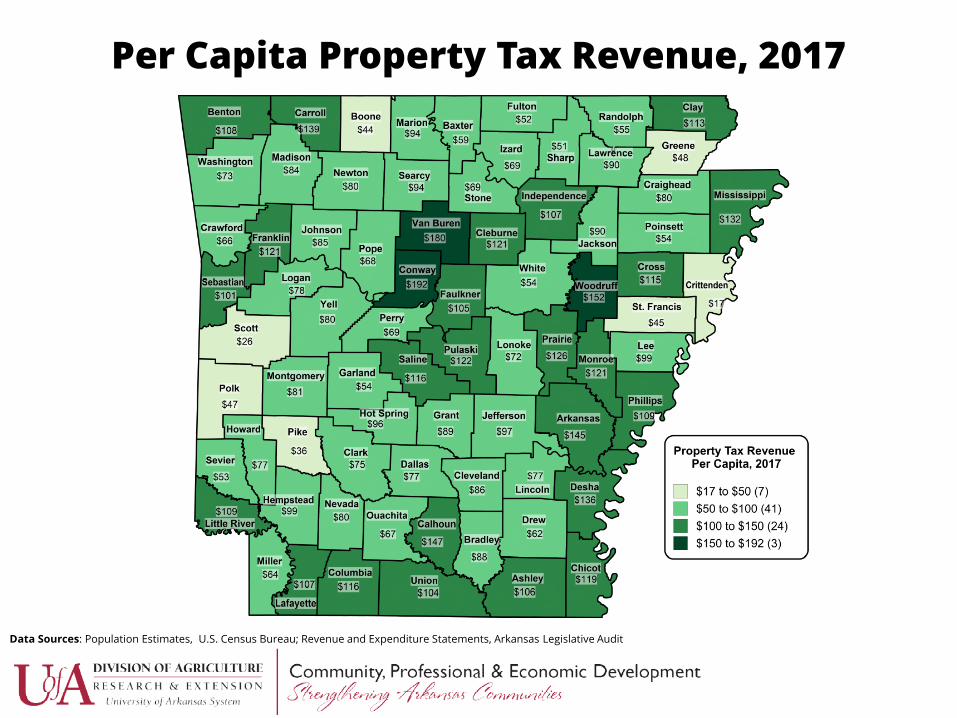
Per Capita Property Tax Revenue, 2017
Data Sources: Population Estimates, U.S. Census Bureau; Revenue and Expenditure Statements, Arkansas Legislative Audit

Change in Per Capita Property Tax Revenue, 1999-2017
Data Sources: Population Estimates, U.S. Census Bureau; Revenue and Expenditure Statements, Arkansas Legislative Audit; South Urban CPI, Bureau of Labor Statistics

Per Capita Sales Tax Revenue, 2017
Data Sources: Population Estimates, U.S. Census Bureau; Revenue and Expenditure Statements, Arkansas Legislative Audit

Change in Per Capita Sales Tax Revenue, 1999-2017
Data Sources: Population Estimates, U.S. Census Bureau; Revenue and Expenditure Statements, Arkansas Legislative Audit; South Urban CPI, Bureau of Labor StatisticsNote: Crawford County had sales tax revenue in only the 4th quarter of 1999, because this skews the percent change value for Crawford County is treated as 0 for this map.

Garland County Minor Sources of Revenue, 1999-2017
Data Sources: Revenue and Expenditure Statements, Arkansas Legislative Audit; South Urban CPI, Bureau of Labor Statistics
• From 2007 to 2017, revenue from Officers, Jail and 911 fees Garland County has gone up 31% (or by $1,161,399).
• During that time, revenue from Commissions and Taxes Apportioned has gone down 2% (or by -$51,349).
• During that time, revenue from Fines, Forfeitures & Franchise Taxes has gone up 29% (or by $394,304).
• During that time, Other revenue has gone up 17% (or by $1,745,402).
$0.0
$10.0
$20.0
$30.0
$40.0
$50.0
$60.0
1999 2000 2001 2002 2003 2004 2005 2006 2007 2008 2009 2010 2011 2012 2013 2014 2015 2016 2017
Con
sta
nt 2
017 D
olla
rs
(Mill
ions)
Officers, Jail & 911 fees Commissions & Taxes ApportionedFines, Forfeitures & Franchise Taxes Other Revenue

Garland County Per Capita Minor Sources of Revenue, 1999-2017
Data Sources: Population Estimates, U.S. Census Bureau; Revenue and Expenditure Statements, Arkansas Legislative Audit; South Urban CPI, Bureau of Labor Statistics
• From 2007 to 2017, per capita revenue from Officers, Jail and 911 fees in Garland County has gone up 26% (or by $10).
• During that time, per capita revenue from Commissions and Taxes Apportioned went down 6% (or by -$1).
• During that time, per capita revenue from Fines, Forfeitures & Franchise Taxes went up 24% (or by $3).
• During that time, Other per capita revenue went up 13% (or by $14).
$0
$100
$200
$300
$400
$500
$600
1999 2000 2001 2002 2003 2004 2005 2006 2007 2008 2009 2010 2011 2012 2013 2014 2015 2016 2017
Consta
nt 2017
Dolla
rs
Officers, Jail & 911 fees Commissions & Taxes Apportioned


Garland County Expenditures for Services Provided, 1999-2017
*Due to rounding, bars may appear slightly higher or lower than the values stated on this slide.Data Source: Revenue and Expenditure Statements, Arkansas Legislative Audit
• The share of total expenditures going towards Law Enforcement and Public Safety in Garland County has gone down 0 percentage points from 1999 to 2017.
• The share of total expenditures going towards Highways and Streets has gone up 9 percentage points during that time.
0%
5%
10%
15%
20%
25%
30%
35%
40%
Law Enforcement &
Public Safety
Highways & Streets General & Other Health & Social
Services
Recreation &
Culture
Debt Service Capital Outlay
Sh
are
of
To
tal Exp
en
dit
ure
s
1999 2017

Garland County Expenditure Shares Compared to State Average Shares, 2017
*Due to rounding, bars may appear slightly higher or lower than the values stated on this slide.Data Source: Revenue and Expenditure Statements, Arkansas Legislative Audit
• The share of total expenditures going towards Law Enforcement and Public Safety is 3 percentage points lower in Garland County compared to the average for all counties in Arkansas.
• The share of total expenditures going towards Highways and Streets is 3 percentage points lower in Garland County compared to the average for all counties in Arkansas.
0%
5%
10%
15%
20%
25%
30%
35%
40%
Law Enforcement &
Public Safety
Highways & Streets General & Other Health & Social
Services
Recreation &
Culture
Debt Service Capital Outlay
Sh
are
of
To
tal Exp
en
dit
ure
s
Garland State

Garland County Major Category Expenditures, 1999-2017
Data Sources: Revenue and Expenditure Statements, Arkansas Legislative Audit; South Urban CPI, Bureau of Labor Statistics
• From 2007 to 2017, expenditures on Law Enforcement and Public Safety in Garland County have gone up 47% (or by $5,554,535).
• During that time, expenditures on Highways and Streets went up 84% (or by $4,453,590).
$0.0
$5.0
$10.0
$15.0
$20.0
$25.0
$30.0
$35.0
$40.0
$45.0
1999 2000 2001 2002 2003 2004 2005 2006 2007 2008 2009 2010 2011 2012 2013 2014 2015 2016 2017Co
nsta
nt 2017 D
olla
rs (
Mill
ions)
Law Enforcement & Public Safety Highways & Streets General & Other

Garland County Per Capita Major Category Expenditures, 1999-2017
Data Sources: Population Estimates, U.S. Census Bureau; Revenue and Expenditure Statements, Arkansas Legislative Audit; South Urban CPI, Bureau of Labor Statistics
• From 2007 to 2017, per capita expenditures on Law Enforcement and Public Safety in Garland County have gone up 42% (or by $52).
• During that time, expenditures on Highways and Streets went up 77% (or by $43).
$0
$50
$100
$150
$200
$250
$300
$350
$400
$450
1999 2000 2001 2002 2003 2004 2005 2006 2007 2008 2009 2010 2011 2012 2013 2014 2015 2016 2017
Consta
nt 201
7 D
olla
rs
Law Enforcement & Public Safety Highways & Streets General & Other

Per Capita Public Safety Expenditures, 2017
Data Sources: Population Estimates, U.S. Census Bureau; Revenue and Expenditure Statements, Arkansas Legislative Audit
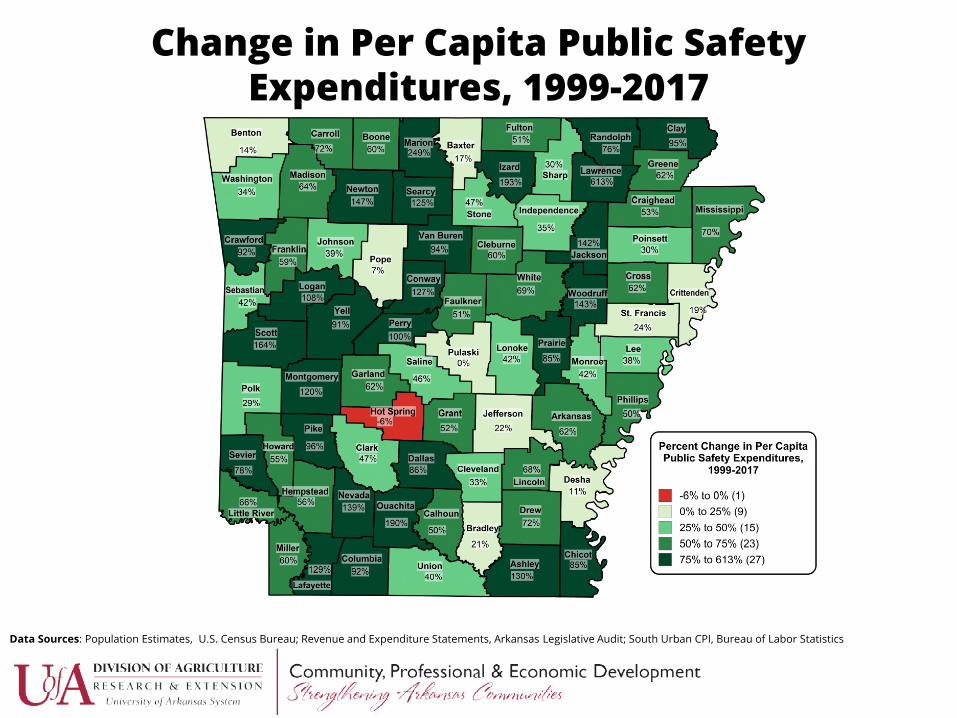
Change in Per Capita Public Safety Expenditures, 1999-2017
Data Sources: Population Estimates, U.S. Census Bureau; Revenue and Expenditure Statements, Arkansas Legislative Audit; South Urban CPI, Bureau of Labor Statistics

Per Capita Road Expenditures, 2017
Data Sources: Population Estimates, U.S. Census Bureau; Revenue and Expenditure Statements, Arkansas Legislative Audit

Change in Per Capita Road Expenditures, 1999-2017
Data Sources: Population Estimates, U.S. Census Bureau; Revenue and Expenditure Statements, Arkansas Legislative Audit; South Urban CPI, Bureau of Labor Statistics

Garland County Road Expenditures Per County Road Mile, 1999-2017
Data Sources: Revenue and Expenditure Statements, Arkansas Legislative Audit; Road & Street Report, Arkansas Highway and Transportation Department
• From 2007 to 2017, expenditures per county road mile in Garland County have gone up 85% (or by $3,805) compared to 19% (or by $590) for all counties in Arkansas.
• Garland County road expenditures in 2017 are considerably greater than the average for all Arkansas counties.
$0
$1,000
$2,000
$3,000
$4,000
$5,000
$6,000
$7,000
$8,000
$9,000
1999200020012002200320042005 200620072008200920102011201220132014201520162017
Consta
nt 2017
Dolla
rs
Garland State

Garland County Minor Category Expenditures, 1999-2017
Data Sources: Revenue and Expenditure Statements, Arkansas Legislative Audit; South Urban CPI, Bureau of Labor Statistics
• From 2007 to 2017, expenditures on Health and Social Services in Garland County have gone up 133% (or by $193,381).
• During that time, expenditures on Recreation and Culture have gone up 43% (or by $916,036).
• During that time, expenditures on Debt Service have gone up 341% (by $1,236,051).
$0.0
$2.0
$4.0
$6.0
$8.0
$10.0
$12.0
$14.0
$16.0
$18.0
$20.0
1999 2000 2001 2002 2003 2004 2005 2006 2007 2008 2009 2010 2011 2012 2013 2014 2015 2016 2017
Consta
nt 20
17 D
olla
rs
(Mill
ions)
Health & Social Services Recreation & Culture Debt Service Capital Outlay
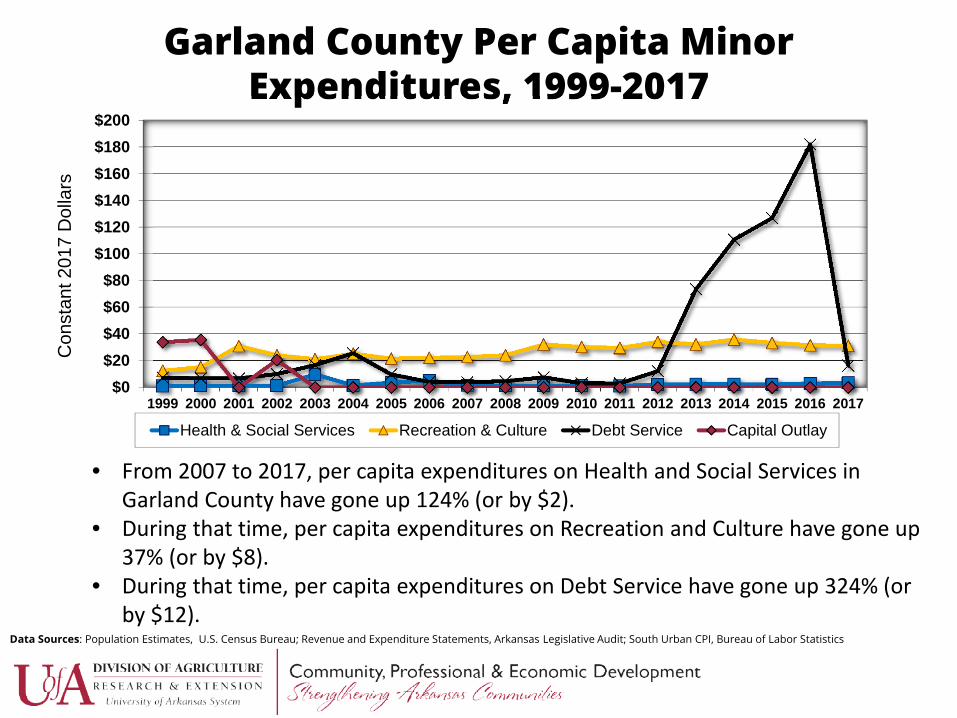
Garland County Per Capita Minor Expenditures, 1999-2017
Data Sources: Population Estimates, U.S. Census Bureau; Revenue and Expenditure Statements, Arkansas Legislative Audit; South Urban CPI, Bureau of Labor Statistics
• From 2007 to 2017, per capita expenditures on Health and Social Services in Garland County have gone up 124% (or by $2).
• During that time, per capita expenditures on Recreation and Culture have gone up 37% (or by $8).
• During that time, per capita expenditures on Debt Service have gone up 324% (or by $12).
$0
$20
$40
$60
$80
$100
$120
$140
$160
$180
$200
1999 2000 2001 2002 2003 2004 2005 2006 2007 2008 2009 2010 2011 2012 2013 2014 2015 2016 2017
Co
nsta
nt 2017 D
olla
rs
Health & Social Services Recreation & Culture Debt Service Capital Outlay


Garland County Total Property Assessments,1999-2017
Data Sources: Assessed Values, Arkansas Assessment Coordination Department; South Urban CPI, Bureau of Labor Statistics
• From the beginning of the Great Recession in 2007 to 2017, Total Property Assessments in Garland County have gone up 35% (or by $488,472,760).
$0
$200
$400
$600
$800
$1,000
$1,200
$1,400
$1,600
$1,800
$2,000
1999 2000 2001 2002 2003 2004 2005 2006 2007 2008 2009 2010 2011 2012 2013 2014 2015 2016 2017
Co
nsta
nt 2017 D
olla
rs (
Mill
ions)

Garland County Per Capita Property Assessments, 1999-2017
Data Sources: Assessed Values, Arkansas Assessment Coordination Department; South Urban CPI, Bureau of Labor Statistics; Population Estimates, U.S. Census Bureau
• From 2007 to 2017, Property Assessments per capita in Garland County have gone up 9.4% (or by $1,649) compared to up 9% (or by $1,292) for all counties in Arkansas.
• Garland County per capita property tax assessments were greater than the average for all counties in 2007 and the gap has widened since then.
$0
$5,000
$10,000
$15,000
$20,000
$25,000
1999 2000 2001 2002 2003 2004 2005 2006 2007 2008 2009 2010 2011 2012 2013 2014 2015 2016 2017
Con
sta
nt 2
017 D
olla
rs
Garland State
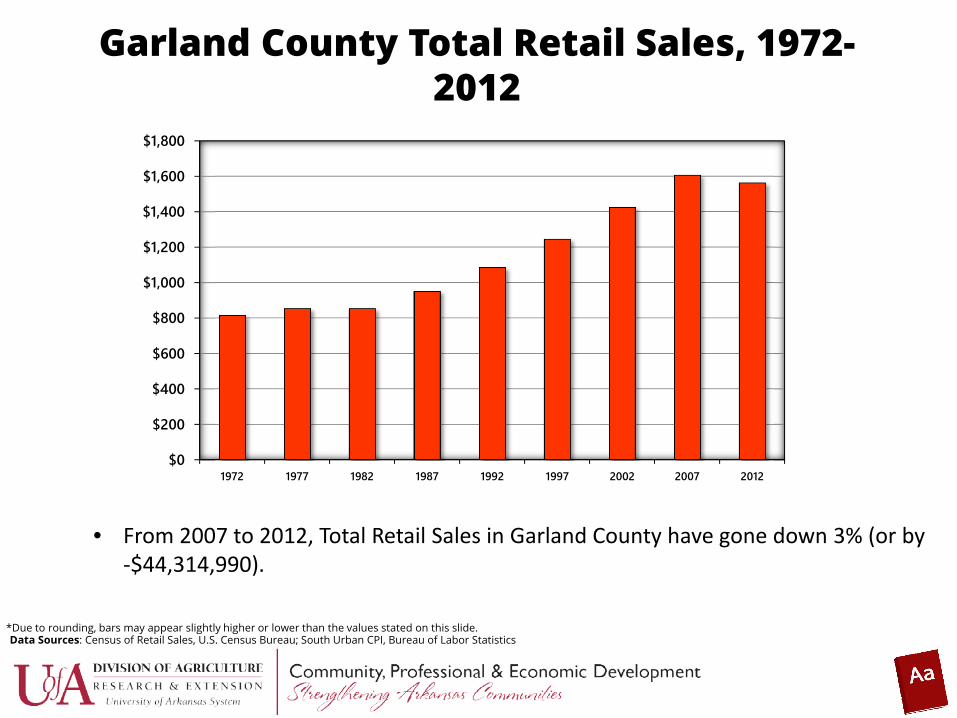
Garland County Total Retail Sales, 1972-2012
*Due to rounding, bars may appear slightly higher or lower than the values stated on this slide.Data Sources: Census of Retail Sales, U.S. Census Bureau; South Urban CPI, Bureau of Labor Statistics
• From 2007 to 2012, Total Retail Sales in Garland County have gone down 3% (or by -$44,314,990).
$0
$200
$400
$600
$800
$1,000
$1,200
$1,400
$1,600
$1,800
1972 1977 1982 1987 1992 1997 2002 2007 2012

Garland County Per Capita Retail Sales, 1972-2012
*Due to rounding, bars may appear slightly higher or lower than the values stated on this slide.
Data Sources: Census of Retail Sales, U.S. Census Bureau; South Urban CPI, Bureau of Labor Statistics; Population Estimates, U.S. Census Bureau
• From 2007 to 2012, per capita Retail Sales in Garland County have gone down 5% (or by -$848).
• During that time, average per capita Retail Sales for all counties in Arkansas have gone down 3% (or by -$426).
$0
$2,000
$4,000
$6,000
$8,000
$10,000
$12,000
$14,000
$16,000
$18,000
1972 1977 1982 1987 1992 1997 2002 2007 2012
Co
nst
an
t 2
017
Do
llars
Garland State

Capacity and Effort
Capacity:– The maximum amount that can be produced when all the
resources in an economy are employed as fully as possible.
– Capacity constraints can be caused by lack of investment and skills shortages.
– Spare capacity can be caused by lack of demand.
Effort:– The amount to which a county utilizes its ability to generate
revenue through taxation.
Property Tax Capacity and Effort
Capacity:• High capacity = County’s per capita property assessments
were above the state average.
• Low capacity = County’s per capita property assessments were below the state average.
Effort:• High effort = County’s millage rate was above the average of
Arkansas counties.
• Low effort = County’s millage rate was below the average of Arkansas counties.

Property Tax Capacity & Effort, 2017
Data Sources: Population Estimates, U.S. Census Bureau; Property Assessments and Millage Rates, the Arkansas Assessment Coordination Department

Sales Tax Capacity and Effort
Capacity:• High capacity = County’s per capita retail sales were above
the state average.
• Low capacity = County’s per capita retail sales were below the state average.
Effort:• High effort = County’s sales tax rate was above the average of
Arkansas counties.
• Low effort = County’s sales tax rate was below the average of Arkansas counties.
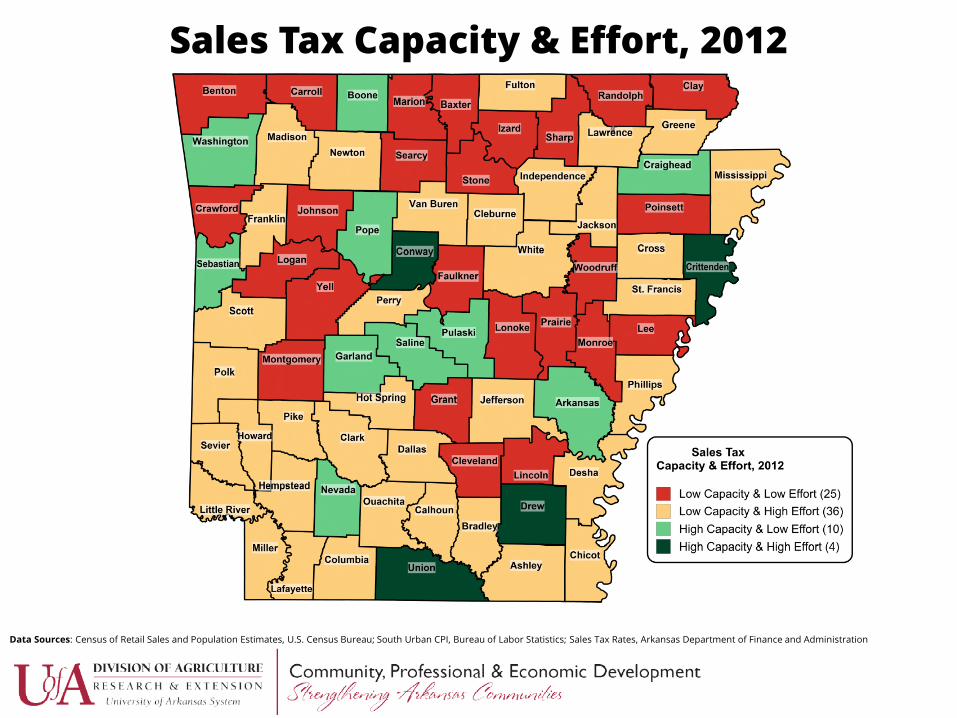
Sales Tax Capacity & Effort, 2012
Data Sources: Census of Retail Sales and Population Estimates, U.S. Census Bureau; South Urban CPI, Bureau of Labor Statistics; Sales Tax Rates, Arkansas Department of Finance and Administration

Options for Providing Services to County Residents
• Increase cost effectiveness– Improve management and productivity– Explore possibility of privatizing services– Consider intergovernmental agreements to offer shared
services
• Increase revenue– Alternative (new) revenue sources
• User charges, • shift tax burden to non-residents
– Expand the tax base– Increase tax rates
• Reduce Services

Contact
Jimmy Driggers, County Staff Chair, 501-623-6841
For more information and assistance on county government finance options, contact:
Visit Our Website:
https://uaex.edu/localgov
The University of Arkansas System Division of Agriculture offers all its Extension and Research programs and services without regard to race, color, sex, gender identity, sexual orientation, national origin, religion, age, disability, marital or
veteran status, genetic information, or any other legally protected status, and is an Affirmative Action/Equal Opportunity Employer.

Important terms used in the presentation are now included in a dictionary which can only be accessed when delivering the PowerPoint presentation.
During the presentation, when new terminology is introduced, a picture of a red dictionary will appear in the bottom right-hand corner of the slide show. Simply click the image to visit the dictionary page.
When you are done looking over the terminology on the slide, click on the return icon and you will be taken back to the previous slide.

Dictionary, Slide 11Total Revenue: total revenue received by the county government in a given year.
Total revenue is the sum of seven categories of county government revenue. The three major sources of revenue are intergovernmental revenue, property tax revenue, sales tax revenue. The four minor revenue sources are commissions and taxes apportioned; fines, forfeitures and franchise taxes; officers, jail and 911 fees; and other revenue.
Total expenditures: total county government spending in a given year.
Total expenditures are the sum of seven categories of county government spending. The three major category expenditures are law enforcement and public safety; highways and streets; and general and other spending. The four minor spending categories are health and social services; recreation and culture; capital outlay; and debt service.

Dictionary, Slide 14
Total Revenue per Capita: total revenue received by the county government per person in the county.
Total expenditures per Capita: total expenditures of the county government per person in the county.
A total value can be converted to a per capita measure using the formula below:
Per Capita = Total ÷ Population

Dictionary, Slide 18 - Part 1
Intergovernmental Revenue: all revenue received by the county government from state and federal sources.
Property Tax Revenue: total revenue received by the county government from taxes levied on real and personal property.
Sales Tax Revenue: total revenue from sales taxes levied by the county government.
Definitions of officers, jail & 911 fees, commissions & taxes apportioned, fines, forfeitures & franchise taxes; and other revenue on the next slide.

Dictionary, Slide 18 - Part 2Officers, Jail & 911 Fees: revenue from 911 surcharges, ambulance fees, city contributions for 911 dispatch fees, dispatch salary reimbursement, emergency service fees, inmate fees, jail telephone commissions, prisoner care and law enforcement services.
Commissions & Taxes Apportioned: commissions earned by the county treasurer and county collector and tax revenue allocated to the county assessor.
Fines, Forfeitures & Franchise taxes: revenue collected from fines and property forfeitures as well as revenue paid by businesses for operating in the county.
Other Revenue: monies collected from fines and forfeitures paid to municipal courts, court costs, investment income, sanitation fees, recyclables, donations, and other miscellaneous revenue.
Dictionary, Slide 31 - Part 1
Law enforcement & public safety: county government spending for law enforcement, jails and other related services.
Highways & Streets: county government spending for county roads and bridges.
General & Other: total spending for miscellaneous county government expenses. This includes, but is not limited to: airports, rural water/water projects, hydroelectric projects, community and economic development, and industrial development.
Definitions of health & social services, recreation & culture, capital outlay, and debt service are provided on the next slide.

Dictionary, Slide 31 - Part 2
Health & social services: county government spending for health and social services.
Recreation & culture: county government spending for parks, community centers, libraries, and other similar services.
Capital outlay: money spent by the county government to acquire, repair, maintain and improve fixed assets (machinery, land and facilities).
Debt service: money spent by the county government on lease principal and interest, bond principal and interest, and credit principal and interest payments.

Dictionary, Slide 43
Total Property Assessments: the total assessed value of property in the county. This is the tax base on which property tax revenue is generated.
Assessable property in Arkansas includes:
1. Real estate property2. Personal property3. Public utility and carrier property4. Mineral property5. Agricultural property6. Forestry property

Dictionary, Slide 45
Total Retail Sales: total sales by all retail establishments in the county.The U.S. Census Bureau defines retail establishments as follows:
“The retailing process is the final step in the distribution of merchandise; retailers are, therefore, organized to sell merchandise in small quantities to the general public. This sector comprises two main types of retailers: store and non[-]store retailers.”
Retail sales in a proxy for the sales tax base on which sales tax revenue is generated.

Update the hyperlink and tool tip information for this box then change the “Shape Fill” to “None” and delete this text.
Update the hyperlink and tool tip information for this box then change the “Shape Fill” to “None” and delete this text.
Appendix, Slide ##
Word: this is a template
Return to slide #