coupling statistical indentation and microscopy to
TRANSCRIPT

HAL Id: hal-01938271https://hal.archives-ouvertes.fr/hal-01938271
Submitted on 28 Nov 2018
HAL is a multi-disciplinary open accessarchive for the deposit and dissemination of sci-entific research documents, whether they are pub-lished or not. The documents may come fromteaching and research institutions in France orabroad, or from public or private research centers.
L’archive ouverte pluridisciplinaire HAL, estdestinée au dépôt et à la diffusion de documentsscientifiques de niveau recherche, publiés ou non,émanant des établissements d’enseignement et derecherche français ou étrangers, des laboratoirespublics ou privés.
Coupling statistical indentation and microscopy toevaluate micromechanical properties of materials:Application to viscoelastic behavior of irradiated
mortarsBenoit Hilloulin, Maxime Robira, Ahmed Loukili
To cite this version:Benoit Hilloulin, Maxime Robira, Ahmed Loukili. Coupling statistical indentation and mi-croscopy to evaluate micromechanical properties of materials: Application to viscoelastic behav-ior of irradiated mortars. Cement and Concrete Composites, Elsevier, 2018, 94, pp.153 - 165.�10.1016/j.cemconcomp.2018.09.008�. �hal-01938271�

1
Coupling statistical indentation and microscopy to evaluate micromechanical 1
properties of materials: application to viscoelastic behavior of irradiated mortars 2
Benoit Hilloulina*
, Maxime Robiraa,b,c
, Ahmed Loukilia 3
a , Institut de Recherche en Génie Civil et Mécanique (GeM), UMR-CNRS 6183, Ecole Centrale 4
de Nantes, 1 rue de la Noë, 44321 Nantes, France – e-mail: [email protected]; 5
b SUBATECH, Unité Mixte de Recherche 6457, École des Mines de Nantes, CNRS/IN2P3, 7
Université de Nantes, BP 20722, 44307 Nantes cedex 3, France – e-mail: 8
c Tractebel Engineering – Le Delage, 5 rue du 19 Mars 1962, 92622 Gennevilliers CEDEX, 10
France 11
12
13
* Corresponding author: Tel.: + 33 (0)2 40 37 16 61 14
15
16
Highlights 17
- Data mining principles applied to materials can lead to substantial improvements in 18
the properties identification process. 19
- Coupling indentation and optical analysis reduces identified phase properties’ 20
variability. 21
- -irradiated mortar samples exhibit greater creep modulus and hardness and lower 22
creep characteristic time than references. 23
24

2
Abstract 25
In this work, an original method coupling statistical indentation and 3D microscope 26
image analysis for heterogenous materials characterization is developed. Statistical 27
microindentation test results performed on -irradiated and pristine mortar specimens 28
are presented and analyzed using a clustering data mining technique. The outputs are 29
compared with the phase identification from 3D image analysis to effectively reduce 30
uncertainties in the material properties of one of the phases (cement paste). With respect 31
to the effects of irradiations on cementitious materials, a significant increase of cement 32
paste creep modulus and hardness, and a significant decrease of creep characteristic 33
time, are highlighted after an exposition of 257 kGy at 8.5 Gy /min. Young’s modulus 34
of the cement paste is not significantly affected. These results confirm macroscopic 35
concrete creep observations presented in previous studies fitted with dose-dependent 36
logarithmic laws. 37
38
39
Keywords: Indentation, Cement Paste (D), Mechanical properties (C), Creep (C), 40
Radioactive Waste (E), Image analysis (B). 41
42
1. Introduction 43
The macroscopic mechanical properties of concrete mainly depend on micro-44
mechanical properties of its binding phase (i.e., the cement paste) and more particularly 45
on the calcium silicate hydrate (CSH) gel, which exhibits significant local variations. 46
For some years, microindentation and nanoindentation have been widely investigated to 47
characterize elasto-plastic and creep properties of cementitious materials [1-4]. 48
3
Indentation elastic parameters can then be input in homogenization schemes to 49
determine concrete elastic properties [5-7]. 50
According to Oliver and Pharr theory [8], the initial elastic unloading part of indentation 51
curves can be analyzed to determine the indentation modulus and the indentation 52
hardness of homogenous materials. Because cement paste is highly heterogenous, even 53
at very small length scales, statistical nanoindentation performed at loads leading to 54
penetration depths of some hundreds of nanometers has been developed. Assuming 55
several phases may be indented at the same time, statistical indentation’s main objective 56
is to collect enough data points to apply a deconvolution algorithm giving the individual 57
phase properties [9, 10]. However, two main critical aspects were identified regarding 58
the application of statistical indentation technique to cementitious materials [11]: the 59
size of the interaction volume may be larger than the size of the single phases at the risk 60
of creating spurious peaks in the probability density function (PDF) [12, 13] as well as 61
micromechanical values depending on the applied load [14], and the deconvolution 62
analysis based on Gaussian Mixture itself may converge to local minima [15]. 63
Therefore, coupling indentation results to other techniques identifying the effective 64
nature of the indents is of great interest at different scales: using atomic force 65
microscope [16] or SEM [6, 17, 18]. Coupling nanoindentation and SEM-EDS to filter 66
data points, Chen et al. highlighted the presence of ultra-high density CSH/Ca(OH)2 67
nanocomposites in low water-to-cement ratio cement paste by correlating 68
micromechanical properties, e.g. indentation hardness or indentation modulus, to the 69
portlandite volume fraction measured in volumes with approximately the same size as 70
the one investigated through nanoindentation. Localization of indents by imaging 71
techniques can also be used to differentiate the properties of several inclusions [19, 20] 72
and eventually map a restricted area depending on the measured mechanical properties 73

4
[19, 21]. From the microscale to the macroscale, 3D image analysis of concrete or 74
mortar surface appears to offer a promising field of research for purposes of generating 75
geometric or topological data and supplementing other experimental techniques or 76
providing input for numerical models [22-24]. 77
Besides these developments concerning statistical indentation and imaging, it has been 78
found out that the long-term creep properties of concrete specimens are related to the 79
creep properties measured during minute-long microindentation or nanoindentation 80
experiments. Both creep behaviors can be described using logarithmic time-dependent 81
functions with two main variables: creep modulus and creep characteristic time [7, 25, 82
26]. Creep modulus of cement paste is linearly correlated with indentation hardness 83
which means that the lower the hardness, the greater the creep strains, though the slope 84
of the regression depends on the material: creep modulus of pure CSH is greater than 85
the one of cement paste and it decreases with Ca/Si ratio [27]. Like macroscopic creep, 86
indentation creep depends on the relative humidity [28]. 87
In the context of nuclear waste disposals and, more generally, in the scope of nuclear 88
safety structures characterization, the assessment of mechanical properties of irradiated 89
concrete is of great interest to speculate over long term behavior of concrete under 90
irradiations. Concrete properties evolutions with radiations have recently been 91
summarized [29]. An extensive literature review ensures that irradiations lead to a 92
decrease of the macroscopic strength of concrete under several types of radiations (, 93
and neutrons). The main mechanism behind concrete degradation under -radiation is 94
radiation-induced volumetric expansion (RIVE) of siliceous aggregates [30, 31] at doses 95
greater than a reference dose of around 1×10²⁰
n/cm2 [32]. But under pure -radiation 96
(exposition condition of structural concrete element of disposals [33]), degradation 97
mechanisms are not understood yet and there is still a debate whether a reference level 98

5
of 2×10⁵ kGy introduced some decades ago is relevant or not as some recent studies 99
showed degradations after the exposure to lower doses [34, 35]. Water radiolysis 100
triggered by -radiation is supposed to be the main phenomenon responsible of possible 101
degradations located in the cement paste [36, 37] and phase alterations occurs only at 102
very high doses of some dozens or even hundreds of MGy [38].Concrete creep under 103
low dose irradiation (< 1 Gy / h [33]) is one of the major preoccupations concerning 104
long-term behavior of waste disposal infrastructures. To our knowledge, only one study 105
reported the smaller extent of creep of -irradiated concrete under compression, though 106
measurements were carried out over a relatively short period of one year without any 107
repetition [39]. 108
The growing use of various data mining techniques in civil engineering and materials 109
science applications is changing the way scientists and engineers are facing issues and 110
creating promising paths of investigation at the same time. Larger datasets can be 111
obtained and the challenge is to find useful and innovative information out of them [40]. 112
Data mining techniques are being developed to identify materials properties [41] and 113
even leading to the creation of novel materials. In civil engineering [42], data mining 114
has mainly been used for large scale transportation problems for some years [43]. 115
A main objective of the present work is to demonstrate the potential of data mining 116
techniques for material properties identification in civil engineering at a microscale and 117
mesoscale, at the crossroads of materials science and civil engineering. For this purpose, 118
two complementary methods, namely statistical microindentation and microscopy, were 119
performed on mortar specimens and combined to detect hidden data trends. Used 120
together with adequate data mining techniques, microindentation data analysis and 121
optical microscopy image analysis are shown to reduce the uncertainties associated with 122
cement paste mechanical properties identification. An application to the determination 123
6
of mechanical properties of -irradiated mortars is then proposed. The first micro 124
mechanical dataset of this type is reported and compared with the only, because tedious, 125
measurement performed on concrete some decades ago [39]. Hundreds of measurement 126
points obtained from 3 irradiated and 3 pristine control specimens are compared to 127
highlight hidden trends due to radiation exposure. 128
129
2. Materials and methods 130
2.1 Specimens preparation and irradiation conditions 131
Mortar was prepared with CEM I 52.5 and 0/4 mm calcareous sand (to avoid the 132
activation of alkali-silica reaction by irradiation) with the proportions detailed in 133
Table 1. Any use of organic additives like superplasticizer or demolding oil was 134
avoided to not induce a possible premature degradation by the irradiations. This mortar 135
formulation was determined to be as representative as possible of a high-performance 136
concrete used in nuclear waste storage facility galleries. 137
Six mortar prisms with dimensions of 4 x 4 x 16 cm3 were cast in polypropylene molds 138
to avoid any presence of metallic compounds from the molds. After 1 day of curing 139
under sealed conditions in an air-conditioned room at a temperature of 20°C and 140
90% RH, the specimens were demolded. The specimens were further cured in lime-141
saturated water until the age of 28 days. Mortar prisms were then dried during 14 days 142
in an oven at 45°C (a constant mass was measured at 10 days). 143
Half of the mortar prisms (MD-257kGy-I1 to MD-257kGy-I3) were then introduced in 144
an irradiator at ARRONAX (137
Cs source, 661 keV, 123.4 TBq) at the age of 42 days. 145
Specimens were exposed as close to the source as possible to guarantee a spatially 146
homogenous dosage during 3 weeks. The total dose received by the specimens was 147
calculated to be around 257 kGy based on a map of the fluxes in the irradiator realized 148
7
by Fricke dosimetry measurement. The other half of the specimens (MD-257kGy-S1 to 149
MD-257kGy-S3), e.g. the control specimens, were kept in an air-conditioned room at 150
relative humidity of around 65% close to the ones measured in the irradiator at the end 151
of the irradiation period. 152
Table 1. Mortar compositions 153
Cement
(kg/m3)
Calcareous Sand 0/4
(kg/m3)
Water
(kg/m3)
W/C
Paste volume
(%)
566 1344 270 0.43 45
154
Several mechanical and chemo-physical tests were performed on these mortars and on 155
other series as well. The results will be presented in future communications but, in the 156
sake of clarity, some results may be evocated in regards to micromechanical results 157
presented herein. No evident carbonation, pore size evolution or hydrated phases 158
transformations were measured. Thus micromechanical properties evolutions may not 159
be attributed to calcite formation in contrast with [44]. 160
161
2.2 Indentation setup and theory 162
Microindentation tests were performed during the week following the irradiation period 163
with the main objective of comparing the properties of irradiated and control specimens. 164
Thus, a volume of 2 x 2 x 1.5 cm3 was sawn from the middle part of a half of the 165
4 x 4 x 16 cm3 broken by three-point bending test. This location was selected to avoid 166
damage due to the three-point bending test. The 2 x 2 cm2 section was polished with Si-167
C paper with decreasing particle size (500, 1200, 2000, 4000) using ethanol as polishing 168
liquid. Polishing times were selected around some minutes per paper to limit the risk of 169
aggregate cracking. These times are much shorter than the ones used for 170

8
nanoindentation on cement pastes [45] but were sufficient to obtain a surface roughness 171
Rq of around 0.5 - 1 µm which is acceptable for micro-indentation with penetration 172
depth of some microns. 173
A typical cement paste area with a typical indent is presented in Fig. 1. As it can be 174
observed, the scale of the indent is larger than the characteristic scale of the 175
microstructure of the cement paste (residual anhydrous clinker size): thus, the 176
performed microindentation tests provided the mechanical properties of the cement 177
paste or the sand, or the interface and not of the individual phases of the cement paste. 178
Microindentation was performed using a Vickers indenter probe over a grid of 179
20 x 20 points, evenly spaced by 500 µm to investigate a representative surface of 180
1 x 1 cm² of the mortar sample. For each indent, the load was increased linearly over 181
time in 5 s up to 2000 mN, kept constant during the 60 s holding phase, and decreased 182
linearly over time back to zero in 5 s. The very short loading time was selected to limit 183
creep during this period and do not apparently damaged the sample. 184

9
Fig. 1. SEM observation of a typical indent located in the cement paste with a width of 185
59 µm (small sand fines located near the indent are circled by orange dashed lines). 186
187
Various properties were calculated from the load – penetration curves. First, the 188
indentation hardness depending on the maximum load and the projected contact area: 189
(1)
For Vickers’ indenter the projected contact area can be estimated by: 190
(2)
Where hc can be calculated based on maximum indentation depth hmax assuming: 191
(3)
with and hr is the final ideal penetration height can be determined. Martens 192
hardness was also computed according to: 193
(4)
Where is the contact area, depending on the indentation depth h, defined for a 194
Vickers indenter by: 195
( ⁄ )
( ⁄ )
(5)
With =136° the top angle of the Vickers pyramid. 196
The Young’s modulus EIT of the indented material is given by: 197
(6)
Where M denotes the indentation modulus, Mind = 1140 GPa the modulus of the 198
indenter, the Poisson ratio of the material (considered equal to 0.2, a possible 199

10
variation of some percent of EIT may be induced for other values of Poisson ratio) and 200
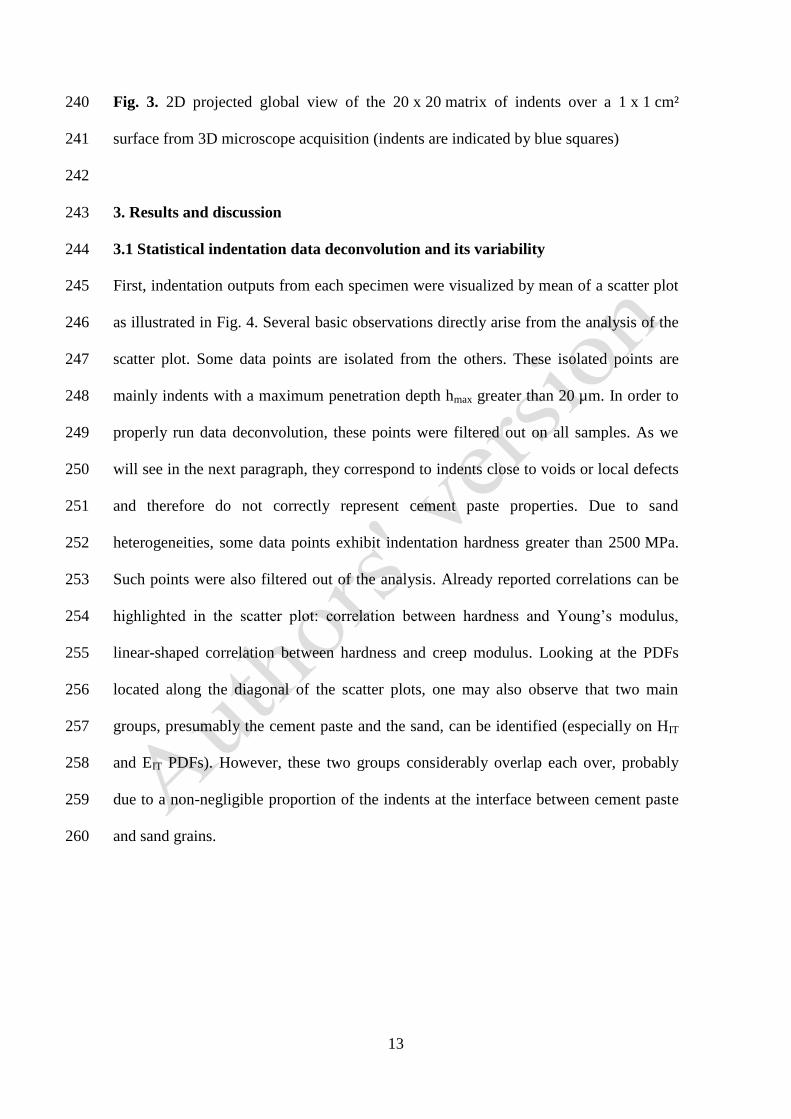
Er is the reduced modulus which is determined assuming: 201
(
√
)
(7)
A first creep parameter CIT, e.g. the normalized indentation creep parameter, was 202
calculated by the machine. It is defined as: 203
(8)
With h1 the indentation depth at the beginning of the creep stage. 204
Energetic parameters nIT and Wt were also recorded. nIT is the proportion of the elastic 205
response relatively to the total energy Wt: nIT = Welas / Wt. 206
More meaningful creep parameters C and can be extracted from the indentation curves 207
(see Fig 2a)) calculating the creep function [21]: 208
(9)
Where denotes the indentation depth increase during the constant load phase, au 209
denotes the is the radius of the equivalent projected contact area between the indenter 210
probe and the indented surface at the onset of unloading 211
Assuming a logarithmic fit of the creep function, the creep parameters are defined 212
according to [25]: 213
⁄
(10)
It was verified that this law can adequately reproduce the creep behavior of both cement 214
paste and sand as illustrated in Fig. 2 b). In order to avoid drying during creep 215
experiments, indentation was realized at a relative humidity close to the one imposed 216
during the irradiation period (around 65% RH). Moreover, autogenous shrinkage of the 217

11
sample can be neglected at the age of 72 d. Then, the creep function is expected to 218
characterize the basic creep behavior of the specimens. 219
220
a)
b)
Fig. 2. Microindentation outputs: a) raw load – penetration curve, b) fitting the creep 221
function by a logarithmic law (3 curves correspond to cement paste indents and 1 to a 222
sand indent) 223
224

12
2.3 3D microscope measurements and analysis 225
After indentation, a map of the indented zone was realized using a Hirox RH-2000 3D 226
microscope by merging around 200 3D reconstructed images evenly spaced along the 227
indented area. The selected magnification (x 140) led to a final horizontal resolution of 228
the 2D projected image of 1.5 µm / pix which is adequate to correctly locate the indents 229
and assess their nature. Because some indents may be hardly located, especially the 230
ones created in voids, a basic routine was implemented in Python to locate all the 231
indents based on the location of 3 of them by drawing blue squares on the original 232
image. As illustrated in Fig. 3, the 20 x 20 matrix of indents covers a sufficiently large 233
area representative of the mortar volume and the reconstructed image correctly 234
represent the matrix without image distortion due to multiple image merging (it was 235
verified that the indents were correctly located by the blue squares). The nature of the 236
indents was then manually identified because color-based filters were found to be 237
relatively imprecise in the case of such mortar images. 238
239
13
Fig. 3. 2D projected global view of the 20 x 20 matrix of indents over a 1 x 1 cm² 240
surface from 3D microscope acquisition (indents are indicated by blue squares) 241
242
3. Results and discussion 243
3.1 Statistical indentation data deconvolution and its variability 244
First, indentation outputs from each specimen were visualized by mean of a scatter plot 245
as illustrated in Fig. 4. Several basic observations directly arise from the analysis of the 246
scatter plot. Some data points are isolated from the others. These isolated points are 247
mainly indents with a maximum penetration depth hmax greater than 20 µm. In order to 248
properly run data deconvolution, these points were filtered out on all samples. As we 249
will see in the next paragraph, they correspond to indents close to voids or local defects 250
and therefore do not correctly represent cement paste properties. Due to sand 251
heterogeneities, some data points exhibit indentation hardness greater than 2500 MPa. 252
Such points were also filtered out of the analysis. Already reported correlations can be 253
highlighted in the scatter plot: correlation between hardness and Young’s modulus, 254
linear-shaped correlation between hardness and creep modulus. Looking at the PDFs 255
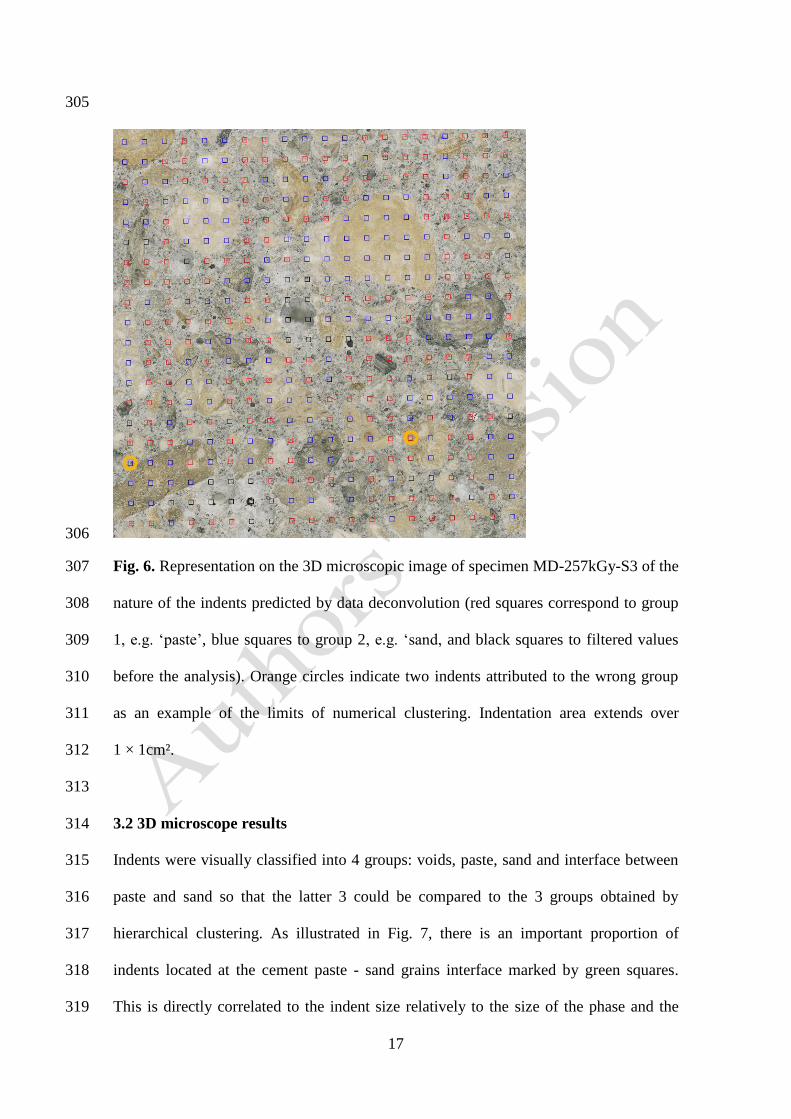
located along the diagonal of the scatter plots, one may also observe that two main 256
groups, presumably the cement paste and the sand, can be identified (especially on HIT 257
and EIT PDFs). However, these two groups considerably overlap each over, probably 258
due to a non-negligible proportion of the indents at the interface between cement paste 259
and sand grains. 260

14
261
Fig. 4. Unfiltered scatter plot from sample MD-257kGy-S3 (HM and HIT are expressed 262
in MPa, EIT and C in GPa, CIT and nIT in %, Wt in µJ, hmax in µm and in s). 263
Then, data points repartition was visualized using a Euclidian distance-based 264
dendrogram generated from the 9 output variables as illustrated in Fig 5 a). This way, 265
the similarities between the data points can be highlighted without subjectivity 266
(subjectivity may come from the arbitrary choice of the number of clusters prior to 267
deconvolution, the output variables used to generate the clusters, e.g. typically 2 [9] or 3 268
[14] only). The data points mainly belong to two dissimilar groups joining at a high 269
around 60 and with their subgroups differentiated at highs around 20. 270
Cutting the dendrogram at a high of 30 leads to a 2-groups hierarchical clustering 271
represented on a C-HIT 2D plane (Fig. 5 b)) with one group probably mainly composed 272
of cement paste and one group probably mainly composed of sand. Cutting the 273

15
dendrogram at a high of 20 leads to 3 groups (Fig. 5 c)). Naturally, because of 274
hierarchical clustering principles, only one of the two groups has been divided into two 275
subgroups, and for most of the mortar samples it is the group with the highest hardness 276
(presumably sand indents). Then, it means that, at the selected indentation load, sand 277
grains are more heterogeneous than the cement paste. It also leads to another 278
observation: 2-groups (and 3-groups) hierarchical clustering clearly overestimates 279
cement paste proportion, if one basically assumes that the group with the smallest mean 280
hardness corresponds to the cement paste. Indeed, reading the dendrogram, the 281
horizontal proportion of the first group corresponding to the lowest hardness is greater 282
than the one of the second group corresponding to the highest hardness. As the 283
horizontal axis is composed of all the single data points, it would mean that the number 284
of indents in the cement paste is greater than the number of indents in the sand. That is a 285
biased conclusion because the paste volume fraction is only of 45% (and at this 286
indentation load, an important number of indents are located at the interface between 287
cement paste and sand grains and they would lead to intermediate properties). This 288
erroneous prediction of the phase volume fractions has already been reported elsewhere 289
and the assignation of mean phases properties based on numerical data deconvolution is 290
questionable [15]. This basic observation motivates the use of optical techniques 291
described hereafter to filter experimental data based on indents nature. 292
Reporting the nature of the indents predicted by deconvolution over the microscopic 293
image as illustrated in Fig. 6, a relatively good correspondence is noticeable: red 294
squares corresponding to the first deconvoluted group are mainly located in the paste 295
and blue ones, corresponding to the second group are mainly located in sand grains, 296
while black squares, corresponding to initially filtered values are all near voids. 297
However, some indents (2 of them were circled in orange as examples) numerically 298

16
identified as cement paste are located on sand grains and vice versa which emphasizes 299
the limits of numerical clustering. 300
a)
b)
c)
Fig. 5. Hierarchical clustering strategy applied to specimen MD-257kGy-S3: a) 301
Euclidian distance-based dendrogram (with the 400 individual data points on the x-302
axis), b) and c), data points repartition along C-HIT plane using a 2-groups separation 303
(b) and a 3-groups separation (c). 304
17
305
306
Fig. 6. Representation on the 3D microscopic image of specimen MD-257kGy-S3 of the 307
nature of the indents predicted by data deconvolution (red squares correspond to group 308
1, e.g. ‘paste’, blue squares to group 2, e.g. ‘sand, and black squares to filtered values 309
before the analysis). Orange circles indicate two indents attributed to the wrong group 310
as an example of the limits of numerical clustering. Indentation area extends over 311
1 × 1cm². 312
313
3.2 3D microscope results 314
Indents were visually classified into 4 groups: voids, paste, sand and interface between 315
paste and sand so that the latter 3 could be compared to the 3 groups obtained by 316
hierarchical clustering. As illustrated in Fig. 7, there is an important proportion of 317
indents located at the cement paste - sand grains interface marked by green squares. 318
This is directly correlated to the indent size relatively to the size of the phase and the 319

18
volume fraction of sand. Comparing Fig. 6 with Fig. 7, one may notes that the other 320
indents are on majority of the same nature as the indents attributed to one group using 321
the hierarchical clustering method. 322
323
Fig. 7. Indents location and nature of specimen MD-257kGy-S3 (paste in red, cement 324
paste - sand grain interface in green, pure sand in blue, void in black) according the 3D 325
microscope image analysis. 326
327
From the repartition of the indented outputs variables per groups using 3D microscope 328
(Fig. 8), it can be observed that cement paste and sand indentation variables 329
distributions closely match normal distributions. On the other side, properties associated 330
with indents located at interfaces between cement paste and sand grains (green 331
histograms) are much more variables and do not follow any specific distribution. This is 332
due to the fact that indents on interfaces could either exhibit the mean value when two 333
phases properties are probed (for example there are a lot of indents on interfaces with 334
19
Young’s modulus between 25 and 35 GPa, because this property is representative of a 335
large volume), either be very similar to cement paste or sand properties because the 336
indenter probe slide to one side during loading (most of the time, to the cement paste 337
side because of its lower altitude). For this reason, a lot of indents on interfaces have an 338
indentation hardness around 500 MPa, e.g. around the mean value of indents attributed 339
to the cement paste as this property is representative of a smaller volume. 340
Identifying phases properties based on imaging is therefore possible for predominant 341
phases like cement paste or sand. Distributions are well defined but some indents 342
properties are possibly associated with the wrong group. For example, in Fig. 8, one can 343
see that some indents with high hardness and creep modulus (around 1 GPa and 344
400 GPa resp.) were identified as cement paste while some indents with Young’s 345
modulus lower than 15 GPa were identified as sand grains. More than half of these 346
values are associated with either an odd indent shape on sand or the presence of very 347
small sand grains close to an indent attributed to the cement paste (most of these indents 348
are probably rightly on cement paste but the indentation variables may be influence by 349
very close sand grains even under the indent). Thus, although the optical identification 350
of the indents should be attractive and sufficient in some cases, the combination of a 351
numerical deconvolution technique and of an imaging technique may help reduce the 352
uncertainties concerning some minor odd indents outputs. 353

20
354
Fig. 8. Histograms of distributions of the indentation output variables of specimen MD-355
257kGy-S3. Total distribution is represented by the continuous black line, distributions 356
of the phases identified using the 3D microscope are colored in red (cement paste), blue 357
(sand grains) and green (cement paste – sand grain interface). 358
359
3.3 Combination of 3D microscope and indentation results 360
3D microscope and indentation data deconvolution phase assignations were combined 361
to reduce the variability of the identified phase properties. Comparing the indent natures 362
from the two first order techniques (3D microscope 3 groups identification vs 3 groups 363
hierarchical clustering), the indents with corresponding natures were considered as 364
representative of a given phase while the others were considered as non-reliable 365
information regarding the final application of this study, e.g. cement paste 366
characterization. This coupling may address the two main preoccupations of the first 367

21
order analysis: concerning numerical clustering this method can effectively provide a 368
supplementary information about the nature of the indents and, concerning optical 369
clustering, the method can considerably decrease the risk of false identification (either 370
due to the operator or to the image precision) by selecting clusters of indents with close 371
micromechanical properties. 372
From a visual inspection of the spatial repartition of the nature of the indents in one of 373
the worst cases (Fig. 9), it should be observed that there is a huge proportion of 374
noncorresponding indent natures (yellow squares). Indeed, when comparing 3 groups 375
from 3D microscope identification and 3 groups from data deconvolution, around 35% 376
of indents nature do not correspond between the two analysis, while this proportion is 377
usually around 25% for the comparison between 3 groups from 3D microscope and 2 378
groups from data deconvolution. A majority of noncorresponding indents are located in 379
sand grains or at their periphery and this is the reason explaining why there is less error 380
using 2 groups data from deconvolution data: data points numerically identified as 381
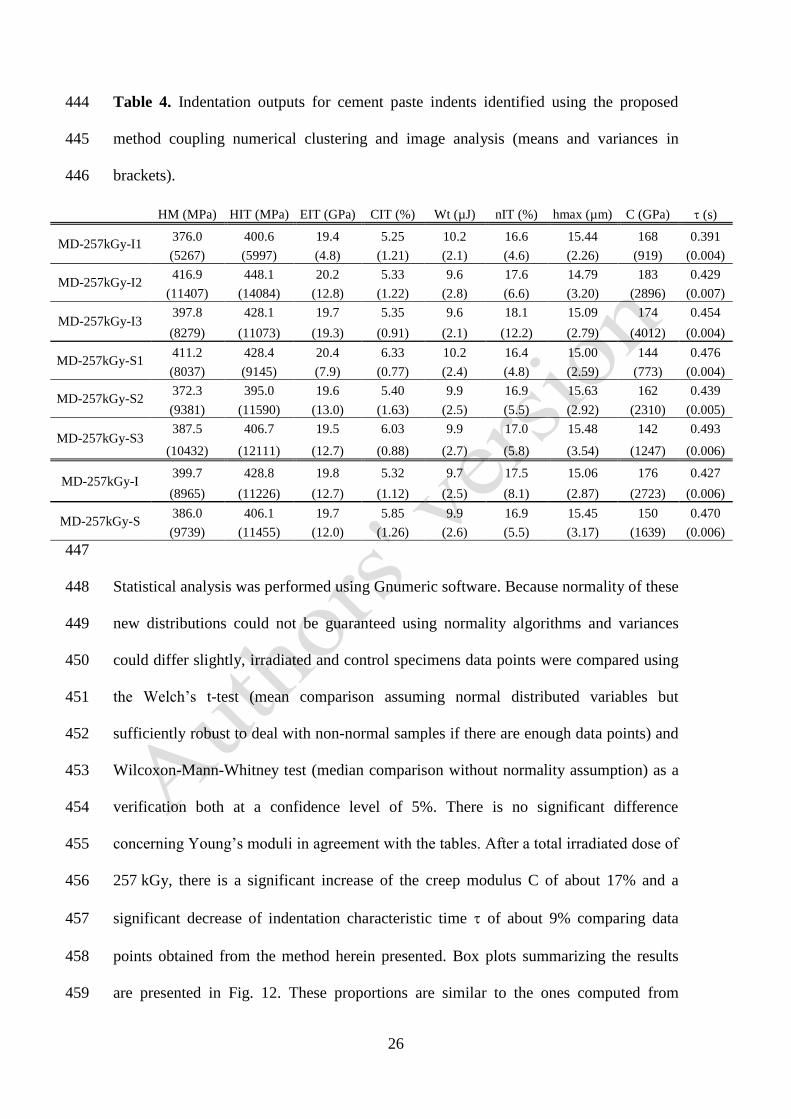
belonging to the intermediate group were mostly visually identified as sand grains and 382
not sand grain – cement paste interface. Only a very few indents were identified as 383
interfaces by combining the two methods which means that groups identified by 384
clustering algorithms with intermediate properties are not necessarily different phases 385
(here sand grain – cement paste interface). Moreover, the variability of sand grain 386
properties could also be visualized as for some sand grains almost all indents are 387
corresponding ones, while for others, probably with smaller hardness, indents are 388
mostly noncorresponding ones (identified as sand for one analysis, interface for the 389
other). 390

22
391
Fig. 9. Indents location and nature of specimen MD-257kGy-S3 comparing 3D 392
microscope image analysis and 3 groups hierarchical data deconvolution (paste in red, 393
cement paste - sand grain interface in green, pure sand in blue, void in black and indents 394
with noncorresponding natures between the two analyses in yellow). 395
396
A detailed analysis of the microindentation output variables through histograms (Fig. 397
10) reveals that noncorresponding indents are mainly the ones with intermediate 398
properties as predicted by the visual observation. Interestingly, the initial goal of this 399
comparison method seems to have been achieved: cement paste and sand distributions 400
are tightened and do not overlap for Young’s modulus, hardness and creep modulus. 401
Moreover, some of the extreme values are filtered out. Thus, the comparison of 402
numerical data deconvolution and optical data clustering efficiently reduces the 403
uncertainties concerning phase identification because of the complementarity between 404
the two methods. 405

23
406
407
Fig. 10. Histograms of distributions of the indentation output variables of specimen 408
MD-257kGy-S3 after the combined use of numerical and clustering and image analysis. 409
Total distribution is represented by the continuous black line, distributions of the phases 410
are colored in red (cement paste), blue (sand grains), green (sand grain – cement pastes 411
interface). The distribution of noncorresponding indents is represented in yellow. 412
413
3.4 Creep properties of -irradiated mortar specimens 414
Using the method described in the previous paragraphs, cement paste properties of 415
irradiated and control mortar specimens were compared. Tables 2 to 4 summarize the 416
indentation outputs associated with hierarchical clustering, 3D-microscope image 417
analysis and the method coupling numerical indentation data clustering and 3D-418
microscope image analysis. As explained, the main interest of the technique is to reduce 419

24
the variability of the indentation outputs attributed to one phase, here the cement paste. 420
This objective is achieved for most of the outputs as the variances of the outputs 421
variables distributions in Table 4 are smaller than the corresponding ones on Table 2 422
and 3 both on individual specimens and on the two series merging data from the 3 423
specimens per series. Moreover, mean values of hardness, Young’s modulus, creep 424
parameter are smaller on Table 4 because some data points with intermediate properties 425
were filtered out comparing numerical clustering and optical clustering. 426
One may finally observe that it is rather difficult to draw some conclusions on the 427
evolution of the output variables due to irradiations from these data as the standard error 428
(square-root of the variance) is close or greater than the difference between the two 429
series. Thus, indentation outputs were grouped together whether they belong to 430
irradiated specimens or not. The merged data is represented on Fig. 11. Analyzing non-431
diagonal graphics, one may observe that data points are rather well concentrated and 432
dispersion limited. On diagonal probability distributions (PDF), a clear shift of C due to 433
irradiations can be observed towards greater values while decreases. Indentation 434
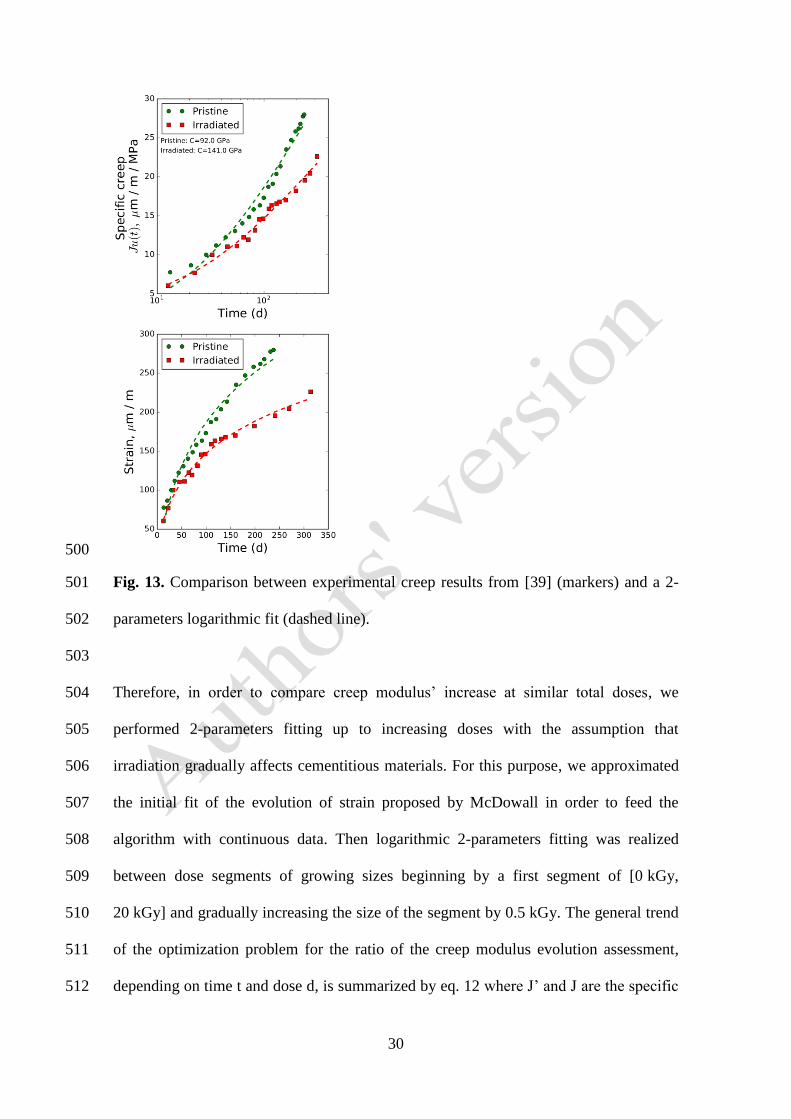
hardness also seems to be affected, though statistical analysis is necessary to conclude 435
concerning a possible influence of irradiations. 436
437

25
Table 2. Indentation outputs for cement paste indents identified using hierarchical 438
clustering (means and variances in brackets). 439
HM (MPa) HIT (MPa) EIT (GPa) CIT (%) Wt (µJ) nIT (%) hmax (µm) C (GPa) (s)
MD-257kGy-I1 377.4 402.7 19.5 5.16 10.2 16.7 15.40 173 0.384
(5424) (6192) (5.2) (1.22) (2.0) (4.2) (2.30) (1111) (0.005)
MD-257kGy-I2 432.0 466.6 21.0 5.20 9.3 18.1 14.54 197 0.416
(13035) (16610) (15.5) (1.51) (2.8) (8.1) (3.30) (3534) (0.007)
MD-257kGy-I3 438.8 478.8 21.3 5.04 9.2 19.0 14.46 210 0.447
(16321) (22917) (28.2) (1.02) (2.8) (14.9) (3.92) (8623) (0.005)
MD-257kGy-S1 396.9 415.4 20.2 6.00 10.1 16.7 15.26 149 0.465
(9088) (10205) (8.4) (1.29) (2.4) (6.2) (3.13) (1006) (0.005)
MD-257kGy-S2 369.3 395.2 19.9 4.99 9.7 17.5 15.58 182 0.426
(6869) (8737) (12.5) (1.89) (3.0) (10.5) (2.79) (4653) (0.006)
MD-257kGy-S3 416.1 441.0 20.8 5.77 9.7 17.3 15.01 165 0.481
(16467) (20063) (18.1) (1.43) (3.2) (7.4) (4.34) (3481) (0.007)
MD-257kGy-I 421.8 456.2 20.7 5.13 9.5 18.1 14.71 196 0.420
(13019) (17314) (18.2) (1.27) (2.7) (10.4) (3.43) (4998) (0.006)
MD-257kGy-S 396.2 420.2 20.4 5.55 9.8 17.2 15.25 168 0.459
(12102) (14600) (14.4) (1.73) (3.0) (8.3) (3.62) (3539) (0.007)
440
Table 3. Indentation outputs for cement paste indents identified using 3D-microscope 441
image analysis (means and variances in brackets). 442
HM (MPa) HIT (MPa) EIT (GPa) CIT (%) Wt (µJ) nIT (%) hmax (µm) C (GPa) (s)
MD-257kGy-I1 440.8 476.8 21.2 5.24 9.4 18.0 14.50 199 0.400
(19742) (27060) (12.9) (1.29) (2.9) (11.9) (3.92) (4667) (0.005)
MD-257kGy-I2 434.1 468.9 20.6 5.33 9.4 17.9 14.60 192 0.425
(17383) (23191) (16.4) (1.20) (3.0) (8.3) (3.82) (4943) (0.007)
MD-257kGy-I3 431.9 464.6 20.4 5.63 9.3 18.6 14.64 177 0.478
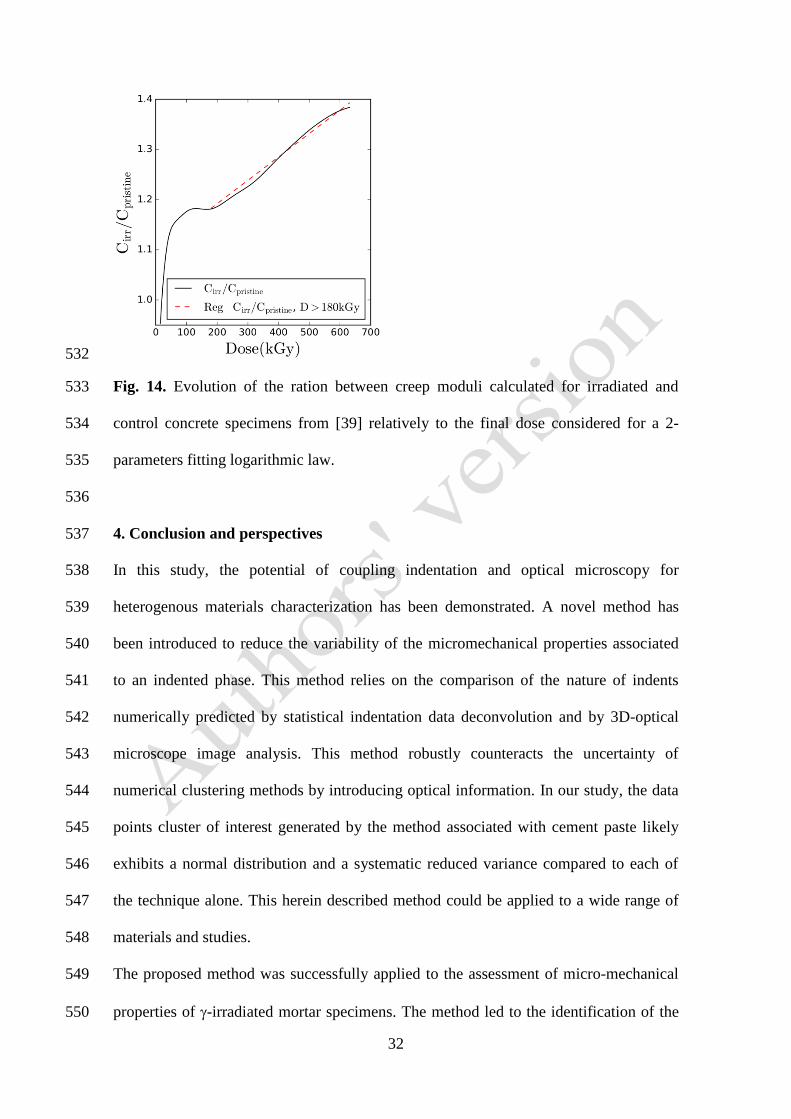
(15769) (21090) (20.5) (1.15) (2.2) (12.4) (3.50) (4922) (0.007)
MD-257kGy-S1 480.2 509.0 22.4 6.39 9.1 18.1 14.01 166 0.558
(22752) (32818) (15.9) (0.97) (2.3) (10.6) (3.09) (5071) (0.013)
MD-257kGy-S2 412.5 443.9 20.3 5.44 9.6 17.6 15.17 180 0.435
(28845) (42071) (18.6) (1.62) (2.8) (9.7) (4.73) (8569) (0.005)
MD-257kGy-S3 402.8 425.0 20.0 6.00 9.7 17.3 15.29 151 0.495
(16326) (20613) (18.6) (0.96) (3.2) (8.1) (4.33) (3661) (0.007)
MD-257kGy-I 435.7 470.2 20.8 5.40 9.4 18.2 14.58 190 0.434
(17592) (23734) (16.5) (1.24) (2.7) (10.9) (3.74) (4898) (0.007)
MD-257kGy-S 432.2 459.5 20.9 5.95 9.5 17.7 14.82 165 0.497
(23588) (32752) (18.8) (1.32) (2.8) (9.6) (4.36) (5814) (0.011)
443
26
Table 4. Indentation outputs for cement paste indents identified using the proposed 444
method coupling numerical clustering and image analysis (means and variances in 445
brackets). 446
HM (MPa) HIT (MPa) EIT (GPa) CIT (%) Wt (µJ) nIT (%) hmax (µm) C (GPa) (s)
MD-257kGy-I1 376.0 400.6 19.4 5.25 10.2 16.6 15.44 168 0.391
(5267) (5997) (4.8) (1.21) (2.1) (4.6) (2.26) (919) (0.004)
MD-257kGy-I2 416.9 448.1 20.2 5.33 9.6 17.6 14.79 183 0.429
(11407) (14084) (12.8) (1.22) (2.8) (6.6) (3.20) (2896) (0.007)
MD-257kGy-I3 397.8 428.1 19.7 5.35 9.6 18.1 15.09 174 0.454
(8279) (11073) (19.3) (0.91) (2.1) (12.2) (2.79) (4012) (0.004)
MD-257kGy-S1 411.2 428.4 20.4 6.33 10.2 16.4 15.00 144 0.476
(8037) (9145) (7.9) (0.77) (2.4) (4.8) (2.59) (773) (0.004)
MD-257kGy-S2 372.3 395.0 19.6 5.40 9.9 16.9 15.63 162 0.439
(9381) (11590) (13.0) (1.63) (2.5) (5.5) (2.92) (2310) (0.005)
MD-257kGy-S3 387.5 406.7 19.5 6.03 9.9 17.0 15.48 142 0.493
(10432) (12111) (12.7) (0.88) (2.7) (5.8) (3.54) (1247) (0.006)
MD-257kGy-I 399.7 428.8 19.8 5.32 9.7 17.5 15.06 176 0.427
(8965) (11226) (12.7) (1.12) (2.5) (8.1) (2.87) (2723) (0.006)
MD-257kGy-S 386.0 406.1 19.7 5.85 9.9 16.9 15.45 150 0.470
(9739) (11455) (12.0) (1.26) (2.6) (5.5) (3.17) (1639) (0.006)
447
Statistical analysis was performed using Gnumeric software. Because normality of these 448
new distributions could not be guaranteed using normality algorithms and variances 449
could differ slightly, irradiated and control specimens data points were compared using 450
the Welch’s t-test (mean comparison assuming normal distributed variables but 451
sufficiently robust to deal with non-normal samples if there are enough data points) and 452
Wilcoxon-Mann-Whitney test (median comparison without normality assumption) as a 453
verification both at a confidence level of 5%. There is no significant difference 454
concerning Young’s moduli in agreement with the tables. After a total irradiated dose of 455
257 kGy, there is a significant increase of the creep modulus C of about 17% and a 456
significant decrease of indentation characteristic time of about 9% comparing data 457
points obtained from the method herein presented. Box plots summarizing the results 458
are presented in Fig. 12. These proportions are similar to the ones computed from 459

27
hierarchical or 3D-microscope analysis outputs but may not be statistically different in 460
the latter cases, especially when data points are identified using 3D-microscope only. 461
Creep modulus increase is correlated with a slight indentation hardness increase of 462
about 6% which is significant for data points obtained using the coupled method. 463
Consequently, hmax slightly decreases while nIT slightly increases with irradiations. The 464
indentation energy Wt remains unchanged proving that only slight changes are 465
occurring. 466
467
468
Fig. 11. Scatter plot of indentation data points attributed to the cement paste by 469
coupling data deconvolution and image analysis for irradiated and control specimens 470
(HIT is expressed in MPa, EIT and C in GPa, nIT in %, Wt in µJ and in s). 471
472

28
473
a)
b)
c)
d)
Fig. 12. Box plots of indentation data points attributed to the cement paste by coupling 474
data deconvolution and image analysis for irradiated and pristine specimens: a) HIT, b) 475
EIT, c) C and d) , Center horizontal line of the box represents the median value while 476
thick diamond stands for the mean value. 477
478

29
From our knowledge, these creep results are the first microindentation results 479
concerning irradiated concrete specimens. Therefore, it could be interesting to make a 480
comparison with the only macroscopic creep results under -irradiation reported a long 481
time ago [39] and illustrated as markers in Fig. 13. The experimental macroscopic 482
specific creep function was first fitted using a classic 3-parameters logarithmic law: 483
⁄
(11)
This first fit led to an increase of the creep modulus of 74% (132 GPa for irradiated 484
sample and 76 GPa for control sample) and a decrease of of around 49 % (47 d 485
vs 24d). Tough the raw increases are dramatic and somehow affected by the lack of 486
experimental values compared to the number of parameters, this trend qualitatively 487
agrees with the microindentation results. In order to obtain more realistic creep modulus 488
variations, it has been decided to fit the experimental data using a two parameters law 489
written as: 490
⁄
(11)
Using a characteristic time cste of 25 d (same order of magnitude as the characteristic 491
time using a 3-parameters fit. but still a relatively small value regarding the dose 492
(around 70 kGy) at this time), this type of law correctly describe the creep behavior for 493
times greater than . As illustrated in Fig. 13, the fit is acceptable for times greater than 494
approximately 40 d. When applied on the regression curves proposed by McDowall, 495
this fit leads to a more reasonable creep modulus increase of 53% after a total dose 496
820kGy in approximately 300 d (141 GPa for the irradiated specimen and 92 GPa for 497
the control specimen). This increase is around three times greater than the increase 498
measured by indentation after a total dose of 257 kGy. 499
30
500
Fig. 13. Comparison between experimental creep results from [39] (markers) and a 2-501
parameters logarithmic fit (dashed line). 502
503
Therefore, in order to compare creep modulus’ increase at similar total doses, we 504
performed 2-parameters fitting up to increasing doses with the assumption that 505
irradiation gradually affects cementitious materials. For this purpose, we approximated 506
the initial fit of the evolution of strain proposed by McDowall in order to feed the 507
algorithm with continuous data. Then logarithmic 2-parameters fitting was realized 508
between dose segments of growing sizes beginning by a first segment of [0 kGy, 509
20 kGy] and gradually increasing the size of the segment by 0.5 kGy. The general trend 510
of the optimization problem for the ratio of the creep modulus evolution assessment, 511
depending on time t and dose d, is summarized by eq. 12 where J’ and J are the specific 512

31
creep function of the irradiated and control specimens. The resulting evolution of the 513
ratio between the creep moduli of irradiated concrete specimen and control specimen 514
over the total dose is illustrated in Fig. 14. 515
516
∫
∫
(12)
517
Because the effect of radiations is supposedly small at low doses, creep moduli ratio is 518
close to 1 for small segments and. because the effect of radiation increases with time the 519
ratio gradually increases. It is difficult to say whether the quick increase of the ratio 520
before 50-60 kGy is representative of the concrete behavior or if the fit reliability is 521
affected by the logarithmic function selected (irradiation times are close to the creep 522
characteristic time at low dosage). However, one may observe the ratio exhibits a quasi-523
linear increase after 180 kGy (doses at which time ≥ 3×creep characteristic time). A 524
linear regression with a correlation coefficient of 0.994 is proposed after 180 kGy. From 525
this regression, it can be stated that the increase rate is of 5×10⁻²
% / kGy, which leads, 526
considering and initial creep modulus of around 100 GPa, to a rate of 50 GPa/MGy. For 527
a dose of 257 kGy, the increase of the creep modulus from this method is around 20% 528
which is in good agreement with the increase calculated from the microindentation 529
experiment. 530
531
32
532
Fig. 14. Evolution of the ration between creep moduli calculated for irradiated and 533
control concrete specimens from [39] relatively to the final dose considered for a 2-534
parameters fitting logarithmic law. 535
536
4. Conclusion and perspectives 537
In this study, the potential of coupling indentation and optical microscopy for 538
heterogenous materials characterization has been demonstrated. A novel method has 539
been introduced to reduce the variability of the micromechanical properties associated 540
to an indented phase. This method relies on the comparison of the nature of indents 541
numerically predicted by statistical indentation data deconvolution and by 3D-optical 542
microscope image analysis. This method robustly counteracts the uncertainty of 543
numerical clustering methods by introducing optical information. In our study, the data 544
points cluster of interest generated by the method associated with cement paste likely 545
exhibits a normal distribution and a systematic reduced variance compared to each of 546
the technique alone. This herein described method could be applied to a wide range of 547
materials and studies. 548
The proposed method was successfully applied to the assessment of micro-mechanical 549
properties of -irradiated mortar specimens. The method led to the identification of the 550

33
cement paste elasto-plastic parameters affected by irradiation at relatively low 551
cumulated dose of 257 kGy. It has been found out that creep modulus C significantly 552
increases by around 17% and indentation characteristic time significantly decreases by 553
around 9% after irradiation. The creep modulus increase is correlated with a slight 554
increase of the indentation hardness HIT and of the proportion of the elastic response 555
relatively to the total energy nIT. On the other hand, Young’s modulus of irradiated 556
specimens does not significantly differ from the one of control specimens. 557
These micro-mechanical observations agree with the only macroscopic uniaxial 558
compressive creep measurements under -irradiation published to our knowledge [39]. 559
Using a logarithmic dose-dependant fit of the specific creep function proposed in this 560
study, it can be calculated that the creep modulus increases and the creep characteristic 561
time decreases leading to less creep of the irradiated samples. Then a reverse analysis 562
was proposed to quantify the evolution of the irradiated vs pristine creep moduli ratio 563
with the time increasing -dose. Although supplementary similar experiments should be 564
carried out at both microscale and macroscale with various dose rates, the creep 565
modulus appears to linearly increase with the -dose for doses between 180 and 566
700 kGy. 567
568
Acknowledgments 569
The authors gratefully acknowledge the financial support provided for this study by 570
Tractebel Engineering. Special thanks are due to Xavier Bourbon (ANDRA) for 571
instructive discussions. This work has been supported in part by a grant from the French 572
National Agency for Research called “Investissements d’'Avenir”. Equipex ArronaxPlus 573
n°ANR-11-EQPX-0004. 574
575

34
References 576
[1] P. Trtik and P. J. M. Bartos. Micromechanical properties of cementitious 577
composites. Materials and Structures, 32(5):388–393, 1999. 578
[2] P. Acker. Micromechanical analysis of creep and shrinkage mechanisms. In 579
Creep, shrinkage and durability mechanics of concrete and other quasi-brittle 580
materials. (Proceedings of ConCreep6), 2001. 581
[3] K. Velez, S. Maximilien, D. Damidot, G. Fantozzi, and F. Sorrentino. 582
Determination by nanoindentation of elastic modulus and hardness of pure constituents 583
of portland cement clinker. Cement and Concrete Research, 31(4):555 – 561, 2001. 584
[4] G. Constantinides, F.-J. Ulm, and K. Van Vliet. On the use of nanoindentation 585
for cementitious materials. Materials and Structures, 36(3):191–196, 2003. 586
[5] G. Constantinides and F.-J. Ulm. The effect of two types of c-s-h on the 587
elasticity of cement-based materials: Results from nanoindentation and 588
micromechanical modeling. Cement and Concrete Research, 34:67–80, 2004. 589
[6] J. J. Chen, L. Sorelli, M. Vandamme, F.-J. Ulm, and G. Chanvillard. A coupled 590
nanoindentation/sem-eds study on low water/cement ratio portland cement paste: 591
Evidence for c-s-h/ca(oh)2 nanocomposites. Journal of the American Ceramic Society, 592
93(5):1484–1493, 2010. 593
[7] M. Vandamme and F.-J. Ulm. Nanoindentation investigation of creep properties 594
of calcium silicate hydrates. Cement and Concrete Research, 52:38 – 52, 2013. 595
[8] W.C. Oliver and G.M. Pharr. An improved technique for determining hardness 596
and elastic modulus using load and displacement sensing indentation experiments. 597
Journal of Materials Research, 7:1564–1583, 1992. 598

35
[9] F.-J. Ulm, M. Vandamme, C. Bobko, J.A. Ortega, K. Tai, and C Ortiz. Statistical 599
indentation techniques for hydrated nanocomposites: Concrete, bone, and shale. Journal 600
of the American Ceramic Society, 90:2677–2692, 2007. 601
[10] L. Sorelli, G. Constantinides, F.-J. Ulm, and F. Toutlemonde. The nano-602
mechanical signature of ultra high performance concrete by statistical nanoindentation 603
techniques. Cement and Concrete Research, 38(12):1447 – 1456, 2008. 604
[11] C. Hu, Y. Gao, Y. Zhang, and Z. Li. Statistical nanoindentation technique in 605
application to hardened cement pastes: Influences of material microstructure and 606
analysis method. Construction and Building Materials, 113:306 – 316, 2016. 607
[12] P. Trtik, B. Münch, and P. Lura. A critical examination of statistical 608
nanoindentation on model materials and hardened cement pastes based on virtual 609
experiments. Cement and Concrete Composites, 31(10):705 – 714, 2009. 610
[13] F.-J. Ulm, M. Vandamme, H. M. Jennings, J. Vanzo, M. Bentivegna, K. J. 611
Krakowiak, G. Constantinides, C. P. Bobko, and K. J. Van Vliet. Does microstructure 612
matter for statistical nanoindentation techniques? Cement and Concrete Composites, 613
32(1):92 – 99, 2010. 614
[14] D. Davydov, M. Jirásek, and L. Kopecký. Critical aspects of nano-indentation 615
technique in application to hardened cement paste. Cement and Concrete Research, 616
41(1):20 – 29, 2011. 617
[15] P. Lura, P. Trtik, and B. Münch. Validity of recent approaches for statistical 618
nanoindentation of cement pastes. Cement and Concrete Composites, 33(4):457 – 465, 619
2011. 620
[16] P. Mondal, S. P. Shah, and L. Marks. A reliable technique to determine the local 621
mechanical properties at the nanoscale for cementitious materials. Cement and Concrete 622
Research, 37(10):1440 – 1444, 2007. 623

36
[17] J. J. Hughes and P. Trtik. Micro-mechanical properties of cement paste 624
measured by depth-sensing nanoindentation: a preliminary correlation of physical 625
properties with phase type. Materials Characterization, 53:223 – 231, 2004. EMABM 626
2003: 9th Euroseminar on Microscopy Applied to Building Materials. 627
[18] C. Hu and Z. Li. Micromechanical investigation of portland cement paste. 628
Construction and Building Materials, 71:44 – 52, 2014. 629
[19] W. Zhu, J. J. Hughes, N. Bicanic, and Chris J. Pearce. Nanoindentation mapping 630
of mechanical properties of cement paste and natural rocks. Materials Characterization, 631
58:1189 – 1198, 2007. 10th Euroseminar on Microscopy Applied to Building Materials 632
(EMABM). 633
[20] S. Zhao and W. Sun. Nano-mechanical behavior of a green ultra-high 634
performance concrete. Construction and Building Materials, 63:150 – 160, 2014. 635
[21] M. Vandamme, F.-J. Ulm, and P. Fonollosa. Nanogranular packing of C-S-H at 636
substochiometric conditions. Cement and Concrete Research, 40(1):14 – 26, 2010. 637
[22] A. B. Nichols and D. A. Lange. 3d surface image analysis for fracture modeling 638
of cement-based materials. Cement and Concrete Research, 36(6):1098 – 1107, 2006. 639
[23] T. Ficker, D. Martisek, and H. M. Jennings. Roughness of fracture surfaces and 640
compressive strength of hydrated cement pastes. Çement and Concrete Research, 641
40(6):947 – 955, 2010. 642
[24] B. Hilloulin, J.-B. Legland, E. Lys, O. Abraham, A. Loukili, F. Grondin, O. 643
Durand, and V. Tournat. Monitoring of autogenous crack healing in cementitious 644
materials by the nonlinear modulation of ultrasonic coda waves, 3d microscopy and x-645
ray microtomography. Construction and Building Materials, 123:143 – 152, 2016. 646

37
[25] Q. Zhang, R. Le Roy, M. Vandamme, and B. Zuber. Long-term creep properties 647
of cementitious materials: Comparing microindentation testing with macroscopic 648
uniaxial compressive testing. Cement and Concrete Research, 58:89 – 98, 2014. 649
[26] M. Irfan-ul-Hassan, B. Pichler, R. Reihsner, and Ch. Hellmich. Elastic and creep 650
properties of young cement paste, as determined from hourly repeated minute-long 651
quasi-static tests. Cement and Concrete Research, 82:36 – 49, 2016. 652
[27] D.-T. Nguyen, R. Alizadeh, J. J. Beaudoin, P. Pourbeik, and L. Raki. 653
Microindentation creep of monophasic calcium-silicate-hydrates. Cement and Concrete 654
Composites, 48:118 – 126, 2014. 655
[28] J. Frech-Baronet, L. Sorelli, and J.-P. Charron. New evidences on the effect of 656
the internal relative humidity on the creep and relaxation behaviour of a cement paste by 657
micro-indentation techniques. Cement and Concrete Research, 91:39 – 51, 2017. 658
[29] K.G. Field, I. Remec, and Y. Le Pape. Radiation effects in concrete for nuclear 659
power plants - part i: Quantification of radiation exposure and radiation effects. Nuclear 660
Engineering and Design, 282:126 – 143, 2015. 661
[30] Y. Le Pape, K.G. Field, and I. Remec. Radiation effects in concrete for nuclear 662
power plants, part ii: Perspective from micromechanical modeling. Nuclear Engineering 663
and Design, 282:144 – 157, 2015. 664
[31] A. Giorla, M. Vaitová, Y. Le Pape, and P. Štemberk. Meso-scale modeling of 665
irradiated concrete in test reactor. Nuclear Engineering and Design, 295:59 – 73, 2015. 666
[32] H. K. Hilsdorf, J. Kropp, and H. J. Koch. The effects of nuclear radiation on the 667
mechanical properties of concrete. Technical report, ACI SP-55, 1978. 668
[33] ANDRA. Dossier 2005 argile, architecture and management of a geological 669
repository. Technical report, ANDRA, 2005. 670

38
[34] P. Soo and L. M. Milian. The effect of gamma radiation on the strength of 671
portland cement mortars. Journal of Materials Science Letters, 20(14):1345–1348, 672
2001. 673
[35] F. Vodák, K. Trtík, V. Sopko, O. Kapicková, and P. Demo. Effect of γ - 674
irradiation on strength of concrete for nuclear-safety structures. Cement and Concrete 675
Research, 35(7):1447 – 1451, 2005. 676
[36] O. Kontani, Y. Ichikawa, A. Ishizawa, M. Takizawa, and O. Sato. Irradiation 677
effects on concrete structures. In International Symposium on the Ageing Management 678
& Maintenance of Nuclear Power Plants, 2010. 679
[37] O. Kontani, S. Sawada, I. Maruyama, M. Takizawa, and O. Sato. Evaluation of 680
irradiation effects on concrete structure - gamma - ray irradiation test on cement paste. 681
In Proceedings of the ASME 2013 Power Conference (POWER2013), July 29-August 1, 682
2013, Boston, Massachusetts, USA, 2013. 683
[38] A. Lowinska-Kluge and P. Piszora. Effect of gamma irradiation on cement 684
composites observed with XRD and SEM methods in the range of radiation dose 0 - 685
1409 MGy. Acta Physica Polonica, A, 114:399 – 411, 2008. 686
[39] D. McDowall. The effects of gamma radiation on the creep properties of 687
concrete. In Proceedings of the Information Exchange Meeting on ’Results of Concrete 688
Irradiation Programs’, EUR 4751 f-e, Commission des Communautés Européennes, 689
Brussels, Belgium, 1971. 690
[40] R.L. Grossman, C. Kamath, P. Kegelmeyer, V. Kumar, and R. Namburu. Data 691
Mining for Scientific and Engineering Applications. Springer US, 2001. 692
[41] Krishna Rajan. Materials informatics. Materials Today, 8(10):38 – 45, 2005. 693
[42] J.H. Koo. Polymer Nanocomposites: Processing, Characterization, and 694
Applications. McGraw-Hill, New York, 2006. 695
39
[43] S. K. Barai. Data mining applications in transportation engineering. Transport, 696
18(5):216–223, 2003. 697
[44] F. Vodák, V. Vydra, K. Trtík, and O. Kapiccková. Effect of gamma irradiation 698
on properties of hardened cement paste. Materials and Structures, 44:101 – 107, 2011. 699
[45] M. Miller, C. Bobko, M. Vandamme, and F.-J. Ulm. Surface roughness criteria 700
for cement paste nanoindentation. Cement and Concrete Research, 38(4):467 – 476, 701
2008. 702
703
704