cours biophotonique 2 2012 - École polytechnique
TRANSCRIPT
Antigoni [email protected], 01.69.33.50.04
CHAPTER 2: Fluorescence microscopy
« Biophotonics » course
Fluorophores Organic fluorophores Inorganic nanoparticles Labeling strategies Fluorophores as probes of signaling molecules
Microscopy techniques Wide‐field microscopy Confocal microscopy
• Principle• Scanning and speed issues
Alternatives to confocal microscopy• Selective Plane Illumination Microscopy (SPIM) • Structured illumination microscopy• Total internal reflection microscopy (TIRFM)Fluorescence techniques
Single‐molecule optical microscopy• Principle and instrumentation• Localization precision• Applications to biomolecule conformational changes• Applications to biomolecule diffusion • 3D tracking

CHAPTER 2: Fluorescence microscopyFluorophores

The ideal biological label
Water soluble
Specific coupling to biomolecules
Photostable
Small
No modification of the dynamics under study
Multiplexing
Sensitivity to other parameters
How do I visualize biomolecules ?

Fluorescence
Inter-atomic distance
Energy
absorptionEmission (~ns)
vibrational relaxation (~ps)
Invitrogen website
Cy3

Organic fluorescent labels
Amersham website
Fluorescein
Cyanine 3 Cyanine 5
Electrons delocalized across parallel aligned p‐orbitals of atoms involved in alternating single and multiple bonds (conjugated system).The larger the delocalization region, the longer the transition wavelength.
Cy3 Cy5

Organic labelsAlexa Fluor Dyes
Invitrogen website (Molecular Probes)Optimizebrightnessphotostabilitycolor selectionpH insensitivitywater solubility

Fluorescent proteinsGreen fluorescent protein(GFP)
2008 Nobel Prize in Chemistry shared by OsamuShimomura, Martin Chalfie, and Roger Y. Tsien
The green fluorescent protein was first observed in the jellyfishAequorea victoria in 1962.Osamu Shimomura first isolated GFP from Aequorea victoria.Martin Chalfie demonstrated its use as a fluorescent genetic labelRoger Y. Tsien introduced mutations to optimize the fluorescence properties and obtain emission at different wavelengths.
Nobel prize website
• GFP consists of an eleven‐stranded ‐barrel with an ‐helix running along the axis of the cylinder. • Three amino acids in the ‐helix close to the center of the cylinder (Ser65‐Tyr66‐Gly67) form the chromophore.
R. Y. Tsien 1998
Fluorescence excitationEmission

Labeling by generating fusion proteins
Advantages: coupling specificity1:1 stochoimetry
Target protein Fluorescent protein
Other mutations produced color mutants: blue (BFP), cyan (CFP), yellow (YFP) fluorescent proteins, ….
Fluorescent proteins
Roger Y. Tsien website
Agar Plate of Fluorescent Bacteria Colonies
R. Y. Tsien lab, Univ. California San DiegoB. Giepmans et al. Science 312, 217 (2006).
Mutations improved the spectral characteristics of GFP to give eGFP :=55,000 M−1cm−1, quantum yield=0.60

Labeling by generating fusion proteinsTarget protein Fluorescent protein
Fluorescent proteinsThe GFP‐rabbit
Louis‐Marie Houdebine and Patrick Prunet, Jouy‐en ‐Josas, France, 2000

Different emission colors can be obtained for the same excitation wavelength.
Quantum dots
Energy
x
SC2SC1The confinement energy depends on the size L of the quantum dot.
SC2 SC2SC1
x . p ~
Ec ~ p2/2m ~ 2/2mL2x ~ L
L
SC2
Ec
Ec
CdSe
ZnS
excitationemission
CdSe ZnSZnS
Synthesis in organic solvents.
Excitation with a 365 nm UV source
H. Mattoussi group, Naval Research LabI. Medintz et al., Nat. Mat. 4, 435 (2005)
Valence band
Conduction band
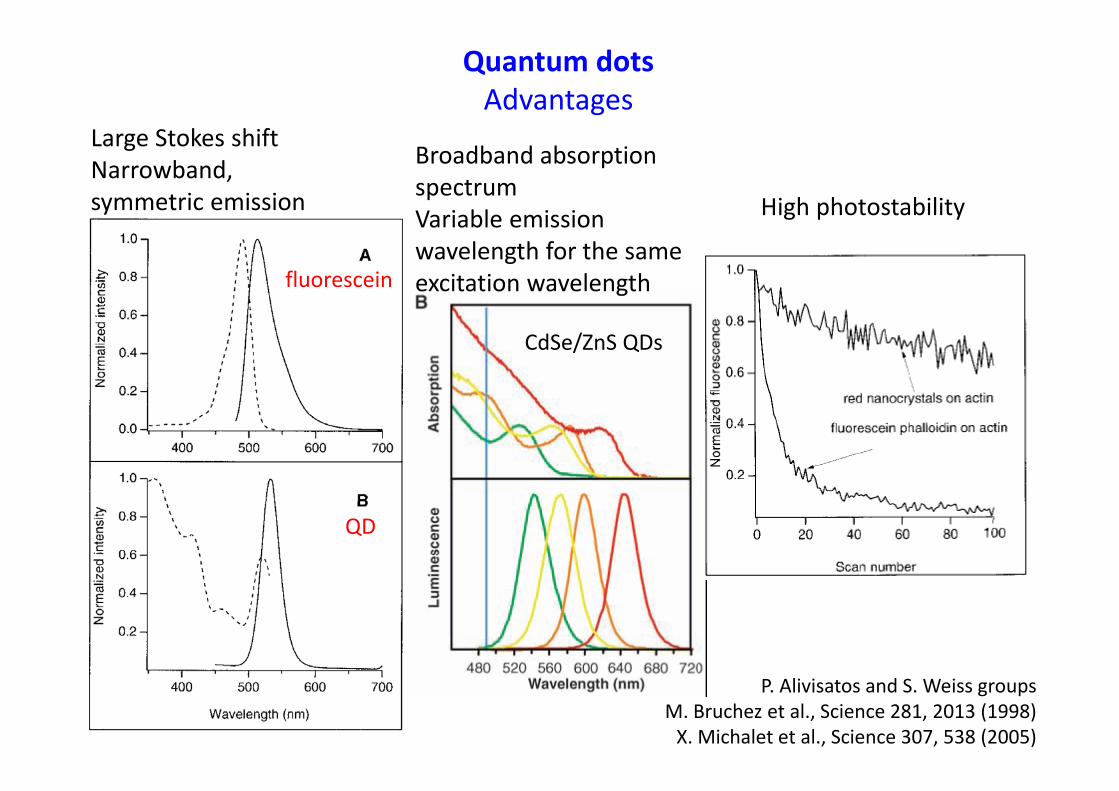
Quantum dotsAdvantages
Large Stokes shiftNarrowband, symmetric emission
fluorescein
QD
Broadband absorption spectrumVariable emissionwavelength for the sameexcitation wavelength
P. Alivisatos and S. Weiss groupsM. Bruchez et al., Science 281, 2013 (1998)X. Michalet et al., Science 307, 538 (2005)
High photostability
CdSe/ZnS QDs

Quantum dotsEmission extending to the near IR
S. Weiss group, UCLA, X. Michalet et al., Science 307, 538 (2005)

Quantum dots: Solubilization in water and functionalization
S. Weiss group, UCLA, X. Michalet et al., Science 307, 538 (2005)

Emission
(Excitation at 280 nm)
Excitation spectrum(detection at 617 nm)
0
2000
4000
6000
8000
250 300 350 400 450 500 550 600
x 150
7F0,1
-5D2In
tens
ity (a
rb. u
.)
Wavelength (nm)
0
1000
2000
3000
4000
5000
550 600 650 700 750
5D0-7F2
Wavelength (nm)
Inte
nsity
(arb
. u.)
Rare‐earth doped nanoparticles
Also: Persistant fluorescence nanoparticles
10-4
0 nm
YVO4:Eu
SiO2
excitation
Advantages: Synthesized in water Good photostability No blinking (9000 Eu ions in a 20 nm 20%‐doped nanoparticle) Narrow emission bandwidth (<10 nm)=> possibility of multi‐color experiments Long excited‐state lifetime (~0.7 ms)=> possibility of time‐gated detection‐> attractive labels for long‐term single‐molecule tracking experiments
fluorescence
LOB&PMC, Ecole PolytechniqueE. Beaurepaire et al, Nano Lett. 4, 2079 (2004)

Time‐gated detection of rare‐earth doped nanoparticlesSynchronized mechanical choppers
Without time-gating With time-gating
excitationchopper
detection chopper
Period T = 1.5 ms
Ton = 0.8 ms
Tdet = 0.55 ms T”curtain”= 0.15 ms
5 µm
Cellfluorescence:
15000-50000 ph/s
Nanoparticleemission lifetime:0.7 msCell fluorescence lifetime: ~ns
Excellent discrimination against cell fluorescence
200 ph/s
LOB&PMC, Ecole PolytechniqueE. Beaurepaire et al, Nano Lett. 4, 2079 (2004)
For QDs (lifetime ~ 10 ns), electronic gating is necessaryM. Dahan et al., Opt. Lett. 26, 825 (2001)

U. Wiesner group, Cornell UniversityH. Ow et al., Nano Lett. 5, 113 (2005).
Fluorescent silica nanoparticles incorporating dye moleculesSize: 20‐30 nm20 times brighter andMore photostablethan individual dyes(the silica shellprovides shieldingfrom interactions withthe solvent thussuppressing non radiative de‐excitation pathways)
First step: covalent attachment of dyesto a silica precursorto form a core
Second step: growth of a silica shell

Metal nanoparticles: devising new detection techniquesPhotothermal heterodyne imaging (down to 1.4 nm)
CPMOH, Bordeaux UniversityS. Berciaud et al, Phys. Rev. Lett. 93, 257402 (2004)
L. Cognet talk at the Nanosciences School Ile de France 2008
• Metal nanoparticles absorb at their plasmon resonance.• Almost no luminescence.The absorbed energy istransformed into heat.‐> Variation of the local index of refraction.Detection scheme:• Modulate the heating beam(green) at frequency .• Time‐modulation of the index of refraction in the vicinity of the nanoparticle.• A probe beam (red) at frequency gives rise to a scattered field containing sidebands at ±.• The interference between the reflected (or transmitted) probe field and the scattered fieldoscillates at the frequency ‐> lock‐in detection
532 nm500 kW/cm2
3D representationof a photothermalheterodyne image of 1.4 nm gold clusters (67 atoms) 5x5 µm2
Requires scanning(10 ms/pixel, 80nm/pix.)
Detection through scatteredlight (down to 10‐20 nm), ~R6
F
FF
F
F
CdSe
ZnS
F
F
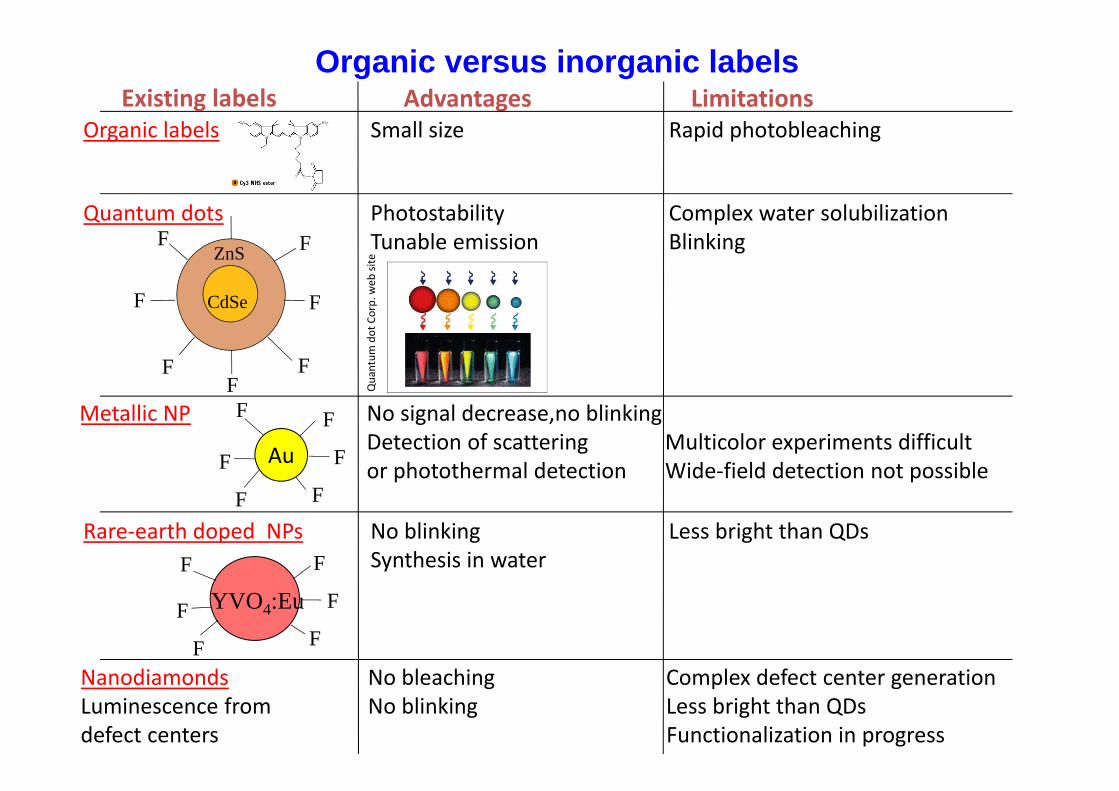
Organic labels Small size Rapid photobleaching
Quantum
dot Corp. web
site
Metallic NP No signal decrease,no blinkingDetection of scattering Multicolor experiments difficultor photothermal detection Wide‐field detection not possibleF
F
AuFF
F
F
Advantages LimitationsExisting labels
Nanodiamonds No bleaching Complex defect center generationLuminescence from No blinking Less bright than QDsdefect centers Functionalization in progress
Rare‐earth doped NPs No blinking Less bright than QDsSynthesis in water
YVO4:Eu F
F
FF
F
F
Quantum dots Photostability Complex water solubilizationTunable emission Blinking
Organic versus inorganic labels

FluorophoresLabeling strategies

Coupling fluorescent labels to proteins
Coupling to amine groups
Coupling to thiol groups
Five amino acidscontain amine groups.NHS‐esters reactmainly with Lysine
Only one amino acidcontains a thiol groupCysteine
NHS: N‐hydroxysuccinimide (activatingreagent for carboxylic acids) Water‐soluble analog: sulfo‐NHS Terminal –NH2 group can also react.
R contains a fluorophore

Coupling fluorescent labels to proteins
Example :FITC: fluorescein isothiocyanate
RNH2
R’ contains a fluorophoreRNH2 is the molecule to be labeled
Coupling to amine groups
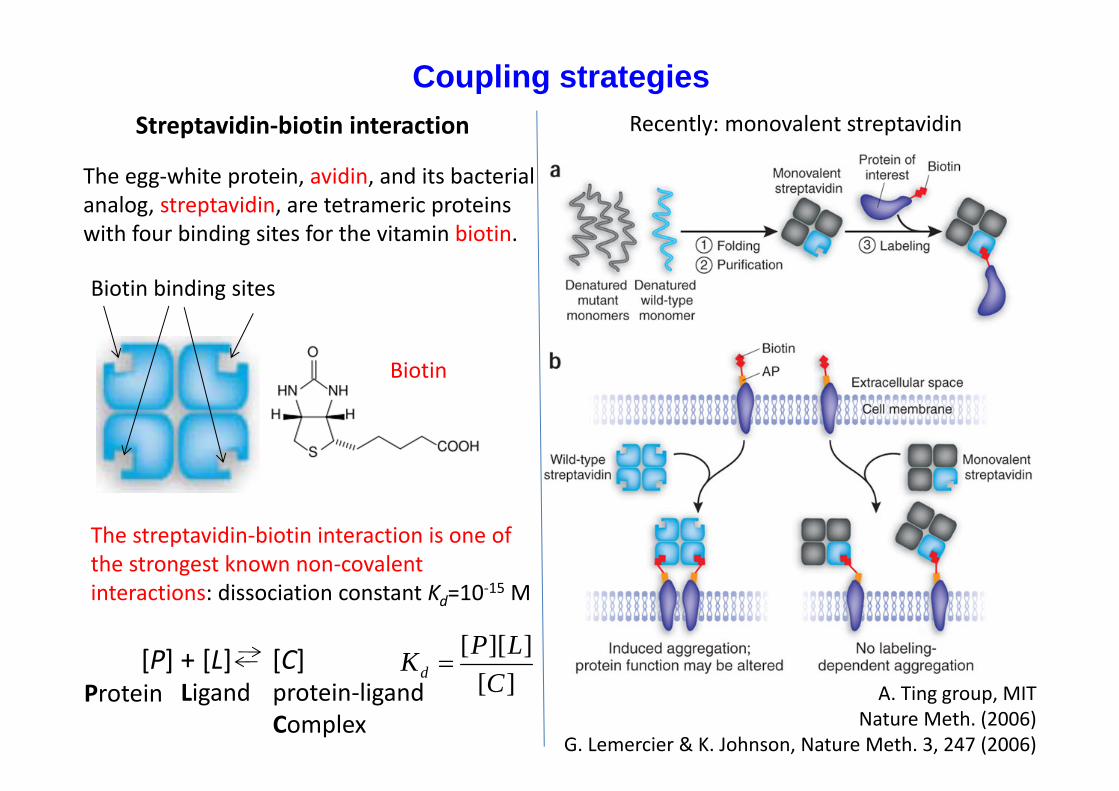
Coupling strategiesStreptavidin‐biotin interaction Recently: monovalent streptavidin
Biotin
A. Ting group, MITNature Meth. (2006)
G. Lemercier & K. Johnson, Nature Meth. 3, 247 (2006)
The egg‐white protein, avidin, and its bacterialanalog, streptavidin, are tetrameric proteinswith four binding sites for the vitamin biotin.
Biotin binding sites
The streptavidin‐biotin interaction is one of the strongest known non‐covalent interactions: dissociation constant Kd=10‐15 M
[P] + [L] [C] Protein Ligand protein‐ligand
Complex][
]][[C
LPKd

Coupling strategiesAntigen‐antibody interaction
M. Dahan, A. Triller groups, ENS ParisH. Bannai et al., Nature Protocols 1, 2628 (2007)
Important: verify that the biomoleculeremains functional after coupling.
Heavy chains
Light chains
AntibodyFab: fragment antigen‐binding

Fab: Fragment antigen‐binding
Antibody structure
Fc region: Fragment crystallizable region

Size comparison
B. Giepmans et al. Science 312, 217 (2006).

Labeling oligonucleotides and nucleic acids
Alexa 488
A‐B: Spacer to reduce stericinterferencedeoxycytidine triphosphate (dCTP)
Invitrogen website
‐ Use labeled nucleotides‐ Use amine‐modified nucleotides for subsequent labeling with NHS‐dyes
‐ Hoechst labels and DAPI bind to the minor groove of DNA
DAPI
Example:

FluorophoresFluorophores as probes of signaling molecules

Fluorophores as probes for signaling moleculesCa2+ indicators
A. Minta, J. P. Y. Kao, R. Y. Tsien, J. Biol. Chem. 264, 8171 (1993)
Large variety of Ca2+ indicators available.Dissociation constants to be chosen dependingon the Ca2+ concentration levels that must bemeasured.
Tetracarboxylate chelator
Xanthene chromophore
Exampleof a chelator
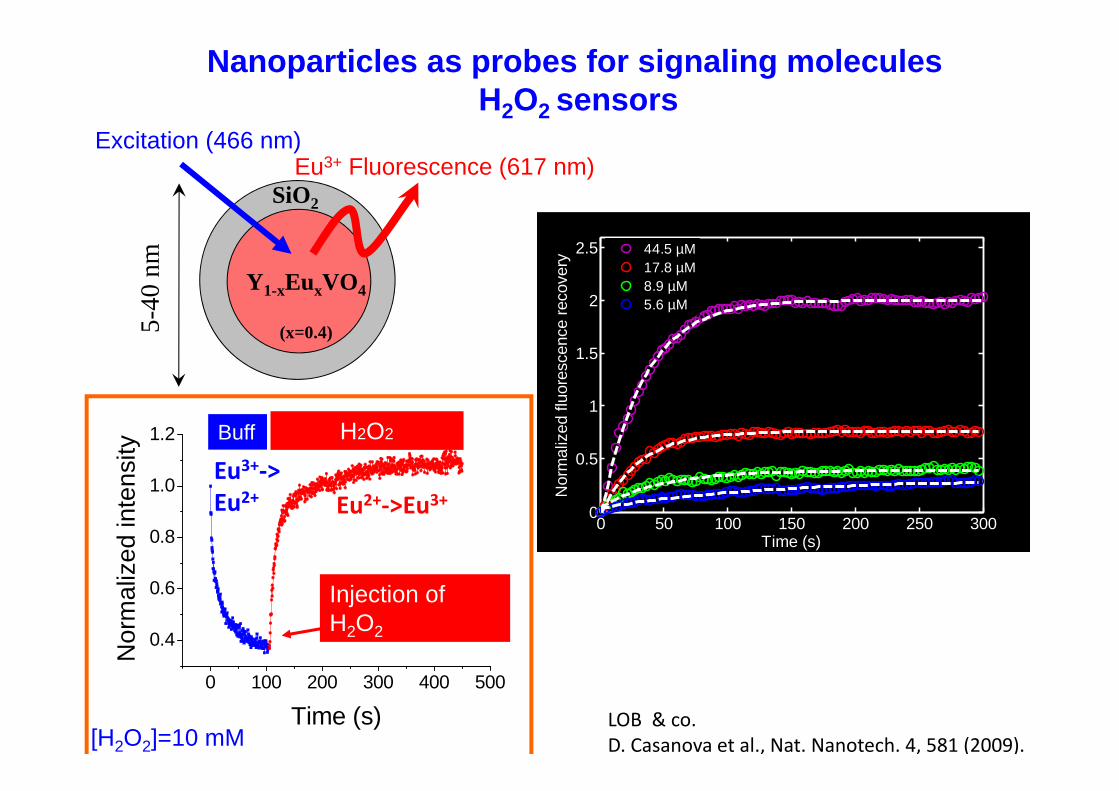
Nanoparticles as probes for signaling moleculesH2O2 sensors
5-40
nm
Y1-xEuxVO4
(x=0.4)
SiO2
Excitation (466 nm)Eu3+ Fluorescence (617 nm)
0 100 200 300 400 500
0.4
0.6
0.8
1.0
1.2
Nor
mal
ized
inte
nsity
Time (s)
Buff H2O2
[H2O2]=10 mM
Injection of H2O2
Eu3+‐>Eu2+ Eu2+‐>Eu3+
0 50 100 150 200 250 3000
0.5
1
1.5
2
2.5
Time (s)N
orm
aliz
ed fl
uore
scen
ce re
cove
ry
44.5 µM17.8 µM8.9 µM5.6 µM
LOB & co.D. Casanova et al., Nat. Nanotech. 4, 581 (2009).

Microscopy techniquesWide-field microscopy

Wide‐field inverted microscope
Zeiss Axio Observer
Laser or lamp in
Objective
Dichroic
Sample
Tube lens
Lamp
Condenser

White‐light transmission image of vascular smooth muscle cells
T.‐L. Nguyên, LOB
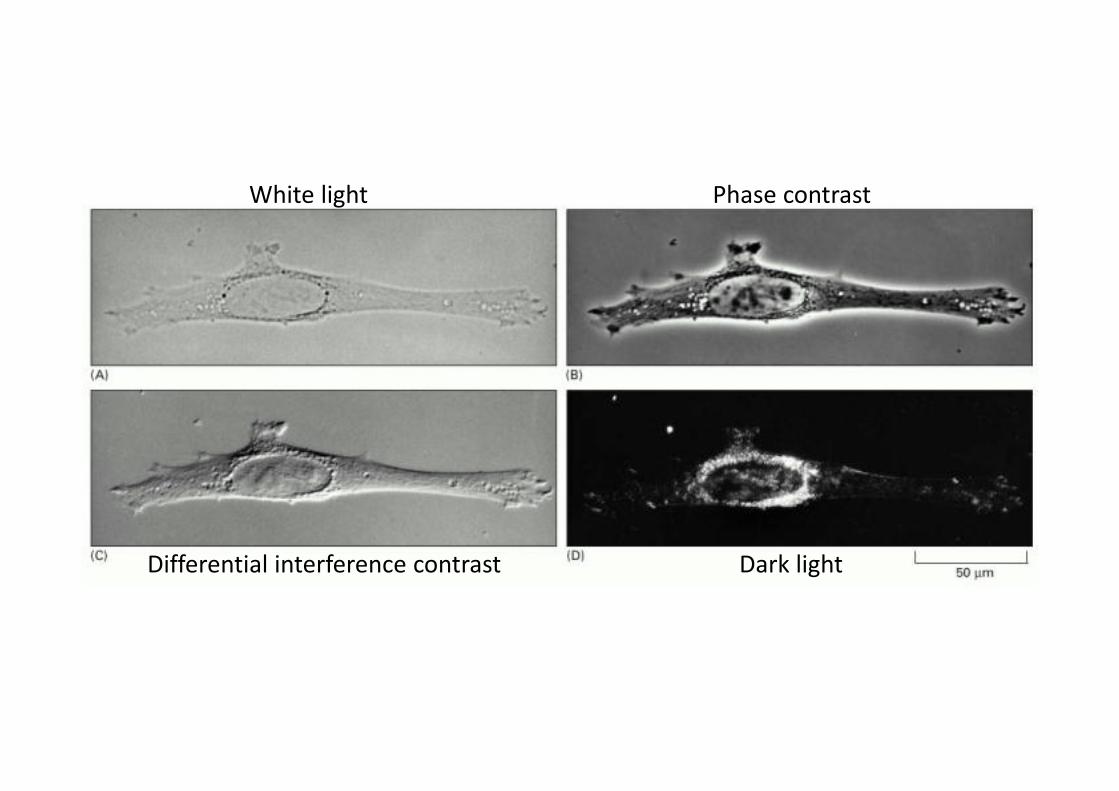
White light Phase contrast
Differential interference contrast Dark light

Dichroic mirrorReflects excitation laser Transmitts sample fluorescence
CC
D
Objective
Coverslip
Tube lens
mirror
Sample
Emission filter
Excitation laser
Wide‐field inverted fluorescence microscope
Image plane

The point spread function of a wide‐field microscope
M. Müller, Introduction to Confocal Fluorescence Microscopy, 2nd ed., SPIE Press, 2006A. Diaspro et al., Biomed. Eng. online, 2006, 5:36 (http://www.biomedical‐engineering‐online.com/content/5/1/36)
The imaging properties of an optical system are characterized by the spreading of the image of a point source.An optical system (in our case a microscope) images a point source into a 3D light distribution called the point spread function.In the case of aberration‐free imaging (in the framework of a number of approximations), the 2D light distribution in the focal plane is an Airy disk.
x
y
r
zLight intensity distributions in logarithmic scale
Calculated for:Emission at 520 nmN.A.=1.3 (oil‐immersion objective)

Lateral and axial resolution
For 2 point sources, the Rayleigh criterion gives:
Lateral resolution:
Axial resolution:
sin.. nAN
2.).(22.1
ANnz
..222.1
ANR
Point source Image
http://micro.magnet.fsu.edu/primer/
The Rayleigh criterion states that 2 point sources of equal intensity separated by a distance d can be resolved down to distances such that the maximum of the Airy diskdue to one of the sources coincides with the minimum of the other.
In reality, this depends on the signal to noise ratio.
Ernst Abbe, Schultze Arch. Mikrosc. Anat. 9, 413–468 (1873).

The point spread function of a wide‐field microscopeThe problem of multiple sources
),,(),,(),,( zyxPSFzyxOzyxI
For multiple point sources making up an object O(x,y,z):
PROBLEM: a wide‐field microscope can not determine the in‐focus position of a thin, homogeneously fluorescent planei.e. the same image is obtained for all z positions of the plane
Or to put it differently: for samples thicker than the plane of focus, at the detector plane, there is signal coming from out‐of‐focus areas
Solution: confocal microscopy (Marvin Minsky 1955)
objectimage
T.‐L. Nguyên, LOB

r
z
r
z
r
z
r
z
Wide‐field microscope
Multiple point sources in the focal plane Multiple point sources at different planes

Microscopy techniquesConfocal microscopy

Confocal microscopy:principle
Principle: Use point illumination + eliminate light from outside the focal place using a pinhole in an optically conjugate plane.‐> Optical sectioning. Alternatives: Non‐linear excitation (see course on non‐linear microscopy)Drawback: scanning is necessary ‐> galvanometric mirrors

J.‐A. Conchello & J. W. Lichtman, Nature Methods 2, 920 ‐ 931 (2005)
Confocal microscopy: principle

Point spread function: wide field versus confocal microscope
x
y
r
z
Wide‐field Confocal
Efficient rejection of out‐of‐focus light
A. Diaspro et al., Biomed. Eng. online, 2006, 5:36 (http://www.biomedical‐engineering‐online.com/content/5/1/36)
Light intensitydistributions in logarithmic scale
Calculated for:Emission at 520 nmN.A.=1.3 (oil‐imm. objective)

Beware: in the case of a refractive index change at the coverslip, the point spreadfunction broadens and depends on the distance of the point source from the coverslip.
Y
X
Z
X
Point spread function in the case of refractive index mismatch
x
z0.05

Confocal microscopy: scanning
Galvamoneter mirror scanningMoving the sample Moving the beam
Scanning is necessary to obtain a 2D image. Z scanning: piezoelectric scanning of the objective
E. Beaurepaire course
X‐Y scanning
Advantage:The beam alwaysgoes through the lenscenter
Disadvantage:SlowerMay lead to celldeformation
For optimal (diffraction‐limited) performance, the objective rear focal aperture should be completely filled with the excitation beam during scanning. ‐> Scan design that pivots the beam at a stationary point conjugate with the objective rear aperture.

Confocal versus wide‐field microscopyGastrula‐stage Drosophila embryo
Labeling of actin filaments
Molecular Biology of the Cell, 4rth edition, B. Alberts et al.
ConfocalWide‐field

Optical sectioning ‐> Capability to obtain 3D images.
Confocal microscopy for reconstruction of 3D images
Green: GFP‐MAP4 fusion proteinMAP4 binds to the microtubules

Confocal microscopy: scanning speedIncrease scanning speed: galvanometric mirrors 100kHz, i.e. 10 µs/spot, for an image of 300x300 spots2
‐>typically 1 frame/sresonant galvanometric mirrors ‐> video frame rates (25 frames/s) BUT < 1 µs/spot
Averaging images becomes necessary because of the low signal levelAlternatives for increasing scanning speed: multi‐beam scanning (detection with CCD instead of PMT)
Spinning Nipkow disk
http://www.olympusfluoview.com/theory/confocalscanningsystems.html
Disadvantages: • light loss at the disk• pinholes of fixed size that cannotbe matched to the objective beingused• scattering in the sample may leadto overlap between the signals fromdifferent spots
Conclusion: Faster scanning isonly useful when high signal levels and/or high excitation powers are available.
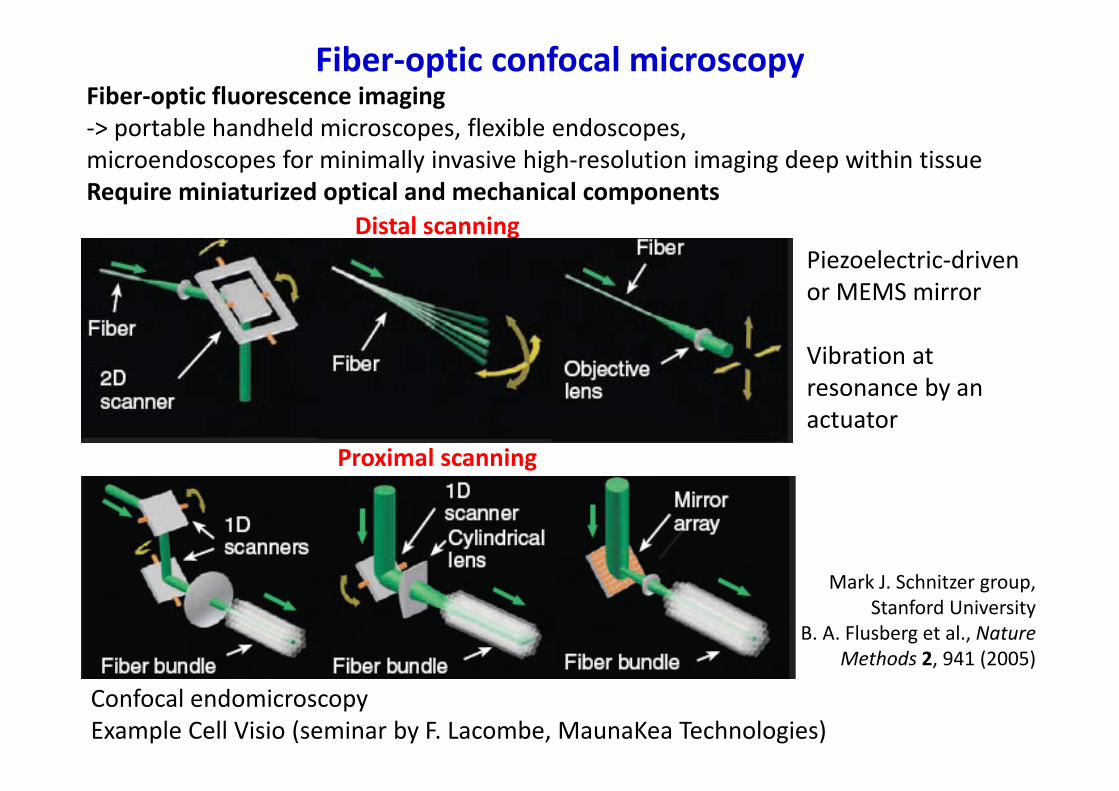
Proximal scanning
Fiber‐optic confocal microscopyFiber‐optic fluorescence imaging‐> portable handheld microscopes, flexible endoscopes,microendoscopes for minimally invasive high‐resolution imaging deep within tissueRequire miniaturized optical and mechanical components
Mark J. Schnitzer group, Stanford University
B. A. Flusberg et al., Nature Methods 2, 941 (2005)
Confocal endomicroscopyExample Cell Visio (seminar by F. Lacombe, MaunaKea Technologies)
Piezoelectric‐drivenor MEMS mirror
Vibration at resonance by an actuator
Distal scanning

Microscopy techniquesAlternatives to confocal microscopy
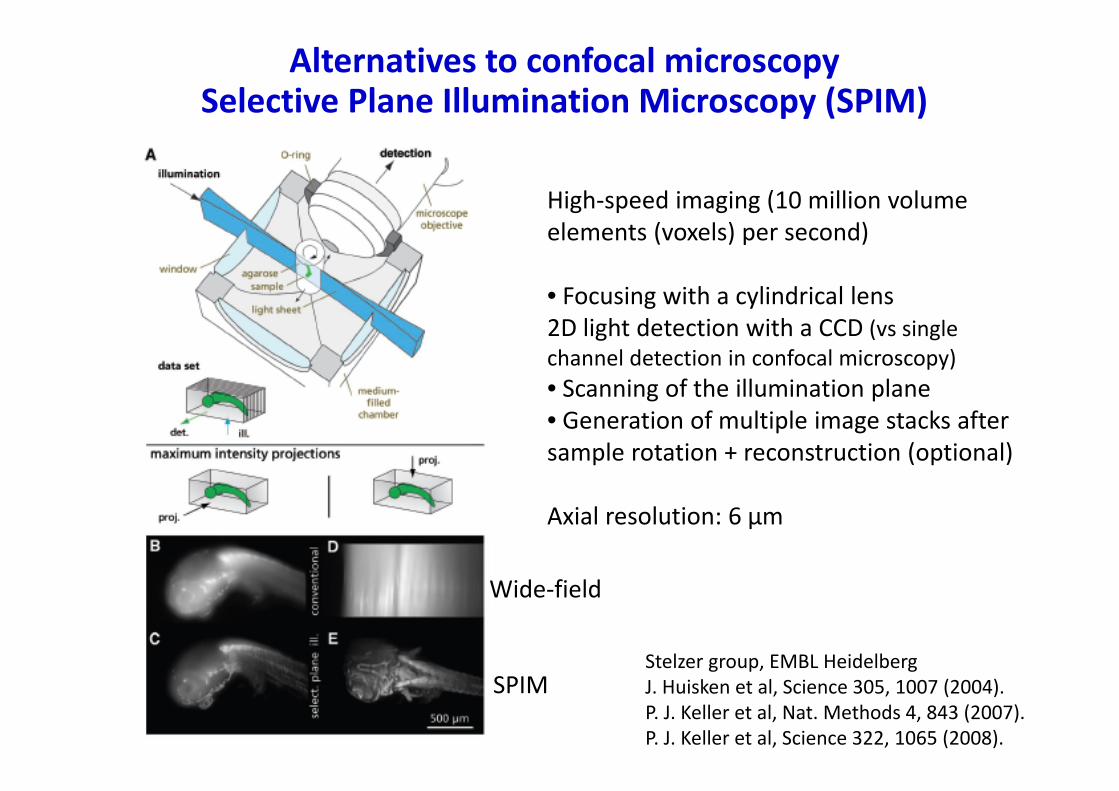
Alternatives to confocal microscopySelective Plane Illumination Microscopy (SPIM)
High‐speed imaging (10 million volume elements (voxels) per second)
• Focusing with a cylindrical lens2D light detection with a CCD (vs single channel detection in confocal microscopy) • Scanning of the illumination plane• Generation of multiple image stacks aftersample rotation + reconstruction (optional)
Axial resolution: 6 µm
Stelzer group, EMBL HeidelbergJ. Huisken et al, Science 305, 1007 (2004).P. J. Keller et al, Nat. Methods 4, 843 (2007).P. J. Keller et al, Science 322, 1065 (2008).
Wide‐field
SPIM
Alternatives to confocal microscopyStructured illumination
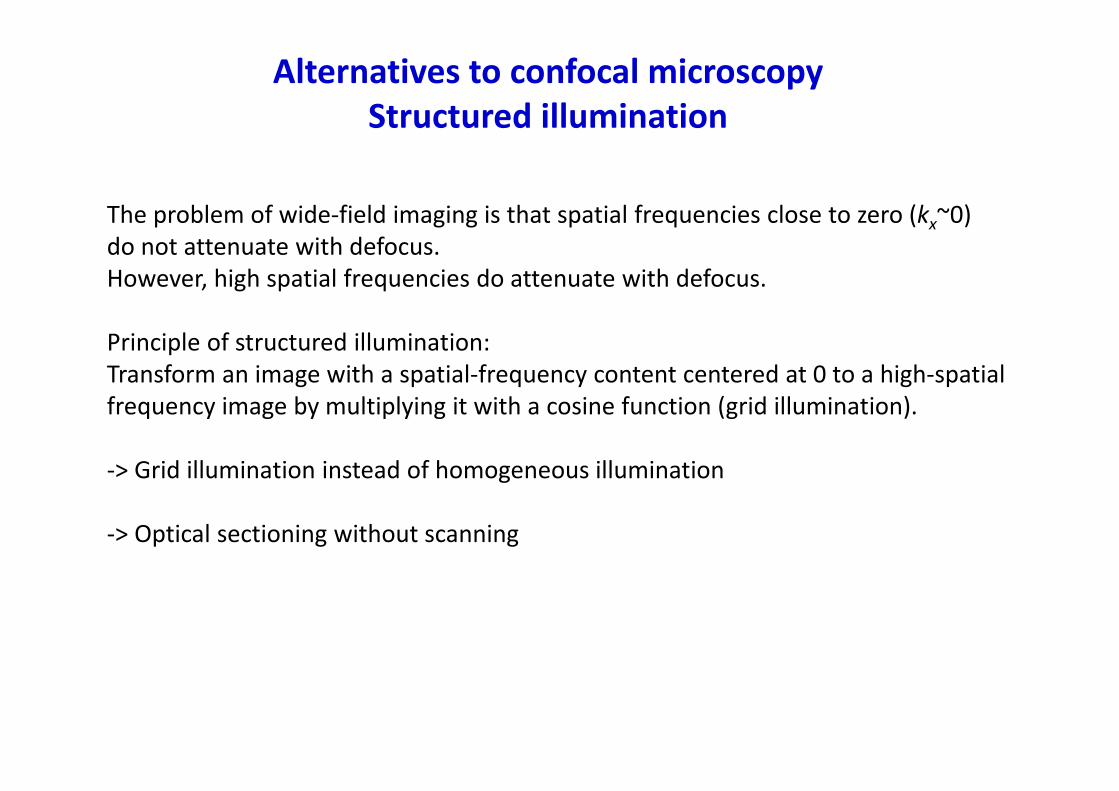
The problem of wide‐field imaging is that spatial frequencies close to zero (kx~0)do not attenuate with defocus.However, high spatial frequencies do attenuate with defocus.
Principle of structured illumination:Transform an image with a spatial‐frequency content centered at 0 to a high‐spatial frequency image by multiplying it with a cosine function (grid illumination).
‐> Grid illumination instead of homogeneous illumination
‐> Optical sectioning without scanning

Wide‐field image (microscope focused in a mid‐depth plane)
T. Wilson group, OxfordM. A. A. Neil et al, Optics Letters, 22, 1905 (1997).
Lily pollen grain: 100 µm x 70 µm
Structured illumination
Autofocus imageAcquire a stack of optically sectionned 2D images over 30 µmThen plot the maximum image intensity at each pixel.
3D reconstruction also possible.
Illuminate the sample through a 1D grid (40 lines/mm)

Objective
Prism‐based TIRFM
Total Internal Reflection Fluorescence Microscopy (TIRFM)
Excitation beam
SampleCoverslip
Oil
Emittedlight
Evanescent wave region
Critical angle for total internal reflection
• Rays propagating at angles greaterthan the critical angle give rise to an exponentially decaying evanescent field(penetration depth ~100 nm). • Excite light only from fluorophores in the immediate vicinity of the interface.• To obtain such rays: a> c
a
« Optical sectioning » only for the layer at the interface
Allows significant reduction of background.Ideal for observation of effects like exocytosis occurring at the membrane in the presence of signal from other intracellular planes.Commonly used in single‐molecule experiments.

Total Internal Reflection Fluorescence Microscopy (TIRFM)
Provides optical sectioning only for the plane at the interface between glass and water.
A. L. Stout & D. Axelrod, Appl. Opt. 28, 5237 (1989)
n2n1
n1=1.33 n2=1.5 ‐> c=61.4°
anAN sin.. 2
For N.A.=1.4, a=67.5°
Objective‐based TIRFMCritical angle for total internal reflection
Recently: objectives with N. A.=1.45

Exocytosis of single secretory vesicles in live cells using TIRFMElectron microscopy image
Before After stimulation with a high [K+]
‐> Loss of vesicles due to exocytosis
Disappearance of a vesicle due to exocytosis
Arrival of a new vesicle at the plasma membrane
J. A. Steyer et al., Nature 388, 474 (1997)

Variable‐angle prism‐based TIRFM
The decay length depends on the incidence angle:
Total Internal Reflection Fluorescence Microscopy (TIRFM)
D. Loerke et al., J. Biomed. Opt. 5, 23 (2000)
‐> Obtain information on the z‐position of fluorophores
Image vesicles in neuroendocrine cells(~25000 vesicles/cell)
Labeling with acridine orange, a membrane‐permeant dyethat becomes trapped in acidic compartments
Angle variation using acousto‐optic deflection
Penetration depth: 124 nm 84 nm

Fluorescence techniquesSingle-molecule optical microscopy

Single‐molecule observations: what for?
Avoid averaging Determine the distribution function of different parameters Distinguish different populations Follow dynamic processes
Applications in biology: Study protein structural modifications At the cell membrane: observe diffusion, aggregation Observe processes like internalization and biomolecule interaction

Single molecule detection
Optical (lateral) resolution(limited by diffraction): sin.. nAN
Typically : 200‐300 nm
W. E. Moerner and D. P. Fromm,Rev. Sci. Instrum. 74, 3597 (2003).
For single fluorescent objects• the Airy disk can be fitted witha 2D Gaussian• the center of the diffraction‐limited spot can be determinedfrom the Gaussian fit with a precision depending on the signal/noise ratio‐> localization precisiondown to 1 nm!
..222.1
ANR

Signal: The number of photons N arriving per acquisition time follows a Poisson distribution around the average value <N>. The noise related to these fluctuations iscalled Poisson noise or shot noise ‐> standard deviation:
Background signal (cell fluorescence, coverslip fluorescence, signal from out‐of‐focal‐plane objects, …) If the background signal is Nb, the related shot noise will have a standard deviation of
Other sources of noise: CCD readout noise , CCD thermal noise
Single molecule detection: signal‐to‐noise considerations
Typically, a signal will be detectable if: 1/ NoiseSignal
N
bNCCDreadoutn CCD
thermaln
22/
CCDthermal
CCDreadoutb nnNN
NNoiseSignal
The different sources of noise are considered independent.

Optimize signal‐to‐noise ratio Increase signal (N photons per acquisition time)
Optimize collection and detection efficiencyHigh aperture objectives 1.3‐1.4High quality filtersHigh quantum efficiency detection (back‐illuminated CCD)Minimize the number of optical elements
Choice of label (high extinction coefficient, high quantum yield, high photostability)‐> number of photons/second‐> total number of photons before photobleaching
Reduce noise Reduce background signal Nb
Choice of excitation wavelength, choice of coverslip, choice of fluorophoreTIRFM
Reduce CCD readout and thermal noise (appropriate choice of CCD)
Single molecule detection: signal‐to‐noise considerations
Optimize excitation power (avoid signal saturation)

Single molecule detection: Localization precision
Adding noise due to pixellization for a pixel size a (when s>a):a2/12: variance for a top‐hat distribution of size a
In the absence of background fluorescence and readout noise (and for infinitely small pixels):Each photon gives a measure of the position of the fluorophore.The position error x of each measurement is the same as the standard deviation, s, of the point spread function of the microscope.
For N photons, the standard error on the mean will be:
Adding background noise b:
Noise sources: photon shot‐noise related to the signal photonspixellization noisephoton noise due to background signal (cell fluorescence, etc) CCD readout and thermal noise
R. E. Thompson, D. R. Larson, W. W. Webb, Biophys. J. 82, 2775 (2002).
22 CCDthermal
CCDreadoutb nnNb In the presence of Nb background fluorescence
photons and of and noise:CCDreadoutn CCD
thermaln
N
bNCCDreadoutn CCD
thermaln

Localization precision as a function of photon number N
R. E. Thompson, D. R. Larson, W. W. Webb, Biophys. J. 82, 2775 (2002).
Theory
Experiment
Computer‐generatedimages
Spot size: 208 nmPixel size: 130 nmb=0.7
The spot size is considered equal to the standard deviation, s, of the pointspread function.
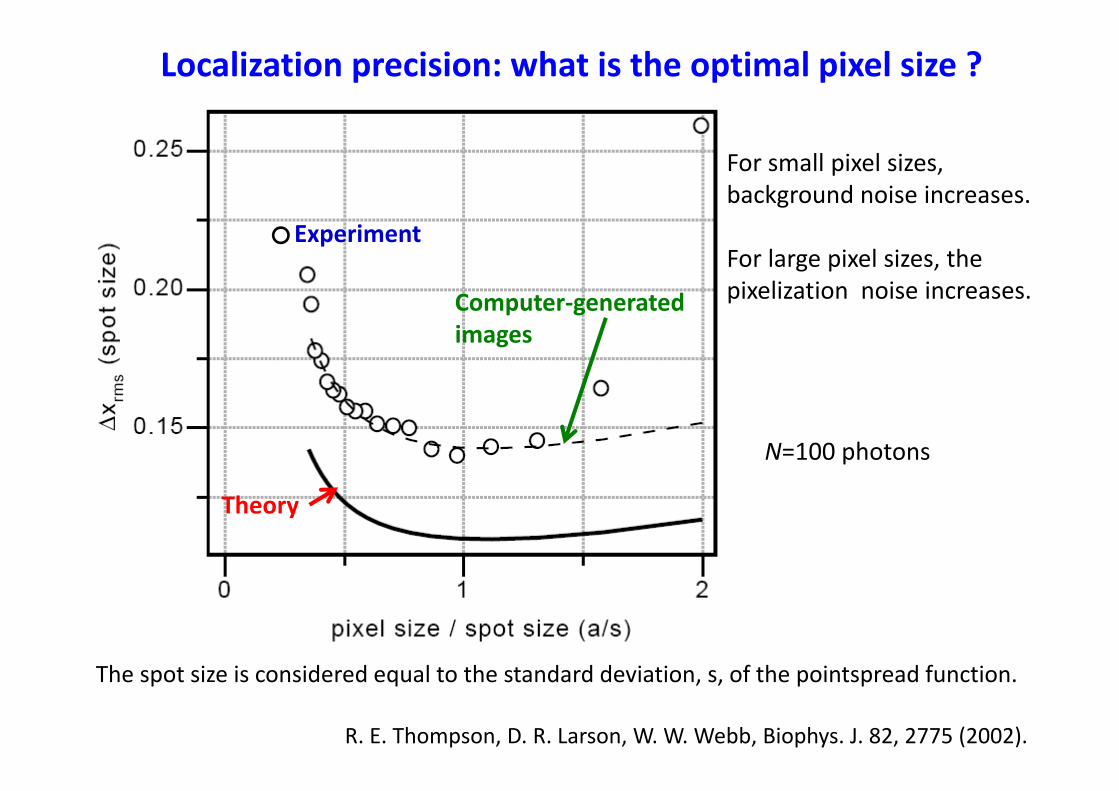
Localization precision: what is the optimal pixel size ?
R. E. Thompson, D. R. Larson, W. W. Webb, Biophys. J. 82, 2775 (2002).
For small pixel sizes, background noise increases.
For large pixel sizes, the pixelization noise increases.
The spot size is considered equal to the standard deviation, s, of the pointspread function.
Theory
Experiment
Computer‐generatedimages
N=100 photons

Andor website
Standard CCD‐ Shift charges vertically row by row into the serial output register.‐Read out each row by shiftinghorizontally pixel by pixel.‐ Use a mechanical shutter duringreadout.
T. Schmidt, Les Houches Spring School, 2001
A/D converter
Single‐molecule detection: CCD technology

Single‐molecule detectionBack‐illuminated versus front‐illuminated CCD
Roper Scientific websiteT. Schmidt, Les Houches Spring School, 2001

Single‐molecule detection: CCD technologyFrame transfer CCD Interline‐transfer CCD
‐ Transfer the whole image to the store section (in a few ms)Advantage: faster, readout duringacquisition of the next imageDisadvantage: more expensive, largersensor area
Andor website
‐ Fast transfer of the charges to immediately adjacent pixelsAdvantage: faster, readout duringacquisition of the next imageDisadvantage: the interline maskreduces the light sensitive area of the detector

www.emccd.com
Single‐molecule detection: Electron Multiplying‐CCD (EM‐CCD)
Advantages: faster readout (upto 10MHz, i.e. 0.1 µs/pixel ‐> upto 35 frames/s for a 512x512 pixel2 detector)
detection of smaller signals
The faster the readout, the higher the readout noise. Thanks to the electronmultiplication step, faster readout is possible, while maintaining a readout noise muchlower than the signal.Conventional readout noise : ~6 electronsEM‐CCD readout noise: ~50 electrons BUT for a gain of 50 this corresponds to 1 electron readout noise
Gain: 1‐1000
Additional step of electron multiplication before readout

BibliographyJ. R. Lakowicz, Principles of fluorescence spectroscopy, 3rd edition, Springer, 2006J. Mertz, Introduction to optical microscopy, Roberts & Co. Publishers, 2009 (in press).M. Müller, Introduction to Confocal Fluorescence Microscopy, 2nd ed., SPIE Press, 2006http://books.google.fr/books?id=t7N4G4x9zGcC&printsec=frontcover#PPP1,M1R. Rigler, H. Vogel (eds.), Single molecules and Nanotechnology, Springer, 2008P. Selvin, T. Ha (eds.), Single‐Molecule Techniques: A Laboratory Manual , CSH Lab. Press, 2008
Cited publications, in particular:B. Giepmans et al. Science 312, 217 (2006) fluorescent proteinsX. Michalet et al., Science 307, 538 (2005) QDsI. Medintz et al., Nat. Mat. 4, 435 (2005) QDsJ.‐A. Conchello & J. W. Lichtman, Nature Methods 2, 920 ‐ 931 (2005) confocalM. J. Saxton, K. Jacobson, Annu. Rev. Biophys. Biomol. Struct. 26, 373 (1997) single moleculeN. G. Walter et al., Nature Methods 5, 475 (2008) single molecule
Biophotonics seminarsMonday morning February 6: 9h‐10h30 François Lacombe, MaunaKea Technologies
10h45‐12h15 Ana‐Maria Pena, L’Oréal
Exam: Wednesday February 15 14h‐17hWritten exam (1h30 on the first 3 ½ courses, 1h30 on the second part)
All documents authorized.Bibliography projects upon request.

White‐light transmission (transillumination)Imaging modes: Phase contrast
Frits Zernike, Physics Nobel prize 1953
Olympus web site
Principle: transform a phase contrast into an amplitude contrast
S‐wave: Surround waveUnperturbedD‐wave: Diffracted wave/4 phase shiftThe phase plate retards the D‐wave by /4.The total phase differenceis now /2 destructive
interference

White‐light transmissionImaging modes: Differential interference contrast
Georges Nomarski
Olympus web site
Same principle: transform a phase contrast into an amplitude contrast
Different realization:Polarizer, Wollaston prism,Sample,Wollaston prism, analyzer