cover crops, and water qualityifca.com/files/ifca_2017-nrec_armstrong_timing.pdf · timing of...
TRANSCRIPT

Timing of Nitrogen Applications, Cover Crops, and Water Quality
PIs: Dr. Shalamar Armstrong2 and Dr. Catherine O’Reilly11Associate Profess of Hydrogeology
Department of Geography-Geology, Illinois State University2Assistant Professor Agronomy, Agronomy Department, Purdue University

Illinois Nutrient Loss Reduction Strategy
The target is 45 percent reduction in total phosphorus and nitrate-nitrogen that reaches Illinois waters by 2025.
To achieve that goal, we must enhance the efficiency of all common N management practices in our watersheds

Illinois Producer N Management Trends
0
500,000
1,000,000
1,500,000
2,000,000
2,500,000
3,000,000
3,500,000
Fall N Spring N Fall N <50%, Split pre-plant & side-dress
Row
Cro
p Ac
res
USDA-NASS Producer Survey, 2015
2011 2015
0
10
20
30
40
50
60
70
80
% of Farmers -Fall N % of Farmers -Spring N % of Farmers ≥ 2 N applications
Mackinaw River Producer Survey, 2014-2016
1993-19982014-2016 (C/S)2014-2016 (C/C)
• Decrease in fall applied N, but a larger portion of still remain• Increase in spring applied N• Large increase in split application of N (greater than or equal to 2 N applications within one growing season)
Spaulding and Armstrong, 2016

How do cover crops affect N availability and fate within common N management systems of IL?
N Conservation
• Soil inorganic N from OM
• Residual N
• Applied N, if a portion of N is applied in the Fall (DAP or Manure)
N Release
• Physiology
• Species: Legume, grass, cereal
• C:N ratio
Inorganic N sources cover crop interact with are:
Cover crop residue N release depends on
N Uptake
Corn and Soybean N and Yield

Effect of Cover Crops and Nitrogen Application Timing on Nutrient Loading Through Subsurface Drainage
Shalamar Armstrong1, Catherine O’Reilly2, Richard Roth3, Mike Ruffatti3,Travis Deppe3and Corey Lacey4
1 Assistant Professor, Purdue University Department of Agronomy, 2Associate Profess of Hydrogeology Department of Geography-Geology, Illinois State University
3M.S. Candidate In Agriculture Sciences , Illinois State University Department of Agriculture, 4Graduate Research Assistant, Purdue University Department of Agronomy

Nutrient Loss Reduction Strategies Evaluated
1. Change N application timing from fall to spring
2. Change N application timing from fall to spring + cover crop
3. Addition of cover crops to fall applied N----Strip-till application of N into a living cover crop

*Fall Anhydrous Ammonia was strip tilled into a living stand of Cereal and Radish Mix
Total N rate for all plots: 200 lb/A
1. Control-No Fertilizer and No Cover crop
2. Spring Split Application of Nitrogen (20% Fall -DAP and 80% Anhydrous Ammonium)
3. Spring Split Application of Nitrogen (20% Fall-DAP and 80% Anhydrous Ammonium) + Cover Crops
4. Fall Split Application of Nitrogen (70% Fall-DAP and Anhydrous Ammonium and 30% sidedress- Anhydrous Ammonium)
5. Fall Split Application of Nitrogen (70% Fall-DAP and Anhydrous Ammonium and 30% sidedress- Anhydrous Ammonium) + Cover Crops
Treatments

Research DesignA
Rep. 1 Rep. 2 Rep. 3
Field History
• 10 years Strip-till before Corn and No-till before Soybeans• Current Nitrogen Management : 60 % Fall N and 40% Spring N
15 Individually Tiled Fields: 1.6 Acres 72 rows
Tile Monitoring Station

Tile Monitoring Station
2 Days before Planting

Methodology – Cover Crop Planting
Cover Crop Mixture Daikon Radish (8%) Cereal Rye (92%)
Seeding Rate: 84 kg ha-1
Planting Date: Early to mid- Sept.

December 4, 2014

December 4, 2015

Precision Cover Crop and N Management
Fall Strip-till AA injection corn-corn 2014/2015
Precision PlantingInto fall N and Cover Crops residue

Precision Field Management
Fall Strip-Till and N application into living cover crop stand and soybean
residue going into corn 2017.

Cover Crop Biomass and N Uptake
On average cover crops absorbed 25% (60 kg ha-1 = 53 lb A-1) ) of the total N rate applied.
Within the cereal rye/radish mixture, radish is responsible for 55% of biomass produced and 51% of N uptake

0
200
400
600
800
1,000
1,200
1,400
2014 CC Season 2015 Corn Season 2015 CC Season 2016 SoybeanSeason
Drai
nage
Disc
harg
e (m
m)
Spring Spring + Cover Crop Fall Fall + Cover Crop Zero Control
Cover Crops impact on Total Discharge by Season
32-42% reduction in drainage during cover crop growing seasons
Little to no impact of cover crops on discharge during cash crop seasons

Cumulative Rainfall and Nitrate Loss
Spring N vs. Spring N + CC = 45% reductionFall N vs. Fall N + CC = 41% reductionSpring N vs. Fall N +CC = 49% reductionSpring N + CC vs. Fall N + CC = 7% reduction (equal)

Cover Crop impact on residual N loss in the soybean year following corn
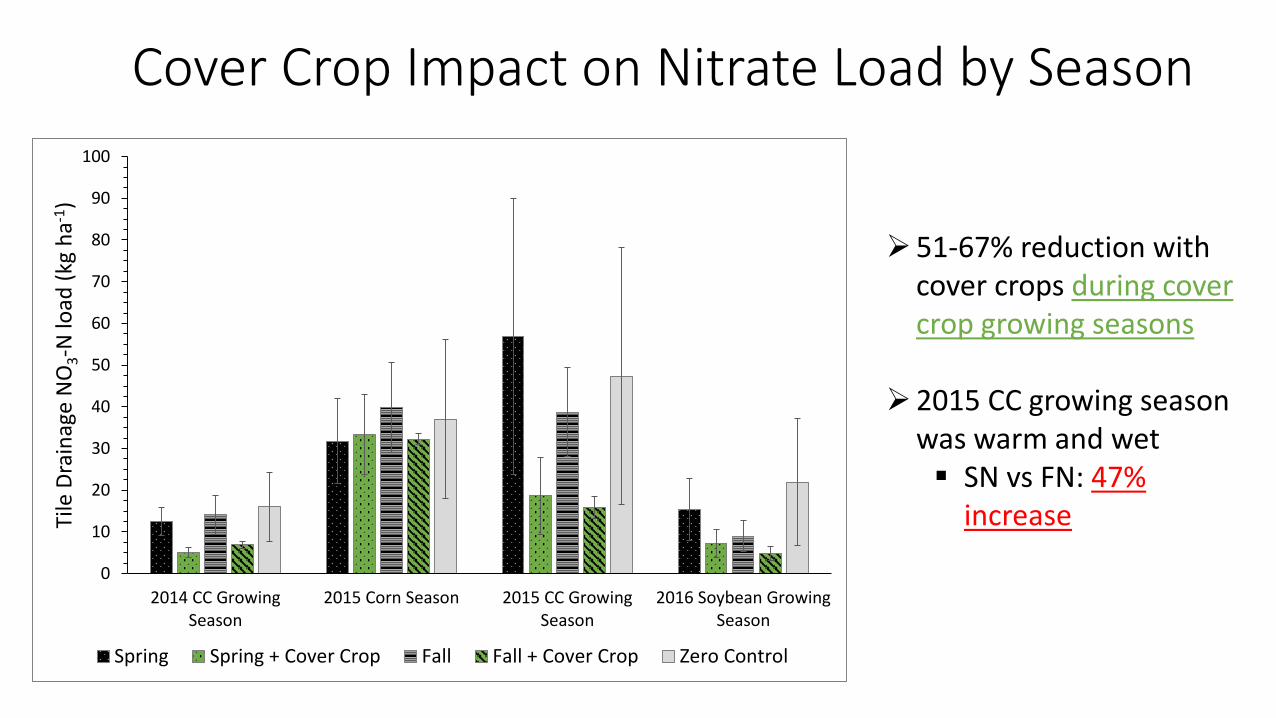
Cover Crop Impact on Nitrate Load by Season
0
10
20
30
40
50
60
70
80
90
100
2014 CC GrowingSeason
2015 Corn Season 2015 CC GrowingSeason
2016 Soybean GrowingSeason
Tile
Dra
inag
e N
O3-
N lo
ad (k
g ha
-1)
Spring Spring + Cover Crop Fall Fall + Cover Crop Zero Control
51-67% reduction with cover crops during cover crop growing seasons
2015 CC growing season was warm and wet SN vs FN: 47%
increase

Cover Crops Impact DRP Load by Season
0.00
0.05
0.10
0.15
0.20
0.25
0.30
0.35
0.40
2014 CC GrowingSeason
2015 Corn Season 2015 CC GrowingSeason
2016 SoybeanGrowing Season
Tile
Dra
inag
e DR
P lo
ad (k
g ha
-1)
Spring Spring + Cover Crop Fall Fall + Cover Crop Zero Control
Cover Crop Seasons
Spring system: 15-90% reduction with cover crops
Fall system: 37-69% reduction with cover crops
Little to no impact of cover crops on DRP load load during cash crops season

Cover Crop Impact on Cash Crop Yield
0.00
1.00
2.00
3.00
4.00
5.00
Fall Fall CoverCrop
Spring SpringCover Crop
ZeroControl
Soyb
ean
Yiel
d M
g ha
-1
AB AB AB
C
-
2.00
4.00
6.00
8.00
10.00
12.00
14.00
16.00
Spring Spring +CoverCrop
Fall Fall +CoverCrop
ZeroControl
Corn
Yie
ld M
g ha
-1

Summary• On average cover crops stabilized 54 lb N A-1
• Despite N management system (Fall or Spring) cover crops reduced N loss via tile drainage by 41-49%. Spring N + CC = Fall N + CC
• Cover crops are most effective when the are growing.
• Cover crops reduced corn N uptake and yield in the spring system, but not in the fall N system.
• Cover crops did not affect soybean yield.

The Effect of Cover Crops on Surface Water Quality: A Paired Watershed Experiment in the Lake Bloomington Watershed.
Shalamar Armstrong2 , Dr. Catherine O’Reilly1 , Ben Bruening3, Corey Lacey4, Richard Roth5, and Michael Ruffatti5
1Associate Profess of Hydrogeology Department of Geography-Geology, Illinois State University
2Assistant Professor Agronomy, Agronomy Department, Purdue University,3Graduate Student, Department of Geography-Geology, Illinois State University,
4Graduate Student, Agronomy Department, Purdue University, and 5Department of Agriculture, Illinois State University

N Conservation-Watershed Scale2016 Control44% Corn/56% Soybean
2016 Treatment32% Corn/68%Soybean
266 ha
479 ha
Lake Bloomington Watershed Towanda, IL

Approximately 48% (~ 213 ha) of the treatment watershed was treated with cover crop.
Fall 2015 Aerial Cover Crops Application8/28/15-9/9/15

11/28/201511/28/2015

Radish/Oats in Soybean 11/18/15
Cereal Rye/Radish in Corn10/5/15
Radish/Oats in Soybean 11/18/15
Cereal Rye/Radish in Corn12/15/15


2016 Soybean Harvest

Fall and Spring Cover Crop Biomass Samples
Above ground biomass was collected from a 1 m quadrant from 8 ha grids across the watershed.Fall sampling: 11/28/15Spring sampling:4/2/15
Biomass samples were dried and analyzed for %N to determine cover crop N uptake

2015/2016 Cover Crop Biomass
Cover Crop Biomass (kg ha-1)
Increase in Biomass from Fall
to Spring (kg ha-1)
CR/ Radish 1,682 A 1,259
Radish/Oats 460 B
Red = Cereal Rye/RadishYellow = Radish/Oats

2015/2016 Total Cover Crop N Uptake
Cover Crop N uptake(kg ha-1)
Increase in N uptake from Fall
to Spring (kg ha-1)
CR/Radish 58 A 42Radish/Oats 21 B

Spring Soil Samples4/18/16 – 4/21/16
• Soil samples were collected from 0-30 cm and 30-60 cm on 10 ha (20 acres) across the watershed.
• Soil were analyzed for NO3-N and NH4-N.

Soil NH4-N and NO3-N concentrations at the 0-30cm
depth
05
101520253035404550
Radish/Oats Cereal Rye/Radish Non CC Control WS
Soil
NH 4-
N o
r NO
3-N
(kg
ha-1
)
NH4-N NO3-N
A
B
BBC
AA B
NH4-N (kg ha-1)
NO3-N (kg ha-1)

Soil NH4-N and NO3-N concentrations at the 30-60cm
depth
0
10
20
30
40
50
Radish/Oats Cereal Rye/Radish Non Cover Crop Control WS
Soil
NH 4-
N o
r NO
3-N
(kg
ha-1
) NH4-N NO3-N
B BA A
A C BB
NH4-N (kg ha-1)
NO3-N (kg ha-1)

Cover Crops Impact on Nitrate Loading on a Watershed Scale
2016 Corn/Soybean
2016 CoverCrop
2016/2016Cover Crop

Nitrate Concentrations During Fall 2015 and Spring of 2016, Cover Crop Season

Nitrate Concentrations During 2016 Cash Crop Season

Nitrate Concentrations During Fall 2016 Cover Crop Season

Summary
• It is possible to cover crop on a watershed level, when you have the cooperation of farmers and industry leaders within the watershed.
• Cover Crops scavenged 21 – 58 kg N ha-1 (19 – 52 lb N A-1).
• The type of cover crop planted can dictate the form(NO3- or NH4
+) and location of available N in the soil during the spring after termination.
• During the cover crop growing season we observed a water quality signal. However, during the cash crop growing season additional effective N management practices are need to effect water quality.

Thank You!
Shalamar Armstrong, Ph.DSoil Conservation and Management
Assistant Professor of AgronomyPurdue University-Department of Agronomy
915 W. State Street, West Lafayette, IN 47907
Office [email protected]