cover crops for organic production - ucanr
TRANSCRIPT

Cover Crops for Organic Production
Mark Gaskell, Farm Advisor
UC Cooperative Extension
San Luis Obispo, California

Cover crops in organic production
o Source of nutrients
o Source of organic matter
- soil structure, aeration, drainage
o Crop rotation
o Disease suppression special role of soil nitrogen

Cover crops in organic production
o Important as an economical N source
- short-term soil organic matter
o Amount of N fixed depends upon species, growth
period, growing conditions
- more vigor = more N
o Value of cover crop N in cost / benefit analysis

Organic nutrient management
o Increased soil organic matter
- nutrient availability
- cation exchange capacity
- water retention
o Nitrogen availability – nitrogen use efficiency

Specific effects on soil N
o Nitrogen fixation
o Source of soil N for subsequent crops
o Nitrogen trapping
- less important in organic environment
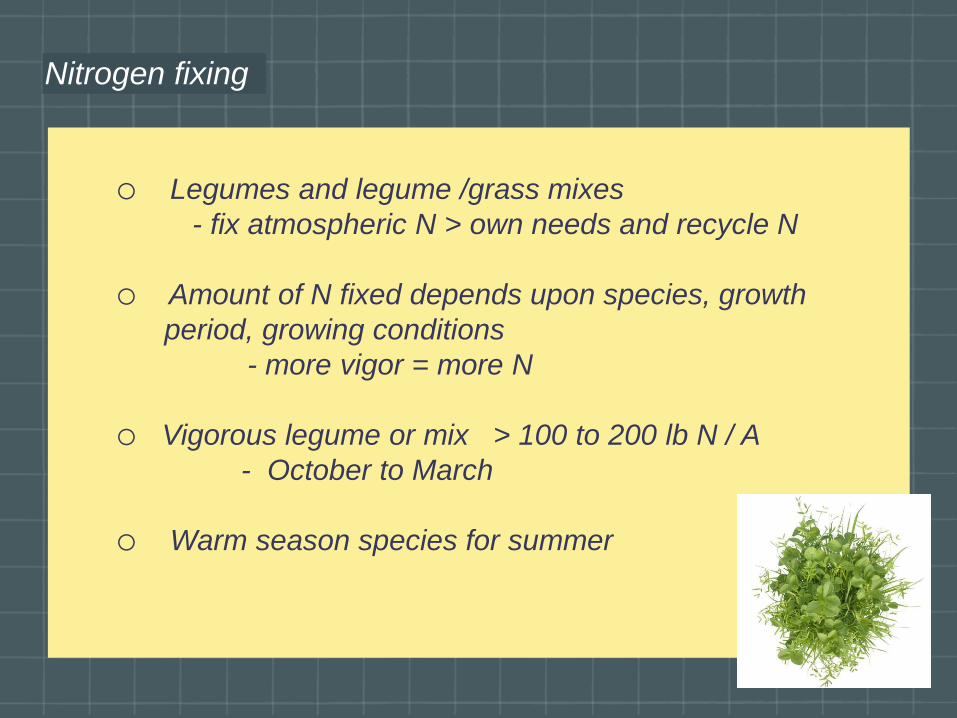
Nitrogen fixing
o Legumes and legume /grass mixes
- fix atmospheric N > own needs and recycle N
o Amount of N fixed depends upon species, growth
period, growing conditions
- more vigor = more N
o Vigorous legume or mix > 100 to 200 lb N / A
- October to March
o Warm season species for summer

Nitrogen from cover crops after incorporation
o N released from cover crop regardless of source
- mature grasses have *** effect > OM
o Mineralization is conversion to mineral N
- macro and micro fauna >
- temperature is important; moisture

C:N ratio is important
o Low C:N speeds decomposition
- legumes >>> grasses, grains
- mustards, buckwheat, etc. are intermediate
o N content may be lower and more slowly available
- organic N > ammonium > nitrate
o Avoid deficiency - supply alternative N

Effect of C:N on nitrogen availability
C: N RATIO NITROGEN AVAILABILITY
< 10 high
10 - 20 medium
20 - 30 low
> 30 negative

Effect of C:N on N availability
Percentage of N
in cover crop
Effect of N release Examples
0.5 will tie up N cereal straw
1.0 will tie up N cereal straw
1.5 will tie up N cereal at heading
2.0 will tie up N cereal before heading
2.5 will release N mustards at heading
and immature cereal
3.0 will release N mustards, legumes,
and juvenile cereal
3.5 will release N legumes and immature
mustards
4.0 will release N legumes

State Plant
Terminate Biomass
(Mgha-1)
N
uptake
(kg ha-1)
Tissue N
(g kg-1)
C:N GDD %
Vetch
Growth
stage
MD Mid September Mid May –
June
9.0–11.2 249–259 23–28
CA Early November Early April 8.1–14.6 175–185 18–27 1921–
2005
Flower
CA Early November Early April 4.7–9.3 115–155 16–27 1955–
2057
Flower
GA October–
November
April 5.7–8.2 84–310 14–38 10–32
NC October Mid April 3.0–5.4 82–200 27–37 14–21 44 R-head V-
early bloom
KY Mid September Mid May 4.2–4.4 90–140 20–33 11–86 R-flower V-
early bloom
ME Mid August Late May 2.1–4.5 46–170 21–30 <10
WA Mid September Late April 4.0–6.0 86–124 19–32 15–25
WA Mid September Late April 3.1–4.8 70–76 16–22 19–27 843–
1023
5–22 R-boot V-
veg
WA Late September Mid April 1.7–2.4 40–57 18–26 14–21

N availability to succeeding crop
o Total amount related to species, vigor
~ 100 – 200 lb N / acre
o Species, stage of development affect decomposition
~ 20-50% total N ---> succeeding crop
o Synchrony of availability
- timing relative to crop need
~ 1 study with organic peppers in SB Co. >
equivalent production to 100 lb N / acre

Total N availability VS synchrony

0 2 7
6 3 5
4 9 8 1 10
Southern Districts
Northern DIstricts
Crop N demand
Pre-plant cover crop mineralization
Prepare beds. apply plastic, drip tape arrival of plants from nursery
Time
Week
Cover crop incorporation
Rat
e o
f N
Min
eral
izat
ion
an
d N
itro
gen
Up
take

Cover crop lab and field study - WSU
o "Nitrogen contribution of rye–hairy vetch cover crop
mixtures to organically grown sweet corn"
Renewable Ag. and Food Systems
A. Lawson, A. M. Fortuna, C. Cogger, A. Bary, and T. Stubbs
Crop and Soil Sciences, WSU Pullman, WA
o Common problems with efficient use cover crops.

Incubate in lab and compare to field ?
o Lab – Vetch and rye mixes to provide varying
N composition
incubate > evaluate N availability
o Field – incorporate cover crops with varying
nitrogen composition after varying periods
evaluate soil N and crop uptake
- compared to varying rates of feather meal N

Composition of incubation materials
Dry Matter
Composition
Cover
crop
treatment
Biomass
(g kg-1)
Total N
(mg kg-1)
N concentration
(g kg-1)
C:N
ratio
Rye
(%)
Vetch
(%)
V100 1.11 398 36 13 0 100
R50V50 1.90 549 29 18 50 50
R75V25 1.90 440 24 21 75 25
R100 1.80 293 16 26 100 0
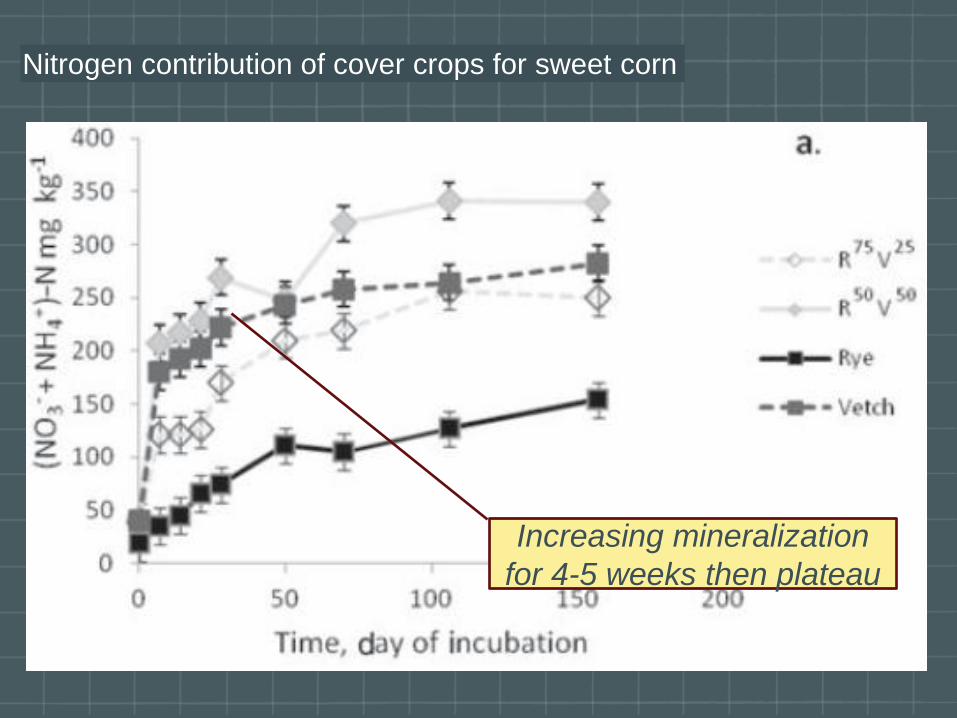
Nitrogen contribution of cover crops for sweet corn
Increasing mineralization
for 4-5 weeks then plateau

Nitrogen contribution of cover crops for sweet corn Salinity from nitrate – affect
microbes and mineralization?

Incubate in lab and compare to field ?
o N increase for 28 days incubation then levels off
EC affect microbial activity?
EC 1.3 to 3.0 and can decrease mineralization
o Higher rate of N mineralization with more vetch VS rye
possible to slow mineralization rate to match
uptake? "Designer" cover crops??

Nitrogen contribution of cover crops for sweet corn
Dry Matter
Composition
Year Cover
Crop
Biomass
(Mg ha-1)
N Uptake
(kg ha-1)
N
concentration
(g kg-1)
C:N
rati
o
Rye
(%)
Vetch
(%)
2009
Early
Late
2.76
1.50
62
34
22.3
22.7
19
18
78
87
22
13
2010
Early
Late
4.81
2.90
76
50
15.9
17.5
27
25
95
95
5
5

Nitrogen contribution of cover crops for sweet corn
Feather meal available N rate
(kg ha-1)
Year Cover
Crop
0
Early
June
0
PSNT
0 56 112 168
Post Harvest
------------------ Soil (NO3-)-N, mg kg-1 ----------------------
2009 Early
Late
None
8
7
7
18
16
15
3
2
2
5
3
3
6
7
4
23
8
10
2010
All
6
15
4
5
8
13
Highest cover crop N pre-
sidedress but insufficient
little N from cover crop

Nitrogen contribution of cover crops for sweet corn

Summer warm season cover crops
o Often grasses or warm season grains
apply N or need to sponge N?
o Cowpea or Crotalaria among warm season legumes
o Water and management important

Cost / benefit of cover crop N
o Direct costs of producing
- water may be most important
o Lost opportunity costs
- loss of use of land
o Cover crop to scavenge N during rainy periods
VS early or late market
o SOM and water retention
VS irrigation frequency and leaching potential

Cover crop management for organic production
o Select cover crop based on specific needs / tradeoffs
o Total N for succeeding crop is commonly ~100 lb N
o Build soil organic matter – short VS long term
o Seasonal limitations – N contribution related to vigor
o Market windows may drive decisions

Summary - Cover Crop N
o Critical importance for organic production
- one of most economical N sources
- improve soil organic matter
o Amount of N fixed depends upon species, growth
period, growing conditions
- more vigor = more N
o Actual N contribution can vary
o Value of cover crop N in cost / benefit analysis

Also see
Cover Crops for Vegetable Production
A Grower's Handbook
University of California
Agriculture and Natural
Resources Publication # 3517
ucanr.org

Cover Crops for Organic Production
Mark Gaskell, Farm Advisor
UC Cooperative Extension
San Luis Obispo, California