cover infiltration analyses powerpoint presentation · pdf filegeneral design and evaporative...
TRANSCRIPT
APPENDlXM
COVER INFILTRATION ANALYSES
Golder Associates
Objective:
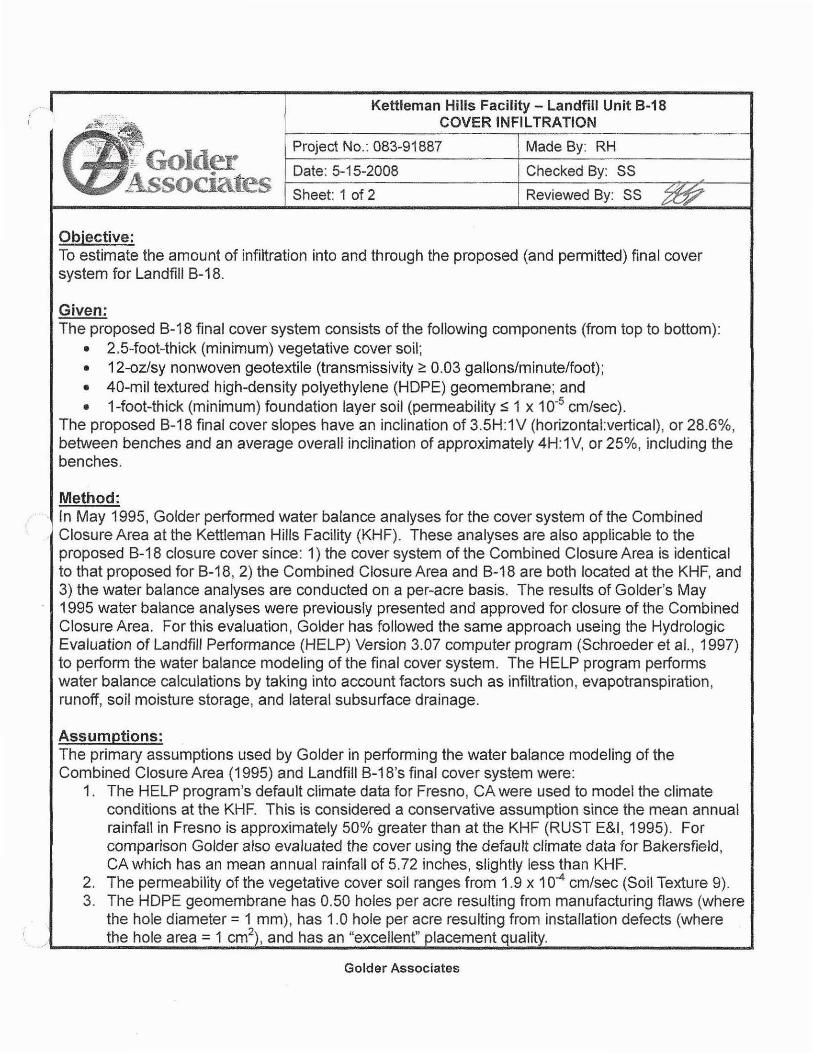
Kettleman Hills Facility - Landfill Unit 8-18 COVER INFILTRATION
Project No.: 083-91887 Made By: RH
Date: 5-15-2008 Checked By: SS
Sheet: 1 of 2 Reviewed By: SS
To estimate the amount of infiltration into and through the proposed (and permitted) final cover system for Landfill B-18.
Given: The proposed B-18 final cover system consists of the following components (from top to bottom):
• 2.5-foot-thick (minimum) vegetative cover soil; • 12-oz/sy nonwoven geotextile (transmissivity ~ 0.03 gallons/minute/foot); • 40-mil textured high-density polyethylene (HOPE) geomembrane; and • 1-foot-thick (minimum) foundation layer soil (permeability ::; 1 x 10⁻⁵ cm/sec).
The proposed B-18 final cover slopes have an inclination of 3.5H:1V (horizontal:vertical), or 28.6%, between benches and an average overall inclination of approximately 4H:1V, or 25%, including the benches.
Method: In May 1995, Golder performed water balance analyses for the cover system of the Combined Closure Area at the Kettleman Hills Facility (KHF). These analyses are also applicable to the proposed B-18 closure cover since : 1) the cover system of the Combined Closure Area is identical to that proposed for B-18, 2) the Combined Closure Area and B-18 are both located at the KHF, and 3) the water balance analyses are conducted on a per-acre basis. The results of Golder's May 1995 water balance analyses were previously presented and approved for closure of the Combined Closure Area . For th is evaluation , Golder has followed the same approach useing the Hydrologic Evaluation of Landfill Performance (HELP) Version 3.07 computer program (Schroeder et aI. , 1997) to perform the water balance modeling of the final cover system. The HELP program performs water balance calculations by taking into account factors such as infiltration, evapotranspiration, runoff, soil moisture storage, and lateral subsurface drainage.
Assumptions: The primary assumptions used by Golder in performing the water balance modeling of the Combined Closure Area (1995) and Landfill B-18's final cover system were:
1. The HELP program's default climate data for Fresno, CA were used to model the climate conditions at the KHF. This is considered a conservative assumption since the mean annual rainfall in Fresno is apprOXimately 50% greater than at the KHF (RUST E&I , 1995). For comparison Golder also evaluated the cover using the default climate data for Bakersfield, CA which has an mean annual rainfall of 5.72 inches, slightly less than KHF.
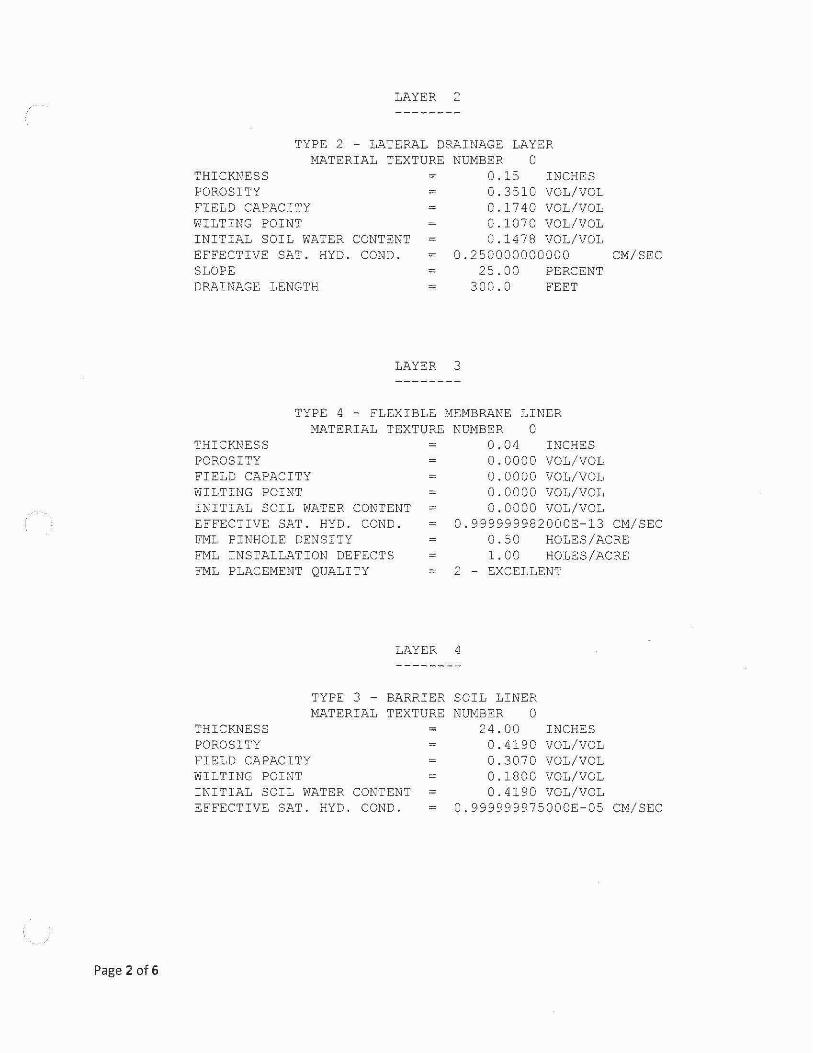
2. The permeability of the vegetative cover soil ranges from 1.9 x 10⁻⁴ cm/sec (Soil Texture 9). 3. The HOPE geomembrane has 0.50 holes per acre resulting from manufacturing flaws (where
the hole diameter = 1 mm) , has 1.0 hole per acre resulting from installation defects (where ./ ...... __ ,;;,th.;.;e;..h;..0;;.;I.;;.e,;;,a;.;..re;;.;a.;;...=...;1_c;;.;m.;..2.1.).;.., a;;;.n;.;.d;.;...;..h;;;.as.;..;;a.;..n_";;;.ex;.;.c;;.;e;.;;lI,;;,e.;..nt.;..".p.;.;la;,,;c;.;e.;.;m.;.;e;,;.n;,;.t .. q,;;,u,;;,a;.;;lit",y.~ _ ________ .....
Golder Associates
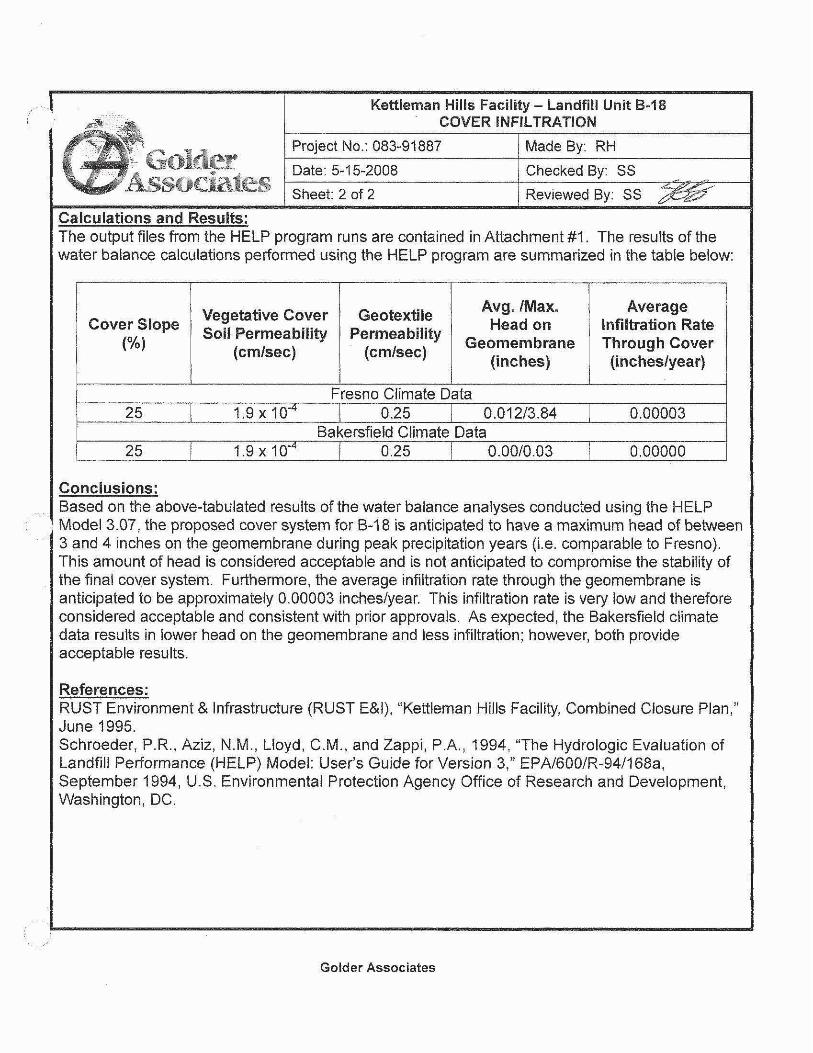
Kettleman Hills Facility - Landfill Unit B-18 COVER INFILTRATION
Project No.: 083-91887 Made By: RH
Date: 5-15-2008 Checked By: SS
Sheet: 2 of 2 Reviewed By: SS
Calculations and Results: The output files from the HELP program runs are contained in Attachment #1. The results of the water balance calculations performed using the HELP program are summarized in the table below:
C 51 I Vegetative Cover Geotextile Avg./Max. Average
over ope 5'1 P bTty Permeability Head on Infiltration Rate
(%) 01 ermea II Geomembrane Through Cover (cm/sec) (cm/sec)
(inches) (inches/year)
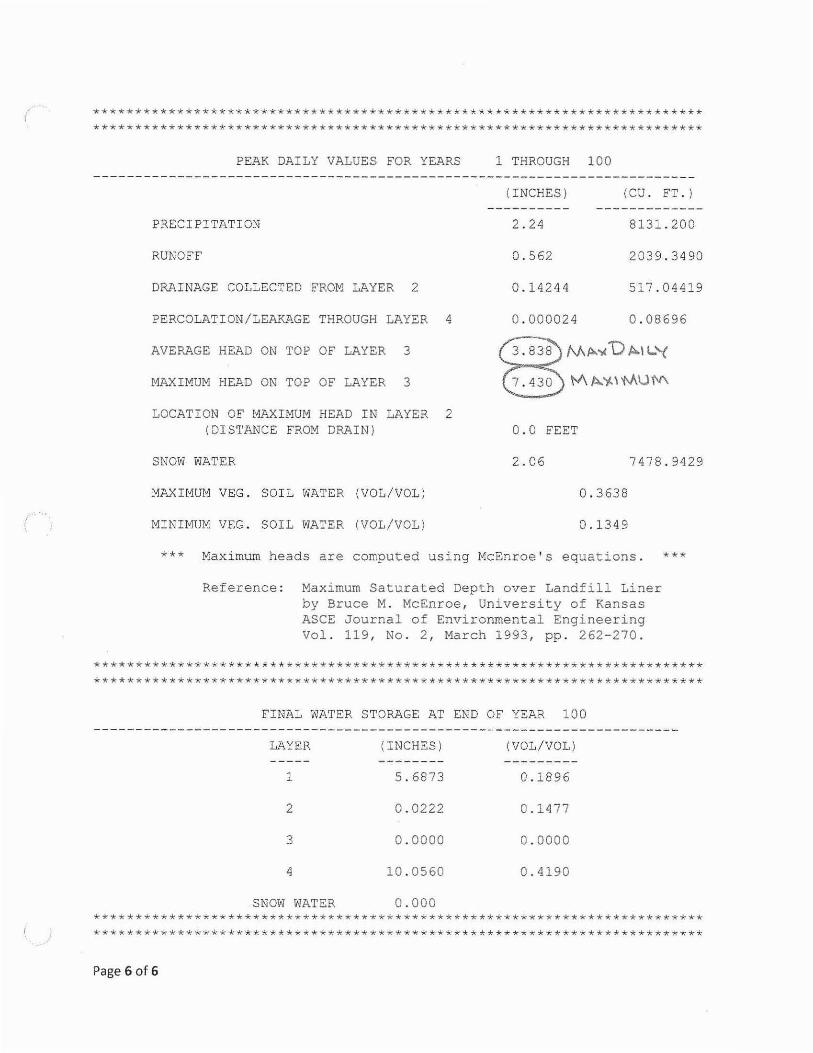
Fresno Climate Data 25 1.9 x 10⁻⁴ 0.25 0.012t3.84 0.00003
Bakersfield Climate Data 25 1.9 x 10⁻⁴ 0.25 0.00tO.03 0.00000
Conclusions: Based on the above-tabulated results of the water balance analyses conducted using the HELP Model 3.07, the proposed cover system for B-18 is anticipated to have a maximum head of between 3 and 4 inches on the geomembrane during peak precipitation years (i.e. comparable to Fresno). This amount of head is considered acceptable and is not anticipated to compromise the stability of the final cover system. Furthermore, the average infiltration rate through the geomembrane is anticipated to be approximately 0.00003 inchestyear. This infiltration rate is very low and therefore considered acceptable and consistent with prior approvals. As expected, the Bakersfield climate data results in lower head on the geomembrane and less infiltration; however, both provide acceptable results.
References: RUST Environment & Infrastructure (RUST E&I), "Kettleman Hills Facility, Combined Closure Plan," June 1995. Schroeder, P.R., Aziz, N.M., Lloyd, C.M., and Zappi, PA, 1994, "The Hydrologic Evaluation of Landfill Performance (HELP) Model: User's Guide for Version 3," EPA/600/R-94/168a, September 1994, U.S. Environmental Protection Agency Office of Research and Development, Washington, DC.
Golder Associates

*************************************************************************
************************************************************************* ** ** ** ** ** ** ** ** **
HYDROLOGIC EVALUATION OF LANDFILL PERFORMANCE HELP MODEL VERSION 3.07 (1 NOVEMBER 1997)
DEVELOPED BY ENVIRONMENTAL LABORATORY USAE WATERWAYS EXPERIMENT STATION
FOR USEPA RISK REDUCTION ENGINEERING LABORATORY
** ** ** ** ** ** ** ** **
************************************************************************* *************************************************************************
PRECIPITA'rION DATA FILE: TEMPERATURE DATA FILE: SOLAR RADIATION DATA FILE: EVAPOTRANSPIRATION DATA: SOIL AND DESIGN DATA FILE: OUTPUT DATA FILE:
C:\HELP3\P4B18.D4 C:\HELP3\T7B18.D7 C:\HELP3\SR13B18.D13 C:\HELP3\E11B18.D11 C:\HELP3\SDD10B18.D10 C:\HELP3\B18 CC.OUT
TIME: 23:22 DATE: 11/17/2008
*************************************************************************
TITLE: Landfill B-18 Closure Infiltration Evaluation (Fresno Climate Data)
*************************************************************************
NOTE: INITIAL MOISTURE CONTENT OF THE LAYERS AND SNOW WATER WERE COMPUTED AS NEARLY STEADY-STATE VALUES BY THE PROGRAM.
Page 1 of6
LAYER 1
TYPE 1 - VERTICAL PERCOLATION ~~TERIAL TEXTURE NUMBER
LAYER 9
THICKNESS 30.00 INCHES POROSITY FIELD CAPACITY WILTING POINT INITIAL SOIL WATER CONTENT EFFECTIVE SAT. HYD. CONDo
0.5010 VOL/VOL 0.2840 VOL/VOL 0.1350 VOL/VOL 0.1684 VOL/VOL 0.19E-03 CM/SEC
NOTE: SATURATED HYDRAULIC CONDUCTIVITY IS MULTIPLIED BY 2.36 FOR ROOT CHANNELS IN TOP HALF OF EVAPORATIVE ZONE.
Page 2 of 6
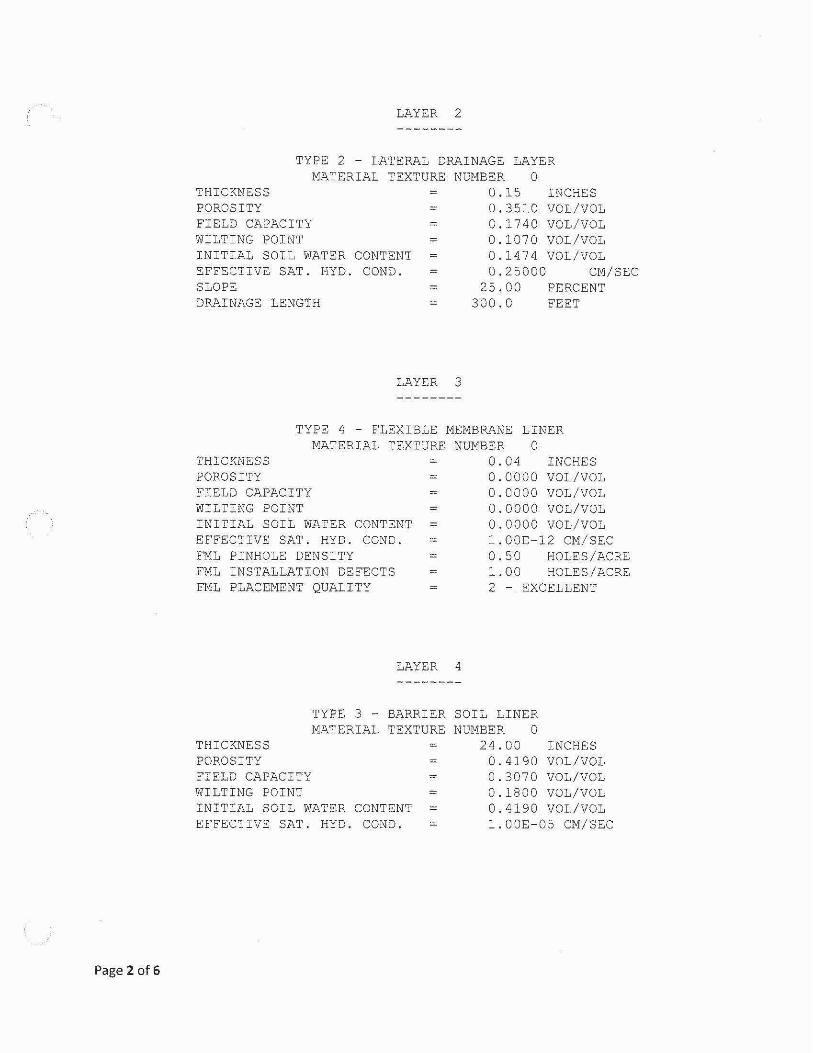
LAYER 2
TYPE 2 - LATERAL DRAINAGE LAYER MATERIAL TEXTURE NUMBER 0
THICKNESS O.lS INCHES POROSITY 0.3S10 VOL/VOL FIELD CAPACITY 0.1740 VOL/VOL WILTING POINT 0.1070 VOL/VOL INITIAL SOIL WATER CONTENT 0.1474 VOL/VOL EFFECTIVE SAT. HYD. CONDo 0.2S000 CM/SEC SLOPE 2S.00 PERCENT DRAINAGE LENGTH 300.0 FEET
LAYER 3
THICKNESS POROSITY
TYPE 4 - FLEXIBLE MEMBRANE LINER MATERIAL TEXTURE NUMBER 0
0.04 INCHES
FIELD CAPACITY WILTING POINT INITIAL SOIL WATER CONTENT EFFECTIVE SAT. HYD. CONDo FML PINHOLE DENSITY FML INSTALLATION DEFECTS
0.0000 VOL/VOL 0.0000 VOL/VOL 0.0000 VOL/VOL 0.0000 VOL/VOL 1. 00E-12 CM/SEC O.SO HOLES/ACRE 1.00 HOLES/ACRE
FML PLACEMENT QUALITY 2 - EXCELLENT
LAYER 4
TYPE 3 BARRIER SOIL LINER MATERIAL TEXTURE NUMBER 0
THICKNESS POROSITY FIELD CAPACITY WILTING POINT INITIAL SOIL WATER CONTENT EFFECTIVE SAT. HYD. CONDo
24.00 INCHES 0.4190 VOL/VOL 0.3070 VOL/VOL 0.1800 VOL/VOL 0.4190 VOL/VOL 1.00E-OS CM/SEC
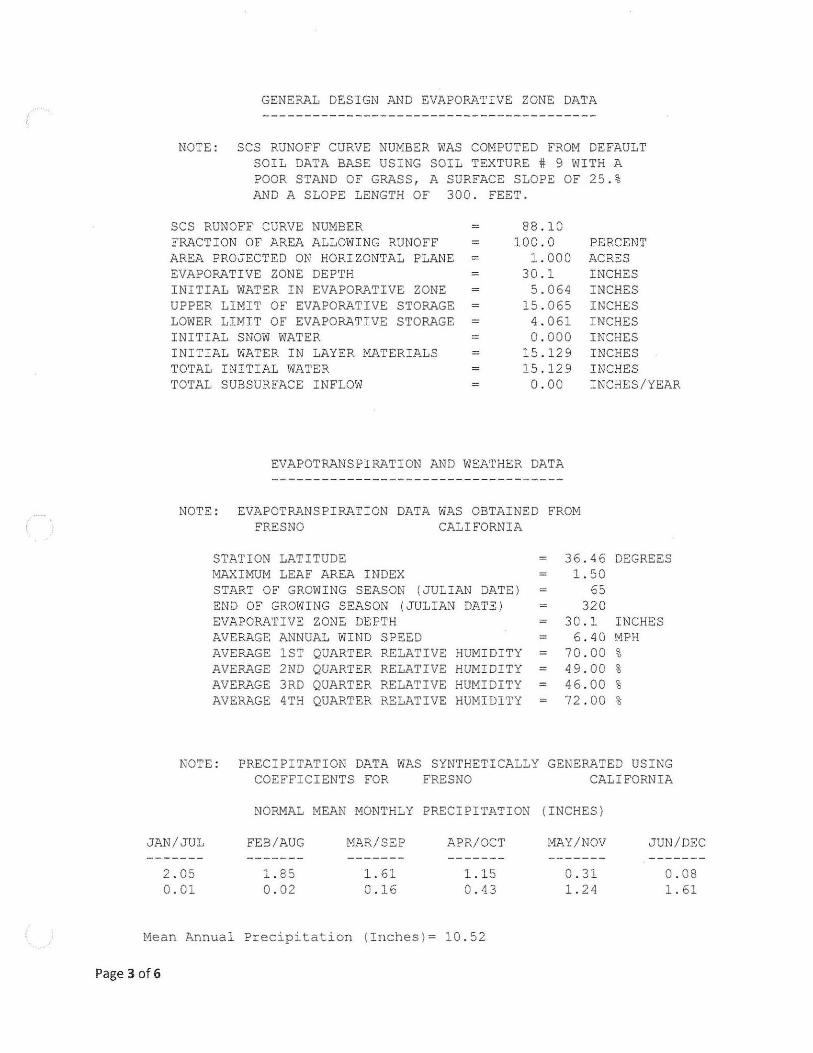
GENERAL DESIGN AND EVAPORATIVE ZONE DATA
NOTE: SCS RUNOFF CURVE NUMBER WAS COMPUTED FROM DE FAULT SOIL DATA BASE USING SOIL TEXTURE # 9 WITH A POOR STAND OF GRASS, A SURFACE SLOPE OF 25 . % AND A SLOPE LENGTH OF 300 . FEET .
SCS RUNOFF CURVE NUMBER FRACT I ON OF AREA ALLOWING RUNOFF AREA PROJECTED ON HORI ZONTAL PLANE EVAPORATIVE ZONE DEPTH
88 . 10 100 . 0 PERCENT
ACRES INCHES INCHES INCHES INCHES INCHES INCHES INCHES INCHES/YEAR
INITIAL WATER IN EVAPORATIVE ZONE UPPER LIMIT OF EVAPORATIVE STORAGE LOWER LIMI T OF EVAPORATIVE STORAGE INITIAL SNOW WATER INITIAL WATER IN LAYE R MATERI ALS TOTAL INITIAL WATER TOTAL SUBS URFACE INFLOW
1. 000 30 . 1 5.064
15 . 065 4 . 061 0 . 000
15 . 129 15 .1 29
0 . 00
EVAPOTRANSPIRATION AND WEATHER DATA
NOTE : EVAPOTRANSPIRATION DATA WAS OBTAINED FROM FRESNO CALIFORNIA
STATION LATITUDE MAXIMUM LEAF AREA INDEX START OF GROWING SEASON (JUL I AN DATE) EN D OF GROWING SEASON (JULIAN DATE) EVAPORATIVE ZONE DE PTH AVERAGE ANNUAL WIND SPEED AVERl'.GE 1ST QUARTER RELATIVE HUMIDITY AVERAGE 2ND QUARTER RELATIVE HUMIDITY AVERAGE 3RD QUARTER RELATIVE HUMIDITY AVERAGE 4TH QU)I.RTER RELATIVE HUMIDITY
36 .46 1. 50
65 32 0
30 . 1 = 6.40 = 70 . 00 = 49.00 = 46 . 00
72 . 00
DEGREES
INCHES MPH % % % %
NOTE: PRECIPITATION DATA WAS SYNTHETI CALLY GENERATED USING COEFFICIENTS FOR FRESNO CALIFORNIA
NORMAL MEAN MONTHLY PRECIPITATION (INCHES )
JAN/JUL FEB/AUG MAR/SEP APR/OCT MAY/NOV JUN/DEC
2 . 05 0 . 01
1. 85 0 . 02
1. 61 0.16
1.15 0 . 43
Mean Annual Precipitation (Inches ) = 10 .52
Page 30f6
0 . 31 1. 24
0 . 08 1. 61
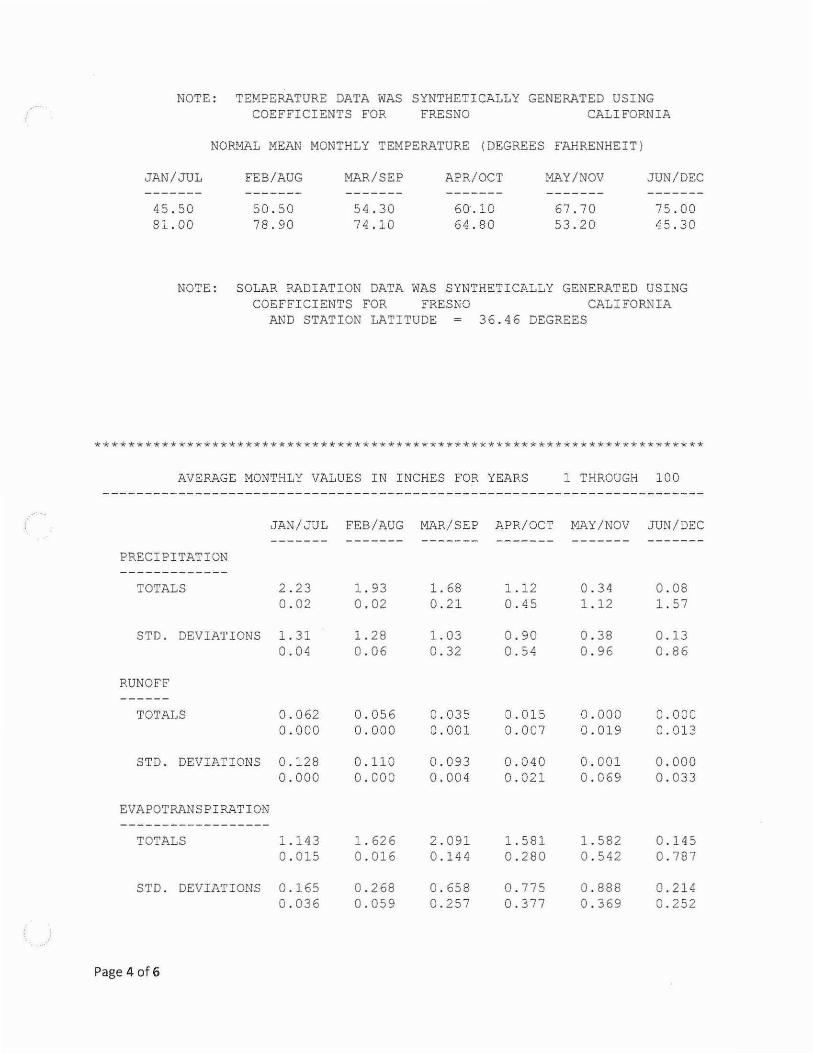
NOTE: TEMPERATURE DATA WAS SYNTHETICALLY GENERATED USING COEFFICIENTS FOR FRESNO CALI FORNIA
JAN/JUL
45 . 50 81. 00
NO&~L MEAN MONTHLY TEMPERATURE (DEGREES FAHRENHEIT)
FEB/AUG
50 . 50 78.90
MAR/SEP
54 . 30 74 . 10
APR/OCT
60 . 10 64 . 80
MAY/NOV
67 . 70 53 . 20
JUN/DEC
75 . 00 45.30
NOTE : SOLAR RADIATION DATA WAS SYNTHETICALLY GENERATED USING COEFFICIENTS FOR FRESNO CALIFORNIA
AND STATION LATITUDE 36.46 DEGREES
*************** ********* ******************** ******* **********************
AV ERAGE MONTHLY VALUES IN INCHES FOR YEARS 1 THROUGH 100
JAN/JUL FEB/AUG MAR/SEP APR/OCT MAY/NOV JUN/DEC
PRECIPITATION
TOTALS 2 . 23 0 . 02
STD . DEVIATIONS 1 . 31 0 . 04
RUNOFF
TOTALS 0.062 0.000
STD. DEVIATIONS 0 .12 8 0 . 000
EVAPOTRANSPI RATION
TOTALS 1 . 143 0 . 015
STD . DEVIATIONS 0 . 165 0 . 036
Page 4 of 6
1. 93 0 . 02
1. 28 0 . 06
0 . 056 0 . 000
0 . 110 0 . 000
1 . 626 0 . 016
0 . 268 0 . 059
1. 68 0 . 21
1. 03 0 . 32
0 .035 0.001
0 . 093 0 . 004
2 . 091 0 .144
0 . 658 0 . 257
1.12 0 . 45
0 . 90 0 . 54
0 . 015 0.00 7
0 . 040 0.021
1. 581 0 . 280
0 . 775 0 . 377
0.34 1.12
0 . 38 0 . 96
0 . 000 0 . 019
0 . 001 0 . 069
1. 582 0 . 542
0 . 888 0 .3 69
0 . 08 1. 57
0 . l3 0 . 86
0 .000 0 . 013
0.000 0 . 033
0 . 145 0 . 787
0 . 214 0 . 252

JAN/JUL FEB/AUG MAR/SEP APR/OCT MAY/NOV JUN/DEC ------- ------- ------- ------- ------- -------
LATERAL DRAINAGE COLLECTED FROM LAYER 2 ----------------------------------------
TOTALS 0.0749 0.2288 0.1979 0.0664 0.0208 0.0006 0.0000 0.0000 0.0000 0.0000 0.0000 0.0039
STD. DEVIATIONS 0.3161 0.5221 0.4164 0.1268 0.0293 0.0046 0.0000 0.0000 0.0001 0.0001 0.0000 0.0271
PERCOLATION/LEAKAGE THROUGH LAYER 4 ------------------------------------
TOTALS 0.0000 0.0000 0.0000 0.0000 0.0000 0.0000 0.0000 0.0000 0.0000 0.0000 0.0000 0.0000
STD. DEVIATIONS 0.0000 0.0001 0.0000 0.0000 0.0000 0.0000 0.0000 0.0000 0.0000 0.0000 0.0000 0.0000
AVERAGES OF MONTHLY AVERAGED DAILY HEADS (INCHES)
DAILY AVERAGE HEAD ON TOP OF LAYER 3 -------------------------------------
AVERAGES 0.0272 0.0787 0.0332 0.0020 0.0006 0.0000 0.0000 0.0000 0.0000 0.0000 0.0000 0.0001
STD. DEVIATIONS 0.1435 0.3015 0.1517 0.0038 0 .0008 0 .0001 0.0000 0.0000 0.0000 0.0000 0.0000 0.0009
************************************************************************* *************************************************************************
AVERAGE ANNUAL TOTALS & (STD. DEVIATIONS) FOR YEARS 1 THROUGH 100
INCHES CU. FEET PERCENT
PRECIPITATION 10.76 2.688) 39053.7 100.00
RUNOFF 0.208 0.2277) 755.31 1.934
EVAPOTRANSPIRATION 9.951 1.9427) 36121.62 92.492
LATERAL DRAINAGE 0.59327 1.06331) 2153.569 5.51438 FROM LAYER 2 r;
. 001 ",WI IN P I 1..,?,.fl>1' I ON 1\4v<.oIJ<:!i!4 ...... oVert. PERCOLATION THROUGH~ ( 0.00008) 0.095 0.00024
LAYER 4 ~
AVERAGE HEAD3
0N TOP ~( 0.036) ",veJLf:;,,&~ IA\'5A-\J OF LAYER ~
CHANGE IN WATER STORAGE 0.006 1. 5550) 23.11 0.059
Page 5 of6
( ************************************************************************* *************************************************************************
PEAK DAILY VALUES FOR YEARS
PRECIPITATI ON
RUNOFF
DK~INAGE COLLECTED FROM LAYER 2
PERCOLATION/LEAKAGE THROUGH LAYER 4
AVEK~GE HEAD ON TOP OF LAYER 3
~ffiXIMUM HEAD ON TOP OF LAYER 3
LOCATION OF MAXIMUM HEAD IN LAYER 2 (DISTANCE FROM DRAIN)
SNOW WATER
MAXIMUM VEG. SOIL WATER (VOL/VOL)
MINIMUM VEG. SOIL WATER (VOL/VOL)
1 THROUGH 100
( INCHES ) (CU . FT. )
2.24 8131.200
0.562 2039 .3490
0 .1 4244 517 . 04419
0 . 000024 0.08696
B Mp..'/. D A.\ 1...'-(
~ \'A/>...'/.\-NlU\V\
0 . 0 FEET
2.06 7478.9429
0.3638
0.1349
*** Maximum heads are computed using McEnroe ' s equations . ***
Reference : Ma ximum Saturated Depth over Landfill Liner by Bruce M. McEnroe , University of Kansas ASCE Journal of Environmental Engineering Vol . 119 , No . 2 , March 1993, pp. 262 - 270 .
************************************************************************* ****************** ******** ***********************************************
FINAL WATER STORAGE AT END OF YEAR 100
LAYER ( INCHES) (VOL/VOL) ------ -- ---------
1 5.6873 0 . 1896
2 0 .0222 0 . 1477
3 0 . 0000 0 . 0000
4 10.0560 0 . 4190
SNOW \-IATER 0 . 000 ************************************************************************* *************************************************************************
Page 6 of 6

************************************************************************ ********************* * ************************************************** ** ** ** ** ** ** ** ** **
HYDROLOGIC EVALUATION OF LANDFILL PERFORMANCE HELP MODEL VERSION 3.07 (1 NOVEMBER 1997)
DEVELOPED BY ENVIRONMENTAL LABORATORY USAE WATERWAYS EXPERIMENT STATION
FOR USEPA RISK REDUCTION ENGINEERING LABORATORY
** ** ** ** ** ** ** ** **
************************************************************************* *************************************************************************
PRECIPITATION DATA FILE: C:\HELP3\P4B18B.D4 C:\HELP3\T7B18B.D7 C:\HELP3\SR13B18B.D13 C: \HELP3\E11B18B.D11 C:\HELP3\SD10B18B.D10 C:\HELP3\B18 BKS.OUT
TEMPERATURE DATA FILE: SOLAR RADIATION DATA FILE: EVAPOTRANSPIRATION DATA: SOIL AND DESIGN DATA FILE: OUTPUT DATA FILE:
TIME: 10:21 DATE: 11/18/2008
*************************************************************************
TITLE: Landfill B-18 Closure Infiltration Evaluation (Bakersfield Climate Data)
*************************************************************************
NOTE: INITIAL MOISTURE CONTENT OF THE LAYERS AND SNOW WATER WERE COMPUTED AS NEARLY STEADY-STATE VALUES BY THE PROGRAM.
~~lof6
LAYER 1
TYPE 1 - VERTICAL PERCOLATION LAYER MATERIAL TEXTURE NUMBER 9
THICKNESS 30.00 INCHES POROSITY 0.5010 VOL/VOL FIELD CAPACITY 0.2840 VOL/VOL WILTING POINT 0.1350 VOL/VOL INITIAL SOIL WATER CONTENT 0.1456 VOL/VOL EFFECTIVE SAT. HYD. CONDo O.190000006000E-03 CM/SEC
NOTE: SATURATED HYDRAULIC CONDUCTIVITY IS MULTIPLIED BY 2.36 FOR ROOT CHANNELS IN TOP HALF OF EVAPORATIVE ZONE.
Page 2 of 6
LAYER 2
TYPE 2 - LATERAL DRAINAGE LAYER MATERIAL TEXTURE NUMBER 0
THICKNESS 0.15 INCHES POROSITY 0.3510 VOL/VOL FIELD CAPACITY 0.1740 VOL/VOL WILTING POINT 0.1070 VOL/VOL INITIAL SOIL WATER CONTENT 0.1478 VOL/VOL EFFECTIVE SAT. HYD. CONDo 0.250000000000 SLOPE 25.00 PERCENT DRAINAGE LENGTH 300.0 FEET
LAYER 3
TYPE 4 - FLEXIBLE MEMBRANE LINER
THICKNESS POROSITY FIELD CAPACITY WILTING POINT
MATERIAL TEXTURE NUMBER 0 0.04 INCHES 0.0000 VOL/VOL 0.0000 VOL/VOL 0.0000 VOL/VOL 0.0000 VOL/VOL
CM/SEC
INITIAL SOIL WATER CONTENT EFFECTIVE SAT. HYD. CONDo FML PINHOLE DENSITY FML INSTALLATION DEFECTS
0.999999982000E-13 CM/SEC 0.50 HOLES/ACRE 1 .00 HOLES/ACRE
FML PLACEMENT QUALITY 2 - EXCELLENT
LAYER 4
TYPE 3 - BARRIER SOIL LINER MATERIAL TEXTURE NUMBER 0
THICKNESS 24.00 INCHES POROSITY 0.4190 VOL/VOL FIELD CAPACITY 0.3070 VOL/VOL WILTING POINT 0.1800 VOL/VOL INITIAL SOIL WATER CONTENT 0.4190 VOL/VOL EFFECTIVE SAT. HYD. CONDo 0.999999975000E-05 CM/SEC

GENERAL DESIGN AND EVAPORATIVE ZONE DATA
NOTE: SCS RUNOFF CURVE NUMBER WAS USER- SPECIFIED.
SCS RUNOFF CURVE NUMBER 88 . 10 FRACTION OF AREA ALLOWING RUNOFF AREA PROJECTED ON HORIZONTAL PLANE EVAPORATIVE ZONE DEPTH
100.0 PERCENT
INITIAL WATER IN EVAPORATIVE ZONE UPPER LIMIT OF EVAPORATIVE STORAGE LOWER LIMIT OF EVAPORATIVE STORAGE INITIAL SNOW WATER INITIAL WATER IN LAYER MATERIALS TOTAL INITIAL WATER TOTAL SUBSURFACE INFLOW
1 . 000 30.1
4.381 15.065
4 . 061 0 . 000
14 . 446 14 . 446
0 . 00
ACRES INCHES INCHES INCHES INCHES INCHES INCHES INCHES INCHES/YEAR
EVAPOTRANSPIRATION AND WEATHER DATA
NOTE : EVAPOTRANSPIRATION DATA WAS OBTAINED FROM BAKERSFIELD
STATION LATITUDE MAXIMUM LEAF AREA INDEX
CALIFORNIA
START OF GROWING SEASON (JULIAN DATE ) END OF GROWING SEASON (JULIAN DATE) EVAPORATIVE ZONE DEPTH AVERAGE ANNUAL WIND SPEED AVERAGE 1ST QUARTER RELATIVE HUMIDITY AVERAGE 2ND QUARTER RELATIVE HUMIDITY AVERAGE 3RD QUARTER RELATIVE HUMIDITY AVERAGE 4TH QUARTER RELATIVE HUMIDITY
NOTE : PRECIPITATION DATA WAS SYNTHETICALLY COEFFICIENTS FOR BAKERSFIELD
NORMAL MEAN MONTHLY PRECIPITATION
35 . 42 DEGREES 1. 50
44 331
30 . 1 6.40
67.00 42 . 00 38 . 00 63 . 00
INCHES MPH % % % %
GENERATED USING CALIFORNIA
(INCHES)
JAN/ JUL FEB/AUG MAR/SEP APR/OCT MAY/NOV JON/DEC ---~--- ------- ------- ------- ------- -------
0 . 98 1. 07 0 . 87 0 .7 0 0.24 0 . 07 0 . 01 0 . 05 0 . 13 0 . 30 0 . 65 0 . 65
Mean Annual Precipitation ( Inches ) = 5 . 72
Page 3 of 6

NOTE: TEMPERATURE DATA WAS SYNTHETICALLY GENERATED USING COEFFICIENTS FOR BAKERSFIELD CALIFORNIA
NORMAL MEAN MONTHLY TEMPERATURE (DEGREES FAHRENHEIT)
JAN/JUL
48.20 84.50
FEB/AUG
53.20 82.40
MAR/SEP
57.10 77.30
APR/OCT
62.70 68.00
MAY/NOV
70.80 56.20
JUN/DEC
78.30 48.20
NOTE: SOLAR RADIATION DATA WAS SYNTHETICALLY GENERATED USING COEFFICIENTS FOR BAKERSFIELD CALIFORNIA
AND STATION LATITUDE 35.42 DEGREES
*************************************************************************
AVERAGE MONTHLY VALUES IN INCHES FOR YEARS 1 THROUGH 100
JAN/JUL FEB/AUG MAR/SEP APR/OCT MAY/NOV JUN/DEC
PRECIPITATION
TOTALS 1.10 0.01
STD. DEVIATIONS 0.65 0.04
RUNOFF
TOTALS 0.002 0.000
STD. DEVIATIONS 0.009 0.000
EVAPOTRANSPIRATION
TOTALS 0 . 654 0.022
STD. DEVIATIONS 0.249 0.088
Page 4 of6
1.13 0.05
0.82 0.20
0.005 0.002
0.017 0.019
0.961 0.045
0.303 0.185
0.93 0.14
0.61 0.22
0.005 0.000
0.018 0.000
1.377 0.116
0.556 0.190
0.72 0.27
0.56 0.45
0.001 0.001
0.007 0.009
1.236 0.160
0.805 0.244
0.24 0.70
0.28 0.64
0.000 0.004
0.002 0.021
0.472 0.382
0.476 0.303
0.08 0.65
0.23 0.43
0.001 0.000
0.007 0.001
0.082 0.451
0.208 0.243
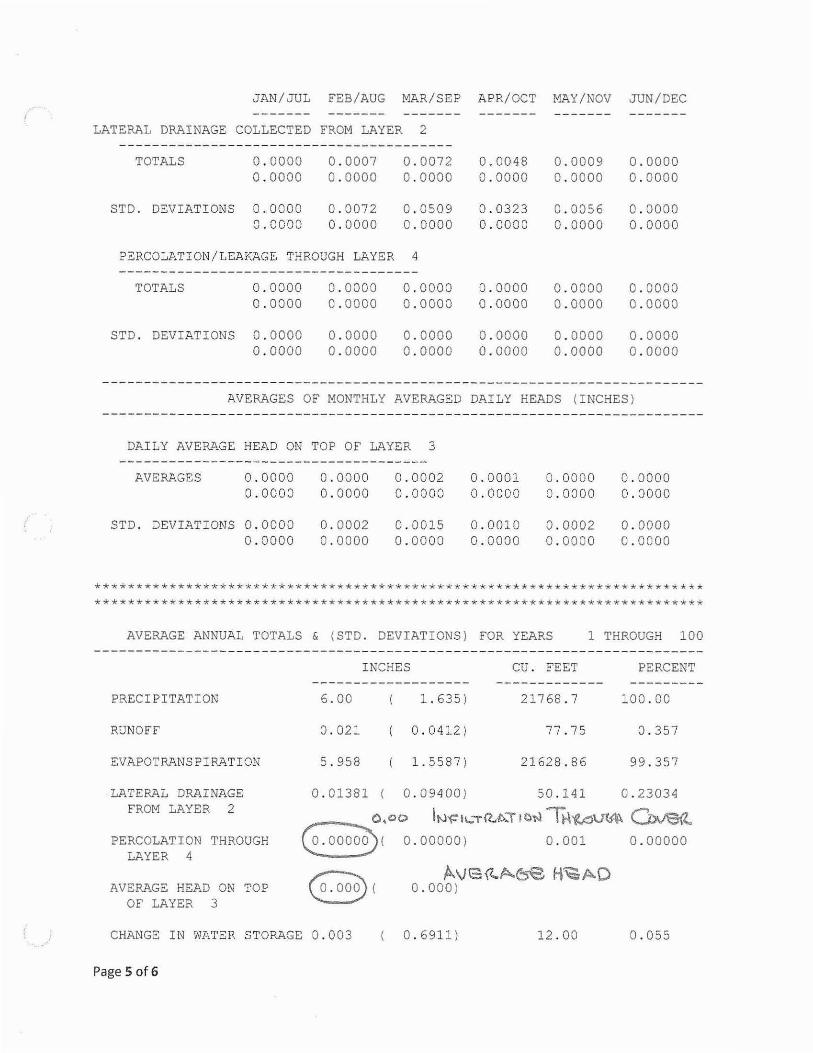
, , JAN/JUL FEB/AUG MJI.R/SEP APR/OCT MAY/NOV JUN/DEC - - ----- ----- -- - - ----- ------- ------- - ------
LATERAL DRAINAGE COLLECTED FROM LAYER 2 --------- - - -- ------------------- - - -- ----
TOTALS 0 . 0000 0 . 0007 0 . 0072 0.0048 0 . 0009 0 . 0000 0 . 0000 0 . 0000 0 . 0000 0 . 0000 0 . 0000 0 . 0000
STD . DEVIATIONS 0 . 0000 0 . 0072 0 . 0509 0 . 0323 0 . 0056 0 . 0000 0 . 0000 0 . 0000 0.0000 0.00 00 0 .0000 0 . 0000
PERCOLATION/LEAKAGE THROUGH LAYER 4 - - ------------------------- - --------
TOTALS 0.0000 0 . 0000 0 . 0000 0 . 0000 0 . 0000 0 . 0000 0 . 0000 0 . 0000 0 . 0000 0 . 0000 0 . 0000 0 . 0000
STD . DEVIATIONS 0 . 0000 0 . 0000 0 . 0000 0 . 0000 0 . 0000 0 . 0000 0.0000 0 . 0000 0 . 0000 0 . 0000 0 . 0000 0 . 0000
AVERAGES OF MONTHLY AVERAGED DAILY HEADS (INCHES )
DAILY AVERAGE HEAD ON TOP OF LAYER 3 - - -- ------------- - --- ----------------
AVERAGES 0 .0 000 0 . 0000 0 . 0002 0 .000 1 0.0000 0 . 0000 0.0 000 0 . 0000 0 . 0000 0.0000 0 . 0000 0 . 0000
STD . DEVIATIONS 0 . 0000 0 . 0002 0 . 0015 0 . 0010 0 . 0002 0.0000 0 . 0000 0 . 0000 0 . 0000 0 . 0000 0 . 0000 0 . 0000
*********************************************** ************ ********* **** * *************************************************************************
AVERAGE ANNUAL TOTALS & (STD . DEVIATIONS) FOR YEARS 1 THROUGH 100
PREC I PITATION
RUNOFF
EVAPOTRANSP IRATION
LATERAL DRAINAGE FROM LAYER 2
PERCOLATION THROUGH LAYER 4
AVERAGE HEAD ON TOP OF LAYER 3
INCHES CU . FEET PERCENT --- -- - - -- -- - ------- - ------------ - --------
6 . 00 1. 635) 21768.7 100 . 00
0 . 021 0 . 0412) 77.75 0 . 357
5 . 958 1.5587) 21628 . 86 99 . 357
0 . 01381 0 . 09400) 50 . 141 0 . 23034
0 • .,0 INi=I,-,lt.t>..1",O..l TH'iAVW CJ:>vea. G:. OOO"OD( 0.00000 ) 0 . 001 0 . 00000
~ AVe<tA.ese f-!1<;,AD ~( 0 . 000 )
CHANGE IN WATER STORAGE 0 . 003 0 . 6911) 12 . 00 0 . 055
Page 5 of6

************************************************************************* *************************************************************************
PEAK DAILY VALUES FOR YEARS
PRECIPITATION
RUNOFF
DRAINAGE COLLECTED FROM LAYER 2
PERCOLATION/LEAKAGE THROUGH LAYER 4
AVERAGE HEAD ON TOP OF LAYER 3
MAXIMUM HEAD ON TOP OF LAYER 3
LOCATION OF MAXIMUM HEAD IN LAYER 2 (DISTANCE FROM DRAIN)
SNOW WATER
MAXIMUM VEG. SOIL WATER (VOL/VOL)
MINIMUM VEG. SOIL WATER (VOL/VOL)
1 THROUGH 100
( INCHES) (CU. FT.)
1. 62 5880.600
0.195 707.0040
0.03062 111.16240
0.000000 0.00062
02D l''\f.>,.,'l'."\:)f.>,.,It...y
ED Mt..'/I...\'N\0N\
0.0 FEET
0.21 763.4433
0.2910
0.1349
*** Maximum heads are computed using McEnroe's equations. ***
Reference: Maximum Saturated Depth over Landfill Liner by Bruce M. McEnroe, University of Kansas ASCE Journal of Environmental Engineering Vol. 119, No.2, March 1993, pp. 262-270.
************************************************************************* *************************************************************************
FINAL WATER STORAGE AT END OF YEAR 100
LAYER ( INCHES) (VOL/VOL) -------- ---------
1 4.6981 0.1566
2 0.0221 0.1474
3 0.0000 0.0000
4 10.0560 0.4190
SNOW WATER 0.000 ********************************************************* * *************** *************************************************************************
Page 6of6

APPENDIXN
FROST AND BIOTIC PROTECTION EVALUATION
APPENDIX N.1
APPENDIX N.2
FROST PENETRATION EVALUATION
BIOTIC PROTECTION EVALUATION
Golder Associates
APPENDIX N.l
FROST PENETRATION EVALUATION
Golder Associates

(
Objective:
Kettleman Hills Facility - Landfill Unit B-18 FROST PENETRATION
Project No.: 083-91887 Made By: RH
Date: 5-19-2008 Checked By: SS
Sheet: 1 of 1 Reviewed By: SS
To evaluate the potential frost penetration effects on the proposed (and permitted) cover system for Landfill B-18.
Given: The proposed B-18 final cover system consists of the following components (from top to bottom):
• 2.5-foot-thick (minimum) vegetative cover soil; • 12-ozlsy nonwoven geotextile (transmissivity ~ 0.03 gallons/minute/foot); • 40-mil textured high-density polyethylene (HOPE) geomembrane; and • 1-foot-thick (minimum) foundation layer soil (permeability::; 1 x 10⁻⁵ cm/sec).
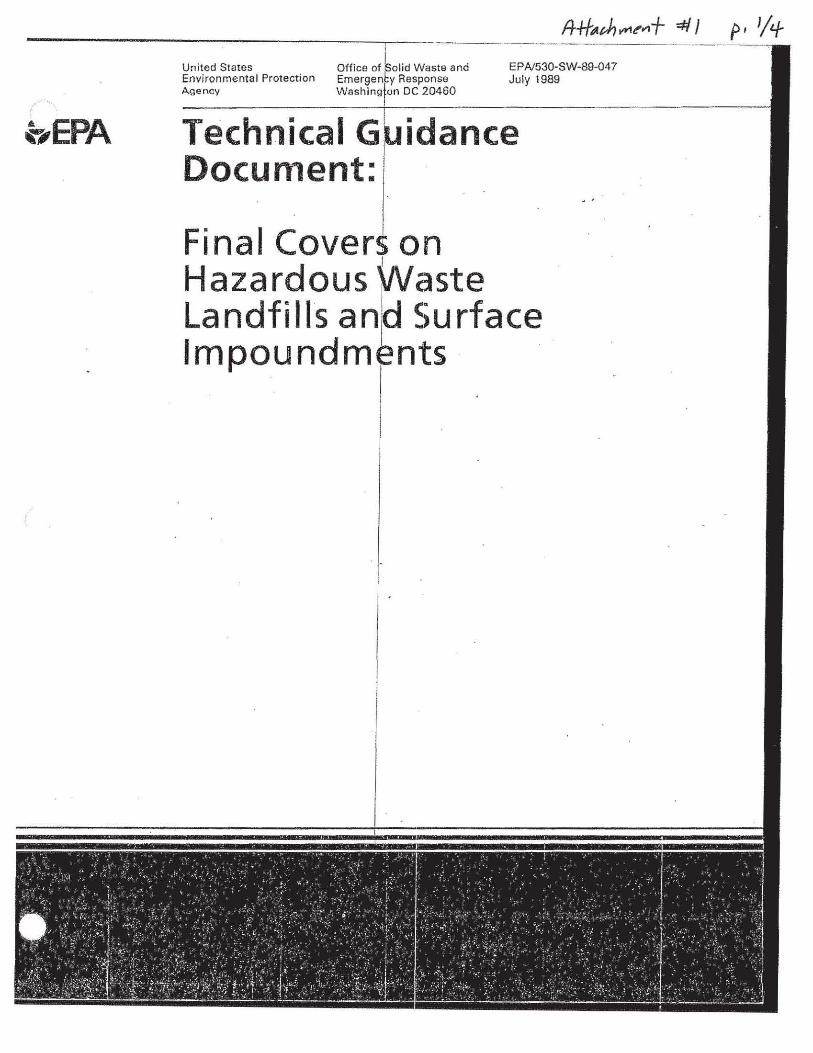
Findings: Based on a regional published map (USEPA, 1989) of frost penetration depths for the United States shown in Attachment #1, the average depth of frost penetration at the Kettleman Hills Facility (KHF) is anticipated to be approximately 2 inches. Another regional published map (NAVFAC, 1986) of frost penetration depths for the United States shows the extreme frost penetration depth at the KHF to be between 0 and 5 inches (see Attachment #2).
Conclusions: Since the proposed B-18 final cover does not contain a clay liner component, degradation of the final cover due to frost penetration is not a concern. Furthermore, available data on frost penetration depths (USEPA, 1989; NAVFAC, 1986) indicate that no more than approximately 0.5 feet of frost penetration is anticipated at the KHF. Hence, any frost penetration will be confined to the uppermost portion of the vegetative cover soil layer. This degree of frost penetration is not anticipated to affect the performance of the B-18 final cover systern.
References: United States Environmental Protection Agency (USEPA), "Technical Guidance Document: Final Covers on Hazardous Waste Landfills and Surface Impoundments," EPAl530-SW-89-047, July 1989. Naval Facilities Engineering Command (NAVFAC), "Design Manual 7.01 - Soil Mechanics," September 1, 1986.
Golder Associates
ATTACHMENT #1
FROST PENETRA nON EVALUATION
Golder Associates
,
bEPA
United States Office of Environmental Protect ion Aesoonse Age ncy 20460
EPAl530·SW-89-047 July 1989
Technical G idance Document:
Final Cove on Hazardous I aste Landfills ani Surface Impoundm nts
EPA/530-S\<I-89-047 July 1989
TECHNICAL GUIu~.~~'L DOCUMENT
FINAL COVERS ON ~;:~~~~U~W~A~S~T~E;~LANDFILLS AND SURFACE
Office of Solid IQaste U.S. Environmenta
Emergency Response Protection Agency
Washin(:jt()n \ DC 20460
In cooper~tionwith
RISK REDUCTION OFFICE OF
U.S. CINCINNATI,
LABORATORY AND DEVELOPMENT
PROTECTION AGENCY OHIO 45268

/(.::-#1 e"'JI" Hi/If.
(IA",'//+Y
Figure 6 .
• , . • • • ,.
'" · .. .. " " " Q • ", • • • •
Regional average depth of frost penetration in inches (stewart, et al., 1975) .
30
I I
stewart, B. A., et al. 1975. Cropland: Volume 1 - A ~d.qu,aL USDA Report No. ARS-H_5-1.
of Water Pollution from for Guideline Development. S. ·Dept. of Agriculture,
Hyattsville, MD.
Thornburg, A. A. 1979. Lands. TP-157 and EPA-6 Service, U.S. Department
Wright, M. J. (Ed.). 1976.
Ma.te,rials for Use on Surface Mined 9-134. Soil Conservation
Agriculture, Washington, D.C.
in Problem Soils. Cornell Experiment station. I~!l.ac'ai'
Adaptation to Mineral Stress versity Agricultural
NY.
f.-U.S. GOVERNMENT PAINTING OFF!CE: 1989·648-163100303

ATTACHMENT #2
FROST PENETRA TION EVALUATION
Golder Associates
Naval Facilities Engineering Command 200 Stovall Street Alexandria, Virginia 22322 -2300 APPROVED FOR PUBLIC RELEASE )))))))))))))))))))))))))))))))))))))))))))))))))))))))))))))))))))))))))))) )
Soil Mechanics
DESIGN MANUAL 7.01
REVALIDATED BY CHANGE 1 SEPTEMBER 1986
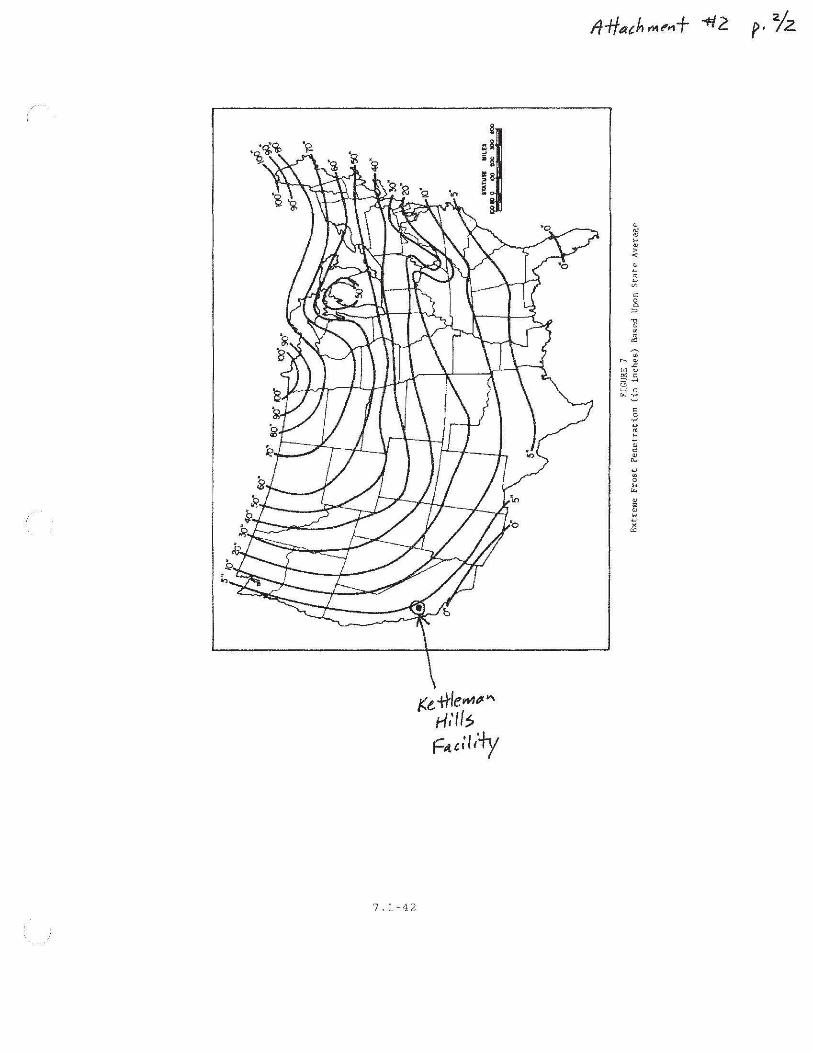
7.1-42
iCe. -tt/em .. '" r/,'/ {£o
F.t,"/;ty

APPENDIX N.2
BIOTIC PROTECTION EVALUATION
Golder Associates
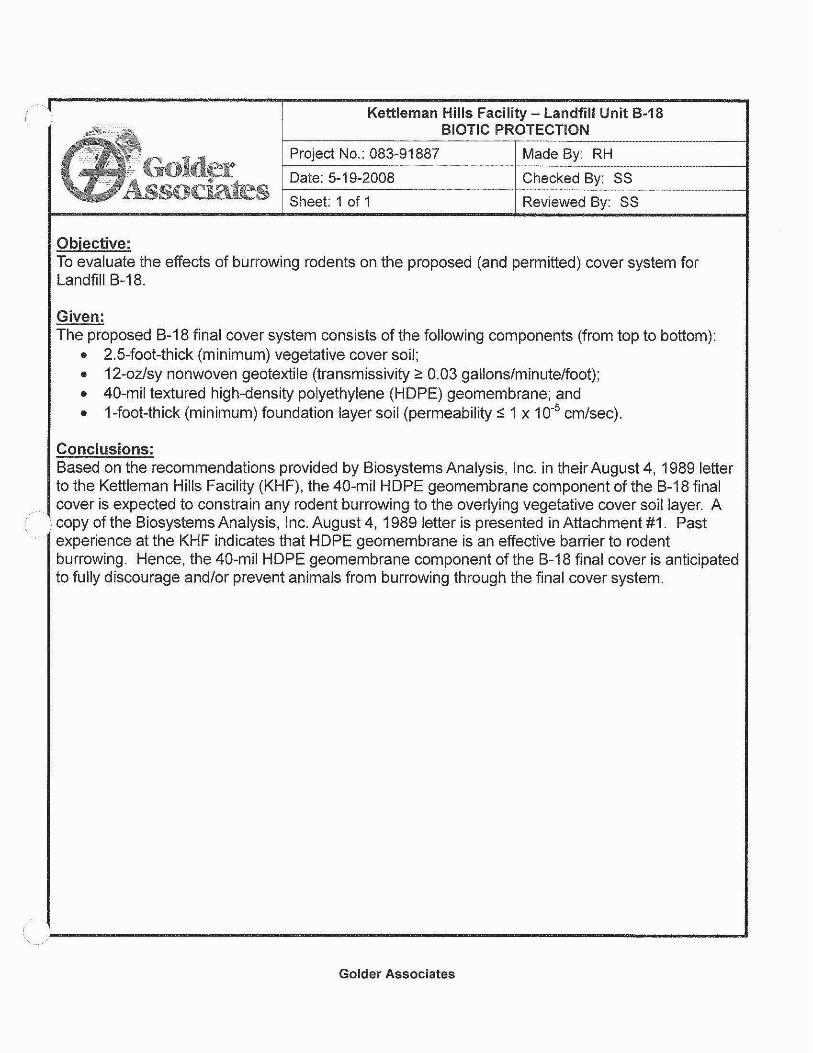
Objective:
Golder sociates
Kettleman Hills Facility - Landfill Unit B-18 BIOTIC PROTECTION
Project No.: 083-91887 Made By: RH
Date: 5-19-2008 Checked By: SS
Sheet: 1 of 1 Reviewed By: SS
To evaluate the effects of burrowing rodents on the proposed (and permitted) cover system for Landfill B-18.
Given: The proposed B-18 final cover system consists of the following components (from top to bottom):
• 2.5-foot-thick (minimum) vegetative cover soil; • 12-ozlsy nonwoven geotextile (transmissivity 2: 0.03 gallons/minute/foot); • 40-mil textured high-density polyethylene (HOPE) geomembrane; and • 1-foot-thick (minimum) foundation layer soil (permeability :5 1 x 10⁻⁵ cm/sec).
Conclusions: Based on the recommendations provided by Biosystems Analysis, Inc. in their August 4, 1989 letter to the Kettleman Hills Facility (KHF), the 40-mil HOPE geomembrane component of the B-18 final cover is expected to constrain any rodent burrowing to the overlying vegetative cover soil layer. A copy of the Biosystems Analysis, Inc. August 4, 1989 letter is presented in Attachment #1. Past experience at the KHF indicates that HOPE geomembrane is an effective barrier to rodent burrowing. Hence, the 40-mil HOPE geomembrane component of the B-18 final cover is anticipated to fully discourage and/or prevent animals from burrowing through the final cover system.
Golder Associates

ATTACHMENT #1
BIOTIC PROTECTION EV ALUA TION
Golder Associates
Ouistopher W. Hansen Otemical Waste Management, Inc. Ketdeman Hills Facility P.O. :Box 471 Kettleman Oty, CA 93239
s RE: Mitigation for Rodent Burrowing in Oosure Cap,
Dear Chris:
IOFI
RECEIVt:.L
AUG O:J 1989
C. W. M
August 4, 1989
We 'talked this morning about rodents burrowing into cover systems of closed waste management units at the Kettleman Hills Facility. I understand that some of your cover ,system cross sections contain compacted clay overlain by 1.5 feet or more of vegetative soil. You are concerned about rodents burrowing through the clay and impacting the integrity of the cover system.
As we discussed, the placement of 8 layer of HOPE geonet between the clay and the vegetative soil should completely discourage or prevent the animals from burrowing into the compacted clay. These animals will encounter the geonet, and will then constrain any burrowing to the overlying vegetative layer.
Please ·call if you have any questions.
Sincerely, BIOSYSTEMS ANALYSIS, INC.
~-d. C0( Wildlife Biologist
1152 P.edlM DrM. 8Idg . •• TIburon. CA IC8Z • !'hone (N) ....... FAJt. Cd) eM '"'