cover letter for sec form 17a - phoenix petroleumunder its registration, the company’s...
TRANSCRIPT

15 March 2013 Ms. Janet A. Encarnacion Head, Disclosure Department Philippine Stock Exchange Plaza 3/F PSE Plaza Ayala Triangle Plaza Ayala Ave., Makati City Dear Ms. Encarnacion: We are herewith submitting our Sec Form 17-A Annual Report in accordance with the Securities Regulations Code and the Revised Disclosure Rules. Thank you and warm regards. Very truly yours, Atty. Socorro Ermac Cabreros Corporate Secretary
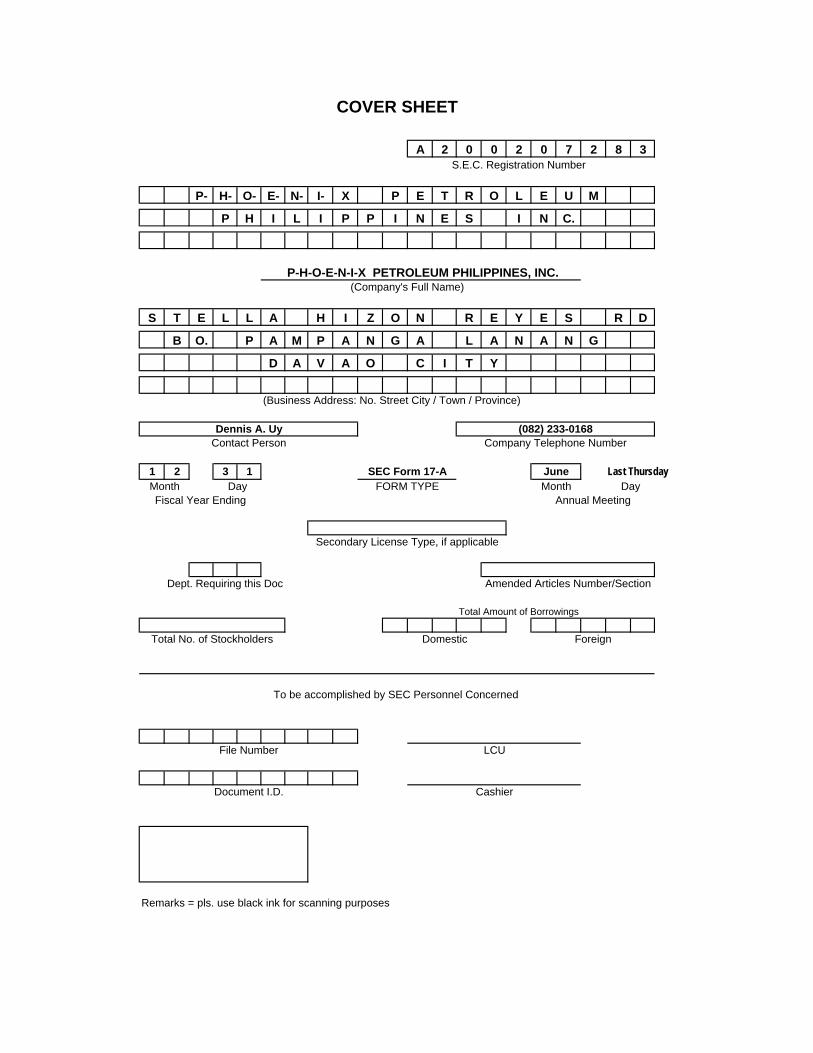
A 2 0 0 2 0 7 2 8 3
P- H- O- E- N- I- X P E T R O L E U M
P H I L I P P I N E S I N C.
P-H-O-E-N-I-X PETROLEUM PHILIPPINES, INC.
S T E L L A H I Z O N R E Y E S R D
B O. P A M P A N G A L A N A N G
D A V A O C I T Y
(Business Address: No. Street City / Town / Province)
1 2 3 1 Last Thursday
Remarks = pls. use black ink for scanning purposes
COVER SHEET
(Company's Full Name)
Dennis A. Uy (082) 233-0168
S.E.C. Registration Number
Secondary License Type, if applicable
Contact Person Company Telephone Number
Month DayJuneMonth DayFORM TYPE
SEC Form 17-A
To be accomplished by SEC Personnel Concerned
File Number
Total No. of Stockholders ForeignDomestic
Document I.D.
Annual Meeting
LCU
Cashier
Total Amount of Borrowings
Amended Articles Number/SectionDept. Requiring this Doc
Fiscal Year Ending
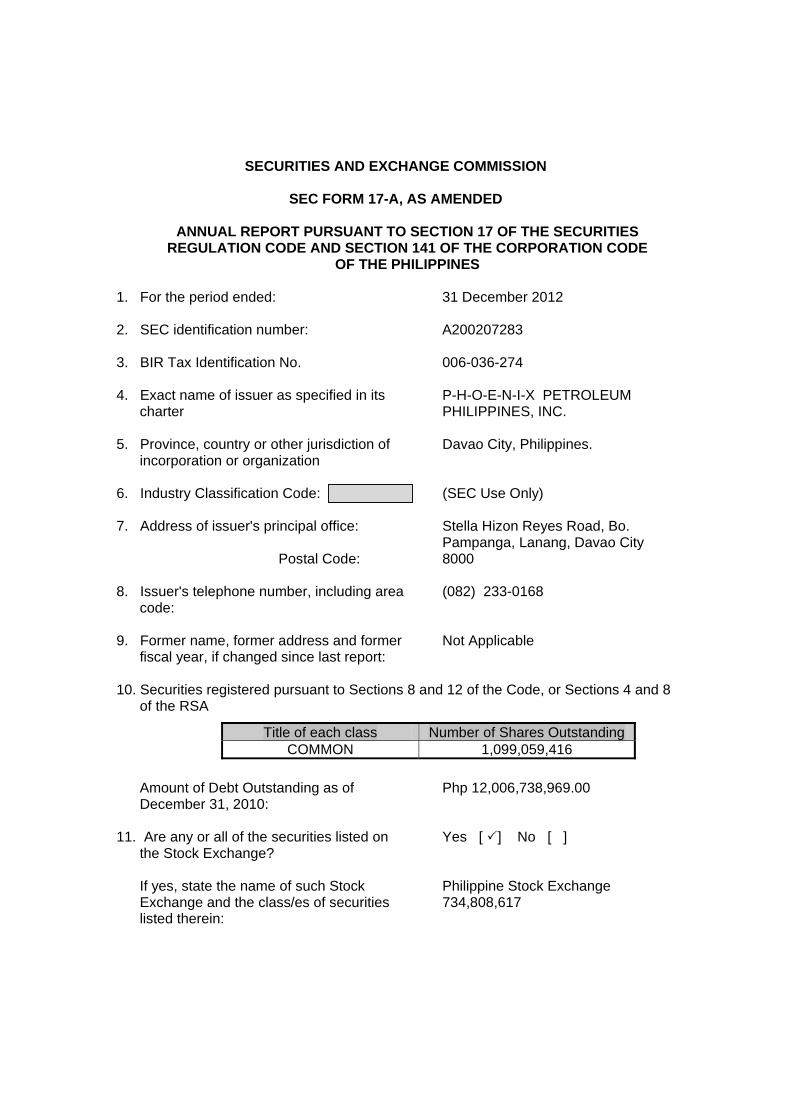
SECURITIES AND EXCHANGE COMMISSION
SEC FORM 17-A, AS AMENDED
ANNUAL REPORT PURSUANT TO SECTION 17 OF THE SECURITIES
REGULATION CODE AND SECTION 141 OF THE CORPORATION CODE OF THE PHILIPPINES
1. For the period ended: 31 December 2012 2. SEC identification number: A200207283 3. BIR Tax Identification No. 006-036-274 4. Exact name of issuer as specified in its
charter P-H-O-E-N-I-X PETROLEUM PHILIPPINES, INC.
5. Province, country or other jurisdiction of
incorporation or organization Davao City, Philippines.
6. Industry Classification Code: (SEC Use Only) 7. Address of issuer's principal office: Postal Code:
Stella Hizon Reyes Road, Bo. Pampanga, Lanang, Davao City 8000
8. Issuer's telephone number, including area
code: (082) 233-0168
9. Former name, former address and former
fiscal year, if changed since last report: Not Applicable
10. Securities registered pursuant to Sections 8 and 12 of the Code, or Sections 4 and 8
of the RSA
Title of each class Number of Shares Outstanding COMMON 1,099,059,416
Amount of Debt Outstanding as of December 31, 2010:
Php 12,006,738,969.00
11. Are any or all of the securities listed on
the Stock Exchange?
If yes, state the name of such Stock Exchange and the class/es of securities listed therein:
Yes [ ] No [ ] Philippine Stock Exchange 734,808,617

ii
12. Check whether the issuer has:
(a) has filed all reports required to be filed by Section 17 of the SRC and SRC Rule 17.1 thereunder or Sections 11 of the RSA and RSA Rule 11(a)-1 thereunder, and Sections 26 and 141 of the Corporation Code of the Philippines, during the preceding twelve (12) months (or for such shorter period the registrant was required to file such reports):
(b) has been subject to such filing
requirements for the past ninety (90) days:
Yes [ ] No [ ] Yes [ ] No [ ]
13. State the aggregate market value of the
voting stock held by non-affiliates of the registrant. The aggregate market value shall be computed by reference to the price at which the stock was sold, or the average bid and asked prices of such stock, as of a specified dated within sixty (60) days prior to the date of filing. If a determination as to whether a particular person or entity is an affiliate cannot be made without involving unreasonable effort and expense, the aggregate market value of the common stock held by non-affiliates may be calculated on the basis of assumptions reasonable under the circumstances, provided the assumptions are set in this Form.
(See definition of “affiliate” in “Annex B”).
DOCUMENTS INCORPORATED BY REFERENCE
The Consolidated Financial Statements as of and for the year ended December 31, 2010 and 2009 (incorporated as reference for Item _ and ___ of SEC Form 17-A)

iii
TABLE OF CONTENTS
PART I – Business and General Information …………………………... 1 – 39
Item 1. Business Description ………………………………………………….. 1Item 2. Business of Issuer……………………………………………………… 21Item 3. Description of Property………………………………………………… 36Item D. Legal Proceedings……………………………………………………… 38
PART II – Securities of the Registrant…………………………………… 40– 44
Item A. Market Price of and Dividends on Registrant’s common Equity shares and Related Stockholders Matters……………………………………. 40Item B. Description of Shares…………………………………………………. 43Item C. Stock Options Plan……………………………………………………. 44
PART III – Financial Information …………………………………………. 45- 57
Item A. Management’s Discussion and Analysis of Financial Conditions... 45Item B. External Audit Fees and Services…………………………………… 56
PART IV – Management and Certain Securityholders………………… 58 – 69Item A. Directors and Executive Officers of the Registrants………………. 58Item B. Executive Compensation…………………………………………….. 64Item C. Security Ownership of Certain Beneficial Owners and Management as of March 31, 2007………………………………… 65Item D. Certain Relationships and Related Transactions………………... 67Item E. Corporate Governance ………………………………………………. 69
PART V - Exhibits and Schedules……………………………………….. 70– 73
Exhibits…………………………………………………………………………… 70Reports on Sec Form 17-C…………………………………………………….. 70
SIGNATURES………………………………………………………………………… 74
1
PART I – BUSINESS AND GENERAL INFORMATION
1. Business Description
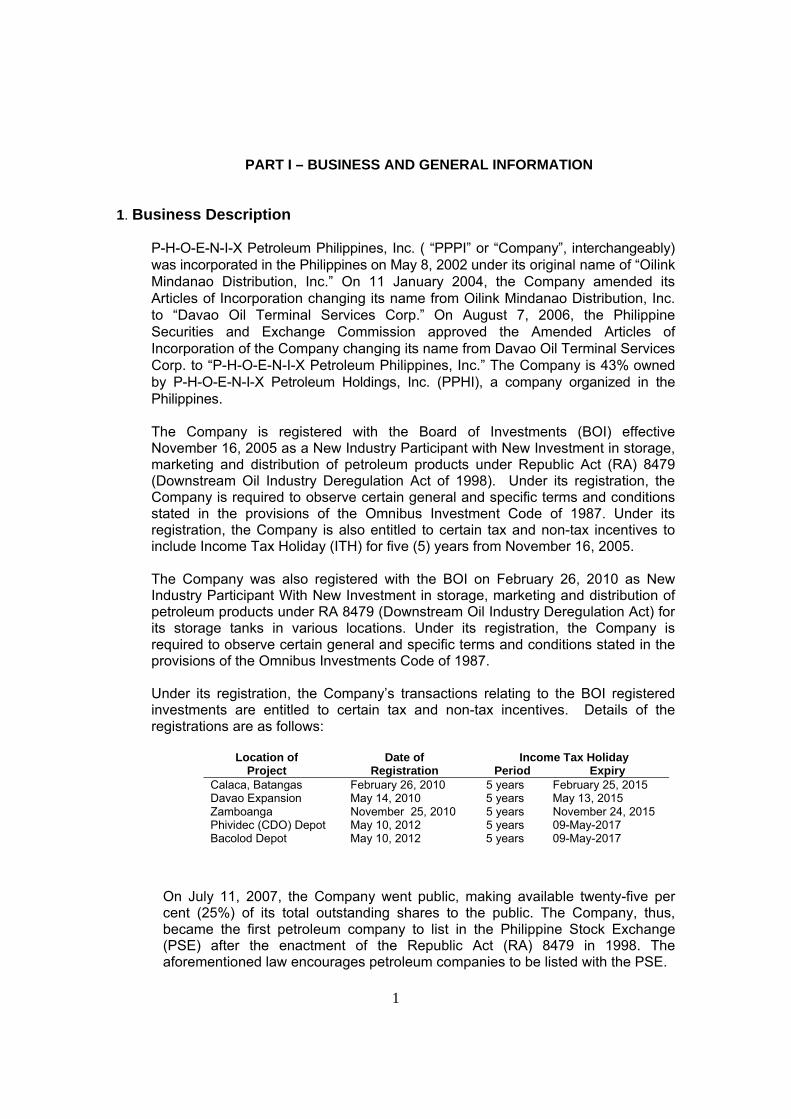
P-H-O-E-N-I-X Petroleum Philippines, Inc. ( “PPPI” or “Company”, interchangeably) was incorporated in the Philippines on May 8, 2002 under its original name of “Oilink Mindanao Distribution, Inc.” On 11 January 2004, the Company amended its Articles of Incorporation changing its name from Oilink Mindanao Distribution, Inc. to “Davao Oil Terminal Services Corp.” On August 7, 2006, the Philippine Securities and Exchange Commission approved the Amended Articles of Incorporation of the Company changing its name from Davao Oil Terminal Services Corp. to “P-H-O-E-N-I-X Petroleum Philippines, Inc.” The Company is 43% owned by P-H-O-E-N-I-X Petroleum Holdings, Inc. (PPHI), a company organized in the Philippines. The Company is registered with the Board of Investments (BOI) effective November 16, 2005 as a New Industry Participant with New Investment in storage, marketing and distribution of petroleum products under Republic Act (RA) 8479 (Downstream Oil Industry Deregulation Act of 1998). Under its registration, the Company is required to observe certain general and specific terms and conditions stated in the provisions of the Omnibus Investment Code of 1987. Under its registration, the Company is also entitled to certain tax and non-tax incentives to include Income Tax Holiday (ITH) for five (5) years from November 16, 2005. The Company was also registered with the BOI on February 26, 2010 as New Industry Participant With New Investment in storage, marketing and distribution of petroleum products under RA 8479 (Downstream Oil Industry Deregulation Act) for its storage tanks in various locations. Under its registration, the Company is required to observe certain general and specific terms and conditions stated in the provisions of the Omnibus Investments Code of 1987. Under its registration, the Company’s transactions relating to the BOI registered investments are entitled to certain tax and non-tax incentives. Details of the registrations are as follows:
Location of Date of Income Tax Holiday
Project Registration Period Expiry Calaca, Batangas February 26, 2010 5 years February 25, 2015 Davao Expansion May 14, 2010 5 years May 13, 2015 Zamboanga November 25, 2010 5 years November 24, 2015 Phividec (CDO) Depot May 10, 2012 5 years 09-May-2017 Bacolod Depot May 10, 2012 5 years 09-May-2017
On July 11, 2007, the Company went public, making available twenty-five per cent (25%) of its total outstanding shares to the public. The Company, thus, became the first petroleum company to list in the Philippine Stock Exchange (PSE) after the enactment of the Republic Act (RA) 8479 in 1998. The aforementioned law encourages petroleum companies to be listed with the PSE.
2
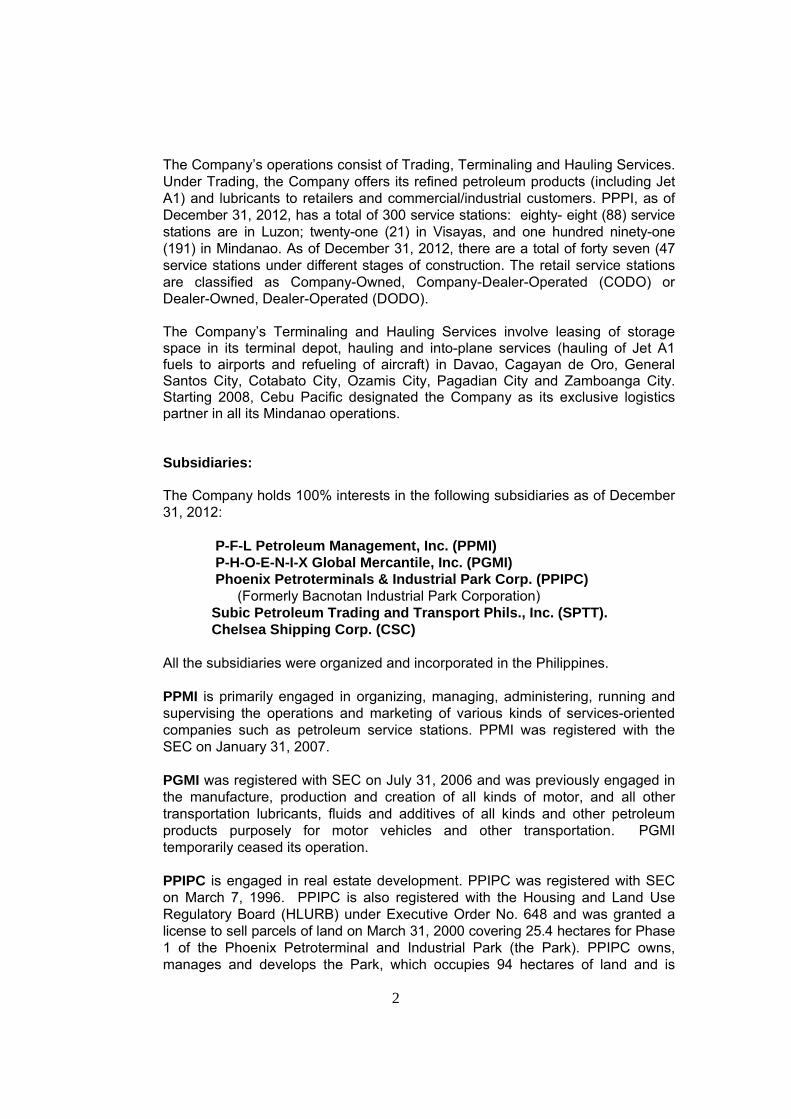
The Company’s operations consist of Trading, Terminaling and Hauling Services. Under Trading, the Company offers its refined petroleum products (including Jet A1) and lubricants to retailers and commercial/industrial customers. PPPI, as of December 31, 2012, has a total of 300 service stations: eighty- eight (88) service stations are in Luzon; twenty-one (21) in Visayas, and one hundred ninety-one (191) in Mindanao. As of December 31, 2012, there are a total of forty seven (47 service stations under different stages of construction. The retail service stations are classified as Company-Owned, Company-Dealer-Operated (CODO) or Dealer-Owned, Dealer-Operated (DODO). The Company’s Terminaling and Hauling Services involve leasing of storage space in its terminal depot, hauling and into-plane services (hauling of Jet A1 fuels to airports and refueling of aircraft) in Davao, Cagayan de Oro, General Santos City, Cotabato City, Ozamis City, Pagadian City and Zamboanga City. Starting 2008, Cebu Pacific designated the Company as its exclusive logistics partner in all its Mindanao operations.
Subsidiaries: The Company holds 100% interests in the following subsidiaries as of December 31, 2012:
P-F-L Petroleum Management, Inc. (PPMI) P-H-O-E-N-I-X Global Mercantile, Inc. (PGMI) Phoenix Petroterminals & Industrial Park Corp. (PPIPC) (Formerly Bacnotan Industrial Park Corporation) Subic Petroleum Trading and Transport Phils., Inc. (SPTT). Chelsea Shipping Corp. (CSC)
All the subsidiaries were organized and incorporated in the Philippines. PPMI is primarily engaged in organizing, managing, administering, running and supervising the operations and marketing of various kinds of services-oriented companies such as petroleum service stations. PPMI was registered with the SEC on January 31, 2007. PGMI was registered with SEC on July 31, 2006 and was previously engaged in the manufacture, production and creation of all kinds of motor, and all other transportation lubricants, fluids and additives of all kinds and other petroleum products purposely for motor vehicles and other transportation. PGMI temporarily ceased its operation. PPIPC is engaged in real estate development. PPIPC was registered with SEC on March 7, 1996. PPIPC is also registered with the Housing and Land Use Regulatory Board (HLURB) under Executive Order No. 648 and was granted a license to sell parcels of land on March 31, 2000 covering 25.4 hectares for Phase 1 of the Phoenix Petroterminal and Industrial Park (the Park). PPIPC owns, manages and develops the Park, which occupies 94 hectares of land and is
3
situated within three (3) Calaca barangays of Salong, Puting Bato West and Lumbang Calzada, with its own port facilities. PPIPC was granted a permit to operate permanent and non-commercial port by the Philippine Ports Authority on April 6, 1999 until the expiration date of the Foreshore Lease Contract on July 22, 2022. SPTT was registered with the SEC on February 20, 2007 and is engaged in buying and selling, supply and distribution, importation and exportation, storage and delivery of all types of petroleum for industrial, marine, aviation and automotive use. It does not carry any inventory at any given time. SPTT is duly registered with Subic Bay Metropolitan Authority and was issued the Certificate of Registration and Tax Exemption on 01 June 2012, which is effective until 31 May 2013, subject to annual renewal by SPTT. CSC was incorporated in the Philippines on July 17, 2006 and started commercial operations on January 1, 2007. CSC is engaged in maritime trade through conveying, carrying, loading, transporting, discharging and storing of petroleum products, goods and merchandise of every kind, over waterways in the Philippines and in the Asia-Pacific region. CSC has 10 vessels in its fleet, two of which serve the regional trade route. Chelsea owns the largest Philippine-registered oil tanker "M/T Chelsea Thelma" with 9366 GRT. With a total fleet size of 19,561 GRT, Chelsea is among the top 5 major petroleum tanker owners in the country. The registered office of the Company and PGMI, which is also their principal place of business, is at Stella Hizon Reyes Road, Barrio Pampanga, Davao City. PPMI’s registered office is at Phoenix Depot, Davao City and its principal place of business is located at Stella Hizon Reyes Road, Barrio Pampanga, Davao City. PPIPC’s principal place of business is in Metro Manila with registered office at the 26th Floor, The Fort Legend Tower, 3rd Avenue corner 31st Street, The Fort Global City, Taguig City. The registered office of SPTT, which is also its principal place of business, is at Units 113 and 115 Subic International Hotel, Alpha Building, Rizal Highway, Subic Bay Freeport Zone, Zambales. The registered office of the CSC which is also its principal place of business, is located at Stella Hizon Reyes Road, Barrio Pampanga, Davao City.
Operation Highlights Sales: Leading Independent Player in the Industry
Retail

4
The Company opened 80 new retail stations in 2012, for a total of 300 retail stations nationwide: 191 in Mindanao, 21 in Visayas, and 88 in Luzon. This makes the Company not just the fastest-growing “independent” retail petroleum company, but the fastest-growing retail petroleum company of any kind in the Philippines over the past five years. With new logistical capability in the Visayas, the Company anticipates next year’s growth to be even stronger.
Nationwide, the Company’s market share increased from 5.4% to 6% in 2012,
making it the number one independent oil company in the Philippines. In Mindanao, the Company is the fourth oil company, with 9% market share and 16.6% network share.
In line with last year’s priorities, the Company retail stations recorded fuel sales
volume growth of 28%, while lubricants were up 32%. As part of development strategy, the Company retail stations continue to be
destinations by themselves, providing other services to the public. In Luzon, 10 of the Companys sites have been installed with ATMs, while 24 stations boast of air-conditioned restrooms as part of the Company’s “Clean and Cool” Program. All locator spaces are 100% occupied.
In Mindanao, the Company’s 300th station in Lanang, Davao City is a
prototype of future development models and as such is equipped with modern conveniences and a larger commercial complex. Locators include an auto service shop, bakery, restaurants, coffee shops, and personal service parlors.
With the Company’s dealers as the frontline of the business and indispensable
partners, strengthening personal and commercial relationships with the business partners is an essential part of its mission. The Company regularly conducts dialogues with dealers to discuss developments in the Company, improve relationship processes and build camaraderie. Much-awaited is the annual Business Partners Appreciation Night in December, which is a grand event that is held separately in Luzon and Mindanao, wherein the Company awards outstanding dealers and commercial customers and celebrates the year’s achievements.
Commercial The highly efficient and entrepreneurial culture of the Company has made
commercial sales a foundation of its success. That foundation grew significantly this past year as Commercial Fuel Sales grew by 25% and Lubricants by 11% over the previous year. This growth was largely driven by an increase in the number of commercial accounts being served. The Company acquired prestigious accounts in key economic growth sectors in construction, steel manufacturing, power, shipping, transportation, mining, and agriculture. In Cebu, the Company inked a two-year supply deal with the provincial government to supply diesel and gasoline.
In Mindanao, the Company is already the second biggest commercial fuel
sales provider, with market share of 19%, bringing the Company at par with a
5
global oil company. In Zamboanga Peninsula, the Company is the market leader in the fishing industry.
Lubricants Succeeding in the highly competitive lubricants market is a high priority for
Phoenix and 2012 saw significant expansion of its network for lubricant sales. Total lubricant sales in all trade channels and regions grew by 12% over 2011.
High Street (Distributor) lubes sales, which represent 60% of total lubes sales of the Company, increased by 8% over the previous year.
Phoenix’s Lubricants is now the Top 7th in the industry as of end-2012, with a
total sales volume of 4.26 million liters, which were sold to the Retail, Commercial/Industrial & High Street trade channels.
Among the Company’s products, sales of Phoenix Motorcycle Oils (Cyclomax)
grew by 39% due to sustained brand awareness campaigns nationwide. Phoenix Passenger Car Motor Oils (Accelerate) grew by 44% due to the increase in NTIs nationwide.
In March, the Company rolled out a new product, Accelerate Vega, its first fully
synthetic oil. Accelerate Vega is a premium quality, fully-synthetic, 5W-40 multi grade engine oil formulated to attain the highest level of performance for modern high-operation vehicles. It can match the performance of any of the fully synthetic oil brands in the market today at a more affordable price.
For Company’s distributors, it held its 1st National Lubricants Distributors’
Conference in Clark Field, Pampanga. The three-day conference and teambuilding gathered all the Company’s distributors towards the fulfillment of one team, one mission, one goal.
Delivering seamless logistics Rapid growth in the past year as well as predicted expansion in 2013 required significant, immediate and predictive planning, implementation and commitment to the development of the Phoenix’s logistics, infrastructure, capability, relationships and knowledge. The past year was instrumental and defining in the success of that logistical capability.
Operations, Logistics and Engineering The Company achieved and exceeded target goals in operational startup in new depots, and expanded its storage capacities in Luzon, Visayas, and Mindanao,
6
with special attention to “Greenfields” targets for dealer and retail outlet growth. The Company additionally upgraded supportive facilities and Human Resource capabilities to keep pace with the current growth of business. These infrastructure and HR developments are designed to accommodate predicted growth patterns for both commercial and consumer sales and will assure that growth is not limited by logistical issues. One example is storage capacity. From 164 million liters in 2011, The Company’s total storage capacity in 2012 increased to 226 million liters. These are spread among its three terminals in Calaca, Cagayan de Oro, and Davao, and four depots in Zamboanga, Cebu, Aklan, and Bacolod, which started operating in February. Additional tanks and supporting facilities were constructed in Calaca, Davao, Zamboanga, and Dumaguit, Aklan. In Cebu, the Company transferred operations from Minglanilla to Ludo compound to include Jet-A1 transactions. In Subic, it started commingling operations for ADO and Mogas in November. Customer-specific logistical development is a core strategy of the Company. Since 2005, a customer-specific logistics development strategy has supported its role as the exclusive logistics provider of leading low-cost carrier, Cebu Pacific Airlines, in all its Mindanao destinations. In May 2012, the Company started into-plane services for Cebu Pacific in Butuan.
Lubricant Manufacturing Growth in both commercial and consumer lubricant sales has been and will continue to be a priority. Pursuant to this, the Company has built strategic logistical support through Depot Operations that established lubricant warehousing and distribution capabilities in Cagayan de Oro, Zamboanga, and Calaca, Batangas. This is in addition to the existing Central Warehouse in Caloocan, Davao terminal, Cebu, and Bacolod. Additional logistical activities related to lubricants enabled the Company to expand bulk storage, toll-filling, and laboratory testing capacities. The Company also launched new packaging for 1L and 4L products to further align graphic design with brand strategy.
Our Subsidiaries and Operations The subsidiary companies and the services they provide to the Company have always been a part of its vertical strategy that has allowed it to successfully navigate the future of the deregulated downstream energy business in the Philippines. These subsidiaries and their relationships to the Company have created a symbiotic value creation and growth process for both subsidiary and parent.
7
Phoenix Petroterminals and Industrial Park Corp. (PPIPC) In 2012, PPIPC handled port volume of 875,000MT contributing revenues of P55 million. Phoenix accounted for 59% of total volume and 47% of total revenues, while salt importer Arvin International accounted for 24% of total volume and 33% of total revenues. In compliance with the development plans of the Housing and Land Use Regulatory Board (HLURB) and its commitment to South Luzon Thermal Energy Corporation (“SLTEC”), PPIPC completed the river protection project along the creek in Phases I and II. PPIPC signed an MOU on build-lease arrangement with Natura Mindanao for the purchase of 5,000 sq. m. of industrial land and lease of tanks with capacity of 3 million liters. Natura Mindanao is a fuel additive producer. In January 2013, PPIPC will start construction of material receiving facility in Phase II as logistics support for the operation of SLTEC’s 2 x 135 MW power plant. Construction is expected to be completed within 16 months. In January 2013, PPIPC also signed a Storage Agreement with Philippine Prosperity Chemicals, Inc. (“PPCI”) for the construction of a storage facility inside the Park that can be used by PPCI for the storage of its chemical solvents. Chelsea Shipping Corporation (CSC) In September 2012, Company acquired the entire outstanding capital stock of Chelsea Shipping Corporation from Udenna Management & Resources Corp., making CSC a wholly-owned subsidiary of PPPI. The acquisition ensures control of product supply and minimizes and eliminates potential risk of current and future supply and distribution disruptions due to scarcity of tanker vessels. Incorporated in 2006, CSC currently has 10 vessels in its fleet, two of which serve the regional trade route. The largest Philippine-registered oil tanker, M/T Chelsea Thelma, at 14000 DWT was inaugurated on March 2012. Also in March, CSC marked a milestone of 1 million man-hours without lost time incident. This is managed by Chelsea Ship Management and Marine Services Corp., a wholly-owned subsidiary of CSC, which is engaged in the business of ship management and providing other marine services to vessel owners in line with international standards. In December, CSC became fully compliant with the double bottom - double hull requirements of the Maritime Industry Authority (MARINA) for its entire fleet, with the completion of the dry-docking of M/T Ernesto Uno.
8
Chelsea Shipping has a total fleet size of 19,561 GRT, making it one of the top 5 major petroleum tanker owners in the country. It serves Phoenix Petroleum, Cebu Pacific Air, National Power Corporation, and the US Navy in Subic, among other large companies.
Health, Safety, Security, and Environment: Making safety a way of life The Company aims to build a safety-conscious culture that is deeply engrained and readily apparent in every way a Phoenix employee thinks and performs his or her job in the workplace. It envisions to address occupational health, safety, security, and environmental management issues and concerns and effectively integrate them in the top management’s day-to-day business decision-making processes and strategic planning. The formalization of its HSE policy in 2010 signifies top management’s full commitment in supporting and promoting HSE management programs and initiatives. Its goal is to achieve a zero-accident operation. To attain this, the Company inculcates upon all its employees, safety as a way of life. That it is everyone’s responsibility. Also, the Company provides continuing education and comprehensive training on safe work practices and operational competence. Employees are evaluated on their compliance through HSE audits and reviews. More HSE programs and documents are underway, such as a Safety Orientation Program for New Hires, Work Permitting Program, Accident/Incident Investigation and Reporting System, Emergency Response Organization, Bulk Receiving Operations, Tank Truck Loading Operations, and Tank Truck Delivery Operations. New HSE programs will continue to be developed and written as deemed necessary. The highlights of HSE programs and activities are as follows:
The continued process of attaining a safety culture within the
company premises. The continuing conduct of safety orientations for new employees
and those who have worked continuously for 2 years. Mandatory continuing safety training of forecourt personnel in
service stations. Trainings provided to depot personnel in terms of operational
knowledge in accordance with the company’s ISO certified procedures, fire safety, and response team organization.
Incident reporting made a standard program for all employees to ensure that necessary actions and interventions are taken to preclude similar incidents in the future..

9
The attainment of NO LOST MAN HOURS in the workplace without injury in all depots and terminals and offices.
The setting up of continuing programs such as annual safety inspections, preventive maintenance and defensive driving seminars for company drivers who operate company owned trucks as well as drivers of ex-bodega clients.
Providing depots and terminals with the necessary safety equipment for firefighting, personal protective equipment and other HSE items (Oil Spill Booms, eyewash and shower stations, ETC) in compliance with government requirements and industry practice.
Work permit issuance monitoring and compliance. Review of accreditation/updating requirements of service stations and
depot contractors with the end view of aligning safety requirements and programs vis-a-vis company safety standards.
Setting up of an HSE organization to oversee the implementation of programs in all depots and terminals and the formation of a management heath, safety, and environment committee to provide directions across the organization.
Safety shall remain to be a factor in all business decisions and activities.
Continuing assessments of depots and terminals on their compliance with government requirements.
The implementation of guidelines on safety and how to improve the same in order to maintain high standards of safety awareness and HSE capabilities.
Enabling a strong company
Finance Financial capability and competence has been and continues to be a core strength and differentiator in the Phoenix success story. In 2012 the Company raised a total of ₱4.3 billion in term loans from 12 different lenders, including a $24 million term loan from Maybank Labuan, Malaysia and a ₱2.5 billion corporate note. The ₱4.3 billion is the biggest amount ever raised by the company and likely the biggest ever raised by an independent oil company in a single year. The ₱2.5B corporate note was the biggest single loan ever raised by the company and likely the biggest raised by an independent. In September, the Philippine Rating Services Corp. (Philratings) issued a PRS Aa minus rating for a possible ₱3 billion corporate note – another first for the company and probably the only independent to secure such a rating.
All these were accomplished in a far from ideal situation because of the Bureau of Customs smuggling issue, which was still unresolved at the time. In

10
November, the Company was finally cleared by the Department of Justice (DOJ) of all charges for smuggling and other alleged violations of the Tariff and Customs Code of the Philippines. The DOJ found no unlawful importations based on the records the Company submitted against BOC’s allegations. The DOJ emphasized that Phoenix has fully paid the duties, taxes and fees on the subject importation as evidenced by the Statement of Settlement of Duties and Taxes. They also noted that the BOC failed to show that the subject importations were fraudulently made. The documents submitted to the DOJ, which mostly emanated from the BOC, clearly showed the payment of duties, taxes and fees covering the importations in question and that its subsequent release were regular and above board.
The BPM has both tactical and strategic objectives. The immediate tactical result will be the creation of new, highly efficient, integrated and value-creating processes in the main areas of Sales and Distribution, Materials Management (Supply, Lubes Manufacturing, Inventory), and Finance. Moreover, the BPM project provides a body of strategic information and knowledge that will support corporate strategy development over the next few years. With the new processes, the ERP is being configured to support the new robust processes to improve ways of working of all Phoenix users. The BPM-ERP is targeted for completion in October 2013.
People People and knowledge have been the foundation of the Phoenix success story from the beginning. This past year, the Company grew not only in numbers from 383 staff to 459, but this also added extensively to its knowledge and technical capability especially in the areas of marketing, brand development and logistics to support the Company’s expansion. Four major initiatives were rolled out as part of the Company’s people development and culture-building: the first Team Satisfaction and Communication Survey, Rating the Boss survey, the Online Payroll System, and signing of the Integrity Pledge. The Integrity Pledge, signed by the President and CEO, is part of the Integrity Initiative. A project of the Makati Business Club and European Chamber of Commerce of the Philippines, the Integrity Pledge is a formal and concrete expression of commitment by companies to abide by ethical business practices and to support a national campaign against corruption. Brand of reliability, Vision of indispensability The past 12 months and the next six months will see the Company continuing to build its permanent foundation for the expression of the Phoenix brand. Based on a systematic and independent analysis of what we do, who we are, how we

11
behave, and where we are going, the Phoenix Brand strategy is a permanent building block in the sustainability of our growth and value creation. The past year’s brand development focused heavily on corporate brand, as the Company built the retail outlet and commercial growth that built the critical mass necessary to significantly expand more consumer-targeted brand communications in the next 12 months. Both Philippine and international opinion leaders and strategic relationships were successfully targeted as Phoenix achieved corporate recognition in awards and nominations in markets as diverse as Hong Kong and Singapore. Brand Phoenix is being progressively implemented via an integrated, coordinated and seamless brand strategy across fuels, product brands, retail network, personnel and corporate operations. In 2012 the Company adopted a new corporate vision that defines how it aspires on its relationships with its customers, business partners, shareholders, employees and community. “To be an indispensable partner in the journey of everyone whose life we touch.” This vision lays down the brand expressions across the Phoenix brand platform.
Largely through promotions, events and sponsorships, the past year supported consumer and commercial sales and laid the foundation for an aggressive rollout of the Phoenix Consumer brand for 2013. In April last year the Company launched its TVC “The Locker” featuring Filipino boxing icon Manny Pacquiao, to reinforce the core ad campaign concept of the journey of a Filipino brand based on reliable values. The TVC was recognized with a Bronze at the Araw Values Award. The Company launched the Phoenix Petroleum Unionbank Visa Credit Card, the first co-branded credit card from an independent oil company backed by the global authority of Visa. Credit card holders earn 3% fuel rebate, free P500 worth of fuel voucher when credit card is approved, 10% discount on Phoenix lubricants and services at Phoenix stations, discounts and exclusive perks at partner establishments, no annual fee on the first year, and easy payment term of up to 12 months installment at 0% interest for car insurance. This brand expression literally expands Brand Phoenix beyond the geographic limits of its retail stores onto the personal and financial necessities of its most loyal customers. This brand meaning was further extended through the Company’s Visa partnership by means of the national promo “Phoenix Gas Na, Good As Cash,” from November 2012 to March 2013. Winners will receive a Phoenix Visa Cash Card loaded with P25,000 to P100,000.
12
Brand Phoenix moved further into the market’s pop culture through support of the Metro Manila Film Festival (MMFF), where an intrustion was placed in the family hit, “Si Enteng, Si Agimat at si Ako” starring Vic Sotto, Bong Revilla Jr., and Judy Ann Santos. This continues the Company’s participation in the MMFF, where in 2011 the Company supported the blockbuster “Enteng Ng Ina Mo.” Events Product-focused events provided visibility and highly-targeted brand promotion for Phoenix consumer products with strong emphasis on the very challenging lubricant consumers. To promote Lubricants products, the Company partnered with Suzuki Philippines for the second straight year as co-presenter of their National Motorcycle Drag Race Championship Series. The Company officially engaged the multi-awarded V-Man Racing Team as partners in promoting Cyclomax in motorcycle circuit racing in Vismin, and Moto-X Davao in motocross races all over Mindanao. The Company sponsored national and local car shows to promote the new Phoenix Accelerate Vega fully synthetic gasoline engine oil. We also held the 2nd Phoenix CyclomaxMotocyclo in CamSur and Phoenix Motocross in Davao. The Company presented the popular Trans Sport Show at SM Megamall in April. In Davao City, the annual Araw ng Dabaw Phoenix Run in March and Kadayawan Phoenix Run in August were participated by thousands of runners. The Phoenix Open golf tournament and Trip Ko Phoenix Fuels Basketball Cup for under-16 also successfully promoted the company and our products. Major Capital Expenditures The following major projects were completed and/or on-going as of end December 2012:
On-going 4th phase of Calaca Installation Expansion Completion of Bacolod City Depot Completion of the construction of AklanDepot Rehabilitation of a leased depot facility in Cebu On-going 5th Phase of Davao Installation Expansion On-going expansion in Zamboanga Depot 80 Retail Stations completed and additional 43 on-going construction
of Phoenix Service Stations in various sites in the country. The Mega-Station in Davao was inaugurated on December 08, 2012 as the 300th station
On-going construction of Company corporate headquarters in Davao Acquisition of 14,000 Metric Ton Dead Weight Marine Tanker Double Hulling of three (3) vessels Acquisition of additional fleet of tankers
13
Other Significant Operational Highlights In an unceasing effort to improve its operations, the Company embarked on two major efficiency-enhancing programs. Quality Management Systems
On February 1, 2008, the Company received its accreditation from Bureau Veritas for ISO 9001: 2000 accreditation. ISO 9000 is a family of standards for quality management systems. The scope of the quality system, intended for its Davao bulk plant and aviation fuel tank truck operations, included “Receiving, Storage and Distribution of Petroleum Fuels”. In the last quarter of 2008, audit for ISO process were done and the Company was evaluated to be compliant. Subsequently, in yearly audit and re-certification, the Parent Company outstandingly and consistently pass the said accreditation. Other ISO Certifications received as follows: ISO 9001:2008
Bacolod and Cagayan de Oro facility is now on the stage 2 of the accreditation.
Information Technology In November 2008, the Company entered into an agreement with Fasttrack Solutions, Inc. to expand its existing system SAP-Business One (SBO) (Systems Applications and Products in Data Processing) capabilities to handle transactions of new Business Units as the Company continues to expand its area of operations. This SAP System was initially rolled out by the Company last July
Location Scope Date issued
Davao Terminal
Receiving, Storage and Distribution of Petroleum Fuels and Into Plane Refuelling Service
Nov. 6, 2012
Calaca Terminal
Receiving, Storage and Distribution of Petroleum Fuels.
Jul 10, 2010
Zamboanga Depot
Receiving, Storage and Distribution of Petroleum Products and Into Plane Services
Nov 10, 2011
14
2007 as an integrated computer system automating its transaction processing from the time products are procured until they are delivered to clients. The system covers procurement management, billing management, inventory management and financial reporting system. In 2009, the Parent Company, through the assistance of Fasttrack also updated its SBO to later version and patch. This system is further enhanced and upgraded to newer patch and higher capacity in 2010 and 2011 to accommodate the growing requirements of the Company. In 2012, this is further improved by consolidating the data base for better reporting. The aforementioned enhancement of system includes training of key SAP users support personnel on advance SAP application, report design and other useful processes. Other Information technology updates and initiatives to include:
1. Applications
a. Retail POS and BOS i. Launched new POS and BOS standard for Phoenix Retail
Sites ii. Rollout for Luzon commenced in 2011, rollout for
Mindanao/Visayas in 2012 iii. Improves customer experience (faster transaction
turnover) iv. Improves dealer (Phoenix partner) control over fuel
management
2. Security – Installation of CCTV System in Davao and Zamboanga
3. Implemented of Audio and Video Conferencing facility between Davao Head office and Fort Bonifactio, Taguig Corporate Office
4. Voice and Data connectivity upgrades for various locations. This is to include tele-conferencing (Audio-Video):
a. Calaca, Batangas Installation b. Davao City Installation & Head Office c. Caloocan City Warehouse d. Zamboanga City Depot and Office e. General Santos City Office f. Fort Bonifacio, Taguig, g. Bacolod City Depot & Office h. Cagayan de Oro City Installation and Office
• Improved communication both for voice and data • Allow the Company better access to ERP • Upgrade of Head Office Davao and Manila Office telecom links to
20MB

15
• Conversion of internet access in both Davao and Manila offices to direct links at 5MBps and 4MBps respectively
• Instalation of on line telecom links to new depots in Bacolod and Cebu
• Begun backup telecom link initiative in 2012 – started with Manila office at 2MBps (Bayantel) and to be completed by Q2 2013 for all sites to improve telecom link reliability to 99.2%.
• Upgraded voice links to Avaya PABX in Mar 2012
– DRP for ERP
• Improved its DRP from cold to hot (full and instant backup) • Provided alternative site in case of full destruction of main server • Provided full Hot DRP for Chelsea main system (May 2012) • Streamlined databases for current ERP – SBO (Oct 2012) • Kicked off new Business Process Mapping (BPM) and new ERP
Implementation in Sep 2012. We will be going live with new processes and new SAP A1 (IS Oil) ERP in Oct 2013.
Setting up of a separate data base for every depot facility in compliance with the reporting requirements of the Board of Investments (BOI)
5. Company-wide Software Inventory to ensure compliance with
Intellectual Property Rights Policies. This initiative continues and ensures our software remains robust (with guaranteed updates) and supported by various solution providers.
6. Embarked in the development of a more advance ERP, the SAP A1. The
new ERP is expected to be rolled-out 4th quarter of 2013. This will cater to the growing need of the Company for a more real-time and sophisticated reliable reporting tool.
EXTERNAL AND CORPORATE AFFAIRS As part of the Company’s commitment to uphold best practices in corporate affairs and social responsibility, the Company through its External and Corporate Affairs Department has remained committed to maintain a good and productive relationship with its stakeholders in the communities where the Company operates. The Company sees to it that its various operational sites all over the country are legally compliant with all permitting and licensing requirements of the national and local government units. The Company engages in regular consultations in communities, where it operates and where it intends to operate in the future. It discloses as part of its transparency program, information about its present activities and future plans
16
and seeks feedback regarding its performance. It aims to contribute to the social and economic development of the areas where it operates. The Company intends to implement a sustainable and culturally acceptable business programs in consultation with stakeholders and in cooperation with the local government units. Building literacy and women empowerment shall be key priorities of the Company in community development.. The Company continues to pursue better media relationship through business-media dialogues, meetings and media fora. The Company will continue to make announcements through press releases and printing of articles, research, annual reports. Being a very busy and challenging year, the Company was very prominent in 2012 in public coverage as it was conspicuously present in television, radio, print, and internet where all major achievements of the Company like the disclosures, quarterly reports, annual reports, station openings and inaugurations notably the 300th Station in Davao City, the 5th PSE Listing Anniversary, Business Partners Night and the Phoenix Open, and a host of other major activities were published in national broadsheets and local dailies. The Company spearheaded various corporate social responsibility projects and activities aimed to help create awareness in the preservation and protection of the environment, to support and strengthen education specially the youth sector, and to provide community service. In coordination with the Phoenix Philippines Foundation, some of these projects were the organization of Disaster Relief Operations in Davao Oriental, Davao City and Compostela Valley Provinces to alleviate the plight of residents whose houses and belongings were destroyed by typhoon Pablo. Aside from relief efforts, the Company also established libraries and provided books to 28 public schools in the Visayas and Mindanao and continued to provide assistance to its 3 adopted schools in Davao as part of its educational programs. The Company also planted thousands of seedlings and dispersed thousands of fingerlings all over Mindanao and Visayas to support the preservation efforts and providing care to our only environment. It has likewise assured financial support to the endangered Philippine Eagle for the next 5 years as it participated in the Adopt-An-Eagle Program of the Philippine Eagle Foundation. In valuing life, the Company has undertaken numerous blood-letting activities in coordination with the Philippine National Red Cross, conducted medical and dental missions in various provinces, and has sponsored the heart operation of a 7-year old girl to treat her congenital heart disease.
17
Corporate Social Responsibility
The Phoenix Petroleum Philippines Foundation: Partners in community-building Phoenix Philippines Foundation (PNX Foundation) remains steadfast in its commitment to serve the community as an indispensable partner. In line with the national growth of Phoenix, in 2012, the foundation expanded its programs in education, environment, health and safety, and outreach to serve more people in more communities across the nation. In addition to the Company’s support for disaster relief and direct CSR projects, in 2012 the Company took steps to institutionalize its national contribution to CSR and nation building. It accepted the offer to become a member of the Philippine Business for Social Progress (PBSP), the country’s largest corporate-led social development foundation. PBSP has directly extended benefit to over 5 million Filipinos and assisted over 6,400 social development projects through more than P7.6 billion in grants and development loans. The Company hopes to expand its CSR involvement by partnering with other PBSP member companies for greater impact in community service. For its direct CSR programs, the Company continues and expands its on-going projects: Education Under the Company’s Adopt-a-School program in Davao City, 401 students graduated from kindergarten from three of the Company’s adopted schools in 2012. The Phoenix Livelihood Training Program, which offers free classes on welding, electronics, electricity, hair science, and Sunday high school, produced 179 graduates. The foundation distributed P310,000 worth of elementary books to 28 public schools in Mindanao and Visayas. Its “Phoenix Libraries” in public schools in Davao, Zamboanga, and Aklan now total seven, with two new ones in Davao City. In support of the Poverty Alleviation Program under the newly-implemented K-12 system, the Company turned-over to the Department of Education (DepEd) in Davao Region 1,170 Nail Care Training Kits for 23 public high schools. The Company also joined the Brigada Eskwela annual clean-up project in its three adopted schools, and in five more schools in partnership with GMA Network. The Company donated 160 gallons of paint to the Care for School Chairs Program of Tagum City. The program benefits public schools and hospitals nationwide by donating school chairs, blackboards, hospital beds, and cabinets. The furniture are made from confiscated illegal logs and are fabricated by the local government.
18
Environment In 2012 the Company adopted a Philippine Eagle, for five years. This is in support of the Philippine Eagle Foundation’s wildlife conservation program to preserve the eagle’s population threatened with extinction. Under the adoption program, the Company will grant an annual cash donation of P125,000 to be used to take care of the needs of the eagle, the operation and maintenance of the eagle’s breeding facility, and the associated conservation research and campaigns of PEF. The adopted bird, the ‘Phoenix Eagle,’ is a 15-year-old male eagle that arrived in 2005 from Sultan Kudarat. The eagle had been shot, but with care gradually recovered. Aside from the Eagle adoption, the Company continued with its annual tree-planting and fish dispersal programs. It planted 10,000 seedlings and dispersed 5,000 tilapia fingerlings at its adopted riverbank at Davao River. Phoenix staff and volunteers from other organizations planted 5,000 narra and acacia seedlings as part of the Kadayawan Phoenix Run, where the Company pledged to plant one tree for every runner. Team Phoenix and Chelsea Shipping also planted narra and fire trees in Batangas. In Batangas and Davao, the Company organized a coastal cleanup with Team Phoenix, barangay officials, and students, parents, and teachers of its adopted schools. The Foundation conducted the Sea of Life Project and released 50 artificial domes at the Island Garden City of Samal in Davao, in partnership with JCI Manila and JCI Davao. The Company is also a signatory to the Davao Gulf Oil Spill Contingency Plan to prevent pollution in the Davao Gulf. At the Phoenix Petroterminal and Industrial Park in Calaca, Batangas where it has a hatchery, the Company’s Pawikan Conservation Program continues to protect the endangered marine turtles. In 2012, 22 adult turtles were tagged and released to the open sea. The Company’s assistance and incentive program rewards fisherfolks who turn over sea turtles. The Company is working with the Protected Areas and Wildlife Bureau of the Department of Environment and Natural Resources to establish a satellite hatchery in Nonong Casto, Lemery, Batangas. A series of lectures, trainings and workshops on Pawikan Conservation will be shared to the coastal residents of Nonong Casto on the first quarter of 2013 to enable them to manage the conservation activities of the project. Health and Safety

19
In 2012, the Company’s second heart patient at the Mindanao Heart Center was successfully operated on. This is part of our support to the Dr. Gerry Cunanan Mindanao Heart Fund at the Davao Medical Center, which aims to help poor children with heart disease whose families cannot afford the expensive operation. Its first patient in 2010 is now back in school. The second patient, Melody Managta from Calinan, Davao City, underwent a successful open heart surgery to treat her congenital heart disease. . Now a healthy 8-year-old, Melody is preparing to go back to school in June 2013. The Company, through its Foundation, extended its healthcare support by adopting the Children’s Ward and a Phoenix Children’s Reading and Play Corner at the Southern Philippines Medical Center. The Company conducted four medical, dental, and surgical missions in General Santos, Tagum, Bacolod, and Compostela Valley, serving a total of 2,865 beneficiaries. In partnership with the Philippine Red Cross, the Company organized seven bloodletting activities in Mindanao, collecting a total of 518 bags or 217,560 cc of fresh blood. As part of the Company’s own road safety advocacy and that of the Philippine National Police, we turned over 200 pieces of reflectorized motorcycle vests to the Davao City Police Office. Outreach In the wake of typhoon Pablo that destroyed towns in Compostela Valley and Davao Oriental in December, it immediately organized disaster relief operations. In four batches, The Company gave P850,000 worth of goods, together with our partner organizations. The Company’s annual Christmas Gift-Giving for Kids in Davao City made the season a more joyous one for 35 cancer patients at the House of Hope and 300 children in Bo. Obrero. Business The Company was adjudged as the Best Independent Oil Company in Asia by World Finance magazine in its 2012 Oil & Gas Awards. The annual Awards is given “in recognition of those companies that have successfully weathered the tough economic conditions while ensuring the continuing success of the industry.” The London-based magazine cited the awardees “for their forward thinking, business acumen, and services to the oil and gas industry.”
Top 7 Importer in the Philippines, awarded by the Bureau of Customs, for paying a total of P4.733 billion in import taxes to the government. Phoenix Petroleum became the fourth biggest importer, after the major companies. In 2011, Phoenix was also the Top 7 Importer, paying P3.69 billion in duties and taxes.

20
No. 1 Importer in the Port of Davao City, awarded by the Bureau of
Customs. Phoenix Petroleum paid P1.28 billion in duties and taxes for CY 2012. This is the second consecutive year for the Company as Top Importer / Taxpayer in Davao.
Top 10 Importer in the Port of Cagayan de Oro for CY 2012
Top 10 Importer in the Port of Batangas for 2011
Top 2 Taxpayer in the City of Cebu among Supplier of Goods and
Services for CY 2011
Management President/CEO and founder, Dennis A. Uy had its share of awards and recognition in 2012 for the work he has done with the Company. Among which were as follows:
Nominated and became a finalist in the 11th Asia Business Leaders Award (ABLA) sponsored by CNBC Asia. This was the second consecutive year that Mr. Uy was recognized by ABLA.
Nominated and became a finalist in the Entrepreneur of the Year for 2012 sponsored and organized by Ernst & Young.
Finalist in the 4th Asia Pacific Young Entrepreneur Award
sponsored by the Confederation of Asia-Pacific Chambers of Commerce and Industry (CACCI) held in Kathmandu, Nepal.
Finance The Company was likewise cited as one of the best managed small-cap companies in the Philippines by Finance Asia, a Hongkong-based magazine which polled 256 investors and analysts across Asia. Finance Asia is Asia’s leading financial publishing company, covering the region’s capital and banking markets. Sales On _____, BPI Family Bank recognized the Company as one of Best Franchise Brands in the country. Their “Ka-Negosyo” best list is their seal of approval on franchise brands that observe superior financial soundness, strong technical and marketing support for its franchisees, and transparency in business practice. Brand
21
The Company on _________ bagged the Bronze Award for its TV Commercial advertisement entitled “Locker” at the Araw Valued Award – that recognizes values-oriented brand communications and advocacy advertising. Communication Finalist citation from the Philippine Quill Awards was given to the Company for its SOAR magazine. The Philippine Quill honors the best in communication management, skills, and creativity. It is conferred by the International Association of Business Communicators (IABC) Philippine chapter. Sports Sports Leadership Award given to President/CEO Dennis Uy by the So Kim Cheng Foundation and Davao City Sports Council for his “outstanding leadership in organizing various sports events in Davao City and in Region XI and for unselfishly supporting local sports and athletes”
2. Business of Issuer i) Principal’s products or services and the Company’s market and
distribution method: The Company’s core businesses are: the trading of refined petroleum products, lubricants and other chemical products on a wholesale basis nationwide and the operation of oil depots and storage facilities, allied services and shipping. The Company’s ultimate markets are motorists, companies using petroleum products and lubricants as well as airline companies in need of specialized services. It mainly sells refined petroleum products through its network of retail service stations, carrying the “Phoenix Fuels Life” brand name. Its retail service stations started in the Davao Regions in 2005 and soon spread out around Southern Mindanao thereafter. Starting 2008, the Company expanded its retail business in neighboring provinces, then into Luzon and the Visayas. The Company also directly serves commercial and industrial accounts. The Company also distributes lubricants and chemicals. The Company produced its own blend of lubricants variety and sells these under the Phoenix brand name such as Cyclomax, a motorcycle oil brand. The Company provides storage space for the Jet A-1 fuel supply of Cebu Pacific Airlines (CPA) for the latter’s requirements for their Davao, Cagayan de Oro, Cotabato, General Santos, Zamboanga City, Pagadian City and Ozamis City flights. The Company is the exclusive service provider for CPA in all its Mindanao Operations.

22
ii) Percentage distribution of sales or revenues:
On 2012, the Company attained a Total Revenue of P34.6 billion which P34 billion or 97.50% was accounted for by the sales of petroleum products, P352 million for Lubricants , and P505 million was accounted for by Charter Hire (Shipping), fuel service, storage income and other income. iii) Other products or services:
In addition to its lubricant lines, the Company continues to promote and sell car care products into the market such as car fresheners, tire black, and others. In response to the automotive market’s demand for better oil formulation for Heavy Duty Engine Oil, the Company launched Zoelo Extreme, a high-quality shear-stable diesel engine oil, with better formulation and packaged in a new label design. This formulation meets API CI-4/SL standard that offers superior quality and heavy duty engine performance among SAE 15w-40 Multi-grade engine oils. This variant is also suitable for mixed fleet of diesel and gasoline engines.
iv) Competition:
The Company’s main competitors are the major players in the downstream oil industry namely, Petron, Shell and Chevron, other multi-national industry players such as Total (of France), PTT (of Thailand) and other independent local players like Unioil, Seaoil Flying V and Jetti among others. The three major players are estimated by the Department of Energy (DOE) to have a cumulative market share of 68.1% of the total Philippine market as of June 30, 2012 while the balance of 31.9% is shared among the aforementioned multi-national players and the independent players. Total cornered around 3.4%, PTT about 1.4% while the remaining balance of 27.1% is shared by the independent players which includes the Company. The Company estimated to have a share of 6% of the total Philippine market and about 18.12% for the total Mindanao market. It should be noted that the Company competes with other players in the industry in terms of pricing, quality of service and products, and strategic locations of its service station retail network.
v) Sources and availability products and principal suppliers
From the start of its operation in 2005 until the first half of year 2009, the Company procured its petroleum products within the Philippines. Its main suppliers are PTT Philippines Corporation as the well as Total Philippines Corporation. With the growth in volume and the availability of the storage capacities in Calaca, Batangas and the Davao expansion, the Company started importing refined petroleum products by September 2009 until the present from Singapore and Taiwan. The Company also sources products
23
from Thailand, Korea and China through various foreign traders and suppliers. The Company continues to import some of its lubricants from Singapore.
vi) Transactions with and/or dependence on related parties. The Company has existing synergies with related companies as follows:
UDENNA Corporation.
Lease of properties from UDENNNA Corporation which are identified under Leased Properties;
Chelsea Shipping Corporation (CSC).
The Company has existing Contracts of Affreightment with CSC to haul the Company’s petroleum supplies. CSC serves other clients including but not limited to Cebu Pacific Airways, Marine Fuels and other petroleum companies. The Company recently acquired CSC last September 2012.
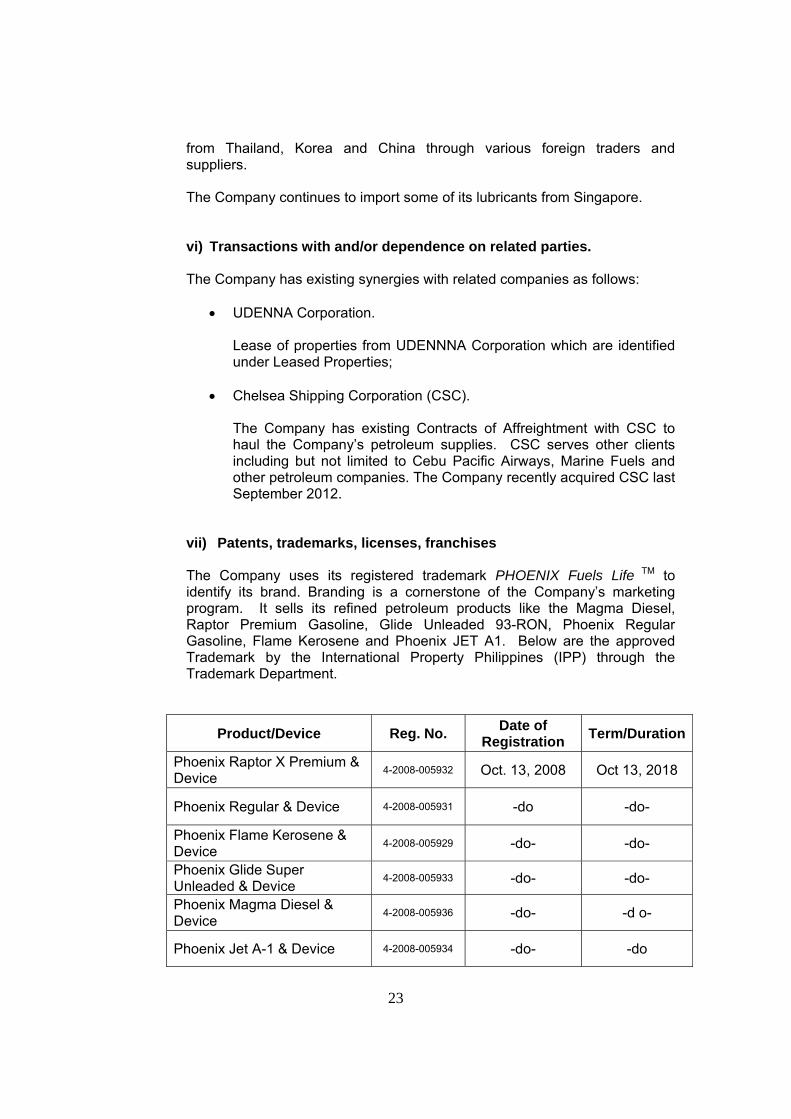
vii) Patents, trademarks, licenses, franchises
The Company uses its registered trademark PHOENIX Fuels Life TM to identify its brand. Branding is a cornerstone of the Company’s marketing program. It sells its refined petroleum products like the Magma Diesel, Raptor Premium Gasoline, Glide Unleaded 93-RON, Phoenix Regular Gasoline, Flame Kerosene and Phoenix JET A1. Below are the approved Trademark by the International Property Philippines (IPP) through the Trademark Department.
Product/Device Reg. No. Date of
Registration Term/Duration
Phoenix Raptor X Premium & Device
4-2008-005932 Oct. 13, 2008 Oct 13, 2018
Phoenix Regular & Device 4-2008-005931 -do -do-
Phoenix Flame Kerosene & Device
4-2008-005929 -do- -do-
Phoenix Glide Super Unleaded & Device
4-2008-005933 -do- -do-
Phoenix Magma Diesel & Device
4-2008-005936 -do- -d o-
Phoenix Jet A-1 & Device 4-2008-005934 -do- -do
24
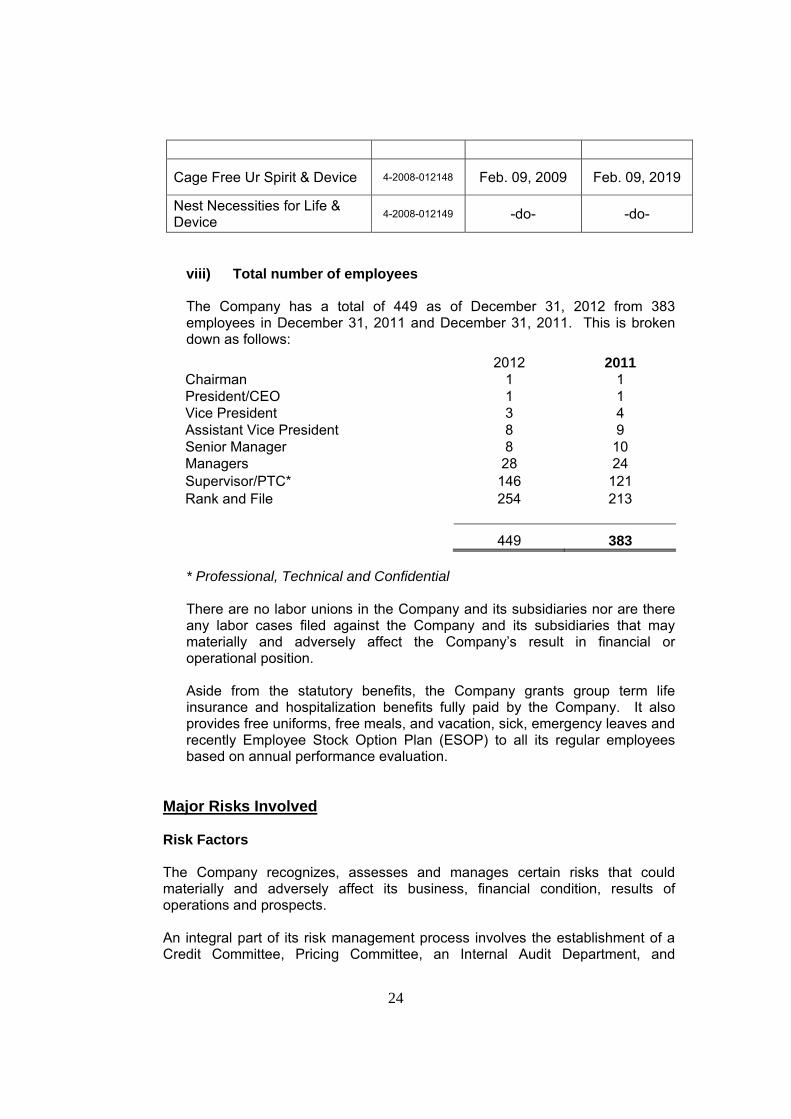
Cage Free Ur Spirit & Device 4-2008-012148 Feb. 09, 2009 Feb. 09, 2019
Nest Necessities for Life & Device
4-2008-012149 -do- -do-
viii) Total number of employees
The Company has a total of 449 as of December 31, 2012 from 383 employees in December 31, 2011 and December 31, 2011. This is broken down as follows:
2012 2011 Chairman 1 1 President/CEO 1 1 Vice President 3 4 Assistant Vice President 8 9 Senior Manager 8 10 Managers 28 24 Supervisor/PTC* 146 121 Rank and File 254 213
449 383 * Professional, Technical and Confidential
There are no labor unions in the Company and its subsidiaries nor are there any labor cases filed against the Company and its subsidiaries that may materially and adversely affect the Company’s result in financial or operational position. Aside from the statutory benefits, the Company grants group term life insurance and hospitalization benefits fully paid by the Company. It also provides free uniforms, free meals, and vacation, sick, emergency leaves and recently Employee Stock Option Plan (ESOP) to all its regular employees based on annual performance evaluation.
Major Risks Involved Risk Factors The Company recognizes, assesses and manages certain risks that could materially and adversely affect its business, financial condition, results of operations and prospects. An integral part of its risk management process involves the establishment of a Credit Committee, Pricing Committee, an Internal Audit Department, and

25
organization of special teams to conduct financial analysis, planning and evaluation of company projects/plans and other business activities. Monthly Business Unit reviews are conducted to identify risks, threats and opportunities, and to ensure that concerned units manage or promptly address identified risks. Major Risks
The Company manages the following major risks relative to its business, industry and area of operations:
Volatility of Prices of Fuels.
Oil prices, which have been and are expected to continue to be volatile and subject to a variety of factors beyond the Company’s control could affect the Company’s profitability, liquidity and sales volume.
Intense Competition.
Competitive pressures from the majors and all other independent/new players could lead to a possible loss of market share or a decrease in prices, either of which could result in decreased revenues and profits. The Company’s competitors are numerous, ranging from large multinational corporations, which have significantly greater capital resources, to relatively small and specialized regional companies.
Material Disruptions in the Availability or Supply of Fuel.
As a trading concern, the Company largely depends on its ability to find stable sources of supply of fuel oil, diesel oil and blend components to assure uninterrupted supply of requirements of its customers. Some of its fuel purchases are negotiated transactions with suppliers offering fuel for immediate or near term delivery, also known as the spot market. In times of extreme market demand or other supply disruptions, there may be possibility of having limited supply to fully satisfy requirements of customers or of having to buy at higher prices in order to meet customer demand.
Reliance on Third Parties to Fulfill their Obligations on a Timely Basis.
The Company, at certain levels, depends on some third party providers for various aspects of its business. As such, it runs the risk that suppliers and service providers may fail to honor their contractual obligations. The Company relies on suppliers of fuel to regularly provide it with its inventory. Shipping companies and charter tankers are contracted to transport fuel oil, diesel oil and blend components from suppliers’ facilities to service centers. The failure of these third parties to fulfill their obligations or to perform the services they have agreed to provide could affect the Company’s relationships with its customers or may lead to its not being able to honor its own contractual obligations to other parties.
26
Regulatory Risk.
Risk can arise from changes in government policies and regulations that may limit the Company’s ability to do business or require it to incur substantial additional costs or otherwise materially adversely affect business, results of operation or financial condition.
Risk Management and Mitigants Volatility of the price of crude oil may have an adverse effect on the Company’s business, results of operations and financial condition. The Company’s financial results are primarily affected by the difference between the price and cost of its petroleum products, which accounts for more than 99% of the Company’s total cost of goods sold. A number of domestic and international factors influence the price of petroleum products, including but not limited to the changes in supply and demand for crude oil, economic conditions, conflicts or acts of terrorism, weather conditions, and governmental regulation. International crude oil prices have been volatile, and are likely to continue being volatile going forward. International crude oil prices were especially volatile in 2008. Demand for oil started to decline and oil prices followed shortly after. Dubai spot crude oil reached a record-high of US$141/bbl1 in July 2008 and went down to under US$37/bbl in December 2008. Crude oil prices have recently hit US$100/bbl in 2011 following uprisings and political tension in the Arab and North African States. Such unrest may spread to neighboring countries that may result to additional oil supply disruptions. Oil prices may be adversely affected. There is no assurance that prices will remain stable over the near- and medium- term. Phoenix holds about twenty (20) to forty five (45) days of inventory and uses the average method to account for its inventory. Should crude oil prices suddenly drop significantly, this could adversely affect the Company which could translate into the Company being forced to sell its petroleum products at a selling price below acquisition costs of its existing inventory. In a period of rising crude oil prices, social and competitive concerns, and government intervention can further force the Company to keep current selling prices, resulting in an inability to pass on price fluctuations in a timely manner. The Government has previously intervened to restrict price increases for petroleum products, following a declaration of a state of national calamity by former President Gloria Macapagal-Arroyo after typhoons “Ondoy” and “Pepeng” left a trail of disaster. Another declaration of a state of national calamity may result in the Company being unable to pass on prices effectively which could adversely affect the profitability for the period of effect of the order. Such inability to pass on price fluctuations may result to an adverse effect on the Company’s business, results of operations and financial condition. Demand for the Company’s products may also be affected as a result of price increases, following passing on of the increased costs of imported oil.
27
A sharp rise in oil prices will require higher working capital and may force the Company to acquire higher financing costs. A material adverse effect on the Company’s financial condition and results of operations may follow should the Company face challenges in securing short-term financing for working capital. To mitigate this risk, the Company closely monitors the prices of fuel in the international and domestic markets. Following industry practice, prices for the upcoming week are set based on the world market price of fuel of the immediately preceding week. These enable the Company not only to anticipate any significant price movement but likewise plan out contingencies to hasten the disposition of its existing inventory as necessary to various distributors and other clients. The Company’s business, financial condition and results of operations may be adversely affected by intense competition. The Company faces intense multinational, national, regional and local competition in the sale of refined petroleum products and other related products in the Philippines. Competition is driven and dictated primarily by the price, as oil is one of the basic commodities. Differences in product specifications, and other overhead costs such as transportation, distribution and marketing costs, account for the price differentials amongst industry players. Some competitors, notably Petron, Shell and Chevron, have significantly greater financial and operating resources, and access to capital than Phoenix, and could arguably dictate domestic marketing and selling conditions to the detriment of the Company. As competition is mainly driven by price, the Company’s business, operational and financial condition may be materially adversely affected if it is unable to compete effectively against other players, which will be primarily driven by its ability to manage overhead costs, streamline transportation and distribution costs, and maximize utilization of its assets. Smuggling and illegal trading activities of petroleum products have affected the domestic petroleum market. These activities have translated to lower sales price and volumes for legitimate market players in the domestic market. The Company’s financial condition and results of operations may be adversely affected if the Government is unable to properly enforce and regulate the domestic oil market. Competition risk is primarily mitigated by the Company continually strengthening and expanding its distribution network to improve its presence in both growing and high potential markets. The Company continues to invest in building brand equity to ensure that it is consistently recognized and recalled by its target market, and improving customer service to a level at par with or superior to its competitors. The growth of the Company is dependent on the successful execution of its expansion plans.

28
Proper execution and successful implementation of the Company’s expansion plans is critical to maintain the growth of Phoenix going forward. These plans are based on certain assumptions about oil demand, oil prices, competition, financing cost and acquiring the necessary timely regulatory approvals, among other things. The Company cannot and does not represent with absolute certainty that these assumptions would materialize as predicted. In the event that these prove to be incorrect, the Company’s future financial performance may be negatively affected. To mitigate this risk, the Company continually reviews its network expansion program by identifying and anticipating target locations, qualifying dealers and operating and logistical requirements up to a year in advance. The Company is able to mobilize financial and operating resources in a timely manner and allocate resources effectively to support the Company’s expansion plans. The Company’s business strategies require significant capital expenditures and financing, which are subject to a number of risks and uncertainties. Its financial condition and results of operations may be adversely affected by its debt levels. The Company’s business is capital intensive, particularly the importation, storage and distribution of petroleum products. The Company’s financial condition, sales, net income and cash flows, will depend on its capital expenditures for, among others, the construction of storage and wholesale distribution facilities and equipment, the construction of retail gas stations and the acquisition of tanker trucks. Its business strategies involve the construction of new terminal facilities and the expansion of its service station networks. If the Company fails to complete its capital expenditure projects on time or at all or within the allotted budget, or to operate such facilities at their designed capacity, it may be unable to maintain and increase its sales and profits or to capture additional market share as planned, and its business, results of operations and financial conditions could be adversely affected. The Company has incurred additional indebtedness to support its capital expenditure program. The Company’s ability to follow this program and meet its debt obligations will partly depend on the business’ ability to generate cash flows from its operations and obtain additional financing. There can be no assurance that the Company will be able to generate sufficient cash flows from its operations or obtain adequate financing for its capital expenditure projects or to meet its debt servicing obligations, on acceptable terms or at all. The inability of the Company to meet its capital expenditure program whether through unsuccessful implementation or insufficient funding could adversely affect its business, financial condition and results of operations. Financing risk is mitigated as the Company follows a conservative financing strategy to optimize its leverage and ensure that the costs of financing are well within the Company’s ability to meet these costs. The Notes issuance is an important part of this financing strategy, as it provides the Company the funding to support its medium term expansion and capital expenditure plans.

29
Any significant disruption in operations or casualty loss at the Company’s storage and distribution facilities could adversely affect its business and results of operations and result in potential liabilities. The Company’s operation of its storage and terminal facilities and retail gasoline stations could be adversely affected by several factors, including but not limited to equipment failure and breakdown, accidents, power interruption, human error, natural disasters and other unforeseen incidents and issues. These disruptions could result in product run-outs, facility shutdown, equipment repair or replacement, increased insurance costs, personal injuries, loss of life and/or unplanned inventory build-up, all of which could have a material adverse effect on the business, results of operations and financial condition of the Company. Company has purchased insurance policies covering majority of foreseeable risks but do not cover all potential losses as insurance may not be available for all such risks or on commercially reasonable terms. Operational disruptions may occur going forward, and as such, insurance may not be able to adequately cover the entire scope or extent of the losses or other financial impact on the Company. Phoenix aims to mitigate this risk by following best practices to prevent the occurrence of or minimize the impact of accidents or other untoward incidents. These include measures to isolate the physical effects of any incidents (for example, the dispersed locations of its storage depots, alternative storage arrangements), minimize their financial impact on the Company (by ensuring that insurance coverage is adequate) and prevent their occurrence (for example, by ensuring that maintenance and safety procedures follow ISO standards and maintaining an adequate security force). Continued compliance with safety, health, environmental and zoning laws and regulations may adversely affect the Company’s results of operations and financial condition. The operations of the Company’s business are subject to a number of national and local laws and regulations, including safety, health, environmental and zoning laws and regulations. These laws and regulations impose controls on air and water discharges, storage, handling, discharge and disposal of waste, location of storage facilities, and other aspects of the operations of the Company’s business. Financial penalties, administrative, legal proceedings against the Company, or revocation or suspension of the Company’s licenses or operation of its facilities may arise should the Company fail to comply with relevant laws and regulations. The Company has incurred, and expects to continue to incur, operating costs to comply with such laws and regulations. In addition, the Company has made and expects to continue to make capital expenditures on an ongoing basis to comply with safety, health, environmental and zoning laws and regulations.
30
There can be no assurance that the Company will be in compliance with all applicable laws and regulations or will not become involved in future litigation or other proceedings or be held responsible in any future litigation or proceedings relating to safety, health, environmental and zoning matters, the costs of which could be material. Safety, health, environmental and zoning laws and regulations in the Philippines are becoming more and more stringent over the years. There can be no assurance that the adoption of new safety, health, environmental and zoning laws and regulations, new interpretations of existing laws, increased governmental enforcement of safety, health, environmental and zoning laws or other developments in the future will not result in the Company being subject to fines and penalties or having to incur additional capital expenditures or operating expenses to upgrade or relocate its facilities. To mitigate this risk, the Company keeps itself updated on government policies and regulations pertaining to the oil industry. Through its Corporate Affairs department, the Company maintains lines of communication with regulatory agencies to allow Phoenix to identify potential regulatory risks and proactively respond to these risks. Regulatory decisions and changes in the legal and regulatory environment could increase the Company’s operating costs and adversely affects its business, results of operations and financial condition. Even though the local downstream oil industry is a deregulated industry, the Government has historically intervened to limit and restrict increases in the prices of petroleum products. On October 2, 2009, a state of national calamity in view of the devastation caused by typhoons “Ondoy” and “Pepeng” was called by former President Gloria Macapagal-Arroyo. Executive Order 839 was issued which called for the prices of petroleum products in Luzon to be kept at October 15, 2009 levels effective October 23, 2009. As a result of the Executive Order, prices of oil products were kept at said levels by the Company, affecting its profitability in Luzon for the period the executive order was in effect. On November 16, 2009, the price freeze was lifted. There is no assurance that the Government will not invoke similar measures or reinstate price regulation in the future, which may adversely affect the Company’s results of operations. The Company’s operations are subject to various taxes, duties and tariffs. The Oil industry in the Philippines has experienced some key changes in its tax and duty structure. Import duties for crude oil and petroleum products were increased in January 1, 2005 from 3% to 5% which was then rolled back to 3%. In 2006, an additional 12% VAT was imposed by the Government on the sale or importation of petroleum products. As of July 4, 2010, import duties on crude oil and petroleum products were lifted. Such taxes, duties and tariffs may or may not change going forward, that could result to a material and adverse affect on the Company’s business, financial condition and results of operations. As indicated in the previous item, the Company has a group dedicated to monitor compliance with regulations as well as anticipate any new regulations that may be implemented by the authorities. This ensures that any additional costs resulting from changes in the legal and regulatory environment can be anticipated and prepared for by the Company.

31
The Company’s business, and financial condition may be adversely impacted by the fluctuations in the value of the Philippine Peso against the U.S. dollar. The Company’s revenues are denominated in PHP while a bulk of its expenses, notably the cost of its imported petroleum products, is US$-denominated. In 2012, 91% of the Company’s revenues were denominated in PHP, while approximately 95% of its cost of goods sold was denominated in US$. The Company’s reporting currency in its financial statements is the PHP. Changes in the US$:PHP exchange rate may adversely affect the financial condition of the Company. Should the PHP depreciate, this would translate to higher foreign currency denominated costs and effectively affecting the Company’s financial conditions. There can be no assurance that the Company could increase its Peso-denominated product prices to offset increases in its cost of goods sold or other costs resulting from any depreciation of the Peso. There can be no assurance that the value of the Peso will not decline or continue to fluctuate significantly against the U.S. dollar and any significant future depreciation of the Peso could have a material adverse effect on the Company’s margins, results of operations and financial condition. To mitigate this risk the Company limits its exposure to foreign currency denominated liabilities. The risk poised by foreign exchange fluctuations on the cost of its imported petroleum products is generally mitigated by the Company’s ability to pass on any such additional costs to its selling prices. Sales to Cebu Air comprise a significant amount of the Company’s sales. Revenues from the supply of jet fuel to Cebu Air, the Philippines’ largest airline in terms of passengers carried, comprised almost 12% of the Company’s total sales for 2011. This makes Cebu Air the Company’s largest single corporate customer. While the Company has supplied Cebu Air with jet fuel since 2005, there is no long term fuel supply contract between the Company and Cebu Air. However, the Company enters into an annual supply contract or agreement with Cebu Air to ensure continuous purchase by the latter for the year ahead. Any disruption, reduction or material change in the business relationship between Cebu Air and the Company could adversely impact the Company’s sales and results of operations. Aside from Cebu Air, the Company has no other customer or buyer that accounts for more than 3.5% of the Company’s sales. To mitigate the risk, the Company continues to expand its base of industrial customers, thus diversifying its risk that the loss of business from any one customer would have a material effect on the Company’s sales. The Company currently benefits from income tax holidays on the operation of certain of its depots. If the Company did not have the benefit of income tax holidays its profitability will be adversely affected, as it will have to pay income tax at the prevailing rates. Under its registration with the BOI, the Company enjoys certain benefits, including an income tax holiday (“ITH”) on the operations of the Davao Extension, the Calaca (Batangas) and the Zamboanga depots. In addition, the Company got approval this year 2012 for BOI registration with corresponding
32
income tax holidays for its Cagayan de Oro City (Phividec) and Bacolod depots. The ITH runs for a period of five (5) years from the commencement of operations of each depot. Upon expiration of a tax holiday, the Company’s income from a depot will be subject to prevailing income tax rates. In addition, if the Company fails to meet certain conditions imposed by the BOI, it may lose its right to the ITH. In such an event, the Company may not be able to continue to avail of the benefits under the ITH. The loss of the ITH would adversely affect the Company’s profitability, as it would have to pay income tax at prevailing rates. In addition, there is no guarantee that the Company will be able to secure similar income tax holidays for any new depots that it may establish in the future or for the statutes granting the said ITH to be superseded or amended. . For example, the Company’s registration as a New Industry Participant with New Investment in Storage, Marketing and Distribution of Petroleum Products (with Certificate of Registration No. 2010-184) provides that it is entitled to ITH until 15 November 2010. After the lapse of the ITH, the Company became liable for the regular corporate income tax. Any such inability by the Company to enjoy ITH benefits will have a material adverse effect on its business prospects, financial condition and results of operations. The Company continuously monitors its compliance with the requirements and conditions imposed by the BOI to mitigate this risk. The Company depends on certain key personnel, and its business and growth prospects may be disrupted if their services were lost. Certain key executives and employees are critical to the continued success of the Company’s business. There is no assurance that such key executives and employees will remain employed with the Company. Should several of these key personnel be unable or unwilling to continue their present roles, the Company may face difficulties in looking for replacements and the business and operations may be disrupted as a result translating to a potential material adverse effect on the financial condition and operations results of the Company. To mitigate this risk the Company ensures that its compensation and benefit packages for its officers, staff and rank and file are competitive with industry standards. Promotions and pay raises are merit-based and performance appraisals are conducted regularly. Key personnel are also regularly sent to training programs in the Philippines and abroad to ensure that their knowledge and skills are continually updated. The Company’s controlling shareholder may have interests that may not be the same as those of other shareholders. Udenna Corp, the ultimate holding company, directly or indirectly through PPHI and UMRC, holds 71% of the Company’s outstanding common equity as of January 31, 2012. Neither Udenna nor PPHI is obligated to provide the Company with financial support or to exercise its rights as a shareholder in the Company’s best interests or the best interests of the Company’s other shareholders. Should there be a conflict between the interests of Udenna Corp or PPHI and the interests of the Company, the Company may be affected by the actions done by Udenna Corp.
33
The Company has an operating lease agreement with its parent, Udenna Corp, for the use of various properties for its operations and for office space. Furthermore, the Company regularly charters the use of marine tankers from its affiliate, CSC, for the hauling of its fuel products from suppliers’ terminals and from its own depots to Company depots and to its customers. The Company also avails of the freight forwarding services of another affiliate, F2 Logistics, Inc., for the delivery of goods to customers and for internal movement of non-commercial cargo. While the Company believes that the terms of these transactions were negotiated on an arms-length basis, there is no assurance that the Company cannot avail of better terms if it contracted with parties other than its affiliates. To mitigate this risk, the Company follows good corporate governance standards in dealing with its shareholders and other related parties. These standards include, but are not necessarily limited to, “arms-length” practices in all commercial dealings with related interests and transparency and full disclosure in all such dealings. If the number or severity of claims for which the Company is insured increases, or if it is required to accrue or pay additional amounts because the cost of damages and claims prove to be more severe than its insurance coverage, the Company’s financial condition and results of operations may be materially adversely affected. The Company uses a combination of self-insurance and reinsurance to cover its properties and certain potential liabilities. The Company’s insurance coverage includes property, marine cargo and third party liability. The Company estimates the liabilities associated with the risks retained by it, in part, by considering historical claims, experience and other actuarial assumptions which, by their nature, are subject to a degree of uncertainty and variability. A number of external factors affect the uncertainty and variability including but not limited to future inflation rates, discount rates, litigation trends, legal interpretations and actual claim settlement patterns. If the number or severity of claims for which the Company is insured increases, or if it is required to accrue or pay additional amounts because the claims prove to be more severe than its original assessments, the Company’s financial condition, results of operations and cash flows may be materially adversely affected. To mitigate this risk the Company continually reviews and updates its insurance policies so that it is reasonably protected from foreseeable events and risks. Insurance coverage is acquired through competitive bidding to ensure that the Company’s premium costs are reasonable and at par with industry standards. Risks Relating to the Philippines The Company’s business and sales may be negatively affected by slow growth rates and economic instability globally and in the Philippines. The Company, since its commencement of operations, has derived all of its revenues and operating profits from sales of its petroleum products in the
34
Philippines. The Company’s business has mostly been influenced by the Philippine economy and the level of business activity in the country. In the past, the Philippines has experienced periods of slow or negative growth, high inflation, significant devaluation of the Philippine Peso and debt restructuring, and has been significantly affected by economic volatilities in the Asia-Pacific region. The Company cannot assure prospective investors that one or more of these factors will not negatively impact Philippine consumers’ purchasing power, which could materially and adversely affect the Company’s financial condition and results of operations. In addition, global financial, credit and currency markets have, since the second half of 2007, experienced, and may continue to experience, significant dislocations and liquidity disruptions. There is significant uncertainty as to the potential for a continued downturn in the U.S. and the global economy, which would be likely to cause economic conditions in the Philippines to deteriorate. A slowdown in the Philippine economy may adversely affect consumer sentiment and lead to a reduction in demand for the Company’s products. There is also no assurance that current or future Government administrations will adopt economic policies conducive to sustaining economic growth. Political instability or acts of terrorism in the Philippines could destabilize the country and may have a negative effect on the Company. The Philippines has experienced political and military instability. In the past decade, political instability has been observed headlined by impeachment proceedings against former presidents Joseph Estrada and Gloria Macapagal-Arroyo, and public and military protests arising from alleged misconduct by previous administrations. There is no assurance that acts of election-related violence will not occur in the future and such events have the potential to negatively impact the Philippine economy. An unstable political environment, whether due to the imposition of emergency executive rule, martial law or widespread popular demonstrations or rioting, could negatively affect the general economic conditions and operation environment in the Philippines, which could have a material adverse effect on the Company’s business, financial condition and results of operations. Terrorist attacks have been observed in the Philippines since 2000. The conflict with the Abu Sayyaf organization continues. The Abu Sayyaf organization is being identified and associated with kidnapping and terrorist activities in the country including several bombing activities in the southern region of the country and is said to have ties with the al-Qaeda terrorist network. On May 10, 2010, the Philippines held a presidential election, as well as elections for national (members of the Senate and the Congress) and local positions. This resulted in the election of Benigno Aquino III as the new President of the Philippines, effective June 30, 2010. Although there has been no major public protest of the change in government, there can be no assurance that the political environment in the Philippines will continue to be stable or that the new

35
government will adopt economic policies conducive to sustained economic growth or which do not impact adversely on the current regulatory environment. On August 23, 2010, a hostage situation occurred in Manila resulting to 8 dead hostages. This resulted in the Hong Kong Special Administrative Region government issuing a “black” travel alert for the Philippines. An increase in the frequency, severity or geographic reach of terrorist attacks may destabilize the Government, and adversely affect the country’s economy. There is no guarantee that the Philippines and the assets of the Company will not be subject to such acts of terrorism, resulting to potential adverse effects on the business, financial condition and results of operations of the Company. The occurrence of natural catastrophes or blackouts may materially disrupt the Company’s operations. The Philippines has encountered and is expected to experience a number of major natural catastrophes including typhoons, volcanic eruptions, earthquakes, mudslides, droughts or floods. Such natural catastrophes may cause disruption to the Company’s operations, and distribution of its petroleum products. Electricity blackouts are also experienced caused by insufficient power generation following strong typhoons and other natural catastrophes. These types of events may materially disrupt and adversely affect the Company’s business and operations. The Company cannot assure prospective investors that the insurance coverage it maintains for these risks will adequately compensate the Company for all damages and economic losses resulting from natural catastrophes or blackouts, including possible business interruptions. If foreign exchange controls were to be imposed, the Company’s ability to access foreign currency to purchase petroleum, petroleum products, raw materials, equipment and other imported products, could be adversely affected. Generally, Philippine residents may freely dispose of their foreign exchange receipts and foreign exchange may be freely sold and purchased outside the Philippine banking system. The Monetary Board of the BSP, with the approval of the President of the Philippines, has statutory authority, during a foreign exchange crisis or in times of national emergency, to suspend temporarily or restrict sales of foreign exchange, require licensing of foreign exchange transactions or require delivery of foreign exchange to the BSP or its designee. The Government has, in the past, instituted restrictions on the conversion of Pesos into foreign currency and the use of foreign exchange received by Philippine residents to pay foreign currency obligations. The Company purchases some critical materials, particularly petroleum and petroleum products, and some capital equipment from abroad and needs foreign currency to make these purchases. Although the Government has from time to time made public pronouncements of a policy not to impose restrictions on foreign exchange, there can be no assurance that the Government will maintain such policy or will not impose economic or regulatory controls that may restrict free access to foreign currency. Any such restrictions imposed in the future could adversely affect the ability of the Company to purchase petroleum and other materials and equipment from abroad in U.S. dollars.

36
3. Description of Property:
The Company’s properties consist of its terminal, depot facilities, head office building, pier and pipeline structures and its accessories, steel cylindrical tanks, and stocks of all petroleum products stored and contained inside the depot. In March 2009, after acquisition of PPIPC by the Company, the Group has additional Port Facilities, Land Held for Sale and Land Held for future developments. Under the terms of agreements covering the liabilities under trust receipts, certain inventories of petroleum products released to the Company are held in trust for the bank. The Company is accountable to the bank for the trusteed inventories or their sales proceeds.
Leased Properties
Lease with Udenna Corporation
The Company’s headquarters is currently located at Stella Hizon Reyes Road, Bo. Pampanga, Davao City. The premises are covered by existing lease contracts with Udenna Corporation and the Heirs of Stella Hizon Reyes, as lessors. Following are the relevant terms of the lease contracts: The Company’s sublease contract with Udenna Corporation was originally for a term of three (3) years, from January 2007 to December 2009. The lease was renewed for another term of three (3) years, commencing from 01 January 2010 to 31 December 2012, subject to further renewal under terms and conditions to be agreed to by the parties. On the other hand, the lease contract by Udenna Corporation with the Heirs of Stella Hizon Reyes over 1.1 hectares is effective for twenty one (21) years, which shall expire on March 20, 2027, subject to renewal upon terms and conditions to be agreed to by the parties. The same term for purposes of synchronization was implemented over the lease of the remaining area of 1.2 hectares with the lessor for the expanded area which is now leased directly by the Company. The Company shall pay Udenna Corporation a monthly lease rental for
the parcels of land used as sites of its Depot Facilities in Davao and a retail station site such as the recently opened mega-station located along Lanang, Davao City.
The leased premises shall be exclusively used by the Company for
petroleum and fuel products storage and for its pier facilities or any other related business. The Company is prohibited from using the leased

37
premises for any other purpose without the prior written consent of lessors.
The Company may not introduce improvements or make alterations or
changes without the written consent of Udenna Corporation, except the construction of the necessary offices, storage tanks and other improvements required by the business of the Company.
Udenna Corporation shall have the right to pre-terminate the sublease on
any of the following grounds: (a) non-payment of rentals for at least two (2) consecutive months; (b) if the Company, at any time, fails or neglects to perform or comply with any of the covenants, conditions, agreements, or restrictions stipulated in the lease contract; or (c) if the Company shall become insolvent. Udenna Corporation shall give the Corporation one (1) month notice prior to the intended date of termination. The Company may pre-terminate the lease, upon prior thirty-day written notice to Udenna Corporation.
Payment of real property taxes on the land shall for the account of the
Lessor while the real property taxes pertaining to the improvements found thereon shall be for the account of the Company, as lessee.
Leased Properties for Terminal/Depot Sites The Company likewise executed valid lease agreement over various parcels of lands in various areas of the country where its Terminal/Depots are located and established as part of its expansion program, namely: General Santos City. A fifteen-year (15) lease contract, with option to
renew for another five (5) years, was entered with Southern Fishing Industries, Inc. for the 10,000 square meters property located at Tambler, General Santos City. Contract was signed on May 7, 2008.
Zamboanga City. The Company entered to a lease agreement with Jordan Fishing Corporation for an area of 10,000 square meters for a period of ten (10) years, with an option to renew for another five (5) years. The said lease agreement commenced November 16, 2008. The depot in Zamboanga City has a 5.5 million liter capacity that supports the retail network and the commercial and industrial accounts.
Bacolod City. A land with an area consisting of 5,000 square meters
more or less was leased by the Company from Jordan Fishing Corporation for ten (10) years starting January 01, 2008 with option to renew for another five (5) years. The Depot in Bacolod City has a 9 million liter capacity that supports the retail network and the commercial and industrial accounts in the area.
38
Leased Properties for Company-owned, Dealer-operated (CODO) Stations In addition to the aforementioned leases, the Company likewise has existing lease contracts with various property owners covering the properties where its CODOs are situated. Relevant terms of said lease contracts are as follows: The lease shall be for a term of fifteen (15) years, subject to renewal upon
such terms and conditions as may be agreed upon in writing and signed by the parties.
The Company shall pay monthly rentals, subject to annual escalation ranging from 5% to 10%, plus applicable real estate and government taxes.
The leased premises may be occupied and used by the Company exclusively as a gasoline service station. In some areas, the leased premises for the CODOs include the operation of convenience stores, coffee shops, service bays and other facilities as might be deemed appropriate for a gasoline service station and for no other purpose without the written consent of the lessors.
Given the nature of the business, the Company is expressly permitted to sublease the leased premises.
4. Legal Proceedings Involvement in Certain Legal Proceedings
The Company’s Independent Director, Monico V. Jacob, in his capacity as then Chairman of Petron Corporation, was impleaded in a case together with some government officials for Violation of Republic Act 3019 otherwise known as the Anti-Graft and Corrupt Practices Act involving tax credit payments. The case is now pending with the Sandiganbayan. On 05 May 2011, the Bureau of Customs (BOC) filed before the Department of Justice (DOJ) a complaint against the Company’s President and Chief Executive Officer Dennis A. Uy and other respondents for alleged violation of Sections 3602, 2501(l)(1) & (5), 1801, 1802 and 3604 of the Tariff and Customs Code of the Philippines. On 16 November 2012, the DOJ dismissed the case for lack of probable cause against all the respondents. Except for the above, to the best of the Company’s knowledge there has been no occurrence during the past five (5) years up to the date of this Report of any of the following events which are material to an evaluation of the ability or integrity of any director, person nominated to become a director, executive officer, or control person of the Company:

39
(i) Any insolvency or bankruptcy petition filed by or against any business of which such person was a general partner or executive officer either at the time of the insolvency or within two years prior to that time;
(ii) Any conviction by final judgment in a criminal proceeding, domestic or
foreign, or any pending criminal proceeding, domestic or foreign, excluding traffic violations and other minor offenses;
(iii) Any final and executory order, judgment, or decree of any court of
competent jurisdiction, domestic or foreign, permanently or temporarily enjoining, barring, suspending, or otherwise limiting involvement in any type of business, securities, commodities, or banking activities; and
(iv) Any final and executory judgment by a domestic or foreign court of
competent jurisdiction (in a civil action), the Securities and Exchange Commission (“SEC”), or comparable foreign body, or a domestic or foreign exchange or electronic marketplace or self-regulatory organization, for violation of a securities or commodities law.

40
PART II - SECURITIES OF THE REGISTRANT
(A) Market price of and Dividends on Registrant’s common equity
shares and Related Stockholders Matters
(1) Market Information
On 11 July 2007, the Parent Company’s common shares became listed for trading on the Philippine Stock Exchange (“PSE”).. The high and low sale prices of each quarter for the year 2012 are hereunder shown: Highest Close Lowest Close
Period Price Date Price Date First Quarter 14.88 Mar-12 9.50 Mar-30 Second Quarter 9.74 Apr 4&10 8.09 Jun-15 Third Quarter 8.95 Jul 16 8.10 Aug-16 Fourth Quarter 9.29 Dec-06 8.05 Oct-8
As of December 31, 2012, the market capitalization of the Company, based on the closing price of P 9.03, was approximately P8.182 billion.
(2) Top 20 Stockholders*
As of January 31, 2013
# NAME OF STOCKHOLDER NO. OF SHARES
% OWNERSHIP
1 PHOENIX PETROLEUM HOLDINGS INC.
390,035,100 43.05%
2 UDENNA MANAGEMENT & RESOURCES CORP.
196,093,649 21.64%
3 PCD NOMINEE CORPORATION - (FILIPINO)
188,163,535 20.77%
4 UDENNA CORPORATION
98,129,821 10.83%
5 PCD NOMINEE CORPORATION - (NON-FILIPINO)
20,447,168 2.26%
6 JOSELITO R. RAMOS
3,702,000 0.41%
7 DENNIS A. UY
3,070,624 0.34%
8 CAROLINE G. TAOJO
2,155,000 0.24%
9 UDENCO CORPORATION
1,242,144 0.14%
10 DENNIS A. UY &/OR CHERYLYN C. UY
844,662 0.09%
11 DOMINGO T. UY
496,861 0.05%12 JOSE MANUEL ROQUE QUIMSON 0.03%

41
273,000
13 EDGARDO ALVARADO ALERTA
245,004 0.03%
14 ZENAIDA CHAN UY
114,660 0.01%
15 REBECCA PILAR CLARIDAD CATERIO
114,195 0.01%
16 EMMANUEL M. CABUSAO
111,720 0.01%
17 ORLANDO T. LANSANGAN
102,000 0.01%
18 ROMEO B. MOLANO
96,048 0.01%
19 SOCORRO ERMAC CABREROS
79,474 0.01%
20 CRISTINA C. PERTIERRA
59,040 0.01%
* disclosure based on records of the Stock Transfer Agent, BDO-Equitable Trust Co., as of January 31, 2013. (3) Dividends
The Company’s dividend policy is to declare at least 30% of its prior year’s net income as dividends, whether in stock or in cash or a combination of both, payable out of its unrestricted retained earnings subject to statutory limitations. Each holder of a common share is entitled to such dividends as may be declared in accordance with the Company’s dividend policy. The Company’s current dividend policy entitles holders of common shares to receive dividends based on the recommendation of the Board of Directors. Such recommendation will consider such factors as operating expenses, implementation of business plans, and working capital among other factors.
For the year 2008, the Board of Directors approved on May 8, 2008 and duly ratified by the stockholders on July 16, 2008, a 30% stock dividend for stockholders of record as of July 11, 2008 to be issued from the Company’s unrestricted retained earnings. Distribution date was scheduled on August 6, 2008. A total of 43,000,198 common shares were issued valued at Par Value of P 1.00 per share or a total of P43,000,198.00. Moreover, a cash dividend of P 0.10/share was also declared for all stockholders on record as May 30, 2008. Payment date was set on June 26, 2008 for the total amount of P 14,500,000.00. For 2009, the Shareholders ratified and approved on May 29, 2009 a 40% stock dividend. Details are as follows:
42
Ex-Date July 03, 2009 Record Date July 08, 2009 Distribution Date August 03, 2009 No. of Shares Distributed 73,660,677 shares
For 2010, on April 12, 2010, the Company’s Board of Directors approved a P 0.05 per share cash dividend. Details are as follows:
Ex-Date July 12, 2010 Record Date July 15, 2010 Payment Date August 10, 2010 Total Amount P 13,656,430
On July 15, 2010, the Parent Company’s stockholders ratified and approved a 40% stock dividend (or a total of 107,664,266 shares), valued at par of P1.00 per share and distributed on October 20, 2010 to all stockholders of record as of September 24, 2010.
For the year 2011, the Board of Directors declared a cash dividend for common shareholders with details as follows:
Dividend Rate Php 0.10/share Ex Date March 22, 2011 Record Date March 25, 2011 Payment Date April 20, 2011 Total Amount Distributed Php 37,682,494
On March 15, 2011, a 30% Stock Dividend was declared by the Board of Directors and subsequently approved by the stockholders during the March 11, 2011 Annual Stockholders’ meeting. All stockholders of record as of April 8, 2011 were entitled to the stock dividend declaration that was distributed on May 6, 2011. A total of 113,047,475 common shares were distributed for this declaration. Similarly, the Board of Directors declared and approved the payment of cash dividend at the rate of 11.5% per annum to all preferred shareholders totaling to P 70.7 million. Preferred shares issuance by the Company is not listed and traded in the Philippine Stock Exchange.
For the year 2012, the Board of Directors declared Cash Dividend for Common Shareholders with details as follows:
Dividend Rate Php 0.10/share Ex Date March 20, 2012 Record Date March 23, 2012 Payment Date April 23, 2012 Total Amount Distributed P 48,987,241.50

43
Similarly, a 50% stock dividend was declared by the Board of Directors on January 26, 2012 and subsequently approved by the Stockholders during the March 08, 2012 Annual Stockholders’ meeting. All stockholders of record as March 28, 2012 were entitled to said stock dividend declaration that was distributed on April 26, 2012. Total distributed for this dividend is 113,047,475 shares. Also, the Board of Directors declared and approved the payment of cash dividend at the rate of 11.5% per annum to all preferred shareholders totaling to P 70.7 million. Preferred shares issuance by the Company is not listed and traded in the Philippine Stock Exchange.
(4) Recent Sale of Unregistered Securities
All of the shares of the Company are duly registered with the Securities and Exchange Commission.
(5) Re-acquisition/buy-back of its Own Securities
On September 21, 2007, the Board of Directors approved the buy-back program of the Company’s common shares, worth a total of P50,000,000.00 or 5.15% of the Company’s then market capitalization. Using PSE facilities, the program commenced on the second week of October 2007. The program will conclude upon exhaustion of the approved allotment, subject to the disclosure requirements of the SEC and the PSE. As of December 31, 2010 and December 31, 2009, the Company treasury shares have cumulative costs of P -0- and P 17,252,140 respectively. No re-acquisitions of shares were made in 2011. The funds allocated for the repurchase of the shares was taken from the Company’s unrestricted retained earnings. The program was basically designed to boost up and/or improve the shareholders value through the repurchase of the shares whenever the same is trading at a value lower than its actual corporate valuation. The program did not involve any funds allotted for the Company’s impending expansion projects/investments nor any of those allotted for the payment of obligations and liabilities.
(B) Description of Shares
The Company’s shares consist of common shares with a par value of P 1.00 per share and preferred shares with a par value of P 1.00 per share. As of January 31, 2013, total outstanding common shares, with voting rights, is 1,099,059,416. Preferred share issued by the Company as of December 31, 2012 is 5,000,000 shares with a par value of P 1.00 per share.

44
(C) Employee Stock Option Plan
The Company’s Board of Directors approved the Employees’ Stock Option Plan (ESOP) during its April 12, 2010 Board Meeting. Under the ESOP program, the Parent Company will allocate up to a total of 5% of its issued and outstanding common shares to be awarded to eligible employees. The ESOP was approved by the shareholders during the 2011 Annual Stockholders’ Meeting.
The ESOP initial Offer date is set at March 01, 2013 as approved by the Board of Directors last BOD January 24, 2013 Board Meeting.
45
PART III - FINANCIAL INFORMATION
(A) Management’s Discussion and Analysis of Financial Conditions
The following is a discussion and analysis of the PPPI and its Subsidiaries’ financial performance for the years ended December 31, 2012, 2011 and 2010. The discussion should be read in conjunction with the audited consolidated financial statements and the accompanying notes. In the discussion of financial information, any reference to “the Company” or to the “Group” means PPPI and its Subsidiaries. The selected financial information set forth in the following table has been derived from the Company’s audited consolidated financial statements for the years ended December 31, 2012, 2011 and 2010. The Company’s financial statements were audited by Punongbayan & Araullo for 2012, 2011 and 2010, in accordance with Philippine Financial Reporting Standards.
As of and for the years ended
December 31 In P thousands, except for Per Share amounts
2010 2011 2012
Income Statement Data: Revenues………………………………………… 14,929,560 27,450,978 34,585,552Cost of sales…………………………………….. 13,245,269 25,327,617 31,961,749Net profit………………………………………. 412,822 556,546 625,734 Balance Sheet Data: Current Assets………………………………….. 4,882,502 6,901,769 8,967,002Non-current Assets…………………………….. 4,393,505 6,056,887 7,540,188Total Assets ……………………………………. 9,276,007 12,958,656 16,507,190Total Liabilities………………………………….. 6,197,392 9,247,693 12,008,862Stockholders’ Equity……………………………. Earnings per Share-Adjusted……………….. 0.44 0.55 0.63Book Value per Share………………………….. 5.61 5.61 4.96
46
Analysis of Results of Operations for 2012 and 2011
Revenues The Group generated total revenues of P 34.586 billion in 2012 which is 26% higher than its comparative 2011 level of P 27.451 billion. This was brought about by the 26% and 8.3% increase in sales volume of petroleum products and lubricants, respectively. Service revenue also posted an increase of 34% compared to immediately preceding year. There is no real estate sales recorded this year by the Group compared to a realized P354 million real estate sales in its PPIPC industrial park in Calaca, Batangas in 2011. Sales revenues from trading and distribution of petroleum products and lubricants increased by 26% from P 27.074 billion in 2011 to P 34.080 billion in 2012 resulting principally from a wider distribution network and expanded institutional customer base. The 26% increase in sales volume accounts the increase in revenue. Average Means of Platts Singapore (MOPS), the benchmark for pricing of petroleum in the Philippines, increased by 1.23% for Gasoil (benchmark for Diesel) and 2.41% for MOGAS92 (benchmark for Gasoline). PPPI had three hundred (300) Phoenix Fuels Life retail service stations as of December 31, 2012 compared to two hundred twenty (220) as of December 31, 2011. A number of these service stations are yet to fully realize their potential peak sales volume considering that they have been in operation for only less than a year. The Group generated P505 million from its fuels service (i.e. shipping, hauling and into-plane), lease of its storage facilities, Port Revenue and other service revenue in 2012 versus P 377 million in 2011, or a 34% increase compared to last year. Ship Charter revenue accounts for the biggest increase at P 68 million or 51% percent increase compared to prior year. Storage and Service Revenue also increased by 49% and 23% respectively. Cost and expenses The Group recorded this year’s cost of sales at P31.962 billion, an increase of 26% compared to the 2011 figure of P 25.328 billion. The increase was triggered by the 26% increase in volume. Weighted average cost per liter this year is at the same level as that of last year. The slight increase in product costs in 2012 was balanced by the sales mix.
The 20% increase in selling and administrative expenses is a result of the increasing volume and the ongoing expansion and growth of the Group’s organizational build-out and business operations. The Major items that increased as a result of this retail network expansion and increasing volume include rental, depreciation, travel and transportation, repairs, taxes and licenses and other expenses. PPPI is also continuously doing branding and promotional campaign

47
to improve on brand awareness in the market, which resulted to higher advertising expenses. Net Profit and Comprehensive Income The Group’s total net profit increased by 12% to P 624 million during year 2012 compared to P 557 million for 2011. This is a result of the Group’s growth on volume on all of its business segments and the integration of the net income of the newly acquired subsidiary, Chelsea Shipping. Total Comprehensive Income increased 65% from P 517 million in 2011 to P 856 million in 2012 as accounted by the increase in net income and the effect of the revaluation of vessel tankers.
Analysis of Financial Condition and Balance Sheet Accounts (As of December 31, 2012 versus December 31, 2011) Total resources of the Group as of December 31, 2012 stood at P 16.507 billion, an increase of 27% over the P 12.959 billion as of December 31, 2011. Cash and cash equivalents decreased by 53% from P 924 million to P 439 million as part of the Group cash management to retain cash level for current operational requirements and bank accounts average daily balance. The Group’s liquidity position continued to hold strong with Current Assets reaching P 8.967 billion as of December 31, 2012, up from P 6.902 billion as of December 31, 2011. Trade and other receivables increased by 24%, from P2.865 billion as of December 31, 2011 to P 3.557 billion as of December 31, 2012 due to increase in sales revenue in 2012 vis-a-vis the preceding year. The Company continues to exercise prudence in its credit policies in order to manage customer receivable risk. The receivables are spread over a number of industries and a number of clients. Inventories increased by 73%, from P 3.689 billion as of December 31, 2011 to P2.133 million as of December 31, 2012 as part of the Company’s inventory management strategy. The Company maintains more or less one month of inventory to ensure stable supply in retail stations and commercial/industrial clients. In the comparative year, the Company is maintained a level of around thirty five (35) days and twenty two (22) days inventory as of December 31, 2012 and December 31, 2011 cut-off. Inventory Costs per unit was also a slight factor of the inventory costs increase this year. In addition, in this period of rising fuel prices, it is necessary to build commensurate levels of inventory to improve potential margins.
48
Lands Held for Sale are parcels of subdivided lots owned by PPIPC, a wholly owned subsidiary of the PPPI. These lots are intended for sale to prospective buyers. The increase in 2012 from the 2011 value is for the development of the Park that was introduced this year. There are ongoing active negotiations with prospective buyers on some parcels of these lots. Due from related parties net balance payable is P 77.3 million as of December 31, 2012 compared to a payable balance of P 10.8 million in 2011. The Company’s parent holding company and related party extended advances to support its cash requirement for its capital expenditures on a temporary basis to bridge immediate cash flow requirements. Restricted deposits increased by 20% from P 69 million in December 31, 2011 to P 82.7 million in December 31, 2011 due sinking set-up for dividend plus interest income to these deposits. Input-VAT-net increased by 73% from P 226.5 million in December 31, 2011 to P393 million in December 31, 2012. These are accumulation of input VAT, current and deferred as a result of the continuous capital expenditures of the Group and the increase in inventory equivalent input taxes.
Other current assets increased by 44% from P 206.2 million in December 31, 2011 to P 296 million in December 31, 2012. These are prepayments on taxes, rentals on retail service stations and depot sites, creditable withholding tax and other various prepayments. As of December 31, 2012, the Group’s property and equipment, net of accumulated depreciation, increased to P 6.999 billion compared to P 5.572 billion as of December 31, 2011 as a result of the Company’s continuous expansion of retail service stations, Storage Facilities, additional ship, capitalized dry-docking costs and other minor capital expenditures. Lands held for future developments are parcel of subdivided lot owned by the wholly owned subsidiary PPIPC. The balance is increased by 6% as a due to minor development introduced in the property. These lots may be sold at its current state or be developed for better selling prices which will yield better returns to the Group. Total Loans and Borrowings increased by 69% from total P 5.877 billion as of December 31, 2011 to P 9.915 billion as of December 31, 2012. This is due to the financing for vessel double hulling, purchase of brand new vessel. The total loan amount is P 214 million and US$ 14.5 million for the double hulling and purchase of brand new vessel respectively. In addition, the Parent Company availed of long term debts to refinance short term debts. Short term loans and borrowings are related to the financing of the inventory build-up and accounts receivable trade gapping.
Trade and other payables decreased by 50%, from P 3.084 billion as of December 31, 2011 to P1.547 billion as of December 31, 2012 as trade payables at the end of the year are mostly booked under trust receipts. The increase in
49
Other Payable was mostly payables to contractors and suppliers for construction of depots and retail stations. Other non-current liabilities increased by 59% in December 31, 2012. Most of this is accumulation of Cash Bond placed by dealers and customer to secure their credit purchases. Total Stockholders’ Equity increased to P 4.500 billion as of December 31, 2012 from P 3.711 billion as of December 31, 2011 due to the issuance net income posted during the year. Increase Revaluation Reserve to P 294 million contributed to the increase. This however was reduced by the effect of the P 92 million cash dividend declared and distributed during the year to both common and preferred shareholders.
Analysis of Results of Operations for 2011 and 2010
Revenues The Group generated total revenues of P 27.451 billion in 2011 which is 84% higher than its comparative 2010 level of P 14.930 billion. This was brought about by the 52% and 8.5% increase in sales volume of petroleum products and lubricants, respectively. Service revenue posted a slight decline by 2% as a result of lower chartering revenue decline volume from 3rd party with the increasing need of shipping within the Group. The group also realized P354 million real estate sales in its PPIPC industrial park in Calaca, Batangas. Sales revenues from trading and distribution of petroleum products increased by 85% from P 14.341 billion in 2010 to P 26.508 billion in 2011 resulting principally from a wider distribution network and expanded institutional customer base. The 52% increase in sales volume is complemented by the increase in weighted average selling price by 22%, from P 31.26 per liter in 2010 to P 38.01 per liter in 2011. PPPI had two hundred twenty (220) Phoenix Fuels Life retail service stations as of December 31, 2011 compared to one hundred sixty one (161) retail stations as of the December 31, 2010. The recently opened retail service stations have yet to fully realize their potential peak sales volume considering that they have been in operation only for less than a year. The Group generated P377 million from its fuels service (i.e. shipping, hauling and into-plane), lease of its storage facilities, Port Revenue and other service revenue in 2011 versus P 385 million in 2010, or a 2% decrease compared to last year. It includes revenue from port operation of P 58 million and P 45 million for 2011 and 2010 respectively on PPIPC, the 2009 acquired wholly-owned subsidiary.
50
Cost and expenses The Group recorded this year cost of sales of P25.328 billion, an increase of 91% compared to the 2010 figure of P 13.245 billion. The increase was triggered by the 52% increase in volume plus the higher average cost by 24.5%. Year 2011 average fuel cost is 35.94 per liter compared to 28.87 in 2010 driven by higher average crude prices and product sales mix factor.
Selling and administrative expenses increased by 41% as a result of the increasing volume and the ongoing expansion and growth of the Group’s organizational build-out and business operations. Major items that increased out of this retail network expansion and increasing volume are rental, depreciation, travel and transportation, repairs, taxes and licenses and other expenses. The Parent Company is also continuously doing branding and promotional campaign which resulted to higher advertising expenses to improve on brand awareness in the market. Net Profit and Total Income The Group’s total net profit increased by 35% to P 555 million during year 2011 compared to P 413 million for 2010. This is a result of the Group’s growth on volume on all of its business segments.
Analysis of Financial Condition and Balance Sheet Accounts (As of December 31, 2011 versus December 31, 2010) Total resources of the Group as of December 31, 2011 stood at P 12.959 billion, an increase of 40% over the P 9.276 billion as of December 31, 2010. Cash and cash equivalents increased by 50% from P615 million to P924 million due to higher revenue level during the current year and the need to retain cash on that level due to operational requirements. The Group’s liquidity position continued to hold strong with Current Assets reaching P 6.902 billion as of December 31, 2011, up from P 4.882 billion as of December 31, 2010. Trade and other receivables increased by 12%, from P2.556 billion as of December 31, 2010 to P2.865 billion as of December 31, 2011 as a result of the increase in sales revenue in 2011 compared to the preceding year. The Company continues to exercise prudence in its credit policies in order to manage customer receivables risk. The receivable is spread over a number of industries and a number of clients. Inventories increased by 103%, from P 1.052 billion as of December 31, 2010 to P2.133 million as of December 31, 2011 as part of the Company’s inventory management strategy. The Company maintains more or less one month of inventory to ensure stable supply in retail stations and commercial/industrial
51
clients. Both the comparative year are in the level of around twenty two (22) days inventory as of December 31 cut-off. Prices also a factor of the inventory costs increase this year. In addition, in a period of rising fuel prices, it would be necessary to build commensurate levels of inventory to improve potential margins. Land Held for Sale are parcels of subdivided lots owned by PPIPC, a wholly owned subsidiary of the PPPI. These lots are intended for sale to prospective buyers. The level is the same as that of 2010 as the sold lots are coming from the undeveloped portion which was part of the Land Held for Future development under non-current assts. There are ongoing active negotiations with prospective buyers of these parcels of lot. Due from related parties net balance is payable P 10.766 million as of December 31, 2011 compared to a payable balance of P 33.890 million in 2010. The Company’s parent holding company extended advances to support its cash requirement for its capital expenditures on a temporary basis to bridge immediate cash flow requirements. Restricted deposits decreased by 6% from P 73.4 million in December 31, 2010 to P 69 million in December 31, 2011. Some of the banks released restricted deposits which were previously required. Input-VAT-net increased by 722% from P 28 million in December 31, 2010 to P226 million in December 31, 2011. These are accumulation of input VAT, current and deferred as a result of the continuous capital expenditures of the Group.
Other current assets increased by 140% from P 86 million in December 31, 2010 to P 206 million in December 31, 2011. These are prepayments on taxes, rentals on retail service stations and depot sites, creditable withholding tax and other various prepayments. As of December 31, 2011, the Group’s property and equipment, net of accumulated depreciation, increased to P 5.572 billion compared to P 3.886 billion as of December 31, 2010 as a result of the Company’s continuous expansion of retail service stations, Storage Facilities, acquisition of land, purchase of vessel and other minor capital expenditures. Land held for future developments are parcel of subdivided lot owned by the wholly owned subsidiary PPIPC. The balance is reduced by 14% as a result of the land sale realized by the Group this 2011. The remaining lots may be sold at its current state or be developed for better selling prices which will yield better returns to the Company. Loans and Borrowings increased by 46% from total P4.304 billion as of December 31, 2010 to P5.877 billion as of December 31, 2011. This is due to the P750 million corporate notes issue by the Group, and the increase in short term loans and borrowings that are related to the financing of the inventory build-up and accounts receivable trade gapping.
52
Trade and other payables increased by 60%, from P 1.926 billion as of December 31, 2010 to P3.084 billion as of December 31, 2011 as a result of the inventory build-up of the Company using suppliers’ credit as well as higher unit prices. The increase in Other Payable was mostly payables to contractors and suppliers for construction of depots and retail stations. Other non-current liabilities increased by 213% in December 31, 2011. Most of this is accumulation of Cash Bond placed by dealers and customer to secure their credit purchases. Total Stockholders’ Equity increased to P 3.711 billion as of December 31, 2011 from P 3.079 billion as of December 31, 2010 due to the P 510 million net income posted during the year. This however was minimized by the effect of the P 108.3 million cash dividend declared and distributed during the year to both common and preferred shareholders. Revaluation of Vessels and CSC assets also affected the amounts for the Revaluation Reserves and other reserves amount.
Analysis of Results of Operations for 2010 and 2009
Revenues The Group generated total revenues of P14.929 billion in 2010 which is 154% higher than its comparative 2009 level of P5.873 billion. This was brought about by the 126% and 44% increase in sales volume of Petroleum Products and Lubricants respectively. Service revenue also posted an increase by 186% in volume of fuels handled in year 2010 compared to immediately preceding year. Sales revenues from trading and distribution of petroleum products increased by 158% from P 5.489 billion in 2009 to P 14.204 billion in 2010 resulting principally from a wider distribution network and expanded institutional customer base. The 127% increase in volume is complemented also by the increase in average selling price by 13%, from P27.46 per liter in 2009 to P 31.26 per liter in 2010. PPPI had one hundred sixty one (161) operating Phoenix Fuels Life retail service stations as of December 31, 2010 compared to one hundred twenty (120) retail stations as of the same period of last year. A substantial number of these additional stations have yet to fully realize their potential peak sales volume, having been in operation for less than a year. The Group generated P153 million from its fuels service (i.e. hauling and into-plane), lease of its storage facilities, Port Revenue and other service revenue in 2010 versus P 101 million in 2009, or a 94% increase compared to last year. It includes revenue from port operation of P 45 million and P39 million for 2010 and 2009 respectively on PPIPC, the 2009 acquired wholly-owned subsidiary.
53
Cost and expenses The Group recorded this year cost of sales of P13.245 billion, an increase of 158% compared to the 2009 figure of P5.138 billion. The increase was triggered by the 127% increase in volume plus the higher average cost by 17%. Year 2010 average cost is 28.87 per liter compared to 24.68 in 2009 driven by higher average crude prices and sales mix factor.
Selling and administrative expenses increased by 96% as a result of the increasing volume and the ongoing expansion and growth of the Group’s organizational build-out and business operations. Major items that increased out of this retail network expansion and increasing volume are rental, depreciation, travel and transportation, repairs, taxes and licenses and other expenses. The Parent Company is also continuously doing branding and promotional campaign which resulted to higher advertising expenses to improve on brand awareness in the market. Net Income The Group’s total net income is down to P413 million during year 2010 compared to P 751.5 million for 2009. In 2009, the Parent Company recognized a P573 million one-time gain representing non-recurring income due to the booking of the “excess of fair value over acquisition costs”, or negative goodwill arising from the Parent Company’s purchase of 100% of the capital of PPIPC in March 2009. Core operating net income increased by an impressive 132% from P 178 million in 2009 to P 413 million in 2010.
Analysis of Financial Condition and Balance Sheet Accounts (As of December 31, 2010 versus December 31, 2009) Total resources of the Group as of December 31, 2010 stood at P 9.276 billion, an increase of 86% over the P4.986 billion as of December 31, 2009. Cash and cash equivalents increased by 68% from P365 million to P615 million due to higher revenue level during the current year. The Group’s liquidity position continued to hold strong with Current Assets reaching P 4.883 billion as of December 31, 2010, up from P 2.919 billion as of December 31, 2009. Trade and other receivables increased by 87%, from P1.369 billion as of December 31, 2009 to P2.556 billion as of December 31, 2010 as a result of the 152% increase in sales revenue in this year compared to last year. The Company continues to exercise prudence in its credit policies in order to manage customer receivables risk. The receivable is spread over a number of industries and a number of clients. Inventories increased by 130%, from P 458 million as of December 31, 2009 to P1,052 million as of December 31, 2010 as part of the Company’s inventory
54
management strategy. The Company maintains more or less one month of inventory to ensure stable supply in retail stations and commercial/industrial clients. In addition, in a period of rising fuel prices, it would be necessary to build commensurate levels of inventory to improve potential margins. Land Held for Sales are parcels of subdivided lots owned by PPIPC, a wholly owned subsidiary of the PPPI. These lots are intended for sale to prospective buyers. The reduction by 15% was a result of land sale during the year. Further, there are existing memorandums of agreements for purchase of lots with corresponding option money paid. There are also ongoing negotiations with other prospective buyers. Due from related parties net balance is net payable of P38.4 million as of December 31, 2010 which is almost the same level as that of December 31, 2009. The Company’s parent holding company extended advances to support its cash requirement for its capital expenditures. Other current assets as of December 31, 2010 are almost at the same level as that of December 31, 2009. These are prepayments on rentals on retail service stations and depot sites, creditable withholding tax and other various prepayments. As of December 31, 2010, the Group’s property and equipment, net of accumulated depreciation, increased to P2.358 billion compared to P 1.7 billion as of December 31, 2009 as a result of the Company’s continuous expansion of retail service stations, Storage Facilities and Pier Expansion. Land held for future developments are parcel of subdivided lot owned by the wholly owned subsidiary PPIPC. These lots may be sold at its current state or be developed for better selling prices which will yield better returns to the Company. Loans and Borrowings increased by 74% from total P2.318 billion as of December 31, 2009 to P4.034 billion as of December 31, 2010 due the increase short term loans and borrowings are related to the financing of the inventory build-up and accounts receivable trade gapping. Trade and other payables increased by 82%, from P 1.059 billion as of December 31, 2009 to P1.926 billion as of December 31, 2010 as a result of the inventory build-up of the Company using suppliers’ credit. The increase in Other Payable was mostly payables to contractors and suppliers for construction of depots and retail stations. Total Stockholders’ Equity increased to P 3.078 billion as of December 31, 2010 from P 1.529 billion as of December 31, 2009 due to the issuance of primary shares as result of acquisition of CSC (restated report). Net income for 2010 amounting to P 427 million net income and the P 500 million worth of preferred shares issued in 2010 also contributed to the increase. This, however, was minimized by P 13.6 million cash dividend.

55
Key Performance Indicators and Relevant Ratios
The Company’s key performance indicators and relevant ratios and how they are computed are listed below:
2012 2011 2010 Current Ratio1 1.56 : 1 0.97 : 1 0.99: 1 Debt to Equity2 2.67 : 1 2.49 : 1 2.01 : 1 Return on Equity3 15.24% 16.39% 17.92% Net Book Value Per Share4 4.97 5.61 5.61 Earnings Per Share-Adjusted 5 0.63 0.55 044 Notes: 1 - Total current assets divided by current liabilities 2 - Total liabilities divided by tangible net worth 3 - Net income divided by average total stockholders’ equity 4 –Total stockholders’ equity net of preferred divided by the total number of shares issued and outstanding 5 – Net income after tax (net of Preferred dividend) divided by weighted average number of outstanding common shares adjusted to Stock dividends
These key indicators were chosen to provide management with a measure of the Company’s financial strength (Current Ratio and Debt to Equity) and the Company’s ability to maximize the value of its stockholders’ investment in the Company (Return on Equity, Net Book Value Per Share and Earnings Per Share). Likewise, these ratios are used to compare the Company’s performance with similar companies. The Company debt to equity (DE) ratio for 2012 is 2.67: 1 due to needed high level of inventory to maintain to support the sales requirement in the first month of 2013. The immediately preceding two years been steady at 2.49: 1 and 2.01: 1 for 2011 and 2010 respectively. However, the DE for interest bearing liabilities is 2.21:1 and 1.57:1 for 2012 and 2011 respectively. The DE is expected improve this year out of the Groups projected income and various initiatives.
Audit and Audit-Related Fees
The financial statements of the Company were audited by Punongbayan & Araullo for the years ended December 31, 2012 and 2011, and for the year ended December 31, 2010. Said external auditor has no shareholdings in the Company, or any right, whether legally enforceable or not, to nominate persons or to subscribe to the securities of the Company, in accordance with the professional standards on independence set by the Board of Accountancy and the Professional Regulation Commission.
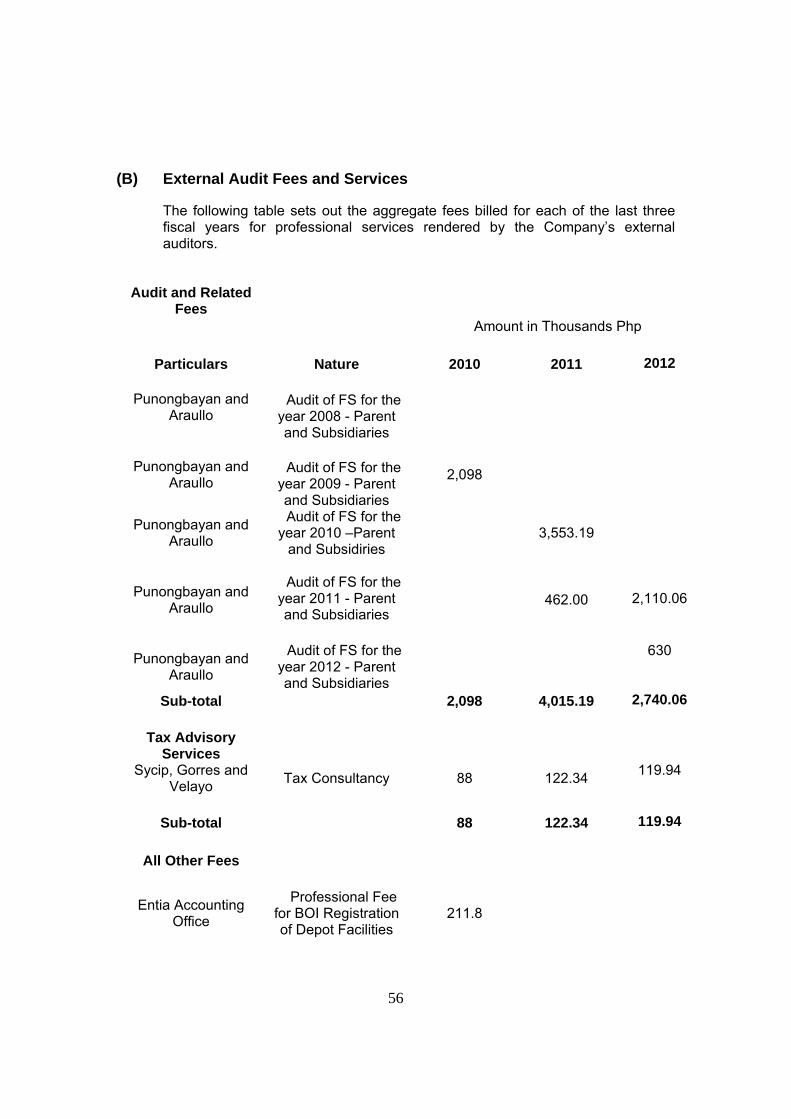
56
(B) External Audit Fees and Services
The following table sets out the aggregate fees billed for each of the last three fiscal years for professional services rendered by the Company’s external auditors.
Audit and Related Fees
Amount in Thousands Php
Particulars Nature 2010 2011 2012
Punongbayan and Araullo
Audit of FS for the
year 2008 - Parent and Subsidiaries
Punongbayan and Araullo
2,098
Audit of FS for the
year 2009 - Parent and Subsidiaries
Punongbayan and Araullo
Audit of FS for the year 2010 –Parent
and Subsidiries 3,553.19
Punongbayan and Araullo
Audit of FS for the
year 2011 - Parent and Subsidiaries
462.00
2,110.06
Punongbayan and Araullo
Audit of FS for the year 2012 - Parent and Subsidiaries
630
Sub-total 2,098 4,015.19 2,740.06
Tax Advisory
Services
Sycip, Gorres and Velayo
Tax Consultancy 88 122.34 119.94
Sub-total 88 122.34 119.94
All Other Fees
Entia Accounting Office
Professional Fee for BOI Registration of Depot Facilities
211.8
57
Sub-total 211.8 -
GRAND TOTAL 2,397.8 4,137.54 2,860.94
In accordance with the Company’s By-laws and Manual of Corporate Governance, in 2007, the Company formed its Audit Committee. The Company’s Audit Committee is composed of at least three (3) members of the Board, preferably with accounting and finance background, one of whom shall be an Independent Director and another should have related audit experience. The chairman of the Audit Committee is s an independent director and he shall be responsible for inculcating in the minds of the members of the Board the importance of management responsibilities in maintaining a sound system of internal control and the Board’s oversight responsibility. The following are the members of the Audit Committee: Monico Jacob (Independent Director) as Chairman, and Domingo T. Uy and J.V. Emmanuel De Dios as members. The Internal Audit systems of the Company are in place since 2008 but these auditing tools were strengthened this year. The Internal Audit’s role and responsibilities are defined in the Audit Charter approved by the Board of Directors. Primarily, it assists the Audit Committee of the Board in fulfilling its oversight responsibility to the shareholders by bringing a systematic, disciplined approach to evaluating and improving the effectiveness of governance, risk management and internal control processes. Internal Audit, in fulfilling its role, performs the following general functions: 1.) evaluating the Company’s governance processes including ethics-related programs; 2.) performing an objective assessment of the effectiveness of risk management and internal control framework, identifying risk exposures and recommending strategies to mitigate them; 3.) evaluating the reliability and integrity of financial statements and the financial reporting process; 4.) analyzing and evaluating business processes and associated controls; 5.) determining compliance with applicable laws and regulations.
Changes In and Disagreements With Accountants
The Company has not had any disagreement with its previous and current external auditor / independent public accountant on any matter of accounting principles or practices, financial statement disclosure or auditing scope or procedure.
58
PART IV – MANAGEMENT AND CERTAIN SECURITYHOLDERS
(A) Directors and Executive Officers of the Registrants
The Company’s members of the Board of Directors are herewith described below with their respective experiences.
(1) Directors Domingo T. Uy Chairman Domingo T. Uy, Filipino, 66 years old, is a co-founder and has been a member of the Board of Directors of the Company since 2002. Mr. Uy was elected Chairman of the Board of Directors of the Company on February 15, 2007. He is also a Director of Granland Resources Corporation, a corporation involved in real estate development. Mr. Uy is actively involved in socio-civic programs and is a Director of the Philippine Red Cross - Davao Chapter. He is the Vice Chairman of the Board of Trustees of the Davao Central High School. He is also the Past President of the Davao City Sta. Ana Lions Club and the Kang Ha Uy Association - Davao Chapter. Dennis A. Uy Director, President and Chief Executive Officer Dennis A. Uy, Filipino, 39 years old, is the founder of the Company and has served as President and Chief Executive Officer since inception. He is the Chairman and President of Phoenix Petroleum Holdings, Inc., the holding company of the Company, and Udenna Corporation, the ultimate parent company. The subsidiaries of the Company are Chelsea Shipping Corp., Phoenix Petroterminals & Industrial Park Corp., Subic Petroleum Trading & Transport Philippines, Inc., PFL Petroleum Management, and Phoenix Global Mercantile, Inc. Among the subsidiaries of Udenna Corporation are Udenna Management & Resources Corp, One Subic Power, Global Synergy Trade and Distribution Corp., Udenna Development Corporation, Value Leases, Inc., Udenna Environmental Solutions, and Udenna Energy Corporation. Mr. Uy is also Chairman of F2 Logistics, Phoenix Philippines Foundation, Inc. and Udenna Foundation, Inc. He is a member of the Young Presidents Organization - Philippine chapter and the Philippine Business for Social Progress. Mr. Uy is the Honorary Consul of Kazakhstan to the Philippine since November 2011. He is a graduate of De La Salle University with a degree in Business Management. Romeo B. De Guzman Director, Chief Operating Officer Romeo B. De Guzman, Filipino, 63 years old, was elected Director of the Company in 2009. He is Chief Operating Officer of the Company, bringing with him 35 years of outstanding experience in the oil industry. Before joining the Company, he was with Pilipinas Shell Petroleum Corporation, where he was Vice
59
President for External Affairs for Asia Pacific and a member of the Board of Directors up to Dec. 2006. He was with the said company holding various management and executive positions. He also worked with Getty Oil Philippines Inc. for 10 years, prior to joining Pilipinas Shell. He carries with him a Marketing Management and an MBA degree from San Sebastian College – Manila. Jose Manuel R. Quimson Director Jose Manuel R. Quimson, Filipino, 64 years old, has been a Director of the Company since February 15, 2007. He is concurrently the General Manager of Phoenix Petroterminals & Industrial Park Corp and the Chief Operating Officer of Chelsea Shipping Corp. Mr. Quimson is a member of the Board of Directors of the Udenna Corporation and its subsidiaries. Previously, he was President of Petrotrade Philippines, Inc. a company providing bunkering services to international vessels. Mr. Quimson has more than 30 years of work experience in the shipping industry. Socorro T. Ermac-Cabreros Director, AVP for Corporate Legal and Corporate Secretary Socorro T. Ermac-Cabreros, Filipino, 47 years old, was elected Director and appointed Corporate Secretary on February 15, 2007. She is concurrently Asst. Vice President for Corporate Legal of the Company. She is also the Corporate Secretary and member of the Board of Directors of Udenna Corporation and its subsidiaries. Prior to joining the Company, she was a Legal Counsel of Philippine National Bank in Davao City. She has worked for the government such as Office of the Ombudsman for Mindanao and later as Prosecutor for the Province of Davao del Norte after engaging in the private practice of law. She finished her law degree at the Ateneo de Davao University College of Law. She is the immediate past President for the Davao City Chapter of the Integrated Bar of the Philippines. Atty. J.V. Emmanuel A. De Dios Director J.V. Emmanuel A. De Dios, Filipino, 48 years old, was Independent Director of PPPI on 2007 and a regular director since 2008. He is the CEO of GE Philippines. Prior to PPPI, he was the President and CEO of Nido Petroleum Pty Ltd. He was Managing Director of Merritt Advisory Partners, Inc. and Member of the Board of Directors of Davies Energy Systems, Inc. He also served as Chairman of the Board of the Philippine National Oil Company Exploration Corporation and Undersecretary of the Philippine Department of Energy. He graduated from the Ateneo School of Law with a degree in Bachelor of Laws. He took up Master of Laws at the Harvard University. Diana Pardo Aguilar Director Diana Pardo-Aguilar, 49 years old, is a Director of the Company since December 3, 2010. She served as the Social Security System Commissioner on August

60
2010 and is currently the chairperson of the Investment Oversight Committee and a member of the Audit Committee. She also sits as Board Director in many other institutions engaged in Banking, E-Commerce, Food and Retail, Real Property Management and Education. Prior to her assumption of directorship, she worked in CLSA Exchange Capital Corporation, Exchange Capital Corporation and Jardine Fleming Exchange Capital Corporation. She graduated from De La Salle University with a degree in BS Computer Science and holds a Masters Degree in Business Administration, major in International Finance from Pepperdine University in California. Ricardo S. Pascua Independent Director Ricardo S. Pascua, Filipino, 64 years old, has been Independent Director of the Company since February 15, 2007. He is Chairman of the Board of Caelum Developers, Facilities and Property Mgmt Technologies and Lucena Biodiesel Energy Corporation. Prior to PPPI, he was the Vice Chairman, President and Chief Executive Officer of the Metro Pacific Corporation and the Fort Bonifacio Development Corporation. Monico V. Jacob Independent Director Monico V. Jacob, 67 years old, is an Independent Director of PPPI (from March 7, 2008 to present). He is President and CEO of the STI Education Systems Holdings, Inc., a publicly listed company, STI Education Services Group, STI Investments, Inc., Philplans First, Inc., Philhealthcare, Inc., Philippine Financial Assurance Corporation, and Total Consolidated Asset Management, Inc. He is Chairman of the Global Resource for Outsourced Workers (GROW), Inc. and a Partner of the Jacob and Jacob Law Firm. He was formerly Associate Commissioner of the Securities and Exchange Commission, General Manager of National Housing Authority, and CEO of the Pag-Ibig Fund. Prior to his assumption as director of PPPI, Mr. Jacob was the Chairman and Chief Executive Officer of Petron Corporation and of the Philippine National Oil Company. Advisor to the Board: Stephen A. Cu Unjieng Senior Managing Director of Evercore Partners and Chairman of Evercore Asia Limited
(2) Other Executive Officers
Joseph John L. Ong, Filipino, 53 years old, is currently the Chief Finance Officer of PPPI. He was the Executive Vice President for Operations and Chief Finance Officer of Primeworld Digital Systems, Inc.He served as the Vice
61
President for Treasury at Ginebra San Miguel, Inc. from 1995 to 1999. He had held various positions in Bank of the Philippine Islands & Ayala Investment & Development Corp. from 1980 to 1986. He graduated from De La Salle University with a degree of Bachelor of Science in Commerce.
Chryss Alfonsus V. Damuy, Filipino, 39 years old has been with PPPI since 2007. Prior to PPPI, he was the Controller of Lapanday Foods Corporation. Currently, he is the Treasurer and Vice President for Finance of PPPI. He also had worked in Fresh Asia Produce, Mindanao Fresh Produce Services Corporation, Regional Educators Multi-purpose Cooperative and Holy Cross of Davao College. He is a Certified Public Accountant
Alan Raymond T. Zorrilla, Filipino, 43 years of age, is the Vice President for External Affairs, Business Development and Security of PPPI. Prior to his assumption as officer of PPPI, he was the Chief Legal Counsel of Unioil Group of Companies. He also held directorship position at Freeport Services Corporation, a 100% subsidiary of Subic Bay Metropolitan Authority. He graduated from San Beda College with a degree of Bachelor of Laws.
Edgardo A. Alerta, Filipino, 57 years old, is currently the Assistant Vice President for Commercial Sales for Mindanao. Before joining PPPI, he held various positions at Pilipinas Shell Petroleum Corporation, Getty Oil Philippines and Department of Energy. He graduated from Cebu Institute of Technology with degree in Bachelor Science in Mechanical Engineering and Electrical Engineering.
Joselito G. de Jesus, Filipino, 58 years old, is the Assistant Vice-President for Commercial Sales Luzon-Visayas of PPPI. He was the Assistant Vice-President for Reseller Trade of Petron Corporation and Corporate Planning Manager/Coordinator of the Philippine National Oil Company (PNOC). He had a 17-year stint at Petron Corporation. He graduated from the University of the Philippines with a degree in BS Business Administration and has a Masters degree in Business Administration from Ateneo Graduate School of Business. Jose Roel C. Cruz, Filipino, 45 years old, is the Assistant Vice President for Retail Sales in Visayas & Mindanao. Before joining PPPI, he held various positions at Pilipinas Shell Petroleum Corporation from 1988 to 2011. He graduated from De La Salle University and is a licensed Electronics and Communications Engineer.
Alberto D. Alcid, Filipino, 57 years old, is the Assistant Vice President for Lubes and Chemicals of PPPI. Prior to PPPI, he was the National Manager for Lubes and Greases of Caltex Philippines. He graduated from De La Salle University with a degree in BS Mechanical Engineering.
Rebecca Pilar C. Caterio, Filipino, 41 years old, is currently the Assistant Vice President for Credit and Collection of PPPI. Before joining PPPI, she held various positions in Lapanday Packaging Inc. and its subsidiaries. She was also a Staff Auditor at SGV & Co. She is a Certified Public Accountant and a member of the Philippine Institute of Certified Public Accountants (PICPA) since 1993. She graduated from the Ateneo De Zamboanga with a degree in BS in Commerce.
62
Reynaldo A. Phala, Filipino, 46 years old, is the Assistant Vice President for Treasury. He has been with PPPI since 2008 as its Credit and Collection Manager. Before PPPI, he had worked in various banks for seventeen (17) years. He also worked with the Department of Trade and Industry as Municipal Trade and Industry Officer. He is a graduate of Bachelor of Science in Civil Engineering from the Mindanao State University-General Santos City. He is a licensed Civil Engineer.
Jose Victor L. Cruz, Filipino, 52 years old, is currently the Assistant Vice President for Retail Sales in Luzon. Prior to PPPI, he was the Chief Operating Officer of Flying V. He was also the COO of Citadel Commercial, Inc. and held various positions in Caltex Philippines Inc. from 1983 up to 1991. He graduated from De La Salle University with a Masters degree in Business Administration.
William M. Azarcon, Filipino, 66 years old is currently the Assistant Vice President for Operational Engineering and Logistics. Before PPPI, he joined Pilipinas Shell Petroleum Corporation, where his last appointment was as Field Engineer in Operations and concurrent Head of Operation. He graduated from Mapua Institute of Technology with a degree in Bachelor of Science in Mechanical Engineering. Gigi Q. Fuensalida, Filipino, 36 years old, is the Assistant Corporate Secretary of the Company. Prior to PPPI, she was a Senior Associate of the Villaraza Cruz Marcelo and Angangco Law Office. She specialized in Civil, Commercial and Criminal Litigation for six years before she joined PPPI. She graduated from the Ateneo de Manila University with a degree in Bachelor of Laws. John Henry C. Yap, Filipino, 38 years old, has been the Trading and Supply Manager of PPPI since 2009. Prior to PPPI, he worked as a Purchasing Manager for Golden Forum Land Inc. and Supply Manager of Oilink International Corp. He also held several positions in Unioil Petroleum Philippines, Inc., where his last appointment was as Lubricants Supply Manager. He graduated from De La Salle University with a degree in BS Industrial Engineering and holds a Masters degree in Business Administration from the Ateneo Graduate School of Business.
(3) Significant Employees
There are no significant employees or personnel who are not executive officers but are expected to make a significant contribution to the business.
(4) Family Relationships With the exception of Messrs. Domingo T. Uy and Dennis A. Uy who are related to each other by consanguinity within the first civil degree, there are no other family relationships either by consanguinity or affinity up to the fourth civil degree among the directors, executive officers, and persons nominated and chosen by the Company to become directors and executive officers of the Company.
63
(5) Involvement in Certain Legal Proceedings
The Company’s Independent Director, Monico V. Jacob, in his capacity as then Chairman of Petron Corporation, was recently impleaded in a case together with some government officials for Violation of Republic Act 3019 otherwise known as the Anti-Graft and Corrupt Practices Act involving tax credit payments. The case is now pending with the Sandiganbayan. On the other hand, on 05 May 2011, news reports surfaced on the alleged filing by the Bureau of Customs (“BOC”) of a PHP5Billion case against Dennis A. Uy and other respondents for alleged violation of Sections 3602, 2501(l)(1) & (5), 1801, 1802 and 3604 of the Tariff and Customs Code of the Philippines. On 06 July 2011, the subpoena issued by the Department of Justice was received by Mr. Uy. On 16 November 2012, the Department of Justice dismissed the case against Dennis Uy and other respondents. Except for the above, to the best of the Company’s knowledge there has been no occurrence during the past five (5) years up to the date of this Report of any of the following events which are material to an evaluation of the ability or integrity of any director, person nominated to become a director, executive officer, or control person of the Company: Any insolvency or bankruptcy petition filed by or against any business of which such person was a general partner or executive officer either at the time of the insolvency or within two years prior to that time; Any conviction by final judgment in a criminal proceeding, domestic or foreign, or any pending criminal proceeding, domestic or foreign, excluding traffic violations and other minor offenses; Any final and executory order, judgment, or decree or any court of competent jurisdiction, domestic or foreign, permanently or temporarily enjoining, barring, suspending, or otherwise limiting involvement in any type of business, securities, commodities, or banking activities; and Any final and executory judgment by a domestic or foreign court or competent jurisdiction (in a civil action), the Securities and Exchange Commission ( “SEC”), or comparable foreign body, or a domestic or foreign exchange or electronic marketplace or self-regulatory organization, for violation of a securities or commodities law. (e) Certain Relationships and Related Transactions The Group’s related parties include the ultimate parent company, parent company, stockholders, the Group’s key management and others as described below and in the succeeding pages. The following are the transactions with related parties:
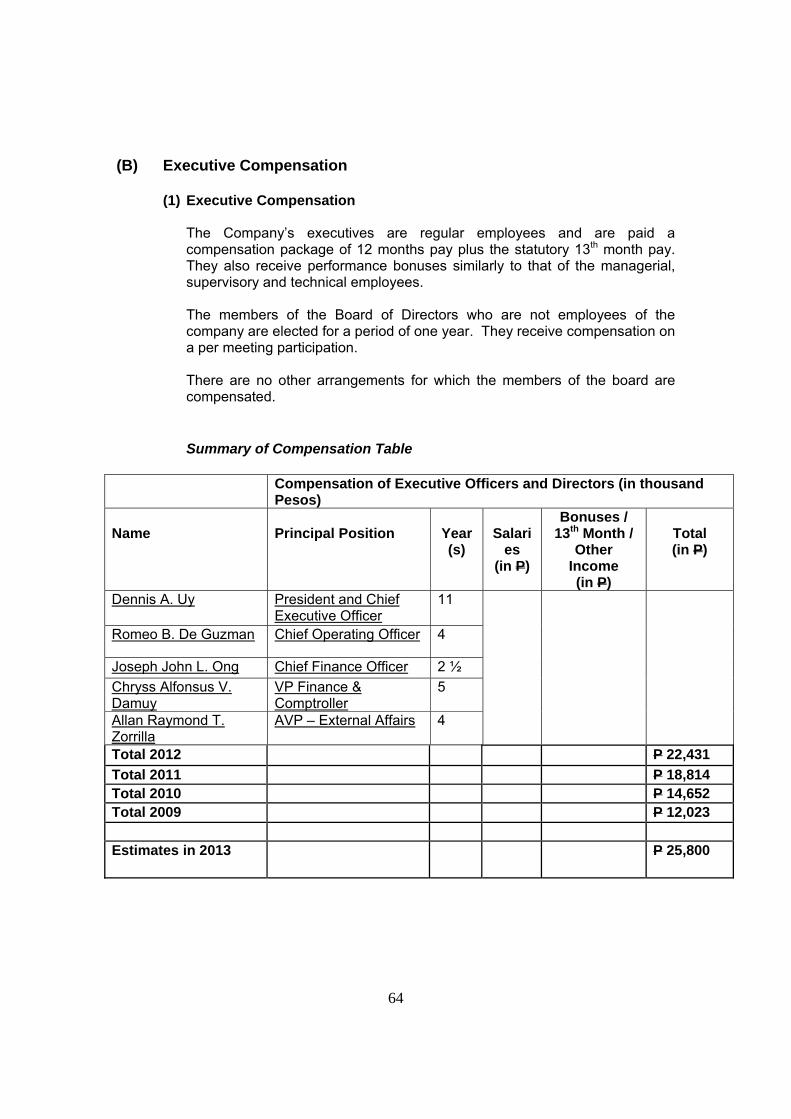
64
(B) Executive Compensation
(1) Executive Compensation The Company’s executives are regular employees and are paid a compensation package of 12 months pay plus the statutory 13th month pay. They also receive performance bonuses similarly to that of the managerial, supervisory and technical employees. The members of the Board of Directors who are not employees of the company are elected for a period of one year. They receive compensation on a per meeting participation. There are no other arrangements for which the members of the board are compensated.
Summary of Compensation Table
Compensation of Executive Officers and Directors (in thousand Pesos)
Name
Principal Position
Year (s)
Salari
es (in P)
Bonuses / 13th Month /
Other Income (in P)
Total (in P)
Dennis A. Uy President and Chief Executive Officer
11
Romeo B. De Guzman Chief Operating Officer 4
Joseph John L. Ong Chief Finance Officer 2 ½
Chryss Alfonsus V. Damuy
VP Finance & Comptroller
5
Allan Raymond T. Zorrilla
AVP – External Affairs 4
Total 2012 P 22,431
Total 2011 P 18,814 Total 2010 P 14,652 Total 2009 P 12,023 Estimates in 2013 P 25,800

65
(C ) Security Ownership of Certain Beneficial Owners and Management
As of January 31, 2013 the security ownership of management is as follows:
Title of
Class of Securities
Name/Address of Beneficial Owner
Amount and Nature of Beneficial Ownership
Citizenship
% of Ownershi
p
Directors: Common Dennis A. Uy
Stella Hizon Reyes Rd., Bo. Pampanga, Lanang, Davao City
3,070,624 direct beneficial
owner
Filipino 0.33%
Common Dennis A. Uy &/or
Cherylyn C. Uy Stella Hizon Reyes Rd., Bo. Pampanga, Lanang, Davao City
884,662 direct beneficial
owner
Filipino 0.09%
Common Domingo T. Uy
Insular Village Phase II, Lanang, Davao City
496,861 direct beneficial
owner
Filipino 0.05%
Common Romeo B. De Guzman
Hillsborough, Alabang Village, Muntinlupa City
54,600
direct beneficial owner
Filipino 0.01%
Common Socorro T. Ermac
Cabreros 223 V. Mapa St., Davao City
79,474 direct beneficial
owner
Filipino 0.01%
Common Jose Manuel R.
Quimson 28 Osmeña St., Xavierville Subd., Loyola Heights, Katipunan, Quezon City
273,031
direct beneficial owner
Filipino 0.02%
Common J.V. Emmanuel A. De
Dios c95 A. Melchor St., Loyola Heights, Quezon City
1
direct beneficial owner
Filipino 0.00%

66
Common Ricardo S. Pascua 3 Pebblewood cor. Fairwood, McKinely Hill Village, Taguig City
1
direct beneficial owner
Filipino 0.00%
Common Monico V. Jacob
7th flr Philippine First Bldg, 6764 Ayala Ave., Makati City
1
direct beneficial owner
Filipino 0.00%
Common
Diana Pardo-Aguilar 205 Cadena de Amor Street Ayala Alabang Village Muntinlupa City
1
direct beneficial owner
Filipino
0.00 %
Senior Management: Common Chryss Alfonsus V.
Damuy Ph2 Blk 07 Lot 07, Wellspring Highlands Subd. Catalunan Pequeno Davao City 8000
54,600
direct beneficial owner
Filipino 0.01%
Common Alberto D. Alcid
Doña Socorro St., Belisario Heights Subd., Lanang, Davao City
46,481
direct beneficial owner
Filipino 0.01%
Common Edgardo A. Alerta
Fortune Executive Homes Lanang, Davao City
245,004
direct beneficial owner
Filipino 0.03%
Common Rebecca Pilar C. Caterio
Margarita Village, Bajada, Davao City
114,195
direct beneficial owner
Filipino 0.01%
Common
Gigi Q. Fuensalida 155 Brillantes St. 5th Avenue, Caloocan City
54,600
direct beneficial owner
Filipino
0.01%
Common Reynaldo A. Phala
Block 5 Lot 20 Pioneers Village
27,300
direct beneficial owner
Filipino 0.00%
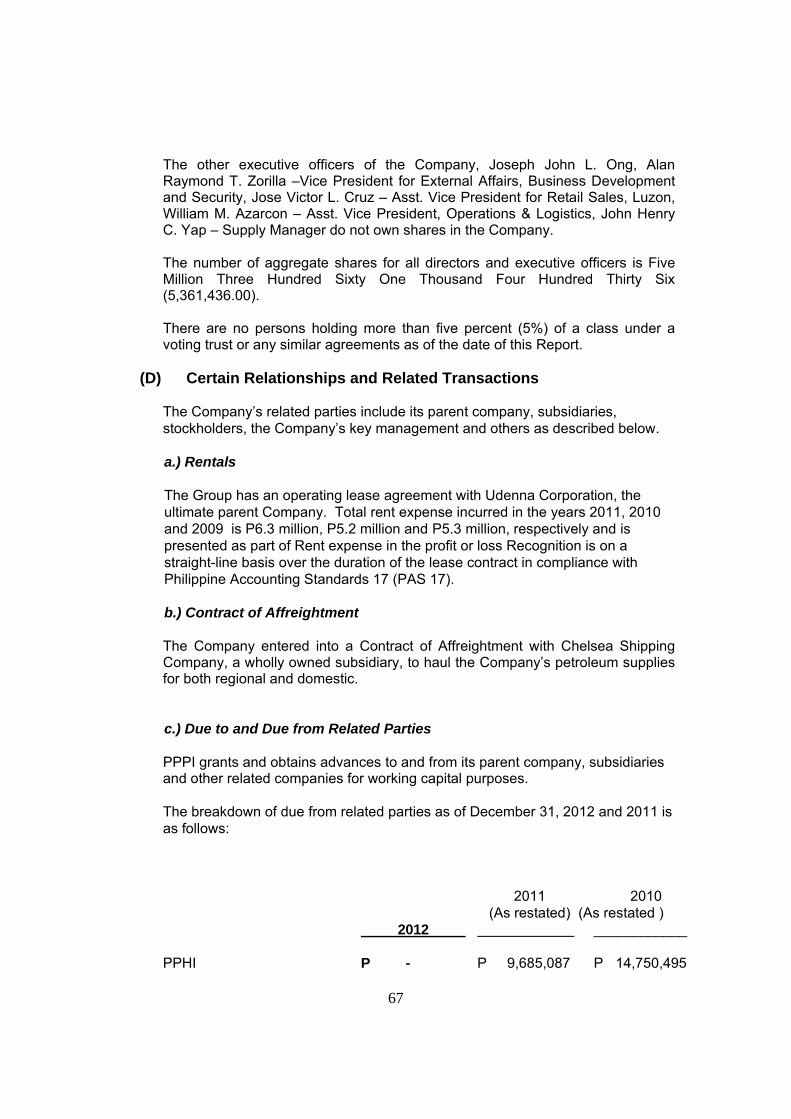
67
The other executive officers of the Company, Joseph John L. Ong, Alan Raymond T. Zorilla –Vice President for External Affairs, Business Development and Security, Jose Victor L. Cruz – Asst. Vice President for Retail Sales, Luzon, William M. Azarcon – Asst. Vice President, Operations & Logistics, John Henry C. Yap – Supply Manager do not own shares in the Company. The number of aggregate shares for all directors and executive officers is Five Million Three Hundred Sixty One Thousand Four Hundred Thirty Six (5,361,436.00). There are no persons holding more than five percent (5%) of a class under a voting trust or any similar agreements as of the date of this Report.
(D) Certain Relationships and Related Transactions
The Company’s related parties include its parent company, subsidiaries, stockholders, the Company’s key management and others as described below. a.) Rentals The Group has an operating lease agreement with Udenna Corporation, the ultimate parent Company. Total rent expense incurred in the years 2011, 2010 and 2009 is P6.3 million, P5.2 million and P5.3 million, respectively and is presented as part of Rent expense in the profit or loss Recognition is on a straight-line basis over the duration of the lease contract in compliance with Philippine Accounting Standards 17 (PAS 17).
b.) Contract of Affreightment The Company entered into a Contract of Affreightment with Chelsea Shipping Company, a wholly owned subsidiary, to haul the Company’s petroleum supplies for both regional and domestic.
c.) Due to and Due from Related Parties
PPPI grants and obtains advances to and from its parent company, subsidiaries and other related companies for working capital purposes. The breakdown of due from related parties as of December 31, 2012 and 2011 is as follows:
2011 2010 (As restated) (As restated ) 2012 ____________
PPHI P - P 9,685,087 P 14,750,495
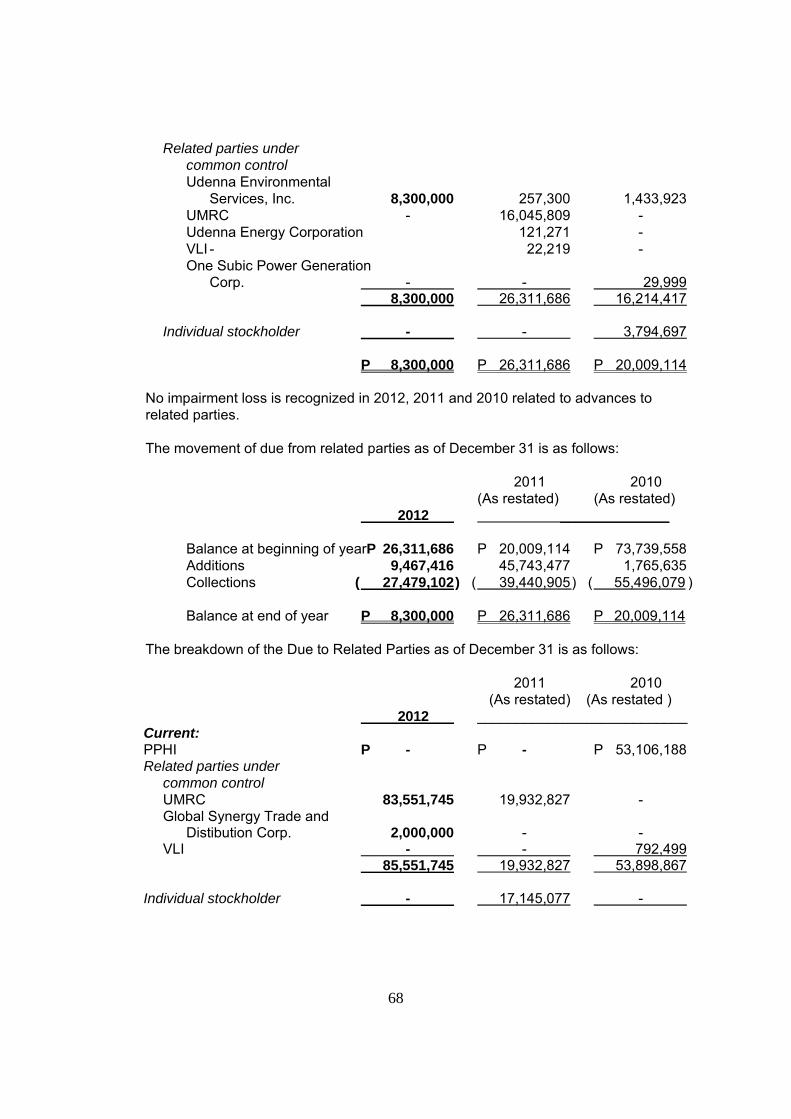
68
Related parties under common control Udenna Environmental Services, Inc. 8,300,000 257,300 1,433,923 UMRC - 16,045,809 - Udenna Energy Corporation 121,271 - VLI - 22,219 - One Subic Power Generation
Corp. - - 29,999 8,300,000 26,311,686 16,214,417
Individual stockholder - - 3,794,697
P 8,300,000 P 26,311,686 P 20,009,114
No impairment loss is recognized in 2012, 2011 and 2010 related to advances to related parties. The movement of due from related parties as of December 31 is as follows:
2011 2010 (As restated) (As restated) 2012 ______________ Balance at beginning of yearP 26,311,686 P 20,009,114 P 73,739,558 Additions 9,467,416 45,743,477 1,765,635 Collections ( 27,479,102 ) ( 39,440,905 ) ( 55,496,079 )
Balance at end of year P 8,300,000 P 26,311,686 P 20,009,114
The breakdown of the Due to Related Parties as of December 31 is as follows: 2011 2010
(As restated) (As restated ) 2012 ___________________________ Current: PPHI P - P - P 53,106,188 Related parties under common control UMRC 83,551,745 19,932,827 - Global Synergy Trade and Distibution Corp. 2,000,000 - - VLI - - 792,499 85,551,745 19,932,827 53,898,867 Individual stockholder - 17,145,077 -
69
(E) Corporate Governance
Corporate powers and governance of the Company is exercised by the Board of Directors which consists of nine (9) members, two (2) of whom are independent directors. As a matter of policy and based on good corporate practice, unless a special meeting is called upon for a specific purpose, the Board regularly meets every quarter wherein which the relevant corporate issues may be raised for discussion and voted by the members of the Board. Last March 07, 2008, during the regular meeting of the Board, the Manual of Corporate Governance which incorporated the best practices was approved and adopted to establish the principles of good corporate governance for the entire Corporation. The adoption of the new Manual of Corporate Governance supersedes the old manual of corporate governance prescribed by the SEC which was then observed and followed by the Company. Moreover, the adoption of the new Manual now complies with the SEC requirement that before assuming office, a director must attend a seminar on corporate governance conducted by a duly recognized government or private institution. Last January 30, 2008, the Company through the Corporate Secretary has submitted a document certifying the attendance of the members of the Board of Directors in all regular meetings for the year 2007 as well as the compliance to the provisions of the Manual of Corporate Governance prescribed by the SEC as adopted by the Company. March 03, 2009 was the submission and compliance with the Certification of the Company’s Compliance Officer to the extent of compliance with its Manual for Corporate Governance. As part of the Corporate Governance, the Group works on the early disclosures of quarterly and annual reports to SEC and PSE. Internal Audit Group of the Company conducts regular internal audit review to both processes, compliance to Company policies and procedures and risk analysis. Reports and recommendations submitted for board review and actions.
70
PART V – EXHIBITS AND SCHEDULES Exhibits and Reports on SEC Form 17-C Exhibits The following exhibits are incorporated by reference in this report.
Consolidated Financial Statements of the Company as of and for the year ended 31 December 2011
Index to Financial Statements and Supplementary Schedules Reports on SEC Form 17-C The following disclosures have been reported and disclosed to the Commission for the year 2012 up to January 31, 2013 which were duly supported by disclosure letters:
2012 January 6, 2012 Report on the Top Stockholder of the Company as of Dec. 31,
2011 Board Lot Report as of December 31, 2011 Foreign Ownership Report as of December 31, 2011 January 13, 2012 Certification on the attendance of the Company’s Board of
Directors and compliance of the Manual of Corporate Governance for 2011.
Disclosure on the Company’s purchased 100% equity shares in Subic Petroleum Trading and Transport Phils. Inc. (SPTT)
Awards and Achievements January 16, 2013 Conclusion of Purchase of Subic Petroleum Trading and
Transport Phils. Inc.
Receipt of Accolade and Achievements by PNX and President & CEO
January 31, 2012 Increase in the Authorized Capital Stock of the Company from 750,000,000 common shares to 2,500,000,000 common shares.
February 2, 2012 Disclosure of Notice and Agenda of the Company’s Annual Stockholders Meeting
February 3, 2012 Board Lot Report as of January 31, 2012 February 7, 2012 Report on the Top 100 Stockholders as of January 31, 2012 Report of Award from the Bureau of Customs as one of the Top 7
importers for year 2011 February 8, 2012 Record and Payment of Cash & Stock Dividend. Annual Report for Year 2010 (SEC Form 17-A) Disclosure on the press statement in relation to the Company’s
performance for calendar year 2011 February 13, 2012 Definitive Information Statement for Annual Stockholders’ Meeting
on March 8, 2012 February 14, 2012 SEC Form 23-B of Atty. J.V. Emmanuel De Dios for his

71
disposition of PNX Shares. February 21, 2012 Disclosure of Stockholders of record as of Feb.14, 2012 who shall
be entitled to vote and participate during the ASM on March 8, 2012
March 5, 2012 Disclosure on the Board lot report as of February 29, 2012. SEC Form 23-B of Mr. Romeo B. de Guzman for his additional
purchase of PNX Shares. March 7, 2012 Notice of Investors’ Briefing on March 12, 2012 March 8, 2012 Disclosure of Company’s Public Ownership Report as of
December 31, 2011 Record and Payment dates of Cash & Stock Dividends. Disclosure on the Results of the 2012 Annual Stockholders’
Meeting. Disclosure of approved and authorized the corporation to conduct,
do, perform and undertake capital and/or equity fund raising activities
March 9, 2012 Disclosure on the dividend declaration to announce and specify that the issuance of stock dividend shall be taken from the unissued capital stock of the Company.
March 22, 2012 Disclosure on the Philippine Ratings Service Corporation (PhilRatings) has rated Phoenix Petroleum Philippines, Inc. a rating of PRS Aa in a possible issuance of Php1-Billion corporate notes and/or bonds.
Final computation on the adjusted price and the adjusted issued & outstanding shares based on market data.
April 3, 2012 Compliance Report on Corporate Governance for Year 2011 April 10, 2012 Disclosure on the Phoenix Petroleum Holdings Inc. Subscription
of 193,000,000 common shares. April 16, 2012 Disclosure of Company’s Public Ownership Report as of March
31, 2012 April 23, 2012 Top 100 Stockholders as of March 31, 2012 April 23, 2012 Disclosure of Securities and Exchange Commission approval of
the Amendment of the Company’s Articles of Incorporation particularly Article VII increasing the Company’s Authorized Capital Stock from Php800,000,000.00 to Php2,550,000,000.00
April 24, 2012 Disclosure on Top 100 Stockholders as of March 31, 2012 April 26, 2012 Disclosure on the press statement in relation to the results of the
Company’s First Quarter Report (SEC 17Q) for the period ended March 31, 2012.
April 27, 2012 Disclosure of the revised Certification on the attendance of the Company’s Director on the Board Meetings for the year 2011.
May 2, 2012 Additional Information re: Subscription by PPHI of PNX Shares May 3, 2012 Notice of Investors’ Briefing on March 8, 2012 May 4, 2012 Correction re: Notice of Investors’ Briefing on May 8, 2012 May 21, 2012 Disclosure on the press statement in relation to the company’s
recent recognition and citation from Finance Asia June 25, 2012 Clarification of news article” “BOI approves P718-Million Phoenix
Pet Investment” July 06, 2012 Disclosure on the Board lot report as of June 30, 2012. Disclosure of: (i) Issuance of convertible notes worth Php500
72
million with issuance of Php180 million warrant with BDO Universal Bank; (ii) Amendment of the Article of Incorporation particularly Article II paragraph 3 on Secondary Purposes; (iii) Engagement and appointment of the services of Evercore Asia Limited as financial Adviser for purposes of capital raising activities; (iv) Amendment of the Article III Section 1 (a) on Composition on the BOD the number from nine (9) to eleven (11); (v) Conduct of a Special Stockholders Meeting; and (vi) Strategic acquisition of 100% shares of stock of Chelsea Shipping Corp.
July 08, 2012 Disclosure on the press statement in relation to the Issuance of Php500 million convertible notes to BDO
July 09, 2012 Press statement in relation to the company’s Acquisition of Chelsea Shipping Corp.
Board approval of issuance of convertible notes/warrants, amendment to Articles of
July 11, 2012 Disclosure of PPPI executed a Convertible Notes Facility Agreement worth Php500 million with warrants offering amounting to Php180 million with BDO Unibank, Inc.
July 13, 2012 Top 100 Stockholders as of June 30, 2012 July 15, 2012 Disclosure of Company’s Public Ownership report as of June 30,
2012 July 18, 2012 Compliance with the SEC letter dated July 11, 2012 requiring the
submission of a comprehensive disclosure on the acquisition of Chelsea Shipping Corp.
July 24, 2012 Disclosure of Company’s approved various corporate actions July 26, 2012 Disclosure of Notice and Agenda of Special Stockholders’
Meeting July 27, 2012 Definitive Information Statement for the Special Stockholders’
Meeting August 03, 2012 Disclosure on the Board lot report as of July 31, 2012 August 9, 2012 Quarterly Report for Period Ended June 30, 2012 Press Release: “Phoenix Petroleum 1st half revenue up by 21% September 06, 2012
Disclosure on the Board lot report as of August 31, 2012
Disclosure on the Results of the 2012 Special Stockholders’ Meeting.
September 7, 2012 Press Release: “Phoenix Petroleum Stockholders approve BDO converts, purchase of Chelsea Shipping”
September 24, 2012
Press Release: “Phoenix Petroleum’s Possible Debt Issuance Gets a PRS Aa minus rating”
October 15, 2012 Disclosure of Company’s Public Ownership Report as of September 30, 2012
Disclosure of Acquisition of the 100% common shares in Chelsea Shipping Corp. via share-for-share swap agreement
Top 100 Stockholders as of September 30, 2012
November 07, 2012 Disclosure of the Issuance of a Five-year Fixed Rate Notes Facility up to Two Billion Five Hundred Million Pesos (Php2,500,000,000.00)
November 09, 2012 Clarification of News Article: “Phoenix Petroleum Issues P2.5B
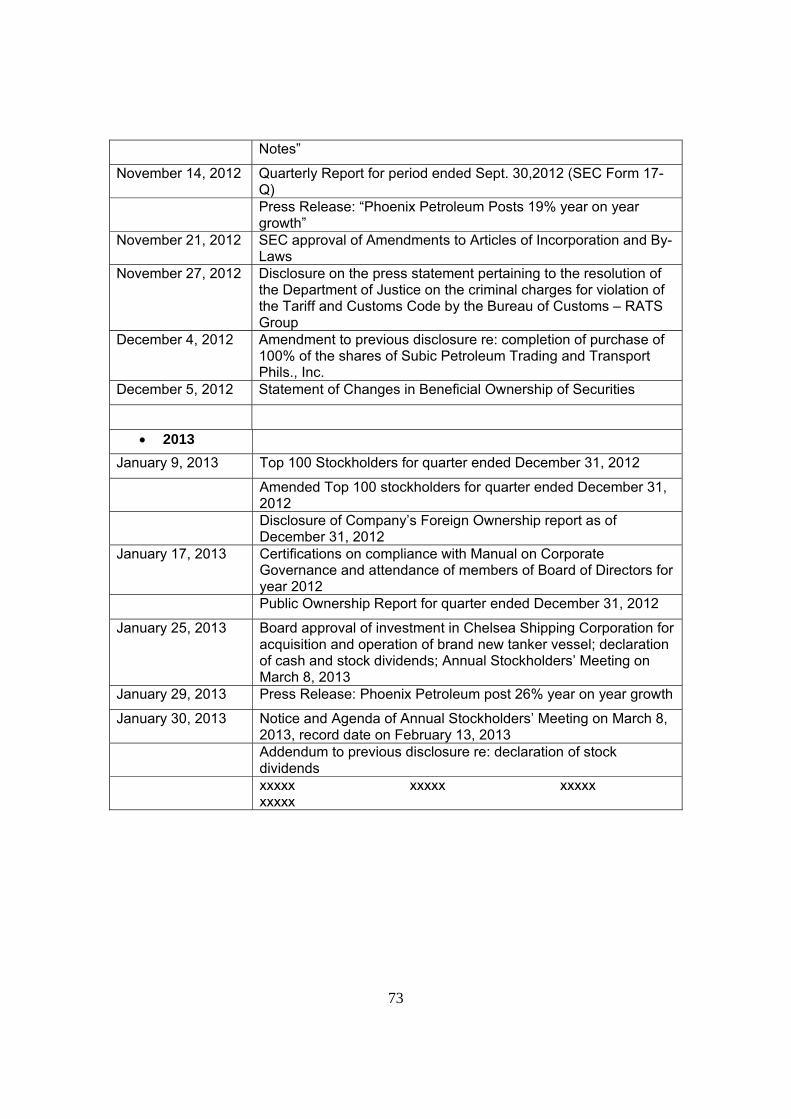
73
Notes”
November 14, 2012 Quarterly Report for period ended Sept. 30,2012 (SEC Form 17-Q)
Press Release: “Phoenix Petroleum Posts 19% year on year growth”
November 21, 2012 SEC approval of Amendments to Articles of Incorporation and By-Laws
November 27, 2012 Disclosure on the press statement pertaining to the resolution of the Department of Justice on the criminal charges for violation of the Tariff and Customs Code by the Bureau of Customs – RATS Group
December 4, 2012 Amendment to previous disclosure re: completion of purchase of 100% of the shares of Subic Petroleum Trading and Transport Phils., Inc.
December 5, 2012 Statement of Changes in Beneficial Ownership of Securities
2013
January 9, 2013 Top 100 Stockholders for quarter ended December 31, 2012
Amended Top 100 stockholders for quarter ended December 31, 2012
Disclosure of Company’s Foreign Ownership report as of December 31, 2012
January 17, 2013 Certifications on compliance with Manual on Corporate Governance and attendance of members of Board of Directors for year 2012
Public Ownership Report for quarter ended December 31, 2012
January 25, 2013 Board approval of investment in Chelsea Shipping Corporation for acquisition and operation of brand new tanker vessel; declaration of cash and stock dividends; Annual Stockholders’ Meeting on March 8, 2013
January 29, 2013 Press Release: Phoenix Petroleum post 26% year on year growth
January 30, 2013 Notice and Agenda of Annual Stockholders’ Meeting on March 8, 2013, record date on February 13, 2013
Addendum to previous disclosure re: declaration of stock dividends
xxxxx xxxxx xxxxx xxxxx
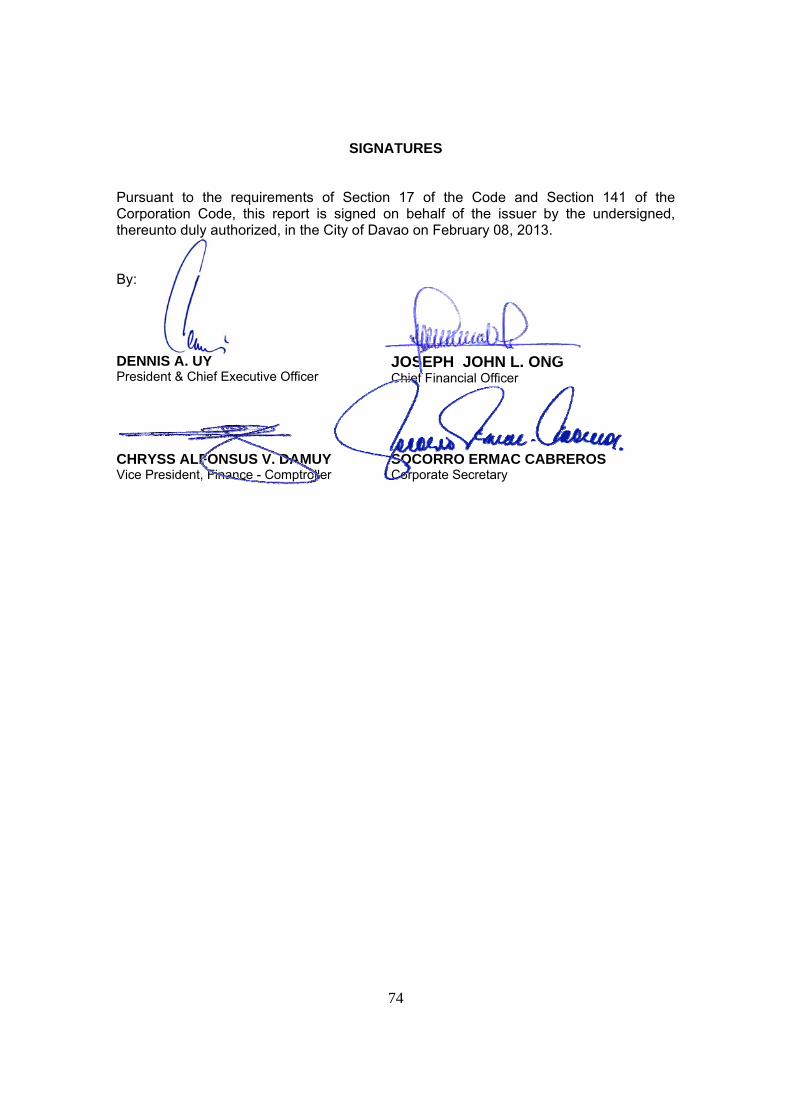
74
SIGNATURES Pursuant to the requirements of Section 17 of the Code and Section 141 of the Corporation Code, this report is signed on behalf of the issuer by the undersigned, thereunto duly authorized, in the City of Davao on February 08, 2013. By: DENNIS A. UY President & Chief Executive Officer
JOSEPH JOHN L. ONG Chief Financial Officer
CHRYSS ALFONSUS V. DAMUY Vice President, Finance - Comptroller
SOCORRO ERMAC CABREROS Corporate Secretary

A 2 0 0 2 0 7 2 8 3
P- H- O- E- N- I- X P E T R O L E U M
P H I L I P P I N E S I N C.
P-H-O-E-N-I-X PETROLEUM PHILIPPINES, INC.
S T E L L A H I Z O N R E Y E S R D
B O. P A M P A N G A L A N A N G
D A V A O C I T Y
(Business Address: No. Street City / Town / Province)
Last Friday1 2 3 1
Remarks = pls. use black ink for scanning purposes
AAFS
COVER SHEET
(Company's Full Name)
Dennis A. Uy (082) 233-0168
S.E.C. Registration Number
Secondary License Type, if applicable
Contact Person Company Telephone Number
Month DayXXMarch
Month DayFORM TYPE
To be accomplished by SEC Personnel Concerned
File Number
Total No. of Stockholders ForeignDomestic
Document I.D.
Annual Meeting
LCU
Cashier
Total Amount of Borrowings
Dept. Requiring this Doc
Fiscal Year Ending

STATEMENT OF MANAGEMENT’S RESPONSIBILITY
FOR FINANCIAL STATEMENTS The management of P-H-O-E-N-I-X Petroleum Philippines, Inc. and Subsidiaries is responsible for the preparation and fair presentation of the financial statements for the year(s) ended December 31, 2012, 2011 and 2010 in accordance with Philippine Financial Reporting Standards. This responsibility includes designing and implementing internal controls relevant to the preparation and fair presentation of financial statements that are free from material misstatement, whether due to fraud or error, selecting and applying appropriate accounting policies, and making accounting estimates that are reasonable in the circumstances. Management is responsible for the preparation and fair presentation of these financial statements in accordance with Philippines Financial Reporting Standards, and for such internal control as management determines is necessary to enable the preparation of the financial statements free from material misstatement, whether due to fraud or error. The Board of Directors approves and reviews the financial statements and submit the same to the stockholders. Punongbayan & Araullo, the independent auditors and appointed by the stockholders, has examined the financial statement of the Company in accordance with Philippine Standards on Auditing and in its report to the Board of Directors and stockholders has expressed its opinion on the fairness of presentation upon completion of such examination. Signed under oath by the following on this 8th day of February 2013: Signature______________________ Name of the Chairman of the Board DOMINGO T. UY Signature______________________ Name of the President and Chief Executive Officer DENNIS A. UY Signature______________________ Name of the Chief Finance Officer JOSEPH JOHN DE LEON ONG
-JURAT-
SUBSCRIBED AND SWORN to before me on this 8th FEBRUARY 2013 in Davao City, Philippines. Affiants have confirmed their identities by presenting competent evidence of identity and that they further attest that the same are true and correct., viz: Name Competent Evidence of Identity Domingo T. Uy SSS ID No. 09-0185238-6 Dennis A. Uy SSS ID No. 09-1539399-6 Joseph John L. Ong SSS ID No. 03-5903914-6
Doc. No. 174 Page No. 35 Book No. 46 Series of 2013
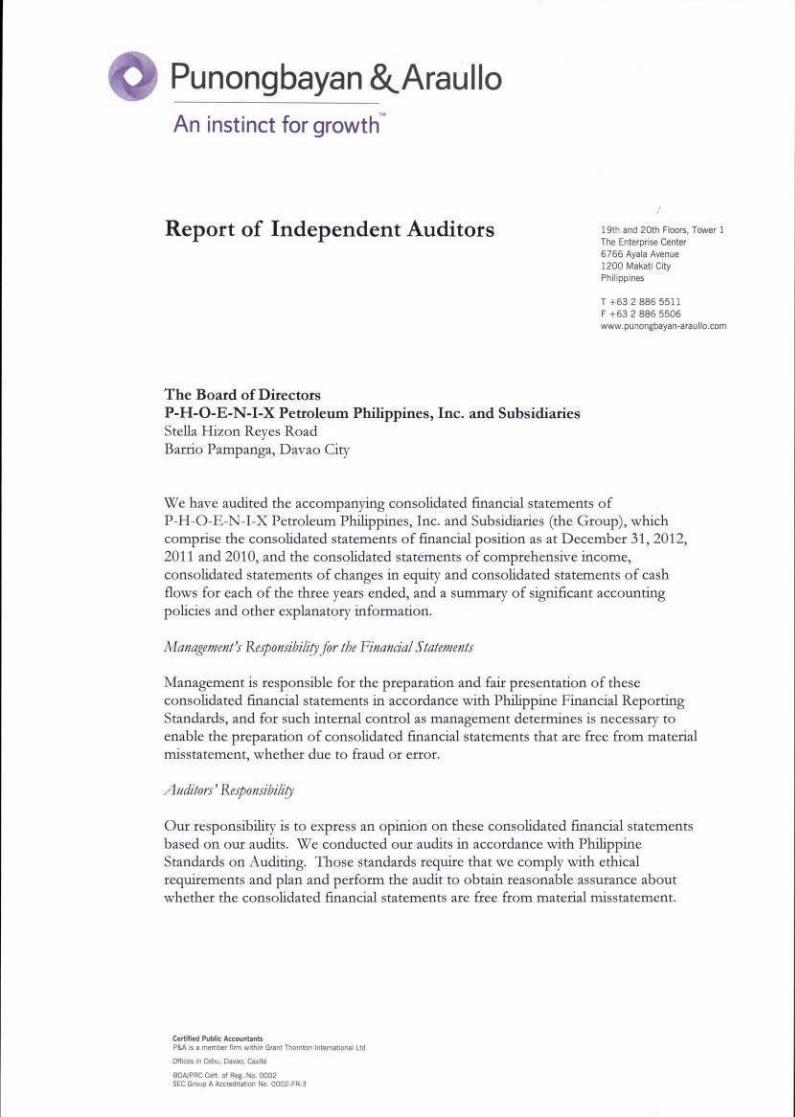
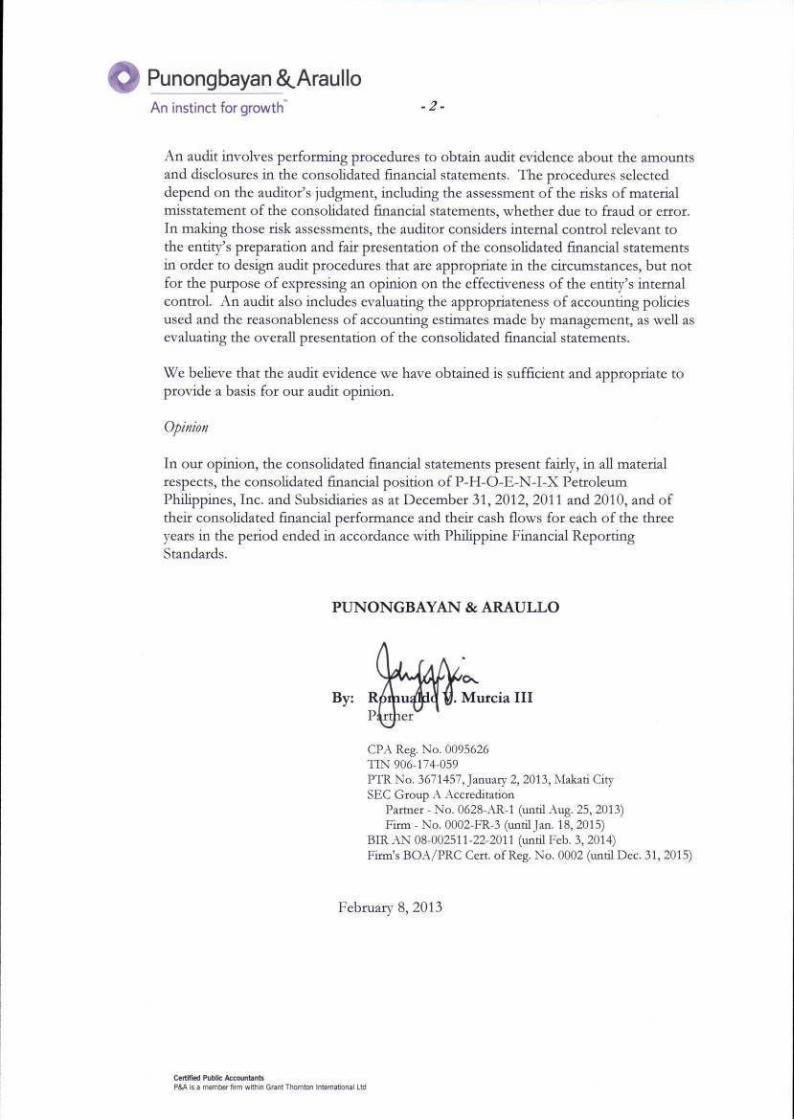

2011 2010
(As Restated - (As Restated -
Notes 2012 see Note 30) see Note 30)
A S S E T S
CURRENT ASSETS
Cash and cash equivalents 6 438,510,937 P 924,008,515 P 615,860,623 P Trade and other receivables - net 7 3,557,002,879 2,865,485,431 2,556,384,913 Inventories 8 3,688,759,676 2,132,622,405 1,051,658,928 Land held for sale and land development costs 9 502,030,559 451,587,118 451,587,118 Due from related parties 25 8,300,000 26,311,686 20,009,114
Restricted deposits 10 82,694,029 69,036,837 73,422,716
Input value-added tax - net 392,968,622 226,507,521 27,539,110
Prepayments and other current assets 11 296,735,523 206,209,945 86,039,926
Total Current Assets 8,967,002,225 6,901,769,458 4,882,502,448
NON-CURRENT ASSETS
Installment contract receivable - 9,002,788 18,005,640 Land held for future development 13 289,078,227 271,981,834 315,874,750 Property and equipment - net 12 6,998,785,817 5,572,270,773 3,886,113,017 Goodwill 15 84,516,663 85,783,624 83,638,948
Other non-current assets 14 167,807,348 117,847,917 89,872,487
Total Non-current Assets 7,540,188,055 6,056,886,936 4,393,504,842
TOTAL ASSETS 16,507,190,280 P 12,958,656,394 P 9,276,007,290 P
CURRENT LIABILITIES
Interest-bearing loans and borrowings 16 4,119,347,152 P 4,031,200,956 P 2,957,886,252 P
Trade and other payables 17 1,547,105,184 3,083,587,717 1,926,103,478
Due to related parties 25 85,551,745 37,077,904 53,898,687
Total Current Liabilities 5,752,004,081 7,151,866,577 4,937,888,417
NON-CURRENT LIABILITIES
Interest-bearing loans and borrowings 16 5,795,974,645 1,846,117,207 1,076,337,872
Due to related parties 25 - 24,102,695 91,167,021
Deferred tax liabilities - net 24 114,004,950 8,917,909 22,878,090
Other non-current liabilities 18 344,755,293 216,689,056 69,124,242
Total Non-current Liabilities 6,254,734,888 2,095,826,867 1,259,507,225
Total Liabilities 12,006,738,969 9,247,693,444 6,197,395,642
EQUITY 26
Common stock 906,059,416 661,123,014 548,075,739 Preferred stock 5,000,000 5,000,000 5,000,000 Additional paid-in capital 2,051,723,794 2,051,723,794 2,051,723,794 Revaluation reserves 294,152,102 73,957,965 121,056,606 Other reserves 622,952,239 )( 622,952,239 )( 854,202,239 )(
Retained earnings 1,866,468,238 1,542,110,416 1,206,957,748
Total Equity 4,500,451,311 3,710,962,950 3,078,611,648
TOTAL LIABILITIES AND EQUITY 16,507,190,280 P 12,958,656,394 P 9,276,007,290 P
See Notes to Consolidated Financial Statements.
P-H-O-E-N-I-X PETROLEUM PHILIPPINES, INC. AND SUBSIDIARIES
LIABILITIES AND EQUITY
(Amounts in Philippine Pesos)DECEMBER 31, 2012, 2011 AND 2010
CONSOLIDATED STATEMENTS OF FINANCIAL POSITION

2011 2010(As Restated - (As Restated -
Notes 2012 see Note 30) see Note 30)
REVENUES
Sale of goods 25 34,080,171,520 P 27,073,793,112 P 14,544,604,182 P Charter fees 201,813,941 133,482,323 228,093,378
Fuel service and other revenues 135,885,455 110,071,589 65,392,289
Rent and storage income 25, 29 113,295,479 76,051,056 45,680,378
Port revenues 54,385,910 57,579,514 45,789,816
34,585,552,305 27,450,977,594 14,929,560,043
COST AND EXPENSES
Cost of sales and services 19 31,961,749,413 25,327,617,229 13,245,268,747
Selling and administrative expenses 20 1,499,515,219 1,253,550,743 886,205,051
33,461,264,632 26,581,167,972 14,131,473,798
OTHER INCOME (CHARGES)
Finance costs 21 518,221,415 )( 346,537,077 )( 398,539,914 )(
Finance income 21 24,629,351 21,928,387 24,482,196
Gain (loss) on sale of property - net 12 - 41,885,044 36,609,384 )(
Others 16,133,556 15,033,237 981,155
477,458,509 )( 267,690,409 )( 409,685,947 )(
PROFIT BEFORE TAX AND
PRE-ACQUISITION INCOME 646,829,165 602,119,213 388,400,298
PRE-ACQUISITION INCOME - 3,163,822 )( -
PROFIT BEFORE TAX 646,829,165 598,955,391 388,400,298
TAX INCOME (EXPENSE) 24 21,095,072 )( 42,409,094 )( 24,421,558
NET PROFIT 27 625,734,093 556,546,297 412,821,856
OTHER COMPREHENSIVE INCOME
Revaluation (reversal of revaluation) of tankers 331,807,097 55,931,472 )( 6,751,545 )(
Tax expense (income) on revaluation of tankers 99,542,130 )( 16,779,443 2,025,464
232,264,967 39,152,029 )( 4,726,081 )(
TOTAL COMPREHENSIVE INCOME 857,999,060 P 517,394,268 P 408,095,775 P
Basic and Diluted Earnings per share 27 0.63 P 0.55 P 0.44 P
P-H-O-E-N-I-X PETROLEUM PHILIPPINES, INC. AND SUBSIDIARIES
CONSOLIDATED STATEMENTS OF COMPREHENSIVE INCOME
FOR THE YEARS ENDED DECEMBER 31, 2012, 2011 AND 2010
(Amounts in Philippine Pesos)
See Notes to Consolidated Financial Statements.
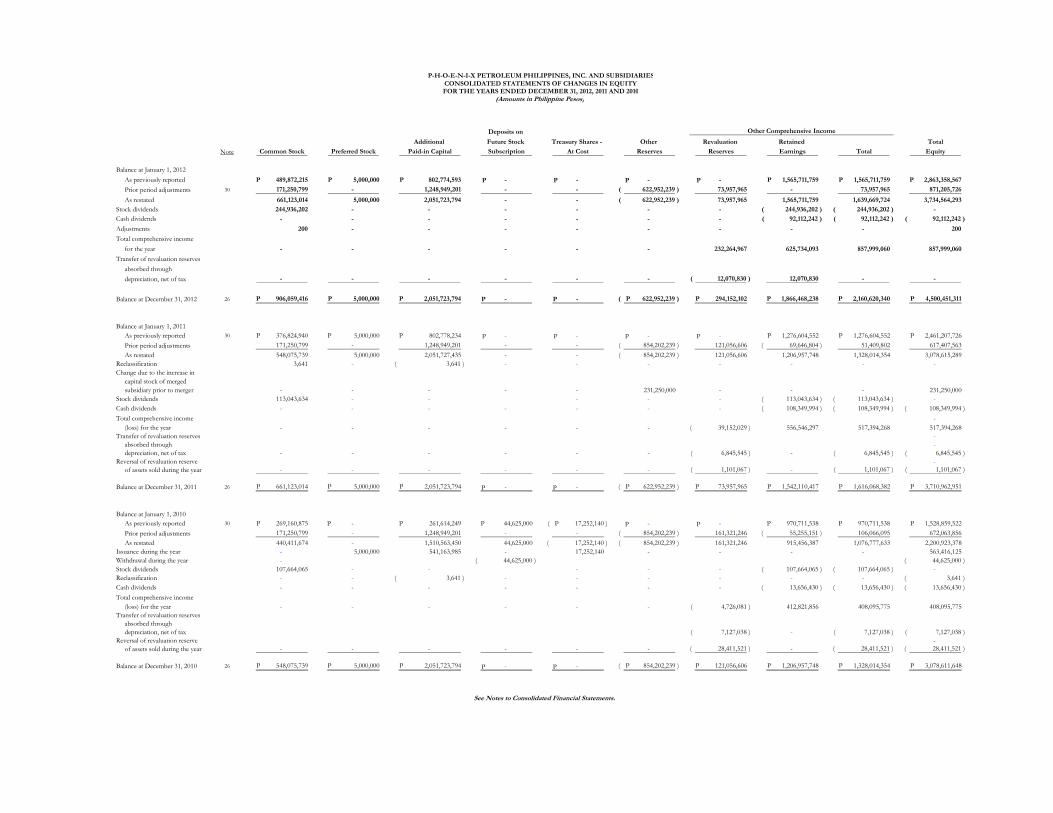
Deposits on
Additional Future Stock Treasury Shares - Other Revaluation Retained Total
Note Common Stock Preferred Stock Paid-in Capital Subscription At Cost Reserves Reserves Earnings Total Equity
Balance at January 1, 2012
As previously reported 489,872,215 P 5,000,000 P 802,774,593 P - - - - 1,565,711,759 P 1,565,711,759 P 2,863,358,567 P
Prior period adjustments 30 171,250,799 - 1,248,949,201 - - 622,952,239 )( 73,957,965 - 73,957,965 871,205,726
As restated 661,123,014 5,000,000 2,051,723,794 - - 622,952,239 )( 73,957,965 1,565,711,759 1,639,669,724 3,734,564,293
Stock dividends 244,936,202 - - - - - - 244,936,202 )( 244,936,202 )( -
Cash dividends - - - - - - - 92,112,242 )( 92,112,242 )( 92,112,242 )(
Adjustments 200 - - - - - - - - 200
Total comprehensive income
for the year - - - - - - 232,264,967 625,734,093 857,999,060 857,999,060
Transfer of revaluation reserves
absorbed through
depreciation, net of tax - - - - - - 12,070,830 )( 12,070,830 - -
Balance at December 31, 2012 26 906,059,416 P 5,000,000 P 2,051,723,794 P - - 622,952,239 )( P 294,152,102 P 1,866,468,238 P 2,160,620,340 P 4,500,451,311 P
Balance at January 1, 2011
As previously reported 30 376,824,940 P 5,000,000 P 802,778,234 P - - - - 1,276,604,552 P 1,276,604,552 P 2,461,207,726 P
Prior period adjustments 171,250,799 - 1,248,949,201 - - 854,202,239 )( 121,056,606 69,646,804 )( 51,409,802 617,407,563
As restated 548,075,739 5,000,000 2,051,727,435 - - 854,202,239 )( 121,056,606 1,206,957,748 1,328,014,354 3,078,615,289
Reclassification 3,641 - 3,641 )( - - - - - - -
Change due to the increase in
capital stock of merged
subsidiary prior to merger - - - - - 231,250,000 - - - 231,250,000
Stock dividends 113,043,634 - - - - - 113,043,634 )( 113,043,634 )( -
Cash dividends - - - - - - - 108,349,994 )( 108,349,994 )( 108,349,994 )(
Total comprehensive income -
(loss) for the year - - - - - - 39,152,029 )( 556,546,297 517,394,268 517,394,268
Transfer of revaluation reserves -
absorbed through -
depreciation, net of tax - - - - - - 6,845,545 )( - 6,845,545 )( 6,845,545 )(
Reversal of revaluation reserve -
of assets sold during the year - - - - - - 1,101,067 )( - 1,101,067 )( 1,101,067 )(
Balance at December 31, 2011 26 661,123,014 P 5,000,000 P 2,051,723,794 P - - 622,952,239 )( P 73,957,965 P 1,542,110,417 P 1,616,068,382 P 3,710,962,951 P
Balance at January 1, 2010
As previously reported 30 269,160,875 P - 261,614,249 P 44,625,000 P 17,252,140 )( P - - 970,711,538 P 970,711,538 P 1,528,859,522 P
Prior period adjustments 171,250,799 - 1,248,949,201 - - 854,202,239 )( 161,321,246 55,255,151 )( 106,066,095 672,063,856
As restated 440,411,674 - 1,510,563,450 44,625,000 17,252,140 )( 854,202,239 )( 161,321,246 915,456,387 1,076,777,633 2,200,923,378
Issuance during the year - 5,000,000 541,163,985 - 17,252,140 - - - - 563,416,125
Withdrawal during the year - 44,625,000 )( 44,625,000 )(
Stock dividends 107,664,065 - - - - - 107,664,065 )( 107,664,065 )( -
Reclassification - - 3,641 )( - - - - - - 3,641 )(
Cash dividends - - - - - - - 13,656,430 )( 13,656,430 )( 13,656,430 )(
Total comprehensive income
(loss) for the year - - - - - - 4,726,081 )( 412,821,856 408,095,775 408,095,775
Transfer of revaluation reserves
absorbed through
depreciation, net of tax 7,127,038 )( - 7,127,038 )( 7,127,038 )(
Reversal of revaluation reserve -
of assets sold during the year - - - - - - 28,411,521 )( - 28,411,521 )( 28,411,521 )(
Balance at December 31, 2010 26 548,075,739 P 5,000,000 P 2,051,723,794 P - - 854,202,239 )( P 121,056,606 P 1,206,957,748 P 1,328,014,354 P 3,078,611,648 P
See Notes to Consolidated Financial Statements.
P-H-O-E-N-I-X PETROLEUM PHILIPPINES, INC. AND SUBSIDIARIES
CONSOLIDATED STATEMENTS OF CHANGES IN EQUITY FOR THE YEARS ENDED DECEMBER 31, 2012, 2011 AND 2010
(Amounts in Philippine Pesos)
Other Comprehensive Income
P
P
P
P P
P P
P
P
P
P
P P
P P
P P
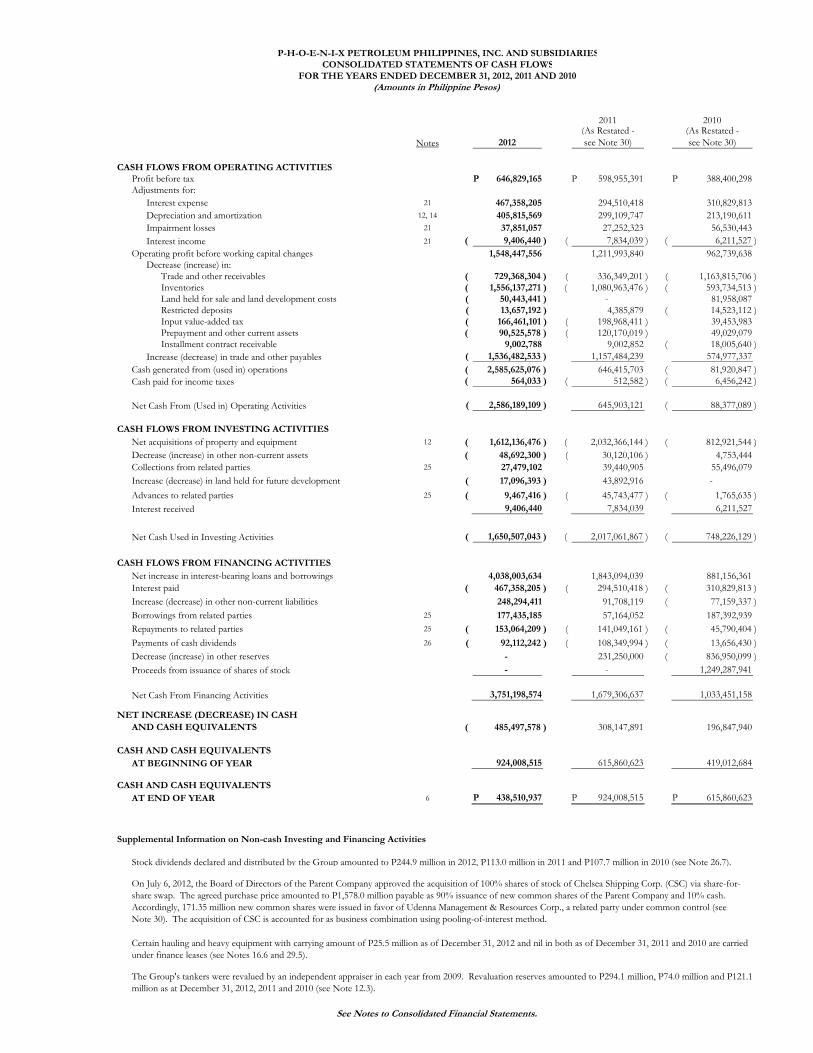
2011 2010(As Restated - (As Restated -
Notes 2012 see Note 30) see Note 30)
CASH FLOWS FROM OPERATING ACTIVITIES
Profit before tax 646,829,165 P 598,955,391 P 388,400,298 P Adjustments for:
Interest expense 21 467,358,205 294,510,418 310,829,813
Depreciation and amortization 12, 14 405,815,569 299,109,747 213,190,611
Impairment losses 21 37,851,057 27,252,323 56,530,443
Interest income 21 9,406,440 )( 7,834,039 )( 6,211,527 )(
Operating profit before working capital changes 1,548,447,556 1,211,993,840 962,739,638 Decrease (increase) in:
Trade and other receivables 729,368,304 )( 336,349,201 )( 1,163,815,706 )( Inventories 1,556,137,271 )( 1,080,963,476 )( 593,734,513 )( Land held for sale and land development costs 50,443,441 )( - 81,958,087 Restricted deposits 13,657,192 )( 4,385,879 14,523,112 )( Input value-added tax 166,461,101 )( 198,968,411 )( 39,453,983 Prepayment and other current assets 90,525,578 )( 120,170,019 )( 49,029,079 Installment contract receivable 9,002,788 9,002,852 18,005,640 )(
Increase (decrease) in trade and other payables 1,536,482,533 )( 1,157,484,239 574,977,337
Cash generated from (used in) operations 2,585,625,076 )( 646,415,703 81,920,847 )(
Cash paid for income taxes 564,033 )( 512,582 )( 6,456,242 )(
Net Cash From (Used in) Operating Activities 2,586,189,109 )( 645,903,121 88,377,089 )(
CASH FLOWS FROM INVESTING ACTIVITIES
Net acquisitions of property and equipment 12 1,612,136,476 )( 2,032,366,144 )( 812,921,544 )(
Decrease (increase) in other non-current assets 48,692,300 )( 30,120,106 )( 4,753,444
Collections from related parties 25 27,479,102 39,440,905 55,496,079
Increase (decrease) in land held for future development 17,096,393 )( 43,892,916 -
Advances to related parties 25 9,467,416 )( 45,743,477 )( 1,765,635 )(
Interest received 9,406,440 7,834,039 6,211,527
Net Cash Used in Investing Activities 1,650,507,043 )( 2,017,061,867 )( 748,226,129 )(
CASH FLOWS FROM FINANCING ACTIVITIES
Net increase in interest-bearing loans and borrowings 4,038,003,634 1,843,094,039 881,156,361
Interest paid 467,358,205 )( 294,510,418 )( 310,829,813 )(
Increase (decrease) in other non-current liabilities 248,294,411 91,708,119 77,159,337 )(
Borrowings from related parties 25 177,435,185 57,164,052 187,392,939
Repayments to related parties 25 153,064,209 )( 141,049,161 )( 45,790,404 )(
Payments of cash dividends 26 92,112,242 )( 108,349,994 )( 13,656,430 )(
Decrease (increase) in other reserves - 231,250,000 836,950,099 )(
Proceeds from issuance of shares of stock - - 1,249,287,941
Net Cash From Financing Activities 3,751,198,574 1,679,306,637 1,033,451,158
NET INCREASE (DECREASE) IN CASH
AND CASH EQUIVALENTS 485,497,578 )( 308,147,891 196,847,940
CASH AND CASH EQUIVALENTS
AT BEGINNING OF YEAR 924,008,515 615,860,623 419,012,684
CASH AND CASH EQUIVALENTS
AT END OF YEAR 6 438,510,937 P 924,008,515 P 615,860,623 P
Supplemental Information on Non-cash Investing and Financing Activities
Stock dividends declared and distributed by the Group amounted to P244.9 million in 2012, P113.0 million in 2011 and P107.7 million in 2010 (see Note 26.7).
See Notes to Consolidated Financial Statements.
P-H-O-E-N-I-X PETROLEUM PHILIPPINES, INC. AND SUBSIDIARIES
CONSOLIDATED STATEMENTS OF CASH FLOWS
FOR THE YEARS ENDED DECEMBER 31, 2012, 2011 AND 2010
(Amounts in Philippine Pesos)
Certain hauling and heavy equipment with carrying amount of P25.5 million as of December 31, 2012 and nil in both as of December 31, 2011 and 2010 are carried
under finance leases (see Notes 16.6 and 29.5).
On July 6, 2012, the Board of Directors of the Parent Company approved the acquisition of 100% shares of stock of Chelsea Shipping Corp. (CSC) via share-for-
share swap. The agreed purchase price amounted to P1,578.0 million payable as 90% issuance of new common shares of the Parent Company and 10% cash.
Accordingly, 171.35 million new common shares were issued in favor of Udenna Management & Resources Corp., a related party under common control (see
Note 30). The acquisition of CSC is accounted for as business combination using pooling-of-interest method.
The Group's tankers were revalued by an independent appraiser in each year from 2009. Revaluation reserves amounted to P294.1 million, P74.0 million and P121.1
million as at December 31, 2012, 2011 and 2010 (see Note 12.3).


-1-
P-H-O-E-N-I-X PETROLEUM PHILIPPINES, INC. AND SUBSIDIARIES NOTES TO CONSOLIDATED FINANCIAL STATEMENTS
DECEMBER 31, 2012, 2011 AND 2010 (Amounts in Philippine Pesos)
1. CORPORATE INFORMATION
1.1 Incorporation and Operations
P-H-O-E-N-I-X Petroleum Philippines, Inc. (the Parent Company) was incorporated in the Philippines on May 8, 2002 and is 43% owned by P-H-O-E-N-I-X Petroleum Holdings, Inc. (PPHI), a company organized in the Philippines.
The Parent Company’s shares of stocks are listed with the Philippine Stock Exchange (PSE). The Parent Company is presently engaged in trading of petroleum products on wholesale and retail basis and operating of gas stations, oil depots, storage facilities and allied services. The registered office of the Parent Company, which is also its principal place of business, is located at Stella Hizon Reyes Road, Barrio Pampanga, Davao City.
PPHI was incorporated in the Philippines on May 31, 2006. PPHI’s primary purpose is to
provide management, investment and technical advice for commercial, industrial, manufacturing and other kinds of enterprises. PPHI’s registered office is located at Stella Hizon Reyes Road, Barrio Pampanga, Davao City.
The ultimate parent of the Group is Udenna Corporation, which is engaged in the acquisition, development, management and operation of real estate. The ultimate parent company’s registered office is located at Stella Hizon Reyes Road, Barrio Pampanga, Davao City.
The Parent Company has a total of 300 service stations, including 88 service stations in Luzon, 21 in the Visayas and 191 in Mindanao operating as of December 31, 2012 and there are a total of 43 service stations under construction as of December 31, 2012.
1.2 Subsidiaries and their Operations
The Company holds the following interests in the following subsidiaries as of December 31:
2012 2011 2010
P-F-L Petroleum Management, Inc. (PPMI) 100% 100% 100% P-H-O-E-N-I-X Global Mercantile, Inc. (PGMI) 100% 100% 100% Phoenix Petroterminals & Industrial Park Corp. (PPIPC) 100% 100% 100% Subic Petroleum Trading and Transport Phils., Inc. (SPTT) 100% 100% - Petroterminals Philippines Corporation (PPC) - - 100% Petrologistix Services Corp. (PSC) - - 100% Chelsea Shipping Corp. (CSC) 100% 100% 100% Bunkers Manila, Inc. (BMI)* 100% 100% 100% Michael, Inc. (MI)* 100% 100% 100% PNX – Chelsea Shipping Corp. (PNX – Chelsea)* 100% 100% 100% Chelsea Ship Management Marine Services Corp (CSMMSC)* 100% 100% 100%
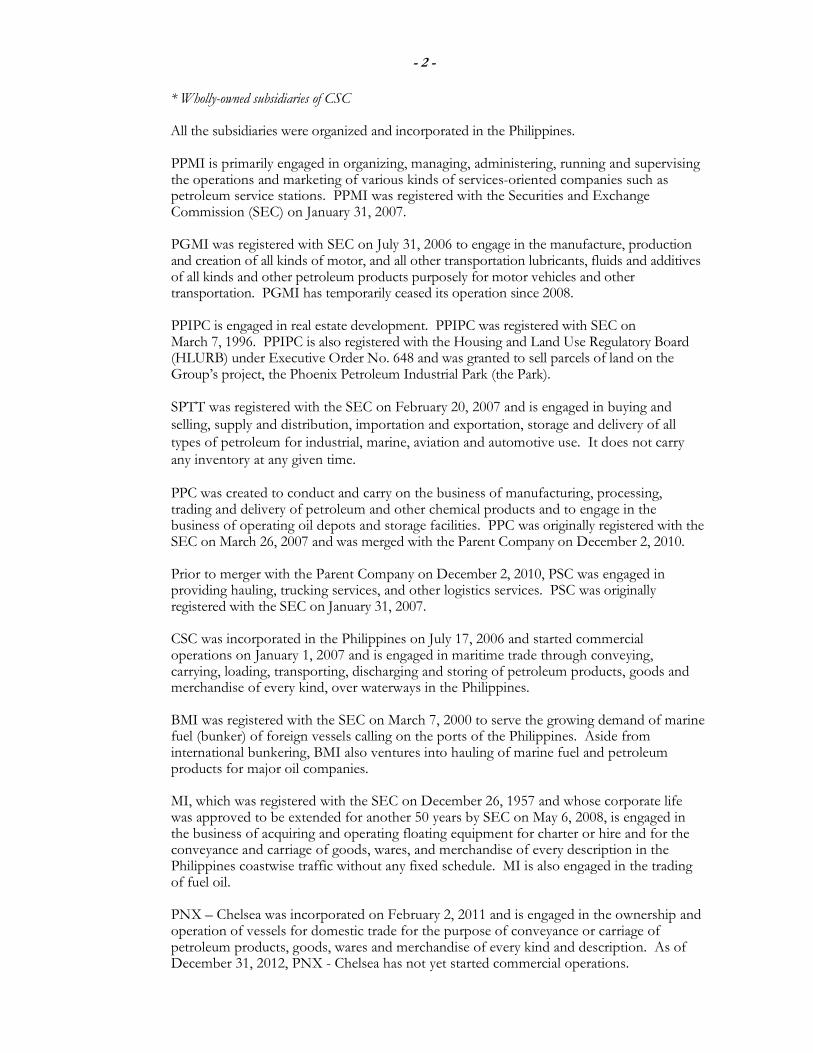
- 2 -
* Wholly-owned subsidiaries of CSC All the subsidiaries were organized and incorporated in the Philippines.
PPMI is primarily engaged in organizing, managing, administering, running and supervising the operations and marketing of various kinds of services-oriented companies such as petroleum service stations. PPMI was registered with the Securities and Exchange Commission (SEC) on January 31, 2007. PGMI was registered with SEC on July 31, 2006 to engage in the manufacture, production and creation of all kinds of motor, and all other transportation lubricants, fluids and additives of all kinds and other petroleum products purposely for motor vehicles and other transportation. PGMI has temporarily ceased its operation since 2008. PPIPC is engaged in real estate development. PPIPC was registered with SEC on March 7, 1996. PPIPC is also registered with the Housing and Land Use Regulatory Board (HLURB) under Executive Order No. 648 and was granted to sell parcels of land on the Group’s project, the Phoenix Petroleum Industrial Park (the Park). SPTT was registered with the SEC on February 20, 2007 and is engaged in buying and selling, supply and distribution, importation and exportation, storage and delivery of all types of petroleum for industrial, marine, aviation and automotive use. It does not carry any inventory at any given time. PPC was created to conduct and carry on the business of manufacturing, processing, trading and delivery of petroleum and other chemical products and to engage in the business of operating oil depots and storage facilities. PPC was originally registered with the SEC on March 26, 2007 and was merged with the Parent Company on December 2, 2010. Prior to merger with the Parent Company on December 2, 2010, PSC was engaged in providing hauling, trucking services, and other logistics services. PSC was originally registered with the SEC on January 31, 2007. CSC was incorporated in the Philippines on July 17, 2006 and started commercial operations on January 1, 2007 and is engaged in maritime trade through conveying, carrying, loading, transporting, discharging and storing of petroleum products, goods and merchandise of every kind, over waterways in the Philippines. BMI was registered with the SEC on March 7, 2000 to serve the growing demand of marine fuel (bunker) of foreign vessels calling on the ports of the Philippines. Aside from international bunkering, BMI also ventures into hauling of marine fuel and petroleum products for major oil companies. MI, which was registered with the SEC on December 26, 1957 and whose corporate life was approved to be extended for another 50 years by SEC on May 6, 2008, is engaged in the business of acquiring and operating floating equipment for charter or hire and for the conveyance and carriage of goods, wares, and merchandise of every description in the Philippines coastwise traffic without any fixed schedule. MI is also engaged in the trading of fuel oil. PNX – Chelsea was incorporated on February 2, 2011 and is engaged in the ownership and operation of vessels for domestic trade for the purpose of conveyance or carriage of petroleum products, goods, wares and merchandise of every kind and description. As of December 31, 2012, PNX - Chelsea has not yet started commercial operations.

- 3 -
CSMMSC was incorporated on March 30, 2012 to carry on the business of ship management and to act as agent, broker, ship chandler or representative of foreign/domestic shipping corporations and individuals for the purpose of managing, operating, supervising, administering and developing the operation of vessels. PPMI’s registered office is located at Penthouse, Valero Tower, 122 Valero Street, Salcedo Village, Makati City and its principal place of business is located at Stella Hizon Reyes Road, Barrio Pampanga, Davao City. The registered office of PGMI, CSC, BMI and PNX – Chelsea, which is also their principal place of business, is located at Stella Hizon Reyes Road, Barrio Pampanga, Davao City.
PPIPC’s registered office is located at 4th Floor, Phinma Plaza, 39 Plaza Drive, Rockwell
Center, Makati City and its principal place of business is located at 26th Floor, The Fort Legend Tower, 3rd Avenue corner 31st Street, The Fort Global City, Taguig City.
The registered office of SPTT, which is also its principal place of business, is located at Units
113 and 115 Subic International Hotel, Alpha Building, Rizal Highway, Subic Bay Freeport Zone, Zambales.
The registered office of MI, which is also its principal place of business, is located at 12 Dagohoy Street, San Antonio Village, Banilad, Cebu City.
The registered address of CSMMSC, which is also its principal place of business, is located at
the 26/F, Fort Legend Towers, 3rd Ave. corner 31st St., Bonifacio Global City, Taguig City.
1.1 Merger of PSC and PSC On December 2, 2010, SEC approved the merger of PPC and PSC with the Company. Per application approved by SEC, the merger is effective on December 2, 2010. PPC and PSC were wholly-owned subsidiary of the Parent Company prior to merger. 1.2 Acquisition of CSC
On September 6, 2012, CSC became a wholly owned subsidiary of the Company upon the approval of the Parent Company’s stockholders of the acquisition of the 100% of CSC’s outstanding shares from Udenna Management Resources Corp. (UMRC), a related party under common control. The acquisition was initially approved by the Company’s Board of Directors (BOD) on July 6, 2012. 1.3 Approval of Consolidated Financial Statements
The financial statements of the Parent Company and Subsidiaries (the Group) for the year
ended December 31, 2012 (including the comparatives as of and for the years ended December 31, 2011 and 2010) were authorized for issue by the Parent Company’s President
and Chief Executive Officer on February 8, 2013.

- 4 -
2. SUMMARY OF SIGNIFICANT ACCOUNTING POLICIES
The significant accounting policies that have been used in the preparation of these consolidated financial statements are summarized below and in the succeeding pages. These policies have been consistently applied to all the years presented, unless otherwise stated. 2.1 Basis of Preparation of Consolidated Financial Statements
(a) Statement of Compliance with Philippine Financial Reporting Standards
The consolidated financial statements of the Group have been prepared in accordance with Philippine Financial Reporting Standards (PFRS). PFRS are adopted by the Financial Reporting Standards Council (FRSC) from the pronouncements issued by the International Accounting Standards Board (IASB).
The consolidated financial statements have been prepared using the measurement bases specified by PFRS for each type of assets, liabilities, income and expense. The measurement bases are more fully described in the accounting policies that follow.
(b) Presentation of Financial Statements
The consolidated financial statements are presented in accordance with Philippine Accounting Standard (PAS) 1, Presentation of Financial Statements. The Group presents all items of income and expenses in a single consolidated statement of comprehensive income. Two comparative periods are presented for the consolidated statement of financial position when the Group applies an accounting policy retrospectively, makes a retrospective restatement of items in its consolidated financial statements, or reclassifies items in the consolidated financial statements. Certain items in the 2011 and 2010 consolidated financial statements of the Group have been restated in relation with the business combination brought about by the acquisition of CSC which is accounted for under pooling-of-interest method, hence, two comparative periods were presented for the consolidated statement of financial position (see Note 30).
(c) Functional and Presentation Currency
These consolidated financial statements are presented in Philippine pesos, the Group’s functional and presentation currency, and all values represent absolute amounts except when otherwise indicated. Items included in the consolidated financial statements of the Group are measured using its functional currency, the currency of the primary economic environment in which the Group operates.
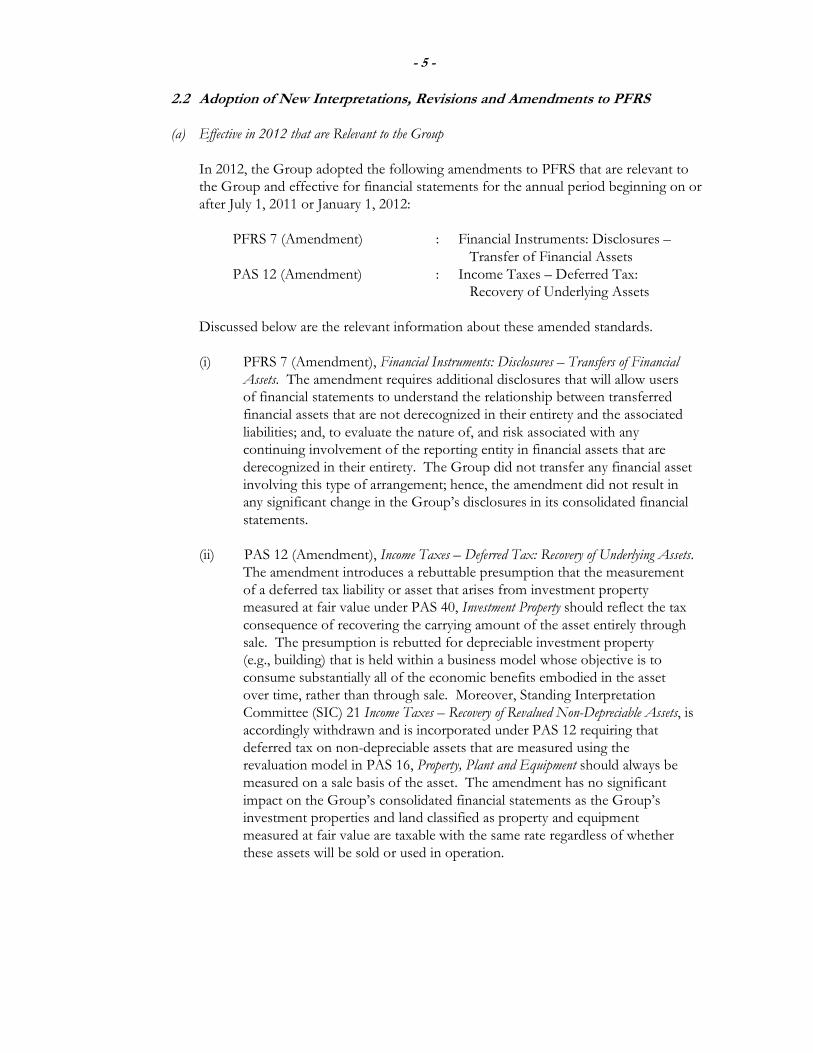
- 5 -
2.2 Adoption of New Interpretations, Revisions and Amendments to PFRS
(a) Effective in 2012 that are Relevant to the Group
In 2012, the Group adopted the following amendments to PFRS that are relevant to the Group and effective for financial statements for the annual period beginning on or after July 1, 2011 or January 1, 2012:
PFRS 7 (Amendment) : Financial Instruments: Disclosures – Transfer of Financial Assets PAS 12 (Amendment) : Income Taxes – Deferred Tax: Recovery of Underlying Assets
Discussed below are the relevant information about these amended standards. (i) PFRS 7 (Amendment), Financial Instruments: Disclosures – Transfers of Financial
Assets. The amendment requires additional disclosures that will allow users of financial statements to understand the relationship between transferred financial assets that are not derecognized in their entirety and the associated liabilities; and, to evaluate the nature of, and risk associated with any continuing involvement of the reporting entity in financial assets that are derecognized in their entirety. The Group did not transfer any financial asset involving this type of arrangement; hence, the amendment did not result in any significant change in the Group’s disclosures in its consolidated financial statements.
(ii) PAS 12 (Amendment), Income Taxes – Deferred Tax: Recovery of Underlying Assets.
The amendment introduces a rebuttable presumption that the measurement of a deferred tax liability or asset that arises from investment property measured at fair value under PAS 40, Investment Property should reflect the tax consequence of recovering the carrying amount of the asset entirely through sale. The presumption is rebutted for depreciable investment property (e.g., building) that is held within a business model whose objective is to consume substantially all of the economic benefits embodied in the asset over time, rather than through sale. Moreover, Standing Interpretation Committee (SIC) 21 Income Taxes – Recovery of Revalued Non-Depreciable Assets, is accordingly withdrawn and is incorporated under PAS 12 requiring that deferred tax on non-depreciable assets that are measured using the revaluation model in PAS 16, Property, Plant and Equipment should always be measured on a sale basis of the asset. The amendment has no significant impact on the Group’s consolidated financial statements as the Group’s investment properties and land classified as property and equipment measured at fair value are taxable with the same rate regardless of whether these assets will be sold or used in operation.

- 6 -
(b) Effective in 2012 that are not Relevant to the Group
PFRS 1, First-time Adoption of PFRS, was amended to provide relief for first-time adopters of PFRS from having to reconstruct transactions that occurred before the date of transition to PFRS and to provide guidance for entities emerging from severe hyperinflation either to resume presenting PFRS consolidated financial statements or to present PFRS consolidated financial statements for the first time. The amendment became effective for annual periods beginning on or after July 1, 2011 but is not relevant to the Group’s consolidated financial statements.
(c) Effective Subsequent to 2012 but not Adopted Early
There are new PFRS, amendments, annual improvements and interpretations to existing standards that are effective for periods subsequent to 2012. Management has initially determined the following pronouncements, which the Group will apply in accordance with their transitional provisions, to be relevant to its consolidated financial statements:
(i) PAS 1 (Amendment), Financial Statements Presentation – Presentation of Items of Other
Comprehensive Income (effective from July 1, 2012). The amendment requires an entity to group items presented in Other Comprehensive Income into those that, in accordance with other PFRSs: (a) will not be reclassified subsequently to profit or loss and (b) will be reclassified subsequently to profit or loss when specific conditions are met. The Group’s management expects that this will change the current presentation of items in other comprehensive income (i.e., segregation of revaluation reserves on tankers under property and equipment). This however, will not affect the measurement or recognition of such items.
(ii) PAS 19 (Revised), Employee Benefits (effective from January 1, 2013). The amendment made a number of changes as part of the improvements throughout the standard. The main changes relate to defined benefit plans as follows: • eliminates the corridor approach under the existing guidance of PAS 19 and requires an entity to recognize all gains and losses arising in the reporting period;
• streamlines the presentation of changes in plan assets and liabilities resulting in the disaggregation of changes into three main components of service costs, net interest on net defined benefit obligation or asset, and remeasurement; and,
• enhances disclosure requirements, including information about the characteristics of defined benefit plans and the risks that entities are exposed to through participation in them.
Currently, the Group is using the corridor approach and its unrecognized actuarial loss as of December 31, 2012 amounted to P12.1 million which will be retrospectively recognized as loss in other comprehensive income in 2013 (see Note 22).

- 7 -
(iii) Consolidation Standards The Group is currently reviewing the impact on its consolidated financial statements of the following consolidation standards which will be effective from January 1, 2013:
• PFRS 10, Consolidated Financial Statements. This standard builds on existing principles of consolidation by identifying the concept of control as the determining factor in whether an entity should be included within the consolidated financial statements. The standard also provides additional guidance to assist in determining control where this is difficult to assess.
• PFRS 12, Disclosure of Interest in Other Entities. This standard integrates and makes consistent the disclosure requirements for all forms of interests in other entities, including joint arrangements, associates, special purpose vehicles and unconsolidated structured entities. This also introduces new disclosure requirements about the risks to which an entity is exposed from its involvement with structured entities.
• PAS 27 (Amendment), Separate Financial Statements. This revised standard now covers the requirements pertaining solely to separate financial statements after the relevant discussions on control and consolidated financial statements have been transferred and included in PFRS 10. No new major changes relating to separate financial statements have been introduced as a result of the revision.
• PAS 28 (Amendment), Investments in Associate and Joint Venture. This revised standard includes the requirements for joint ventures, as well as associates, to be accounted for using equity method following the issuance of PFRS 11, Joint Arrangement.
Subsequent to the issuance of the foregoing consolidation standards, the IASB made some changes to the transitional provisions in IFRS 10, IFRS 11 and IFRS 12, which were also adopted by the FRSC. The guidance confirms that an entity is not required to apply PFRS 10 retrospectively in certain circumstances and clarifies the requirements to present adjusted comparatives. The guidance also made changes to PFRS 10 and PFRS 12 which provide similar relief from the presentation or adjustment of comparative information for periods prior to the immediately preceding period. Further, it provides relief by removing the requirement to present comparatives for disclosures relating to unconsolidated structured entities for any period before the first annual period for which PFRS 12 is applied.

- 8 -
(iv) PFRS 7 (Amendment), Financial Instruments: Disclosures – Offsetting Financial Assets and Financial Liabilities (effective from January 1, 2013). The amendment requires qualitative and quantitative disclosures relating to gross and net amounts of recognized financial instruments that are set-off in accordance with PAS 32, Financial Instruments: Presentation. The amendment also requires disclosure of information about recognized financial instruments subject to enforceable master netting arrangements or similar agreements, even if they are not set-off in the statement of financial position, including those which do not meet some or all of the offsetting criteria under PAS 32, and amounts related to a financial collateral. These disclosures will allow financial statement users to evaluate the effect or potential effect of netting arrangements, including rights of set-off associated with recognized financial assets and financial liabilities on the entity’s financial position. The Group has initially assessed that the adoption of the amendment will not have a significant impact on its consolidated financial statements.
(v) PFRS 13, Fair Value Measurement (effective from January 1, 2013). This standard aims to improve consistency and reduce complexity by providing a precise definition of fair value and a single source of fair value measurement and disclosure requirements for use across PFRS. The requirements do not extend the use of fair value accounting but provide guidance on how it should be applied where its use is already required or permitted by other standards. Management is in the process of reviewing its valuation methodologies for conformity with the new requirements and has yet to assess the impact of the new standard on the Group’s consolidated financial statements.
(vi) PAS 32 (Amendment), Financial Instruments: Presentation – Offsetting Financial Assets
and Financial Liabilities (effective from January 1, 2014). The amendment provides guidance to address inconsistencies in applying the criteria for offsetting financial assets and financial liabilities. It clarifies that a right of set-off is required to be legally enforceable, in the normal course of business, in the event of default and in the event of insolvency or bankruptcy of the entity and all of the counterparties. The amendment also clarifies the principle behind net settlement and includes an example of a gross settlement system with characteristics that would satisfy the criterion for net settlement. The Group does not expect this amendment to have a significant impact on its consolidated financial statements.
(vii) PFRS 9, Financial Instruments: Classification and Measurement (effective from
January 1, 2015). This is the first part of a new standard on financial instruments that will replace PAS 39 in its entirety. This chapter covers the classification and measurement of financial assets and financial liabilities and it deals with two measurement categories for financial assets: amortized cost and fair value. All equity instruments will be measured at fair value while debt instruments will be measured at amortized cost only if the entity is holding it to collect contractual cash flows which represent payment of principal and interest. The accounting for embedded derivatives in host contracts that are financial assets is simplified by removing the requirement to consider whether or not they are closely related, and, in most arrangement, does not require separation from the host contract.
- 9 -
For liabilities, the standard retains most of the PAS 39 requirements which include amortized cost accounting for most financial liabilities, with bifurcation of embedded derivatives. The main change is that, in case where the fair value option is taken for financial liabilities, the part of a fair value change due to an entity’s own credit risk is recorded in other comprehensive income rather than in profit or loss, unless this creates an accounting mismatch. To date, other chapters of PFRS 9 dealing with impairment methodology and hedge accounting are still being completed. Further, in November 2011, the IASB tentatively decided to consider making limited modifications to IFRS 9’s financial asset classification model to address certain application issues. The Group does not expect to implement and adopt PFRS 9 until its effective date or until all chapters of this new standard have been published. In addition, management is currently assessing the impact of PFRS 9 on the consolidated financial statements of the Group and it plans to conduct a comprehensive study of the potential impact of this standard prior to its mandatory adoption date to assess the impact of all changes.
(viii) 2009-2011 Annual Improvements to PFRS. Annual improvements to PFRS
(2009-2011 Cycle) made minor amendments to a number of PFRS, which are effective for annual period beginning on or after January 1, 2013. Among those improvements, the following amendments are relevant to the Group but management does not expect a material impact on the Group’s financial statements: (a) PAS 1 (Amendment), Presentation of Financial Statements – Clarification of the
Requirements for Comparative Information. The amendment clarifies the requirements for presenting comparative information for the following:
• Requirements for opening statement of financial position
If an entity applies an accounting policy retrospectively, or makes a retrospective restatement or reclassification of items that has a material effect on the information in the statement of financial position at the beginning of the preceding period (i.e., opening statement of financial position), it shall present such third statement of financial position.
Other than disclosure of certain specified information in accordance with PAS 8, Accounting Policies, Changes in Accounting Estimates and Errors, related notes to the opening statement of financial position as at the beginning of the preceding period are not required to be presented.
• Requirements for additional comparative information beyond minimum requirements
- 10 -
If an entity presented comparative information in the financial statements beyond the minimum comparative information requirements, the additional financial statements information should be presented in accordance with PFRS including disclosure of comparative information in the related notes for that additional information. Presenting additional comparative information voluntarily would not trigger a requirement to provide a complete set of financial statements.
(b) PAS 16 (Amendment), Property, Plant and Equipment – Classification of
Servicing Equipment. The amendment addresses a perceived inconsistency in the classification requirements for servicing equipment which resulted in classifying servicing equipment as part of inventory when it is used for more than one period. It clarifies that items such as spare parts, stand-by equipment and servicing equipment shall be recognized as property, plant and equipment when they meet the definition of property, plant and equipment, otherwise, these are classified as inventory.
(c) PAS 32 (Amendment), Financial Instruments – Presentation – Tax Effect of
Distributions to Holders of Equity Instruments. The amendment clarifies that the consequences of income tax relating to distributions to holders of an equity instrument and to transaction costs of an equity transaction shall be accounted for in accordance with PAS 12, Income Taxes. Accordingly, income tax relating to distributions to holders of an equity instrument is recognized in profit or loss while income tax related to the transaction costs of an equity transaction is recognized in equity.
2.3 Basis of Consolidation
The Group obtains and exercises control through voting rights. The Group’s consolidated financial statements comprise the accounts of the Parent Company and its subsidiaries (see Note 1) after the elimination of material intercompany transactions. All intercompany balances and transactions with subsidiaries, including income, expenses and dividends, are eliminated in full. Unrealized profits and losses from intercompany transactions that are recognized in assets are also eliminated in full. Intercompany losses that indicate an impairment are recognized in the consolidated financial statements. The financial statements of subsidiaries are prepared for the same reporting period as the Group, using consistent accounting principles.
The Parent Company accounts for its investments in subsidiaries as follows:
Subsidiaries are all entities over which the Group has the power to control the financial and operating policies generally accompanying a shareholding of more than one half of the voting rights. The existence and effect of potential voting rights that are currently exercisable or convertible are considered when assessing whether the Group controls another entity. Subsidiaries are consolidated from the date the Group obtains control until such time that such control ceases.
- 11 -
The acquisition method is applied to account for acquired subsidiaries. This requires recognizing and measuring the identifiable assets acquired, the liabilities assumed and any non-controlling interest in the acquiree. The consideration transferred for the acquisition of a subsidiary is the fair values of the assets transferred, the liabilities incurred and the equity interests issued by the Parent Company, if any. The consideration transferred also includes the fair value of any asset or liability resulting from a contingent consideration arrangement. Acquisition-related costs are expensed as incurred and subsequent change in the fair value of contingent consideration is recognized directly in profit or loss. Identifiable assets acquired and liabilities and contingent liabilities assumed in a business combination are measured initially at their fair values at the acquisition date. On an acquisition-by-acquisition basis, the Group recognizes any non-controlling interest in the acquiree either at fair value or at the non-controlling interest’s proportionate share of the acquiree’s net assets. The excess of the consideration transferred, the amount of any non-controlling interest in the acquiree and the acquisition-date fair value of any previous equity interest in the acquiree over the fair value of the Group’s share of the identifiable net assets acquired is recognized as goodwill (see Note 15). If this is less than the fair value of the net assets of the subsidiary acquired in the case of a bargain purchase, the difference is recognized directly as gain. On the other hand, business combinations arising from transfers or acquisition of interests in entities that are under the common control of the shareholder that controls the Group are normally accounted for under the pooling-of-interests method and reflected in the consolidated financial statements as if the business combination had occurred at the beginning of the earliest comparative period presented, or if later, at the date that common control was established; for this purpose, comparatives are restated. The assets and liabilities acquired are recognized in the Group’s consolidated financial statements at the carrying amounts recognized previously. The difference between the consideration transferred and the net assets of the subsidiary acquired is recognized as Other Reserves as part of the equity.
2.4 Financial Assets
Financial assets are recognized when the Group becomes a party to the contractual terms of the financial instrument. Financial assets are classified into the following categories: financial assets at fair value through profit or loss (FVTPL), loans and receivables, held-to-maturity investments and available-for-sale financial assets (AFS). Financial assets are assigned to the different categories by management on initial recognition, depending on the purpose for which the investments were acquired. Regular purchases and sales of financial assets are recognized on their trade date. All financial assets that are not classified as at FVTPL are initially recognized at fair value plus any directly attributable transaction costs. Financial assets carried at FVTPL are initially recorded at fair value and transaction costs related to it are recognized in profit or loss.
- 12 -
A more detailed description of the loans and receivable category of financial assets relevant to the Group is as follows: Loans and receivables are non-derivative financial assets with fixed or determinable payments that are not quoted in an active market. They arise when the Group provides money, goods or services directly to a debtor with no intention of trading the receivables. They are included in current assets, except for maturities greater than 12 months after the end of the reporting period which are classified as non-current assets. Loans and receivables are subsequently measured at amortized cost using the effective interest method, less impairment loss, if any. Impairment loss is provided when there is objective evidence that the Group will not be able to collect all amounts due to it in accordance with the original terms of the receivables. The amount of the impairment loss is determined as the difference between the assets’ carrying amount and the present value of estimated future cash flows, discounted at the effective interest rate. The Group’s financial assets categorized as loans and receivables are presented as Cash and Cash Equivalents, Trade and Other Receivables, Due from Related Parties, Restricted Deposits (presented as part of Current Assets and part of Other Non-Current Assets in the consolidated statement of financial position), Installment Contract Receivables, and Refundable Rent Deposits and Hold-out Deposits (both presented as part of Other Non-Current Assets in the consolidated statement of financial position). Cash and cash equivalents are defined as cash on hand, savings and demand deposits and short-term, highly liquid investments readily convertible to known amounts of cash and which are subject to insignificant risk of changes in value. All income and expenses, including impairment losses, relating to financial assets that are recognized in profit or loss are presented as part of Finance Costs or Finance Income in the consolidated statement of comprehensive income. Non-compounding interest and other cash flows resulting from holding financial assets are recognized in profit or loss when earned, regardless of how the related carrying amount of financial assets is measured. The financial assets are derecognized when the contractual rights to receive cash flows from the financial instruments expire, or when the financial assets and all substantial risks and rewards of ownership have been transferred.
2.5 Inventories
Inventories are valued at the lower of cost and net realizable value. Cost is determined using the moving average method. The cost of inventories include all costs directly attributable to acquisitions, such as the purchase price, import duties and other taxes that are not subsequently recoverable from taxing authorities. Net realizable value is the estimated selling price in the ordinary course of business, less the estimated costs of completion and the estimated costs necessary to make the sale.
- 13 -
2.6 Land Held for Sale and Land Development Costs
Land held for sale and land development costs are valued at the lower of cost and net realizable value. Land held for sale and land development costs includes the cost of land and actual development costs incurred up to the end of reporting period. Interest incurred during the development of the project is capitalized (see Note 2.20). Net realizable value is the estimated selling price in the ordinary course of business, less the estimated costs of developing and the estimated costs necessary to make the sale. 2.7 Prepayments and Other Current Assets Prepayments and other current assets pertain to other resources controlled by the Group as a result of past events. They are recognized in the consolidated financial statement when it is probable that the future economic benefits will flow to the entity and the asset has a cost or value that can be measured reliably.
Other recognized assets of similar nature, where future economic benefits are expected to flow to the Group beyond one year after the end of the reporting period (or in the normal operating cycle of the business, if longer), are classified as non-current assets. 2.8 Land Held For Future Development Land held for future development is valued at the lower of cost and net realizable value. Cost includes purchase price and other costs directly attributable to the acquisition of land. Net realizable value is the estimated selling price in the ordinary course of business, less the estimated costs of developing and estimated costs necessary to make the sale.
2.9 Property and Equipment Land is stated at cost less any impairment in value. Tankers are measured at revalued amount less accumulated depreciation. All other property and equipment are carried at acquisition cost less accumulated depreciation and amortization and any impairment in value. The cost of an asset comprises its purchase price and directly attributable costs of bringing the asset to working condition for its intended use. Expenditures for additions, major improvements and renewals are capitalized; expenditures for repairs and maintenance are charged to expense as incurred, except for periodic dry docking costs performed at least every two years on the vessel which are capitalized (see Note 2.10). Following initial recognition, tankers are carried at revalued amounts which represent fair values as determined by independent appraisers, less any subsequent accumulated depreciation and any accumulated impairment losses. Fair value is determined by reference to market-based evidence, which is the amount for which the assets could be exchanged between a knowledgeable willing buyer and a knowledgeable willing seller in an arm’s length transaction as at the valuation date.

- 14 -
Any revaluation surplus is recognized in other comprehensive income and credited to the Revaluation Reserves account in the consolidated statement of changes in equity. Any revaluation deficit directly offsetting a previous surplus in the same asset is charged to other comprehensive income to the extent of any revaluation surplus in equity relating to this asset and the remaining deficit, if any, is recognized in profit or loss. Annually, an amount from the Revaluation Reserves is transferred to Retained Earnings for the related depreciation relating to the revaluation increment.
Upon disposal of the revalued assets, amounts included in Revaluation Reserves is transferred to Retained Earnings.
Revaluations are performed at least every two years ensuring that the carrying amount does not materially differ from that which would be determined using fair value at the end of reporting period, unless circumstances require annual revaluation.
Depreciation is computed on the straight-line basis over the estimated useful lives of the assets as follows:
Tankers 30 years Vessel equipment 5 years Buildings, depot and pier facilities 5-25 years
Transportation and other equipment 1-10 years Hauling and heavy equipment 1-5 years
Gasoline station equipment 1-5 years Office furniture and equipment 1-5 years
Leasehold and land improvements are amortized over the terms of the related leases or the useful lives of the improvements, whichever is shorter.
Hauling and heavy equipment held under finance lease agreements (see Note 2.16) are depreciated over their expected useful lives (determined by reference to comparable owned assets) or over the term of lease, if shorter. Construction in progress (CIP) represents properties under construction and on-going major repair works and is stated at cost. This includes cost of construction, applicable borrowing costs (see Note 2.20). The account is not depreciated until such time that the assets are completed and available for use.
An asset’s carrying amount is written down immediately to its recoverable amount if the asset’s carrying amount is greater than its estimated recoverable amount (see Note 2.18). The residual values and estimated useful lives of property and equipment are reviewed, and adjusted, if appropriate, at the end of each reporting period.
An item of property and equipment is derecognized upon disposal or when no future economic benefits are expected to arise from the continued use of the asset. Any gain or loss arising on derecognition of the asset (calculated as the difference between the net disposal proceeds and the carrying amount of the item) is included in profit or loss the year the item is derecognized.
- 15 -
2.10 Dry Docking Costs Dry docking costs are considered major repairs that preserve the life of the vessel. As an industry practice, costs associated with dry docking are amortized over 24 months or until the next dry docking occurs, whichever comes earlier. When significant dry docking expenditures occur prior to their expiry of this period, any remaining unamortized balance of the original dry docking costs is expensed in the month of subsequent dry docking. Amortization of dry docking costs starts only when the process has been completed and the related vessel is ready for use. The carrying amount of dry docking costs, presented as part of the Other Non-current Asset account in the consolidated statement of financial position, is written down immediately to its recoverable amount if the carrying amount is greater than its estimated recoverable amount (see Note 2.18).
2.11 Financial Liabilities Financial liabilities, which include Interest-bearing Loans and Borrowings, Trade and Other Payables (except income tax payable) , Due to Related Parties and Security Deposits (presented under Other Non-Current Liabilities in the consolidated statement of financial position), are recognized when the Group becomes a party to the contractual terms of the instrument. All interest-related charges incurred on financial liability are recognized as an expense in profit or loss under the caption Finance Costs in the consolidated statement of comprehensive income. Interest charges that are attributable to the acquisition, construction or production of a qualifying asset (i.e., an asset that takes a substantial period of time to get ready for its intended use or sale) are capitalized as part of the cost of such asset (see Note 2.20). All other interest related charges are recognized as an expense in the consolidated statement of comprehensive income under the caption Finance Costs. Interest-bearing loans and borrowings are raised for support of long-term funding of operations. Finance charges, including premiums payable on settlement or redemption and direct issue costs, are charged to profit or loss on an accrual basis using the effective interest method and are added to the carrying amount of the instrument to the extent that these are not settled in the period in which they arise. Trade and other payables, due to related parties and security deposits are recognized initially at their fair values and subsequently measured at amortized cost, using effective interest method for maturities beyond one year, less settlement payments.
Obligations under finance lease (included as part of Interest-bearing Loans and Borrowings) are recognized at amounts equal to the fair value of the leased property or, if lower, at the present value of minimum lease payments, at the inception of the lease (see Notes 2.16 and 29.5).
Dividend distributions to shareholders are recognized as financial liabilities upon declaration of the Group.
- 16 -
Financial liabilities are classified as current liabilities if payment is due to be settled within one year or less after the end of the reporting period (or in the normal operating cycle of the business, if longer), or the Group does not have an unconditional right to defer settlement of the liability for at least twelve months after the reporting period. Otherwise, these are presented as non-current liabilities. Financial liabilities are derecognized from the consolidated statement of financial position only when the obligations are extinguished either through discharge, cancellation or expiration.
2.12 Offsetting Financial Instruments Financial assets and liabilities are offset and the resulting net amount is reported in the consolidated statement of financial position when there is a legally enforceable right to set off the recognized amounts and there is an intention to settle on a net basis, or realize the asset and settle the liability simultaneously.
2.13 Provisions and Contingencies Provisions are recognized when present obligations will probably lead to an outflow of economic resources and they can be estimated reliably even if the timing or amount of the outflow may still be uncertain. A present obligation arises from the presence of a legal or constructive commitment that has resulted from past events. Provisions are measured at the estimated expenditure required to settle the present obligation, based on the most reliable evidence available at the end of the reporting period, including the risks and uncertainties associated with the present obligation. Where there are a number of similar obligations, the likelihood that an outflow will be required in settlement is determined by considering the class of obligations as a whole. When time value of money is material, long-term provisions are discounted to their present values using a pretax rate that reflects market assessments and the risks specific to the obligation. Provisions are reviewed at the end of each reporting period and adjusted to reflect the current best estimate. In those cases where the possible outflow of economic resource as a result of present obligations is considered improbable or remote, or the amount to be provided for cannot be measured reliably, no liability is recognized in the consolidated financial statements. Similarly, possible inflows of economic benefits to the Group that do not yet meet the recognition criteria of an asset are considered contingent assets, hence, are not recognized in the consolidated financial statements. On the other hand, any reimbursement that the Group can be virtually certain to collect from a third party with respect to the obligation is recognized as a separate asset not exceeding the amount of the related provision.
- 17 -
2.14 Business Combinations
Business acquisitions are accounted for using the acquisition method of accounting. Goodwill represents the excess of the cost of an acquisition over the fair value of the Group’s share of the net identifiable assets of the acquired subsidiary at the date of acquisition. Subsequent to initial recognition, goodwill is measured at cost less any accumulated impairment losses. Goodwill is tested annually for impairment and carried at cost less accumulated impairment losses. Impairment losses on goodwill are not reversed (see Note 2.18). Negative goodwill which is the excess of the Group’s interest in the net fair value of net identifiable assets acquired over acquisition cost is charged directly to income. For the purpose of impairment testing, goodwill is allocated to cash-generating units or groups of cash-generating units that are expected to benefit from the business combination in which the goodwill arose. The cash-generating units or groups of cash-generating units are identified according to operating segment.
Gains and losses on the disposal of an interest in a subsidiary include the carrying amount of goodwill relating to it. If the business combination is achieved in stages, the acquirer is required to remeasure its previously held equity interest in the acquiree at its acquisition-date fair value and recognize the resulting gain or loss, if any, in the profit or loss or other comprehensive income, as appropriate. Any contingent consideration to be transferred by the Group is recognized at fair value at the acquisition date. Subsequent changes to the fair value of the contingent consideration that is deemed to be an asset or liability is recognized in accordance with PAS 37 either in profit or loss or as a change to other comprehensive income. Contingent consideration that is classified as equity is not remeasured, and its subsequent settlement is accounted for within equity.
Under the pooling-of-interest method, similar accounts of the entities are combined on a line-by-line basis except for the equity accounts which were offset with the new shares issued by the new entity in which the difference between the net assets received and the amount of the consideration issued (shares and cash) is accounted for as Other Reserves.
2.15 Revenue and Expense Recognition Revenue comprises revenue from the sale of goods and the rendering of services measured by reference to the fair value of consideration received or receivable by the Group for goods sold and services rendered, excluding value-added tax (VAT), rebates and trade discounts.
- 18 -
Revenue is recognized to the extent that the revenue can be reliably measured; it is probable that the economic benefits will flow to the Group; and the costs incurred or to be incurred can be measured reliably. In addition, the following specific recognition criteria must also be met before revenue is recognized: (a) Sale of goods – Revenue is recognized when the risks and rewards of ownership of the
goods have passed to the buyer, i.e. when the customer has acknowledged delivery of goods or when the customer has taken undisputed delivery of goods.
(b) Charter fees – Revenue, which consists mainly of charter income arising from the charter
hire of its tankers, is recognized based on the type of charter arrangement entered into, either under a time charter (TC) or a continuing voyage charter (CVC). Under a TC, revenue is recognized based on the terms of the contract [see Note 3.1(d)]. Under a CVC, revenue is recognized upon completion of the voyage; however, appropriate accrual of revenue is made at the end of the reporting period.
(c) Fuel service and other revenues and storage income – Revenue is recognized when the performance of contractually agreed tasks has been substantially rendered. This account includes franchise income, which has minimal amount. In addition, this includes revenue arising from port and cargo handling services.
(d) Interest income– Revenue is recognized as the interest accrues taking into account the effective yield on the asset.
(e) Rent income – Revenue is recognized on a straight-line basis over the lease term.
(f) Port revenues – Revenue is recognized when services are rendered.
Cost and expenses are recognized in the profit or loss upon utilization of goods or services or at the date they are incurred. All finance costs are reported in profit or loss on an accrual basis, except capitalized borrowing costs which are included as part of the cost of the related qualifying asset (see Note 2.20). The cost of real estate sold, if any, before the completion of the development is determined based on the actual costs incurred to date which include the cost of land plus estimated costs to complete the project development. The estimated expenditures for the development of sold real estate, as determined by project engineers, are charged to Cost of Sales and Services account in the consolidated statement of comprehensive income with a corresponding credit to accrued expenses presented under Trade and Other Payables account in the consolidated statement of financial position. Effects of any revisions in the total project cost estimates are recognized in the year in which the changes become known.
- 19 -
2.16 Leases The Group accounts for its leases as follows: (a) Group as Lessee
Leases which transfer to the Group substantially all risks and benefits incidental to ownership of the leased item are classified as finance leases and are recognized as assets and liabilities in the statement of financial position at amounts equal to the fair value of the leased property at the inception of the lease or, if lower, at the present value of minimum lease payments. Lease payments are apportioned between the finance costs and reduction of the lease liability so as to achieve a constant rate of interest on the remaining balance of the liability
Finance costs are recognized in profit or loss. Capitalized leased assets are depreciated over the shorter of the estimated useful life of the asset or the lease term. Finance lease obligations, net of finance charges, are included in Interest-bearing Loans and Borrowings account in the consolidated statement of financial position.
Leases which do not transfer to the Group substantially all the risks and benefits of ownership of the asset are classified as operating leases. Operating lease payments are recognized as expense in the consolidated statement of comprehensive income on a straight-line basis over the lease term. Associated costs, such as maintenance and insurance, are expensed as incurred.
(b) Group as Lessor
Leases wherein the Group substantially transfers to the lessee all risks and benefits incidental to ownership of the leased item are classified as finance leases and are presented as receivable at an amount equal to the Group’s net investment in the lease. Finance income is recognized based on the pattern reflecting a constant periodic rate of return on the Group’s net investment outstanding in respect of the finance lease. Leases which do not transfer to the lessee substantially all the risks and benefits of ownership of the asset are classified as operating leases. Lease income from operating leases is recognized in profit or loss on a straight-line basis over the lease term.
The Group determines whether an arrangement is, or contains a lease based on the substance of the arrangement. It makes an assessment of whether the fulfilment of the arrangement is dependent on the use of a specific asset or assets and the arrangement conveys a right to use the asset. 2.17 Foreign Currency Transactions and Translations
The accounting records of the Group are maintained in Philippine pesos. Foreign currency transactions during the year are translated into the functional currency at exchange rates which approximate those prevailing on transaction dates.
- 20 -
Foreign currency gains and losses resulting from the settlement of such transactions and from the translation at year-end exchange rates of monetary assets and liabilities denominated in foreign currencies are recognized in the consolidated statement of comprehensive income as part of income or loss from operations.
2.18 Impairment of Non-financial Assets
The Group’s property and equipment and goodwill are subject to impairment testing. Individual assets or cash-generating units are tested for impairment whenever events or changes in circumstances indicate that the carrying amount may not be recoverable.
For purposes of assessing impairment, assets are grouped at the lowest levels for which there are separately identifiable cash flows (cash-generating units). As a result, some assets are tested individually for impairment and some are tested at cash-generating unit level. Impairment loss is recognized for the amount by which the asset’s or cash-generating unit’s carrying amount exceeds its recoverable amounts which is the higher of its fair value less costs to sell and its value in use. In determining value in use, management estimates the expected future cash flows from each cash-generating unit and determines the suitable interest rate in order to calculate the present value of those cash flows. The data used for impairment testing procedures are directly linked to the Group’s latest approved budget, adjusted as necessary to exclude the effects of asset enhancements. Discount factors are determined individually for each cash-generating unit and reflect management’s assessment of respective risk profiles, such as market and asset-specific risk factors. All assets are subsequently reassessed for indications that an impairment loss previously recognized may no longer exist and the carrying amount of the asset is adjusted to the recoverable amount resulting in the reversal of the impairment loss. 2.19 Employee Benefits (a) Post-employment Benefits
Post-employment benefits are provided to employees through a defined benefit plan and defined contribution plan. A defined benefit plan is a post-employment plan that defines an amount of post-employment benefit that an employee will receive on retirement, usually dependent on one or more factors such as age, years of service and salary. The legal obligation for any benefits from this kind of post-employment plan remains with the Group, even if plan assets, if any, for funding the defined benefit plan have been acquired. Plan assets, if any, may include assets specifically designated to a long-term benefit fund, as well as qualifying insurance policies. The Group’s post-employment benefit pension plan covers all regular full-time employees.
- 21 -
The liability recognized in the consolidated statement of financial position for post-employment defined benefit pension plans is the present value of the defined benefit obligation (DBO) at the end of reporting period less unrecognized actuarial losses. The DBO shall be calculated annually by independent actuaries using the projected unit credit method. The present value of the DBO is determined by discounting the estimated future cash outflows using interest rates of high quality corporate bonds that are denominated in the currency in which the benefits will be paid and that have terms to maturity approximating to the terms of the related post-employment liability. Actuarial gains and losses are not recognized as an income or expense unless the total unrecognized gain or loss exceeds 10% of the greater of the obligation and related plan assets. The amount exceeding this 10% corridor is charged or credited to profit or loss over the employees’ expected average remaining working lives. Actuarial gains and losses within the 10% corridor are disclosed separately. Past service costs are recognized immediately in profit or loss, unless the changes to the post-employment plan are conditional on the employees remaining in service for a specified period of time (the vesting period). In this case, the past service costs are amortized on a straight-line basis over the vesting period. A defined contribution plan is a post-employment plan under which the Group pays fixed contributions into an independent entity. The Group has no legal or constructive obligations to pay further contributions after payment of the fixed contribution. The contributions recognized in respect of defined contribution plans are expensed as they fall due. Liabilities and assets may be recognized if underpayment or prepayment has occurred and are included in current liabilities or current assets as they are normally of a short-term nature.
(b) Compensated Absences
Compensated absences are recognized for the number of paid leave days (including holiday entitlement) remaining at the end of the reporting period. They are included in Trade and Other Payables account in the consolidated statement of financial position at the undiscounted amount that the Group expects to pay as a result of the unused entitlement.
2.20 Borrowing Costs
Borrowing costs are recognized as expenses in the period in which they are incurred, except to the extent that they are capitalized. Borrowing costs that are attributable to the acquisition, construction or production of a qualifying asset (i.e., an asset that takes a substantial period of time to get ready for its intended use or sale) are capitalized as part of cost of such asset. The capitalization of borrowing costs commences when expenditures for the asset and borrowing costs are being incurred and activities that are necessary to prepare the asset for its intended use or sale are in progress. Capitalization ceases when substantially all such activities are complete.
- 22 -
2.21 Income Taxes
Tax income (expense) recognized in profit or loss comprises the sum of deferred tax and current tax not recognized in other comprehensive income or directly in equity, if any. Current tax assets or liabilities comprise those claims from, or obligations to, fiscal authorities relating to the current or prior reporting period, that are uncollected or unpaid at the end of reporting period. They are calculated according to the tax rates and tax laws applicable to the fiscal periods to which they relate, based on the taxable profit for the year. All changes to current tax assets or liabilities are recognized as a component of tax expense in profit or loss. Deferred tax is accounted for using the liability method on temporary differences at the end of reporting period between the tax base of assets and liabilities and their carrying amounts for financial reporting purposes. Under the liability method, with certain exceptions, deferred tax liabilities are recognized for all taxable temporary differences and deferred tax assets are recognized for all deductible temporary differences and the carryforward of unused tax losses and unused tax credits to the extent that it is probable that taxable profit will be available against which the deductible temporary differences can be utilized. Unrecognized deferred tax assets, if any, are reassessed at the end of each reporting period and are recognized to the extent that it has become probable that future taxable profit will be available to allow such deferred tax assets to be recovered. The carrying amount of deferred tax assets is reviewed at the end of each reporting period and reduced to the extent that it is probable that sufficient taxable profit will be available to allow all or part of the deferred tax asset to be utilized. Deferred tax assets and liabilities are measured at the tax rates that are expected to apply to the period when the asset is realized or the liability is settled provided such tax rates have been enacted or substantively enacted at the end of the reporting period. Most changes in deferred tax assets or liabilities are recognized as a component of tax expense in profit or loss. Only changes in deferred tax assets or liabilities that relate to items recognized in other comprehensive income or directly in equity are recognized in other comprehensive income or directly in equity. Deferred tax assets and deferred tax liabilities are offset if the Group has a legally enforceable right to set off current tax assets against current tax liabilities and the deferred taxes relate to the same entity and the same taxation authority. 2.22 Related Party Relationships and Transactions Related party transactions are transfer of resources, services or obligations between the Group and its related parties, regardless whether a price is charged.
- 23 -
Parties are considered to be related if one party has the ability to control the other party or exercise significant influence over the other party in making financial and operating decisions. These parties includes: (a) individuals owning, directly or indirectly through one or more intermediaries, control or are controlled by, or under common control with the Group; (b) associates; and (c) individuals owning, directly or indirectly, an interest in the voting power of the Group that gives them significant influence over the Group and close members of the family of any such individual. In considering each possible related party relationship, attention is directed to the substance of the relationship and not merely on the legal form.
2.23 Segment Reporting Operating segments are reported in a manner consistent with the internal reporting provided to the Group’s strategic steering committee; its chief operating decision-maker. The strategic steering committee is responsible for allocating resources and assessing performance of the operating segments. In identifying its operating segments, management generally follows the Group’s products and service lines as disclosed in Note 28 which represent the main products and services provided by the Group. Each of these operating segments is managed separately as each of these service lines requires different technologies and other resources as well as marketing approaches. All inter-segment transfers are carried out at arm's length prices. The measurement policies the Group uses for segment reporting under PFRS 8 is the same as those used in its consolidated financial statements, except that the following, if there is any, are not included in arriving at the operating profit of the operating segments:
• post-employment benefit expenses; and,
• expenses relating to share-based payments. In addition, corporate assets which are not directly attributable to the business activities of any operating segment are not allocated to a segment. There have been no changes from prior periods in the measurement methods used to determine reported segment profit or loss.
2.24 Equity
Capital stock represents the nominal value of shares that have been issued.
Additional paid-in capital includes any premiums received on the initial issuance of capital stock. Any transaction costs associated with the issuance of shares are deducted from additional paid-in capital, net of any related income tax benefits. Revaluation reserves pertain to the revaluation increment and changes thereof (e.g. subsequent depreciation), net of tax, arising from the revaluation of the Group’s tankers.

- 24 -
Other reserves pertain to the difference between the Parent Company’s cost of investment and the net assets of CSC.
Deposits on future stock subscriptions include all amounts received for future stock subscriptions. Treasury shares are stated at the cost of re-acquiring such shares irrespective of whether these are acquired below or above par value.
Retained earnings include all current and prior period results of operations as disclosed in the profit or loss section of the consolidated statement of comprehensive income.
2.25 Earnings per Share Basic earnings per share (EPS) is computed by dividing net income attributable to common shareholders by the weighted average number of common shares outstanding during the period. Diluted EPS is computed by adjusting the weighted average number of ordinary shares outstanding to assume conversion of dilutive potential shares.
2.26 Events After the End of the Reporting Period
Any post-year-end event that provides additional information about the Group’s position at the end of the reporting period (adjusting event) is reflected in the consolidated financial statements. Post-year-end events that are not adjusting events, if any, are disclosed when material to the consolidated financial statements.
- 25 -
3. SIGNIFICANT ACCOUNTING JUDGMENTS AND ESTIMATES
The Group’s consolidated financial statements prepared in accordance with PFRS require management to make judgments and estimates that affect amounts reported in the consolidated financial statements and related notes. Judgments and estimates are continually evaluated and are based on historical experience and other factors, including expectations of future events that are believed to be reasonable under the circumstances. Actual results may ultimately differ from these estimates.
3.1 Critical Management Judgments in Applying Accounting Policies
In the process of applying the Group’s accounting policies, management has made the following judgments, apart from those involving estimation, which have the most significant effect on the amounts recognized in the consolidated financial statements:
(a) Distinction between Operating and Finance Leases
The Group has entered into various lease agreements. Critical judgment was exercised by management to distinguish each lease agreement as either an operating or finance lease by looking at the transfer or retention of significant risk and rewards of ownership of the properties covered by the agreements. Failure to make the right judgment will result in either overstatement or understatement of assets and liabilities. Certain hauling and heavy equipment are accounted for under finance lease.
(b) Recognition of Provisions and Contingencies
Judgment is exercised by management to distinguish between provisions and contingencies. Policies on recognition and disclosure of provision and disclosure of contingencies are discussed in Note 2.13 and relevant disclosure is presented in Note 29.
(c) Qualifying Assets on Borrowing Costs
A qualifying asset is an asset that necessarily takes a substantial period of time to get ready for its intended use or sale. Determining if an asset is a qualifying asset will depend on the circumstances and requires the use of judgment in each case. In making judgment, the management takes into account its intention when it determines whether the asset is a qualifying asset and considers the facts and circumstances and uses its judgment to determine whether an asset takes a substantial period of time to get ready for its intended use or sale. Based on the facts and circumstances affecting the Group’s qualifying asset, the management concludes that the Group’s retail station, depot facilities and tankers are qualifying assets as the management assesses that it takes substantial period of time for the completion of those assets.
- 26 -
(d) Revenue Recognition for TC Arrangements
In determining the appropriate method to use in recognizing the Group’s revenue from TC, management considers the following criteria: (1) whether the fulfilment of the arrangement is dependent on the use of a specific vessel; and, (2) whether the arrangement conveys a right to use the vessel. Management determined that if both criteria are met, the revenue should be recognized using the straight-line method over the term of the contract (see Note 2.15).
(e) Functional Currency
The Group has determined that its functional currency is the Philippine peso which is the functional currency of the primary economic environment in which the Group operates.
3.2 Key Sources of Estimation Uncertainty The following are the key assumptions concerning the future, and other key sources of estimation uncertainty at the end of the reporting period, that have a significant risk of causing a material adjustment to the carrying amounts of assets and liabilities within the next financial year.
(a) Impairment of Trade and Other Receivables Due from Related Parties
Adequate amount of allowance for impairment is provided for specific and groups of accounts, where objective evidence of impairment exists. The Group evaluates the amount of allowance for impairment based on available facts and circumstances affecting the collectibility of the accounts, including, but not limited to, the length of the Group’s relationship with the customers, the customers’ current credit status, average age of accounts, collection experience and historical loss experience. The carrying value of trade and other receivables and the analysis of allowance for impairment on such financial assets are shown in Note 7.
(b) Determining Net Realizable Value of Inventories
In determining the net realizable value of inventories, management takes into account the most reliable evidence available at the times the estimates are made. Future realization of the carrying amounts of inventories as presented in Note 8 is affected by price changes and action from the competitors. Both aspects are considered key sources of estimation uncertainty and may cause significant adjustments to the Group’s inventories within the next financial year.
- 27 -
(c) Determining Net Realizable Value of Land Held for Sale and Land Development Costs and Land
Held for Future Development
In determining the net realizable value of land held for sale and land development costs and land held for future development, management takes into account the most reliable evidence available at the times the estimates are made. Future realization of the carrying amounts of land held for sale and development costs and land held for future development are affected by price changes and demand from the target market segments. Both aspects are considered key sources of estimation uncertainty and may cause significant adjustments within the next financial year.
(d) Useful Lives of Property and Equipment and Dry docking Costs
The Group estimates the useful lives of property and equipment and dry docking costs based on the period over which the assets are expected to be available for use. The estimated useful lives of property and equipment are reviewed periodically and are updated if expectations differ from previous estimates due to physical wear and tear, technical or commercial obsolescence and legal or other limits on the use of the assets. The carrying amounts of property and equipment and dry docking costs are analyzed in Notes 12 and 14, respectively. Based on management’s assessment as at December 31, 2012, 2011 and 2010, there is no change in the estimated useful lives of the property and equipment and dry docking costs during those years. Actual results, however, may vary due to changes in estimates brought about by changes in factors mentioned above.
(e) Fair Value of Tankers
In determining the fair value of the Group’s tankers, the Group engages the services of professional and independent appraisers. The fair value is determined by reference to the market-based evidence, which is the amount for which the assets could be exchanged between a knowledgeable willing buyer and seller in an arm’s length transaction as at the valuation date. Such amount is influenced by different factors including the specific characteristics of the property (e.g. size, features, and capacity), quantity of comparable properties available in the market, and economic condition and behavior of the buying parties. A significant change in these elements may affect prices and value of the assets. Based on management’s review of the recorded fair value of the tankers as of December 31, 2012, 2011 and 2010, such fair value reasonably approximates the fair value based on the latest appraisal report or of those dates as determined by an independent appraisers (see Note 12.3).
- 28 -
(f) Realizable Amount of Deferred Tax Assets
The Group reviews its deferred tax assets at the end of each reporting period and reduces the carrying amount to the extent that it is no longer probable that sufficient taxable profit will be available to allow all or part of the deferred tax assets to be utilized. Management assessed that the deferred tax assets recognized as at December 31, 2012, 2011 and 2010 will be fully utilized in the coming years. The carrying value of deferred tax assets as of December 31, 2012, 2011 and 2010 is disclosed in Note 24.
(g) Liability for Land Development
Obligations to complete development of real estate are based on actual costs and project estimates of contractors and Group’s technical staff. These costs are reviewed at least annually and are updated if expectations differ from previous estimates. Liability to complete the project for sold units included in the determination of cost of sales are presented as part of accrued expenses under Trade and Other Payables account in the consolidated statements of financial position amounted to P1.0 million as of December 31, 2012 and 2011, and P1.1 million as of December 31, 2010. (see Note 17).
(h) Retirement and Other Benefits
The determination of the Group’s obligation and cost of pension and other retirement benefits is dependent on the selection of certain assumptions used by actuaries in calculating such amounts. Those assumptions are described in Note 22 and include, among others, discount rates and salary increase rate. In accordance with PFRS, actual results that differ from the assumptions are accumulated and amortized over future periods and therefore, generally affect the recognized expense and recorded obligation in such future periods. The amounts of retirement benefit obligation and expense and an analysis of the movements in the estimated present value of retirement benefit obligation are presented in Note 22.2.
(i) Estimating Development Costs
The accounting for real estate requires the use of estimates in determining costs and gross profit recognition. Cost of real estate sold includes estimated costs for future development. The development cost of the project is estimated by the Group’s technical staff. At the end of reporting period, these estimates are reviewed and revised to reflect the current conditions, when necessary.

- 29 -
(j) Impairment of Non-Financial Assets
In assessing impairment, management estimates the recoverable amount of each asset or a cash-generating unit based on expected future cash flows and uses an interest rate to discount such. Estimation uncertainty relates to assumptions about future operating results and the determination of a suitable discount rate (see Note 2.18). Though management believes that the assumptions used in the estimation of fair values reflected in the financial statements are appropriate and reasonable, significant changes in these assumptions may materially affect the assessment of recoverable values and any resulting impairment loss could have a material adverse effect on the results of operations. Management has assessed that no impairment losses are required to be recognized on the Group’s non-financial assets in 2012, 2011 and 2010.
4. RISK MANAGEMENT OBJECTIVES AND POLICIES
The Group is exposed to a variety of financial risks in relation to financial instruments. The Group’s financial assets and liabilities by category are summarized in Note 5. The main types of risks are market risk, credit risk and liquidity risk. The Group’s risk management is coordinated with its parent Company, in close cooperation with the BOD, and focuses on actively securing the Group’s short-to-medium term cash flows by minimizing the exposure to financial markets.
The Group does not engage in the trading of financial assets for speculative purposes nor does it write options. The most significant financial risks to which the Group is exposed to are described below and in the succeeding pages.
4.1 Market Risk The Group is exposed to market risk through its use of financial instruments and specifically to currency risk and interest rate risk which result from both its operating and investing activities.
(a) Foreign Currency Sensitivity
Most of the Group’s transactions are carried out in Philippine pesos, its functional currency. Exposures to currency exchange rates arise from the Group’s sales to a certain customer and fuel importation, which are primarily denominated in U.S. dollars. The liability covering the importation is covered by letter of credits which is subsequently closed to Philippine peso trusts receipts (TRs). Further, the Group has a U.S. dollar loan from a certain bank which has been used to finance its capital expenditures (see Note 16). The Group also holds U.S. dollar-denominated cash and cash equivalents. To mitigate the Group’s exposure to foreign currency risk, non-Philippine peso cash flows are monitored.
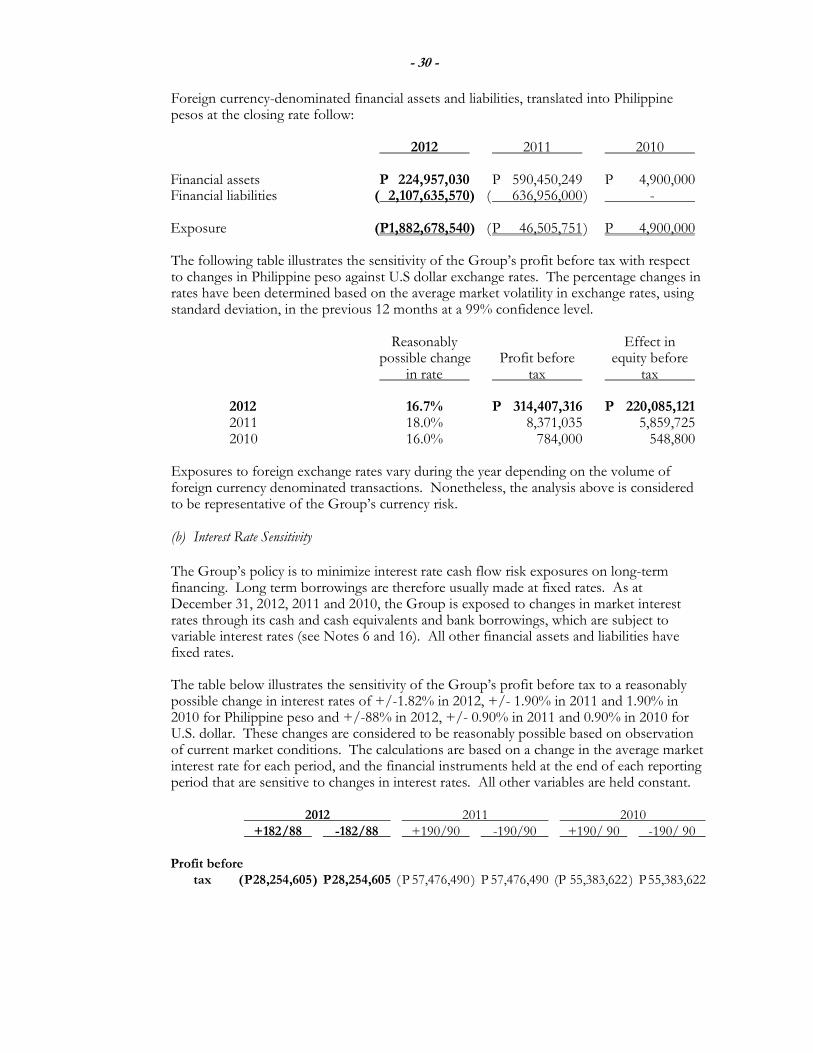
- 30 -
Foreign currency-denominated financial assets and liabilities, translated into Philippine pesos at the closing rate follow:
2012 2011 2010
Financial assets P 224,957,030 P 590,450,249 P 4,900,000 Financial liabilities ( 2,107,635,570) ( 636,956,000 ) - Exposure (P1,882,678,540) ( P 46,505,751 ) P 4,900,000
The following table illustrates the sensitivity of the Group’s profit before tax with respect to changes in Philippine peso against U.S dollar exchange rates. The percentage changes in rates have been determined based on the average market volatility in exchange rates, using standard deviation, in the previous 12 months at a 99% confidence level.
Reasonably Effect in possible change Profit before equity before in rate tax tax 2012 16.7% P 314,407,316 P 220,085,121 2011 18.0% 8,371,035 5,859,725 2010 16.0% 784,000 548,800
Exposures to foreign exchange rates vary during the year depending on the volume of foreign currency denominated transactions. Nonetheless, the analysis above is considered to be representative of the Group’s currency risk.
(b) Interest Rate Sensitivity The Group’s policy is to minimize interest rate cash flow risk exposures on long-term financing. Long term borrowings are therefore usually made at fixed rates. As at December 31, 2012, 2011 and 2010, the Group is exposed to changes in market interest rates through its cash and cash equivalents and bank borrowings, which are subject to variable interest rates (see Notes 6 and 16). All other financial assets and liabilities have fixed rates.
The table below illustrates the sensitivity of the Group’s profit before tax to a reasonably possible change in interest rates of +/-1.82% in 2012, +/- 1.90% in 2011 and 1.90% in 2010 for Philippine peso and +/-88% in 2012, +/- 0.90% in 2011 and 0.90% in 2010 for U.S. dollar. These changes are considered to be reasonably possible based on observation of current market conditions. The calculations are based on a change in the average market interest rate for each period, and the financial instruments held at the end of each reporting period that are sensitive to changes in interest rates. All other variables are held constant. 2012 2011 2010
+182/88 -182/88 +190/90 -190/90 +190/ 90 -190/ 90 Profit before tax ( P 28,254,605 ) P 28,254,605 ( P 57,476,490 ) P 57,476,490 (P 55,383,622 ) P 55,383,622
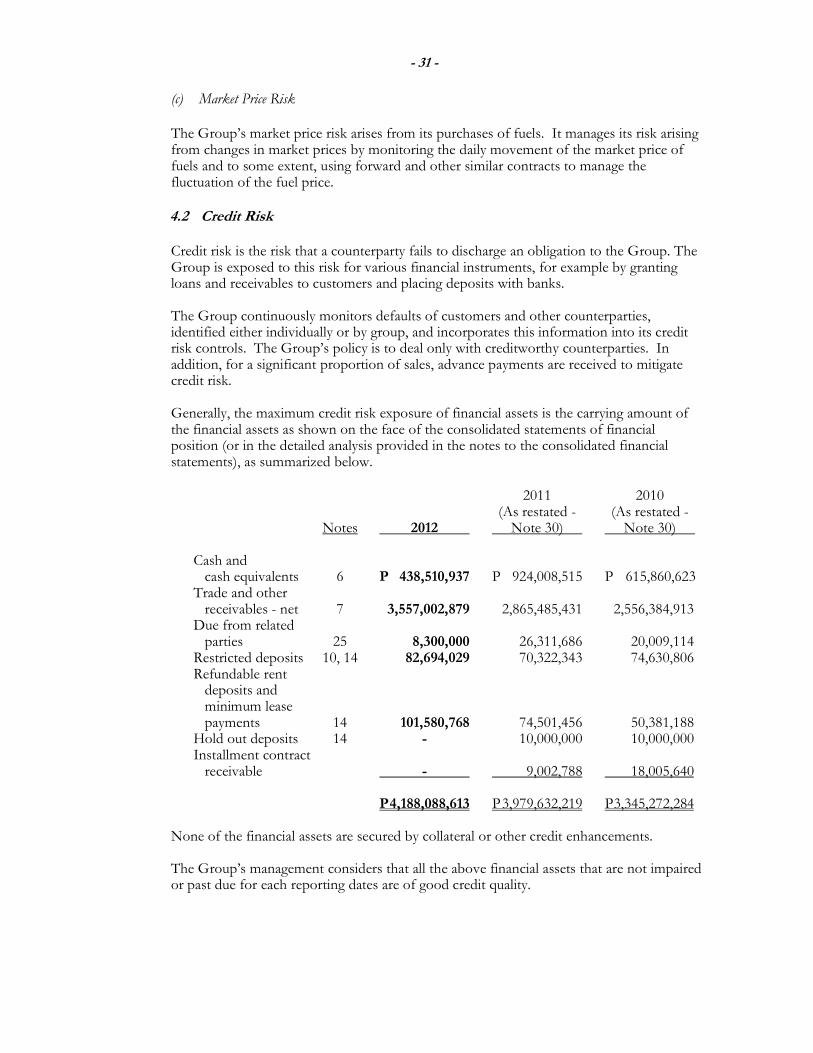
- 31 -
(c) Market Price Risk
The Group’s market price risk arises from its purchases of fuels. It manages its risk arising from changes in market prices by monitoring the daily movement of the market price of fuels and to some extent, using forward and other similar contracts to manage the fluctuation of the fuel price.
4.2 Credit Risk Credit risk is the risk that a counterparty fails to discharge an obligation to the Group. The Group is exposed to this risk for various financial instruments, for example by granting loans and receivables to customers and placing deposits with banks.
The Group continuously monitors defaults of customers and other counterparties, identified either individually or by group, and incorporates this information into its credit risk controls. The Group’s policy is to deal only with creditworthy counterparties. In addition, for a significant proportion of sales, advance payments are received to mitigate credit risk. Generally, the maximum credit risk exposure of financial assets is the carrying amount of the financial assets as shown on the face of the consolidated statements of financial position (or in the detailed analysis provided in the notes to the consolidated financial statements), as summarized below.
2011 2010 (As restated - (As restated - Notes 2012 Note 30) Note 30) Cash and cash equivalents 6 P 438,510,937 P 924,008,515 P 615,860,623 Trade and other receivables - net 7 3,557,002,879 2,865,485,431 2,556,384,913 Due from related parties 25 8,300,000 26,311,686 20,009,114 Restricted deposits 10, 14 82,694,029 70,322,343 74,630,806 Refundable rent deposits and minimum lease payments 14 101,580,768 74,501,456 50,381,188 Hold out deposits 14 - 10,000,000 10,000,000 Installment contract receivable - 9,002,788 18,005,640 P 4,188,088,613 P 3,979,632,219 P 3,345,272,284
None of the financial assets are secured by collateral or other credit enhancements. The Group’s management considers that all the above financial assets that are not impaired or past due for each reporting dates are of good credit quality.
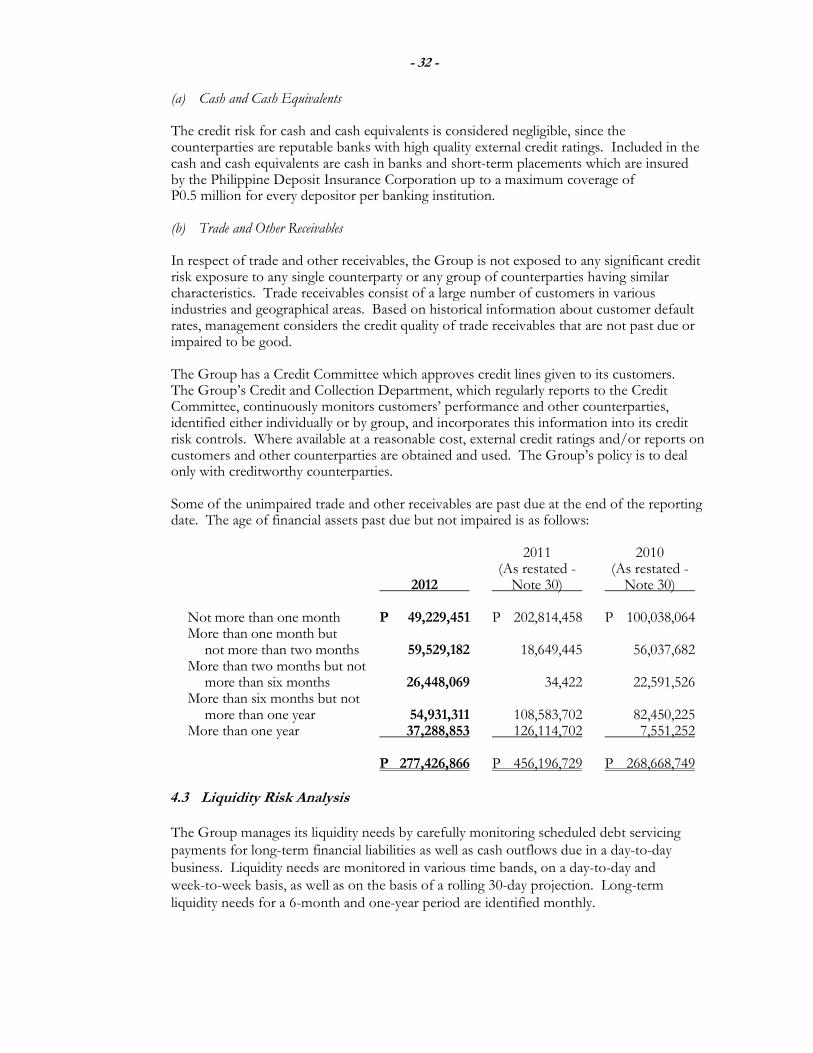
- 32 -
(a) Cash and Cash Equivalents The credit risk for cash and cash equivalents is considered negligible, since the counterparties are reputable banks with high quality external credit ratings. Included in the cash and cash equivalents are cash in banks and short-term placements which are insured by the Philippine Deposit Insurance Corporation up to a maximum coverage of P0.5 million for every depositor per banking institution. (b) Trade and Other Receivables
In respect of trade and other receivables, the Group is not exposed to any significant credit risk exposure to any single counterparty or any group of counterparties having similar characteristics. Trade receivables consist of a large number of customers in various industries and geographical areas. Based on historical information about customer default rates, management considers the credit quality of trade receivables that are not past due or impaired to be good. The Group has a Credit Committee which approves credit lines given to its customers. The Group’s Credit and Collection Department, which regularly reports to the Credit Committee, continuously monitors customers’ performance and other counterparties, identified either individually or by group, and incorporates this information into its credit risk controls. Where available at a reasonable cost, external credit ratings and/or reports on customers and other counterparties are obtained and used. The Group’s policy is to deal only with creditworthy counterparties.
Some of the unimpaired trade and other receivables are past due at the end of the reporting date. The age of financial assets past due but not impaired is as follows:
2011 2010 (As restated - (As restated - 2012 Note 30) Note 30) Not more than one month P 49,229,451 P 202,814,458 P 100,038,064 More than one month but not more than two months 59,529,182 18,649,445 56,037,682 More than two months but not more than six months 26,448,069 34,422 22,591,526 More than six months but not more than one year 54,931,311 108,583,702 82,450,225 More than one year 37,288,853 126,114,702 7,551,252 P 277,426,866 P 456,196,729 P 268,668,749
4.3 Liquidity Risk Analysis The Group manages its liquidity needs by carefully monitoring scheduled debt servicing payments for long-term financial liabilities as well as cash outflows due in a day-to-day business. Liquidity needs are monitored in various time bands, on a day-to-day and week-to-week basis, as well as on the basis of a rolling 30-day projection. Long-term liquidity needs for a 6-month and one-year period are identified monthly.
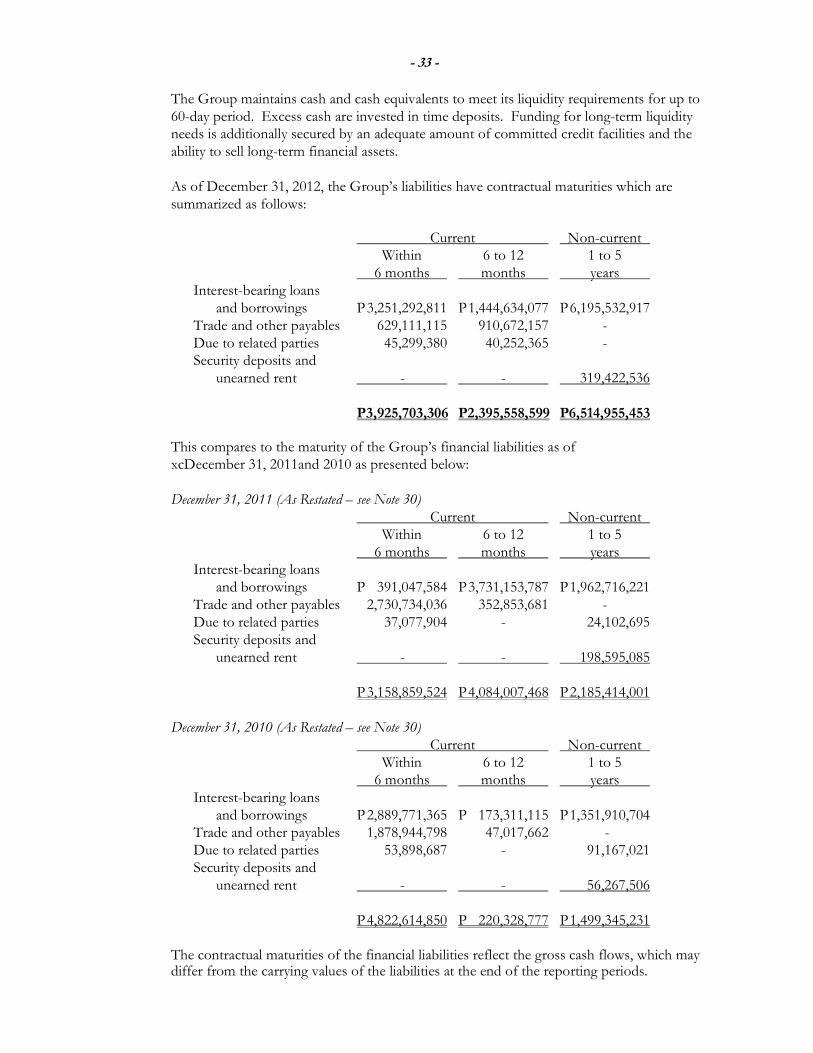
- 33 -
The Group maintains cash and cash equivalents to meet its liquidity requirements for up to 60-day period. Excess cash are invested in time deposits. Funding for long-term liquidity needs is additionally secured by an adequate amount of committed credit facilities and the ability to sell long-term financial assets.
As of December 31, 2012, the Group’s liabilities have contractual maturities which are summarized as follows: Current Non-current Within 6 to 12 1 to 5 6 months months years Interest-bearing loans and borrowings P 3,251,292,811 P 1,444,634,077 P 6,195,532,917
Trade and other payables 629,111,115 910,672,157 - Due to related parties 45,299,380 40,252,365 - Security deposits and unearned rent - - 319,422,536 P3,925,703,306 P2,395,558,599 P6,514,955,453
This compares to the maturity of the Group’s financial liabilities as of xcDecember 31, 2011and 2010 as presented below: December 31, 2011 (As Restated – see Note 30)
Current Non-current Within 6 to 12 1 to 5 6 months months years Interest-bearing loans and borrowings P 391,047,584 P 3,731,153,787 P 1,962,716,221
Trade and other payables 2,730,734,036 352,853,681 - Due to related parties 37,077,904 - 24,102,695 Security deposits and unearned rent - - 198,595,085 P 3,158,859,524 P 4,084,007,468 P 2,185,414,001 December 31, 2010 (As Restated – see Note 30)
Current Non-current Within 6 to 12 1 to 5 6 months months years Interest-bearing loans and borrowings P 2,889,771,365 P 173,311,115 P 1,351,910,704
Trade and other payables 1,878,944,798 47,017,662 - Due to related parties 53,898,687 - 91,167,021 Security deposits and unearned rent - - 56,267,506 P 4,822,614,850 P 220,328,777 P 1,499,345,231
The contractual maturities of the financial liabilities reflect the gross cash flows, which may differ from the carrying values of the liabilities at the end of the reporting periods.
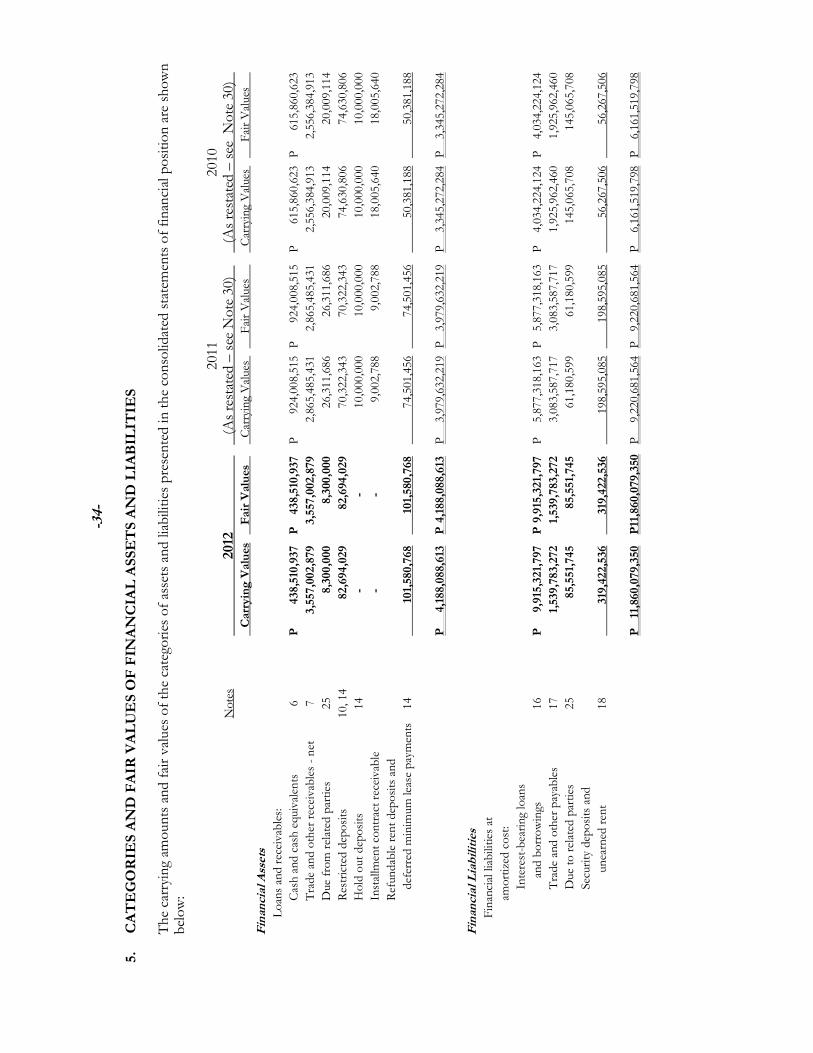
-34-
5.
CA
TE
GO
RIE
S A
ND
FA
IR V
AL
UE
S O
F F
INA
NC
IAL
ASSE
TS A
ND
LIA
BIL
ITIE
S
The carrying amounts and fair values of the categories of assets and liabilities presented in the consolidated statements of financial position are shown
below:
2011
2010
Notes
20
12
(As restated – see Note 30) (As restated – see Note 30)
Carr
yin
g V
alu
es
Fair V
alues Carrying Values Fair Values Carrying Values Fair Values
Fin
anci
al A
sset
s
Loans and receivables:
Cash and cash equivalents
6 P
438,5
10,9
37
P
438,5
10,9
37 P
924,008,515 P 924,008,515 P
615,860,623 P 615,860,623
Trade and other receivables - net
7
3,5
57,0
02,8
79
3,5
57,0
02,8
79
2,865,485,431 2,865,485,431 2,556,384,913 2,556,384,913
Due from related parties
25
8,3
00,0
00
8,3
00,0
00
26,311,686
26,311,686
20,009,114
20,009,114
Restricted deposits
10, 14
82,6
94,0
29
82
,694
,029
70,322,343
70,322,343
74,630,806
74,630,806
Hold out deposits
14
-
-
10,000,000
10,000,000
10,000,000
10,000,000
Installment contract receivable
-
-
9,002,788
9,002,788
18,005,640
18,005,640
Refundable rent deposits and
deferred minimum lease payments 14
10
1,58
0,7
68
101,
580
,768
74,501,456
74,501,456
50,381,188
50,381,188
P
4,18
8,0
88,
613
P 4
,188,0
88,6
13 P 3,979,632,219 P 3,979,632,219 P 3,345,272,284 P 3,345,272,284
Fin
anci
al L
iabilitie
s
Financial liabilities at
amortized cost:
Interest-bearing loans
and borrowings
16
P
9,915
,321,
797
P 9
,915
,321,
797 P 5,877,318,163 P 5,877,318,163 P 4,034,224,124 P 4,034,224,124
Trade and other payables
17
1,
539,7
83,2
72
1,539
,783
,272
3,083,587,717 3,083,587,717 1,925,962,460 1,925,962,460
Due to related parties
25
85,
551,
745
85,5
51,
745
61,180,599
61,180,599
145,065,708
145,065,708
Security deposits and
unearned rent
18
319
,422,5
36
319,4
22,5
36
198,595,085
198,595,085
56,267,506
56,267,506
P
11,8
60,0
79,3
50
P11
,860,0
79,
350 P 9,220,681,564 P 9,220,681,564 P 6,161,519,798 P 6,161,519,798

-35-
6. CASH AND CASH EQUIVALENTS
Cash and cash equivalents include the following components as of December 31: 2011 2010 (As Restated - (As Restated - 2012 see Note 30) see Note 30) Cash on hand P 5,104,365 P 5,997,265 P 3,105,139 Cash in banks 293,191,196 527,020,436 531,473,622 Revolving fund 20,000 8,514,836 2,121,862 Short-term placements 140,195,376 382,475,978 78,960,000
P 438,510,937 P 924,008,515 P 615,860,623
Cash accounts with the banks generally earn interest at rates based on daily bank deposit rates ranging from 0.03% to 3.00% per annum in all years presented. Short-term placements have maturity ranging from 7 to 90 days and earn effective interest ranging from 2.1% to 4.8% per annum in 2012, 2011 and 2010. Interest income earned amounted to P9.4 million, P7.8 million and P6.2 million in 2012, 2011 and 2010, respectively (see Note 21.2).
The balances of the cash on hand and in banks as of December 31, 2012, 2011 and 2010 exclude restricted cash amounting to P82.7 million, P70.3 million and P74.6 million, respectively, which are shown as Restricted Deposits account in the consolidated statements of financial position (see Notes 10 and 14). Such amounts are not available for the general use of the Group under the loan agreements (see Note 16.3).
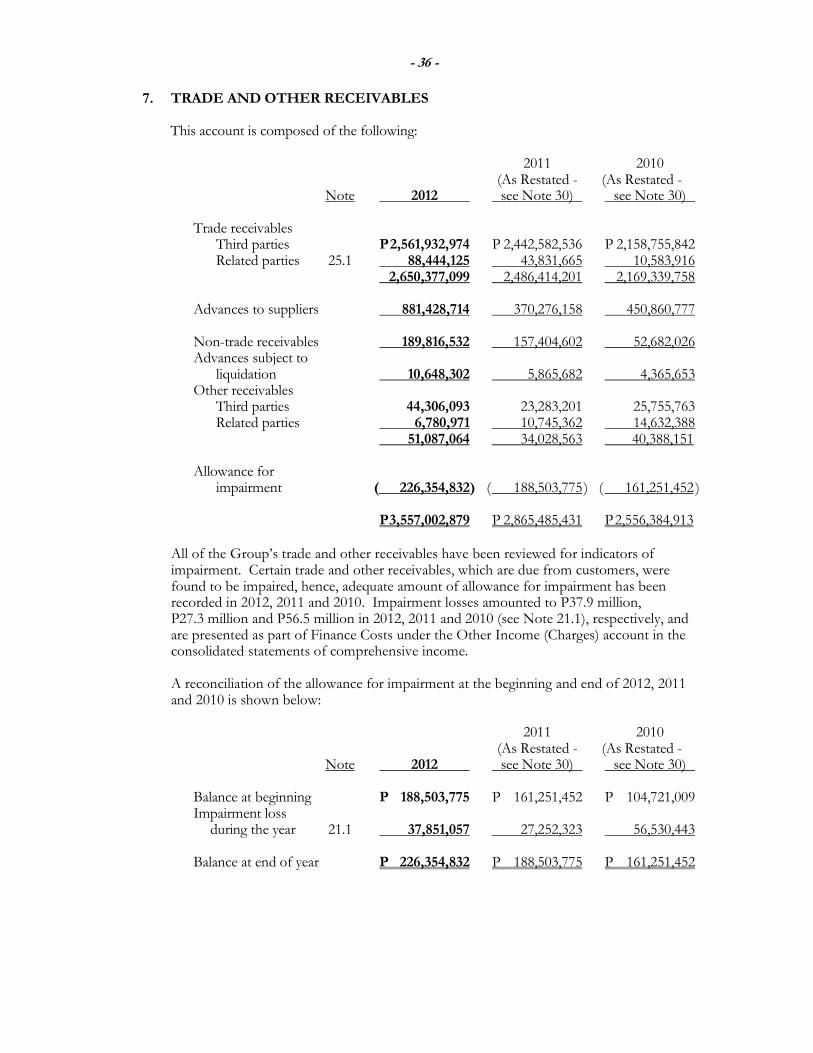
- 36 -
7. TRADE AND OTHER RECEIVABLES This account is composed of the following: 2011 2010 (As Restated - (As Restated - Note 2012 see Note 30) see Note 30) Trade receivables Third parties P 2,561,932,974 P 2,442,582,536 P 2,158,755,842 Related parties 25.1 88,444,125 43,831,665 10,583,916 2,650,377,099 2,486,414,201 2,169,339,758 Advances to suppliers 881,428,714 370,276,158 450,860,777 Non-trade receivables 189,816,532 157,404,602 52,682,026 Advances subject to liquidation 10,648,302 5,865,682 4,365,653 Other receivables Third parties 44,306,093 23,283,201 25,755,763 Related parties 6,780,971 10,745,362 14,632,388 51,087,064 34,028,563 40,388,151 Allowance for impairment ( 226,354,832 ) ( 188,503,775 ) ( 161,251,452 ) P 3,557,002,879 P 2,865,485,431 P 2,556,384,913
All of the Group’s trade and other receivables have been reviewed for indicators of impairment. Certain trade and other receivables, which are due from customers, were found to be impaired, hence, adequate amount of allowance for impairment has been recorded in 2012, 2011 and 2010. Impairment losses amounted to P37.9 million, P27.3 million and P56.5 million in 2012, 2011 and 2010 (see Note 21.1), respectively, and are presented as part of Finance Costs under the Other Income (Charges) account in the consolidated statements of comprehensive income. A reconciliation of the allowance for impairment at the beginning and end of 2012, 2011 and 2010 is shown below:
2011 2010 (As Restated - (As Restated - Note 2012 see Note 30) see Note 30) Balance at beginning P 188,503,775 P 161,251,452 P 104,721,009 Impairment loss during the year 21.1 37,851,057 27,252,323 56,530,443 Balance at end of year P 226,354,832 P 188,503,775 P 161,251,452
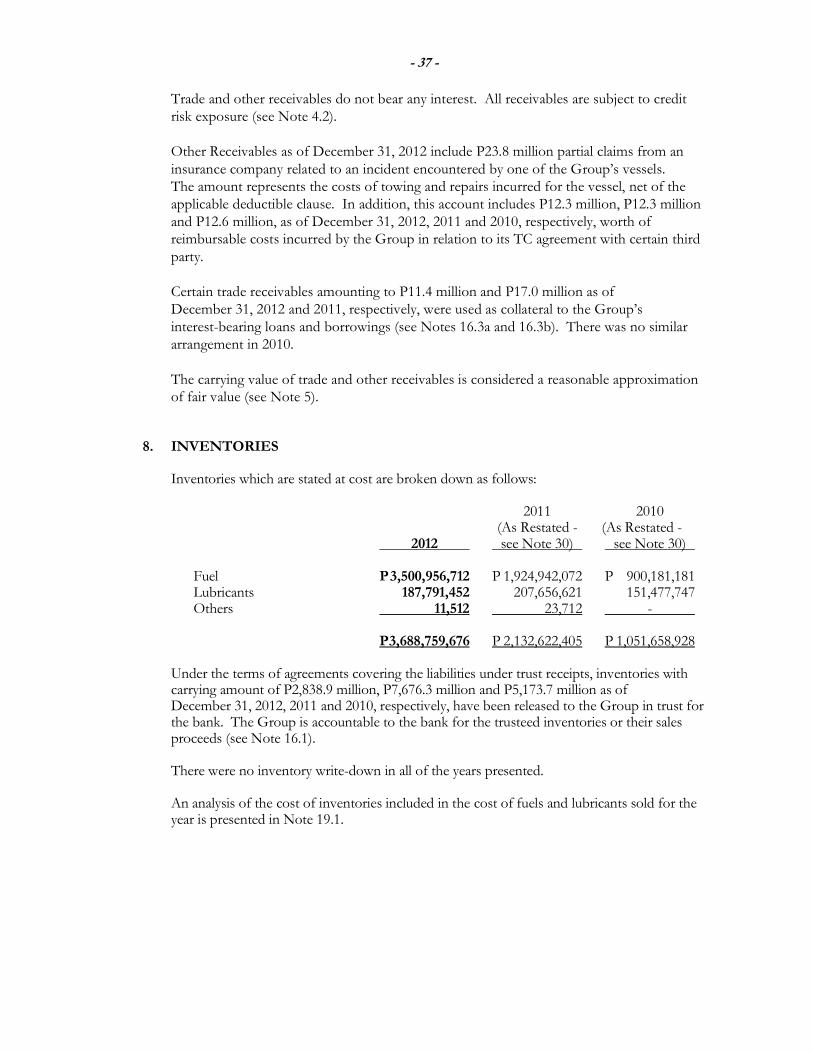
- 37 -
Trade and other receivables do not bear any interest. All receivables are subject to credit risk exposure (see Note 4.2). Other Receivables as of December 31, 2012 include P23.8 million partial claims from an insurance company related to an incident encountered by one of the Group’s vessels. The amount represents the costs of towing and repairs incurred for the vessel, net of the applicable deductible clause. In addition, this account includes P12.3 million, P12.3 million and P12.6 million, as of December 31, 2012, 2011 and 2010, respectively, worth of reimbursable costs incurred by the Group in relation to its TC agreement with certain third party. Certain trade receivables amounting to P11.4 million and P17.0 million as of December 31, 2012 and 2011, respectively, were used as collateral to the Group’s interest-bearing loans and borrowings (see Notes 16.3a and 16.3b). There was no similar arrangement in 2010. The carrying value of trade and other receivables is considered a reasonable approximation of fair value (see Note 5).
8. INVENTORIES
Inventories which are stated at cost are broken down as follows: 2011 2010 (As Restated - (As Restated - 2012 see Note 30) see Note 30) Fuel P 3,500,956,712 P 1,924,942,072 P 900,181,181 Lubricants 187,791,452 207,656,621 151,477,747 Others 11,512 23,712 - P 3,688,759,676 P 2,132,622,405 P 1,051,658,928
Under the terms of agreements covering the liabilities under trust receipts, inventories with carrying amount of P2,838.9 million, P7,676.3 million and P5,173.7 million as of December 31, 2012, 2011 and 2010, respectively, have been released to the Group in trust for the bank. The Group is accountable to the bank for the trusteed inventories or their sales proceeds (see Note 16.1).
There were no inventory write-down in all of the years presented.
An analysis of the cost of inventories included in the cost of fuels and lubricants sold for the year is presented in Note 19.1.
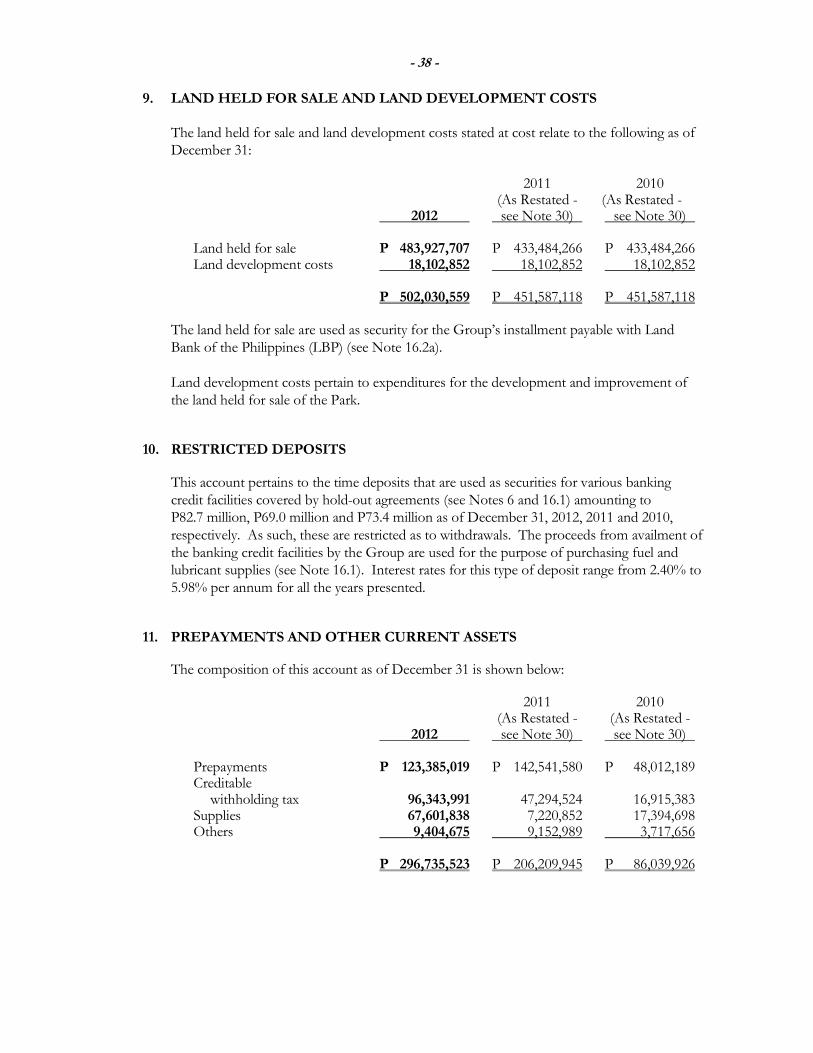
- 38 -
9. LAND HELD FOR SALE AND LAND DEVELOPMENT COSTS The land held for sale and land development costs stated at cost relate to the following as of December 31:
2011 2010 (As Restated - (As Restated - 2012 see Note 30) see Note 30) Land held for sale P 483,927,707 P 433,484,266 P 433,484,266 Land development costs 18,102,852 18,102,852 18,102,852 P 502,030,559 P 451,587,118 P 451,587,118
The land held for sale are used as security for the Group’s installment payable with Land Bank of the Philippines (LBP) (see Note 16.2a). Land development costs pertain to expenditures for the development and improvement of the land held for sale of the Park.
10. RESTRICTED DEPOSITS
This account pertains to the time deposits that are used as securities for various banking credit facilities covered by hold-out agreements (see Notes 6 and 16.1) amounting to P82.7 million, P69.0 million and P73.4 million as of December 31, 2012, 2011 and 2010, respectively. As such, these are restricted as to withdrawals. The proceeds from availment of the banking credit facilities by the Group are used for the purpose of purchasing fuel and lubricant supplies (see Note 16.1). Interest rates for this type of deposit range from 2.40% to 5.98% per annum for all the years presented.
11. PREPAYMENTS AND OTHER CURRENT ASSETS The composition of this account as of December 31 is shown below: 2011 2010 (As Restated - (As Restated - 2012 see Note 30) see Note 30) Prepayments P 123,385,019 P 142,541,580 P 48,012,189 Creditable withholding tax 96,343,991 47,294,524 16,915,383 Supplies 67,601,838 7,220,852 17,394,698 Others 9,404,675 9,152,989 3,717,656 P 296,735,523 P 206,209,945 P 86,039,926

-39-
12.
PR
OPE
RT
Y A
ND
EQ
UIP
ME
NT
The gross carrying amounts and accumulated depreciation and amortization at the beginning and end of 2012, 2011 and 2010 (as restated - see Note 30) are shown below:
B
uildin
gs,
L
ease
hold
G
aso
line
Offic
e
H
auling
T
ransp
ort
ation
Const
ruction
D
epot and
and L
and
Sta
tion
F
urn
iture
and
and H
eavy
and O
ther
Ves
sel
in
Pie
r Faci
lities
Im
pro
vem
ents
E
quip
men
t
E
quip
men
t
E
quip
men
t
E
quip
men
t
T
anker
s
E
quip
men
t
L
and
Pro
gre
ss
Tota
l
December 31, 2012
Cost
P 3,084,915,381 P 55,656,133 P 407,092,708 P 75,658,193 P 341,521,375 P 63,195,010 P 2,935,833,849
P 109,371,360 P 314,817,213 P 826,164,543 P 8,214,225,765
Accumulated depreciation
and amortization
( 488,342,896 ) (
34,646,602 ) (
90,255,972 ) (
59,674,415) ( 165,135,977 ) (
58,709,091 ) (
306,045,202) (
12,629,793)
-
- (
1,215,439,947 )
Net carrying amount
P 2
,596
,572
,485
P
21
,009
,531
P
31
6,83
6,73
6
P
15,9
83,7
78
P
176,
385,
398
P
4,48
5,92
1
P 2
,629
,788
,646
P
96,7
41,5
67 P
314,
817,
213
P
826,
164,
543
P
6,99
8,78
5,81
8 December 31, 2011
Cost
P 2,448,096,169 P 55,242,472 P 343,448,606 P 64,838,151 P 188,602,020 P 59,218,964 P 1,573,097,981
P
8,144,218 P 294,582,257 P 1,369,210,820 P 6,404,481,658
Accumulated depreciation
and amortization
( 287,466,953 ) (
26,720,521 ) (
84,390,166 ) (
51,227,279) (
115,771,597) (
50,707,700) (
214,235,251 ) (
1,691,418)
-
- (
832,210,885 )
Net carrying amount
P 2,160,629,216 P 28,521,951 P 259,058,440 P 13,610,872 P 72,830,423 P
8,511,264 P 1,358,862,730
P
6,452,800 P 294,582,257 P 1,369,210,820 P 5,572,270,773
December 31, 2010
Cost
P 1,066,425,419 P 55,534,047 P 554,116,295 P 54,124,908 P 237,695,961 P 104,577,653 P 1,720,180,752
P
3,721,050 P 202,095,194 P 492,859,284 P 4,491,330,563
Accumulated depreciation
and amortization
( 188,091,626 ) (
16,770,362 ) (
64,434,605 ) (
35,213,662) (
73,827,034) (
43,262,636) ( 183,358,683 ) (
258,938)
-
- (
605,217,546 )
Net carrying amount
P 878,333,793 P 38,763,685 P 489,681,690 P 18,911,246 P 163,868,927 P 61,315,017 P 1,536,822,069 P
3,462,112 P 202,095,194 P 492,859,284 P 3,886,113,017
January 1, 2010
Cost
P 617,338,531 P 47,398,045 P 315,521,430 P 65,705,337 P 154,156,153 P 85,095,874 P 1,733,306,966
P
- P 164,684,194 P 625,020,994 P 3,808,227,524
Accumulated depreciation
and amortization
( 128,767,036 ) (
10,794,503 ) (
57,757,466 ) (
25,876,364) (
49,083,920) (
34,012,977) (
139,851,894 )
-
-
- (
446,144,160 )
Net carrying amount
P 488,571,495 P 36,603,542 P 257,763,964 P 39,828,973 P 105,072,233 P 51,082,897 P 1,593,455,072 P
- P 164,684,194 P 625,020,994 P 3,362,083,364

- 40
-
A reconciliation of the carrying amounts at the beginning and end of 2012, 2011 and 2010 (as restated - see Note 30) of property and equipment is shown below and in the succeeding page.
B
uildin
gs,
L
ease
hold
G
aso
line
Offic
e
H
auling
T
ransp
ort
ation
Const
ruction
D
epot and
and L
and
Sta
tion
F
urn
iture
and
and H
eavy
and O
ther
Ves
sel
in
Pie
r Faci
lities
Im
pro
vem
ents
E
quip
men
t
E
quip
men
t
E
quip
men
t
E
quip
men
t
T
anker
s
E
quip
men
t
L
and
Pro
gre
ss
Tota
l
Balance at January 1, 2012,
net of accumulated
depreciation and
amortization
P 2,160,629,216 P 28,521,951 P 259,058,440 P 13,610,872 P 72,830,423 P
8,511,264 P 1,358,862,730 P
6,452,800 P 294,582,257 P 1,369,210,820 P 5,572,270,773
Additions
277,171,382
916,669
64,971,675
11,202,741
56,929,002
4,395,476
136,041,924
93,530,147
30,490,875
803,220,556 1,478,870,447
Revaluation increment
-
-
-
-
-
-
331,807,097
-
-
-
331,807,097
Transfers
359,647,830 (
503,008 ) (
1,137,573 ) (
299,581)
96,174,777
56,465
894,886,847
7,696,995 (
10,255,919 ) ( 1,346,266,833 )
-
Cost of asset disposed
-
- (
190,000 ) (
83,118) (
184,424) (
475,895)
-
-
-
- (
933,437 )
Accumulated depreciation of
asset disposed
-
-
- (
97,633 ) (
1,703,533 )
-
-
-
-
- (
1,801,166 )
Depreciation and amortization
charges for the year
( 200,875,943 ) (
7,926,081) (
5,865,806 ) (
8,349,503) ( 47,660,847 ) (
8,001,391) (
91,809,951) (
10,938,375)
-
- (
381,427,896 )
Balance at December 31, 2012,
net of accumulated
depreciation and amortization P
2,5
96,5
72,4
85
P
21,0
09,5
31
P
316,
836,
736
P
15,9
83,7
79
P
176,
385,
398
P
4,48
5,91
9
P
2,62
9,78
8,64
7 P
96,7
41,5
67 P
314,
817,
213
P
826,
164,
543
P
6,99
8,78
5,81
8
Balance at January 1, 2011,
net of accumulated
depreciation and
amortization
P 878,333,793 P 38,763,685 P 489,681,690 P 18,911,246 P 163,868,927 P 61,315,017 P 1,536,822,069 P
3,462,112 P 202,095,194 P 492,859,284 P 3,886,113,017
Additions
78,428,525
5,980,923
80,424,627
10,748,332
46,084,497
2,313,589
20,221,155
4,423,168
92,487,063 1,723,009,229 2,064,121,108
Revaluation decrement
-
-
-
-
-
- (
55,931,472 )
-
-
- (
55,931,472 )
Transfers
1,303,242,225 (
6,272,498 ) ( 291,092,316 )
- (
95,178,438 ) (
47,672,278 ) (
16,369,002 )
-
- (
846,657,693 )
-
Cost of asset disposed
-
-
- (
35,089)
-
- (
95,003,452 )
-
-
- (
95,038,541 )
Accumulated depreciation of
asset disposed
-
-
-
7,310
-
-
54,911,279
-
-
-
54,918,589
Depreciation and amortization
charges for the year
( 99,375,327 ) (
9,950,159 ) (
19,955,561 ) ( 16,020,927 ) (
41,944,563 ) (
7,445,064) (
85,787,847 ) (
1,432,480 )
-
- (
281,911,928 )
Balance at December 31, 2011,
net of accumulated
depreciation and amortization P 2,160,629,216 P 28,521,951 P 259,058,440 P 13,610,872 P 72,830,423 P
8,511,264 P 1,358,862,730 P
6,452,800 P 294,582,257 P 1,369,210,820 P 5,572,270,773

- 41
-
B
uildin
gs,
L
ease
hold
G
aso
line
Offic
e
H
auling
T
ransp
ort
ation
Const
ruction
D
epot and
and L
and
Sta
tion
F
urn
iture
and
and H
eavy
and O
ther
Ves
sel
in
Pie
r Faci
lities
Im
pro
vem
ents
E
quip
men
t
E
quip
men
t
E
quip
men
t
E
quip
men
t
T
anker
s
E
quip
men
t
L
and
Pro
gre
ss
Tota
l
Balance at January 1, 2010,
net of accumulated
depreciation and
amortization
P 488,571,495 P 36,603,542 P 257,763,964 P 39,828,973 P 105,072,233 P 51,082,897 P 1,593,455,072 P
- P 164,684,194 P 625,020,994 P 3,362,083,364
Additions
52,015,163
9,502,314 170,528,561
7,422,794 38,770,472
16,369,323
6,451,070
3,721,050
37,411,000
404,485,357
746,677,104
Revaluation decrement
-
-
-
-
-
- (
6,751,545 )
-
-
- (
6,751,545 )
Transfers
397,071,725
539,542
68,066,304 (
19,003,223 )
44,769,336
5,572,908
39,630,475
-
- (
536,647,067 )
-
Cost of asset disposed
-
(
1,905,854 )
-
-
- (
2,460,452) ( 52,456,214 )
-
-
- (
56,822,520 )
Accumulated depreciation of
asset disposed
-
(
13,145 )
-
-
-
2,218,477
17,856,941
-
-
-
20,062,273
Depreciation and amortization
charges for the year
( 59,324,590) (
5,962,714 ) (
6,677,139 ) (
9,337,298) (
24,743,114 ) (
11,468,136 ) (
61,363,730 ) (
258,938 )
-
- (
179,135,659 )
Balance at December 31, 2010,
net of accumulated
depreciation and amortization P 878,333,793 P 38,763,685 P 489,681,690 P 18,911,246 P 163,868,927 P 61,315,017 P 1,536,822,069 P
3,462,112 P 202,095,194 P 492,859,284 P 3,886,113,017
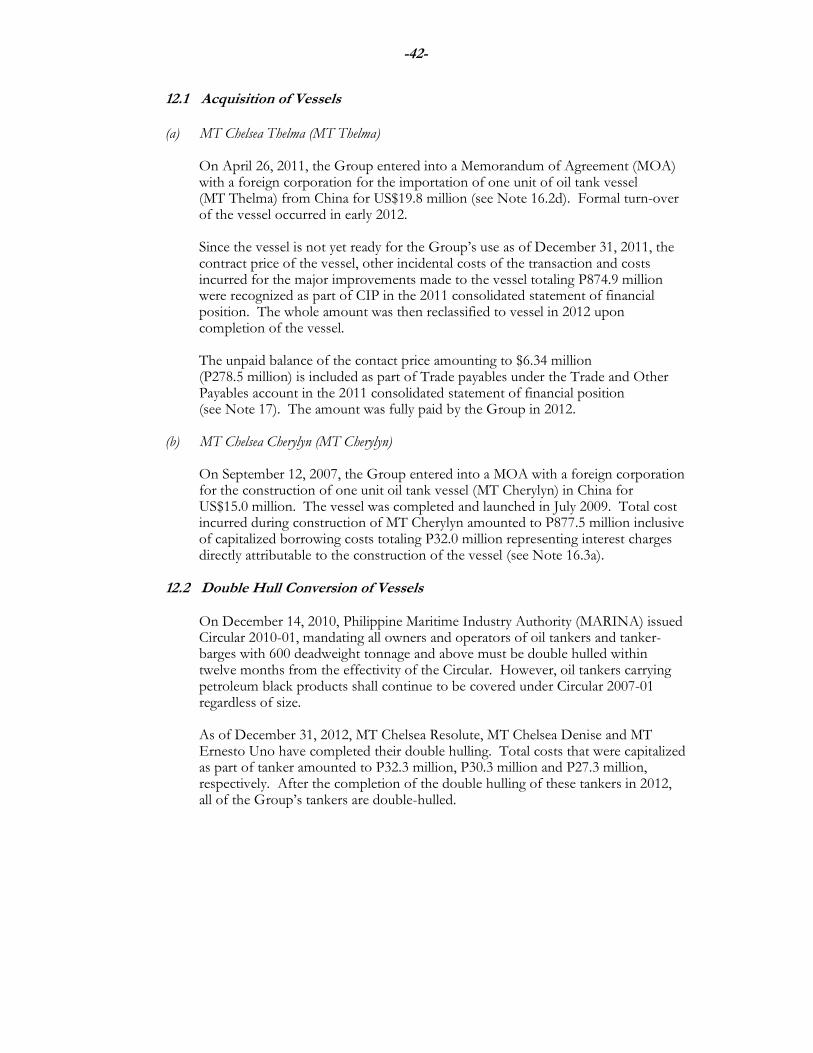
-42-
12.1 Acquisition of Vessels (a) MT Chelsea Thelma (MT Thelma)
On April 26, 2011, the Group entered into a Memorandum of Agreement (MOA) with a foreign corporation for the importation of one unit of oil tank vessel (MT Thelma) from China for US$19.8 million (see Note 16.2d). Formal turn-over of the vessel occurred in early 2012. Since the vessel is not yet ready for the Group’s use as of December 31, 2011, the contract price of the vessel, other incidental costs of the transaction and costs incurred for the major improvements made to the vessel totaling P874.9 million were recognized as part of CIP in the 2011 consolidated statement of financial position. The whole amount was then reclassified to vessel in 2012 upon completion of the vessel. The unpaid balance of the contact price amounting to $6.34 million (P278.5 million) is included as part of Trade payables under the Trade and Other Payables account in the 2011 consolidated statement of financial position (see Note 17). The amount was fully paid by the Group in 2012.
(b) MT Chelsea Cherylyn (MT Cherylyn) On September 12, 2007, the Group entered into a MOA with a foreign corporation for the construction of one unit oil tank vessel (MT Cherylyn) in China for US$15.0 million. The vessel was completed and launched in July 2009. Total cost incurred during construction of MT Cherylyn amounted to P877.5 million inclusive of capitalized borrowing costs totaling P32.0 million representing interest charges directly attributable to the construction of the vessel (see Note 16.3a).
12.2 Double Hull Conversion of Vessels On December 14, 2010, Philippine Maritime Industry Authority (MARINA) issued Circular 2010-01, mandating all owners and operators of oil tankers and tanker-barges with 600 deadweight tonnage and above must be double hulled within twelve months from the effectivity of the Circular. However, oil tankers carrying petroleum black products shall continue to be covered under Circular 2007-01 regardless of size. As of December 31, 2012, MT Chelsea Resolute, MT Chelsea Denise and MT Ernesto Uno have completed their double hulling. Total costs that were capitalized as part of tanker amounted to P32.3 million, P30.3 million and P27.3 million, respectively. After the completion of the double hulling of these tankers in 2012, all of the Group’s tankers are double-hulled.
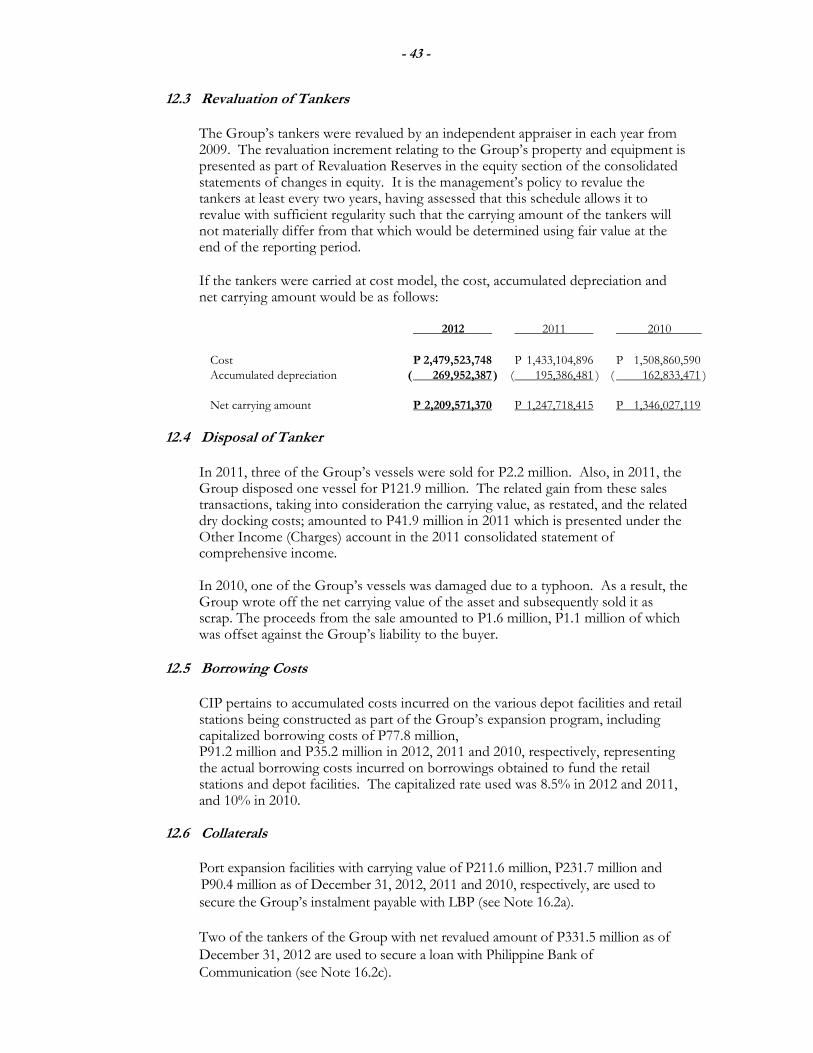
- 43 -
12.3 Revaluation of Tankers
The Group’s tankers were revalued by an independent appraiser in each year from 2009. The revaluation increment relating to the Group’s property and equipment is presented as part of Revaluation Reserves in the equity section of the consolidated statements of changes in equity. It is the management’s policy to revalue the tankers at least every two years, having assessed that this schedule allows it to revalue with sufficient regularity such that the carrying amount of the tankers will not materially differ from that which would be determined using fair value at the end of the reporting period.
If the tankers were carried at cost model, the cost, accumulated depreciation and net carrying amount would be as follows:
2012 2011 2010
Cost P 2,479,523,748 P 1,433,104,896 P 1,508,860,590
Accumulated depreciation ( 269,952,387 ) ( 195,386,481 ) ( 162,833,471 )
Net carrying amount P 2,209,571,370 P 1,247,718,415 P 1,346,027,119
12.4 Disposal of Tanker In 2011, three of the Group’s vessels were sold for P2.2 million. Also, in 2011, the Group disposed one vessel for P121.9 million. The related gain from these sales transactions, taking into consideration the carrying value, as restated, and the related dry docking costs; amounted to P41.9 million in 2011 which is presented under the Other Income (Charges) account in the 2011 consolidated statement of comprehensive income. In 2010, one of the Group’s vessels was damaged due to a typhoon. As a result, the Group wrote off the net carrying value of the asset and subsequently sold it as scrap. The proceeds from the sale amounted to P1.6 million, P1.1 million of which was offset against the Group’s liability to the buyer.
12.5 Borrowing Costs CIP pertains to accumulated costs incurred on the various depot facilities and retail stations being constructed as part of the Group’s expansion program, including capitalized borrowing costs of P77.8 million, P91.2 million and P35.2 million in 2012, 2011 and 2010, respectively, representing the actual borrowing costs incurred on borrowings obtained to fund the retail stations and depot facilities. The capitalized rate used was 8.5% in 2012 and 2011, and 10% in 2010.
12.6 Collaterals Port expansion facilities with carrying value of P211.6 million, P231.7 million and P90.4 million as of December 31, 2012, 2011 and 2010, respectively, are used to secure the Group’s instalment payable with LBP (see Note 16.2a). Two of the tankers of the Group with net revalued amount of P331.5 million as of December 31, 2012 are used to secure a loan with Philippine Bank of Communication (see Note 16.2c).

- 44 -
Certain property and equipment with an aggregate carrying value of P42.5 million, P26.0 million and P37.7 million as of December 31, 2012, 2011 and 2010, respectively, are mortgaged with local banks (see Note 16.4). Moreover, certain service vehicle of the Group with carrying value of P110.8 million, P38.0 million and P81.3 million as of December 31, 2012, 2011 and 2010, respectively, was used as collateral for mortgage payable (see Note 16.5).
12.7 Finance Lease The carrying amount of hauling and heavy equipment held under finance lease amount to P25.5 million as of December 31, 2012 and nil as of December 31, 2011 and 2010 (see Note 16.6).
12.8 Depreciation The amount of depreciation and amortization is allocated as follows:
Notes 2012 2011 2010 Cost of services P 122,984,227 P 78,484,830 P 60,462,084 Selling and administrative expenses 19.2 258,443,669 203,427,098 118,673,575 20 P 381,427,896 P 281,911,928 P 179,135,659
As of December 31, 2012, 2011 and 2010, fully depreciated property and equipment still use in operations amounted to P81.2 million, P50.1 million and P21.1 million, respectively.
13. LAND HELD FOR FUTURE DEVELOPMENT
Land held for future development represents the Group’s land property totaling to 44 hectares in Phase 2 and 3 of the Park that is intended for sale once developed. The Group’s land held for future development was used as collateral for the Group’s installment payable with LBP (see Note 16.2a).
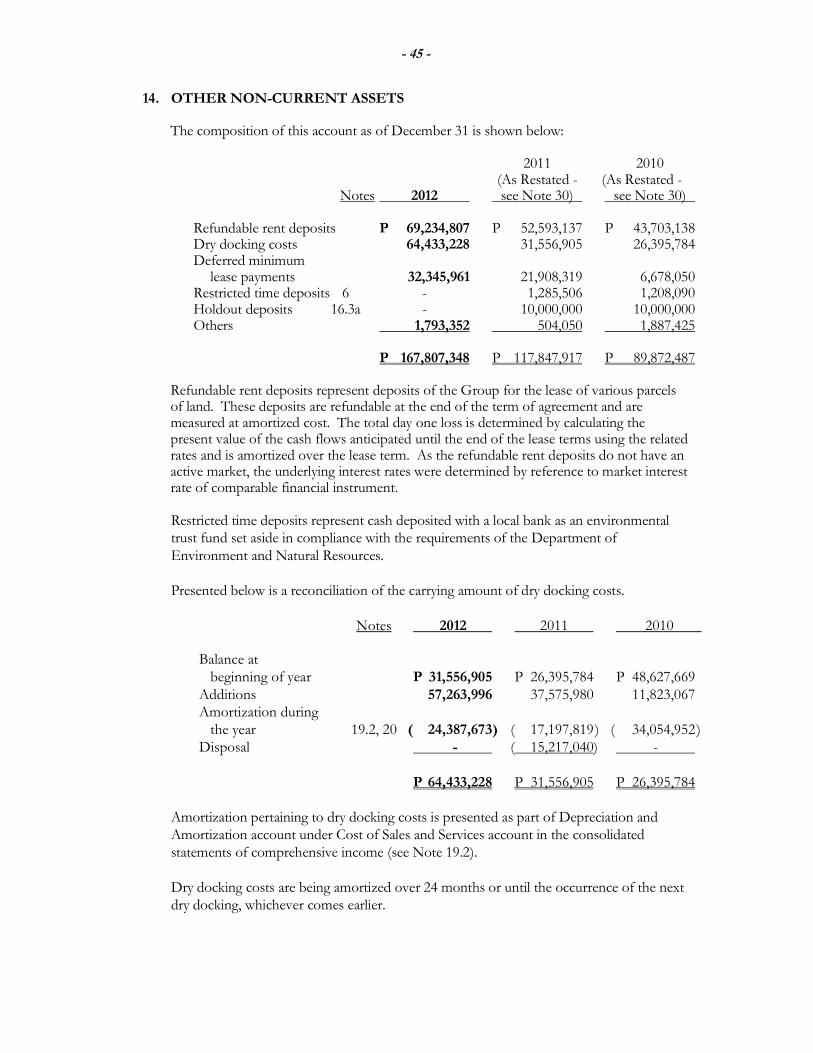
- 45 -
14. OTHER NON-CURRENT ASSETS The composition of this account as of December 31 is shown below: 2011 2010 (As Restated - (As Restated - Notes 2012 see Note 30) see Note 30) Refundable rent deposits P 69,234,807 P 52,593,137 P 43,703,138 Dry docking costs 64,433,228 31,556,905 26,395,784 Deferred minimum lease payments 32,345,961 21,908,319 6,678,050 Restricted time deposits 6 - 1,285,506 1,208,090 Holdout deposits 16.3a - 10,000,000 10,000,000 Others 1,793,352 504,050 1,887,425 P 167,807,348 P 117,847,917 P 89,872,487
Refundable rent deposits represent deposits of the Group for the lease of various parcels of land. These deposits are refundable at the end of the term of agreement and are measured at amortized cost. The total day one loss is determined by calculating the present value of the cash flows anticipated until the end of the lease terms using the related rates and is amortized over the lease term. As the refundable rent deposits do not have an active market, the underlying interest rates were determined by reference to market interest rate of comparable financial instrument.
Restricted time deposits represent cash deposited with a local bank as an environmental trust fund set aside in compliance with the requirements of the Department of Environment and Natural Resources. Presented below is a reconciliation of the carrying amount of dry docking costs.
Notes 2012 2011 2010 Balance at beginning of year P 31,556,905 P 26,395,784 P 48,627,669 Additions 57,263,996 37,575,980 11,823,067 Amortization during the year 19.2, 20 ( 24,387,673 ) ( 17,197,819 ) ( 34,054,952 ) Disposal - ( 15,217,040) - P 64,433,228 P 31,556,905 P 26,395,784
Amortization pertaining to dry docking costs is presented as part of Depreciation and Amortization account under Cost of Sales and Services account in the consolidated statements of comprehensive income (see Note 19.2). Dry docking costs are being amortized over 24 months or until the occurrence of the next dry docking, whichever comes earlier.
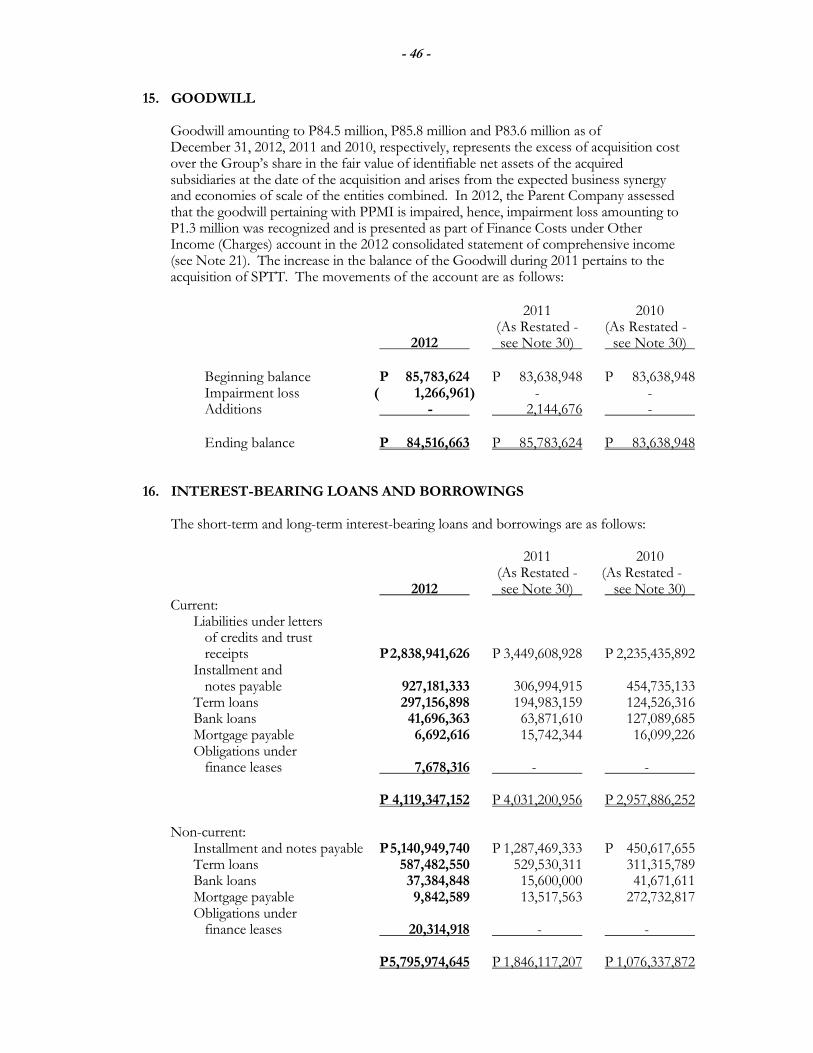
- 46 -
15. GOODWILL Goodwill amounting to P84.5 million, P85.8 million and P83.6 million as of December 31, 2012, 2011 and 2010, respectively, represents the excess of acquisition cost over the Group’s share in the fair value of identifiable net assets of the acquired subsidiaries at the date of the acquisition and arises from the expected business synergy and economies of scale of the entities combined. In 2012, the Parent Company assessed that the goodwill pertaining with PPMI is impaired, hence, impairment loss amounting to P1.3 million was recognized and is presented as part of Finance Costs under Other Income (Charges) account in the 2012 consolidated statement of comprehensive income (see Note 21). The increase in the balance of the Goodwill during 2011 pertains to the acquisition of SPTT. The movements of the account are as follows:
2011 2010 (As Restated - (As Restated - 2012 see Note 30) see Note 30) Beginning balance P 85,783,624 P 83,638,948 P 83,638,948 Impairment loss ( 1,266,961 ) - - Additions - 2,144,676 - Ending balance P 84,516,663 P 85,783,624 P 83,638,948 16. INTEREST-BEARING LOANS AND BORROWINGS
The short-term and long-term interest-bearing loans and borrowings are as follows: 2011 2010 (As Restated - (As Restated - 2012 see Note 30) see Note 30) Current: Liabilities under letters of credits and trust receipts P 2,838,941,626 P 3,449,608,928 P 2,235,435,892 Installment and notes payable 927,181,333 306,994,915 454,735,133 Term loans 297,156,898 194,983,159 124,526,316 Bank loans 41,696,363 63,871,610 127,089,685 Mortgage payable 6,692,616 15,742,344 16,099,226 Obligations under finance leases 7,678,316 - - P 4,119,347,152 P 4,031,200,956 P 2,957,886,252
Non-current:
Installment and notes payable P 5,140,949,740 P 1,287,469,333 P 450,617,655 Term loans 587,482,550 529,530,311 311,315,789 Bank loans 37,384,848 15,600,000 41,671,611 Mortgage payable 9,842,589 13,517,563 272,732,817 Obligations under finance leases 20,314,918 - - P 5,795,974,645 P 1,846,117,207 P 1,076,337,872

- 47 -
16.1 Liabilities Under Letters of Credits and Trust Receipts
The Group avails of letter of credit (LC) and TR lines with local banks to finance its purchases of inventories (see Note 8). These short-term trust receipts bear interests based on prevailing market interest rates at an average of 8.25% per annum both in 2012, 2011 and 2010. The Group is required by the banks to maintain certain collaterals for the credit line facility provided to the Group for working capital requirements. The collaterals are in the form of compensating deposits and a surety of a stockholder (see Notes 10 and 25.6). The carrying values of liabilities under LCs and TRs recognized as part of interest-bearing loans and borrowings in the consolidated statements of financial position are reasonable approximations of their fair values (see Note 5).
16.2 Installment and Notes Payable
16.2a Installment Loan with LBP
On April 16, 2010, the Group availed the P580.0 million loan with LBP. The loan with LBP was used to refinance the installment payable with PHINMA Group via take-out of the outstanding installment payable to PHINMA Group. The refinanced installment payable is payable for seven years with one year grace period on principal and bears an interest rate based on the prevailing LBP rate at the time of availment subject to quarterly repricing with reference to a three month PDST-F rate plus minimum spread of 2.5%. The installment payable with LBP is secured by the Group’s parcel of land with carrying value of P773.0 million, P705.5 million and P749.3 million as of December 31, 2012, 2011 and 2010, respectively (see Notes 9 and 13), and port expansion facilities with carrying value of P211.6 million, P231.7 million and P90.4 million as of December 31, 2012, 2011 and 2010 respectively (see Note 12.6).
16.2b Notes Facility Agreement
In 2011, the Group availed the P750.0 million clean loan under the notes facility
agreement entered into with BDO Capital & Investment Corporation, Banco De Oro Unibank, Inc., Maybank Philippines, Inc., Robinsons Bank Corporation and Banco de Oro Unibank, Inc. – Trust and Investment Group. The long-term loan amounting to P700.0 million with interest rate of 7.35% annually is payable on August 24, 2016 and the remaining P50.0 million with interest rate of 7.66% is payable on August 23, 2018.
16.2c Omnibus Loan and Security Agreement (OLSA) with Philippine Bank of
Communication (PBComm) On February 10, 2012, the Group entered into a loan agreement with PBComm amounting to P107.0 million to partly finance the double hulling and dry docking of a vessel owned by the Group. In February and May 2012, PBComm released the loan amounting to P65.0 million and P42.0 million, respectively. The loan is subject to annual interest rate of 9.5% and is payable in thirty-six equal monthly installments with one quarter grace period from date of each release.
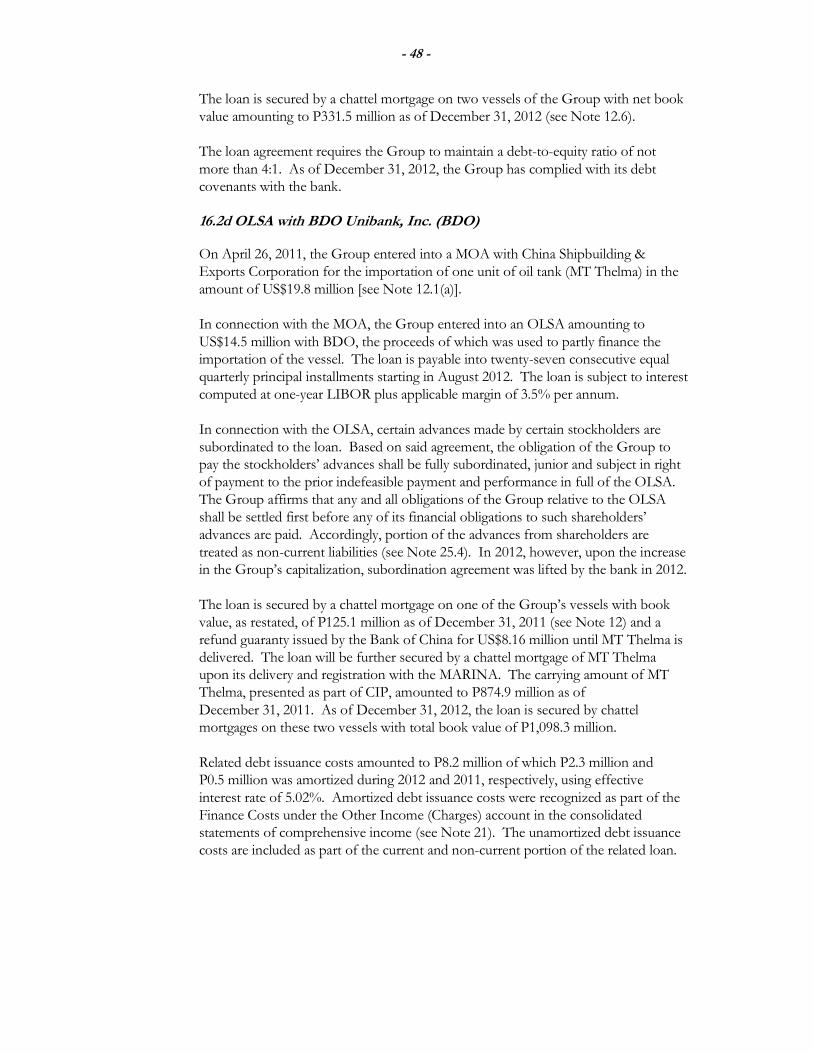
- 48 -
The loan is secured by a chattel mortgage on two vessels of the Group with net book value amounting to P331.5 million as of December 31, 2012 (see Note 12.6). The loan agreement requires the Group to maintain a debt-to-equity ratio of not more than 4:1. As of December 31, 2012, the Group has complied with its debt covenants with the bank.
16.2d OLSA with BDO Unibank, Inc. (BDO)
On April 26, 2011, the Group entered into a MOA with China Shipbuilding & Exports Corporation for the importation of one unit of oil tank (MT Thelma) in the amount of US$19.8 million [see Note 12.1(a)]. In connection with the MOA, the Group entered into an OLSA amounting to US$14.5 million with BDO, the proceeds of which was used to partly finance the importation of the vessel. The loan is payable into twenty-seven consecutive equal quarterly principal installments starting in August 2012. The loan is subject to interest computed at one-year LIBOR plus applicable margin of 3.5% per annum. In connection with the OLSA, certain advances made by certain stockholders are subordinated to the loan. Based on said agreement, the obligation of the Group to pay the stockholders’ advances shall be fully subordinated, junior and subject in right of payment to the prior indefeasible payment and performance in full of the OLSA. The Group affirms that any and all obligations of the Group relative to the OLSA shall be settled first before any of its financial obligations to such shareholders’ advances are paid. Accordingly, portion of the advances from shareholders are treated as non-current liabilities (see Note 25.4). In 2012, however, upon the increase in the Group’s capitalization, subordination agreement was lifted by the bank in 2012. The loan is secured by a chattel mortgage on one of the Group’s vessels with book value, as restated, of P125.1 million as of December 31, 2011 (see Note 12) and a refund guaranty issued by the Bank of China for US$8.16 million until MT Thelma is delivered. The loan will be further secured by a chattel mortgage of MT Thelma upon its delivery and registration with the MARINA. The carrying amount of MT Thelma, presented as part of CIP, amounted to P874.9 million as of December 31, 2011. As of December 31, 2012, the loan is secured by chattel mortgages on these two vessels with total book value of P1,098.3 million. Related debt issuance costs amounted to P8.2 million of which P2.3 million and P0.5 million was amortized during 2012 and 2011, respectively, using effective interest rate of 5.02%. Amortized debt issuance costs were recognized as part of the Finance Costs under the Other Income (Charges) account in the consolidated statements of comprehensive income (see Note 21). The unamortized debt issuance costs are included as part of the current and non-current portion of the related loan.
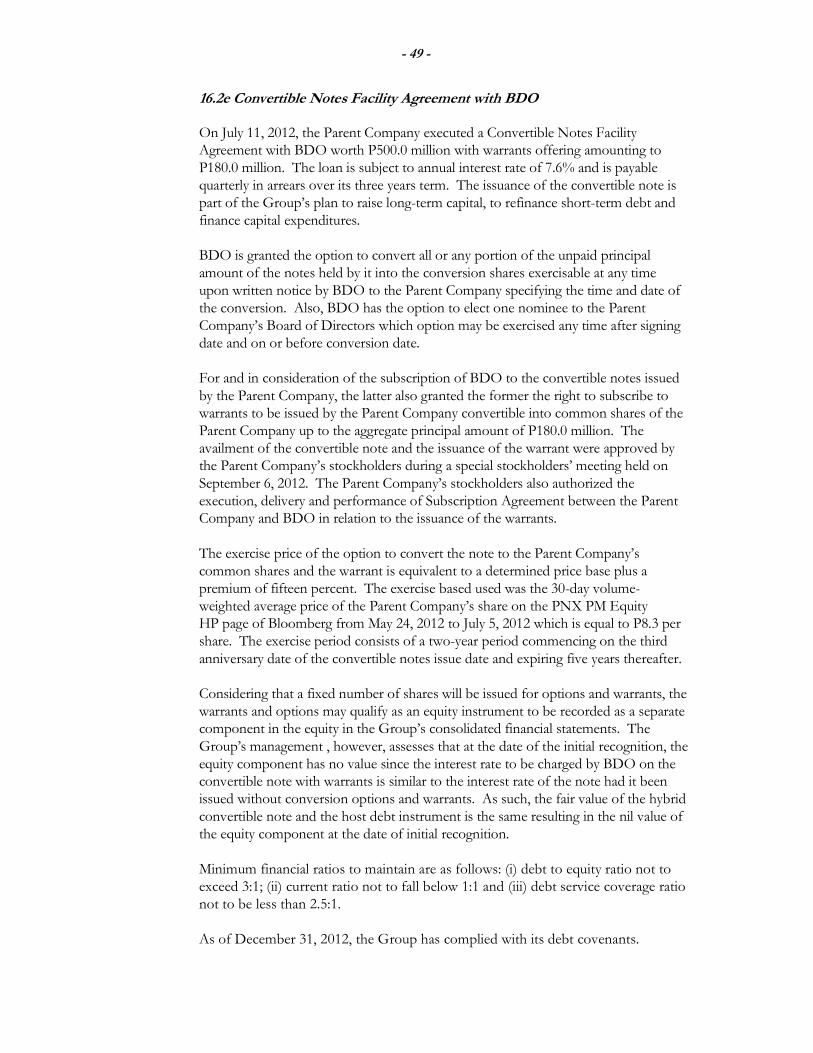
- 49 -
16.2e Convertible Notes Facility Agreement with BDO
On July 11, 2012, the Parent Company executed a Convertible Notes Facility Agreement with BDO worth P500.0 million with warrants offering amounting to P180.0 million. The loan is subject to annual interest rate of 7.6% and is payable quarterly in arrears over its three years term. The issuance of the convertible note is part of the Group’s plan to raise long-term capital, to refinance short-term debt and finance capital expenditures. BDO is granted the option to convert all or any portion of the unpaid principal amount of the notes held by it into the conversion shares exercisable at any time upon written notice by BDO to the Parent Company specifying the time and date of the conversion. Also, BDO has the option to elect one nominee to the Parent Company’s Board of Directors which option may be exercised any time after signing date and on or before conversion date.
For and in consideration of the subscription of BDO to the convertible notes issued by the Parent Company, the latter also granted the former the right to subscribe to warrants to be issued by the Parent Company convertible into common shares of the Parent Company up to the aggregate principal amount of P180.0 million. The availment of the convertible note and the issuance of the warrant were approved by the Parent Company’s stockholders during a special stockholders’ meeting held on September 6, 2012. The Parent Company’s stockholders also authorized the execution, delivery and performance of Subscription Agreement between the Parent Company and BDO in relation to the issuance of the warrants. The exercise price of the option to convert the note to the Parent Company’s common shares and the warrant is equivalent to a determined price base plus a premium of fifteen percent. The exercise based used was the 30-day volume-weighted average price of the Parent Company’s share on the PNX PM Equity HP page of Bloomberg from May 24, 2012 to July 5, 2012 which is equal to P8.3 per share. The exercise period consists of a two-year period commencing on the third anniversary date of the convertible notes issue date and expiring five years thereafter. Considering that a fixed number of shares will be issued for options and warrants, the warrants and options may qualify as an equity instrument to be recorded as a separate component in the equity in the Group’s consolidated financial statements. The Group’s management , however, assesses that at the date of the initial recognition, the equity component has no value since the interest rate to be charged by BDO on the convertible note with warrants is similar to the interest rate of the note had it been issued without conversion options and warrants. As such, the fair value of the hybrid convertible note and the host debt instrument is the same resulting in the nil value of the equity component at the date of initial recognition. Minimum financial ratios to maintain are as follows: (i) debt to equity ratio not to exceed 3:1; (ii) current ratio not to fall below 1:1 and (iii) debt service coverage ratio not to be less than 2.5:1. As of December 31, 2012, the Group has complied with its debt covenants.
- 50 -
16.2f Notes Facility Agreement with China Banking Corporation and Pentacapital Investment Corporation
On November 8, 2012, the Parent Company entered into a notes facility agreement with China Banking Corporation and Pentacapital Investment Corporation totaling P2,500.0 million. The loan is subject to a fixed annual interest rate of 7.75% which is payable in twenty quarterly payments. The net proceeds of the loan were used by the Parent Company for the roll out of the retails stations, for debt financing, to support capital expenditures and for other general corporate purposes. As of December 31, 2012, the total amount of the loan has already been drawn down. By virtue of the notes facility agreement, the Parent Company affirms that it shall maintain the listing of its common shares with PSE and shall not declare or pay any dividends to stockholders (other than dividends payable solely in shares of its capital stock) or retain, retire, purchase or otherwise acquire any class of its capital stock, or make any other capital or other asset distribution to its stockholders, unless all payments due under the notes are current and updated. Minimum financial ratios to maintain are as follows: (i) debt to equity ratio not to exceed 3:1; (ii) current ratio not to fall below 1:1 and (iii) debt service coverage ratio not to be less than 2.5:1. As of December 31, 2012, the Group has complied with its debt covenants.
16.3 Term Loans
16.3a Term Loan Agreement (TLA) with Development Bank of the
Philippines (DBP) On September 12, 2007, the Group entered into a MOA with China Shipbuilding & Exports Corporation for the construction of one unit of oil tank (vessel) in the amount of US$15.0 million [see Note 12.1(b)]. In connection with the MOA, the Group entered into a TLA amounting to US$13.0 million with DBP, the proceeds of which shall be exclusively used to finance the construction of the vessel. In February 2008 and May 2009, DBP granted the loan amounting to US$3.9 million (P159.0 million) and US$9.1 million (P432.5 million), respectively. The loan is payable over five years in equal quarterly principal installments, with one quarter grace period on principal, commencing November 2009 and was subject to 10.5% interest rate per annum. In 2010, DBP approved the reduction of interest rate from 10.5% to 9% subject to annual review effective September 14, 2010. The agreement also stipulated for interest-bearing hold-out deposits amounting to at least P10.0 million which is shown as Hold-out Deposits under the Other Non-current Assets account in the consolidated statements of financial position (see Note 14). The Hold-out Deposits were agreed to be released by the DBP in 2012. Hold-out deposit earns interest at the rate of 2.5% per annum. In 2012, DBP further reduced the interest rate to 7.5% effective March 23, 2012.
- 51 -
The loan is secured by a chattel mortgage on certain vessel of the Group with net book value, as restated, amounting to P808.1 million, P713.6 million and P947.3 million as of December 31, 2012, 2011 and 2010, respectively, and of certain vessels with total net book value, as restated, totaling P921.0 million as of December 31, 2010 (see Note 12). The loan is also secured by certain collateral on receivables of CSC and guaranteed by certain stockholders of the Group (see Notes 7 and 25.6).
16.3b Loan Agreement with Robinsons Bank Corporation (RBC)
On November 23, 2011, the Group entered into a loan agreement with RBC amounting to P65.0 million to partly finance the double hulling and dry docking of certain vessel of the Group. The loan is subject to annual interest rate of 8.0% and is payable in twenty-four equal monthly installments. The loan is secured by a chattel mortgage on one of the vessels of the Group with net book value amounting to P130.7 million and P101.3 million as of December 31, 2012 and 2011, respectively, and receivables of CSC from certain customer (see Note 7). The loan is also guaranteed by certain stockholders of CSC. 16.3c TLA with Maybank Philippines, Inc.
On July 18, 2012, the Parent Company signed with Maybank Philippines, Inc. a five year clean term loan amounting to P300.0 million to be used exclusively for capital expenditure and permanent working capital. The loan is subject to annual interest rate of 6.0% and is payable in twenty equal quarterly installments. In connection with the TLA, all existing and future advances to the Parent Company by its stockholders or related parties are subordinated to the loan. The Parent Company agrees that any and all of its obligations relative to the TLA shall be settled first before any of its financial obligations to such shareholders’ and related parties’ advances are paid. The TLA also requires the Parent Company to maintain debt-to-equity ratio of not more than 3:1, current ratio of at least 1:1 and debt coverage ratio of at least 2.5.
As of December 31, 2012, the Group has complied with its debt covenants with the bank. 16.3d TLA with Maybank International Ltd.
On November 20, 2012, the Group entered into a TLA amounting to US$24.0 million with Maybank International Ltd. to fund various capital expenditures. The total amount of the loan is broken down into US$14.0 million (tranche 1) which is due in five years and US$10.0 million (tranche 2) with a term of three years. The loan is subject to interest computed at one-year LIBOR plus applicable margin of 4.25% per annum, or cost of funds plus a margin of 2.0% per annum, whichever is higher. Interest payments are to be serviced quarterly in arrears. Maybank International Ltd. reserves the right to vary, at its absolute discretion from time to time, such rate of interest, which variation may take place by varying the LIBOR or the margin or spread above the LIBOR, or both.

- 52 -
The TLA also requires the Group to maintain debt-to-equity ratio of not more than 3:1, current ration of at least 1:1 and debt coverage ratio of at least 2.5.
Moreover, Maybank International Ltd. has the right of first refusal and right to match any fund raising exercise that may be required to refinance the U.S. dollar-denominated term facility either via follow-on offering of the Group’s shares or a syndicated term loan.
The balance of the principal of the loan amounted to P987.2 million, translated into Philippine Peso using the closing rate as of December 31, 2012. As of December 31, 2012, the Group has complied with its debt covenants with the bank.
16.4 Bank Loans
The bank loans represent secured loans from local commercial banks for working capital purposes. The loans bear annual interest rates ranging from 7.5% to 14.0% in 2012, 2011 and 2010 subject to monthly repricing. These loans are secured by certain vessels owned by the Group with net book value, as restated, amounting to P182.7 million, P259.3 million and P501.5 million as of December 31, 2012, 2011 and 2010 respectively
(see Note 12.6), and by certain stockholders (see Notes 16.7 and 25.6).
16.5 Mortgage Payable The mortgage payable represents secured loans which bear interest rates ranging from
7.6% to 11.4% per annum, and with terms ranging from 18 months to 36 months. The mortgages are secured by certain service vehicles of the Group, presented as part of Property and Equipment account in the consolidated statements of financial position (see Note 12).
16.6 Obligations under Finance Lease
The finance lease liability for certain hauling and heavy equipment has an effective interest rate of 5.07% which is equal to the rate implicit in the lease contract (see Notes 12.7 and 29.5). Lease payments are made on a monthly basis. 16.7 Credit Line
The Parent Company has an available credit line of P10.0 billion and P8.3 billion under LC and TR, respectively. These lines obtained from various banks are being utilized by the Parent Company for procurement of inventories both local and foreign. The credit line is secured by the following:
(a) Assignment of future receivables; (b) Suretyship of the PPHI and pledge of its share in the Parent Company
amounting to P46,958,000 (at P1 par value); (c) Joint several signature of certain stockholders; and, (d) Negative pledge over the remaining shares of PPHI in Parent Company in
favor of the bank amounting to P4,080.0 million.
- 53 -
Total interest expense on the interest-bearing loans and borrowings amounted to P467.4 million, P305.4 million and P310.8 million in 2012, 2011 and 2010, respectively,
17. TRADE AND OTHER PAYABLES This account consists of: 2011 2010 (As Restated - (As Restated - Note 2012 see Note 30) see Note 30) Trade payables 12.1 P 565,867,953 P 2,448,692,607 P 1,425,197,487 Accrued expenses 512,791,859 186,255,407 147,556,307 Advances from customers 310,478,006 271,051,966 179,931,492 Income tax payable 7,321,912 - 141,019 Others 150,645,454 177,587,737 173,277,173 P 1,547,105,184 P 3,083,587,717 P 1,926,103,478
The 2011 balance of Trade payables includes the P278.5 million unpaid balance of the agreed price for the purchase of MT Thelma from a foreign corporation. It was fully paid as of December 31, 2012.
Accrued expenses mostly pertain to payables to various contractors for the construction of retail stations that remains unpaid at the end of the year. In addition, this comprises amounts to be paid in relation to charter hire cost, repairs and maintenance, interest expense arising from loans and professional fees. The advances from customers include option money from two different locators amounting to P0.1 million in 2012 and 2011, and P47.0 million in 2010. The said locators have the right and option to purchase subject properties under the terms and condition agreed by the said locator and the Group. However, in the event that the said locator does not exercise its right to purchase the subject properties, the option money shall be refunded to the said locator plus interest at the rate equivalent to the prevailing treasury bill rate plus 2% per annum.
In addition, the advances from customers pertain to the advance payment of the various customers for their fuel purchases. Advances from customers are measured at the amount of cash received from the customers and are offset against trade receivables once the related sales transactions are consummated.
The carrying amount of trade and other payables, which are expected to be settled within the next 12 months from reporting period, is a reasonable approximation of their fair value (see Note 5).

- 54 -
18. OTHER NON-CURRENT LIABILITIES This account consists of: 2011 2010 (As Restated - (As Restated - Note 2012 see Note 30) see Note 30) Security deposits P 270,272,999 P 147,463,104 P 53,072,027 Retirement benefit obligation 22.2 24,337,362 17,266,395 12,029,362 Unearned rent 49,149,537 51,131,981 3,195,479 Others 995,395 827,576 827,374 P 344,755,293 P 216,689,056 P 69,124,242
Security deposits represent deposits received from dealers for the lease of retail stations and equipment that are installed in retail stations and are refundable at the end of the lease terms. The deposits are carried at amortized cost using the effective interest rates at the inception of the lease contracts. The day one gain is determined by calculating the present value of the cash flows anticipated until the end of the lease term using certain risk-free rates and is amortized over the lease terms. As the deposits do not have an active market, the underlying interest rates were determined by reference to certain interest rate of comparable financial instrument.
19. COST OF SALES AND SERVICES
This account is composed of the following as of December 31:
2011 2010 (As Restated - (As Restated - Notes 2012 see Note 30) see Note 30) Cost of fuels and lubricants sold 19.1 P 31,444,710,716 P 24,646,048,111 P 12,828,616,845 Cost of services 19.2 517,038,697 426,399,961 334,518,902 Cost of real estate sold 20 - 255,169,157 82,133,000 P 31,961,749,413 P 25,327,617,229 P 13,245,268,747
- 55 -
19.1. Cost of Fuels and Lubricants Sold The cost of fuels and lubricants sold are broken down as follows:
2011 2010 (As Restated - (As Restated - Note 2012 see Note 30) see Note 30) Inventories at beginning of year 8 P 2,132,622,405 P 1,051,658,928 P 457,924,415 Net purchases during the year 33,000,847,987 25,727,011,588 13,422,351,358 Goods available for sale 35,133,470,392 26,778,670,516 13,880,275,773 Inventories at end of year 8 ( 3,688,759,676) ( 2,132,622,405 ) ( 1,051,658,928) P 31,444,710,716 P 24,646,048,111 P 12,828,616,845
19.2. Cost of Services
Details of cost of services are shown below:
2011 2010 (As restated - (As restated - Notes 2012 see Note 30) see Note 30) Depreciation and amortization 12, 14 P 147,371,900 P 95,682,649 P 94,517,036 Bunkering 106,973,168 97,707,682 25,081,727 Charter hire fees 71,143,057 52,127,126 31,765,499 Port expenses 58,257,723 58,067,686 58,021,279 Professional fees 42,067,106 19,219,086 16,099,094 Salaries and employees benefits 29,065,941 39,170,418 40,822,766 Insurance 25,329,791 23,277,799 29,948,770 Repairs and maintenance 19,611,488 18,785,445 14,535,959 Taxes and licenses 7,745,126 8,508,543 4,337,740 Fuel, gas and lubricants 4,974,245 9,630,985 15,313,547 Security services 1,210,469 1,022,920 1,000,410 Travel and transportation 208,697 276,842 497,908 Outside services - 760,118 633,569 Others 3,079,986 2,162,662 1,943,598 P 517,038,697 P 426,399,961 P 334,518,902
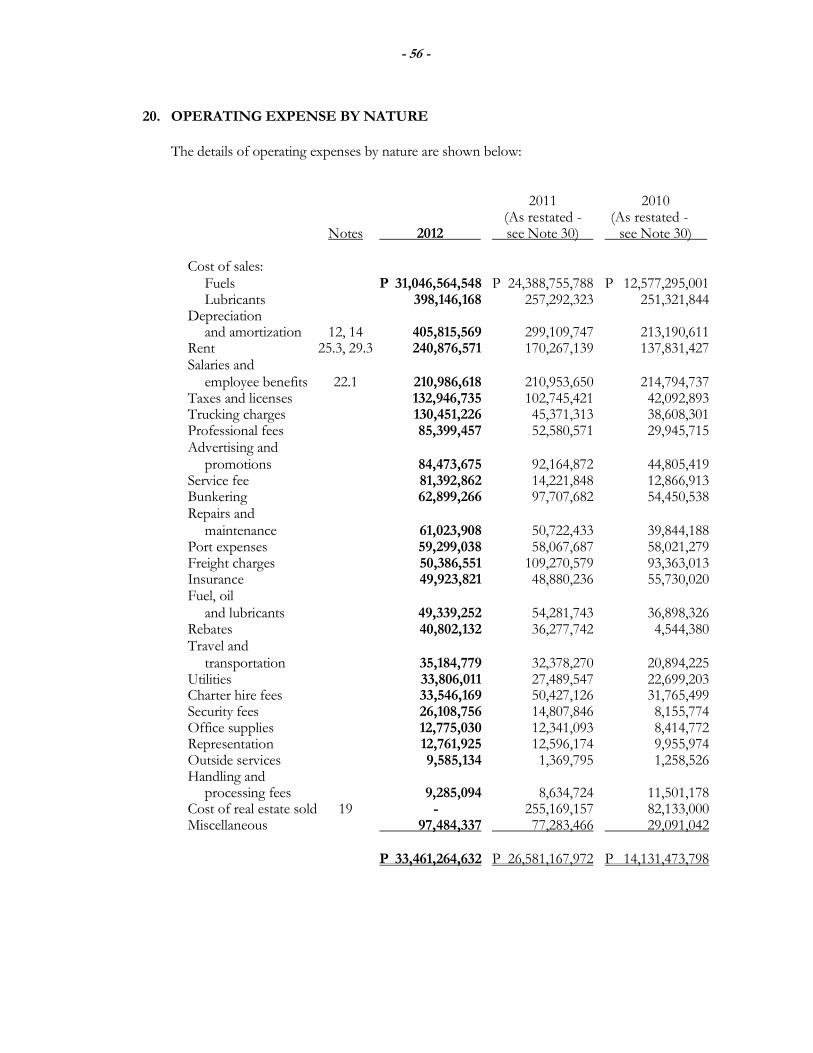
- 56 -
20. OPERATING EXPENSE BY NATURE
The details of operating expenses by nature are shown below: 2011 2010 (As restated - (As restated - Notes 2012 see Note 30) see Note 30) Cost of sales: Fuels P 31,046,564,548 P 24,388,755,788 P 12,577,295,001 Lubricants 398,146,168 257,292,323 251,321,844 Depreciation and amortization 12, 14 405,815,569 299,109,747 213,190,611 Rent 25.3, 29.3 240,876,571 170,267,139 137,831,427 Salaries and employee benefits 22.1 210,986,618 210,953,650 214,794,737 Taxes and licenses 132,946,735 102,745,421 42,092,893 Trucking charges 130,451,226 45,371,313 38,608,301 Professional fees 85,399,457 52,580,571 29,945,715 Advertising and promotions 84,473,675 92,164,872 44,805,419 Service fee 81,392,862 14,221,848 12,866,913 Bunkering 62,899,266 97,707,682 54,450,538 Repairs and maintenance 61,023,908 50,722,433 39,844,188 Port expenses 59,299,038 58,067,687 58,021,279 Freight charges 50,386,551 109,270,579 93,363,013 Insurance 49,923,821 48,880,236 55,730,020 Fuel, oil and lubricants 49,339,252 54,281,743 36,898,326 Rebates 40,802,132 36,277,742 4,544,380 Travel and transportation 35,184,779 32,378,270 20,894,225 Utilities 33,806,011 27,489,547 22,699,203 Charter hire fees 33,546,169 50,427,126 31,765,499 Security fees 26,108,756 14,807,846 8,155,774 Office supplies 12,775,030 12,341,093 8,414,772 Representation 12,761,925 12,596,174 9,955,974 Outside services 9,585,134 1,369,795 1,258,526 Handling and processing fees 9,285,094 8,634,724 11,501,178 Cost of real estate sold 19 - 255,169,157 82,133,000 Miscellaneous 97,484,337 77,283,466 29,091,042 P 33,461,264,632 P 26,581,167,972 P 14,131,473,798
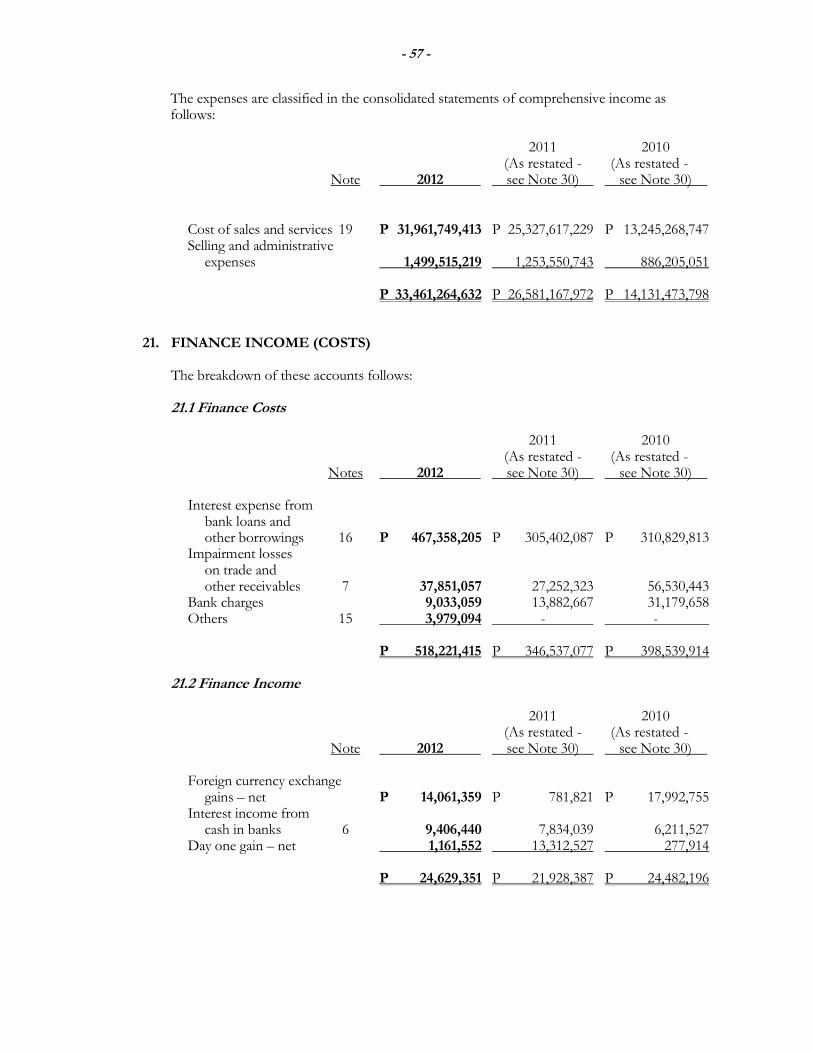
- 57 -
The expenses are classified in the consolidated statements of comprehensive income as follows:
2011 2010 (As restated - (As restated - Note 2012 see Note 30) see Note 30) Cost of sales and services 19 P 31,961,749,413 P 25,327,617,229 P 13,245,268,747 Selling and administrative expenses 1,499,515,219 1,253,550,743 886,205,051 P 33,461,264,632 P 26,581,167,972 P 14,131,473,798 21. FINANCE INCOME (COSTS)
The breakdown of these accounts follows:
21.1 Finance Costs
2011 2010 (As restated - (As restated - Notes 2012 see Note 30) see Note 30) Interest expense from bank loans and other borrowings 16 P 467,358,205 P 305,402,087 P 310,829,813 Impairment losses on trade and other receivables 7 37,851,057 27,252,323 56,530,443 Bank charges 9,033,059 13,882,667 31,179,658 Others 15 3,979,094 - - P 518,221,415 P 346,537,077 P 398,539,914
21.2 Finance Income
2011 2010 (As restated - (As restated - Note 2012 see Note 30) see Note 30) Foreign currency exchange gains – net P 14,061,359 P 781,821 P 17,992,755 Interest income from cash in banks 6 9,406,440 7,834,039 6,211,527 Day one gain – net 1,161,552 13,312,527 277,914 P 24,629,351 P 21,928,387 P 24,482,196
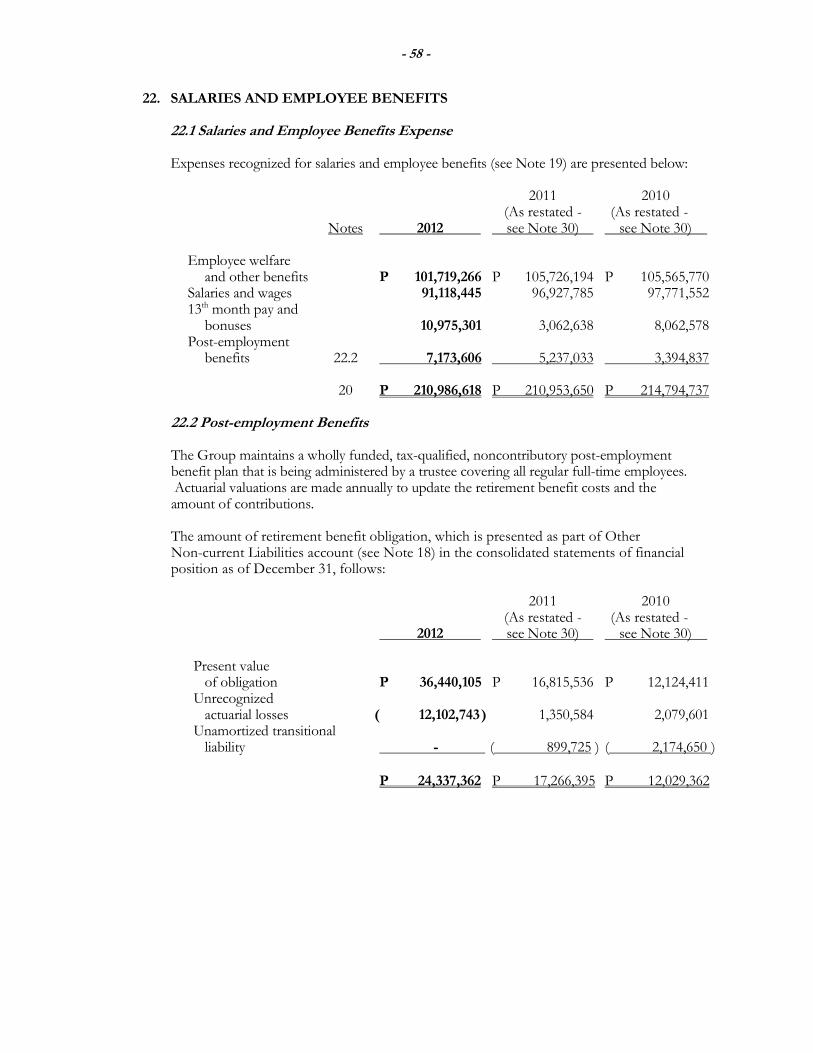
- 58 -
22. SALARIES AND EMPLOYEE BENEFITS 22.1 Salaries and Employee Benefits Expense Expenses recognized for salaries and employee benefits (see Note 19) are presented below: 2011 2010 (As restated - (As restated - Notes 2012 see Note 30) see Note 30) Employee welfare and other benefits P 101,719,266 P 105,726,194 P 105,565,770 Salaries and wages 91,118,445 96,927,785 97,771,552 13th month pay and bonuses 10,975,301 3,062,638 8,062,578 Post-employment benefits 22.2 7,173,606 5,237,033 3,394,837 20 P 210,986,618 P 210,953,650 P 214,794,737
22.2 Post-employment Benefits The Group maintains a wholly funded, tax-qualified, noncontributory post-employment benefit plan that is being administered by a trustee covering all regular full-time employees. Actuarial valuations are made annually to update the retirement benefit costs and the amount of contributions. The amount of retirement benefit obligation, which is presented as part of Other Non-current Liabilities account (see Note 18) in the consolidated statements of financial position as of December 31, follows:
2011 2010 (As restated - (As restated - 2012 see Note 30) see Note 30) Present value of obligation P 36,440,105 P 16,815,536 P 12,124,411 Unrecognized actuarial losses ( 12,102,743 ) 1,350,584 2,079,601 Unamortized transitional liability - ( 899,725 ) ( 2,174,650 ) P 24,337,362 P 17,266,395 P 12,029,362

- 59 -
2011 2010 (As restated - (As restated - 2012 see Note 30) see Note 30) Balance at beginning of year P 16,815,536 P 12,124,411 P 13,446,366 Actuarial loss 13,643,977 431,917 - Current service cost 4,921,333 4,740,900 1,819,050 Interest cost 1,499,078 1,625,308 1,202,961 Changes in assumptions ( 371,380) ( 299,500) 729,500 Benefits paid ( 102,639) - ( 256,800 ) Experience adjustments 34,200 34,200 ( 4,024,066 ) Effect of curtailment - ( 1,841,700) ( 792,600 ) Balance at end of year P 36,440,105 P 16,815,536 P 12,124,411
The amounts of retirement benefits expense recognized in the consolidated statements of comprehensive income are as follows:
2011 2010 (As restated - (As restated - Note 2012 see Note 30) see Note 30) ` Current service cost P 4,921,333 P 4,740,900 P 1,819,050 Interest cost 1,499,078 1,625,308 1,202,961 Amortization of transitional liability 899,725 1,274,925 372,826 Actuarial loss (gain) recognized during the year ( 146,530) 91,200 - Curtailment gain - ( 2,495,300) - 22.1 P 7,173,606 P 5,237,033 P 3,394,837
The amount of retirement benefits expenses is presented under Selling and Administrative Expenses in the consolidated statements of comprehensive income. Presented below are the historical information related to the present value of the retirement benefit obligation and the experienced adjustments arising on plan liabilities (in thousand Philippine Pesos). 2012 2011 2010 2009 2008
Present value of the obligation P 36,440 P 16,816 P 12,124 P 13,446 P 7,625
Experience adjustments on plan
liabilities 34 34 4,024 - -

- 60 -
For the determination of the retirement benefit obligation, the following actuarial assumptions were used:
2012 2011 2010 Discount rate 4.70% to 6.20% 5.48% to 10.44% 8.68% to 10.44%
Expected rate of salary increase 5% to 7% 5% to 10% 5% to 10%
Assumptions regarding future mortality are based on published statistics and mortality tables.
The Group’s post-employment benefit is unfunded as of December 31, 2012, 2011 and 2010. The Group has yet to determine how much and when to fund the post-employment benefit plan.
23. REGISTRATION WITH THE BOARD OF INVESTMENTS
23.1 BOI Registration as New Industry Participant – Davao Depot The Parent Company was registered with the Bureau of Investments (BOI) on November 16, 2005, as a new industry participant with new investment in storage, marketing and distribution of petroleum products under Republic Act (RA) No. 8479 (Downstream Oil Industry Deregulation Act). Under its registration, the Parent Company is required to observe certain general and specific terms and conditions stated in the provisions of the Omnibus Investments Code of 1987 (the Code). Under its registration, the Parent Company is also entitled to certain tax and non-tax incentives as follows: (a) Income tax holiday (ITH) for five years from November 16, 2005 without
extension or bonus year from the date of registration; (b) Additional deduction from taxable income of 50% of the wages corresponding to
the increment in the number of direct labor for skilled and unskilled workers in the year of availment as against the previous year if the project meets the prescribed ratio of capital equipment to number of workers set by the board of not more than US$10,000 to one worker and provided that this incentive shall not be availed of simultaneously with the ITH;
(c) The Parent Company may qualify to import capital requirement, spare parts and
accessories at zero percent (0%) from the date of registration up to June 16, 2011 pursuant to the Executive Order No. 528 and its implementing rules and regulations. Special transport equipment such as but not limited to tanks, trucks/lorries may be imported with incentives subject to land transportation operation requirements;
(d) Tax credit on domestic capital equipment shall be granted on locally fabricated
capital equipment;
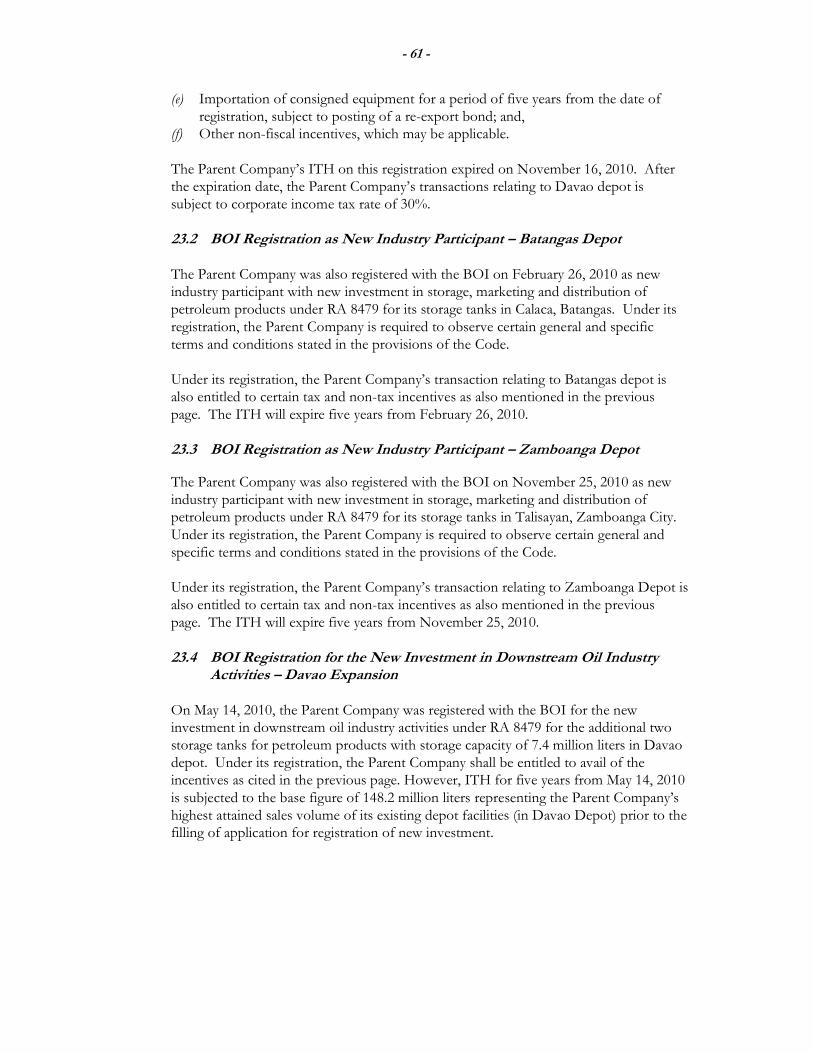
- 61 -
(e) Importation of consigned equipment for a period of five years from the date of registration, subject to posting of a re-export bond; and,
(f) Other non-fiscal incentives, which may be applicable.
The Parent Company’s ITH on this registration expired on November 16, 2010. After the expiration date, the Parent Company’s transactions relating to Davao depot is subject to corporate income tax rate of 30%. 23.2 BOI Registration as New Industry Participant – Batangas Depot
The Parent Company was also registered with the BOI on February 26, 2010 as new industry participant with new investment in storage, marketing and distribution of petroleum products under RA 8479 for its storage tanks in Calaca, Batangas. Under its registration, the Parent Company is required to observe certain general and specific terms and conditions stated in the provisions of the Code. Under its registration, the Parent Company’s transaction relating to Batangas depot is also entitled to certain tax and non-tax incentives as also mentioned in the previous page. The ITH will expire five years from February 26, 2010. 23.3 BOI Registration as New Industry Participant – Zamboanga Depot
The Parent Company was also registered with the BOI on November 25, 2010 as new industry participant with new investment in storage, marketing and distribution of petroleum products under RA 8479 for its storage tanks in Talisayan, Zamboanga City. Under its registration, the Parent Company is required to observe certain general and specific terms and conditions stated in the provisions of the Code. Under its registration, the Parent Company’s transaction relating to Zamboanga Depot is also entitled to certain tax and non-tax incentives as also mentioned in the previous page. The ITH will expire five years from November 25, 2010. 23.4 BOI Registration for the New Investment in Downstream Oil Industry
Activities – Davao Expansion On May 14, 2010, the Parent Company was registered with the BOI for the new investment in downstream oil industry activities under RA 8479 for the additional two storage tanks for petroleum products with storage capacity of 7.4 million liters in Davao depot. Under its registration, the Parent Company shall be entitled to avail of the incentives as cited in the previous page. However, ITH for five years from May 14, 2010 is subjected to the base figure of 148.2 million liters representing the Parent Company’s highest attained sales volume of its existing depot facilities (in Davao Depot) prior to the filling of application for registration of new investment.

- 62 -
23.5 BOI Registration for New Investment – Bacolod Storage Terminal On May 10, 2012, the Parent Company was registered with the BOI as new industry participant with new investment in storage, marketing and distribution and bulk marketing of petroleum products under RA 8479 for its storage terminal in Bacolod City. Under its registration, the Parent Company is required to observe certain general and specific terms and conditions stated in the provisions of the Code. Under its registration, the Parent Company’s transaction relating Bacolod storage terminal is also entitled to certain tax and non-tax incentives as also mentioned in the previous page. The ITH will expire five years from May 10, 2012. 23.6 BOI Registration for New Investment – Cagayan De Oro City Storage
Terminal On May 10, 2012, the Parent Company was registered with the BOI as new industry participant with new investment in storage, marketing and distribution and bulk marketing of petroleum products under RA 8479 for its storage terminal in Bacolod City. Under its registration, the Parent Company is required to observe certain general and specific terms and conditions stated in the provisions of the Code. Under its registration, the Parent Company’s transaction relating Bacolod storage terminal is also entitled to certain tax and non-tax incentives as also mentioned in the previous page. The ITH will expire five years from May 10, 2012.
23.7 BOI Registration for MT Thelma and MT Cherylyn
On November 23, 2011 and December 10, 2008, CSC had registered its activity for MT Thelma and MT Cherylyn, respectively, with the BOI under Executive Order No. 226, otherwise known as the Omnibus Investments Code of 1987 as a new operator of domestic/interisland shipping on a pioneer status. As a registered entity, CSC is entitled to tax and non-tax incentives which include a six-year ITH. For MT Cherylyn, the related tax incentives started in April 2009. Meanwhile, the tax incentive for MT Thelma started in November 2011. ITH incentives shall be limited only to the revenues generated by the registered project.
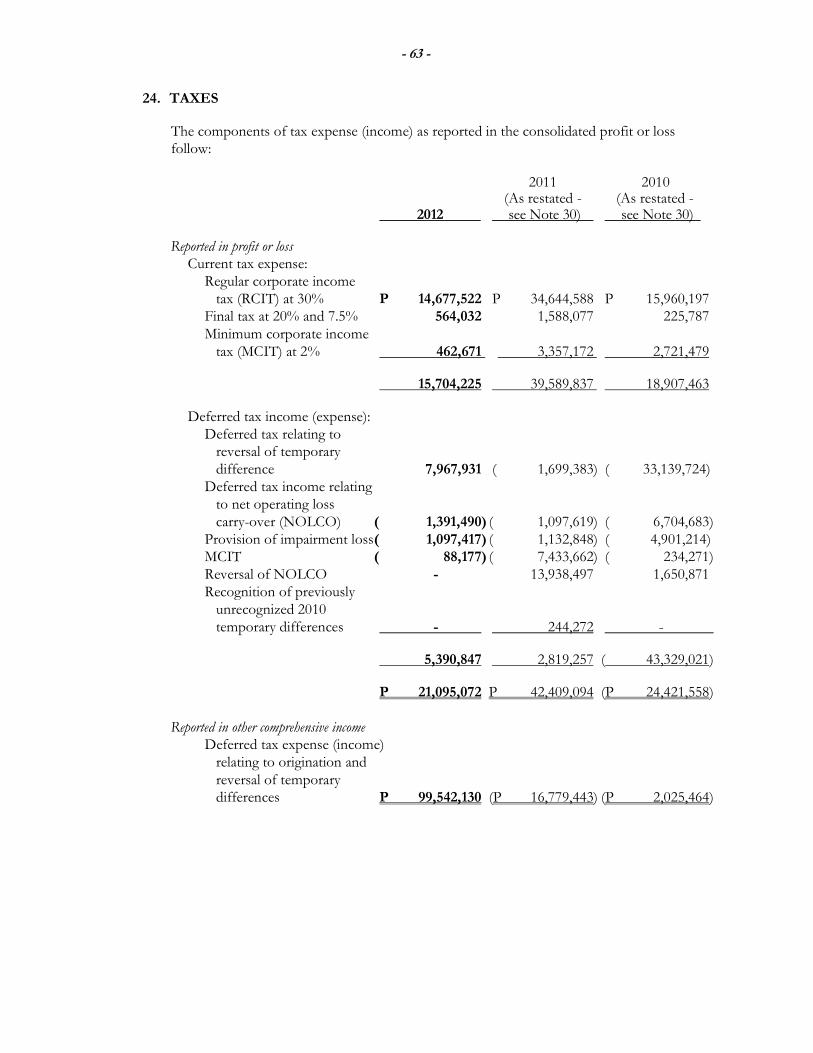
- 63 -
24. TAXES
The components of tax expense (income) as reported in the consolidated profit or loss follow:
2011 2010 (As restated - (As restated - 2012 see Note 30) see Note 30)
Reported in profit or loss
Current tax expense: Regular corporate income tax (RCIT) at 30% P 14,677,522 P 34,644,588 P 15,960,197 Final tax at 20% and 7.5% 564,032 1,588,077 225,787 Minimum corporate income tax (MCIT) at 2% 462,671 3,357,172 2,721,479
15,704,225 39,589,837 18,907,463
Deferred tax income (expense): Deferred tax relating to reversal of temporary difference 7,967,931 ( 1,699,383) ( 33,139,724) Deferred tax income relating to net operating loss carry-over (NOLCO) ( 1,391,490) ( 1,097,619) ( 6,704,683 ) Provision of impairment loss ( 1,097,417) ( 1,132,848) ( 4,901,214) MCIT ( 88,177) ( 7,433,662) ( 234,271 ) Reversal of NOLCO - 13,938,497 1,650,871 Recognition of previously unrecognized 2010 temporary differences - 244,272 -
5,390,847 2,819,257 ( 43,329,021 )
P 21,095,072 P 42,409,094 (P 24,421,558 ) Reported in other comprehensive income
Deferred tax expense (income) relating to origination and reversal of temporary differences P 99,542,130 (P 16,779,443) (P 2,025,464 )
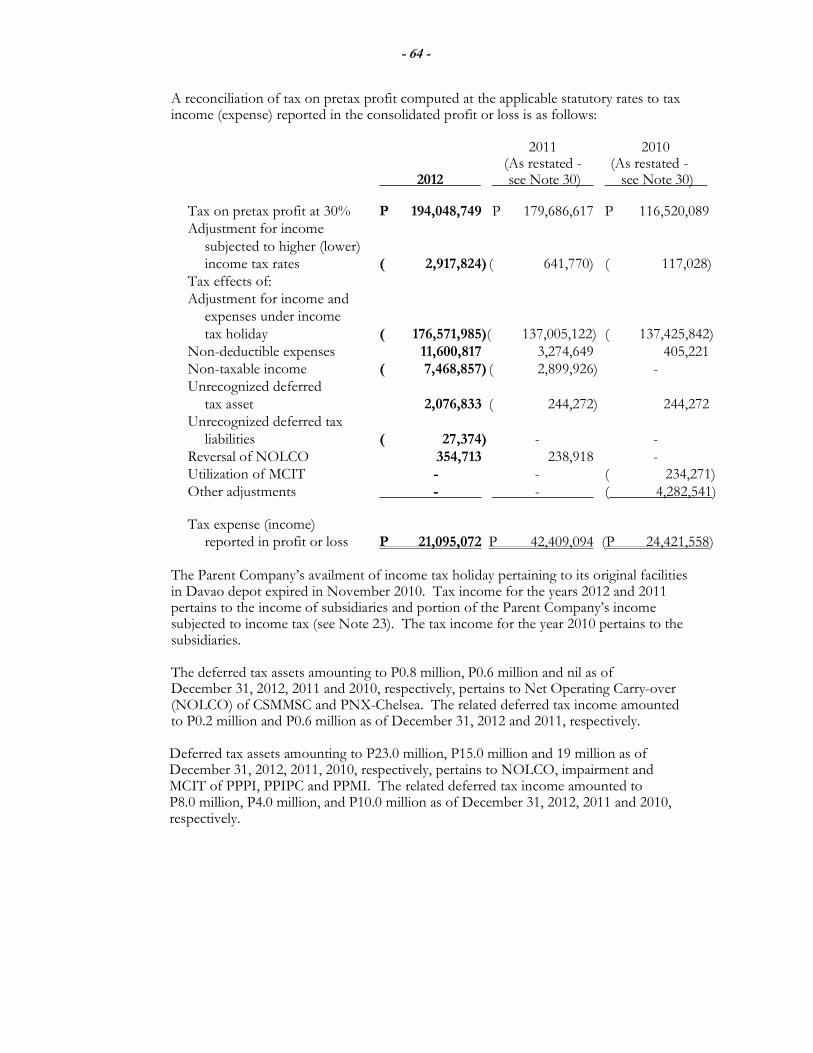
- 64 -
A reconciliation of tax on pretax profit computed at the applicable statutory rates to tax income (expense) reported in the consolidated profit or loss is as follows:
2011 2010 (As restated - (As restated - 2012 see Note 30) see Note 30)
Tax on pretax profit at 30% P 194,048,749 P 179,686,617 P 116,520,089 Adjustment for income subjected to higher (lower) income tax rates ( 2,917,824) ( 641,770) ( 117,028) Tax effects of: Adjustment for income and expenses under income tax holiday ( 176,571,985)( 137,005,122) ( 137,425,842) Non-deductible expenses 11,600,817 3,274,649 405,221 Non-taxable income ( 7,468,857) ( 2,899,926) - Unrecognized deferred tax asset 2,076,833 ( 244,272) 244,272 Unrecognized deferred tax liabilities ( 27,374) - - Reversal of NOLCO 354,713 238,918 - Utilization of MCIT - - ( 234,271) Other adjustments - - ( 4,282,541)
Tax expense (income) reported in profit or loss P 21,095,072 P 42,409,094 (P 24,421,558 )
The Parent Company’s availment of income tax holiday pertaining to its original facilities in Davao depot expired in November 2010. Tax income for the years 2012 and 2011 pertains to the income of subsidiaries and portion of the Parent Company’s income subjected to income tax (see Note 23). The tax income for the year 2010 pertains to the subsidiaries. The deferred tax assets amounting to P0.8 million, P0.6 million and nil as of December 31, 2012, 2011 and 2010, respectively, pertains to Net Operating Carry-over (NOLCO) of CSMMSC and PNX-Chelsea. The related deferred tax income amounted to P0.2 million and P0.6 million as of December 31, 2012 and 2011, respectively. Deferred tax assets amounting to P23.0 million, P15.0 million and 19 million as of December 31, 2012, 2011, 2010, respectively, pertains to NOLCO, impairment and MCIT of PPPI, PPIPC and PPMI. The related deferred tax income amounted to P8.0 million, P4.0 million, and P10.0 million as of December 31, 2012, 2011 and 2010, respectively.
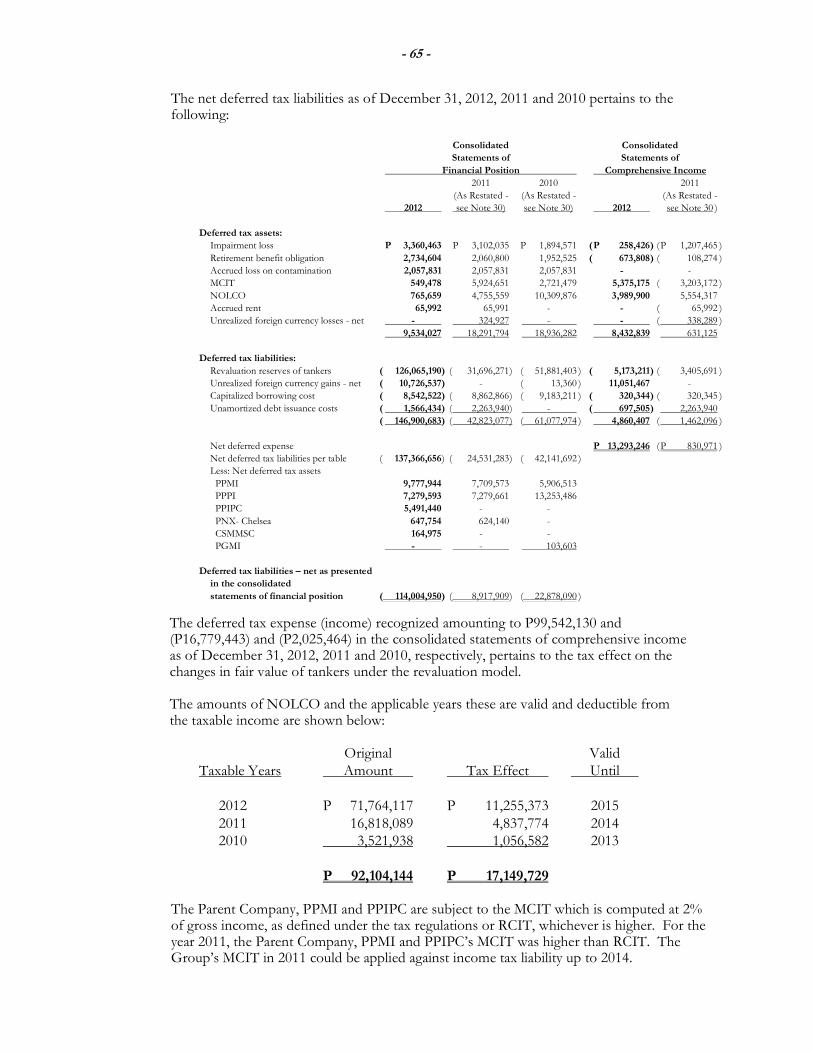
- 65 -
The net deferred tax liabilities as of December 31, 2012, 2011 and 2010 pertains to the following:
Consolidated Consolidated
Statements of Statements of
Financial Position Comprehensive Income
2011 2010 2011
(As Restated - (As Restated - (As Restated -
2012 see Note 30) see Note 30) 2012 see Note 30 )
Deferred tax assets:
Impairment loss P 3,360,463 P 3,102,035 P 1,894,571 ( P 258,426 ) ( P 1,207,465 )
Retirement benefit obligation 2,734,604 2,060,800 1,952,525 ( 673,808 ) ( 108,274 )
Accrued loss on contamination 2,057,831 2,057,831 2,057,831 - -
MCIT 549,478 5,924,651 2,721,479 5,375,175 ( 3,203,172 )
NOLCO 765,659 4,755,559 10,309,876 3,989,900 5,554,317
Accrued rent 65,992 65,991 - - ( 65,992 )
Unrealized foreign currency losses - net - 324,927 - - ( 338,289 )
9,534,027 18,291,794 18,936,282 8,432,839 631,125
Deferred tax liabilities:
Revaluation reserves of tankers ( 126,065,190) ( 31,696,271 ) ( 51,881,403 ) ( 5,173,211 ) ( 3,405,691 )
Unrealized foreign currency gains - net ( 10,726,537) - ( 13,360 ) 11,051,467 -
Capitalized borrowing cost ( 8,542,522) ( 8,862,866 ) ( 9,183,211 ) ( 320,344 ) ( 320,345 )
Unamortized debt issuance costs ( 1,566,434) ( 2,263,940 ) - ( 697,505 ) 2,263,940
( 146,900,683) ( 42,823,077 ) ( 61,077,974 ) 4,860,407 ( 1,462,096 )
Net deferred expense P 13,293,246 ( P 830,971 )
Net deferred tax liabilities per table ( 137,366,656 ) ( 24,531,283 ) ( 42,141,692 )
Less: Net deferred tax assets
PPMI 9,777,944 7,709,573 5,906,513
PPPI 7,279,593 7,279,661 13,253,486
PPIPC 5,491,440 - -
PNX- Chelsea 647,754 624,140 -
CSMMSC 164,975 - -
PGMI - - 103,603
Deferred tax liabilities – net as presented
in the consolidated
statements of financial position ( 114,004,950) ( 8,917,909 ) ( 22,878,090 )
The deferred tax expense (income) recognized amounting to P99,542,130 and (P16,779,443) and (P2,025,464) in the consolidated statements of comprehensive income as of December 31, 2012, 2011 and 2010, respectively, pertains to the tax effect on the changes in fair value of tankers under the revaluation model. The amounts of NOLCO and the applicable years these are valid and deductible from the taxable income are shown below: Original Valid Taxable Years Amount Tax Effect Until
2012 P 71,764,117 P 11,255,373 2015 2011 16,818,089 4,837,774 2014 2010 3,521,938 1,056,582 2013 P 92,104,144 P 17,149,729 The Parent Company, PPMI and PPIPC are subject to the MCIT which is computed at 2% of gross income, as defined under the tax regulations or RCIT, whichever is higher. For the year 2011, the Parent Company, PPMI and PPIPC’s MCIT was higher than RCIT. The Group’s MCIT in 2011 could be applied against income tax liability up to 2014.

- 66 -
In 2012, 2011 and 2010, the Group opted to claim itemized deductions.
25. RELATED PARTY TRANSACTIONS
The Group’s related parties include the ultimate parent company, the parent company, stockholders, the Group’s key management, entities under common control by the ultimate parent company and others as described below and in the succeeding pages. The following are the transactions with related parties: 25.1. Sales of Goods The Group sells products to certain related parties. Goods are purchased and sold on the basis of the price lists in force with non-related parties.
Amount of Outstanding
Transactions Balances
2012 2011 2010 2012 2011 2010
Sales of goods:
Other related parties P 125,553,735 P 128,664,820 P 83,012,517 P 88,444,125 P 43,831,665 P 10,583,916
The outstanding receivables from sales of goods to other related parties are presented as part of Trade Receivables under Trade and Other Receivables account in the statements of financial position (see Note 7). The outstanding balances are unsecured, non-interest bearing and payable on demand. There are no impairment losses on the outstanding balances for all the years presented. 25.2. Purchases of Services The Group purchased services from related parties on the basis of price lists in force with non-related parties.
Amount of Outstanding
Transactions Balances
2012 2011 2010 2012 2011 2010
Purchases of services:
Other related parties P 654,413,710 P 391,133,996 P 359,297,083 P 4,963,791 P 5,560,320 P 4,874,025

- 67 -
The amounts of transactions are presented as part of the Cost of Sales and Services account in the consolidated statements of comprehensive income and the related outstanding payables for services obtained in 2012, 2011 and 2010 are presented as part of Trade Payables under Trade and Other Payables account (in the consolidated statements of financial position (see Note 17). The outstanding balances are unsecured, non-interest bearing and payable on demand.
25.3. Rentals The Group has the following lease agreements with the following related parties: (a) Udenna Corporation – five year lease term of which total rent expense incurred in the years 2012, 2011 and 2010 amounted to P6.6 million, P6.3 million and P7.3 million, respectively. There is no outstanding payable as of all the years presented.
(b) Udenna Development (UDEVCO) Corporation – five year lease term of which total rent expense in 2012 amounted to P26.4 million and nil in both 2011 and 2010. Rental deposit for the lease amounted to P7.4 million and is presented as Refundable Rent Deposits under Other Non-current Assets in the 2012 consolidated statement of financial position (see Note 14).
(c) Value Leases, Inc. – three year lease term of which total rent expense in 2012, 2011 and 2010 amounted to P20.0 million, P0.4 million and nil, respectively. Refundable Rent Deposits amounted to P0.1 million both in 2012 and 2011, and is presented as part of Other Non-current Assets in the consolidated financial statements (see Note 14).
The rent expenses aforementioned are presented as part of selling and administrative expenses in the consolidated statement of comprehensive income (see Notes 20 and 29.3). 25.4. Due from and Due to Related Parties
The Group grants and obtains unsecured advances to and from PPHI and other unconsolidated related companies for working capital purposes. As of December 31, 2012, 2011 and 2010, the outstanding receivable and payable balances from these advances are shown as Due From Related Parties and Due to Related Parties, respectively, in the consolidated statements of financial position. Due From Related Parties and Due to Related Parties - current are either receivable in cash or paid through offsetting, unsecured noninterest-bearing liabilities and are expected to be paid within one year; hence, their carrying values are considered to be a reasonable approximation of their fair values. Non-current Due to Related Parties, on the other hand, are unsecured non-interest bearing liabilities. These are stated at their carrying value since the date of repayment is not currently determinable.
The details of the outstanding due from related parties as of December 31 are as presented in the next page.

- 68 -
2011 2010 (As restated - (As restated - 2012 see Note 30) see Note 30)
PPHI P - P 9,685,087 P 14,750,495
Related parties under common control Udenna Environmental Services, Inc. 8,300,000 257,300 1,433,923 UMRC - 16,045,809 - Udenna Energy Corporation 121,271 - VLI - 22,219 - One Subic Power Generation
Corp. - - 29,999 8,300,000 26,311,686 16,214,417
Individual stockholder - - 3,794,697
P 8,300,000 P 26,311,686 P 20,009,114
No impairment loss is recognized in 2012, 2011 and 2010 related to advances to related parties. The movement of due from related parties as of December 31 is as follows:
2011 2010 (As restated - (As restated - 2012 see Note 30) see Note 30) Balance at beginning of year P 26,311,686 P 20,009,114 P 73,739,558 Additions 9,467,416 45,743,477 1,765,635 Collections ( 27,479,102 ) ( 39,440,905 ) ( 55,496,079 )
Balance at end of year P 8,300,000 P 26,311,686 P 20,009,114
The breakdown of the Due to Related Parties as of December 31 is as follows: 2011 2010
(As restated - (As restated - 2012 see Note 30) see Note 30) Current: PPHI P - P - P 53,106,188 Related parties under common control UMRC 83,551,745 19,932,827 - Global Synergy Trade and Distibution Corp. 2,000,000 - - VLI - - 792,499 85,551,745 19,932,827 53,898,867 Individual stockholder - 17,145,077 - Total Current P 85,551,745 P 37,077,904 P 53,898,687

- 69 -
2011 2010 (As restated - (As restated -
2012 see Note 30) see Note 30) Non-Current: Related party under common control UMRC P - P - P 78,430,491 Individual stockholder - 24,102,695 12,736,530 Total Non-Current P - P 24,102,695 P 91,167,021
The movement of due to related parties in 2012, 2011 and 2010 follows:
2011 2010 (As restated - (As restated - 2012 see Note 30) see Note 30) Balance at beginning of year P 61,180,599 P 145,065,708 P 3,463,173 Additions 177,435,185 57,164,052 187,392,939 Payments ( 153,064,039 ) ( 141,049,161 ) ( 45,790,404 )
Balance at end of year P 85,551,745 P 61,180,599 P 145,065,708
25.5. Loan Collateral (a) Surety and a negative pledge over the remaining shares of a stockholder secured the
liabilities under letters of credits and trust receipts (see Note 16.1). (b) The TLA with DBP, OLSA with BDO and PBComm, loan agreement with RBC
and certain banks loans of the Group were guaranteed by certain stockholders through a surety agreement with the respective banks. The vessels owned by the Group were also used as security on particular loans.
25.6. Key Management Compensations
The compensations of key management personnel are broken down as follows: 2012 2011 2010 Salaries and wages P 36,822,265 P 31,121,478 P 25,137,801 Honoraria and allowances 4,416,398 3,000,011 1,997,058 13th month pay and bonuses 4,129,412 3,625,681 3,303,149 Post-employment benefits 242,700 207,850 281,665 P 45,610,775 P 37,955,020 P 30,719,673

- 70 -
25.7. Others
The Group has made donations amounting to P1.5 million, P0.5 million and P0.6 million in 2012, 2011 and 2010, respectively, to Udenna Foundation, Inc., a non-stock, non-profit organization established by the ultimate parent company. In addition, the Group has made donations amounting to P3.8 million, P4.6 million and P1.7 million in 2012, 2011 and 2010, respectively, to PhoenixPhilippines Foundation, Inc., a non-stock non-profit organization established by the Parent Company. These are all presented as part of Other Expense under the Other Operating Expenses in the consolidated statements of comprehensive income.
26. EQUITY
26.1 Capital Stock Capital stock consists of: Shares Amount
2012 2011 2010 2012 2011 2010
Preferred – cumulative,
nonvoting,
non-participating,
non-convertible into
common shares -
P1 par value
Authorized: 50,000,000 50,000,000 50,000,000 P 50,000,000 P 50,000,000 P 50,000,000
Issued and outstanding 5,000,000 5,000,000 5,000,000 P 5,000,000 P 5,000,000 P 5,000,000
Common shares – P1 par value
Authorized:
Balance at beginning of year 750,000,000 750,000,000 400,000,000 P 750,000,000 P 750,000,000 P400,000,000
Increase in authorized stock 1,750,000,000 - 350,000,000 1,750,000,000 - 350,000,000
Balance at end of year 2,500,000,000 750,000,000 750,000,000 P 2,500,000,000 P 750,000,000 P750,000,000
Issued:
Balance at beginning of year 661,123,014 548,075,739 440,411,671 P 661,123,014 P 548,075,739 P440,411,671
Stock dividends 244,936,202 113,043,634 107,664,065 244,936,202 113,043,634 107,664,065
Reclassification 200 3,641 - 200 3,641 -
Balance at end of year 906,059,416 661,123,014 548,075,739 P 906,059,416 P 661,123,014 P548,075,739
P 911,059,416 P 666,123,014 P553,075,739

- 71 -
On April 23, 2012, the SEC approved the Parent Company’s increase in authorized capital stock from P800.0 million divided into 750.0 million common shares with a par value of P1 and 50.0 million preferred shares with par value of P1 per share into P2,550.0 million divided into 2,500.0 common shares with par value of P1 per share and 50.0 million preferred shares with par value of P1 per share. On September 7, 2010, the SEC approved the Parent Company’s increased in authorized capital stock from P400.0 million divided into 400.0 million common shares with a par value of P1 per share to P800.0 million divided into 750.0 million common shares with par value of P1 per share and 50.0 million preferred shares with par value of P1 per share. The preferred shares shall have the following features:
(a) Non-convertible into common shares;
(b) Non participating in any other corporation activities or other further dividends, non-voting except in cases specified by law;
(c) No pre-emptive rights over the holders of common shares as to distribution of net
assets in the event of dissolution or liquidation and in the payment of dividends at a specified rate. The Board of Directors shall determine its issued value at the time of issuance and shall determine its dividend rates and the dividends shall be paid cumulatively; and,
(d) The preferred shares shall be redeemable at the Parent Company’s option under such terms as the Board of Directors may provide at the time of issuance. It shall also be re-issuable when fully redeemed.
Moreover, preferred shares have the following features among others as provided in the subscription agreement; (a) Dividends on the Preferred Shares shall have a fixed rate of 11.50% per annum
calculated in respect of each share with reference to the Issue Price thereof in respect to each dividend period.
(b) Dividends shall be payable every September 21, December 21, March 21 and June 21 of each year (each a “Dividend Payment Date”). The dividends on the Preferred Shares shall be calculated on a 30/360 day basis and shall be paid quarterly in arrears on the last day of each 3-month dividend period (each a Dividend Payment Date), as and if declared by the Board of Directors. If the Dividend Payment Date is not a banking day, dividends shall be paid on the next succeeding banking day, without adjustment as to the amounts of dividends to be paid.
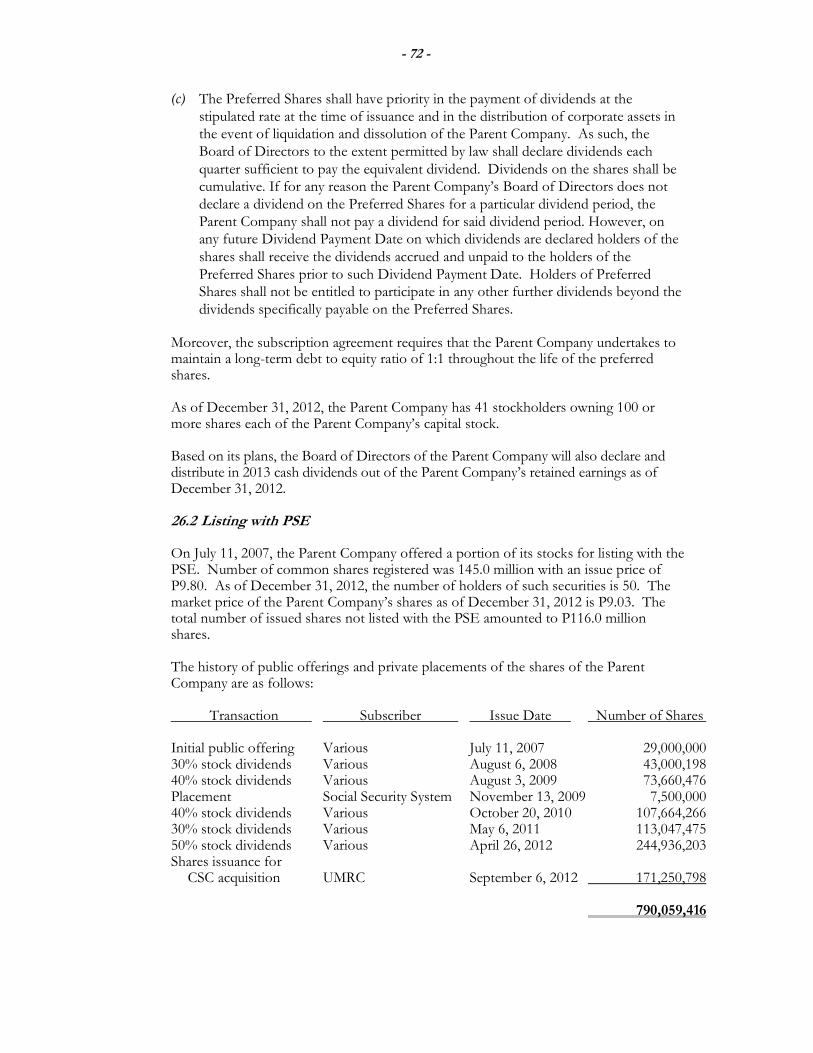
- 72 -
(c) The Preferred Shares shall have priority in the payment of dividends at the stipulated rate at the time of issuance and in the distribution of corporate assets in the event of liquidation and dissolution of the Parent Company. As such, the Board of Directors to the extent permitted by law shall declare dividends each quarter sufficient to pay the equivalent dividend. Dividends on the shares shall be cumulative. If for any reason the Parent Company’s Board of Directors does not declare a dividend on the Preferred Shares for a particular dividend period, the Parent Company shall not pay a dividend for said dividend period. However, on any future Dividend Payment Date on which dividends are declared holders of the shares shall receive the dividends accrued and unpaid to the holders of the Preferred Shares prior to such Dividend Payment Date. Holders of Preferred Shares shall not be entitled to participate in any other further dividends beyond the dividends specifically payable on the Preferred Shares.
Moreover, the subscription agreement requires that the Parent Company undertakes to maintain a long-term debt to equity ratio of 1:1 throughout the life of the preferred shares.
As of December 31, 2012, the Parent Company has 41 stockholders owning 100 or more shares each of the Parent Company’s capital stock. Based on its plans, the Board of Directors of the Parent Company will also declare and distribute in 2013 cash dividends out of the Parent Company’s retained earnings as of December 31, 2012. 26.2 Listing with PSE On July 11, 2007, the Parent Company offered a portion of its stocks for listing with the PSE. Number of common shares registered was 145.0 million with an issue price of P9.80. As of December 31, 2012, the number of holders of such securities is 50. The market price of the Parent Company’s shares as of December 31, 2012 is P9.03. The total number of issued shares not listed with the PSE amounted to P116.0 million shares. The history of public offerings and private placements of the shares of the Parent Company are as follows: Transaction Subscriber Issue Date Number of Shares Initial public offering Various July 11, 2007 29,000,000 30% stock dividends Various August 6, 2008 43,000,198 40% stock dividends Various August 3, 2009 73,660,476 Placement Social Security System November 13, 2009 7,500,000 40% stock dividends Various October 20, 2010 107,664,266 30% stock dividends Various May 6, 2011 113,047,475 50% stock dividends Various April 26, 2012 244,936,203 Shares issuance for CSC acquisition UMRC September 6, 2012 171,250,798 790,059,416
- 73 -
26.3 Additional Paid-in Capital
In 2012, the Parent Company issued 171,250.8 million shares in favor of UMRC in relation to the share-for-share swap acquisition of CSC. The excess of par value of such issuance amounted to P1,248.9 million was recorded as part of Additional Paid-in Capital account (see Note 30). In 2010, the Parent Company issued 5.0 million of its preferred shares at P100 per share. The excess of par value for such subscription amounting to P495.0 million was recorded as part of Additional Paid-in Capital account in the consolidated statements of financial position. In addition, the excess of the selling price over the acquisition cost of the treasury shares sold in 2010 also constitutes the Additional Paid-in Capital account.
In 2009, the Social Security System (SSS) has bought an initial 2.83% stake in the Parent Company representing 7.5 million subscribed common shares for P42.0 million or at P5.60 per share. The excess of par value for such subscription amounting to P34.5 million was recorded under Additional Paid-in Capital account in the consolidated statements of financial position. In 2007, the Parent Company listed its shares of stock with PSE. Premiums received in excess of the par value during the public offering amounting to P227.1 million were recorded under Additional Paid-in Capital account in the consolidated statements of financial position.
26.4 Deposits on Future Stock Subscriptions In 2009, the Parent Company received subscriptions amounting to P44.6 million. Pending the Parent Company and investor agreement as to the number of shares to be issued, the amount received was presented as Deposits on Future Stock Subscriptions in the consolidated statements of financial position. In 2010, the investor withdrew the investment.
26.5 Other Reserves In 2012, the Parent Company issued 171,250.8 million common shares plus cash of P157.8 million in exchange of the net assets of CSC. The acquisition of CSC is accounted for under business combination using pooling-of-interest method wherein the difference between the consideration given up over the carrying value of the net assets of CSC is recognized as Other Reserves (see Note 30). 26.6 Treasury Shares – At Cost
Treasury shares of P17.3 million were re-issued during 2010. There are no treasury shares as at end of December 31, 2012, 2011 and 2010.
26.7 Retained Earnings
On March 8, 2012, the stockholders ratified the BOD’s approval of 50% stock dividends (or a total of 244.9 million shares), valued at par and distributed on April 26, 2012 to stockholders of record as of March 28, 2012. In addition, cash dividends of 10 centavos per common shares totaling to P49.0 million were also declared and paid in 2012.
- 74 -
On March 11, 2011, the stockholders ratified the BOD’s approval of 30% stock dividends (or a total of 113.0 million shares), valued at par and distributed on May 6, 2011 to stockholders of record as of April 8, 2011. In addition, cash dividends of 10 centavos per common share totaling to P37.7 million were also declared and paid in 2011. On March 21, 2011, June 21, 2011, September 21, 2011 and December 1, 2011, the BOD declared and approved the payment of cash dividend to preferred shareholders totaling to P70.7 million. On June 15, 2010, the stockholders ratified the Board of Directors’ approval of a 40% stock dividends (or a total of 107.7 million shares), valued at par and distributed on October 21, 2010 to all stockholders of record as of September 24, 2010. In addition, cash dividends of five centavos per share totaling to P13.7 million were also declared and paid in 2010.
26.8 Capital Management Objectives, Policies and Procedures The Group’s capital management objectives are:
• To ensure the Group’s ability to continue as a going concern; and,
• To provide an adequate return to shareholders by pricing products and services commensurately with the level of risk.
The Group monitors capital on the basis of the carrying amount of equity as presented on the face of the consolidated statements of financial position. Capital for the reporting periods under review is summarized as follows:
2012 2011 2010 Total liabilities P 12,006,738,969 P 9,247,693,444 P 6,197,395,642 Total equity 4,500,451,311 3,710,962,950 3,078,611,648 Debt-to-equity ratio 2.67 2.49 2.01
The increase of the total liabilities in 2011 is the result of the additional borrowings for the procurement of petroleum and construction of depot facilities and retail stations. The increase in equity is due to the accumulated earnings. The Group’s goal in capital management is to maintain a debt-to-equity structure ratio of 2.7 to 1. The Group sets the amount of capital in proportion to its overall financing structure, i.e., equity and financial liabilities. The Group manages the capital structure and makes adjustments to it in the light of changes in economic conditions and the risk characteristics of the underlying assets. In order to maintain or adjust the capital structure, the Group may adjust the amount of dividends paid to shareholders, issue new shares or sell assets to reduce debt.
- 75 -
27. EARNINGS PER SHARE (EPS)
EPS were computed as follows:
2011 2010 (As restated - (As restated - 2012 see Note 30) see Note 30) a) Net profit pertaining to common shares P 568,234,093 P 499,046,297 P 398,446,855 b) Net profit attributable to common shares and potential common shares 568,234,093 499,046,297 398,446,855 c) Weighted average number of outstanding common shares 906,003,256 906,002,195 904,576,191 d) Weighted average number of outstanding common and potential common shares 906,003,256 906,002,195 904,576,191 Basic EPS (a/c) P 0.63 P 0.55 P 0.44 Diluted EPS (b/d) P 0.63 P 0.55 P 0.44
The options and warrants attached on the convertible notes do not have dilutive effect since the average market price of the common shares of the Parent Company during the year does not exceed the exercise price of the options or warrants (see Note 16.2e). The 2011 and 2010 basic and diluted EPS were restated to account for the issuance of the shares in relation with the acquisition of CSC and the stock dividends declared which is considered as a bonus issue under PAS 33, Earnings per Share. PAS 33 requires to treat stock dividends issued as if it occurred at the beginning of 2010, the earliest period presented for EPS computation.
28. SEGMENT REPORTING
28.1 Business Segments
In identifying its operating segments, management generally follows the Group’s service lines, which represent the main products and services provided by the Group, namely fuels, lubricants, depot services and real estate. These are also the bases of the Group in reporting its primary segment information.
(a) Trading segment is engaged in marketing, merchandising, purchasing, selling, dealing,
acquiring, disposing and distribution of goods and wares such as but not limited to petroleum products (on wholesale basis), adhesives, glues, bonding agents, epoxy resins, lubricants and other products.
(b) Management, investment and technical services (MITS) segment is involved in
providing management, investment and technical advice for commercial, industrial, manufacturing and other kinds of enterprises.
- 76 -
(c) Shipping and cargo services segment is engaged in hauling of petroleum products, operation of inter-island going vessels for domestic trade, chartering in and out any such vessels and providing complete marine services, either as principal or agent to ship owners, operators and managers.
(d) Real estate segment is involved in real estate development, management and
operations.
(e) Depot and logistics services segment is engaged in operating of oil depots, storage facilities and provides logistics services to various entities.
28.2 Segment Assets and Liabilities
Segment assets include all operating assets used by a segment and consist principally of operating cash, receivables, inventories and property and equipment, and other assets, net of allowances and provisions. Segment liabilities include all operating liabilities and consist principally of accounts payable, trust receipts, wages, and accrued liabilities. Segment assets and liabilities do not include deferred tax assets or liabilities.
28.3 Intersegment Transactions Segment revenues, expenses and performance include sales and purchases between segments and between geographical segments. Such sales and purchases are eliminated upon consolidation. The tables presented in the next pages present revenue and profit information regarding business segments of the Group for the years ended December 31, 2012, 2011 and 2010 and certain asset and liability information regarding industry segments at December 31, 2012, 2011 and 2010 (in thousands).
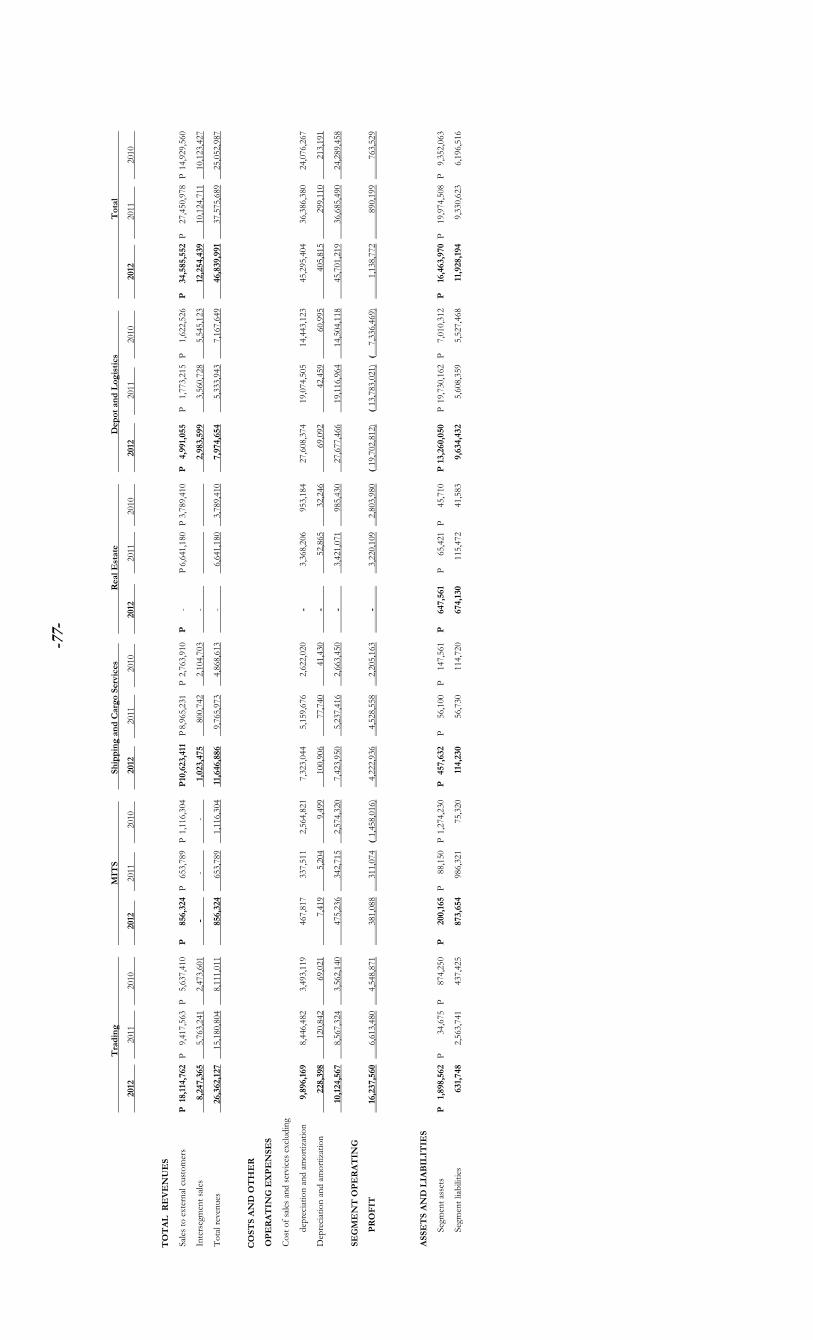
-77-
T
radin
g
MIT
S
Ship
pin
g a
nd C
arg
o S
ervi
ces
Rea
l E
state
D
epot and L
ogis
tics
Tota
l
2012
2011
2010
20
12
2011 2010
20
12 2011 2010
20
12
2011 2010
20
12
2011 2010
20
12
2011
2010
T
OT
AL
R
EV
EN
UE
S
Sales to external customers
P 18
,114
,762 P 9,417,563 P 5,637,410
P
856,
324 P 653,789 P 1,116,304
P10
,623,
411 P 8,965,231 P 2,763,910
P
- P 6,641,180 P 3,789,410
P
4,99
1,05
5 P 1,773,215 P 1,622,526
P
34,5
85,5
52 P 27,450,978
P 14,929,560
Intersegment sales
8,24
7,36
5 5,763,241 2,473,601
-
-
-
1,02
3,4
75 800,742 2,104,703
-
2,98
3,59
9 3,560,728
5,545,123
12,2
54,
439
10,124,711
10,123,427
Total revenues
26,3
62,1
27 15,180,804 8,111,011
85
6,32
4 653,789 1,116,304
11,
646,8
86 9,765,973 4,868,613
-
6,641,180 3,789,410
7,97
4,65
4 5,333,943
7,167,649
46,8
39,9
91 37,575,689 25,052,987
C
OST
S A
ND
OT
HE
R
O
PE
RA
TIN
G E
XP
EN
SE
S
Cost of sales and services excluding
depreciation and amortization
9,89
6,16
9
8,446,482 3,493,119
467,817 337,511 2,564,821 7,323,044 5,159,676 2,622,020
-
3,368,206 953,184 27,608,374 19,074,505 14,443,123
45,295,404 36,386,380 24,076,267
Depreciation and amortization
22
8,39
8
120,842
69,021
7,419
5,204
9,499 100,906
77,740
41,430
-
52,865
32,246
69,092
42,459
60,995
405,815
299,110
213,191
10
,124
,567 8,567,324 3,562,140
475,236 342,715 2,574,320 7,423,950 5,237,416 2,663,450
-
3,421,071 985,430 27,677,466 19,116,964 14,504,118
45,701,219 36,685,490 24,289,458
SE
GM
EN
T O
PE
RA
TIN
G
PR
OFIT
16
,237,
560
6,613,480
4,548,871
381,088 311,074
( 1,458,016) 4,222,936
4,528,558
2,205,163
- 3,220,109
2,803,980
( 19,702,812)
( 13,783,021)
( 7,336,469)
1,138,772
890,199
763,529
A
SSE
TS A
ND
LIA
BIL
ITIE
S
Segment assets
P
1,89
8,5
62 P
34,675 P 874,250
P
200,
165 P 88,150 P 1,274,230
P
457,
632 P 56,100 P 147,561
P
647,
561
P 65,421 P 45,710
P 1
3,26
0,050
P 19,730,162 P 7,010,312
P
16,4
63,
970
P 19,974,508 P 9,352,063
Segment liabilities
631,
748
2,563,741
437,425
873,
654
986,321
75,320
114,
230
56,730 114,720
67
4,13
0 115,472
41,583
9,
634,
432
5,608,359
5,527,468
11,9
28,1
94
9,330,623 6,196,516

-78-
28.5 Reconciliations Presented below is a reconciliation of the Group’s segment information to the key financial information presented in its financial statements (in thousands).
2012 2011 2010 Revenues Total segment revenues P 46,839,991 P 37,575,689 P 25,052,987 Elimination of intersegment revenues ( 12,254,439) ( 10,124,711) ( 10,123,427) Revenues as reported in profit or loss P 34,585,552 P 27,450,978 P 14,929,560
Profit or loss Segment operating profit P 1,138,772 P 878,330 P 798,086 Other unallocated income 5,863 56,918 981 Other unallocated expense ( 4,214 ) ( 8,520) ( 36,609 ) Operating profit as reported in profit or loss 1,140,421 926,728 762,458 Finance costs ( 518,221 ) ( 346,537 ) ( 398,540 ) Finance income 24,629 21,928 24,482 Profit before tax as reported in profit or loss P 646,829 P 602,119 P 388,400 Assets Segment assets P 16,463,970 P 19,974,508 P 9,352,063 Other unallocated assets 88,925 52,130 32,660 Elimination of intercompany accounts ( 45,705 ) ( 67,982 ) ( 108,716) Total assets reported in statements of consolidated financial position P 16,507,190 P 19,958,656 P 9,276,007
Liabilities Segment liabilities P 11,928,194 P 9,330,623 P 6,196,516 Deferred tax liabilities - net 114,005 8,918 22,878 Elimination of intercompany accounts ( 40,800 ) ( 96,708 ) ( 25,228) Other unallocated liabilities 5,340 4,860 3,230 Total liabilities as reported in consolidated statements of financial position P 12,006,739 P 9,247,693 P 6,197,396
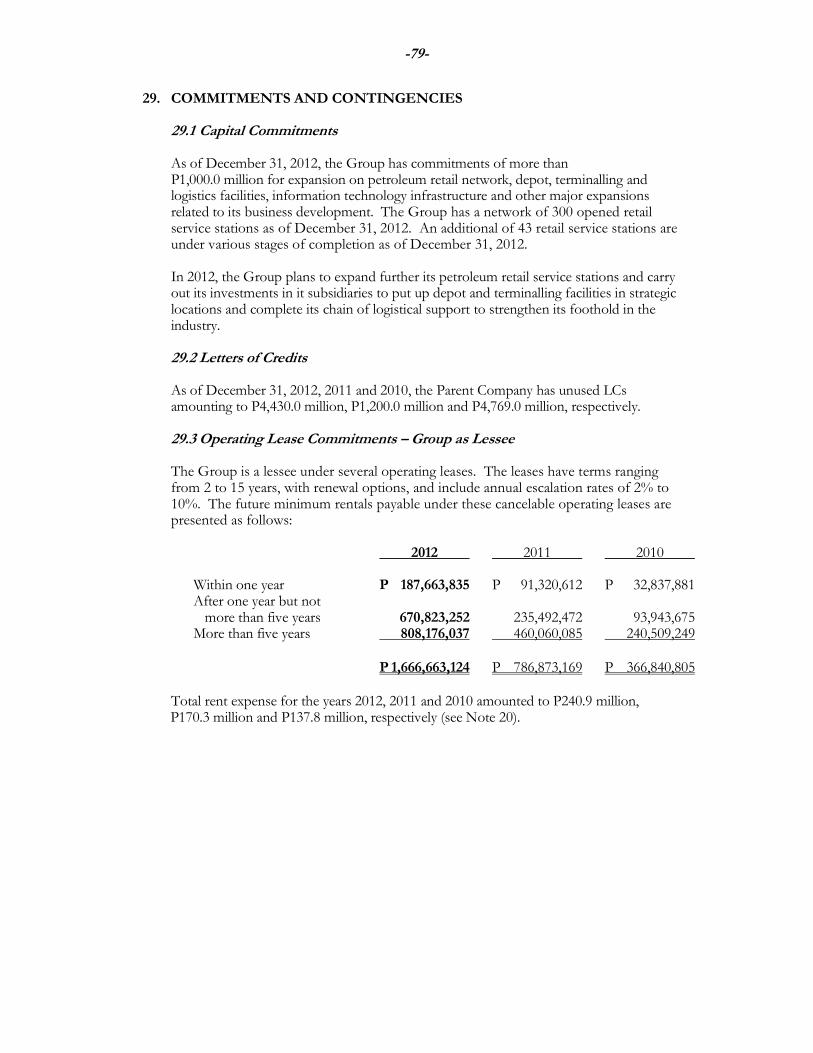
-79-
29. COMMITMENTS AND CONTINGENCIES 29.1 Capital Commitments As of December 31, 2012, the Group has commitments of more than P1,000.0 million for expansion on petroleum retail network, depot, terminalling and logistics facilities, information technology infrastructure and other major expansions related to its business development. The Group has a network of 300 opened retail service stations as of December 31, 2012. An additional of 43 retail service stations are under various stages of completion as of December 31, 2012. In 2012, the Group plans to expand further its petroleum retail service stations and carry out its investments in it subsidiaries to put up depot and terminalling facilities in strategic locations and complete its chain of logistical support to strengthen its foothold in the industry.
29.2 Letters of Credits As of December 31, 2012, 2011 and 2010, the Parent Company has unused LCs amounting to P4,430.0 million, P1,200.0 million and P4,769.0 million, respectively. 29.3 Operating Lease Commitments – Group as Lessee The Group is a lessee under several operating leases. The leases have terms ranging from 2 to 15 years, with renewal options, and include annual escalation rates of 2% to 10%. The future minimum rentals payable under these cancelable operating leases are presented as follows:
2012 2011 2010
Within one year P 187,663,835 P 91,320,612 P 32,837,881 After one year but not more than five years 670,823,252 235,492,472 93,943,675 More than five years 808,176,037 460,060,085 240,509,249 P 1,666,663,124 P 786,873,169 P 366,840,805
Total rent expense for the years 2012, 2011 and 2010 amounted to P240.9 million, P170.3 million and P137.8 million, respectively (see Note 20).
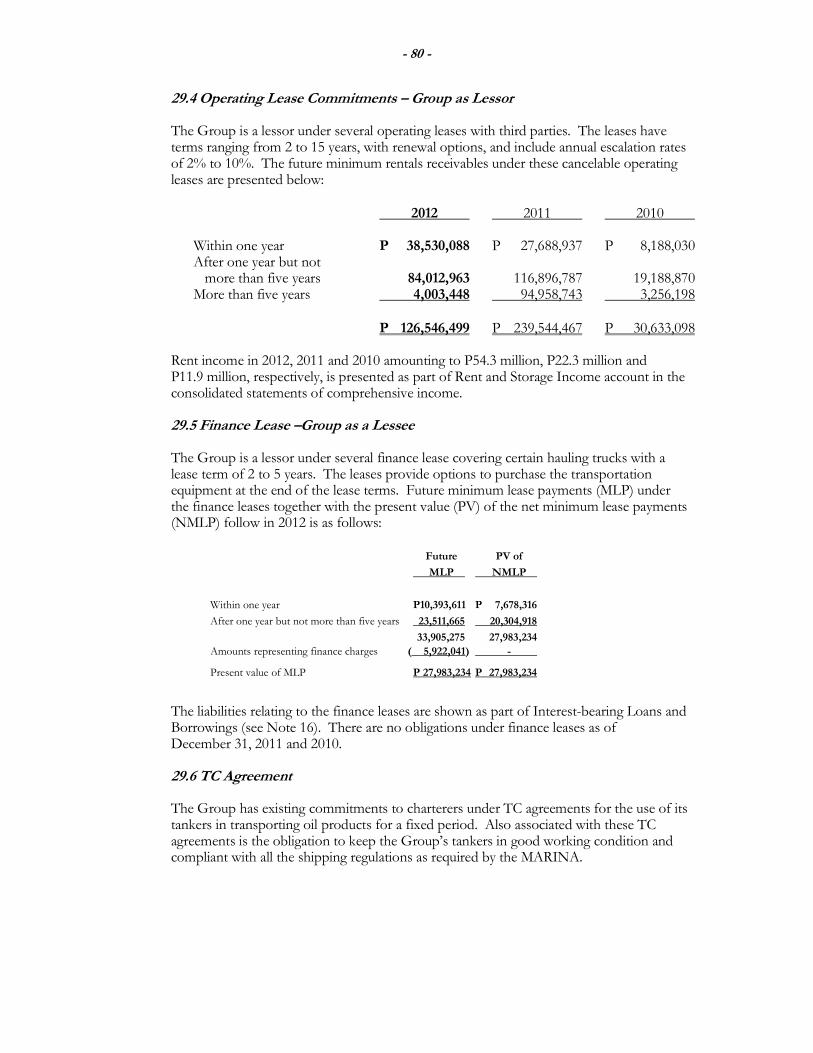
- 80 -
29.4 Operating Lease Commitments – Group as Lessor The Group is a lessor under several operating leases with third parties. The leases have terms ranging from 2 to 15 years, with renewal options, and include annual escalation rates of 2% to 10%. The future minimum rentals receivables under these cancelable operating leases are presented below:
2012 2011 2010
Within one year P 38,530,088 P 27,688,937 P 8,188,030 After one year but not more than five years 84,012,963 116,896,787 19,188,870 More than five years 4,003,448 94,958,743 3,256,198 P 126,546,499 P 239,544,467 P 30,633,098
Rent income in 2012, 2011 and 2010 amounting to P54.3 million, P22.3 million and P11.9 million, respectively, is presented as part of Rent and Storage Income account in the consolidated statements of comprehensive income. 29.5 Finance Lease –Group as a Lessee The Group is a lessor under several finance lease covering certain hauling trucks with a lease term of 2 to 5 years. The leases provide options to purchase the transportation equipment at the end of the lease terms. Future minimum lease payments (MLP) under the finance leases together with the present value (PV) of the net minimum lease payments (NMLP) follow in 2012 is as follows:
Future PV of
MLP NMLP
Within one year P10,393,611 P 7,678,316
After one year but not more than five years 23,511,665 20,304,918
33,905,275 27,983,234
Amounts representing finance charges ( 5,922,041) -
Present value of MLP P 27,983,234 P 27,983,234
The liabilities relating to the finance leases are shown as part of Interest-bearing Loans and Borrowings (see Note 16). There are no obligations under finance leases as of December 31, 2011 and 2010.
29.6 TC Agreement The Group has existing commitments to charterers under TC agreements for the use of its tankers in transporting oil products for a fixed period. Also associated with these TC agreements is the obligation to keep the Group’s tankers in good working condition and compliant with all the shipping regulations as required by the MARINA.
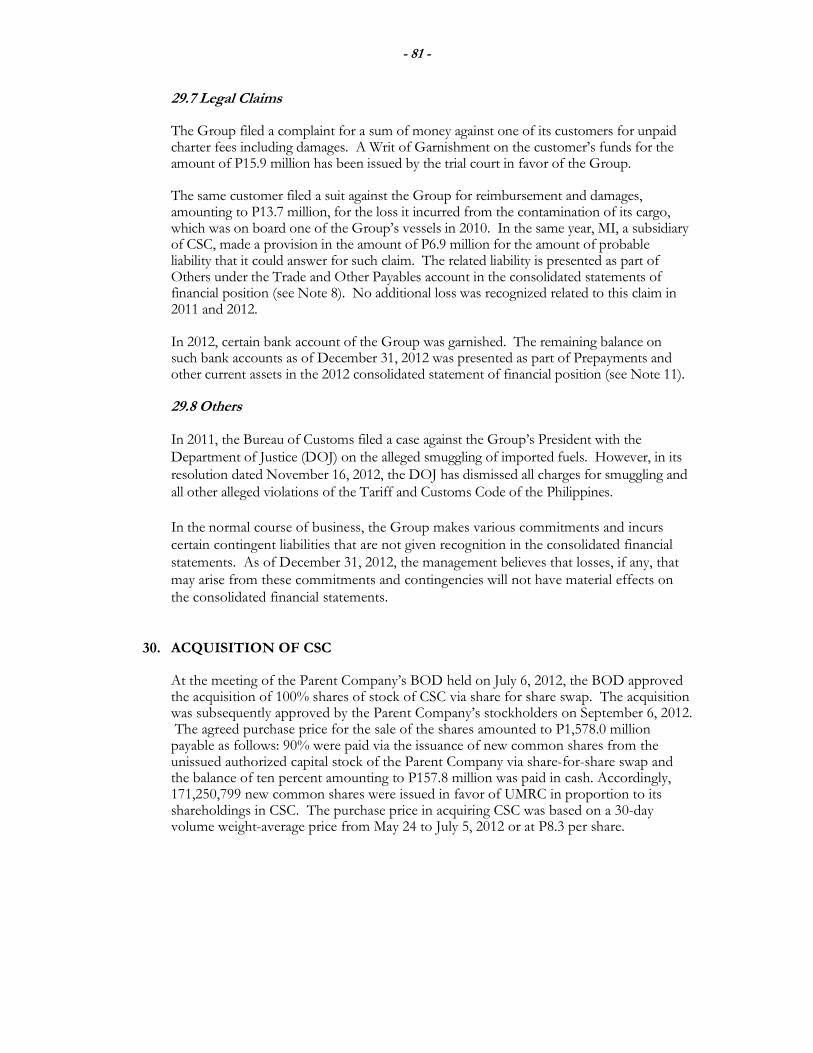
- 81 -
29.7 Legal Claims The Group filed a complaint for a sum of money against one of its customers for unpaid charter fees including damages. A Writ of Garnishment on the customer’s funds for the amount of P15.9 million has been issued by the trial court in favor of the Group. The same customer filed a suit against the Group for reimbursement and damages, amounting to P13.7 million, for the loss it incurred from the contamination of its cargo, which was on board one of the Group’s vessels in 2010. In the same year, MI, a subsidiary of CSC, made a provision in the amount of P6.9 million for the amount of probable liability that it could answer for such claim. The related liability is presented as part of Others under the Trade and Other Payables account in the consolidated statements of financial position (see Note 8). No additional loss was recognized related to this claim in 2011 and 2012. In 2012, certain bank account of the Group was garnished. The remaining balance on such bank accounts as of December 31, 2012 was presented as part of Prepayments and other current assets in the 2012 consolidated statement of financial position (see Note 11).
29.8 Others
In 2011, the Bureau of Customs filed a case against the Group’s President with the Department of Justice (DOJ) on the alleged smuggling of imported fuels. However, in its resolution dated November 16, 2012, the DOJ has dismissed all charges for smuggling and all other alleged violations of the Tariff and Customs Code of the Philippines. In the normal course of business, the Group makes various commitments and incurs certain contingent liabilities that are not given recognition in the consolidated financial statements. As of December 31, 2012, the management believes that losses, if any, that may arise from these commitments and contingencies will not have material effects on the consolidated financial statements.
30. ACQUISITION OF CSC At the meeting of the Parent Company’s BOD held on July 6, 2012, the BOD approved the acquisition of 100% shares of stock of CSC via share for share swap. The acquisition was subsequently approved by the Parent Company’s stockholders on September 6, 2012. The agreed purchase price for the sale of the shares amounted to P1,578.0 million payable as follows: 90% were paid via the issuance of new common shares from the unissued authorized capital stock of the Parent Company via share-for-share swap and the balance of ten percent amounting to P157.8 million was paid in cash. Accordingly, 171,250,799 new common shares were issued in favor of UMRC in proportion to its shareholdings in CSC. The purchase price in acquiring CSC was based on a 30-day volume weight-average price from May 24 to July 5, 2012 or at P8.3 per share.
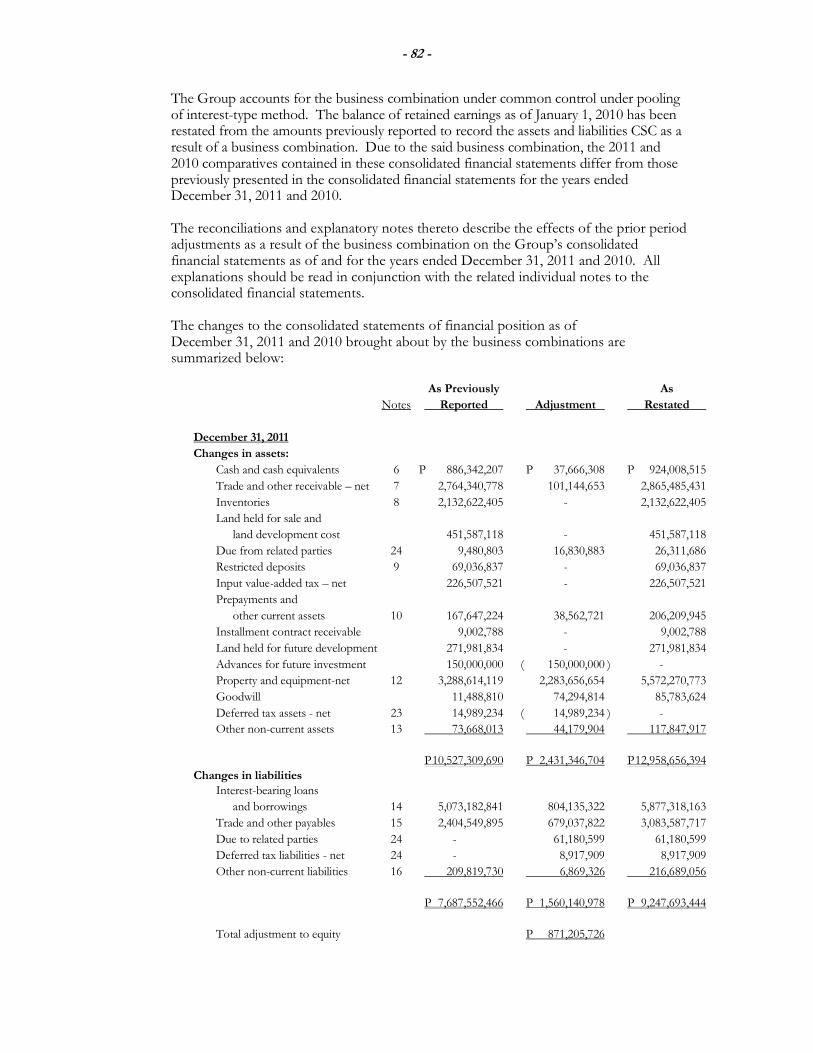
- 82 -
The Group accounts for the business combination under common control under pooling of interest-type method. The balance of retained earnings as of January 1, 2010 has been restated from the amounts previously reported to record the assets and liabilities CSC as a result of a business combination. Due to the said business combination, the 2011 and 2010 comparatives contained in these consolidated financial statements differ from those previously presented in the consolidated financial statements for the years ended December 31, 2011 and 2010. The reconciliations and explanatory notes thereto describe the effects of the prior period adjustments as a result of the business combination on the Group’s consolidated financial statements as of and for the years ended December 31, 2011 and 2010. All explanations should be read in conjunction with the related individual notes to the consolidated financial statements. The changes to the consolidated statements of financial position as of December 31, 2011 and 2010 brought about by the business combinations are summarized below:
As Previously As
Notes Reported Adjustment Restated
December 31, 2011
Changes in assets:
Cash and cash equivalents 6 P 886,342,207 P 37,666,308 P 924,008,515
Trade and other receivable – net 7 2,764,340,778 101,144,653 2,865,485,431
Inventories 8 2,132,622,405 - 2,132,622,405
Land held for sale and
land development cost 451,587,118 - 451,587,118
Due from related parties 24 9,480,803 16,830,883 26,311,686
Restricted deposits 9 69,036,837 - 69,036,837
Input value-added tax – net 226,507,521 - 226,507,521
Prepayments and
other current assets 10 167,647,224 38,562,721 206,209,945
Installment contract receivable 9,002,788 - 9,002,788
Land held for future development 271,981,834 - 271,981,834
Advances for future investment 150,000,000 ( 150,000,000 ) -
Property and equipment-net 12 3,288,614,119 2,283,656,654 5,572,270,773
Goodwill 11,488,810 74,294,814 85,783,624
Deferred tax assets - net 23 14,989,234 ( 14,989,234 ) -
Other non-current assets 13 73,668,013 44,179,904 117,847,917
P 10,527,309,690 P 2,431,346,704 P 12,958,656,394
Changes in liabilities
Interest-bearing loans
and borrowings 14 5,073,182,841 804,135,322 5,877,318,163
Trade and other payables 15 2,404,549,895 679,037,822 3,083,587,717
Due to related parties 24 - 61,180,599 61,180,599
Deferred tax liabilities - net 24 - 8,917,909 8,917,909
Other non-current liabilities 16 209,819,730 6,869,326 216,689,056
P 7,687,552,466 P 1,560,140,978 P 9,247,693,444
Total adjustment to equity P 871,205,726

- 83 -
As Previously As
Notes Reported Adjustment Restated
December 31, 2010
Changes in assets:
Cash and cash equivalents 6 P 605,444,745 P 10,415,878 P 615,860,623
Trade and other receivable – net 7 2,592,845,395 ( 36,460,482 ) 2,556,384,913
Inventories 8 1,051,658,928 - 1,051,658,928
Land held for sale and
land development costs 451,587,118 - 451,587,118
Due from related parties 24 14,750,495 5,258,619 20,009,114
Restricted deposits 9 73,422,716 - 73,422,716
Input value-added tax – net 27,539,110 - 27,539,110
Prepayments and
other current assets 10 53,432,012 32,607,914 86,039,926
Installment contract receivable 18,005,640 - 18,005,640
Land held for future development 315,874,750 - 315,874,750
Advances for future investment - - -
Property and equipment-net 12 2,358,043,160 1,528,069,857 3,886,113,017
Goodwill 9,344,134 74,294,814 83,638,948
Deferred tax assets - net 23 19,263,602 ( 19,263,602 ) -
Other non-current assets 16 50,060,088 39,812,399 89,872,487
P 7,641,271,893 P 1,634,735,397 P 9,276,007,290
Changes in liabilities
Interest-bearing loans and borrowings P 3,427,052,637 P 607,171,487 P 4,034,224,124
Trade and other payables 1,637,293,361 288,810,117 1,926,103,478
Due to related parties 53,106,188 91,959,820 145,065,708
Deferred tax liabilities - net - 22,878,090 22,878,090
Other non-current liabilities 62,615,622 6,508,620 69,124,242
P 5,180,067,808 P 1,017,327,834 P 6,197,395,642
Total adjustment to equity P 617,407,563
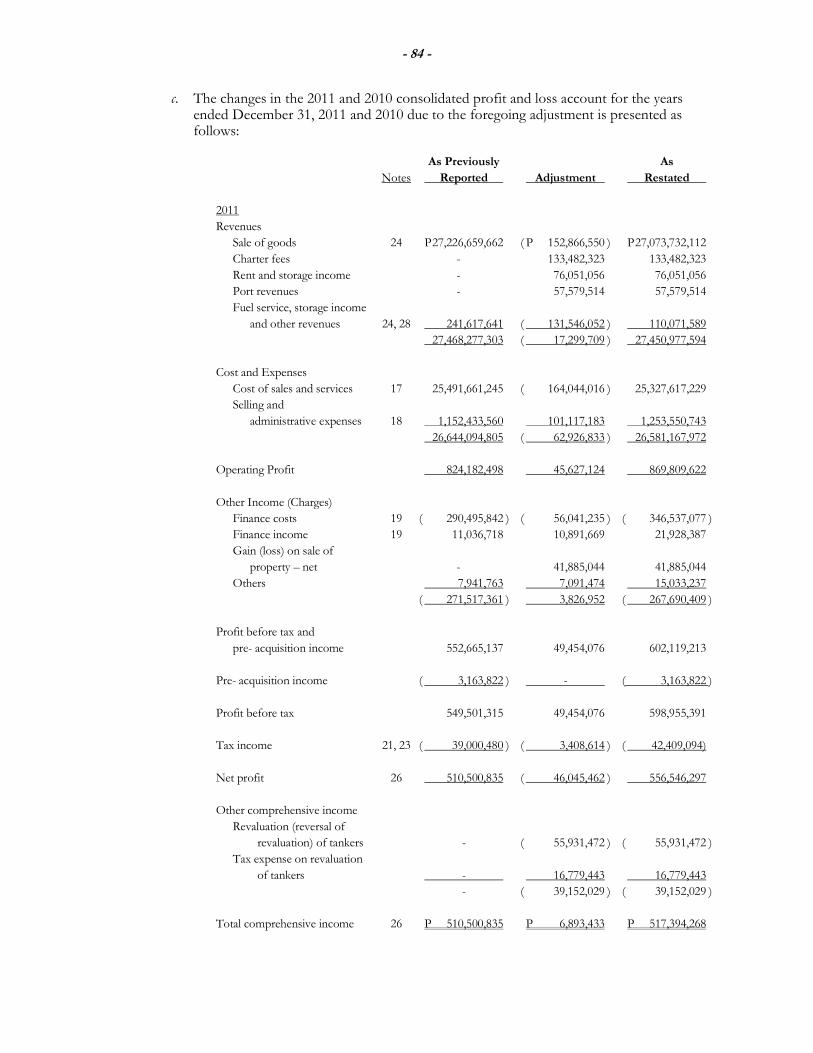
- 84 -
c. The changes in the 2011 and 2010 consolidated profit and loss account for the years ended December 31, 2011 and 2010 due to the foregoing adjustment is presented as follows:
As Previously As
Notes Reported Adjustment Restated
2011
Revenues
Sale of goods 24 P 27,226,659,662 ( P 152,866,550 ) P 27,073,732,112
Charter fees - 133,482,323 133,482,323
Rent and storage income - 76,051,056 76,051,056
Port revenues - 57,579,514 57,579,514
Fuel service, storage income
and other revenues 24, 28 241,617,641 ( 131,546,052 ) 110,071,589
27,468,277,303 ( 17,299,709 ) 27,450,977,594
Cost and Expenses
Cost of sales and services 17 25,491,661,245 ( 164,044,016 ) 25,327,617,229
Selling and
administrative expenses 18 1,152,433,560 101,117,183 1,253,550,743
26,644,094,805 ( 62,926,833 ) 26,581,167,972
Operating Profit 824,182,498 45,627,124 869,809,622
Other Income (Charges)
Finance costs 19 ( 290,495,842 ) ( 56,041,235 ) ( 346,537,077 )
Finance income 19 11,036,718 10,891,669 21,928,387
Gain (loss) on sale of
property – net - 41,885,044 41,885,044
Others 7,941,763 7,091,474 15,033,237
( 271,517,361 ) 3,826,952 ( 267,690,409 )
Profit before tax and
pre- acquisition income 552,665,137 49,454,076 602,119,213
Pre- acquisition income ( 3,163,822 ) - ( 3,163,822 )
Profit before tax 549,501,315 49,454,076 598,955,391
Tax income 21, 23 ( 39,000,480 ) ( 3,408,614 ) ( 42,409,094)
Net profit 26 510,500,835 ( 46,045,462 ) 556,546,297
Other comprehensive income
Revaluation (reversal of
revaluation) of tankers - ( 55,931,472 ) ( 55,931,472 )
Tax expense on revaluation
of tankers - 16,779,443 16,779,443
- ( 39,152,029 ) ( 39,152,029 )
Total comprehensive income 26 P 510,500,835 P 6,893,433 P 517,394,268
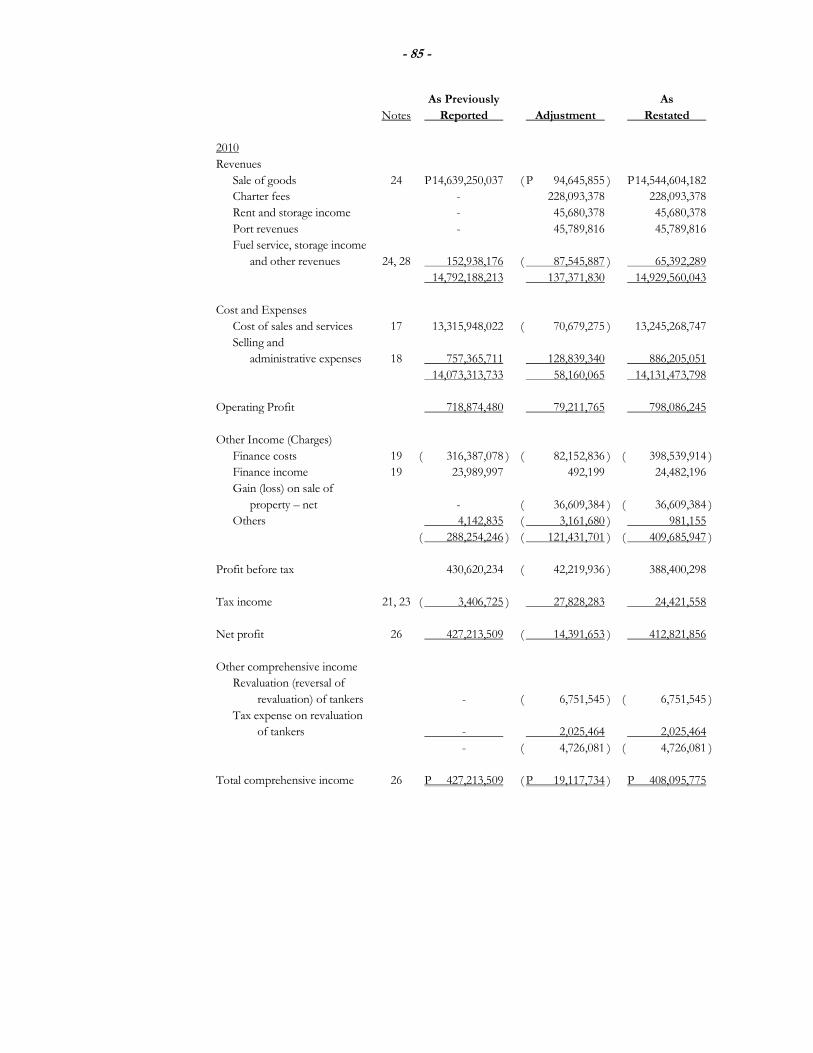
- 85 -
As Previously As
Notes Reported Adjustment Restated
2010
Revenues
Sale of goods 24 P 14,639,250,037 ( P 94,645,855 ) P 14,544,604,182
Charter fees - 228,093,378 228,093,378
Rent and storage income - 45,680,378 45,680,378
Port revenues - 45,789,816 45,789,816
Fuel service, storage income
and other revenues 24, 28 152,938,176 ( 87,545,887 ) 65,392,289
14,792,188,213 137,371,830 14,929,560,043
Cost and Expenses
Cost of sales and services 17 13,315,948,022 ( 70,679,275 ) 13,245,268,747
Selling and
administrative expenses 18 757,365,711 128,839,340 886,205,051
14,073,313,733 58,160,065 14,131,473,798
Operating Profit 718,874,480 79,211,765 798,086,245
Other Income (Charges)
Finance costs 19 ( 316,387,078 ) ( 82,152,836 ) ( 398,539,914 )
Finance income 19 23,989,997 492,199 24,482,196
Gain (loss) on sale of
property – net - ( 36,609,384 ) ( 36,609,384 )
Others 4,142,835 ( 3,161,680 ) 981,155
( 288,254,246 ) ( 121,431,701 ) ( 409,685,947 )
Profit before tax 430,620,234 ( 42,219,936 ) 388,400,298
Tax income 21, 23 ( 3,406,725 ) 27,828,283 24,421,558
Net profit 26 427,213,509 ( 14,391,653 ) 412,821,856
Other comprehensive income
Revaluation (reversal of
revaluation) of tankers - ( 6,751,545 ) ( 6,751,545 )
Tax expense on revaluation
of tankers - 2,025,464 2,025,464
- ( 4,726,081 ) ( 4,726,081 )
Total comprehensive income 26 P 427,213,509 ( P 19,117,734 ) P 408,095,775