cover photo: the nasa p-3 during takeoff from …...figure 6 jim yungel (nasa wff engineer) giving a...
TRANSCRIPT


COVER PHOTO:
The NASA P-3 during takeoff from Thule Air Base, with the Greenland ice sheet in
the distance. Photo credit: Jeremy Harbeck

2018 Annual Report
Airborne Science ProgramScience Mission Directorate

II

III
1. Leadership Comments .......................................................................................................................... 1
2. Program Overview ................................................................................................................................. 3
Structure of the Program ...................................................................................................... 4
New Program Capabilities .................................................................................................... 4
Flight Request System and Flight Hours ............................................................................... 4
3. Science ..................................................................................................................................................... 9
Major Mission Highlights ....................................................................................................... 9
Operation IceBridge (OIB) in FY18 ............................................................................... 10
Earth Venture Suborbital-2 (EVS-2) .............................................................................. 12
ATom ..................................................................................................................... 13
NAAMES ............................................................................................................... 15
ACT-America ......................................................................................................... 15
ORACLES ............................................................................................................. 17
OMG ..................................................................................................................... 19
HyTES / HyspIRI ......................................................................................................... 20
UAVSAR Data Acquisition and Delivery Metrics for FY18 ............................................. 21
Arctic Boreal Vulnerability Experiment (ABoVE) 2018 ................................................... 22
Disaster Response ...................................................................................................... 24
Support to ESD Satellite Missions, Including (2007) Decadal Survey Missions .................... 26
LISTOS ....................................................................................................................... 27
ACEPOL ..................................................................................................................... 29
Support to Instrument Development ................................................................................... 30
AITT Progress ............................................................................................................. 31
Air-LUSI ................................................................................................................. 31
C-HARRIER .......................................................................................................... 33
DopplerScatt ......................................................................................................... 33
Upcoming Missions ............................................................................................................ 35
Cloud and Aerosol Monsoonal Processes - Philippines Experiment (CAMP2Ex) .......... 35
FIREX-AQ ................................................................................................................... 35
Technology Demonstrations ........................................................................................ 36
Earth Venture Suborbital-3 (EVS-3) ............................................................................. 36
4. Aircraft ......................................................................................................................................38
New Program Capabilities ................................................................................................... 40
ASP-Supported Aircraft ...................................................................................................... 40
Other NASA Earth Science Aircraft ...................................................................................... 48
Non-NASA Commercial Aviation Services (CAS) Oversight and Management ..................... 53
Table of Contents
NASA Airborne Science Program • Table of Contents
IV
5. Aircraft Cross-Cutting Support and IT Infrastructure ...................................................................56
ASP Facility Science Infrastructure ...................................................................................... 56
Facility Instrumentation ................................................................................................ 56
Sensor Network IT Infrastructure .................................................................................. 57
NASA Airborne Science Data and Telemetry (NASDAT) System ................................... 58
Satellite Communications Systems .............................................................................. 58
Payload Management .................................................................................................. 59
Mission Tool Suite .............................................................................................................. 59
6. Advanced Planning ...................................................................................................................63
Requirements Update ......................................................................................................... 63
5-Year Plan ......................................................................................................................... 64
7. Education and Outreach ...........................................................................................................65
Student Airborne Research Program 2018 .......................................................................... 65
Appendix A: Appendix: 5-Year Plan .............................................................................................67
Appendix B: Acronyms .................................................................................................................72
Table of Figures
Figure 1 Science Mission Directorate organization chart .................................................. 3
Figure 2 Airborne Science Program organization chart .................................................... 4
Figure 3 ASP flight hours FY98 – FY18 ............................................................................ 6
Figure 4 Locations of ASP missions in 2018 .................................................................... 8
Figure 5 ........................................................................................ 10
Figure 6 Jim Yungel (NASA WFF engineer) giving a mid-flight overview of the ATM (Airborne Topographic Mapper) system to NBC field correspondent Jacob Soboroff in the rear of the NASA P-3. In the background, left to right: Brad Soeder (NASA avionics tech), Jefferson Beck (NASA Earth Science producer), Alex Kyriacou (NBC sound engineer) ........................................................................................................... 11
Figure 7 EVS-2 mission coverage in FY18 ..................................................................... 12
Figure 8 NASA DC-8 and ATom-4 team on return to AFRC ........................................... 13
Figure 9 The ATom team flew over a streak of wildfires near Pyramid Lake in northwest Nevada ........................................................................................................ 14
Figure 10 C-130 and B-200 with ACT-America teams ................................................... 16
Figure 11 P-3 and ER-2 flight tracks from three ORACLES deployments, overlaid on a VIIRS true color image taken on Sept. 13, 2018, showing a typical cloud deck and overlying (brown color) aerosol layer. Flight tracks shown are from 2016 (P-3: light blue; ER-2: green), 2017 (orange) and 2018 (dark blue) ................................................ 18
Figure 12 2018 AXCTD survey of the oceans around Greenland. Yellow dots show planned drops, green dots show completed drops. The two purple drops show the locations of the Alamo Probe drops. Unfortunately, the Alamo Probes failed after launch and did not return any data this year ................................................................. 20
NASA Airborne Science Program • Table of Contents

V
Figure 13 ............. 21
Figure 14 HyspIRI flight boxes were flown multiple seasons in 2013, 2014 and 2015, and single seasons in 2016, 2017 and 2018 ...................................................... 21
Figure 15 Range of disciplines supported by UAVSAR projects ..................................... 22
Figure 16 UAVSAR false-color polarimetric image showing the Mackenzie River Delta (light green) near Inuvik, Canada. Image acquired in August 2018. Polarization: HH HV VV ................................................................................................ 22
Figure 17 AVIRIS-ng datasets collected during ABoVE 2018. Green lines indicate flight lines successfully collected; yellow lines may be obscured by clouds; magenta lines were planned but not collected due to weather .................................................... 23
Figure 18 GLISITN-A flight lines in Hawaii and corresponding lava map ......................... 24
Figure 19 Puerto Rico G-LiHT phase one aerial RGB imagery ........................................ 24
Figure 20 UAVSAR false color polarimetric image over the Pee Dee River. Colors refer to polarization ........................................................................................... 25
Figure 21 The upper image is the standard Color Infrared (CIR) composite; the lower is the Burned Area Emergency Response (BAER) composite, as used by the USFS .... 25
Figure 22 .......... 28
Figure 23 HSRL-2 preliminary data from the ER-2 ACEPOL flight on Nov. 7 showing the structure of aerosol and clouds in the atmosphere along the flight track. The ground is black, dark blue indicates clear air and white indicates water clouds. Transparent cirrus clouds high in the atmosphere show up in yellow and orange. Yellow, green and blue at lower altitudes indicate aerosols ........................................... 29
Figure 24 Air-LUSI IRIS telescope on ARTEMIS mount in ER-2 wing pod tail ................. 32
Figure 25 Test flight on the CIRPAS Twin Otter over Moss Landing and coastal Monterey Bay. CIRPAS meteorology probes can be seen on the wing tip supporting the science data collection ........................................................................................... 33
Figure 26 The AFRC B-200 flew DopplerScatt on multiple missions in 2018.................. 34
Figure 27 EVS-3 Missions, aircraft and tentative flight schedules ................................... 37
Figure 28 NASA Aircraft showing altitude and endurance capabilities ............................ 39
Figure 29 NASA Aircraft showing altitude and range capabilities .................................... 40
Figure 30 The DC-8 was filled with instruments during ATom ......................................... 41
Figure 31 NASA ER-2 flew HyTES in Hawaii in 2018 ..................................................... 42
Figure 32 .............................................................................................................. 43
Figure 33 During ABoVE, the UAVSAR team met with Canadian students in Yellowknife................................................................................................................... 44
Figure 34 Flight crew for the spring ice survey at Thule Air Base, including pilots, mechanics, radar engineers and the lead scientist in front of NASAs Gulfstream III ...... 45
Figure 35 NASA G-V with JSC Aircraft Team ................................................................. 46
Figure 36 NASA 520, a new G-III at LaRC..................................................................... 47
Table of Contents
NASA Airborne Science Program • Table of Contents

VI NASA Airborne Science Program • Table of Contents
Figure 37 In the cockpit of the C-130 during ACT-America ............................................ 49
Figure 38 The AFRC B-200 flew DopplerScatt on multiple missions in 2018 .................. 50
Figure 39 HU-25A participated in LISTOS in FY18 ......................................................... 51
Figure 40 WB-57............................................................................................................ 52
Figure 41 The new MTS user interface showing the Asset Status telemetry displays ...... 60
Figure 42 The MTS product interface. The product interface has been greatly simplified and users can now view different product stacks simultaneously within the same window ......................................................................................................... 61
Figure 43 Freely available 3-D models include: C-20 (w/wo UAVSAR), DC-8, P-3, Global Hawk, G-5, Twin Otter, WB-57, ER-2, B-200s (LaRC, AFRC), SIERRA-B, C-130 .......................................................................................................................... 62
Figure 44 Example rendering of the ER-2. The model can be further customized to accommodate missions, generating outreach materials of aircraft instrumentation ... 62
Figure 45 .................................................................................................................... 66
Figure 46 The SARP 2018 student participants with the DC-8 at AFRC ......................... 66
Table of Tables
Table 1 FY18 ASP-ESD Flight Request Status and Total Flight Hours Flown, by aircraft* ...................................................................................................................... 5
Table 2 ................... 6
Table 3 Summary of ESD-funded FY18 Flight Request Status and Flight Hours Flown by aircraft* ................................................................................................. 7
Table 4 All SOFRS flight hours flown over the past 5 fiscal years by funding source. ........ 8
Table 5 Major Science Missions in FY18 .......................................................................... 9
Table 6 EVS-2 Mission Progress in FY18 ....................................................................... 12
Table 7 Satellite / Space Mission Support ...................................................................... 26
Table 8 Instrument Development Flights in FY18 ........................................................... 31
Table 9 Major Missions Upcoming in 2019 .................................................................... 35
Table 10 Airborne Science Program Aircraft and their Performance Capabilities............. 38
Table 11 Facility Equipment ........................................................................................... 57
Table 12 Satellite Communications Systems on ASP aircraft .......................................... 58
Table 13 Activities to Support ASP Requirements Information Gathering ........................ 64

1
Welcome to the 2018 edition of the NASA Science Mission Directorate Earth Science Division Airborne Science Program’s Annual Report. As can be seen in Figure 3 (page 6), this year, like the past six years, was another busy year for the program with nearly 3,700 flight hours flown. It may sound repetitive, but we travelled the globe again: from the Arctic to the Antarctic, the length of both the Pacific and Atlantic Oceans, throughout the U.S, including Alaska and Hawaii, back to Africa, and this year adding India and Europe. Whew! Please see Figure 4 (page 8) for a visual representation. We flew 18 science campaigns plus technology development and demonstration missions. NASA research aircraft also supported disaster response efforts fol-lowing hurricane Florence and over the Kilauea Volcano lava flows. See Table 5 (page 9) for a breakdown of the missions. Additionally, the program’s support for ongoing and upcoming satellite missions was extensive. Eighteen satellite missions were identified by Principal Investi-gators as being supported by Airborne Science missions. The most heavily supported satellite missions were OCO-2, ICESat-2 and CryoSat-2, HyspIRI, NISAR, LANDSAT, ACE, GEO-CAPE and TROPOMI on ESA Sentinel-5. As several of these were missions in formulation and are now being redesigned in accordance with the new Decadal Survey, the related data will be trans-ferred to those new missions.
While budgets have been challenging the past few years, the program continues to make progress on enhancing our capabilities. The Johnson Space Center G-V nadir port and other modifications were accomplished in 2018, and the aircraft is available to start science mis-sions in the spring of 2019. The Langley Research Center G-III also started nadir port and other modifications and is planned to be available to the science community in 2019. In addition, we completed the ER-2 809 Cabin Altitude Reduction Effort (CARE), which makes aircraft opera-tions safer for the pilot, and are currently working cockpit avionics upgrades. The work is taking longer than planned, but we hope to have a working ER-2 by the early summer of 2019, while ER-2 806 undergoes its CARE modifications. Another effort we started in 2018 were studies for replacement aircraft. The current life expectancy of the DC-8 and C-20 is in the mid-2020s. We’ve received some input from the science community on what, if any, the requirements are for a future large airborne laboratory and radar platform, but continue to accept input and recommendations. To help keep it relevant throughout its continued life, the AFRC C-20 cockpit avionics were scheduled for upgrades in late 2018.
In addition to all the great science we help enable, we are extremely proud of the fact that the Student Airborne Research Program (SARP) celebrated its 10th anniversary this past summer. The program has 305 alumni from 199 schools in 48 states, the District of Columbia and Puerto
1. Leadership Comments
NASA Airborne Science Program • Leadership Comments
2
Bruce Tagg, [email protected]
Randy Albertson, Deputy [email protected]
Rico. Ninety-four percent of alumni are currently employed in Science, Technology, Engineer-ing and Math (STEM) fields or pursuing advanced degrees in STEM fields. Over 30 alumni have Ph.D.s in STEM fields. Since the program started supporting some of the alumni’s participation in the American Geophysical Union Fall Meeting in 2011, there have been 62 student first-author presentations of their previous summer’s research projects in scientific sessions and four stu-dents awarded AGU Outstanding Student Paper Awards. SARP alumni have participated as scientists and engineers in NASA Airborne Science Program missions all over the world (GRIP, HS3, KORUS-AQ, DISCOVER-AQ, DC3, PECAN, SEAC4RS, AJAX, LMOS, UAVSAR, NAAMES, and future missions such as FIREX and CAMP2Ex), while others have been accepted into NASA and NOAA co-op positions. We salute all the faculty, mentors and our program teams that have contributed to the success of this program and the way it has changed students’ lives.
Looking forward, Earth Venture Suborbital-3 (EVS-3) selections were announced in September, and we are actively engaged in preparing support for the five selected missions over the next five years. See Figure 27 (page 37) for details. In addition to EVS-3 missions, upcoming major airborne missions include FIREX-AQ and CAMP2Ex in 2019, and Operation Ice Bridge until 2020. The 2017-2027 Decadal Survey for Earth Science and Applications from Space was also released in 2018 and we look forward to see how the Earth Science community wants our Airborne Sci-ence team to support it.
Randy and I hope you enjoy reading about the program and, again, we say thank you to the dedicated people who make up the program. We all know it doesn’t happen without great people working hard and being committed to the NASA science mission. Please let us know what you think of the report and, as always, we welcome any and all feedback about the program.
NASA Airborne Science Program • Leadership Comments

3
2. Program Overview
2.Pr
ogra
m O
verv
iew
The Airborne Science Program (ASP) is an important element of the NASA Science Mission Directorate (SMD) Earth Science Division (ESD) because it is involved in the entire life cycle of earth observing satellite missions. The Program supports NASA Earth Science missions in the following capacities:
• Process studies to improve models of Earth system elements
• Satellite mission instrument development, algorithm development, and calibration and validation activities
• Instrument testing and development
• Workforce development / next generation of scientistsWe accomplish these support goals by providing both aircraft systems modified and adapted for science, along with aviation services to the sci-ence community. The NASA aircraft and mission infrastructure are described in this report. ASP also facilitates use of non-NASA aircraft and equipment for Earth Science, as needed.
FIGURE 1 Science Mission Directorate organization chart.
3

4 NASA Airborne Science Program • Program Overview
Structure of the Program Figure 1 shows the role of the Airborne Science Program within SMD. ASP components are shown in Figure 2. The aircraft responsibilities are distributed among the NASA centers where the aircraft are based.
New Program Capabilities Completing development in 2018 were two new science-capable platforms: a G-V at Johnson Space Center (JSC) and a new G-III at Langley Research Center (LaRC). With new instrument windows and portals in place, both are perform-ing their first science missions in 2019.
Flight Request System and Flight Hours ASP maintains science-capable aircraft and instrument assets for research use, in support of NASA’s SMD. The Science Operations Flight Request System (SOFRS) is a web-based tool used to track and facilitate the review and ap-proval process for airborne science activities
FIGURE 2 Airborne Science Program organization chart.
using ASP- supported aircraft, facility instru-ments, ASP science support assets or any ESD-funded activities/missions using aircraft. The way to schedule the use of NASA SMD platforms and instrument assets is to submit a Flight Request (FR) for approval through SOFRS (https://airbornescience.nasa.gov/sofrs). The SOFRS team strives for continuous improve-ment by refining the user interface and reports produced.
There were 158 FRs submitted in 2018 for flight activities using at least one of the following ASP components: an ASP-supported aircraft, ESD funding, an ASP facility instrument (AVIRIS-ng, AVIRIS-C, eMAS, LVIS, MASTER, NAST-I and UAVSAR/L-Band), and/or an ASP Science Support Asset (DMS and POS AV Applanix). A total of 68 FRs were completed, using 22 differ-ent aircraft. Of the remaining FRs, some were deferred and the rest were canceled for vari-ous reasons. The 68 completed FRs flew a total

5
Program Overview
NASA Airborne Science Program • Program Overview
TABLE 1 FY18 ASP-ESD Flight Request Status and Total Flight Hours Flown, by aircraft.*
1ASP Supported Aircraft: flight hours are subsidized by the program.2These aircraft are NASA-owned not subsidized by the Airborne Science Program. B-200 includes (B-200 – AFRC, B-200 – LARC, B-200 - UC–12B).
3See Table 2 for details.
of 3,688.5 flight hours. The details are listed below. Table 1 shows all flight requests status and flight hours flown by aircraft. Table 2 shows a list of the “Other” requested aircraft flown (Flight Request Status and Total Hours). Table 3 shows only ESD flight requests and flight
hours flown by aircraft. Figure 3 is a histogram showing the history of flight hours usage. Table 4 shows all SOFRS flight hours flown by funding source. Figure 4 shows the global reach of ASP flight activities in FY18.

6
Aircraft Utilization FY98-FY18
FIGURE 3 ASP flight hours FY98 – FY18.
TABLE 2 List of Other Aircraft Flown (Flight Request Status and Total Hours).
NASA Airborne Science Program • Program Overview

7
TABLE 3 Summary of ESD-funded FY18 Flight Request Status and Flight Hours Flown by aircraft.*
1ASP Supported Aircraft.2These aircraft are NASA-owned not subsidized by the Airborne Science Program. B-200 includes (B-200 – AFRC, B-200 – LaRC, B-200 - UC–12B).3Other Non-NASA contracted aircraft requested include: Aeroscout, SkyTEM helicopter, SPEC LearJet, Tarot Hexacopter, Twin Otter International and UAS.
4Other Non-NASA contracted aircraft actually flown include: A90 - Dynamic Aviation, Alphajet, B-200 - Dynamic Aviation, DC-3, Airtec BT-67, Basler BT-67, ISRO King Air and SuperSwift.
*How to read Table 1 and Table 3• These totals are based on the Flight Re-
quest’s log number, and therefore include Flight Requests whose log number starts with “18”.
• The “Total FRs” column includes Flight Requests that were submitted and whose log number starts with “18”.
•The “Total FRs Approved” column includes Flight Requests that were approved but may or may not have flown during FY18.
• The “Total Partial FRs” column includes Flight Requests in which the total approved hours were not fully expended during FY18 and have been rolled over to the following year.
• The “Total FRs Completed” column includes only Flight Requests whose final status is “Completed”. The “Total Hours Flown” column
includes all “Flight Hours Flown” for Flight Requests with a status of “Completed” or “Partial” for 2018.
Program Overview
NASA Airborne Science Program • Program Overview
7
19
14
16
0
7
154
13
4
1
1
1
1
3
3
28
118
DC-81 – AFRC1
ER-2 – AFRC1
Gulfstream C-20A(GIII) – AFRC1
Gulfstream III – JSC1
Gulfstream V – JSC1
P-3 Orion – WFF1
B-2002
C-130H – WFF2
C-23 Sherpa – WFF2
Dragon Eye – ARC2
Global Hawk – AFRC2
HU-25A Guardian – LaRC2
SIERRA – ARC2
Twin Otter – GRC2
Other3,4
TOTAL
4
15
14
10
0
3
9
4
0
0
0
1
0
3
18
81
0
4
3
0
0
1
0
0
0
0
0
0
0
1
1
10
4
7
8
8
0
2
0
9
4
0
0
0
1
0
2
13
58
254.5
283.7
235.1
224.0
0.0
390.9
429.2
310.5
0.0
0.0
0.0
24.8
0.0
64.0
909.1
3125.8
ASP Supported Aircraft
Other NASA Aircraft

8
FY2018 Airborne Campaigns
FIGURE 4 Locations of ASP missions in 2018.
TABLE 4 All SOFRS flight hours flown over the past 5 fiscal years by funding source.
NASA Airborne Science Program • Program Overview
**The NASA Earth Sciences Division (ESD) is under the Science Mission Directorate (SMD). “SMD (Non-ESD) Flight Hours” are for those hours funded by SMD Program Managers not within ESD.
9
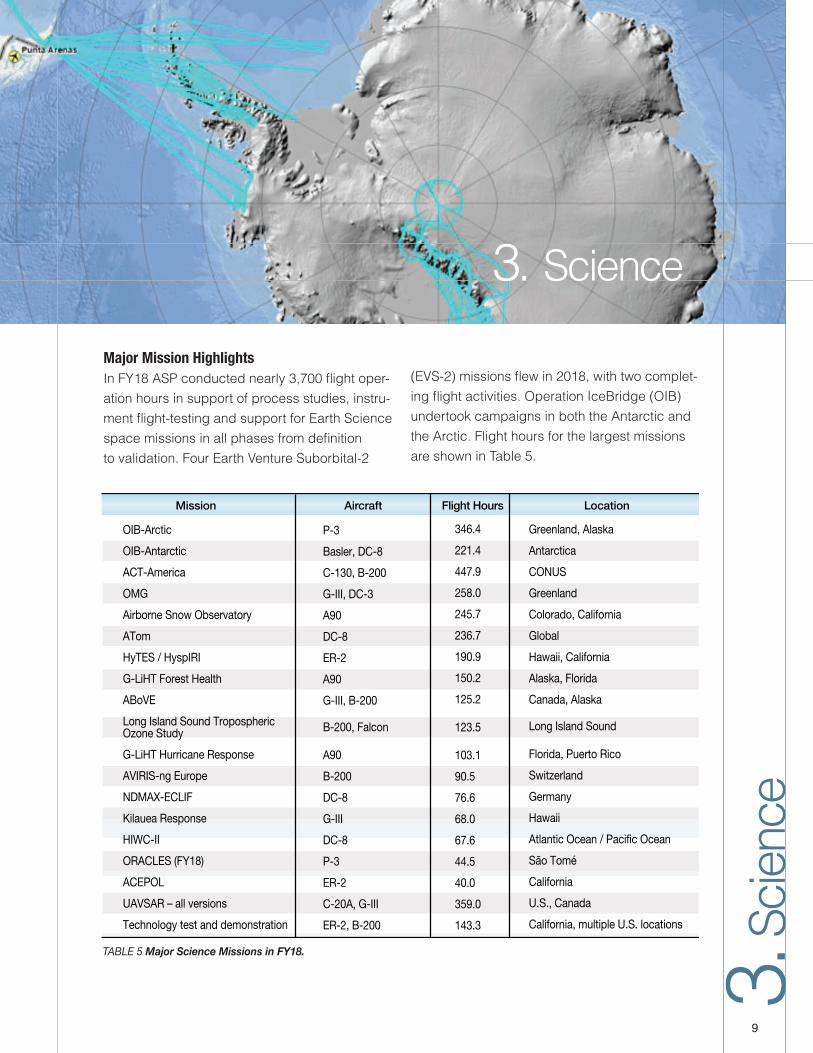
Major Mission HighlightsIn FY18 ASP conducted nearly 3,700 flight oper-ation hours in support of process studies, instru-ment flight-testing and support for Earth Science space missions in all phases from definition to validation. Four Earth Venture Suborbital-2
(EVS-2) missions flew in 2018, with two complet-ing flight activities. Operation IceBridge (OIB) undertook campaigns in both the Antarctic and the Arctic. Flight hours for the largest missions are shown in Table 5.
TABLE 5 Major Science Missions in FY18.
3. Science
3.Sc
ience
9

10
FIGURE 5 OIB flight lines in the Antarctica Spring of 2017 (early FY18), with focus on the “Pole Hole”.
Operation IceBridge (OIB) in FY18
In FY18, OIB returned to both the Antarctic and Arctic. In a new adventure, far reaches of Antarctica were explored using a contracted Basler BT-67 aircraft.
A dual-aircraft campaign was completed in Antarctica in late 2017 (FY18) with a mixture of new areas covered, as well as repeats of historic lines to assess changes in the polar ice cover. In the first campaign, the NASA P-3 aircraft, based out of Ushuaia, Argentina, was equipped with the traditional IceBridge instru-ment suite of laser altimeters, shallow and deep sounding radars, gravimeter, magnetom-eter, and thermal and visible imaging systems. In the second campaign, a Basler BT-67 air-craft, based primarily out of McMurdo Station,
Antarctica, carried a laser altimeter and depth sounding radar.
The P-3 Antarctic campaign logged 11 research flights totaling 156 flight hours and traveled a distance of 85,106 km. The campaign flew extensive coverage of sea ice in the Weddell Sea, including two underflights of the TanDEM-X spacecraft in coordination with the German Aerospace Center (DLR). New gravity surveys of the Larsen C and Venable Ice Shelves were also completed, including the first up-close look at the massive A68 iceberg that calved off the Larsen C glacier in July.
The Basler campaign, which flew right up to year’s end, completed 16 flights totaling 108 flight hours and traveled a distance of 33,880 km. The science lines for the campaign were a mixture of new missions as well as lines
PI – Nathan Kurtz, GSFCProgram – Cryosphere
Aircraft – P-3, DC-8, Basler
NASA Airborne Science Program • Science
11
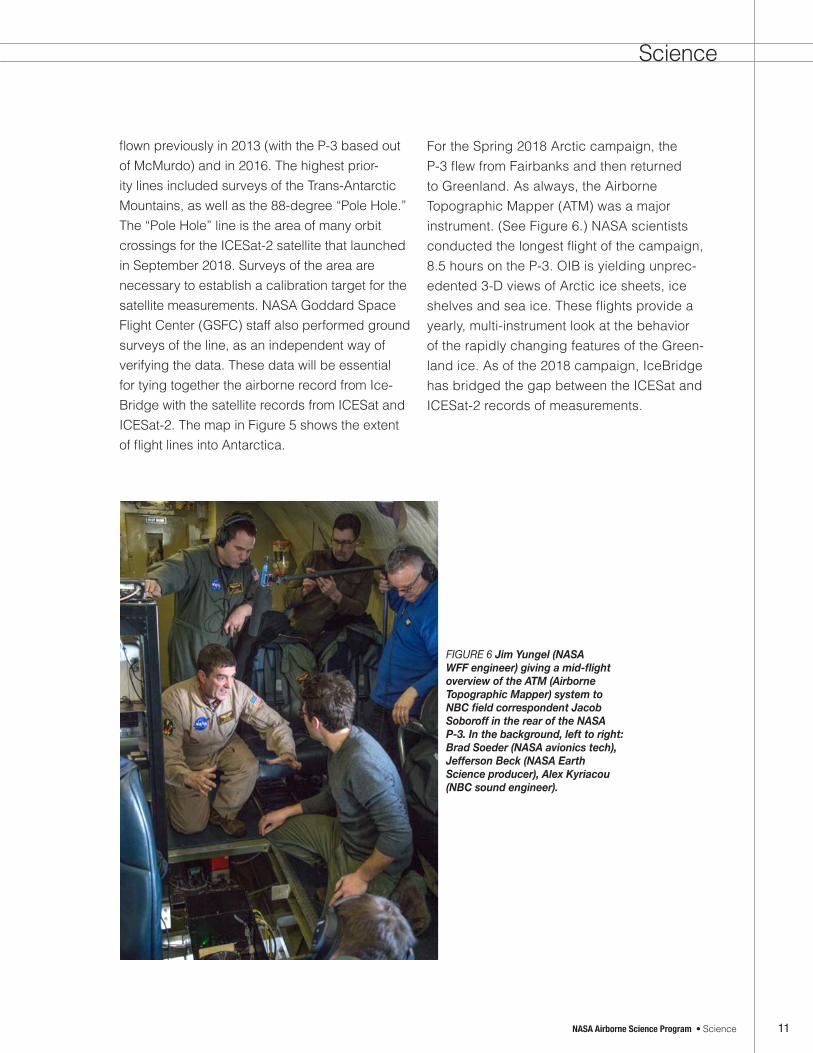
FIGURE 6 Jim Yungel (NASA WFF engineer) giving a mid-flight overview of the ATM (Airborne Topographic Mapper) system to NBC field correspondent Jacob Soboroff in the rear of the NASA P-3. In the background, left to right: Brad Soeder (NASA avionics tech), Jefferson Beck (NASA Earth Science producer), Alex Kyriacou (NBC sound engineer).
flown previously in 2013 (with the P-3 based out of McMurdo) and in 2016. The highest prior-ity lines included surveys of the Trans-Antarctic Mountains, as well as the 88-degree “Pole Hole.” The “Pole Hole” line is the area of many orbit crossings for the ICESat-2 satellite that launched in September 2018. Surveys of the area are necessary to establish a calibration target for the satellite measurements. NASA Goddard Space Flight Center (GSFC) staff also performed ground surveys of the line, as an independent way of verifying the data. These data will be essential for tying together the airborne record from Ice-Bridge with the satellite records from ICESat and ICESat-2. The map in Figure 5 shows the extent of flight lines into Antarctica.
For the Spring 2018 Arctic campaign, the P-3 flew from Fairbanks and then returned to Greenland. As always, the Airborne Topographic Mapper (ATM) was a major instrument. (See Figure 6.) NASA scientists conducted the longest flight of the campaign, 8.5 hours on the P-3. OIB is yielding unprec-edented 3-D views of Arctic ice sheets, ice shelves and sea ice. These flights provide a yearly, multi-instrument look at the behavior of the rapidly changing features of the Green-land ice. As of the 2018 campaign, IceBridge has bridged the gap between the ICESat and ICESat-2 records of measurements.
Science
NASA Airborne Science Program • Science

12
TABLE 6 EVS-2 Mission Progress in FY18.
Earth Venture Suborbital – 2 (EVS-2) EVS-2 missions continued during 2018. Three missions – ATom, NAAMES, and ORACLES – all completed flight activities. ORACLES returned home in October 2018, crossing into FY19.
FIGURE 7 EVS-2 mission coverage in FY18.
NASA Airborne Science Program • Science
ACT-America will finish in 2019, while OMG has flights scheduled into 2020. The progress of the missions is listed in Table 6. The map in Figure 7 shows the broad reach of these missions during 2018.

13
ATom
The Atmospheric Tomography (ATom) project successfully conducted the final of four planned global deployments in FY18, with the return of the NASA DC-8 to Armstrong Flight Research Center (AFRC) on May 21, 2018. Immediately after the final flight, the returning team celebrat-ed the accomplishment with cake and sparkling wine in the B703 hangar. (Figure 8)
The third and fourth deployments featured new challenges — two unplanned and one planned — that the ATom team had to overcome. The first anomaly was the result of an aircraft communica-tion system issue, which delayed the departure from AFRC to Anchorage by one day. The team shortened the planned two-day stopover in Anchorage by one day in order to get back on the original schedule. The second anomaly occurred due to bad weather on route to Thule, Greenland from Lajes AB, Portugal, which
FIGURE 8 NASA DC-8 and ATom-4 team on return to AFRC.
NASA Airborne Science Program • Science
Science
PI – Steve Wofsy (Harvard University) Aircraft – DC-8
caused the aircrew to divert to Kangerlussuaq. Due to the short runway length at the Kangerlus-suaq airport, the aircraft could not take off with sufficient fuel to get back to Anchorage, the next planned stopover location. After an overnight stay in Kangerlussuaq, the team flew to Bangor, Maine, spent the night, and then departed for Anchorage the following day, back on the origi-nal schedule and route. These rapid changes in international deployment locations and flight paths were carried out by the Earth Science Project Office (ESPO) logistics team within a few hours, an extraordinary accomplishment that saved the critical Arctic leg of mission four.
ATom-4 planning also relocated the tropical Atlantic site to Recife, Brazil, replacing Ascension Island as a stopover due to runway deterioration at Wideawake Field. The decision to use Recife caused a last-minute scramble to make all of the necessary arrangements, and raised security and diplomatic concerns, but in the end the stopover in Recife ultimately worked out very well.

14
FIGURE 9 The ATom team flew over a streak of wildfires near Pyramid Lake in northwest Nevada.
Over the four deployments the ATom project accrued 437 flight hours, covering 320,000 km, executing 675 vertical profiles, 10 missed ap-proaches, 10 eddy-flux maneuvers, 7 TCCON site over-flights and 3 over-flights of Antarctica.
“ATom was intended to probe the most remote parts of the atmosphere, to detect the subtle influence of pollution in the farthest reaches of the globe,” said lead PI Steven Wofsy. “We were astonished to find that human-caused pollution was anything but subtle in very remote places, especially the Arctic and Antarctic, and the tropical Atlantic. ATom showed that the most remote places in the atmosphere are commonly
NASA Airborne Science Program • Science
observed to be severely impacted by diverse sources of pollution.”
Michael J. Prather, the deputy lead PI, noted: “In ATom-4’s first 3 flights [PMD-equator-PMD-ANC-KOA] we passed through extensive air masses with strong, distinct chemical signatures of wildfires, industrial pollution, and stratospheric intrusions. These air masses were often folded and had sharp boundaries with what could be described as clean maritime air above and below. They were identifiable over thousands of km in the horizontal and 5 km [nearly a full-scale height] in the vertical.”

15
findings regarding plankton blooms is currently being prepared for a forthcoming special issue in the Frontiers collection of journals. NAAMES results and analyses were featured in a session entitled “Marine Aerosols, Trace Gases, and Clouds over the North Atlantic” that took place at the American Geophysical Union (AGU) Fall Meeting in Washington, D.C. in December and at a NASA Hyperwall talk. In February 2019 an additional session on blooms featuring many findings from NAAMES will occur during the Aquatic Sciences Meeting in San Juan, Puerto Rico. One of the major, early results from the NAAMES project is confirmation of the autumn-early winter initiation of the annual North Atlantic phytoplankton bloom that was hypothesized by Behrenfeld in 2010. Other emerging results on ocean-emitted trace gases and aerosols high-light the need for interdisciplinary science to tackle intractable problems related to our under-standing of the Earth system.
ACT-America
The Atmospheric Carbon and Transport – America (ACT-America) team completed its fourth atmospheric measurement campaign in May 2018. This investigation measures the sources of regional carbon dioxide, methane and other gases, and documents how weather systems transport these gases in the atmo-sphere. The research goal is to improve identi-
NAAMES
The North Atlantic Aerosols and Marine Ecosys-tems Study (NAAMES) team completed its fourth and final deployment in spring 2018 with early results presented at the project science team meeting at Oregon State University in Corvallis, Oregon, on June 11-13. During the spring de-ployment, the R/V Atlantis explored a diversity of ocean ecosystem and associated atmospheric properties associated with the early phase of the annual plankton bloom, yielding many exciting measurements and results despite the aircraft maintenance setbacks that grounded the NASA C-130 in St. John’s, Newfoundland. The scien-tific success of the spring campaign highlights the resiliency of the NAAMES sampling strategy that employs multiple complementary surface, airborne and spaceborne assets. Final data analyses and manuscript preparations are pro-ceeding, but many “first glimpse” results were featured at the project science team meeting in June, where more than 80 team members from NASA and participating universities and orga-nizations were in attendance presenting seven plenary talks, 16 interactive working breakout sessions and more than 50 science posters. Despite only finishing the fourth deployment as recently as April 2018, the NAAMES project has already garnered over 15 publications in high impact journals such as Nature Geosciences, Nature Microbiology, Nature Scientific Reports, PLOS ONE and others. A collection of NAAMES
Science
NASA Airborne Science Program • Science
PI – Mike Behrenfeld (Oregon State University) Aircraft – C-130
PI – Ken Davis (Penn State University) Aircraft – C-130, B-200/UC-12B

16
FIGURE 10 C-130 and B-200 with ACT-America teams.
fication and prediction of carbon dioxide and methane sources and sinks using spaceborne, airborne and ground-based data over the east-ern United States.
The spring field campaign was conducted be-tween April 12 and May 20, 2018. The campaign used two instrumented NASA aircraft (Figure 10) to gather atmospheric measurements of green-house gases along with other trace gases and standard meteorological variables by operat-ing out of LaRC; Wallops Flight Facility (WFF); Shreveport, Louisiana; and Lincoln, Nebraska. The LaRC B-200 aircraft (carrying in-situ sensors) collected 128.2 hours of data and the WFF C-130 aircraft (carrying in-situ and remote sensors) collected 103.2 hours of data during 26 research missions. These missions occurred over the U.S. South, Midwest, and Mid-Atlantic regions, as well as during transit flights between regions. In addition to the numerous level-leg flights, 334 quasi-vertical profiles of greenhouse gases and meteorological variables were made using spirals or on route ascents or descents with both the C-130 and B-200.
Daily flight plans were designed based on prevailing meteorological conditions, synoptic
scale settings and source-sink distributions of different atmospheric tracers in the three regions, and the research flight days were clas-sified into frontal, fair weather and Gulf inflow; some days were hybrids of these. Additionally, during five fair weather days, underflights of the Orbiting Carbon Observatory-2 (OCO-2) satel-lite were carried out to investigate the sensitivity of CO2-column measurements from the OCO-2 to lower tropospheric CO2 variability. The spring campaign included several sets of data that are unique to the ACT-America mission including: flying across the same stationary frontal bound-ary more than five times within a week over the Mid-Atlantic region, and flying across varying “greening” over both the South and Mid-Atlantic regions in which spring had arrived in the South and Mid-Atlantic, but not the Midwest. The lon-gest ACT-America flight to date lasted 9.2 hours and crossed 10 states between South Dakota and the Gulf of Mexico. All the measurements collected during the campaign will be used to improve numerical models of greenhouse gas fluxes and atmospheric transport, one of the most compelling issues in carbon cycle sci-ence. ACT-America will conclude with its fifth campaign in the summer of 2019.
NASA Airborne Science Program • Science

17
ORACLES
In early November 2018, the Observations of Aerosols Above CLouds and their InteractionS (ORACLES) team completed its third and final airborne science deployment; this was the second deployment based in the small island nation of São Tomé (the first deployment was based in Namibia in 2016). The overall goal of the ORACLES project is to study the interactions between clouds and biomass burning aerosols. São Tomé is located at the northern edge of the annual biomass burning aerosol plume that origi-nates on the African continent.
Southern Africa produces between one-third and one-half of the Earth’s biomass burning aero-sol particles, yet the fate of these particles and their influence on regional and global climate is poorly understood and, therefore, poorly rep-resented in models. ORACLES has input from teams with both regional and process modeling components. The data collected will be used to reduce uncertainty in both regional and global forecasts. The purpose of the three ORACLES airborne campaigns was to capture the seasonal cycle of absorbing aerosol radiative forcing and absorbing aerosol-cloud interactions, with the following overarching goals:
• Characterize the absorbing aerosol and cloud conditions and its variability over the south-east Atlantic from August through October, the main months in which substantial biomass burning aerosol is advected westward off of continental Africa.
PI – Paquita Zuidema (U Miami) and Robert Wood (U Washington)
Aircraft – P-3 Orion
• Determine the impact of African biomass burning aerosols on cloud properties and the radiation balance over the South Atlantic,
using state of the art in situ and remote sens-ing instruments to generate data sets that can also be used to verify and refine current and future observation methods.
• Acquire a process-level understanding of aerosol-cloud-radiation interactions and re-sulting cloud adjustments that can be applied in global models.
The P-3 platform began ORACLES integration in early August, with only one minor payload change: the Photo Thermal Interferometer (PTI; Brookhaven National Lab) was once again included (it did not fly in 2017). After its on-time arrival on September 24, the P-3 flew a total of 13 science flights (~105 hours). Approximately one-half of the flights followed a north-south line directly into the heart of the aerosol plume. (See Figure 11.) As in 2017, several flights were dedi-cated to sampling the same polluted air masses days apart, to gain information on aerosol aging. Two flights focused on radiation, and the remain-der were comprehensive surveys of the aerosol plume and cloud deck.
For the 2018 campaign, Dr. Robert Wood and Dr. Paquita Zuidema stepped in to share PI duties, following the departure from NASA of former PI Dr. Jens Redemann. They guided the team through a very successful deployment phase wrap-up. Over the entire mission, ORACLES completed 56 science flights and 447 hours of science flight. The project achieved its baseline science requirements after flying for two weeks in 2018, achieving 9 consecutive weeks of flight
Science
NASA Airborne Science Program • Science

18
FIGURE 11 P-3 and ER-2 flight tracks from three ORACLES deployments, overlaid on a VIIRS true color image taken on Sept. 13, 2018, showing a typical cloud deck and overlying (brown color) aerosol layer. Flight tracks shown are from 2016 (P-3: light blue; ER-2: green), 2017 (orange) and 2018 (dark blue).
coverage from August to October. The mission succeeded in acquiring detailed measurements of aerosol and cloud properties over an ex-tended region of the Southeast Atlantic, where there is a dearth of measurements and major disagreements between modeled climate effects of biomass burning aerosol.
Science highlights include: (a) the first mea-surements showing aerosol chemical aging on timescales of 3-8 days, whereby organic carbon is removed leaving behind more strong-ly sunlight-absorbing black carbon cores;
(b) new constraints on aerosol spectral absorp-tion from remote sensing using novel radiation flight maneuvers; (c) data indicating that much of the biomass burning aerosol entrained into the boundary layer within the stratocumulus deck is removed by precipitation as the cloud deck moves equator-ward, with an associated decrease in the mean cloud droplet number concentration; and (d) first mapping of seasonal differences in the biomass burning aerosol plume and its vertical structure. In addition, ORACLES was the first mission to empirically investigate the effects of the relative placement
NASA Airborne Science Program • Science

19
of cloud probes with respect to the leading edge of the wing, collecting unique data that will affect all future cloud probe missions.
This was the second campaign in São Tomé for most of the aircraft, science and ESPO teams. The Portuguese language and the availability of quality infrastructure presented occasional challenges to the team. The airport and civil aviation organizations alleviated this through their support and local communities were very welcoming. The hotel staff proved to be ex-tremely helpful in making connections outside the hospitality industry: shipping, customs, medical and governmental connections. Con-nections were established with the University of São Tomé and with the Meteorological officials at the airport, who assisted with forecasting local conditions. Weather conditions were expected to provide greater logistical challenges in 2018 than in 2017, due to the onset of the rainy sea-son on the African continent to the east/north-east and associated squall lines that can reach São Tomé. However, the team quickly became adept at forecasting evolving local conditions and only one hour of flight time was lost due to bad weather.
OMG
The objective of Oceans Melting Greenland (OMG) is to investigate the role of warmer, saltier Atlantic subsurface waters in Greenland glacier melting. The study will help pave the way for improved estimates of future sea level rise by observing changes in glacier melting where ice contacts seawater.
PI – Josh Willis (JPL) Aircraft – G-III, Basler/DC-3
OMG carried out its third surveys of both the oceans and the ice in 2018. With 25 feet of po-tential sea level rise locked away in the Green-land Ice sheet, this study will help understand how fast the oceans are eating away at the ice sheet from the edges and pave the way for im-proved estimates of future sea level. OMG flew two science flight missions in 2018: “GLISTIN-A” and “AXCTD”.
In March 2018, JPL’s Glacier and Land Ice Surface Topography Interferometer (GLISTIN-A) radar was installed on the JSC G-III. The GLISTIN-A, single-pass interferometer, made high-resolution, high-precision elevation mea-surements (yearly campaign three of four) of Greenland’s coastal glaciers. During the March deployment, GLISTIN-A conducted glacier sur-vey flights out of Kangerlussuaq (Sondrestrom Air Base), Keflavik (Iceland) and Thule Air Base (Greenland). GLISTIN-A acquired 81 out of 81 planned OMG science flight lines.
In late August and early September 2018, OMG installed JPL’s Airborne Expendable, Conduc-tivity Temperature Depth (AXCTD) system into a DC-3TP owned by Airtec. AXCTD probes are dropped from the aircraft into the ocean to measure ocean temperature and salinity on the ocean shelf. Because the aircraft was able to land on smaller, gravel runways, the crew and aircraft were able to stay in Greenland through-out the entire trip, removing the need to transit from Iceland, Svalbard or Canada, as in previous years. The aircraft deployed to Kulusuk in south-east Greenland for about one week, followed by one day in east Greenland before finishing the survey from Thule Air Base in Northwest Green-land. OMG deployed 239 AXCTD probes in Greenland this year and reached several fjords
Science
NASA Airborne Science Program • Science

20
in north Greenland that were too choked with ice for data collection in previous years. This was campaign three of five. Figure 12 shows the many locations of the sonde drops.
FIGURE 12 2018 AXCTD survey of the oceans around Greenland. Yellow dots show planned drops, green dots show completed drops. The two purple drops show the locations of the Alamo Probe drops. Unfortunately, the Alamo Probes failed after launch and did not return any data this year.
HyTES / HyspIRI
Since 2013, the continuing flights to record vegetation conditions in California and Hawaii have collected data as precursors to a satellite
PI – Simon Hook, JPLProgram – Terrestrial Ecology
Aircraft – ER-2
NASA Airborne Science Program • Science
mission carrying a hyperspectral sensor. Known as “HyspIRI prep” throughout the last decade, these data sets are not only invaluable for the eventual satellite comparison, but also provide important data on changing environmental conditions, especially in California. Previous year missions have relied primarily on the MASTER and AVIRIS instruments for multispectral measurements.
In January 2018 the instrument suite on the ER-2 aircraft was expanded to include the Hyperspec-tral Thermal Emission Spectrometer (HyTES) and the Portable Remote Imaging Spectrometer (PRISM), both developed by JPL. The 2018 payload provided simultaneous passive optical imaging from ultraviolet through infrared, per-haps the most extensive spectral coverage to date from any ER-2 campaign.
The ER-2 returned to Marine Corps Base Hawaii for flights over the erupting Kilauea volcano and Hawaiian coral reefs. The HYTES image (Figure 13) of the SO2 plume from Pu’u ‘O’o was ac-quired on January 18. The second image has been enhanced to highlight SO2 in the plume. The ER-2 flew nearly 60 hours in Hawaii during a one-month mission.
Back in California, the HyspIRI prep team completed the 2018 observations of 6 regions, including the HyTES payload, during nearly 120 hours of flight. Flight boxes are shown in Figure 14. Beginning in 2019, the California flight boxes will continue in preparation of for the Surface Biology and Geology (SBG) mission, which is currently in the definition stage. SBG is expected to be similar to what was proposed for HyspIRI.

21
FIGURE 13
FIGURE 14 HyspIRI flight boxes were flown multiple seasons in 2013, 2014 and 2015, and single seasons in 2016, 2017 and 2018.
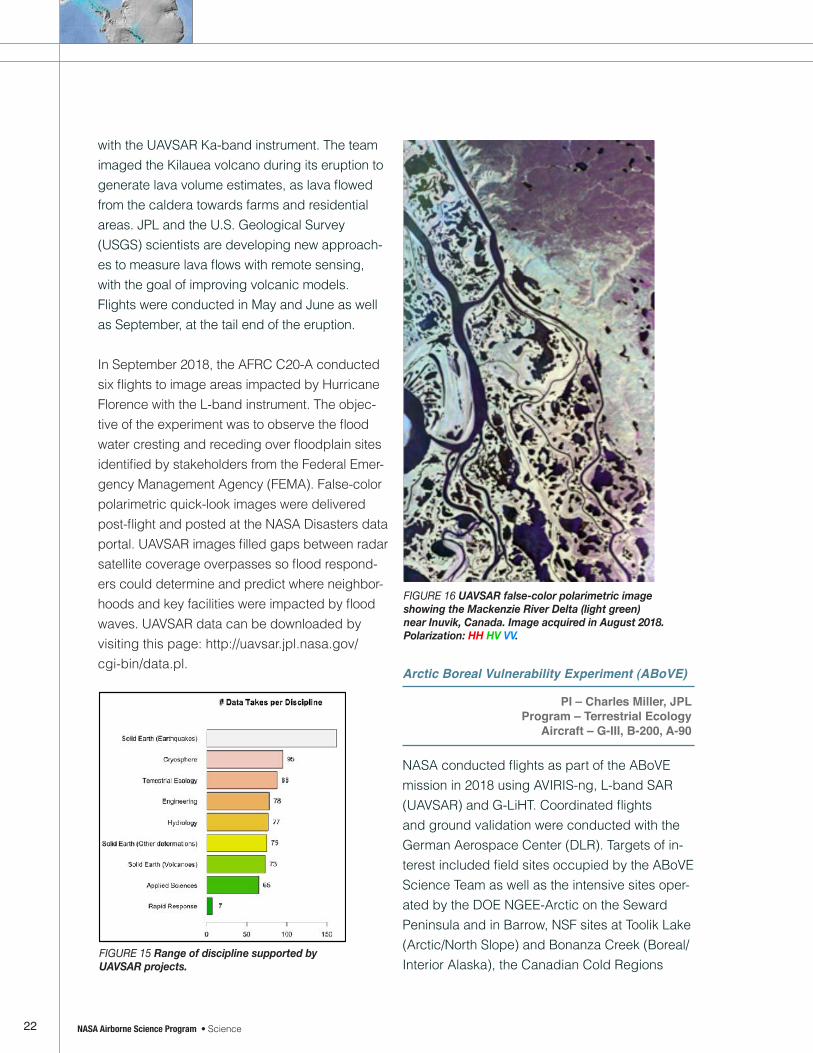
UAVSAR Data Acquisition and Delivery Metrics for FY18
During FY18, the UAVSAR project supported 16 flight requests and 12 principal investigators. The AFRC C-20A (NASA502) executed 43 sci-ence / engineering flights for a total of 207 flight hours. The JSC G-III (NASA992) conducted 35 science / engineering flights totaling 152 flight hours. During this period, 720 flight lines were collected. In 2018, all three radars flew with the following statistics: L-band flew 47 flights, Ka-band flew 25 flights and P-band flew 6 flights.
A breakdown of flight lines per discipline in Figure 15 shows the broad range of scientific studies that were supported by the UAVSAR instrument suite.
The L-band radar acquired a total of 10 TB of raw data with 96% success rate in data acquisi-tion. JPL delivered 359 PolSAR science prod-ucts, 134 requested InSAR pairs, and 48 re-quested InSAR stacks. L-band imagery from the
PI – Yunling LouProgram – Earth Surface and Interior
Aircraft – G-III
Science
NASA Airborne Science Program • Science
ABoVE mison is shown in Figure 16. The P-band radar acquired a total of 1.2 TB of raw data with 78% success rate in data acquisition, and de-livered 55 PolSAR science products. Finally, the Ka-band radar acquired a total of 6 TB of raw data with 96% success rate in data acquisition, and delivered 124 TopSAR science products.
The JSC G-III supported eight flights in Hawaii to produce high-resolution topographic maps
22
FIGURE 15 Range of discipline supported by UAVSAR projects.
with the UAVSAR Ka-band instrument. The team imaged the Kilauea volcano during its eruption to generate lava volume estimates, as lava flowed from the caldera towards farms and residential areas. JPL and the U.S. Geological Survey (USGS) scientists are developing new approach-es to measure lava flows with remote sensing, with the goal of improving volcanic models. Flights were conducted in May and June as well as September, at the tail end of the eruption.
In September 2018, the AFRC C20-A conducted six flights to image areas impacted by Hurricane Florence with the L-band instrument. The objec-tive of the experiment was to observe the flood water cresting and receding over floodplain sites identified by stakeholders from the Federal Emer-gency Management Agency (FEMA). False-color polarimetric quick-look images were delivered post-flight and posted at the NASA Disasters data portal. UAVSAR images filled gaps between radar satellite coverage overpasses so flood respond-ers could determine and predict where neighbor-hoods and key facilities were impacted by flood waves. UAVSAR data can be downloaded by visiting this page: http://uavsar.jpl.nasa.gov/cgi-bin/data.pl.
FIGURE 16 UAVSAR false-color polarimetric image showing the Mackenzie River Delta (light green) near Inuvik, Canada. Image acquired in August 2018. Polarization: HH HV VV.
Arctic Boreal Vulnerability Experiment (ABoVE)
NASA conducted flights as part of the ABoVE mission in 2018 using AVIRIS-ng, L-band SAR (UAVSAR) and G-LiHT. Coordinated flights and ground validation were conducted with the German Aerospace Center (DLR). Targets of in-terest included field sites occupied by the ABoVE Science Team as well as the intensive sites oper-ated by the DOE NGEE-Arctic on the Seward Peninsula and in Barrow, NSF sites at Toolik Lake (Arctic/North Slope) and Bonanza Creek (Boreal/Interior Alaska), the Canadian Cold Regions
PI – Charles Miller, JPLProgram – Terrestrial Ecology
Aircraft – G-III, B-200, A-90
NASA Airborne Science Program • Science

23
Hydrology sites in the Arctic tundra near Trail Valley Creek Northwest Territories (NT), the interdisciplinary science station at Scotty Creek NT, the Government of the Northwest Territories Slave River/Slave Delta watershed time series, the Kluane Lake Yukon Territory (YT) Research Station, and numerous forest and fire distur-bance plots maintained by the National Park Service, and the U.S. and Canadian Forestry Services.
NASA conducted AVIRIS-ng flights during July 21 through August 18, 2018. The primary mission goal was to obtain imagery over areas that were not imaged in 2017 due to weather conditions. Some flights were flown in “methane mode” over regions known or suspected to have high methane emissions. AVIRIS-ng data sets were collected as shown in Figure 17.
NASA conducted L-Band SAR (UAVSAR) flights during August 18-31, repeating lines flown during the 2017 campaign to establish a multi-year time series. Sites included the Boreal Ecosystem Research and Monitoring Sites (BERMS) site in Saskatchewan, the Peace-
Athabascan Delta, road-accessible sites near Yellowknife and Inuvik, and a subset of sites in Alaska and Yukon that were of greatest interest to the SAR Working Group. New flight lines were planned and executed in coordination with the German Aerospace Center (DLR). The BERMS site was flown in TomoSAR mode.
The DLR flew their F-SAR instrument over regions of the ABoVE domain in the Northwest Territories and Saskatchewan in August 2018. DLR and ABoVE will share airborne and ground validation data from the coordinated collections at the BERMS in Saskatchewan and at the Baker Creek watershed near Yellowknife, NT. G-LiHT conducted flights for ABoVE from July 13 to15. The A90 aircraft flew to the Tanana Valley to update data collected during the 2014 G-LiHT flights over forests that have since burned, and over Cold Regions Research and Engineer-ing Laboratory (CRREL) permafrost transects. The A90 also flew ABoVE requests in 2018 over Creamery Field near Fairbanks and Yukon Flats near Ft. Yukon. Weather did not permit collec-tions over Delta Junction sites in 2018, but these may be attempted in 2019.
FIGURE 17 AVIRIS-ng datasets collected during ABoVE 2018. Green lines indicate flight lines sucess-fully collected; yellow lines may be obscured by clouds; magenta lines were planned but not collected due to weather.
Science
NASA Airborne Science Program • Science

24 NASA Airborne Science Program • Science NASA Airborne Science Program • Science
Several missions flown during 2018 can be considered disaster response missions of opportunity. These were useful for providing post-event data. Some activities are sponsored by the Applied Science Program.
The G-III carrying GLISTIN-A flew multiple flight lines over the Kilauea volcano in Hawaii to map the evolving topography caused by lava flows and crater collapse.
G-LiHT returned to South Florida and Puerto Rico to survey post hurricane
recovery from HurricanesIrma and Maria.
PI: Paul LundgrenProgram: Earth Surface and Interior
Aircraft: G-III
PI: Bruce CookProgram: Terrestrial Ecology Rapid Response
Aircraft: A90
Disaster Response
FIGURE 18 GLISITN-A flight lines in Hawaii and corresponding lava map.
FIGURE 19 Puerto Rico G-LiHT phase one aerial RGB imagery.
Kilauea Eruption Response
Post-Hurricane Vegetation Monitoring

25NASA Airborne Science Program • Science
Science
NASA Airborne Science Program • Science
The C-20A carrying UAVSAR (L-band) obtained SAR imagery of flooding and damage following the deluge produced by Hurricane Florence in North Carolina.
The ER-2 flew MASTER over the fire scar caused by
the massive Thomas Fire in Southern California.
PI: Yunling LouProgram: Applied Science Disasters
Aircraft: C-20A
PI: Rob GreenProgram: ESD Research & Analysis
Aircraft: ER-2
Hurricane Florence Damage Assessment
FIGURE 21 The upper image is the standard Color Infrared (CIR) composite; the lower is the Burned Area Emergency Response (BAER) composite, as used by the USFS.
FIGURE 20 UAVSAR false color polarimetric image over the Pee Dee River. Colors refer to polarization.
Thomas Fire Damage Assessment

26 NASA Airborne Science Program • Science
Support to ESD Satellite Missions, including 2007 Decadal Survey Missions
A primary purpose of the Airborne Science Program is to support Earth Science space flight missions, including satellite missions and missions flying on the International Space Station (ISS). This support includes airborne campaigns to collect data for algorithm
development prior to launch, to test instrument concepts for satellite and ISS payloads or airborne simulators, and to provide data for calibration or validation of satellite algorithms, measurements or observations once in orbit. In 2018, ASP provided support to Earth Science missions as listed in Table 7. This included significant flight hours for several missions, especially
TABLE 7 Satellite / Space Mission Support.
NASA Airborne Science Program • Science

27NASA Airborne Science Program • Science
Science
NASA Airborne Science Program • Science
PI – Jay Al-Saadi, LaRCProgram – Tropospheric Chemistry
Aircraft – Guardian, B-200
LISTOS
The summer 2018 Long Island Sound Tropo-spheric Ozone Study (LISTOS) was designed to improve the understanding and forecasting of poor air quality associated with high surface ozone concentrations in the Long Island Sound region. It was conducted with several federal, regional, state, local and university partners. NASA’s involvement included extensive airborne remote sensing measurements, deployment and operation of two ground-based ozone lidar systems, ozone sonde launches, and support of a ground-based network of NASA-developed Pandora remote sensing instruments. Partners
ICESat-2, which launched in 2018. GEDI and ECOSTRESS also launched in 2018.
In 2018, some airborne process missions also collected data that will be valuable for future missions. TEMPO is scheduled to launch as early as 2019, and NISAR and SWOT are expected to launch in 2021. Future missions include a HyspIRI-like mission, now identified as Surface Biology and Geology (SBG). In addition, missions that collected CO2 measure-ments are relevant to OCO-2, Suomi-NPP, and future missions to measure greenhouse gases.
Two airborne missions described below are the Long Island Sound Tropspheric Ozone Study (LISTOS) that supports TEMPO and TROPOMI, and Aerosol Characterization from Polarimeter and Lidar (ACEPOL), which flew a variety of polarimeters in support of CALIPSO and in advance of NASA’s Plankton, Aerosol, Cloud, ocean Ecosystem (PACE) mission.
provided continuous forecasting and analysis support, airborne in-situ measurements, and extensive measurements from ground sites, two mobile labs, and two ships.
A goal of NASA’s involvement in LISTOS is improving the ability of the public to use air qual-ity information from satellites, in particular the upcoming measurements from the Tropospheric Emissions: Monitoring Pollution (TEMPO) mis-sion. The NASA LISTOS flights used two instru-ments that are airborne simulators for TEMPO: the GEO-CAPE Airborne Simulator (GCAS) and the Geostationary Trace Gas and Aerosol Sensor Optimization (GeoTASO). Funding from NASA’s GEO-CAPE Mission Study supported the LISTOS flights. A unique aspect of the LISTOS campaign was the ability to make measurements through the entire summer. By basing from LaRC and having flexibility to use either GCAS or GeoTASO on multiple aircraft, the team was able to con-duct 30 flights totaling 140 flight hours during 15 sampling days from mid-June through mid-September while adapting to other scheduled usage of LaRC aircraft. This flexibility allowed a wide range of weather conditions to be sampled through the summer, including classic heat waves resulting in unhealthy ozone throughout the region, other weather patterns resulting in more localized high ozone and relatively clean background conditions.
LISTOS measurements are also being used to help with validation of data products from the new TROPOspheric Monitoring Instrument (TROPOMI) on the European Space Agency Sentinel-5 Precursor satellite launched last fall. While TROPOMI provides air quality measure-ments with a factor of 10 improvement in spatial resolution over previous satellites, its observa-tions from low Earth orbit occur only once each

28 NASA Airborne Science Program • Science
day. Geostationary TEMPO observations will provide hourly measurements through the day at similar spatial resolution to TROPOMI. The airborne GCAS and GeoTASO observations mapped the LISTOS domain up to four times per day, providing researchers and air quality man-agers with TEMPO-like data so they can improve preparations for using TEMPO data.
Phase 1 of LISTOS, during June, used GeoTASO on the LaRC HU-25A Guardian aircraft. In addi-tion to mapping the LISTOS domain, the range of the Guardian allowed these flights to also map pollutants in the Baltimore area in support of NASA’s OWLETS-2 air quality campaign (PI – Hanisco). Phase 2, July through early Septem-ber, used GCAS on the LaRC B-200 King Air
FIGURE 22 NASA Goddard’s Peter Pantina, left, and Langley’s Laura Judd make final checks of the GEO-TASO instrument on the HU-25A aircraft before a flight.
aircraft. In addition to GCAS, the capability of the B-200 also allowed inclusion of the new High Altitude Lidar Observatory (HALO) instrument (IIP project, PI – Nehrir) to provide information on aerosol vertical distribution and the mixing depth of pollutants. This information, critical for accurately inferring surface concentrations from the satellite remote sensing measurements, is also especially helpful for analysis of air quality events in coastal regions, such as Long Island Sound. Phase 3 of LISTOS, which completed in September, flew the B-200 with GeoTASO and a new Multi-axis Optical Airborne Tracker (MOAT). MOAT allows improved GeoTASO zenith measurements, providing data very useful for ongoing testing of new TEMPO algorithms for re-trieving ozone vertical profile in the troposphere.
NASA Airborne Science Program • Science

29NASA Airborne Science Program • Science
ACEPOL
The ER-2 flight campaign called Aerosol Characterization from Polarimeter and Lidar (ACEPOL) sought to test capabilities of several proposed instruments for the Aerosol-Cloud-Ecosystem (ACE) mission, a 2007 Decadal Survey mission in pre-formulation phase. The new 2017 Decadal Survey replaces ACE with a similar mission called Aerosols and Clouds, Convection and Precipitation (ACCP). In addi-tion, the NASA PACE mission will measure aerosols and needs similar instruments. The ACEPOL mission flew nine flights in November 2017 observing targets including California’s Central Valley and the Pacific Ocean, and as far east as Arizona, where the team observed smoke from controlled forest fires near Flagstaff.
Science
NASA Airborne Science Program • Science
FIGURE 23 HSRL-2 preliminary data from the ER-2 ACEPOL flight on Nov. 7 showing the structure of aerosol and clouds in the atmosphere along the flight track. The ground is black, dark blue indicates clear air and white indicates water clouds. Transparent cirrus clouds high in the atmosphere show up in yellow and orange. Yellow, green and blue at lower altitudes indicate aerosols.
PI – Felix SeidelProgram – Upper Atmosphere Radiation Program
Aircraft – ER-2
The ER-2’s payload included four airborne polarimeters (AirHARP, AirMSPI, AirSPEX and RSP) and two lidar instruments (CPL and HSRL-2). Each of the polarimeters used different techniques and angles to measure and record data. The instruments also differed from one another in size and power. From an engineering perspective, the ultimate goal of the ACEPOL mission was to better understand how those overall differences translate into data collection.
The combination of the polarimeter and lidar instruments, along with ground-based data from stationary air quality measurement stations provide scientists with a more complete picture of the three-dimensional distribution of aerosols in Earth’s atmosphere. Utilizing a variety of differ-ent approaches for collecting data also enables scientists to differentiate various types of aerosols (e.g., smoke, dust, pollution) and clouds (cirrus, stratus, etc.).

30 NASA Airborne Science Program • Science
The ER-2, based at AFRC, was chosen be-cause its high altitude flight regime provides a vantage point and conditions similar to space. By flying these instruments on an aircraft before the expense of launching them into space, scientists and engineers can make adjustments to the hardware and data retrieval algorithms. The aircraft test phase in sensor development is helpful for ensuring instruments are collecting both accurate and useful data prior to the time the final version of the sensors makes its trip into space.
In addition to testing capabilities of new sen-sors, ACEPOL flights provided calibration and evaluation data for NASA’s CALIPSO satellite lidar by staging satellite underpasses as part of their flight plans. In addition to comparisons with CALIPSO, ACEPOL also contributes to the development of future satellite missions includ-ing the European Space Agency’s EarthCare, the European Organization for the Exploitation of Meteorological Satellites METOP-SG , and NASA’s MAIA and PACE programs.
The ACEPOL mission involved partnership be-tween multiple NASA centers, including LaRC, GSFC, JPL and the Goddard Institute for Space Studies. The mission also included international
partnership with the Netherlands Institute for Space Research, which flew the AirSPEX instru-ment on board the ER-2 for the second time.
Support to Instrument Development
Another major element of the ASP program is the support of instrument development for Earth Science. Some instruments are developed specifically for airborne utilization, while many are developed as precursors or simulators for satellite instruments. In 2018, ASP aircraft flew all of the instruments listed in Table 8. Many of these instruments have been developed under sponsorship of NASA’s Earth Science Technol-ogy Office (ESTO) Instrument Incubator Pro-gram (IIP) and Airborne Instrument Technology Transition Program (AITT). ESTO demonstrates and provides technologies that can be reliably and confidently applied to a broad range of science measurements and missions. Through flexible, science-driven technology strategies and a competitive selection process, ESTO-funded technologies support numerous Earth and space science missions.
A large number of other IIP-selected instru-ments are also scheduled for test flights in 2019 and 2020, as shown in the 5-year plan (Appendix A).
NASA Airborne Science Program • Technology

31NASA Airborne Science Program • Science
TABLE 8 Instrument Development Flights in FY18.
Technology
NASA Airborne Science Program • Technology
AITT Progress
The AITT program is designed to fund matura-tion of newly developed aircraft instruments, such as prototypes developed through the ESTO IIP program. The program provides campaign-ready airborne instrumentation that can participate in field experiments, evaluate new satellite instrument concepts, and provide calibration and validation of satellite instru-ments. Past examples are the 4STAR radio-meter, PRISM and the 3-frequency weather radar.
In FY18, three instruments began, continued, or completed their transition to more capable missions or higher altitude aircraft, making them more useful for some types of missions.
Air-LUSI
The objective of airborne LUnar Spectral Irradi-ance (air-LUSI) mission is to provide NASA a capability to measure exo-atmospheric lunar spectral irradiance with unprecedented accu-racy. Careful characterization of the Moon from above the atmosphere will make it a stable and consistent SI-traceable absolute calibration ref-erence. This could revolutionize lunar calibration for some Earth observing satellites and would be especially beneficial to ocean color missions, such as the upcoming PACE and JPSS (VIIRS) missions, and retrospectively for the SeaWiFS, EOS (MODIS), and S-NPP (VIIRS) data records.
PI – Kevin Turpie, UMBCProgram – AITTAircraft – ER-2

32 NASA Airborne Science Program • Technology
Air-LUSI approaches this characterization by taking lunar spectral irradiance measurements at high-altitude on the ER-2 aircraft. This is accom-plished with a non-imaging telescope to collect moonlight, which is passed to a NIST-calibrated spectrometer (called the IRradiance Instrument Subsystem or IRIS) via fiber optics. The spec-trometer and an on-board validation reference are hermetically sealed in an enclosure made of two solid blocks of aluminum, keeping the spec-trometer and reference at constant sea-level pressure and 20°C during the high altitude flight. The Autonomous, Robotic TElescope Mount Instrument Subsystem (ARTEMIS) keeps the telescope pointed at the Moon using a camera to track the sky in front of the telescope. (See Figure 24.)
After a year of design and development, air-LUSI executed its first test flight at AFRC on August 1 and 2 between the hours of 3 a.m. and 5 a.m. The results exceed expectations. During its test flights, the ARTEMIS subsystem kept the IRIS telescope locked onto the Moon to within 0.1° on average and the IRIS enclosure kept the spectrometer and validation reference solidly at sea-level pressure and 20°C. The measurements recorded during these flights showed very high signal-to-noise ratio and sensitivity to the lunar spectrum. The air-LUSI team is now analyzing this and the engineer-ing data and preparing for their demonstration flights early in 2019.
FIGURE 24 Air-LUSI IRIS telescope on ARTEMIS mount in ER-2 wing pod tail.
NASA Airborne Science Program • Technology

33NASA Airborne Science Program • Technology
Technology
NASA Airborne Science Program • Technology
FIGURE 25 Test flight on the CIRPAS Twin Otter over Moss Landing and coastal Monterey Bay. CIRPAS meteorology probes can be seen on the wing tip supporting the science data collection.
C-HARRIER
The C-HARRIER (Coastal High Acquisition Rate Radiometers for Innovative Environmental Re-search) project continued development in 2018. The radiometer instrument system is aligned with present and next-generation satellite bio-optical observations for coastal and ocean biology water quality research, and it utilizes advanced airborne microradiometer technology, which will support new satellite-based algorithms and observations for NASA’s Ocean Biology and Biogeochemistry research program in Earth Sci-ence. C-HARRIER flew in October on the Navy’s CIRPAS Twin Otter to collect data for water quality and aerosol optical depth of Southern California, Monterey Bay and Lake Tahoe sites. (See Figure 25.) The instruments include the ARC C-AIR radiometer and 3STAR sun tracking radiometer (sun photometer) and GSFC C-AERO radiometers.
DopplerScatt
JPL’s DopplerScatt instrument, designed to mea-sure ocean surface currents, has graduated from IIP to AITT and now on to collaborative science measurements. Two missions were carried out in 2018, one in the Gulf of Mexico in March, and the second in the Pacific in August. In the first mission, JPL, in collaboration with Chevron, was benchmarking DopplerScatt’s surface current measurements against ground-truth data from Chevron. DopplerScatt conducted survey flights March 23-29 over the Gulf of Mexico, while the Loop Current is active in the far north of the Gulf near New Orleans. The flights were conducted over areas where Chevron already measures surface currents with assets such as drifters, acoustic Doppler current profilers (ADCPs) and ROCIS (an airborne optical imager). The collaboration and deployment specifics were worked out efficiently and
PI – Liane Guild, ARCProgram – AITT
Aircraft – CIRPAS Twin Otter
PI – Dragna Perkovic-Martin, JPLProgram – AITTAircraft – B-200

34
FIGURE 26 The AFRC B-200 flew DopplerScatt on multiple missions in 2018.
NASA Airborne Science Program • Technology
DopplerScatt team members deployed to the field on March 23 and executed four flights between March 24 and March 27.
During the deployment, DopplerScatt trialed a new real-time processor and real-time map display as part of the AITT milestone verification. These new features enabled situational aware-ness of operators and faster quick-look ground post-processing.
DopplerScatt surface current estimates are being compared to the in-situ data provided by Chevron as well as to the ROCIS sensor data. The ROCIS data is of particular interest, as it is the first comparison of current measurements at the very surface of the water (top few millimeters as opposed to slightly deeper currents measured by other sensors). Strong loop currents can pose safety risks to offshore operations. DopplerScatt’s estimates of surface currents could be used to inform offshore operations. This deployment was a huge team effort including teams from AFRC, Chevron and DopplerScatt/JPL.
For the August mission, the DopplerScatt team collaborated with Florida State University, University of Washington and Scripps Institute of Oceanography, in a deployment to the Pacific (Southwest of the San Francisco Bay) to observe submesoscale processes. DopplerScatt con-ducted survey flights August 20-24 over the area where novel ultra-thin drifters were deployed by the FSU and UW from the research vessel Shana Rae.
DopplerScatt team members and a summer student deployed in the field on August 20 and executed five flights between August 20 and 24 with flying 2 sorties on August 24. During the deployment DopplerScatt collected data con-tinuously during the flights. The winds were low (1-3 m/s) until August 24 when they picked up to ~ 6m/s in the afternoon. DopplerScatt surface current estimates will now be compared to the in-situ data provided by the FSU and UW. DopplerScatt is planned to be used in early SWOT pre-cursor cal/val missions.
NASA Airborne Science Program • Science

35
Mission Aircraft Location
CAMP2EX P-3 Philippines
FIREX-AQ DC-8 Idaho, Kansas
Operation IceBridge DC-8, P-3 Antarctic, Arctic
ACT-America B-200, C-130 Midwest, South U.S.
OMG C-20A, G-III, DC-3 Greenland
SWOT cal/val experiment G-V Pacific off San Francisco
NASA Airborne Science Program • Technology
Science
NASA Airborne Science Program • Science
Upcoming Missions
Major upcoming missions are described below and listed in Table 9.
Cloud and Aerosol Monsoonal Processes - Philippines Experiment (CAMP2EX)
The science objectives of CAMP2Ex are: 1. Determine the extent to which aerosol par-ticles are responsible for modulating warm and mixed phase precipitation in tropical environ-ments. 2. Understand how the presence of aerosol particles, and the resulting increase in cloud droplet number, changes the heat budget in convective clouds, and whether this change controls which clouds grow into large thunder-storms. 3. Characterize the aerosol lifecycle in the Southwest Monsoon, recognizing that aero-sol induced changes in clouds and precipitation may very well feed back into aerosol production, transport and removal.
The mission will deploy an instrumented P-3 from Cebu, Philippines and fly inside the Philip-pines flight information region (FIR) with pos-sible flights to Singapore. The payload includes APR-2, LARGE, HSRL, 4STAR, BBR, SSFR and Cloud Polarimeter. This mission is scheduled for July-August 2019.
FIREX-AQ
FIREX-AQ is a mission sponsored by NASA’s Atmospheric Composition and Chemistry pro-gram. It will fly in summer 2019 on the DC-8, based first out of Boise, Idaho, and later out of Salinas, Kansas, so as to reach multiple regions of the U.S. where fires may be burning. The DC-8 will carry a complete chemistry payload, similar to SEAC4RS, which flew in 2013. It will also carry the MASTER thermal NASA imager. This is a joint mission with NOAA’s FASMEE mission, which will be sampling additional chemistry from a Citation at more limited range.
FIREX-AQ will investigate both wild and pre-scribed burn fires. The overarching objective of FIREX-AQ is to provide measurements of trace gas and aerosol emissions in great detail, relate them to the fuel and fire conditions at the point of emission, characterize the conditions relat-ing to plume rise, follow plumes downwind to understand the chemical transformation and air quality impacts, and assess the efficacy of satel-lite detections for estimating the emissions from sampled fires..
TABLE 9 Major Missions Upcoming in 2019.
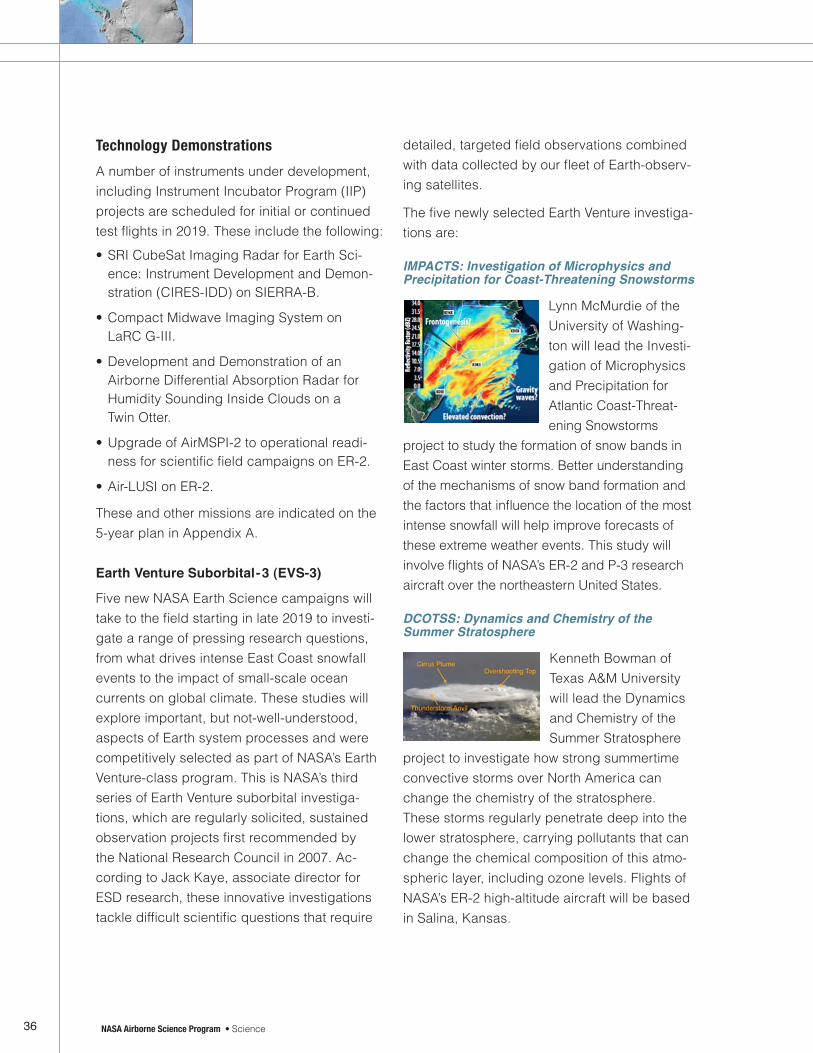
36 NASA Airborne Science Program • Science
Technology Demonstrations
A number of instruments under development, including Instrument Incubator Program (IIP) projects are scheduled for initial or continued test flights in 2019. These include the following:
• SRI CubeSat Imaging Radar for Earth Sci-ence: Instrument Development and Demon-stration (CIRES-IDD) on SIERRA-B.
• Compact Midwave Imaging System on LaRC G-III.
• Development and Demonstration of an Airborne Differential Absorption Radar for Humidity Sounding Inside Clouds on a
Twin Otter.
• Upgrade of AirMSPI-2 to operational readi-ness for scientific field campaigns on ER-2.
• Air-LUSI on ER-2.
These and other missions are indicated on the 5-year plan in Appendix A.
Earth Venture Suborbital-3 (EVS-3)
Five new NASA Earth Science campaigns will take to the field starting in late 2019 to investi-gate a range of pressing research questions, from what drives intense East Coast snowfall events to the impact of small-scale ocean currents on global climate. These studies will explore important, but not-well-understood, aspects of Earth system processes and were competitively selected as part of NASA’s Earth Venture-class program. This is NASA’s third series of Earth Venture suborbital investiga-tions, which are regularly solicited, sustained observation projects first recommended by the National Research Council in 2007. Ac-cording to Jack Kaye, associate director for ESD research, these innovative investigations tackle difficult scientific questions that require
detailed, targeted field observations combined with data collected by our fleet of Earth-observ-ing satellites.
The five newly selected Earth Venture investiga-tions are:
IMPACTS: Investigation of Microphysics and Precipitation for Coast-Threatening Snowstorms
Lynn McMurdie of the University of Washing-ton will lead the Investi-gation of Microphysics and Precipitation for Atlantic Coast-Threat-ening Snowstorms
project to study the formation of snow bands in East Coast winter storms. Better understanding of the mechanisms of snow band formation and the factors that influence the location of the most intense snowfall will help improve forecasts of these extreme weather events. This study will involve flights of NASA’s ER-2 and P-3 research aircraft over the northeastern United States.
DCOTSS: Dynamics and Chemistry of the Summer Stratosphere
Kenneth Bowman of Texas A&M University will lead the Dynamics and Chemistry of the Summer Stratosphere
project to investigate how strong summertime convective storms over North America can change the chemistry of the stratosphere. These storms regularly penetrate deep into the lower stratosphere, carrying pollutants that can change the chemical composition of this atmo-spheric layer, including ozone levels. Flights of NASA’s ER-2 high-altitude aircraft will be based in Salina, Kansas.
NASA Airborne Science Program • Science

37NASA Airborne Science Program • Science
Science
NASA Airborne Science Program • Science
S-MODE: Submesoscale Ocean Dynamics and Vertical Transport
Thomas Farrar of Woods Hole Oceano-graphic Institute will lead the Submesoscale Ocean Dynamics and Vertical Transport
investigation to explore the potentially large influence that small-scale ocean eddies have on the exchange of heat between the ocean and the atmosphere. The project will collect a benchmark data set of climate and biological variables in the upper ocean that influence this exchange. Measurements will be collected by research aircraft and shipborne instruments 200 miles off the coast of San Francisco, in the vicinity of the SWOT cross-over tracks.
ACTIVATE: Aerosol Cloud Meteorology Interac-tions over the Western Atlantic Experiment
Armin Sorooshian of the University of Arizona will lead the Aerosol Cloud Meteorology In-
teractions over the Western Atlantic Experiment to identify how aerosol particles change cloud properties in ways that affect Earth’s climate system. The investigation will focus on marine boundary layer clouds over the western North Atlantic Ocean that have a critical role in our
planet’s energy balance. Two NASA research aircraft, an HU-25 Falcon and a B-200 King Air, will fly from NASA’s Langley Research Center in Hampton, Virginia, to gather measurements from above, below and within.
Delta-X
Marc Simard of NASA’s Jet Propul-sion Laboratory in Pasadena, California, will lead the Delta-X investigation to better
understand the natural processes that maintain and build land in major river deltas threatened by rising seas. The project will improve mod-els that predict loss of coastal land from sea level rise by improving estimates of how deltas add land—a process that involves trapping sediments and creating organic soils as plants grow. Delta-X will focus on the Mississippi River Delta using instruments on three NASA re-search aircraft.
A total of six NASA centers and 27 educational institutions are participating in these five Earth Venture projects. The five-year investigations were selected from 30 proposals. The Delta-X project is funded at a total cost of no more than $15 million; each of the other projects is funded at no more than $30 million. The tentative flight schedule is shown in Figure 27.
FIGURE 27 EVS-3 Missions, aircraft and tentative flight schedules.

NASA maintains and operates a fleet of highly modified aircraft unique in the world for their ability to support Earth observations. The aircraft are based at various NASA centers.
TABLE 10 Airborne Science Program Aircraft and their Performance Capabilities.
4. Aircraft
4.Ai
rcra
ft
38 NASA Airborne Science Program • Aircraft
Some of the platforms have direct support from ASP for flight hours and personnel. These are the “ASP-supported Aircraft.”

39
Other NASA aircraft are also available for science missions. In addition, NASA missions employ commercial air services (CAS) under protocols established by NASA’s Aircraft Office at Headquarters.
More information about using the aircraft can be found on the ASP website at airbornescience.nasa.gov. The annual “call letter” is an excellent source of
information on how to request airborne services. This letter can also be found on the website.
The capabilities of the ASP fleet range from low and slow to high and fast, with a wide variety of payload capacities. The aircraft and their performance characteristics are listed in Table 10. The altitude / endurance characteristics are also shown in Figure 28; altitude/range in Figure 29.
NASA Earth Science Research Capable Aircraft
FIGURE 28 NASA Aircraft showing altitude and endurance capabilities.
NASA Airborne Science Program • Aircraft

40 NASA Airborne Science Program • Aircraft
NASA Earth Science Research Capable Aircraft
FIGURE 29 NASA Aircraft showing altitude and range capabilities.
New Program Capabilities Two new science-capable platforms are now included on the aircraft schedule: a G-V at JSC and a new G-III at LaRC.
ASP-Supported Aircraft The seven aircraft systems directly supported in 2018 (subsidized flight hours) by the Airborne Science Program are the DC-8 flying laboratory, (2) ER-2 high altitude aircraft, P-3 Orion, C-20A (G-III), the JSC G-III and the JSC G-V.
NASA Airborne Science Program • Aircraft

41NASA Airborne Science Program • Aircraft
Aircraft
NASA Airborne Science Program • Aircraft
DC-8 Airborne Laboratory OPERATING CENTER: Armstrong Flight Research Center
AIRCRAFT DESCRIPTION: The DC-8 is a four-engine jet aircraft with a range in excess of 5,000 nm, a ceiling of 41,000 feet and an experiment payload of 30,000 lb
(13,600 kg). This aircraft, extensively modified as a flying laboratory, is operated for the benefit of airborne science researchers.
MODIFICATIONS MADE IN FY18 AND IMPACTS ON PERFORMANCE AND SCIENCE: DC-8 had no major modifications in FY18.
FIGURE 30 The DC-8 was filled with instruments during ATom.
WEBSITE: airbornescience.nasa.gov/aircraft/DC-8
DC-8 FY18 Missions
SCIENCE FLIGHT HOURS IN FY18: 279

42
WEBSITE: airbornescience.nasa.gov/aircraft/ER-2
NASA Airborne Science Program • Aircraft
ER-2
OPERATING CENTER: Armstrong Flight Research Center
AIRCRAFT DESCRIPTION: The ER-2 is a civilian version of the Air Force’s U2-S reconnaissance platform. NASA operates two ER-2 aircraft. These high-altitude aircraft are
used as platforms for investigations at the edge of space.
SCIENCE FLIGHT HOURS IN FY18: 279.5
ER-2 FY18 Missions
MODIFICATIONS MADE IN FY18 AND IMPACTS ON PERFORMANCE AND SCIENCE: ER-2 809 is currently being reintegrated after undergoing Cabin Altitude Reduction Effort (CARE) modification to structurally modify NASA ER-2 aircraft to reduce cockpit cabin altitude from 29,000 to 15,000 feet when the aircraft is
FIGURE 31 NASA ER-2 flew HyTES in Hawaii in 2018.
cruising at 65,000 feet. This is to reduce likeli-hood of decompression sickness, fatigue and risk of permanent neurological injury. A similar cabin altitude reduction effort will be performed on NASA #806 in FY19.
NASA Airborne Science Program • Aircraft

43NASA Airborne Science Program • Aircraft
Aircraft
NASA Airborne Science Program • Aircraft
P-3 Orion
AIRCRAFT DESCRIPTION: The P-3 is a four-engine turboprop aircraft de-signed for endurance and range and is capable of long duration flights. The P-3 has been
MODIFICATIONS MADE IN FY18 AND IMPACTS ON PERFORMANCE AND SCIENCE:Nadir Port #3 was modified to include a new 16-inch diameter aperture glass window inter-face and the addition of three 5-inch diameter ports on the nadir plate. Custom Nadir Port #3 cover plates can be manufactured to support a variety of science instrument needs for this port location.
FIGURE 32
extensively modified to support airborne science-related payloads and activities.
SCIENCE FLIGHT HOURS IN FY18: 390.0
SIGNIFICANT UPCOMING MAINTENANCE PERIODS: • 6-8 week annual maintenance period each year that can be adjusted to meet mission needs. • Landing gear gear change October – early Novermber 2019 (2-3 month effort)• Phased Depot Maintenance (PDM) 2021 (4-6 month effort)
WEBSITE: airbornescience.nasa.gov/aircraft/P-3_Orion
P-3 Orion FY18 Missions
OPERATING CENTER: WGoddard Space Flight Center’s Wallops Flight Facility (WFF)

44 NASA Airborne Science Program • Aircraft
C20-A (Armstrong G-III)
OPERATING CENTER: Armstrong Flight Research Center
AIRCRAFT DESCRIPTION: The Gulfstream III is a business jet with routine flight at 40,000 feet. Both the AFRC and JSC platforms have been structurally modified and instrumented to serve as multi-role cooperative platforms for the Earth science research commu-nity. Each can carry a payload pod for the three
versions of JPL’s UAVSAR instrument (L-band, P-band, Ka-band). Both aircraft are part of the ASP-supported fleet. Beginning in 2019, a third G-III will be available at LaRC.
SCIENCE FLIGHT HOURS IN FY18: C-20A: 241.6
C20-A (G-III) FY18 Missions
WEBSITE: airbornescience.nasa.gov/aircraft/G-III_C-20A_-_Armstrong
FIGURE 33 During ABoVE, the UAVSAR team met with Canadian students in Yellowknife.
MODIFICATIONS MADE TO THE C20-A AIRCRAFT IN FY18: In FY18 the only modification was the addition of an air data probe located on the left side of the jet, which is for the collection of aerobiological particles during flight.
NASA Airborne Science Program • Aircraft
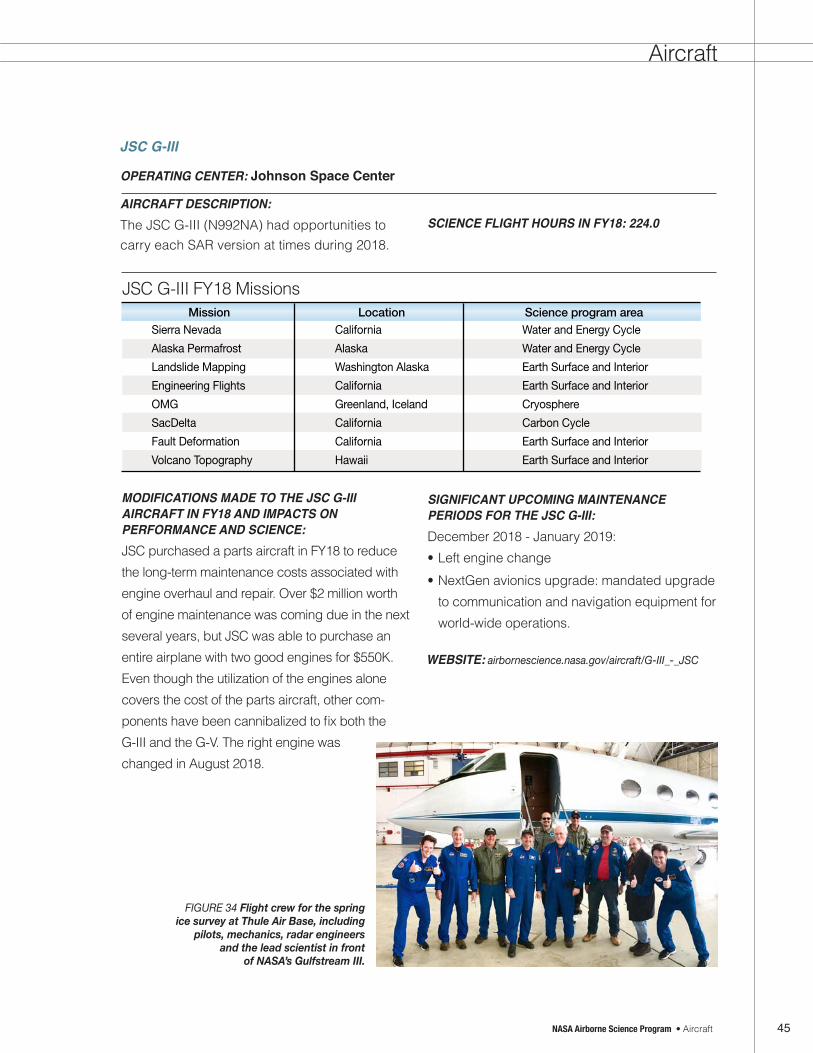
45NASA Airborne Science Program • Aircraft NASA Airborne Science Program • Aircraft
FIGURE 34 Flight crew for the spring ice survey at Thule Air Base, including
pilots, mechanics, radar engineers and the lead scientist in front
of NASA’s Gulfstream III.
Aircraft
OPERATING CENTER: Johnson Space Center
AIRCRAFT DESCRIPTION: The JSC G-III (N992NA) had opportunities to carry each SAR version at times during 2018.
SCIENCE FLIGHT HOURS IN FY18: 224.0
MODIFICATIONS MADE TO THE JSC G-III AIRCRAFT IN FY18 AND IMPACTS ON PERFORMANCE AND SCIENCE:JSC purchased a parts aircraft in FY18 to reduce the long-term maintenance costs associated with engine overhaul and repair. Over $2 million worth of engine maintenance was coming due in the next several years, but JSC was able to purchase an entire airplane with two good engines for $550K. Even though the utilization of the engines alone covers the cost of the parts aircraft, other com-ponents have been cannibalized to fix both the G-III and the G-V. The right engine was changed in August 2018.
SIGNIFICANT UPCOMING MAINTENANCE PERIODS FOR THE JSC G-III:December 2018 - January 2019:• Left engine change• NextGen avionics upgrade: mandated upgrade
to communication and navigation equipment for world-wide operations.
JSC G-III FY18 Missions
WEBSITE: airbornescience.nasa.gov/aircraft/G-III_-_JSC
JSC G-III

46
• Completed the design, analysis and fabrica-tion of the two equipment racks that provide the power and data interface between the aircraft and science equipment.
• Completed the design and analysis of a ge-neric window pack assembly that interfaces with the nadir portals. The pack incorporates a single pane window that is similar in design and stress criteria to other airborne science platforms. Even though the cabin pressure differential is higher on the G-V than these aircraft, the overall design approach is con-sistent with the P-3 and DC-8 with the goal of minimizing the effort to transfer payloads between aircraft.
• Wrote the statement of work and awarded contract to install nadir portals on the G-V.
• The G-V has its first approved flight request (195001). The JSC team is working with Scripps Institution of Oceanography and JPL on the design and integration of the payload into the G-V. First flights are in early 2019.
.
NASA Airborne Science Program • Aircraft
New JSC G-V Aircraft (N95NA)
The G-V spent the month of January 2018 in Longview, Texas at Aerosmith Aviation and received a new coat of paint. The new paint job is instrumental in preventing structural corrosion and damage to maintain the long term health of the aircraft. The paint job was original to the aircraft and not a NASA livery.
JSC completed the following work in FY18 to prepare the aircraft as a platform for the air-borne science community.
• Relocated the radar altimeter, VHF and DME antennas on the bottom of the aircraft to provide the fuselage “real estate” for the nadir portal installation.
• Modified the forward cabin floor structure to support airborne science payloads. (Without this modification, the sensors and instruments would not have a clear field of view from the cabin to the nadir portals.)
• Installed seat track throughout the cabin so that payload equipment and racks can be installed anywhere in the G-V.
FIGURE 35 NASA G-V with JSC Aircraft Team.
NASA Airborne Science Program • Aircraft

47NASA Airborne Science Program • Aircraft NASA Airborne Science Program • Aircraft
Aircraft
New LaRC G-III Aircraft
FIGURE 36 NASA 520, a new G-III at LaRC.
The G-III (C-20B) aircraft will replace NASA Lang-ley’s existing Dassault HU-25A Guardian aircraft for airborne science as soon as practical. An en-gine hush kit has already been installed, enabling the G-III aircraft to be Stage III noise compliant. This modification allows the aircraft to deploy na-tionwide and worldwide without requiring engine noise waivers. In addition, two nadir portals are being installed under contract. The nadir portals (each 18.16-inch x 18.16-inch with external shut-ters) will allow the aircraft to install Earth science sensors, as is currently possible with the center’s two B-200 King Air aircraft and the HU-25A air-craft. The aircraft can be equipped with pressure domes over the portals such that instruments can
be flown open to the atmosphere. A total of six Researcher Interface Panels are planned for the passenger cabin, which will accommodate up to 10 researchers. The research system will also accommodate the NASA Airborne Science Data and Telemetry (NASDAT) system. The G-III aircraft has an advertised range of 3750 nm. versus 1800 nm. for the HU-25A aircraft. The expected duration will increase from 4.5 hours to about 7.5 hours, and the realistic mission altitude will increase to 45,000 feet from 36,000 feet. Discus-sions with researchers at LaRC, GSFC and the Johns Hopkins University are underway regarding installation of research systems in the summer of 2019. The goal is to have the LaRC G-III aircraft ready for research at LaRC in the spring of 2019.

48 NASA Airborne Science Program • Aircraft
Other NASA Earth Science AircraftOther NASA aircraft, as described here, on the ASP website and in the annual ASP Call Letter, are those platforms operated by NASA centers,
but not subsidized by the ASP program. These are available for science through direct coordina-tion with the operating center.
NASA Airborne Science Program • Aircraft

49NASA Airborne Science Program • Aircraft NASA Airborne Science Program • Aircraft
Aircraft
C-130 Hercules
OPERATING CENTER: Wallops Flight Facility
AIRCRAFT DESCRIPTION: The C-130 is a four-engine turboprop aircraft designed for maximum payload capacity. WFF operates two C-130 aircraft. In 2018, one was decommissioned after failure during NAAMES. The other supported the EVS-2 mission ACT-
America. After completion of ACT-America in 2019, a business case will need to be devel-oped to keep operating the remaining aircraft.
SCIENCE FLIGHT HOURS IN FY18: 310.5
C-130 FY18 Missions
SIGNIFICANT UPCOMING MAINTENANCE PERIODS: • N436: 6-8 week annual maintenance period each
year that can be adjusted to meet mission needs.
• A Phased Depot Maintenance (PDM) extension.
MODIFICATIONS MADE IN FY18 AND IMPACTS ON PERFORMANCE AND SCIENCE: None
WEBSITE: airbornescience.nasa.gov/aircraft/C-130_Hercules
inspection is required for N436 in spring 2020 requiring 3-4 months to complete.
• N436: Landing gear overhaul Fall 2021 (2-3 month effort).
FIGURE 37 In the cockpit of the C-130 during ACT-America.

50 NASA Airborne Science Program • Aircraft
AIRCRAFT DESCRIPTION: The Beechcraft B-200 King Air is a twin-turboprop aircraft capable of mid-altitude flight (>30,000 feet) with up to 1,000 pounds
B-200 Missions in FY18
of payload for up to 6 hours. Three NASA centers operate B-200 aircraft with varying modifications for science.
SCIENCE FLIGHT HOURS IN FY18: 446.2
B-200 / UC-12
OPERATING CENTERS: NASA LaRC operates both a conventional B-200 and a UC-12B (military version). Both have been extensively modified for remote sensing research. NASA AFRC also operates a
Super King Air B-200, which has been modified for downward looking payloads. WFF oper-ates a B-200 primarily for mission management operations.
FIGURE 38 The AFRC B-200 flew DopplerScatt on multiple missions in 2018.
MODIFICATIONS ON LARC B-200 AND UC-12B MADE IN FY18 AND IMPACTS ON PERFORMANCE AND SCIENCE: None
MODIFICATIONS ON AFRC B-200 MADE IN FY18 AND IMPACTS ON PERFORMANCE AND SCIENCE: Completed floor access panel and pressure switch modification, which improves maintenance and flight safety.
NASA Airborne Science Program • Aircraft

51NASA Airborne Science Program • Aircraft NASA Airborne Science Program • Aircraft
Aircraft
MAINTENANCE FOR LARC B-200 AND UC-12BEach LaRC aircraft undergoes phase inspections as a function of flight hours or elapsed time. A typical phase inspection has a duration of four weeks. The phase inspections occur when neces-sary based on aircraft usage.
MAINTENANCE FOR AFRC B-200Notional: Phase inspection are scheduled every 200 flight hours or 1 year (whichever comes first).
B-200 WEBSITES: airbornescience.nasa.gov/aircraft/B200_-_LARC
airbornescience.nasa.gov/aircraft/B-200_UC-12B_-_LARC
airbornescience.nasa.gov/aircraft/B200_-_AFRC
airbornescience.nasa.gov/aircraft/B-200_King_Air_-_WFF
SIGNIFICANT UPCOMING MAINTENANCE PERIODS: Maintenance is a function of number of flight hours flown.
HU-25A Guardian
OPERATING CENTER: Langley Research Center
AIRCRAFT DESCRIPTION: The HU-25C and HU-25A Falcon and Guardian are modified twin-engine business jets based on the civilian Dassault FA-20G Falcon. The HU-25C
completed an OIB mission early in FY16 and has been placed into flyable storage. The HU-25A replacement is now in active service.
SCIENCE FLIGHT HOURS IN FY18: 24.8
HU-25A FY18 Missions
WEBSITE: airbornescience.nasa.gov/aircraft/HU-25C_Guardian
MODIFICATIONS MADE IN FY18 AND IMPACTS ON PERFORMANCE AND SCIENCE: None
FIGURE 39 HU-25A participated in LISTOS in FY18.

52 NASA Airborne Science Program • Aircraft NASA Airborne Science Program • Aircraft
WB-57
OPERATING CENTER: Johnson Space Center
AIRCRAFT DESCRIPTION: The WB-57 is a mid-wing, long-range aircraft ca-pable of operation for extended periods of time from sea level to altitudes in excess of 60,000 feet. The sensor equipment operator (SEO) station contains both navigational equipment
and controls for the operation of the payloads located throughout the aircraft. The WB-57 can carry up to 8,800 pounds of payload. JSC main-tains three WB-57 aircraft.
SCIENCE FLIGHT HOURS IN FY18: 0
FIGURE 40 WB-57.
MODIFICATIONS MADE IN FY18 AND IMPACTS ON PERFORMANCE AND SCIENCE: None WEBSITE: airbornescience.nasa.gov/aircraft/WB-57

53NASA Airborne Science Program • Aircraft NASA Airborne Science Program • Aircraft
Aircraft
Non-NASA Commercial Aviation Services (CAS) Oversight and Management
NASA Earth Science investigators not only rely on NASA’s highly capable and specialized air-craft, but also on science-capable aircraft from the commercial sector. This year alone, NASA- sponsored scientists flew missions supporting Operation IceBridge using a contracted Basler BT-67 in Antarctica and contracted King Air A-90s flew missions for the JPL Airborne Snow Observatory over the Sierra Nevada range in California and the GSFC G-LiHT in California, Florida and Puerto Rico. The EVS-2 Oceans Melting Greenland mission used a commercial DC-3 in Greenland and the ABoVE and AVIRIS teams used contracted Super King Air B200s in Alaska, Canada and Europe. Since 2010, each year the use of NASA Airborne Science Program aircraft has exceeded the average annual flight hours flown over the previous decade. Also in this time frame, the use of con-tracted aircraft has increased from below 20% of NASA Earth science funded flight hours to 35%. Where appropriate, the Airborne Science Program supports the use of contract aircraft, currently called Commercial Aviation Services, or CAS. NASA does not have the aircraft or other aviation resources the science community needs to accomplish all its missions, especially lower cost, small general aviation-like aircraft. Acquiring these readily available aircraft, on an as-needed basis, just makes more sense versus covering the full cost of ownership and operations.
NASA, as with all federal government agencies, has policies and procedures in place to help
ensure that only reputable and capable con-tract companies and aircraft were procured to meet the needs of the mission. The procedures were usually split between the contracting office and an aircraft operations organization. The contracting office wrote the proposal and wrote and negotiated the contract. The aircraft operations organization determined the fitness of the aircraft provider usually through a review process. In recent years there have been sub-stantial changes to the policies and rules NASA has instituted to acquire and manage the types of services mentioned above, such as requiring service providers to be FAA Part 135 compliant. Because CAS has become so critical to many of our stakeholders, the Program asked the NASA Aircraft Management Division to provide an overview of NASA’s current CAS policies and expectations. It’s important that Program stake-holders have a solid understanding of NASA’s requirements and expectations.
What is CAS?In general, commercial aviation services (CAS) are full-service contract agreements through which an executive agency acquires aircraft and related aviation services, including unmanned aircraft systems (UAS) and drones. Typically, these agreements come in the form of an aircraft charter under an exclusive use arrangement to perform a specific government function. In most cases these full-service agreements are con-tracts or subcontracts with commercial vendors but, in some cases, CAS can also be conducted through grants with non-commercial entities. In all cases the CAS entity operates and maintains the aircraft performing the government function.

54 NASA Airborne Science Program • Aircraft NASA Airborne Science Program • Aircraft
NASA uses CAS to supplement NASA’s own aircraft capabilities. NASA’s use of CAS includes conducting science and aeronautics research and to support human exploration of space. In FY17 NASA spent approximately $6 million to fly over 1,600 flight hours using CAS. NASA’s CAS utilization has climbed steadily in the last five years to account for almost 35% of all NASA aircraft flight hours flown in support of NASA mission requirements.
What is the Policy?The Federal Aviation Administration (FAA) and the National Transportation Safety Board (NTSB) have pointed out that safety of CAS flight operations is incumbent on the federal agency that has the mission responsibility. In 2017 NASA implemented significant changes in our oversight and management of CAS operations with an update to the NASA Air-craft Operations Management Manual. As a federal agency, which conducts almost all of our missions using NASA’s public use author-ity, NASA has operational control of all public aircraft missions flown for NASA. This public aircraft authority is defined in the U.S. Code with additional guidance in federal regulations. These regulations require NASA to ensure the airworthiness and safe operations of all govern-ment aircraft operations to include CAS through NASA’s management and oversight programs.
NASA’s CAS oversight responsibility begins with planning for the use of aircraft to support NASA programs and projects. This ensures NASA’s world-class performance and safety standards are built into the Requests for Proposals (RFPs)
process. Then, NASA’s center flight operations works with programs and projects in select-ing qualified vendors that are capable of and committed to meeting NASA’s high quality and safety standards. NASA’s oversight continues throughout the performance of the contract, often with NASA instruments or personnel flying on board the contracted aircraft.
When NASA’s people and equipment are exposed to flight risks, our aircraft operations managers have a responsibility to partner with the program and project managers and be the gatekeepers of NASA’s safety requirements. To mitigate any safety risks of CAS flights, NASA has required CAS operators to imple-ment higher standards, such as Federal Avia-tion Regulation (FAR) Part 135 requirements for CAS flight operations. In addition, all aircraft and aircraft modifications have to go through a NASA airworthiness review process and receive either a Certificate of Airworthiness or State-ment of Airworthiness issued by a NASA center airworthiness technical authority, depending on the complexly of the aircraft modification.
NASA’s oversight responsibilities include initial contractor reviews prior to contract award, surveillance during the contract period of per-formance, and appropriate close-out respon-sibilities. A surveillance plan (which includes mandatory inspection points and witnessing select processes but does not typically require continuous onsite oversight) is implemented for all CAS contracts due to the critical and complex nature of CAS operations as defined by NASA safety policies. CAS contracts cite and allow NASA access to all maintenance and
55NASA Airborne Science Program • Aircraft NASA Airborne Science Program • Aircraft
Aircraft
flight operations performed under a NASA contract regardless of prime contractor or subcontractor status. This surveillance also includes inspections of all CAS operators, aircraft, pilots, and maintainers.
Why is CAS important to the Airborne Sci-ence Program and ESD community?
Safety oversight and management of CAS remains a critical area of attention for NASA. NASA’s risk exposure to CAS has significantly increased as NASA increases its reliance on vendor provided flight services. Even though the increased use of CAS has brought a signifi-cant burden of safety oversight, NASA’s avia-tion community is proactively addressing these challenges to ensure that NASA program and project managers are able to acquire CAS
in an expedient manner to meet mission requirements.
As evident from past contractor performance there have been a few occasions where pro-grams have experienced design, quality, cost and workmanship deficiencies that have had an impact on the success of these missions. NASA’s safety oversight role in CAS has, therefore, been improved. While NASA’s operates a large fleet of research aircraft, CAS allows NASA to tap into vast commercial resources to fulfill unique agency missions as needed. CAS has been, and will continue to be, indispensable in supplementing NASA’s own aircraft capabilities. CAS is a significant ele-ment of NASA’s aviation capability in carrying out the agency’s various missions.

Airc
raft
Cro
ss-C
uttin
g S
uppo
rtan
d IT
Infra
stru
ctur
e
5. Aircraft Cross-Cutting Support and IT Infrastructure
5.
Aircraft support entails aircraft facility instru-ment operations and management, engineer-ing support for payload integration, flight planning and mission management tools, flight navigation data hardware and software support, in addition to flight data archiving and distribution.
Cross-cutting support for ASP missions is managed at ARC and is supported by the University of California Santa Cruz Airborne Sensor Facility (ASF) and the National Sub-orbital Research Center (NSRC). Specific activities include providing facility instru-ments, satellite telemetry and mission tools data services, and assistance with payload integration engineering.
Further support for mission management and real-time flight tracking is provided by ARC through the Mission Tools Suite (MTS).
ASP Facility Science Infrastructure
Facility InstrumentationThe ASP provides a suite of facility instrumen-tation and data communications systems for community use by approved NASA investi-gators. Currently available ASP instrumenta-tion (listed in Table 11) includes stand-alone precision navigation systems, and a suite of digital tracking cameras and video systems. Real-time data communications capabilities, which differ from platform to platform, are also described below, and are integral to a wider Sensor Network architecture. In addi-tion, ESD, through the Research and Analysis (R&A) Program and the EOS Project Science Office, maintains a suite of advanced imaging systems that are made available to support multidisciplinary research applications. These are supported at various NASA field centers including JPL, ARC and LaRC. The ASF also
56 NASA Airborne Science Program • Aircraft Cross-Cutting Support and IT Infrastructure

57
maintains a spectral and radiometric instrument calibration facility, which supports the wider NASA airborne remote sensing community. Ac-cess to any of these assets is initiated through the ASP Flight Request process. (See page 4.)
Sensor Network IT InfrastructureA state-of-the-art real-time data communica-tions network has been implemented across the ASP core platforms. Utilizing onboard Ethernet networks linked through airborne satellite com-
TABLE 11 Facility Equipment.
NASA Airborne Science Program • Aircraft Cross-Cutting Support and IT Infrastructure
Aircraft Cross-Cutting Support and IT Infrastructure

58 NASA Airborne Science Program • Aircraft Cross-Cutting Support and IT Infrastructure
TABLE 12 Satellite Communications Systems on ASP aircraft.
munications systems to the web-based MTS, the sensor network is intended to maximize the science return from both single-platform missions and complex multi-aircraft science campaigns. It leverages data visualization tools developed for the NASA DC-8, remote instru-ment control protocols developed for the Global Hawk aircraft, and standard data formats devised by the Interagency Working Group for Airborne Data and Telecommunication Systems (IWGADTS). The sensor network architecture includes standardized electrical interfaces for payload instruments, using a common Experi-menter Interface Panel (EIP); and an airborne network server and satellite communications gateway known as the NASA Airborne Science Data and Telemetry (NASDAT) system; and a web-based application programming interface (API) for interfacing to customer software and other agencies. These capabilities are now operational, as indicated in Table 12.
NASA Airborne Science Data and Telemetry (NASDAT) System
The NASDAT provides experiments with: • Platform navigation and air data
• Highly accurate time-stamping
• Baseline Satcom, Ethernet network and Sensor-Web communications
• Legacy navigation interfaces for the ER-2 (RS-232, RS-422, ARINC-429, Synchro, IRIG-B)
• Recorded cockpit switch states on ER-2 and WB-57 aircraft
• Optional mass storage for payload data
Satellite Communications Systems Several types of airborne satellite communi-cations systems are currently operational on the core science platforms. High bandwidth Ku- and Ka-band systems, which use large steerable dish antennas, are installed on the WB-57F. INMARSAT Broadband Global Area Network (BGAN) multi-channel systems, using electronically-steered flat panel antennas, are available on many of the NASA aircraft. Data-enabled Iridium satellite phone modems are also in use on most of the science platforms as well. Although Iridium has a relatively low data rate, unlike the larger systems, it operates at high polar latitudes, and is lightweight and inexpensive to operate.
NASA Airborne Science Program • Aircraft Cross-Cutting Support and IT Infrastructure

59NASA Airborne Science Program • Aircraft Cross-Cutting Support and IT Infrastructure NASA Airborne Science Program • Aircraft Cross-Cutting Support and IT Infrastructure
Payload Management
ASP provides a variety of engineering support services to instrument teams across all of the program platforms. These include mechanical engineering, electrical and network interface support, and general consulting on the opera-tional issues associated with specific aircraft. The services are provided jointly by personnel from NSRC at NASA’s Palmdale facility and ASF at ARC and Palmdale.
NSRC staff provides instrument integration services for the NASA DC-8 aircraft. Instrument investigators provide a Payload Information Form that includes instrument requirements for space, power, aircraft data and location of the instruments, and any applicable inlet or window access needs. The staff then uses the information provided to complete engineering design and analysis of instrument and probe installations on the aircraft, and wiring data and display feeds to instrument operators.
NSRC also provides data display, aircraft video, facility instruments and satcom services on the DC-8, P-3, and C-130 aircraft. A high-speed data network (both wired and wireless) is maintained on each of the aircraft so onboard investigators have access to display data avail-able on the aircraft. Video, aircraft state param-eters, and permanent facility instrument data are recorded, quality controlled, and posted on the science mission and ASP data archives. Satcom services are provided with multichan-nel Iridium and high bandwidth INMARSAT services. These services allow for real-time chat with scientists on the ground and other aircraft.
NSRC engineers also work with investigators to send appropriate data up to and down from the aircraft to allow for real-time situational aware-ness to scientists on the ground and in flight.
Along with general payload engineering ser-vices, the ASF designs and builds custom flight hardware for the ASP real-time sensor network, e.g. the NASDAT (network host and navigation data server), and the standardized Experiment Interface Panels; as well as payload data sys-tems for the Global Hawk, including the Telem-etry Link Module and the Master Power Control System (MCPS). Together with NSRC, they also support payload IT operations on other aircraft equipped with payload satcom systems. The ASF personnel also support the ER-2 program, providing payload integration and field opera-tions support, as required for the real-time sen-sor network and the MVIS video system.
Mission Tool Suite
The Mission Tools Suite (MTS) is ASP’s de-cisional support and situational awareness system used to assist with the execution of airborne missions (http://mts.nasa.gov). The primary objectives of the MTS are a.) to support tactical decision-making and distributed team situational awareness during a flight; b.) to facilitate team communication and collaboration throughout the mission lifecycle; and c.) to both consume and produce visualization products that can be viewed in conjunction with the real-time position of aircraft and airborne instrument status data. Taken together, the intent of the system is to encourage more responsive and collaborative measurements between instru-

60 NASA Airborne Science Program • Aircraft Cross-Cutting Support and IT Infrastructure NASA Airborne Science Program • Aircraft Cross-Cutting Support and IT Infrastructure
FIGURE 41 The new MTS user interface showing the Asset Status telemetry displays.
ments on multiple aircraft, satellites, and on the surface in order to increase the scientific value of the measurements, and improve the efficien-cy and effectiveness of flight missions.
In addition to supporting flight and program activities over this past year, the team has been focused on a top-to-bottom redesign of the MTS system. This new system should be ready for beta-testing by program stakeholders later in 2019 and operational early in FY20. For users, the new system will streamline functionality in order to improve application memory, perfor-mance and overall usability. Those features that are most relevant to mission execution should become easier to use for new users and more powerful for users that have used the system in the past (see Figure 41).
The next MTS release will be important in a few
different ways. Some highlights include support for map projections that will better serve polar missions (e.g., polar stereographic), automatic ground overlay reprojection, a more capable user interface that will simplify the process of simultaneously monitoring tracked assets across different products stacks (see Figure 42), product video playback, and multi-channel chat. The overhaul will also make it easier for the cross-cutting infrastructure team to manage the application, be more responsive to new IT security directives, including two-factor authen-tication for non-NASA users, and allow integra-tion with the ASP calendar to automatically tag telemetry and other stored data for post-mission reports and visualization. Taken together, the next release will be a major step forward for program stakeholders.

61NASA Airborne Science Program • Aircraft Cross-Cutting Support and IT Infrastructure
Aircraft Cross-Cutting Support and IT Infrastructure
NASA Airborne Science Program • Aircraft Cross-Cutting Support and IT Infrastructure
FIGURE 42 The MTS product interface. The product interface has been greatly simplified and users can now view differ-ent product stacks simultaneously within the same window.
In concert with other activities, the team has also been hard at work to advance access to high-quality digital models of program assets (see Figures 43 and 44). 3D models are useful for aircraft visualization, public education and outreach, and are the foundation for providing
the next generation interfaces that will include augmented- and virtual-reality displays. The ASP has a number of freely available 3D models that include: C-20 (with/without UAVSAR), DC-8, P-3, Global Hawk, G-5, Twin Otter, WB-57, ER-2, B-200s (LaRC, AFRC), SIERRA-B, and the C-130.

62 NASA Airborne Science Program • Aircraft Cross-Cutting Support and IT Infrastructure
FIGURE 43 Freely available 3-D models include: C-20 (with/without UAVSAR), DC-8, P-3, Global Hawk, G-5, Twin Otter, WB-57, ER-2, B-200s (LaRC, AFRC), SIERRA-B, C-130.
FIGURE 44 Example rendering of the ER-2. The model can be further customized to accommodate missions, generating outreach materials of aircraft instrumentation.
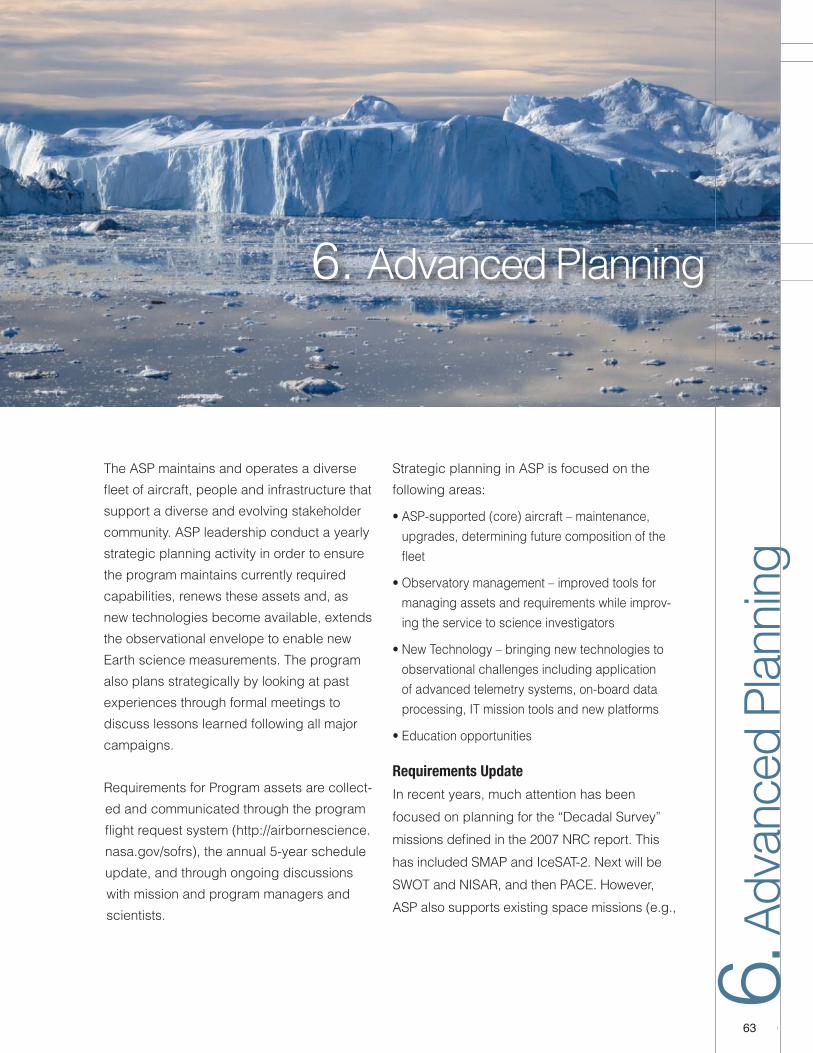
63NASA Airborne Science Program • Aircraft Cross-Cutting Support and IT Infrastructure
6.Ad
vanc
ed P
lannin
g
63
The ASP maintains and operates a diverse fleet of aircraft, people and infrastructure that support a diverse and evolving stakeholder community. ASP leadership conduct a yearly strategic planning activity in order to ensure the program maintains currently required capabilities, renews these assets and, as new technologies become available, extends the observational envelope to enable new Earth science measurements. The program also plans strategically by looking at past experiences through formal meetings to discuss lessons learned following all major campaigns.
Requirements for Program assets are collect-ed and communicated through the program flight request system (http://airbornescience.nasa.gov/sofrs), the annual 5-year schedule update, and through ongoing discussions with mission and program managers and scientists.
Strategic planning in ASP is focused on the following areas:
• ASP-supported (core) aircraft – maintenance, upgrades, determining future composition of the fleet
• Observatory management – improved tools for managing assets and requirements while improv-ing the service to science investigators
• New Technology – bringing new technologies to observational challenges including application of advanced telemetry systems, on-board data processing, IT mission tools and new platforms
• Education opportunities
Requirements Update
In recent years, much attention has been focused on planning for the “Decadal Survey” missions defined in the 2007 NRC report. This has included SMAP and IceSAT-2. Next will be SWOT and NISAR, and then PACE. However, ASP also supports existing space missions (e.g.,

64
A-Train satellites), as well as other “foundational” missions such as GPM, OCO-2 and Suomi-NPP. Once launched, these missions require manda-tory cal/val, often making use of airborne capa-bilities. The Program continues to document and update science impacts that have resulted from airborne support of space missions.
New space missions on the ISS, several small sats, and collaborations with ESA and other space agencies are upcoming. Several airborne experiments are already supporting these activi-ties. Furthermore, the new 2017 NRC Decadal Survey for Earth Science has recommended new space missions such that new airborne support missions are anticipated. ASP personnel are plan-ning an update of the “Requirements Report” in 2019, given the information in the 2017 Decadal Survey, the outcomes of the EVS-3 selections, new ESTO IIP and AITT selections and new input from the science community.
ASP personnel also monitor upcoming Earth Science space missions for potential airborne needs to support:
• Algorithm development• Instrument testing• Calibration and validation activities.
Participation in science team meetings and program reviews in 2018 to describe ASP capa-bilities and collect requirements information are listed in Table 13.
5-year plan
A five-year plan is also maintained by the
Program for out-year planning and scheduling.
A graphical copy is shown in Appendix A,
depicting plans by science area and aircraft
platform. Significant maintenance periods for
the various aircraft are also indicated.
TABLE 13 Activities to Support ASP Requirements Information Gathering.
NASA Airborne Science Program • Advanced Planning
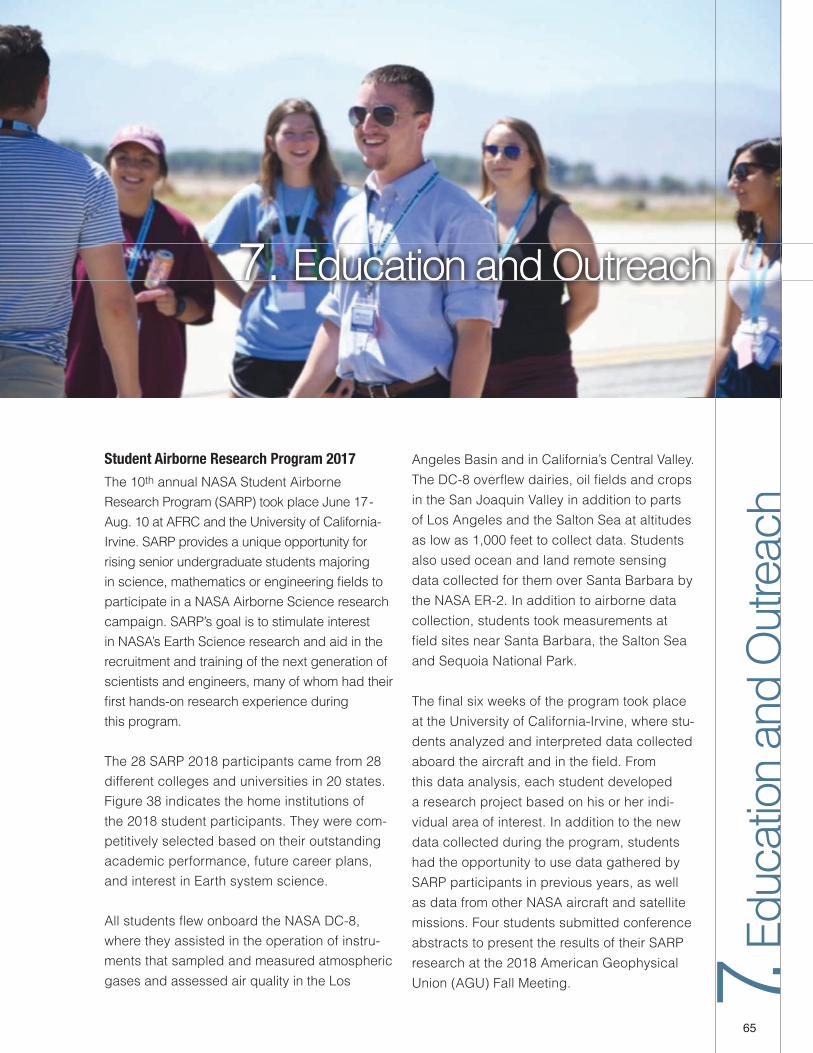
65NASA Airborne Science Program • Advanced Planning
7.Edu
catio
n an
d O
utre
ach
65
Student Airborne Research Program 2017
The 10th annual NASA Student Airborne Research Program (SARP) took place June 17- Aug. 10 at AFRC and the University of California-Irvine. SARP provides a unique opportunity for rising senior undergraduate students majoring in science, mathematics or engineering fields to participate in a NASA Airborne Science research campaign. SARP’s goal is to stimulate interest in NASA’s Earth Science research and aid in the recruitment and training of the next generation of scientists and engineers, many of whom had their first hands-on research experience duringthis program.
The 28 SARP 2018 participants came from 28 different colleges and universities in 20 states. Figure 38 indicates the home institutions of the 2018 student participants. They were com-petitively selected based on their outstanding academic performance, future career plans, and interest in Earth system science.
All students flew onboard the NASA DC-8, where they assisted in the operation of instru-ments that sampled and measured atmospheric gases and assessed air quality in the Los
Angeles Basin and in California’s Central Valley. The DC-8 overflew dairies, oil fields and crops in the San Joaquin Valley in addition to parts of Los Angeles and the Salton Sea at altitudes as low as 1,000 feet to collect data. Students also used ocean and land remote sensing data collected for them over Santa Barbara by the NASA ER-2. In addition to airborne data collection, students took measurements at field sites near Santa Barbara, the Salton Sea and Sequoia National Park.
The final six weeks of the program took place at the University of California-Irvine, where stu-dents analyzed and interpreted data collected aboard the aircraft and in the field. From this data analysis, each student developed a research project based on his or her indi-vidual area of interest. In addition to the new data collected during the program, students had the opportunity to use data gathered by SARP participants in previous years, as well as data from other NASA aircraft and satellite missions. Four students submitted conference abstracts to present the results of their SARP research at the 2018 American Geophysical Union (AGU) Fall Meeting.

66
NASA Student Airborne Research Progem 2018 Colleges & Universities
FIGURE 46 TheSARP 2018 studentparticipants withthe DC-8 at AFRC.
FIGURE 45 Map showing locations of the 2018 SARP students’ colleges and universities.
NASA Airborne Science Program • Appendix ANASA Airborne Science Program • Education and Outreach

67NASA Airborne Science Program • Appendix ANASA Airborne Science Program • Education and Outreach
AppendicesAppendices
Appendix A: 5-Year Plan 5-year Plan by Science Area5-year Plan by Major AircraftMaintenance Schedules for selected Aircraft

68 NASA Airborne Science Program • Appendix A
5-year Plan by Major Aircraft
NASA Airborne Science Program • Appendix A

69NASA Airborne Science Program • Appendix A NASA Airborne Science Program • Appendix A
Appendices

70 NASA Airborne Science Program • Appendix A
Maintenance Schedules for Selected Aircraft
ER-2
DC-8
NASA Airborne Science Program • Appendix A

71NASA Airborne Science Program • Appendix A NASA Airborne Science Program • Appendix A
Appendices
C20-A
P-3 Orion
AFRC B-200 (NASA 801)
• 6-8 week annual maintenance period each year that can be adjusted to meet mission needs.
• Landing gear overhaul - fall 2019 (2-3 month effort)
• Phased Depot Maintenance 2021 (4-6 month effort)
Notional: Phase inspections are scheduled every 200 flight hours or 1 year (whichever comes first).
• Phase 3 & 4, Jan. 2019 – March 2019 • Phase 1 & 2, Jan. 2020 – March 2020 • Phase 3 & 4, Jan. 2021 – March 2021 • Phase 1 & 2, Jan. 2022 – March 2022 • Phase 3 & 4, Jan. 2023 – March 2023

72
Appendix B: Acronyms
A
AA Associate Administrator
AAC ABoVE Airborne Campaign
ABoVE Arctic-Boreal Vulnerability Experiment
ACCP Aerosols and Clouds, Convections and Precipitation
ACE Aerosols Clouds Ecosystems
ACEPOL Aerosol Characterization from Polarimeter and Lidar
ACTIVATE Aerosol Cloud Meteorology Interactions over the Western Atlantic Experiment
ACT-America Atmospheric Carbon and Transport-America
ADCP Acoustic Doppler Current Profilers
ADS-B Automatic Dependent Surveillance – Broadcast
AFRC Armstrong Flight Research Center
AGU American Geophysical Union
Air-HARP Airborne Hyper-Angular Rainbow Polarimeter
Air-LUSI Airborne Lunar Spectral Irradiance
AirMSPI Airborne Multi-angle SpectroPolarimeter Imager
AirMOSS Airborne Microwave Observatory of Subcanopy and Subsurface
AirSPEX Airborne Multi-angular Spectro-Polarimeter from SRON (Netherlands)
AITT Airborne Instrument Technology Transition
AJAX Alpha Jet Airborne Experiment
AMPR Advanced Microwave Precipitation Radiometer
ANC Anchorage International Airport
APU Auxiliary Power Unit
APR-2 Airborne Second Generation Precipitation Radar
ARC Ames Research Center
ARINC Aeronautical Radio, Incorporated
ARMD Aeronautics Research Mission Directorate
ARTEMIS Autonomous, Robotic TElescope Mount Instrument Subsystem
ASF Airborne Sensor Facility
ASO Airborne Snow Observatory
ASP Airborne Science Program
ASTER Advanced Spaceborne Thermal Emission and Reflection Radiometer
NASA Airborne Science Program • Appendix B NASA Airborne Science Program • Appendix B

73
ATC Air Traffic Control
ATM Airborne Topographic Mapper
ATom Atmospheric Tomography Mission
AVIRIS, Airborne Visible/Infrared Imaging Spectrometer, AVIRIS-next generationAVIRIS-ng
AXCTD Airborne Expendable Conductivity Temperature Depth
B
BAER Burned Area Emergency Response
BBR Broadband Radiometers
BERMS Boreal Ecosystem Research and Monitoring Sites
BGAN Broadband Global Area Network
C
C-AERO Compact Airborne Environmental Radiometer
C-AIR Coastal Airborne In-situ Radiometer
C-HARRIER Coastal High Acquisition Rate Radiometers for Innovative Environmental Research
CALIPSO Cloud-Aerosol Lidar and Infrared Pathfinder Satellite Observations
Cal/val Calibration / Validation
CAMAL Cloud-Aerosol Multi-Angle Lidar
CAMP2EX Cloud and Aerosol Monsoonal Processes - Philippines Experiment
CARE Cabin Altitude Reduction Effort
CCE Carbon Cycle and Ecosystems
CDWR California Department of Water Resources
CIRES-IDD CubeSat Imaging Radar for Earth Science - Instrument Development and Demonstration
CIRPAS Center for Interdisciplinary Remotely-Piloted Aircraft Studies
CH4 methane
CO Carbon monoxide
CO2 Carbon dioxide
COA Certificate of Authorization
CONUS Continental United States
NASA Airborne Science Program • Appendix B NASA Airborne Science Program • Appendix B
Appendices

74
CPL Cloud Physics Lidar
CRREL Cold Regions Research and Engineering Laboratory
CY Calendar Year
D
DC3 Deep Convection Clouds and Chemistry
DCOTSS Dynamics and Chemistry of the Summer Stratosphere
DISCOVER-AQ Deriving Information on Surface conditions from Column and Vertically Resolved Observations Relevant to Air Quality
DLR German Space Agency
DME Distance Measuring Equipment
DMS Digital Mapping System
DOE Department of Energy (U.S.)
E
EAFB Edwards Air Force Base
eMAS Enhanced MODIS Airborne Simulator
EOS Earth Observing System
ESA European Space Agency
ESD Earth Science Division
ESPO Earth Science Project Office
ESSP Earth System Science Pathfinder
ESTO Earth Science Technology Office
EV, EVS-2, Earth Venture, Earth Venture Suborbital-2, Earth Venture Suborbital-3EVS-3
F
4Star Spectrometer for Sky-Scanning, Sun-Tracking Atmospheric Research
FAA Federal Aviation Administration
FAR Federal Aviation Regulation
FASMEE Fire and Smoke Model Evaluation Experiment
FIREX-AQ Fire Impacts on Regional Emissions and Chemistry Experiment - Air Quality
FEMA Federal Emergency Management Agency
FR Flight Request
FSU Florida State University
FY Fiscal Year
NASA Airborne Science Program • Appendix B NASA Airborne Science Program • Appendix B

75NASA Airborne Science Program • Appendix B
Appendices
G
GCAS Geo-CAPE Airborne Simulator
GEO-CAPE GEOstationary Coastal and Air Pollution Events
G-LiHT Goddard’s Lidar, Hyperspectral and Thermal
GLISTIN-A Glacier and Ice Surface Topography Interferometer - Airborne
GPM Global Precipitation Mission
GPS Global Positioning System
GRC Glenn Research Center
GRIP Genesis and Rapid Intensification Processes
GSFC Goddard Space Flight Center
H
H2O Water
HALO High Altitude Lidar Observatory
HAVHM High Accuracy Vector Helium Magnetometer
HDVIS High Definition Time-lapse Video System
HIWC High Ice Water Content
HSRL High Spectral Resolution Lidar
HS3 Hurricane and Severe Storm Sentinel
HyspIRI Hyperspectral Infrared Imager
HyTES Hyperspectral Thermal Emission Spectrometer
I
ICESat Ice, Cloud, and land Elevation Satellite
IIP Instrument Incubator Program
IMPACTS Investigation of Microphysics and Precipitation for Coast-Threatening Snowstorms
InSAR Interferometric Synthetic Aperture Radar
IPDA Integrated Path Differential Absorption
IR Infrared
IRIG-B Inter-Range Instrumentation Group - B
IRIS Irradiance Instrument Subsystem
ISRO Indian Space Research Organization
ISS International Space Station
IWGADTS Interagency Working Group for Airborne Data and Telecommunication Systems
NASA Airborne Science Program • Appendix B

76
J
JPL Jet Propulsion Laboratory
JPSS Joint Polar Satellite System
JSC Johnson Space Center
JWST James Webb Space Telescope
K
KOA Kona (Hawaii) International Airport
KORUS; Korea-US; KORUS-Air QualityKORUS-AQ
L
LARGE Langley Aerosol Research Group Experiment
LaRC Langley Research Center
LiDAR Light Detection and Ranging
LISTOS Long Island Sound Tropospheric Ozone Study
LMOS Lake Michigan Ozone Study
LVIS Land, Vegetation, and Ice Sensor
M
MAIA Multi-Angle Imager for Aerosols
MARBLE Millimeter Radar for Learning and Education
MAS MODIS Airborne Simulator
MASTER MODIS/ASTER Airborne Simulator
METOP-SG Meteorological Operational - Second Generation
MODIS Moderate Resolution Imaging Spectroradiometer
MSFC Marshall Space Flight Center
MTS Mission Tools Suite
N
NAAMES North Atlantic Aerosols and Marine Ecosystems Study
NASDAT NASA Airborne Science Data and Telemetry
NASA Airborne Science Program • Appendix B NASA Airborne Science Program • Appendix B

77NASA Airborne Science Program • Appendix B
Appendices
NAST-I National Polar-orbiting Operational Environmental Satellite System Airborne Sounder Testbed - Interferometer
NDMAX-ECLIF NASA/DLR Multidisciplinary Airborne Experiment-Emissions and Climate Impact of Alternative Fuel
NGEE Next generation ecological experiment
NISAR NASA-ISRO SAR
NIST National Institute of Standards and Technology
NOAA National Oceanographic and Atmospheric Administration
NPP National Polar-orbiting Partnership
NRC National Research Council
NSF National Science Foundation
NSRC National Suborbital Research Center
NT Northwest Territories
NTSB National Transportation Safety Board
O
OCO-2 Orbiting Carbon Observatory-2
OIB Operation Ice Bridge
OMG Oceans Melting Greenland
ORACLES Observations of Aerosols Above CLouds and their InteractionS
OWLETS Ozone Water-Land Environmental Transition Study
P
PACE Plankton, Cloud, and ocean Ecosystem
PARCA Program for Arctic Regional Climate Assessment
PDM Phased Depot Maintenance
PECAN Plains Elevated Convection at Night
PI Principal Investigator
PICARD Pushbroom Imager for Cloud and Aerosol R&D
PMD Palmdale Airport
PLOS ONE Public Library of Science Open Access Journal
POS Position and Orientation Systems
PRISM Portable Remote Imaging Spectrometer
NASA Airborne Science Program • Appendix B

78
R
R&A Research and Analysis
RGB Red Green Blue
ROCIS Remote Ocean Current Imaging System
RSP Research Scanning Polarimeter
S
S-MODE Submesoscale Ocean Dynamics and Vertical Transport
SAR Synthetic Aperture Radar
SARP Student Airborne Research Program
SatCom Satellite Communications
SBG Surface Biology and Geology
SeaWiFS Sea-Viewing Wide Field-of-View Sensor
SEAC4RS Studies of Emissions and Atmospheric Composition, Clouds and Climate Coupling by Regional Surveys
SEO Sensor Equipment Operator
SIERRA Sensor Integrated Environmental Remote Research Aircraft
SIF Solar-Induced Fluorescence
SMAP Soil Moisture Active Passive
SMD Science Mission Directorate
SnowEx Snow Experiment
SNPP Suomi National Polar-orbiting Partnership
SO2 Sulfur Dioxide
SOFRS Science Operations Flight Request System
SSFR Solar Spectral Flux Radiometer
STEM Science Technology Engineering and Math
SWIR Short Wave Infrared
SWOT Surface Water and Ocean Topography
NASA Airborne Science Program • Appendix B NASA Airborne Science Program • Appendix B

79NASA Airborne Science Program • Appendix B
Appendices
T
TABS Transoceanic Aerobiology Biodiversity Study
TanDEM-X TerraSAR-X add-on for Digital Elevation Measurement
TB Terra Bytes
TCCON Total Carbon Column Observing Network
TEMPO Tropospheric Emissions: Monitoring Pollution
TROPOMI Tropospheric Monitoring Instrument
U
UAS Unmanned Aircraft Systems
UAV Unmanned Aerial Vehicles
UAVSAR Uninhabited Aerial Vehicle Synthetic Aperture Radar
USFS U.S. Forest Service
USGS U.S. Geological Survey
UW University of Washington
V
VHF Very High Frequency
VIIRS Visible Infrared Imaging Radiometer Suite
VIPR Vapor In-cloud Profiling Radar
W
WFF Wallops Flight Facility
Y
YT Yukon Territory
NASA Airborne Science Program • Appendix B
