coverage-based testing strategies and reliability modeling for fault-tolerant software systems
DESCRIPTION
Ph.D Thesis Defense. Coverage-Based Testing Strategies and Reliability Modeling for Fault-Tolerant Software Systems. Presented by: CAI Xia Supervisor: Prof. Michael R. Lyu August 24, 2006. Outline. Background and related work Research methodology Experimental setup - PowerPoint PPT PresentationTRANSCRIPT

Coverage-Based Testing Strategies and Reliability Modeling for Fault-
Tolerant Software Systems
Presented by: CAI Xia
Supervisor: Prof. Michael R. Lyu
August 24, 2006
Ph.D Thesis Defense

2
Outline
Background and related work Research methodology Experimental setup Evaluations on design diversity Coverage-based testing strategies Reliability modeling Conclusion and future work

3
Background
Four technical methods to achieve reliable software systems
Structural Programming Formal methods Software reuse
Software testing
Formal inspection
Checkpointing and recovery Exception handling Data diversity Design diversity
Software reliability modeling

4
Fault-tolerant software
Single-version technique Checkpointing and recovery Exception handling
Multi-version technique (design diversity) Recovery block (RB) N-version programming (NVP) N self-checking programming (NSCP)
NVP model

5
Design diversity
Requirement Same specification; The multiple versions developed differently by
independent teams; No communications allowed between teams;
Expectation Programs built differently should fail differently
Challenges Cost consuming; Correlated faults?

6
Experiments and evaluations
Empirical and theoretical investigations have been conducted based on experiments, modeling, and evaluations Knight and Leveson (1986), Kelly et al (1988), Eckhardt et al
(1991), Lyu and He (1993) Eckhardt and Lee (1985), Littlewood and Miller (1989), Popov et al.
(2003) Belli and Jedrzejowicz (1990), Littlewood. et al (2001), Teng and
Pham (2002)
No conclusive estimation can be made because of the size, population, complexity and comparability of these experiments

7
Software testing strategies
Key issue test case selection and evaluation
Classifications Functional testing (black-box testing)
Specification-based testing Structural testing (white-box testing)
Branch testing Data-flow coverage testing
Mutation testing Random testing
Comparison of different testing strategies: Simulations Formal analysis
Subdomain-based testing
Code coverage: measurement of
testing completeness?

8
Code coverage
Definition measured as the fraction of program codes that are
executed at least once during the test.
Classification Block coverage: the portion of basic blocks executed. Decision coverage: the portion of decisions executed C-Use coverage: computational uses of a variable. P-Use coverage: predicate uses of a variable

9
Code coverage: an indicator of testing effectiveness? Positive evidence
high code coverage brings high software reliability and low fault rate
both code coverage and fault detected in programs grow over time, as testing progresses.
Negative evidence Can this be attributed to causal dependency between co
de coverage and defect coverage?
Controversial, not conclusive

10
Software reliability growth modeling (SRGM)
To model past failure data to predict future behavior

11
SRGM: some examples
Nonhomogeneous Poisson Process (NHPP) model
S-shaped reliability growth model
Musa-Okumoto Logarithmic Poisson model
μ(t) is the mean value of cumulative number of failure by time t

12
Reliability models for design diversity
Echhardt and Lee (1985) Variation of difficulty on demand space Positive correlations between version failures
Littlewood and Miller (1989) Forced design diversity Possibility of negative correlations
Dugan and Lyu (1995) Markov reward model
Tomek and Trivedi (1995) Stochastic reward net
Popov, Strigini et al (2003) Subdomains on demand space Upper bounds and “likely” lower bounds for reliability

13
Our contributions
For Fault Tolerance: Assess the effectiveness of design diversity
For Fault Removal: Establish the relationship between fault coverage and
code coverage under various testing strategies
For Fault Forecast: Propose a new reliability model which incorporates code
coverage and testing time together

14
Outline
Background and related work Research methodology Experimental setup Evaluations on design diversity Coverage-based testing strategies Reliability modeling Conclusion and future work

15
Motivation
Fault-tolerant software A necessity Yet controversial
Lack of Conclusive assessment creditable reliability model effective testing strategy Real-world project data on testing and fault tolerance
techniques together

16
Research procedure and methodology
A comprehensive and systematic approach Modeling Experimentation Evaluation Economics
Modeling Formulate the relationship between testing and reliability
achievement Propose our own reliability models with the key
attributes
17
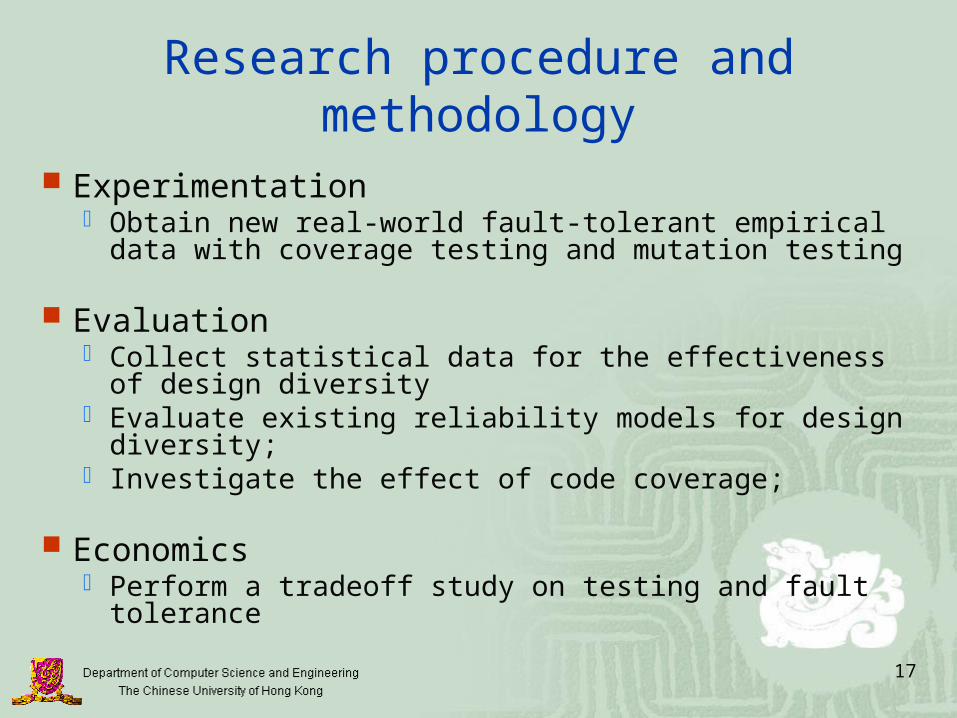
Research procedure and methodology
Experimentation Obtain new real-world fault-tolerant empirical data with
coverage testing and mutation testing
Evaluation Collect statistical data for the effectiveness of design
diversity Evaluate existing reliability models for design diversity; Investigate the effect of code coverage;
Economics Perform a tradeoff study on testing and fault tolerance

18
Outline
Background and related work Research methodology Experimental setup Evaluations on design diversity Coverage-based testing strategies Reliability modeling Conclusion and future work

19
Project features
Complicated and real-world application Large population of program versions Controlled development process Mutation testing with real faults injection Well-defined acceptance test set

20
Experimental setup
Time: spring of 2002
Population: 34 teams of four members
Application: a critical avionics application
Duration: a 12-week long project
Developers: senior-level undergraduate students with computer science major
Place: CUHK

21
Experimental project description
Geometry Data flow diagram
Redundant Strapped-Down Inertial Measurement Unit (RSDIMU)

22
Software development procedure
1. Initial design document ( 3 weeks)
2. Final design document (3 weeks)
3. Initial code (1.5 weeks)
4. Code passing unit test (2 weeks)
5. Code passing integration test (1 weeks)
6. Code passing acceptance test (1.5 weeks)

23
Mutant creation
Revision control applied and code changes analyzed
Mutants created by injecting real faults identified during each development stage
Each mutant containing one design or programming fault
426 mutants created for 21 program versions

24
Program metricsId Lines Modules Functions Blocks Decisions C-Use P-Use Mutants
01 1628 9 70 1327 606 1012 1384 25
02 2361 11 37 1592 809 2022 1714 21
03 2331 8 51 1081 548 899 1070 17
04 1749 7 39 1183 647 646 1339 24
05 2623 7 40 2460 960 2434 1853 26
07 2918 11 35 2686 917 2815 1792 19
08 2154 9 57 1429 585 1470 1293 17
09 2161 9 56 1663 666 2022 1979 20
12 2559 8 46 1308 551 1204 1201 31
15 1849 8 47 1736 732 1645 1448 29
17 1768 9 58 1310 655 1014 1328 17
18 2177 6 69 1635 686 1138 1251 10
20 1807 9 60 1531 782 1512 1735 18
22 3253 7 68 2403 1076 2907 2335 23
24 2131 8 90 1890 706 1586 1805 9
26 4512 20 45 2144 1238 2404 4461 22
27 1455 9 21 1327 622 1114 1364 15
29 1627 8 43 1710 506 1539 833 24
31 1914 12 24 1601 827 1075 1617 23
32 1919 8 41 1807 974 1649 2132 20
33 2022 7 27 1880 1009 2574 2887 16
Average 2234.2 9.0 48.8 1700.1 766.8 1651.5 1753.4 Total: 426

25
Setup of evaluation test
ATAC tool employed to analyze the compare testing coverage
1200 test cases exercised as acceptance test All failures analyzed, code coverage measured, an
d cross-mutant failure results compared 60 Sun machines running Solaris involved with 30
hours one cycle and a total of 1.6 million files around 20GB generated
1M test cases in operational test

26
Outline
Background and related work Research methodology Experimental setup Evaluations on design diversity Coverage-based testing strategies Reliability modeling Conclusion and future work

27
Static analysis result (1)
Fault types Number Percentage
Assign/Init: 136 31%
Function/Class/Object: 144 33%
Algorithm/Method: 81 19%
Checking: 60 14%
Interface/OO Messages 5 1%
Qualifier Number Percentage
Incorrect: 267 63%
Missing: 141 33%
Extraneous:
18 4%
Fault Type Distribution Qualifier Distribution

28
Static analysis result (2)
Stage Number Percentage
Init Code 237 55.6%
Unit Test 120 28.2%
Integration Test 31 7.3%
Acceptance Test 38 8.9%
Lines Number Percentage
1 line: 116 27.23%
2-5 lines: 130 30.52%
6-10 lines: 61 14.32%
11-20 lines: 43 10.09%
21-50 lines: 53 12.44%
>51 lines: 23 5.40%
Average 11.39 Development Stage Distribution
Fault Effect Code Lines

29
Mutants relationship
Related mutants: - same success/failure 1200-bit binary string
Similar mutants: - same binary string with the same erroneous output variables
Exact mutants: - same binary string with same values of erroneous output variables
Total pairs: 90525

30
Cross project comparison

31
Cross project comparison
NASA 4-university project: 7 out of 20 versions passed the operational testing
Coincident failures were found among 2 to 8 versions 5 of the 7 related faults were not observed in our project

32
Major contributions or findings on fault tolerance
Real-world mutation data for design diversity
A major empirical study in this field with substantial coverage and fault data
Supportive evidence for design diversity Remarkable reliability improvement (102 to 104)
Low probability of fault correlation

33
Outline
Background and related work Research methodology Experimental setup Evaluations on design diversity Coverage-based testing strategies Reliability modeling Conclusion and future work
34
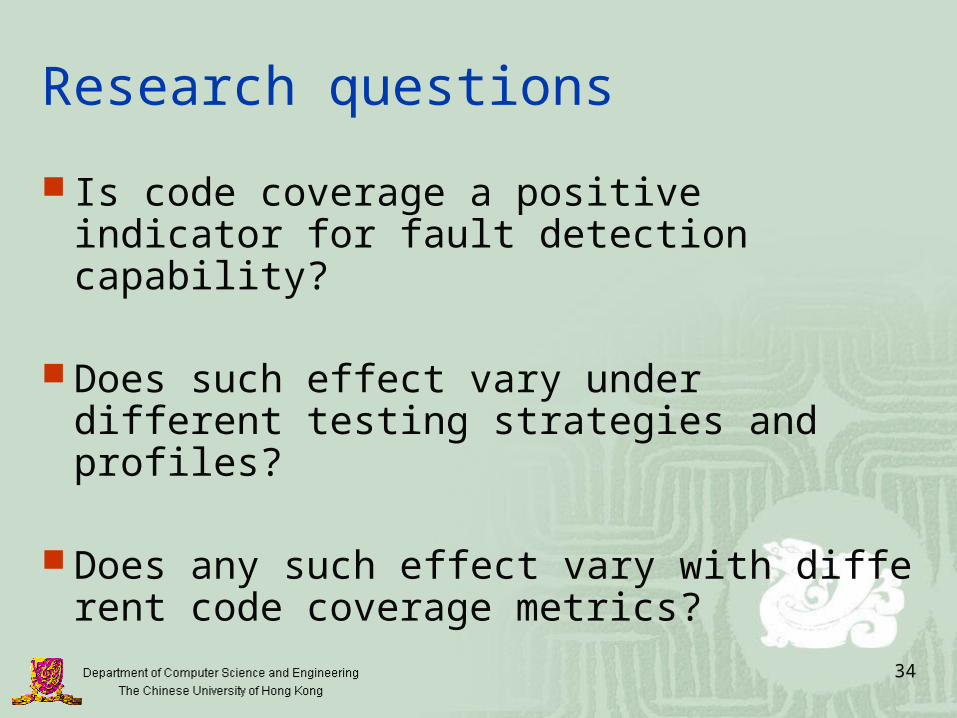
Research questions
Is code coverage a positive indicator for fault detection capability?
Does such effect vary under different testing strategies and profiles?
Does any such effect vary with different code coverage metrics?

35
Fault detection related to changes of test coverageVersion ID Blocks Decisions C-Use P-Use Any
1 6/8 6/8 6/8 7/8 7/8 (87.5%)
2 9/14 9/14 9/14 10/14 10/14 (71.4%)
3 4/7 4/7 3/7 4/7 4/7 (57.1%)
4 7/11 8/11 8/11 8/11 8/11 (72.5%)
5 7/10 7/10 5/10 7/10 7/10 (70%)
7 5/10 5/10 5/10 5/10 5/10 (50%)
8 1/5 2/5 2/5 2/5 2/5 (40%)
9 7/9 7/9 7/9 7/9 7/9 (77.8%)
12 10/20 17/20 11/20 17/20 18/20 (90%)
15 6/11 6/11 6/11 6/11 6/11 (54.5%)
17 5/7 5/7 5/7 5/7 5/7 (71.4%)
18 5/6 5/6 5/6 5/6 5/6 (83.3%)
20 9/11 10/11 8/11 10/11 10/11 (90.9%)
22 12/13 12/13 12/13 12/13 12/13 (92.3%)
24 5/7 5/7 5/7 5/7 5/7 (71.4%)
26 2/12 4/12 4/12 4/12 4/12 (33.3%)
27 4/7 5/7 4/7 5/7 5/7 (71.4%)
29 10/18 10/18 11/18 10/18 12/18 (66.7%)
31 7/11 7/11 7/11 7/11 8/11 (72.7%)
32 3/7 4/7 5/7 5/7 5/7 (71.4%)
33 7/13 7/13 9/13 10/13 10/13 (76.9%)
Overall 131/217 (60.4%)
145/217 (66.8%) 137/217 (63.1%) 152/217 (70%) 155/217 (71.4%)
426-174- 35= 217
Coverage increase => more faults detected!

36
Cumulated defect/block coverage

37
Cumulated defect coverage versus block coverage
R2=0.945

38
Test cases description
I
II
IIIIV
V
VI

39
Block coverage vs. fault coverage
Test case contribution on block coverage
Test case contribution on fault coverage
I II III IV V VII II III IV V VI

40
Correlation between block coverage and fault coverage
Linear modeling fitness in various test case regions
Linear regression relationship between block coverage and defect coverage in the whole test set

41
The correlation at various test regions
Linear regression relationship between block coverage and defect coverage in Region VI
Linear regression relationship between block coverage and defect coverage in Region IV

42
Under various testing strategies
Functional test: 1-800 Random test: 801-1200 Normal test: the system is operational according to the spec Exceptional test: the system is under severe stress conditions.

43
With different coverage metrics
The correlations under decision, C-use and P-use are similar with that of block coverage

44
Answers to the research questions
Is code coverage a positive indicator for fault detection capability? Yes.
Does such effect vary under different testing strategies and profiles? Yes. The effect is highest with exceptional test cases,
while lowest with normal test cases.
Does any such effect vary with different code coverage metrics? Not obvious with our experimental data.

45
Major contributions or findingson software testing
High correlation between fault coverage and code coverage in exceptional test cases Give guidelines for design of exceptional test cases
This is the first time that such correlation has been investigated under various testing strategies

46
Outline
Background and related work Research methodology Experimental setup Evaluations on design diversity Coverage-based testing strategies Reliability modeling Conclusion and future work

47
Work on reliability modeling
Evaluate current probability reliability models for design diversity with our experimental data
Propose a new reliability model which incorporates test coverage measurement into traditional software growth model

48
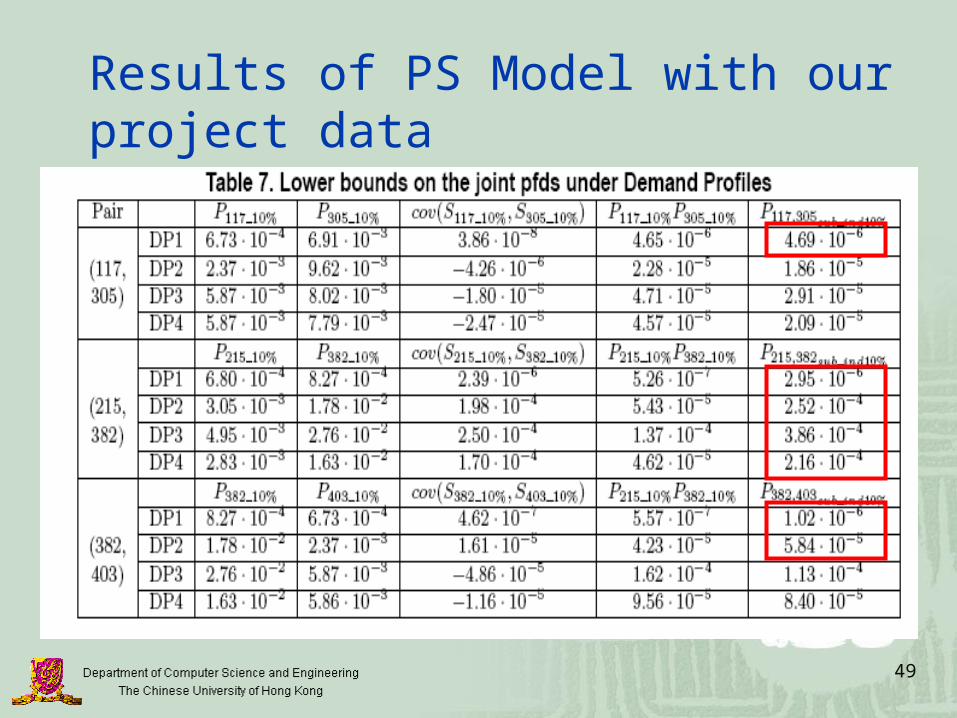
Results of PS Model with our project data Popov, Strigini et al (2003)
49
Results of PS Model with our project data
50
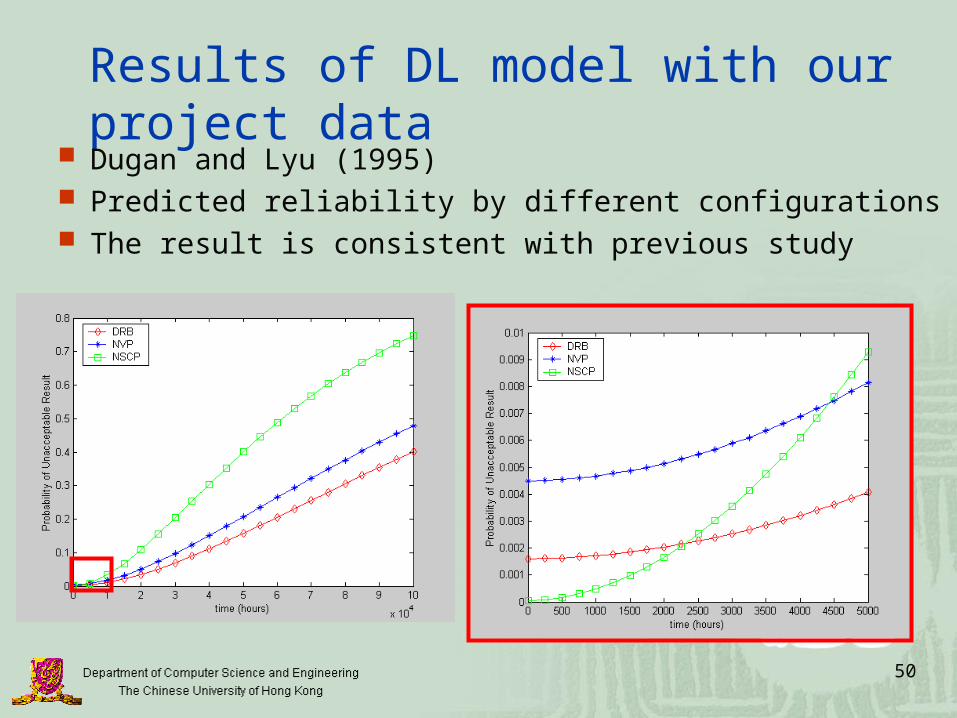
Results of DL model with our project data Dugan and Lyu (1995) Predicted reliability by different configurations The result is consistent with previous study

51
Introducing coverage into software reliability modeling
Most traditional software reliability models are based on time domain
However, time may not be the only factor that affects the failure behavior of software
Test completeness may be another indicator for software reliability

52
A new reliability model
Assumptions:1. The number of failures revealed in testing is relate
d to not only the execution time, but also the code coverage achieved;
2. The failure rate with respect to time and test coverage together is a parameterized summation of those with respect to time or coverage alone;
3. The probabilities of failure with respect to time and coverage are not independent, they affect each other by an exponential rate.

53
Model form
λ(t,c): joint failure intensity function λ1(t): failure intensity function with respect to time
λ2(c): failure intensity function with respect to coverage
α1,γ1, α2, γ2: parameters with the constraint of
α 1 + α 2 = 1
joint failure intensity function
failure intensity function with time
failure intensity function with coverageDependency
factors

54
Method A: Select a model for λ1(t) and λ2(c) ; Estimate the parameters inλ1(t) and λ2(c)
independently; Optimize other four parameters afterwards.
Method B: Select a model for λ1(t) and λ2(c) ; Optimize all parameters together.
Least-squares estimation (LSE) employed
Estimation methods
Existing reliability models: NHPP, S-shaped, logarithmic, Weibull …
???

55
λ(c) : Modeling defect coverage and code coverage
A Hyper-exponential model
Fc: cumulated number of failures when coverage c is achieved K: number of classes of testing strategies; Ni: the expected number of faults detected eventually in each class
A Beta model
N1: the expected number of faults detected eventually N2: the ultimate test coverage

56
λ(c) : Experimental evaluation

57
λ(c) : Parameters estimation results
Hyper-exponential model
Beta model
SSE=38365

58
λ1(t), λ2(c): exponential (NHPP)
NHPP model: original SRGM
Parameter estimation (1)
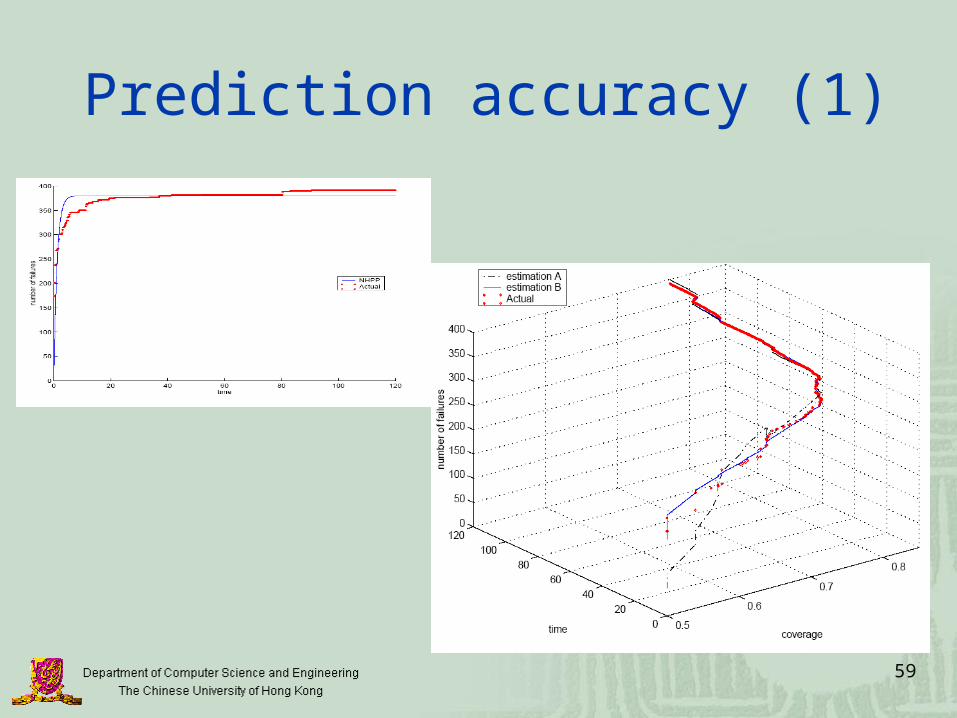
59
Prediction accuracy (1)
60
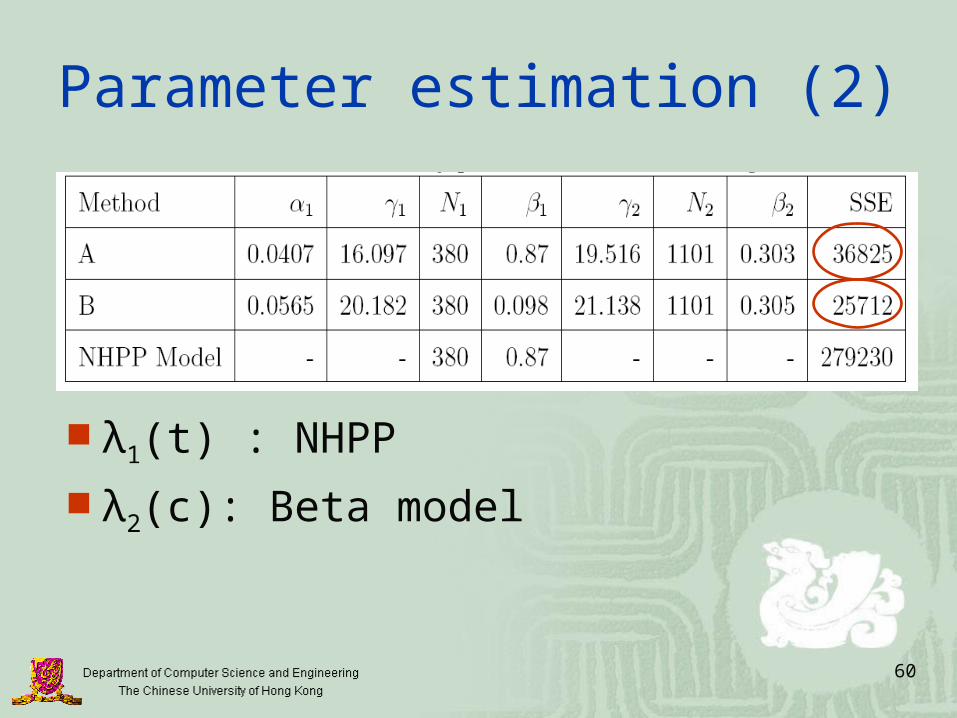
Parameter estimation (2)
λ1(t) : NHPP
λ2(c): Beta model

61
Estimation accuracy (2)

62
Major contributions or findingson software reliability modeling
The first reliability model which combines the effect of testing time and code coverage together
The new reliability model outperforms traditional NHPP model in terms of estimation accuracy

63
Outline
Background and related work Research methodology Experimental setup Evaluations on design diversity Coverage-based testing strategies Reliability modeling Conclusion and future work

64
Conclusion
Propose a new software reliability modeling Incorporate code coverage into traditional
software reliability growth models Achieve better accuracy than the traditional
NHPP model
The first reliability model combining the effect of testing time and code coverage together

65
Conclusion
Assess multi-version fault-tolerant software with supportive evidence by a large-scale experiment High reliability improvement Low fault correlation Stable performance
A major empirical study in this field with substantial fault and coverage data

66
Conclusion
Evaluate the effectiveness of coverage-based testing strategies: Code coverage is a reasonably positive
indicator for fault detection capability The effect is remarkable under exceptional
testing profile
The first evaluation looking into different categories of testing strategies

67
Future work
Further evaluate the current reliability model using comparisons with existing reliability models other than NHPP
Consider other formulations about the relationship between fault coverage and test coverage
Further study on the economical tradeoff between software testing and fault tolerance

68
Publication list Journal papers and book chapters
Xia Cai, Michael R. Lyu and Kam-Fai Wong, A Generic Environment for COTS Testing and Quality Prediction, Testing Commercial-off-the-shelf Components and Systems, Sami Beydeda and Volker Gruhn (eds.), Springer-Verlag, Berlin, 2005, pp.315-347.
Michael R. Lyu and Xia Cai, Fault-tolerant Software, To appear in Encyclopedia on Computer Science and Engineering, Benjamin Wah (ed.), Wiley. .
Xia Cai, Michael R. Lyu, An Experimental Evaluation of the Effect of Code Coverage on Fault Detection, Submitted to IEEE Transactions on Software Engineering, June 2006.
Xia Cai, Michael R. Lyu, Mladen A. Vouk, Reliability Features for Design Diversity :Cross Project Evaluations and Comparisons, in preparation.
Xia Cai, Michael R. Lyu, Predicting Software Reliability with Test Coverage, in preparation.

69
Publication list Conference papers
Michael R. Lyu, Zubin Huang, Sam K. S. Sze and Xia Cai, “An Empirical Study on Testing and Fault Tolerance for Software Reliability Engineering,” Proceedings of the 14th IEEE International Symposium on Software Reliability Engineering (ISSRE'2003), Denver, Colorado, Nov. 2003, pp.119-130. This paper received the ISSRE'2003 Best Paper Award.
Xia Cai and Michael R. Lyu, “An Empirical Study on Reliability and Fault Correlation Models for Diverse Software Systems,” ISSRE’2004, Saint-Malo, France, Nov. 2004, pp.125-136.
Xia Cai and Michael R. Lyu, “The Effect of Code Coverage on Fault Detection under Different Testing Profiles,” ICSE 2005 Workshop on Advances in Model-Based Software Testing (A-MOST), St. Louis, Missouri, May 2005.
Xia Cai, Michael R. Lyu and Mladen A. Vouk, “An Experimental Evaluation on Reliability Features of N-Version Programming,” ISSRE’2005, Chicago, Illinois, Nov. 8-11, 2005, pp. 161-170.
Xia Cai and Michael R. Lyu, “Predicting Software Reliability with Testing Coverage Information,” In preparation to International Conference on Software Engineering (ICSE’2007).

Q & A
Thanks!

71
Previous work on modeling reliability with coverage information Vouk (1992)
Rayleigh model
Malaiya et al.(2002) Logarithmic-exponential model
Chen et al. (2001) Using code coverage as a factor to reduce the
execution time in reliability models

72
Comparisons with previous estimations

73
The number of mutants failing in different testing

74
Non-redundant set of test cases

75
Test set reduction with normal testing

76
Test set reduction with exceptional testing