coverfade!!!.pdf 8/17/10 10:22:08 pm report - … · email: aga˚[email protected] website: pr...
TRANSCRIPT

2009/10
annualREPORT
Department of Environmental A�airs & Development PlanningProvincial Government of the Western Cape
C
M
Y
CM
MY
CY
CMY
K
Coverfade!!!.pdf 8/17/10 10:22:08 PM

Western CapeDepartment of
Environmental A�airsand
Development Planning
VOTE 9
For the year ended 31 March 2010
2009/10
annualREPORT

Contact details:
Chief Financial O�cerDepartment of Environmental A�airs and Development Planning
Utilitas Building1 Dorp Street
Cape Town8001
Private Bag X 9086Cape Town
8000
Telephone: +27 21 483 5128Facsimile: +27 21 483 3662
Email: aga�[email protected]: www.capegateway.gov.za/eadp
PR number: PR 274/2010ISBN number: 978-0-621-39648-5
Afrikaans and isiXhosa available on CD and www.capegateway.gov.za/eadp
In the event of any discrepancy between the di�erent translations of this report, the English text will prevail.
Design and Layout: Fizzee Studios cc +27 21 671 1598Printing: Print Active cc

Contents
Part 1: GENERAL INFORMATION
1.1 Submission of the Annual Report to the Executive Authority 5
1.2 Introduction by the Head of Department 6
1.3 Information on the Ministry 6
1.4 Vision and mission statement 7
1.5 General overview of the Department 8
1.6 Legislative mandates 9
1.7 Public entities controlled by the Department 10
Part 2: PROGRAMME PERFORMANCE
2.1 Voted funds 11
2.2 Aim of vote 11
2.3 Key measurable objectives, programmes and achievements 11
2.4 Overview of the service delivery environment for 2009/10 15
2.5 Overview of the organisational environment for 2009/10 15
2.6 Strategic overview and key policy developments for the 2009/10 financial year 16
2.7 Departmental revenue, expenditure and other specific topics 19
2.8 Programme 1: Administration 20
2.9 Programme 2: Policy Coordination and Environmental Planning 22
2.10 Programme 3: Compliance and Enforcement 32
2.11 Programme 4: Environmental Quality Management 34
2.12 Programme 5: Biodiversity Management 47
Part 3: REPORT OF THE AUDIT COMMITTEE 51
Contact details:
Chief Financial O�cerDepartment of Environmental A�airs and Development Planning
Utilitas Building1 Dorp Street
Cape Town8001
Private Bag X 9086Cape Town
8000
Telephone: +27 21 483 5128Facsimile: +27 21 483 3662
Email: aga�[email protected]: www.capegateway.gov.za/eadp
PR number: PR 274/2010ISBN number: 978-0-621-39648-5
Afrikaans and isiXhosa available on CD and www.capegateway.gov.za/eadp
In the event of any discrepancy between the di�erent translations of this report, the English text will prevail.
Design and Layout: Fizzee Studios cc +27 21 671 1598Printing: Print Active cc

Part 4: ANNUAL FINANCIAL STATEMENTS
Report by the Accounting Officer 55
Report of the Auditor-General 71
Appropriation Statement 75
Notes to the Appropriation Statement 87
Statement of Financial Performance 89
Statement of Financial Position 90
Cash Flow Statement 91
Accounting Policies 92
Notes to the Annual Financial Statements 101
Disclosure Notes to the Annual Financial Statements 112
Annexures 120
Part 5: HUMAN RESOURCE MANAGEMENT
5.1 Service delivery improvement plan 128
5.2 Expenditure 135
5.3 Employment and vacancies 138
5.4 Job evaluation 140
5.5 Employment changes 142
5.6 Employment equity 145
5.7 SMS performance agreements and posts 150
5.8 Performance rewards 153
5.9 Foreign workers 156
5.10 Leave utilisation for the period 1 January 2009 to 31 December 2009 157
5.11 HIV and AIDS and health promotion programmes 159
5.12 Labour relations 161
5.13 Skills development 163
5.14 Injury on duty 166
5.15 Utilisation of consultants 167

i
PART 1
generalINFORMATION

7
INF
OR
MA
TIO
NG e n e ra l
1. GENERAL INFORMATION
1.1 Submission of the Annual Report to the Executive Authority
Provincial Minister of Local Government, Environmental Affairs and Development Planning
As the Accounting Officer, I am pleased to submit the 2009/10 Annual Report of the Department of Environmental Affairs and Development Planning. This Annual Report is presented in terms of Section 40(1)(d) of the Public Finance Management Act (PFMA), 1999.
Section 65(1)(a) of the PFMA requires from you as the Executive Authority, to table the Annual Report in the Provincial Legislature by 30 September 2010. In the event that this is not possible, you are required in terms of section 65(2)(a) of the PFMA to provide a written explanation to the Provincial Legislature.
ACCOUNTING OFFICER
DATE: 31 August 2010
R.J. Ellis (Mr)Head of Department

8
PA
RT
1A n n u a l R e p o r t 2 0 0 9 / 1 0
1.2 Introduction by the Head of Department
Despite the challenges experienced during the 2009/10 financial year, I am proud to report that the Department performed remarkably well.
As part of the modernisation of the Provincial Government, the Department made significant progress with the finalisation of its organisational redesign. This process was influenced by the implementation of the Occupation Specific Dispensation (OSD) for engineers and related professionals and for environmental and biodiversity officers, which required not only calculation adjustments but also revisiting of the proposed establishment. The implementation of the OSD was centrally driven by the Department of Public Service and Administration and this process was only concluded during March 2010, but was applicable from 1 July 2009.
Legislation development, as identified targets in the 2009/10 Annual Performance Plan, proved a major challenge but I am convinced that the lessons learnt and the approach identified will expedite current and future legislation development.
The Department featured prominently during the planning phase of the provincial strategic objectives for the next five years and I am confident that the Department is geared to be a key contributor to successfully achieve the Province’s goals.
The key to the success of this Department is its staff; I would like to thank them for their continued contributions and loyalty. As management, we value your commitment and energy and know that you will make this Department and the Province proud.
1.3 Information on the Ministry
Although Mr P Uys was the Executive Authority responsible for Local Government, Environmental Affairs and Development Planning at the beginning of the financial year, Mr A Bredell was appointed as the Executive Authority after the 2009 general election. During this period no official visits abroad were undertaken by the Executive Authority. The Western Cape Nature Conservation Board, trading as CapeNature, is the provincial public entity responsible for conservation management and reports to the Minister.
The following bills and documents were submitted to the legislature during the financial year:
• Biosphere Reserve Act and regulations, for approval to advertise the Bill for public comment.
• The Draft Health Care Waste Management Amendment Bill which was published in the Government Gazette (PN 361/2009) for public comment.
• A memorandum to obtain approval to publish the Green Procurement Policy as a Green Paper for public comment.

9
INF
OR
MA
TIO
NG e n e ra l
1.4 Vision and mission statement
Vision
An environment conducive to sustainable life.
Mission
To promote environmental integrity that supports human well-being and economic efficiency towards sustainable life in the Western Cape.

10
PA
RT
1A n n u a l R e p o r t 2 0 0 9 / 1 0
1.5
Gen
eral
ove
rvie
w o
f the
Dep
artm
ent
DEP
ART
MEN
TAL
STRU
CTU
RE: T
HE
DEP
ART
MEN
T O
F EN
VIRO
NM
ENTA
L A
FFA
IRS
AN
D D
EVEL
OPM
ENT
PLA
NN
ING
Dire
ctor
:A
. MO
HA
MED
Dire
ctor
:A
.P. B
ARN
ESD
irect
or:
C.K.
RA
BIE
Actin
g D
irect
or:
D. L
AID
LER
Dire
ctor
:J.
LEA
NER
Dire
ctor
:G
.M. A
REN
DSE
Dire
ctor
:E.
PA
LMER
Dire
ctor
:A
.A. G
AFF
OO
RD
irect
or:
I. C
ARO
LUS
Man
ager
:A
.A. G
AN
GER
DIN
E
DEP
ART
MEN
T O
F EN
VIRO
NM
ENTA
L A
FFA
IRS
AN
D D
EVEL
OPM
ENT
PLA
NN
ING
MIN
ISTE
R O
F LO
CA
L G
OVE
RNM
ENT,
EN
VIRO
NM
ENTA
L A
FFA
IRS
AN
D D
EVEL
OPM
ENT
PLA
NN
ING
Hea
d of
Dep
artm
ent:
R.J.
ELLI
S
Prov
inci
al M
inis
ter:
A. B
RED
ELL
Actin
g Ch
ief
Dire
ctor
:A
.P B
ARN
ES
ENVI
RON
MEN
T A
ND
LA
ND
M
AN
AG
EMEN
T
Chie
f Dire
ctor
:D
.J. E
LFO
RD
ENVI
RON
MEN
TAL
AN
D L
AN
D
PLA
NN
ING
FIN
AN
CIA
L M
AN
AG
EMEN
T A
ND
A
DM
INIS
TRAT
ION
Chie
f Dire
ctor
:T.
H. G
ILD
ENH
UYS
INTE
GRA
TED
EN
VIRO
NM
ENTA
L M
AN
AG
EMEN
T(R
egio
n A
)
INTE
GRA
TED
EN
VIRO
NM
ENTA
L M
AN
AG
EMEN
T(R
egio
n B)
STRA
TEG
IC
ENVI
RON
MEN
TAL
MA
NA
GEM
ENT
SPAT
IAL
PLA
NN
ING
POLL
UTI
ON
M
AN
AG
EMEN
TW
AST
EM
AN
AG
EMEN
TLA
W E
NFO
RCEM
ENT
AN
D
AD
MIN
ISTR
ATIO
N
FIN
AN
CEH
UM
AN
RES
OU
RCE
MA
NA
GEM
ENT
AN
D
SHA
RED
LO
GIS
TIC
AL
SERV
ICES
COM
MU
NIC
ATIO
N
AN
D M
ARK
ETIN
G
MA
NA
GEM
ENT
SERV
ICES

11
INF
OR
MA
TIO
NG e n e ra l
1.6 Legislative mandates
Annual Division of Revenue Act
Atmospheric Pollution Prevention Act, 1965 (Act No. 45 of 1965)
Basic Conditions of Employment Act, 1997 (Act No. 75 of 1997)
Constitution of the Republic of South Africa, 1996 (Act No. 108 of 1996)
Constitution of the Western Cape, 1998 (Act No. 1 of 1998)
Disaster Management Act, 2002 (Act No. 57 of 2002)
Electricity Act, 1987 (Act No. 41 of 1987)
Employment Equity Act, 1998 (Act No. 55 of 1998)
Environmental Conservation Act, 1989 (Act No. 73 of 1989)
Forest Act, 1984 (Act No.122 of 1984)
Gas Act, 2001 (Act No. 48 of 2001)
Hazardous Substances Act, 1973 (Act No. 15 of 1973)
Labour Relations Act, 1995 (Act No. 66 of 1995)
Land-use Planning Ordinance, 1985 (Ordinance 15 of 1985)
Marine Living Resources Act, 1998 (Act No. 18 of 1998)
Minerals Act, 1991 (Act No. 50 of 1991)
Mountain Catchment Areas Act, 1970 (Act No. 63 of 1970)
Municipal Finance Management Act, 2003 (Act No. 56 of 2003)
National Environmental Management Act, 1998 (Act No. 107 of 1998)
National Environmental Management: Air Quality Act, 2004 (Act No. 39 of 2004)
National Environmental Management: Biodiversity Act, 2004 (Act No. 10 of 2004)
National Environmental Management: Integrated Coastal Management Act, 2008 (Act No. 24 of 2008)
National Environmental Management: Protected Areas Act, 2003 (Act No. 57 of 2003)
National Environmental Management: Waste Act, 2004 (Act No. 59 of 2008)
National Forest Act, 1998 (Act No. 84 of 1998)
National Monuments Act, 1969 (Act No. 28 of 1969)
National Nuclear Regulator Act, 1999 (Act No. 47 of 1999)
National Roads Traffic Act, 1996 (Act No. 94 of 1996)
National Water Act, 1998 (Act No. 36 of 1998)
Nature and Environmental Conservation Ordinance, 1974 (Ordinance 19 of 1974)
Noise Control Regulations (Provincial Notice 627/1998)
Nuclear Energy Act, 1999 (Act No. 46 of 1999)
Occupational Health and Safety Act, 1993 (Act No. 85 of 1993)
Problem Animal Control Ordinance, 1957 (Ordinance 26 of 1957)
Promotion of Access to Information Act, 2000 (Act No. 2 of 2000)
Promotion of Administrative Justice Act, 2000 (Act No. 3 of 2000)
Provincial Development Council Law, 1996 (Law No. 5 of 1996)
Public Finance Management Act, 1999 (Act No. 1 of 1999)
Public Service Act, 1994 (Proclamation No. 103 of 1994)
Restitution of Land Rights Act, 1994
Seashore Act, 1935 (Act No. 21 of 1935)
Skills Development Act, 1998 (Act No. 97 of 1998)
Skills Development Levies Act, 1999 (Act No. 29 of 1999)
The National Heritage Resources Act, 1999 (Act No. 25 of 1999)
Western Cape Land Administration Act, 1998 (Act No. 6 of 1998)
Western Cape Nature Conservation Board Act, 1998 (Act No. 15 of 1998)
Western Cape Planning and Development Act, 1999 (Act No. 7 of 1999)

12
PA
RT
1A n n u a l R e p o r t 2 0 0 9 / 1 0
1.7 Public entities controlled by the Department
The following provincial entities resort under the responsibility of the Department.
Western Cape Nature Conservation Board
The Western Cape Nature Conservation Board, trading as CapeNature, was established in terms of the Western Cape Nature Conservation Board Act, 1998 (Act No. 15 of 1998). In terms of section 47(1) of the Public Finance Management Act (PFMA), 1999 (Act No. 1 of 1999 as amended by Act No. 29 of 1999), the Minister of Finance listed the Western Cape Nature Conservation Board as a schedule 3, part C provincial public entity with effect from 1 April 2001. The objectives of the Western Cape Nature Conservation Board are:
a) to promote and ensure nature conservation and related matters in the Province;
b) to render services and provide facilities for research and training in connection with nature conservation and related matters in the Province; and
c) pursuing the objectives set out in paragraphs (a) and (b), to generate income.
Environmental Commissioner
Although the Commissioner for the Environment was listed as a schedule 3 part C (PFMA) public entity it was decided not to pursue the establishment of Environmental Commissioner. However, a process was put in motion to obtain approval for the suspension of the process of the establishment of the Office of the Commissioner for the Environment.

PART 2
programme PERFORMANCE

12
PE
RF
OR
MA
NC
EP r o g ra m m e
2. PROGRAMME PERFORMANCE
2.1 Voted funds
Appropriation
Main Appropriation
(R’000)
Adjusted Appropriation
(R’000)
Actual Amount Spent
(R’000)
Under Expenditure
(R’000)
Department 266,757 265,061 263,330 1,731
Responsible Minister Minister of Local Government, Environmental Affairs and Development Planning
Administering Department Department of Environmental Affairs and Development Planning
Accounting Officer Head of Department of Environmental Affairs and Development Planning
2.2 Aim of vote
The aim of the Department is to promote sustainable development, pollution and solid waste management, the protection of biodiversity, provincial, regional and local spatial planning, associated environmental and land development management, coastal management and law enforcement and monitoring.
2.3 Key measurable objectives, programmes and achievements
Key measurable objectives
During the drafting of the 2009/10 Annual Performance Plan, the Department reviewed and confirmed its strategic goals and objectives as identified in the 2005-2009 Five-Year Strategic and Performance Plan.
These strategic goals, which are underpinned by the six strategic objectives are:
Strategic Goals 1. Embedding sustainable development in the growth and development of the Western Cape.
2. Providing cutting-edge leadership and innovative approaches to environmental management and integrated development planning.
3. Enhancing the quality of life of all people through facilitating vibrant, integrated and sustainable human settlements.
4. Accelerating economic growth as well as participation in, and access to, the environmental economy.
Strategic Objectives1. To mainstream the sustainable development paradigm in environmental planning and management.
2. To develop systems, processes and measures to support service delivery.
3. To promote environmental integrity and the progressive realisation of environmental rights.
4. To undertake spatial planning that promotes and guides sustainable development in the Province and redresses spatial inequalities.
5. To provide integrated and holistic environmental management to improve the quality of life of all people in the Western Cape.
6. To develop intervention strategies to facilitate equitable access to, and participation in, the environmental economy.

13
PA
RT
2A n n u a l R e p o r t 2 0 0 9 / 1 0
Programmes
The activities of the Department are organised into five programmes as identified in the environmental sector budget programme structure. These programmes are as follows:
Programme 1: Administration;
Programme 2: Policy Coordination and Environmental Planning;
Programme 3: Compliance and Enforcement;
Programme 4: Environmental Quality Management; and
Programme 5: Biodiversity Management.
Achievements
Detailed discussions of departmental achievements during the 2009/10 financial year features under the respective programme performance. The following highlights the most significant achievements of the Department:
Programme 1: Administration
• Implementation of the Occupation Specific Dispensation (OSD) for engineers and related occupations, biodiversity and environmental officials and geographic information system officials.
Programme 2: Policy Coordination and Environmental Planning
• The amended Draft Biosphere Reserve Bill was submitted to the Provincial Legal Services for final certification.
• A draft Legal Framework for the proposed provincial planning law was compiled.
• A process to review and update the Growth Potential Study was initiated.
• A Biodiversity Fine Scale Plan to cover gap areas within the Province was initiated.
• The George, Knysna and Saldanha Spatial Development Frameworks (SDFs) are progressing satisfactorily and all six SDFs are scheduled to be finalised by the end of October 2010, while an additional six municipalities (Bitou, Mossel Bay, Breede Valley, Hessequa, Cape Agulhas and Theewaterskloof ) were identified as part of phase two of the Built Environment Support Programme (BESP).
• The 2008/09 Sustainable Development Report was completed in the latter part of 2009 and the drafting of the 2009/10 Sustainable Development Report commenced.

14
PE
RF
OR
MA
NC
EP r o g ra m m e
• A draft White Paper on Sustainable Energy was compiled, comments were requested and where appropriate, integrated into the draft White Paper.
• The Regional Regulatory Action Plan (RRAP) was drafted and presented to stakeholders in November 2009.
• The 2008/09 (first) review of the Second Edition Environmental Implementation Plan was submitted to the National Department of Environmental Affairs while the 2009/10 (second) review of the Second Edition is in progress.
• Four internationally recognised environmental days were celebrated.
• A new GIS Server was installed and the migration process from the current GIS Server to the new GIS Server has to be undertaken.
• GIS awareness was identified as another crucial intervention and 13 awareness sessions/events were held.
Programme 3: Compliance and Enforcement
• Complaints received from members of the public, referrals from municipalities, government departments and directorates within the Department were, and are continually investigated. Joint inspections strengthen the ties between the Department and other organs of state.
Programme 4: Environmental Quality Management
• 286 Environmental authorisations were monitored for compliance to conditions of authorisation.
• The Saldanha Bay Environmental Management Framework (EMF) was initiated and the Drakenstein Environmental Management Framework (EMF) was completed.
• 1013 Environmental applications and 1109 planning applications were finalised.
• The Provincial Air Quality Management Plan (AQMP) was finalised, printed and announced at the 2Precious2Pollute programme ceremony.
• The monitoring of ambient air quality took place in Mossel Bay, Vredenburg and Paarl and thereafter the monitoring stations were relocated from Paarl to Worcester, from Vredenburg to Malmesbury and from Mossel Bay to George. A fourth monitoring station was also commissioned and began operating in Maitland, City of Cape Town.
• Good progress was made with the development of the Monitoring and Evaluation (M&E) system to measure implementation of the Climate Change Response Strategy and Action Plan.
• Increased environmental and climate change training was provided to teachers, Community Development Workers and the hospitality sector.

15
PA
RT
2A n n u a l R e p o r t 2 0 0 9 / 1 0
• Solar water heaters were rolled out in various needy communities to stimulate the solar geyser industry in the Western Cape.
• The Department initiated a project to determine the Sea Level Rise Risk assessment for the Eden District coastline.
• The Department initiated a Provincial Programme of Action for Protection of the Marine Environment from land-based activities.
• A Quick Reference Guide on Chemicals Management was produced and distributed.
• 47 Cases of remediation of contaminated land were evaluated and remediation options determined in terms of Section 28 of the National Environmental Management Act (NEMA).
• 17 of the 125 (i.e. 13.6%) authorised waste management facilities were monitored for compliance and eight residents’ monitoring committees were attended as part of the compliance monitoring function.
• Following the public participation and comment process, the Health Care Waste Management Amendment Bill was certified by the Provincial Legal Services and is currently in the parliamentary process.
• The Waste Management in Education (WAME) programme was rolled out to 25 foundation phase educators from schools in the Matzikama area.
• Significant progress was made with the finalisation and translation of a draft Green Paper on a Green Procurement Policy. The Provincial Cabinet was approached to publish the Green Procurement Policy as a Green Paper for public comment.
• The 2Wise2Waste programme, an environmental efficiency programme, was marketed to other provincial departments, municipalities and the public.
• A Waste Minimisation Summit was hosted on 3–4 March 2010 and provided exhibition space that showcased waste minimisation technologies and products.
• An additional four municipalities took part in the pilot test of the Monitoring and Evaluation (M&E) system for Integrated Waste Management Plans (IWMPs) to test factors that could hamper full-scale implementation.
• The development of industry waste management plans for the Consumer Formulated Chemical Sector (CFCS) was facilitated by developing a template and workshopped with industry representatives.
Programme 5: Biodiversity Management
• A survey on Boat Launching Sites in the Province was initiated and finalised at the end of March 2010.
• Part of the implementation of the National Environmental Management: Integrated Coastal Management Act included the appointment of the Coastal Management Unit by the Provincial Cabinet as the lead agent for Coastal Management in the Province and the publication of advertisement for Membership to the Provincial Coastal Committee (PCC).

16
PE
RF
OR
MA
NC
EP r o g ra m m e
2.4 Overview of the service delivery environment for 2009/10
Perhaps one of the major challenges experienced by the Department in meeting its 2009/10 Annual Performance Plan targets relates to legislation. In many instances the drafting of legislation was initiated in previous financial years of which the Department planned to have finalised during the 2009/10 financial year.
Prevailing environmental factors such as court judgements, the promulgation and non-promulgation of national legislation, changes of the executive authorities, new legal opinions as well as the introduction of the modernisation programme significantly contributed to the delivery of set targets. The impact of the preceding factors necessitated that the Department re-examine the drafted legislation and/or commence the formulation process at the initial phase.
Financial constraints remained a fundamental challenge for the Department. Employee compensation savings that accumulated as a result of vacancies were reprioritised during the financial year. However, following the higher than budgeted 2009 annual general salary adjustments and the introduction of the Occupation Specific Dispensation (OSD) for environmental, town and regional planners and geographic information system officials; the Department was forced to reconsider the reprioritisation plan as no additional funding was received.
Effective financial management ensured that the Department addressed the additional expenditure burden, however sustained fiscal increases continued to and will severely impact on target achievements and create higher operational risks for long term planning. The intention of the Department to operationalise the new organisational structure required additional funding. Although the new structure will be introduced in phases, the desired result will not be realised without the required funding.
2.5 Overview of the organisational environment for 2009/10
The line functionaries of the Department predominantly comprise environmental officials, town and regional planners and geographic information system technicians. Specialised skills are required to conduct the various service delivery activities of the Department such as compliance monitoring and law enforcement, environmental monitoring and reporting, spatial and forward planning, pollution and waste management, evaluation of environmental and land-use planning applications, coastal management, biodiversity management and climate change.
The institutional ability to recruit and retain officials equipped with these specialised skills and knowledge has been an ongoing challenge. It is primarily costly to formally train, mentor and coach officials to ensure their efficacy in the workplace. The financial institutional investment into these officials is secondarily negated as these now experienced, trained and skilled officials are recruited by the private sector, municipalities and other government departments, offering higher or market related remuneration packages.
As part of addressing this challenge, the Occupational Specific Dispensation (OSD) was implemented to confidently compete with packages offered by other employers. The Department continued with its refinement exercise and a proposed macro establishment was finalised at the end of the 2009/10 financial year. The Department had to review its first draft macro structure due to these financial implications. This process also prompted a review of the proposed macro structure.

17
PA
RT
2A n n u a l R e p o r t 2 0 0 9 / 1 0
The Provincial Government also introduced a Modernisation Programme and while the investigation into this model continued, a moratorium was placed on the filling of Human Resource Management, Corporate and Finance vacancies. The implementation of the OSD, the related activities to the drafting of the new departmental macro-structure, the introduction of interim financial statements and increasing requests for information, required the Department to appoint contract employees to manage these operational demands.
2.6 Strategic overview and key policy developments for the 2009/10 financial year
Policy developments and legislative changes
• Biosphere Reserve Bill and Regulations
During September 2009, Provincial Cabinet granted approval to advertise the Biosphere Reserve Bill for public comment. The comments were received, considered and the amended Draft Biosphere Reserve Bill was submitted to the Provincial Legal Services for final certification. Progress with regard to the drafting of the Biosphere Reserve Act was hindered by changes of the Executive Authority experienced over the past two years. The support of the Executive Authority was crucial to facilitate the legislative process.
• Provincial Planning and Development Amendment Bill and the Land Use Planning Act
A Provincial Planning and Development Act (PDA) was approved in 1999 and two sections were implemented to facilitate the establishment of a Planning Review Board. Legislative changes necessitated the need to amend the approved PDA and an Amendment Bill was compiled and submitted to the Executive Authority in 2002/03. At this stage the Executive Authority decided on a process to draft a new provincial integrated law to integrate planning, environment and heritage requirements into one ideal provincial law. A draft Integrated Bill was compiled by March 2007 but could not proceed because it required changes to National Legislation. The Executive Authority decided that the Department proceed with the PDA Amendment Bill, but court judgements and promulgation of National Legislation suggested that the PDA Amendment Bill must totally be redrafted. Instead it was decided to develop a new Provincial Land Use Planning Act (LUPA) to ensure improved alignment with planning and other development legislation and a first draft was finalised in March 2009. However, a Supreme Court of Appeal judgement suggested that the approach followed in the first draft of LUPA needed to be revisited and it was decided to develop a consensus legal framework, that is constitutionally acceptable, to guide the development of the proposed new provincial planning law. A draft legal framework for the proposed provincial planning law was compiled and discussed with representatives of municipalities and presented during a meeting of the Premier’s Coordinating Forum (PCF) that was attended by the Minister, Mayors and Municipal Managers on 17 March 2010.
• Provincial Spatial Development Framework and Associated Manuals
The Provincial Spatial Development Framework (PSDF) was approved by the Executive Authority on 24 June 2009. As part of the implementation of the PSDF, draft manuals were compiled but the public participation process could not proceed before the approval of the PSDF. Subsequently the manuals were advertised for comment and workshops were conducted during November/December 2009. The closing date for comments on the manuals was 29 January 2010.

18
PE
RF
OR
MA
NC
EP r o g ra m m e
• Growth Potential Study
The Department embarked on a process to review and update the Growth Potential Study. This review will also be used as an important informant of the Provincial Spatial Plan that the Department will embark upon in the 2010/11 financial year.
• Biodiversity Fine Scale Plan
The Department embarked on a Biodiversity Fine Scale Plan to cover gap areas within the Province that were not covered by previous studies. This Biodiversity Fine Scale Plan will assist, especially rural municipalities, in compiling municipal and provincial spatial plans to recognise and protect areas of high biodiversity value within their jurisdiction.
• Municipal Spatial Development Frameworks
As part of the Built Environment Support Program (BESP), the Department is responsible for the compilation of credible municipal Spatial Development Frameworks (SDF) for Knysna, George, Overstrand, Stellenbosch, Drakenstein and Saldanha. The George, Knysna and Saldanha SDFs are progressing satisfactorily and it is anticipated that the SDFs will be finalised by the end of October 2010. Simultaneously, an additional six municipalities were identified as part of phase two of the BESP. These municipalities are Bitou, Mossel Bay, Breede Valley, Hessequa, Cape Agulhas and Theewaterskloof.
• White Paper on Sustainable Energy
In partnership with Sustainable Energy Africa (SEA) and through funding by the British High Commission, the Department embarked on the Western Cape Clean Energy Governance Programme. This programme included the development of the Western Cape White Paper on Sustainable Energy. A draft White Paper on Sustainable Energy was compiled which, when approved, will be followed by a Sustainable Energy Bill.
• Environmental Management Framework
The Department initiated the Saldanha Bay Environmental Management Framework (EMF) and completed the development of the Drakenstein Environmental Management Framework (EMF). However, the approval of all EMFs are dependent on the promulgation of the amended National Environmental Management Act: Environmental Impact Assessment (NEMA: EIA) Regulations which have not yet come into effect, hence the approval of the EMFs could not happen.
• Provincial Air Quality Management Plan
The finalised Provincial Air Quality Management Plan (AQMP) was launched at the 2Precious2Pollute programme ceremony. Four public participation and three sector workshops were held as part of the public participation process, while regular Project Steering and Technical Committee meetings were held. A Status Quo Report on Air Quality Management in the Western Cape was also produced.

19
PA
RT
2A n n u a l R e p o r t 2 0 0 9 / 1 0
• Sea Level Rise Risk Assessment - Eden
A project was initiated to determine the Sea Level rise risk assessment for the Eden District coastline. Draft status and modelling reports were provided while the final reports and digital maps need to be finalised. Similar studies for the remainder of the provincial coastline are planned to be undertaken in the current and subsequent financial years.
• Provincial Noise Control Regulations
The finalisation of the reviewed Provincial Noise Control Regulations was delayed when Provincial Legal Services raised concerns on the constitutionality of the Regulations, which was contrary to their initial opinion. The Department requested an external legal opinion to verify this opinion. If upheld, the revised Regulations cannot be promulgated without substantial amendment or possible further enactment of framework legislation.
• Western Cape Health Care Waste Management Amendment Act
The Western Cape Health Care Waste Management Act (HCWMA) (Act No. 7 of 2007) and regulations could not be implemented due to alignment with the NEMA: Waste Act that commenced on 1 July 2009. The drafting of the amendment to the HCWMA commenced and the Draft Health Care Waste Management Amendment Bill was published in the Government Gazette for public comment. Comments on the draft were processed and the Health Care Waste Management Amendment Bill was certified by Provincial Legal Services and is currently in the parliamentary process.
• Green Procurement Policy
Following comments from the reference group, significant progress was made with the finalisation and translation of a draft Green Paper on a Green Procurement Policy. A memorandum was submitted to obtain approval from the Provincial Cabinet to publish the Green Procurement Policy as a Green Paper for public comment.
• National Environmental Management: Integrated Coastal Management Act
Part of the implementation of the National Environmental Management: Integrated Coastal Management Act included the appointment of the Coastal Management Unit of the Department as the lead agent for Coastal Management in the Province, while an advertisement for Membership to the Provincial Coastal Committee (PCC) was also placed. The Department also initiated a project to determine Boat Launching Sites in the Province. This project enables the Department to improve the management of these sites and enforce compliance.

20
PE
RF
OR
MA
NC
EP r o g ra m m e
2.7 Departmental revenue, expenditure and other specific topics
Collection of departmental revenue
Against a moderate departmental revenue budget of R106,000, the Department collected R1,044 million. Major revenue collections are in respect of fines imposed by the National Environmental Management Act (NEMA) Section 28G which deals with environmental transgressions and recovery of previous financial years’ transactions.
The table below provides a breakdown of the sources of revenue:
2006/07 Actual
R’000
2007/08 Actual
R’000
2008/09 Actual
R’000
2009/10 Target
R’000
2009/10 Actual
R’000
% Deviation from Target
Non-tax revenue 74 141 530 106 721 580.2Sales of goods and services other than capital assets 32 38 27 56 63 12.5
Fines, penalties and forfeits 20 99 475 50 614 1 128Interest, dividends and rent on land 4 18 4
Sales of capital assets (Capital Revenue) 22 10 40
Financial transactions (Recovery of loans and advances) 112 113 210 323
TOTAL DEPARTMENTAL RECEIPTS 186 254 740 106 1,044 884.9
Departmental expenditure
The total original budget allocated to the Department was R266,757 million which was subsequently reduced during the Adjustments Estimates to R265,061 million. Included in the total adjusted budget is the amount of R133,272 million which was transferred to the provincial conservation public entity, the Western Cape Nature Conservation Board. Total expenditure for the financial year amounts to R263,330 million, with under spending totaling R1,731 million. Details of the final budget and expenditure per programme are as follows:
Programmes
Voted for 2009/10
Roll-Overs and
Adjustments
Virement Total Voted Actual Expenditure
Variance
R’000 R’000 R’000 R’000 R’000 R’0001 : Administration 35,649 35,129 1,815 36,944 36,943 12 : Policy Coordination and Environmental Planning 25,317 23,518 (1,140) 22,378 21,066 1,312
3 : Compliance and Enforcement 7,798 9,263 1,480 10,743 10,742 14 : Environmental Quality Management 58,576 59,684 (2,155) 57,529 57,197 332
5 : Biodiversity Management 139,417 137,467 0 137,467 137,382 85TOTAL 266,757 265,061 0 265,061 263,330 1,731

21
PA
RT
2A n n u a l R e p o r t 2 0 0 9 / 1 0
Transfer payments
Total transfer payments for the 2009/10 financial year were R134,351 million. As the provincial public entity responsible for conservation management, CapeNature received the majority of the total transfer payments at R133,272 million or 99.2%. Other transfer payments included R314 000 to the Cape West Coast Biosphere Reserve (CWCBR), R200 000 to the Kogelberg Biosphere Reserve (KBR), R60 000 to the University of Stellenbosch as part of a rehabilitation programme of a degraded wetland on the Rietenbosch school premises, R323 000 to Government Motor Transport for the purchase of vehicles, R178 000 to external full-time bursary holders, R2 000 as Injury on duty claims to staff members and R2 000 in respect of worm composting kits and garden tools to schools.
Capital investment, maintenance and asset management plan
Assets of the Department predominantly include machinery and equipment such as office furniture, information technology and related equipment, air quality monitoring stations and minor assets. These assets are managed by means of an electronic asset management system, which are updated and reconciled with the accounting records.
2.8 Programme 1: Administration
Purpose:
The aim of this programme is to provide overall management of the Department and centralised support services.
Measurable objective:
To establish policies, processes and systems to ensure an enabling corporate service environment.
Service delivery objectives and indicators:
Part of the 2009/10 annual salary increases included the implementation of the Occupation Specific Dispensation (OSD) for engineers and related occupations. Within the Department, staff in the environmental and biodiversity departments, town and regional planners and geographic information technician fields were affected and accounted for more than 60% of the total staff establishment of the Department.
The Department continued with the creation of a new organisational structure, which was at an advanced stage of finalisation and approval at 31 March 2010. The implementation of the OSD, especially the associated financial implications, also impacted on the proposed structure, and the Department explored alternatives in implementing the proposed organisational structure.

22
PE
RF
OR
MA
NC
EP r o g ra m m e
The Communication and Marketing Management Services (CMMS) unit continued to align its strategic and operational functions and responsibilities with the communications mandate as outlined by the Government Communication and Information Systems (GCIS). Although the strategic progress cannot be measured, significant operational milestones were achieved.
A Memorandum of Understanding between the National Department of Environmental Affairs and the Western Cape Department of Environmental Affairs and Development Planning was agreed on. Four annual meetings are held to discuss a strategic approach to harness, co-ordinate and support environmental communication efforts in the public sector. This forum is a progressive platform at which to identify other stakeholders such as private sector and non-governmental organisations with which to establish cooperative communication relationships. This forum aids the formulation of environmental community outreach and stakeholder engagement projects and programmes that seek to empower communities on environmental rights.
The external communication function of the Department was enhanced through constant media management. A three phase media plan was executed during the Coastal Cleanup Week while focus media management was implemented for the Cleanest Town Competition and during the Cape Town Green Week. The aim of media management is to promote the work of the Department and more importantly to share environmental information with the public by using the media as a platform of communication.
Institutional communication is primarily managed by the production of the monthly internal newsletter, Green Ambassador. The newsletter is communicated to staff in the George and Cape Town Offices as well as other provincial departments ensuring greater awareness of Departmental projects and more specifically showcasing the work being carried out by the internal line functions.
CMMS commenced and continues to manage a website audit. This involves the cooperative support of the line functions to update information on the Departmental website. This process is progressive as the changes affect internal and external communication responsibilities. A branding exercise was completed by CMMS to ensure that strategic corporate communication is aligned and that the Department was holistically represented to external stakeholders and that key messages are disseminated to target audiences. The outputs of the branding exercise were effected on the departmental website portal for consistency.

23
PA
RT
2A n n u a l R e p o r t 2 0 0 9 / 1 0
Service delivery achievements:
Programme
Outputs Output Performance Measures/Service Delivery Indicators
Actual Performance against Target
Target Actual
Prog
ram
me
1: A
dmin
istr
atio
n
To render sound Business Process Support Services.
Unqualified Auditor-General (AG) Report.
Financial Management Level rating.
Unqualified Auditor-General Report.
Financial Management Level 3 rating.
Financial reports discussed at Strategic, Finance and General meetings with Senior Management.
Unqualified Auditor-General Report received in respect of the 2008/09 financial year. 2008/09 fourth quarter and 2009/10 first to third quarter non-financial performance reports were submitted to the Minister, Provincial Treasury and the Shared Audit Committee.
To render sound corporate services.
Number of capacity-building workshops conducted.
12 Capacity-building workshops conducted.
30 Capacity-building workshops conducted on Finance and Human Resource related matters.
Review Departmental institutional structure.
Phased in implementation of a new institutional structure.
Following the implementation of the Occupation Specific Dispensation (OSD), the macro structure and financial implications were revisited and in-principle approval obtained for the new structure. Engagements with the unions and related parties continue before final approval by the Minister.
2.9 Programme 2: Policy Coordination and Environmental Planning
Purpose:
The aim of the programme is to ensure the integration of environmental objectives in national, provincial and local government planning, including provincial growth and development strategies, local economic development plans and integrated development plans. The programme includes cross-cutting functions, such as research, departmental strategy and information management.
The programme Policy Coordination and Environmental Planning is divided into the following sub-programmes:
2.1. Intergovernmental Coordination, Spatial and Development Planning;
2.2. Research and Development Support; and
2.3. Information Management Services.

24
PE
RF
OR
MA
NC
EP r o g ra m m e
Measurable objectives:
The following measurable objectives applicable to this programme were identified and included in the 2009/10 Annual Performance Plan of the Department:
• To support strategic decision-making and interventions to enhance planning and environmental management.
• To implement monitoring measures, policies and programmes for environmental protection.
• To provide strategic direction with regard to land-use management.
• To develop and implement spatial development measures to promote sustainable development.
Service delivery objectives and indicators:
Sub-programme 2.1: Intergovernmental Coordination, Spatial and Development Planning
• The 2009/10 Annual Performance Plan deliverables included the approval and implementation of Acts and its associated regulations. In respect of the proposed Biosphere Reserve Act and regulations, the Cabinet, in September 2009, gave approval to advertise the Bill for public comment. After the advertising period closed on 29 November 2009, all comments received on the Draft Biosphere Reserve Bill were considered and the Bill was amended accordingly. Subsequently the amended Draft Biosphere Reserve Bill was submitted to the Provincial Legal Services for final certification. Progress with regard to the drafting of the Biosphere Reserve Act was hindered by changes in the Executive Authority that the Department experienced over the last two years. The support of the Executive Authority was crucial to facilitate the legislative process.
• A Provincial Planning and Development Act (PDA) was approved in 1999. Two sections of the mentioned Act were implemented to facilitate the establishment of a Planning Review Board. At that stage, certain national legislation was promulgated (Local Government Systems and Structures Act) which necessitated the amendment of the approved PDA. A PDA Amendment Bill was compiled in 2002/03 and submitted to the Executive Authority. In 2004 the Executive Authority decided not to proceed with the PDA amendment process. Instead the Executive Authority instructed the Department to embark on a new provincial integrated law reform process to integrate planning, environment and heritage requirements into one ideal provincial law. A draft Integrated Bill was compiled by March 2007. The implementation of this draft Integrated Bill required amendments to National Legislation (environment and heritage). To facilitate this process, the Executive Authority indicated that he/she would engage with his/her national counterparts to facilitate proposed amendments to National Legislation. Subsequently in 2008, the Executive Authority instructed the Department to proceed with the PDA Amendment Bill, but due to certain court judgements and the coming into effect of other National Legislation, it was decided to totally redraft the PDA and develop a new Provincial Land Use Planning Act (LUPA) to ensure improved alignment with planning and other development legislation. A first draft of LUPA was finalised in March 2009. However, a judgement issued by the Supreme Court of Appeal suggested that the approach followed in the first draft of LUPA needed to be revisited. To promote transparency and openness and to ensure the buy-in of other spheres of government it was decided to develop a consensus legal framework, which is constitutionally acceptable, to guide the development of the proposed new provincial planning law. A draft Legal Framework for the proposed provincial planning law was compiled and discussed with representatives of municipalities and presented during a meeting of the PCF that

25
PA
RT
2A n n u a l R e p o r t 2 0 0 9 / 1 0
was attended by the Minister, Mayors and Municipal Managers on 17 March 2010. All parties needed to submit their comments on the framework before 16 April 2010.
Due to the current effort to reduce red-tape which delays development in the Province, the Land Use Planning Ordinance (LUPO) and other legislation were also put under scrutiny and as a result, it became part of the provincial modernisation process.
As a result of the aforementioned, the process of drafting or converting policies into regulations in terms of the Planning and Development Act, as required in the 2009/10 Annual Performance Plan, could not yet be initiated since the proposed new provincial planning law has not been finalised.
• Although the first draft of the manuals were finalised departmentally in the 2008/09 financial year, the public participation process could not proceed before the Provincial Spatial Development Framework (PSDF) was approved. Due to the sensitive nature of some of the manuals it was necessary that the Executive Authority approve the publication of the manuals for public participation purposes. The approval of the PSDF was granted on 24 June 2009. Permission to go out on public participation of the manuals was obtained in September 2009. Subsequent to this, the Department advertised the manuals for comment and conducted workshops during November/December 2009. The closing date for comments on the manuals was 29 January 2010. The Department of Agriculture requested that the manual on Rural Land Use Planning and Management not be finalised until alignment between the manual and the Provincial Rural Development Strategy has been facilitated. Although a draft manual on Inclusionary Housing was produced, it could not be finalised because the National Department of Human Settlements has not yet finalised their National framework on Inclusionary Housing. The manual on Settlement Restructuring was completed but was not submitted to the Executive Authority for approval as the Department considered the approval of all these manuals as a package that needed to be approved simultaneously as it forms the backbone of the PSDF.
• The Department embarked on the following additional new projects:
- A process to review and update the Growth Potential Study which was an important informant in the drafting of the PSDF. The review of the Growth Potential Study will also be used as an important informant of the Provincial Spatial Plan that the Department will embark on in the 2010/11 financial year.
- A Biodiversity Fine Scale Plan to cover gap areas within the Province that were not covered by previous studies. The purpose of this study is to assist, especially rural municipalities in compiling municipal and provincial spatial plans to recognise and protect areas of high biodiversity value within their jurisdiction.
• The Department, together with the former Department of Local Government and Housing is responsible for the Built Environment Support Program (BESP). In terms of the BESP, the Department of Environmental Affairs and Development Planning is responsible for the compilation of six credible municipal Spatial Development Frameworks for Knysna, George, Overstrand, Stellenbosch, Drakenstein and Saldanha. A request by the Acting Head of Department of Local Government and Housing to expand the project beyond the original brief, executive challenges experienced within Stellenbosch, Drakenstein’s request to delay the process and Overstrand’s request for an extension due to certain technical investigations, led to delays in the finalisation of these SDFs. Although not finalised, the George, Knysna and Saldanha SDFs are progressing satisfactorily. All six SDFs are scheduled to be finalised by the end of October 2010. Simultaneously, an additional six municipalities were identified as part of phase two of the BESP. These municipalities are Bitou, Mossel Bay, Breede Valley, Hessequa, Cape Agulhas and Theewaterskloof.

26
PE
RF
OR
MA
NC
EP r o g ra m m e
Sub-programme 2.2: Research and Development Support
• The Department plays a lead role in the Province with regard to environmental monitoring and management. To fulfill this role the Department produces an annual Sustainable Development Report to assess the performance of the Provincial government against set indicators and targets in maintaining environmental integrity. The 2008/09 Sustainable Development Report was completed in the latter part of 2009 and the drafting of the 2009/10 Sustainable Development Report commenced. The finalisation of this report can only take place after taking into consideration the relevant performance information of other Provincial departments against the set indicators and targets, when available. This document will be finalised during the 2010/11 financial year.
• As part of the drive to promote sustainability, the Department, in partnership with Sustainable Energy Africa (SEA), which is funded by the British High Commission, embarked on the Western Cape Clean Energy Governance Programme. This programme included the development of the Western Cape White Paper on Sustainable Energy. A draft White Paper on Sustainable Energy was compiled and comments were requested from Provincial Legal Services, all provincial departments and municipalities. These comments have been assessed and where appropriate, integrated into the draft White Paper. Due to rapid developments within the renewable energy sector and to ensure and enhance the relevance of this document, the finalisation was delayed. The White Paper will be submitted to Provincial Cabinet for in-principle approval and thereafter advertised for public comment. Flowing from the White Paper process, a Western Cape Sustainable Energy Bill followed and in-principle approval to draft this Bill was granted by Provincial Cabinet.
• In addition to the White Paper, other initiatives to promote the development of sustainable energy in the Province have been undertaken in partnership with a number of external partners and service providers. Some of the key partnership projects are listed below:
Western Cape Renewable Energy Regional Policy Framework - Partners: ESKOM and funded by Deutsche Gesellschaft für Technische Zusammenarbeit (GTZ).
The Department together with the GTZ and ESKOM signed a cooperation agreement with the objective to support the creation of a regulatory framework by developing a Regional Regulatory Action Plan (RRAP) which includes:
- identification of the barriers to expand the use of renewable energy, particularly wind energy in the Western Cape;
- identification of needs to meet the provincial renewable energy targets;
- a process map of the legal requirements for the development of wind farms to expedite the understanding of the legal requirements by developers;
- investigation of financing mechanisms for projects (from both a provincial and development perspective);
- proactive wind energy planning;
- proposals for municipalities to include wind energy in their development plans (IDPs and SDFs);

27
PA
RT
2A n n u a l R e p o r t 2 0 0 9 / 1 0
- facilitation of negotiations between the National Energy Regulator of South Africa (NERSA) and ESKOM to clarify technical, legal and financial areas of uncertainty;
- recommendations relating to small scale feed in tariffs to supplement the recently announced, large scale feed in tariffs for independent power producers; and
- a further focus of the project was regional capacity development in wind energy technology and integration of wind energy into the national grid.
The following events were held in relation to capacity development:
- a two–day series of wind energy workshops were held in May 2009 involving a wide range of stakeholders in wind energy industry development; and
- a technical workshop for ESKOM officials in the use of grid planning software was held in June 2009.
The Regional Regulatory Action Plan (RRAP) was presented to stakeholders at the final workshop in November 2009 and completed in December 2009. The document was extremely well received by all stakeholders. It has been uploaded to the Wind Action Group website, detailed in the following paragraphs:
- initialisation of the development of a Renewable Energy Cluster in the Western Cape, consisting of thematically differentiated regional Action Groups including the development and launch of a website for the distribution of information (http://www.wind-action-groups.com); and
- compilation of an electricity distribution grid-study to investigate the accommodation of 2800 megawatts from wind energy sources based on the current wind energy applications to ESKOM. The study was completed and the final report was presented to stakeholders at the final workshop in November 2009 and also published on the website in December 2009. Arising from this initiative the National Department of Energy is now undertaking further grid studies elsewhere in the country.
• The Province is required in terms of the National Environmental Management Act (NEMA) to report to the National Department of Environmental Affairs (DEA) on environmentally related activities undertaken by the Provincial Government to enable the DEA to exercise a co-coordinating function between Provincial Governments and National departments. The statutory required report is the provincial Environmental Implementation Plan (EIP). A new edition of the EIP is required every fourth year and every other year DEA requires a revision of the current edition. The 2008/09 (first) review of the Second Edition EIP was submitted to the National Department of Environmental Affairs during the reporting period. The 2009/10 (second) review of the Second Edition is in progress and in terms of NEMA will be submitted to DEA within four months of the end of the 2009/10 financial year.
• Four internationally recognised environmental days were celebrated during the 2009/10 financial year i.e. World Environment Day, Arbour Day, Habitat Day and Wetlands Day. World Environment Day was celebrated in Prince Albert in conjunction with the Municipality. More than 300 children and senior officials of government departments in the town attended and a presentation on Climate Change was also communicated. Arbour Day was celebrated in conjunction with the Mossel Bay Municipality. More than 300 children from local schools attended the event that was accompanied by a tree planting ceremony in a public space close to the

28
PE
RF
OR
MA
NC
EP r o g ra m m e
historical Post Office tree. World Habitat Day was celebrated through participation in a coastal clean-up event hosted by the Eden District Municipality. World Wetlands day was celebrated at Rietenbosch Primary School in Stellenbosch. The event involved the launch of a rehabilitation programme, partly funded by the Department, of a degraded wetland on the school premises and an art competition communicating the value of wetlands.
Sub-programme 2.3: Information Management Services
• The Department continued with the deployment of the web-enabled GIS on the network and performed functionality refinement and testing. However, increased demand for GIS services required further maintenance, enhancement and skills transfer and an additional GIS file server was acquired to optimise system performance and create more storing space. The new GIS server was installed and the migration process from the current GIS server to the new GIS server has to be undertaken. Four internal information sharing/training sessions were held to transfer knowledge to staff members.
• GIS awareness was identified as another crucial intervention and 13 awareness sessions/events were held. School learners were targeted and nine secondary schools were visited and exposed by means of practical GIS sessions. In this process 49 teachers and 1356 learners were reached.

29
PA
RT
2A n n u a l R e p o r t 2 0 0 9 / 1 0
Service delivery achievements:
Sub-ProgrammeOutputs Output Performance
Measures/Service Delivery Indicators
Actual Performance against Target
Target Actual
Sub-
prog
ram
me
2.1:
Inte
rgov
ernm
enta
l Coo
rdin
atio
n, S
patia
l and
Dev
elop
men
t Pla
nnin
g
To render sound Western Cape Provincial Spatial Development Framework (WC PSDF) related capacity-building services.
Number of capacity-building workshops conducted.
Conduct six capacity-building workshops on the Western Cape Provincial Spatial Development Framework.
Conduct six capacity-building workshops on the Settlement Restructuring, Rural Planning and Management Guideline, SDF Guideline, Inclusionary Housing (Voluntary) Manual.
12 Capacity-building workshops were conducted on the PSDF and the manuals on Settlement Restructuring, Rural Planning and Management and Inclusionary Housing.
Amounts transferred to Biosphere Reserve Committees versus budget allocated (%).
Transfer 100% of allocated amounts.
Monitor and report on utilisation of previously allocated funds.
100% of the allocated funds for Biosphere Reserves were transferred (R314 000 to the Cape West Coast Biosphere Reserve (CWCBR) and R200 000 to the Kogelberg Biosphere Reserve (KBR)).
Business Plans for the CWCBR and KBR were approved and payments in respect of the funds were approved. An additional R120 000 was provided to the Western Cape Nature Conservation Board to support an application to UNESCO for the registration of the Gouritz Biosphere Reserve.
The Department monitored the spending of both current and historical funds of the Biosphere Reserves on a monthly basis.
To ensure a sound regulatory framework.
(Legislative and policy instruments).
New legislative instrument milestones met versus planned.
Approve Biosphere Reserve Act Regulations.
Approval and implementation of the Biosphere Reserve Act.
Develop Regulations with regard to specific functional areas as required by the Planning and Development Amendment Act (PDA) to facilitate implementation.
The Biosphere Reserve Act and its regulations have not been approved or implemented, but a draft Biosphere Reserve Bill was completed.
Due to the change in the approach to the development of the provincial planning law, the Department could not proceed with the compilation of regulations in terms of the PDA as required.
Finalise, promulgate and implement Western Cape Planning and Development Amendment Act (WCPDA).
The Planning and Development Amendment Act has not been finalised. A change in the approach to provincial planning legislation was necessitated by changing circumstances and as a result a first draft legal framework was compiled to guide the development of legislation.

30
PE
RF
OR
MA
NC
EP r o g ra m m e
Sub-ProgrammeOutputs Output Performance
Measures/Service Delivery Indicators
Actual Performance against Target
Target Actual
Sub-
prog
ram
me
2.1:
Inte
rgov
ernm
enta
l Coo
rdin
atio
n, S
patia
l and
Dev
elop
men
t Pla
nnin
g
To ensure a sound regulatory framework.
(Legislative and policy instruments).
New legislative instrument milestones met versus planned.
Finalise and implement regulations specifically for the administrative roll-out as required by the Western Cape Planning and Development Amendment Act.
Due to the change in the approach to the development of the provincial planning law, the Department could not proceed with the regulations.
New policy instrument milestones met versus planned (%).
Finalise policy instruments initiated in the previous year and convert into Regulations in terms of the Planning and Development Amendment Act (PDA).
Develop two Provincial Spatial Development Framework-based and/or other spatial planning policy aspects.
The conversion of policy instruments into regulations in terms of the Western Cape Planning and Development Act could not be finalised due to a change in the approach to provincial planning legislation.
Final draft of the Climate Change Guidelines for the Western Cape: Climate Change Adaptation and Mitigation considerations were completed.
A final draft Spatial Development Framework (SDF) guideline document was developed but finalisation was delayed due to the interpretation of constitutional competencies with regard to planning.
The Department initiated the Review of the Growth Potential Study which was one of the informants of the PSDF.
The Department embarked on a Biodiversity Fine Scale planning project in support of municipal and provincial spatial plans.
To provide a development facilitation advisory service to municipalities and other Western Cape provincial government departments.
Number of development facilitation advisory services provided versus requested (n).
100% Functional Development Facilitation Unit (DFU).
Complete operationalisation of the Development Facilitation Unit.
The Development Facilitation Unit (DFU) is fully operational and adequately responded to all requests (more than 100 requests received during the year) for development facilitation advisory services (advice and support) received from the Western Cape municipalities and State departments (Planning and Environmental policy, legislative and project related advice and support).
Undertook capacity-building on environmental and planning matters with more than 20 external capacity-building workshops which included municipalities in the different districts.
Actively participated in the Annual Municipal Integrated Development Plan (IDP) review process (with all 30 IDPs reviewed) as well as with the Local Government Turnaround Strategy (TAS).

31
PA
RT
2A n n u a l R e p o r t 2 0 0 9 / 1 0
Sub-ProgrammeOutputs Output Performance
Measures/Service Delivery Indicators
Actual Performance against Target
Target ActualSu
b-pr
ogra
mm
e 2.
1: In
terg
over
nmen
tal C
oord
inat
ion,
Spa
tial a
nd D
evel
opm
ent P
lann
ing
To provide a development facilitation advisory service to municipalities and other Western Cape provincial government departments.
Integrated Development Plans (IDPs) reviewed for environmental content and compliance with the Western Cape Provincial Spatial Development Framework (WCPSDF) versus requests received (%).
Review Integrated Development Plans and Spatial Development Frameworks (SDFs) received for environmental content and compliance with the Western Cape Provincial Spatial Development Framework as part of the Integrated Development Plan assessment process.
Two IDPs that were submitted for review were finalised.
Evaluation of development applications in terms of the Western Cape Provincial Spatial Development Framework and related spatial policies versus requests received (%).
Evaluation of development applications in terms of the Western Cape Provincial Spatial Development Framework and related spatial policies.
A total number of 40 applications (including Guide Plan amendments and environmental applications) were evaluated in terms of their alignment with the PSDF and other related spatial policies. In addition, comments were provided on Municipal SDFs or elements of it as requested.
Municipal Spatial Development Frameworks developed in terms of the Built Environment Support Programme (BESP) (n).
Manage the drafting and compilation of six credible Spatial Development Frameworks in terms of the Built Environment Support Programme.
The development of the six SDFs in terms of the BESP could not be finalised due to the expansion of the project beyond the original brief and in some instances certain technical investigations. Although not finalised, the George, Knysna and Saldanha SDFs are progressing satisfactorily. All six SDFs are scheduled to be finalised by the end of October 2010.
The Terms of Reference for the Second Round of the BESP was advertised in February 2010 and a briefing session has taken place.

32
PE
RF
OR
MA
NC
EP r o g ra m m e
Sub-ProgrammeOutputs Output Performance
Measures/Service Delivery Indicators
Actual Performance against Target
Target Actual
Sub-
prog
ram
me
2.2:
Res
earc
h an
d D
evel
opm
ent S
uppo
rt
To coordinate the implementation of the Sustainable Development Implementation Plan (SDIP).
Sustainable Development Implementation Plan targets implemented.
Report on the implementation of the Sustainable Development Implementation Plan targets.
The 2008/09 Sustainable Development Report was completed in the latter part of 2009 and the drafting of the 2009/10 Sustainable Development Report commenced. The finalisation of this report can only take place after considering the relevant performance information of other provincial departments against the set indicators and targets, when available. This document will be finalised during the 2010/11 financial year.
Implementation of the Sustainable Energy Strategy.
Western Cape Sustainable Energy White Paper implemented.
Approval and implementation of the White Paper on Sustainable Energy for the Western Cape.
A draft White Paper on Sustainable Energy was compiled and comments were requested from Provincial Legal Services, all Provincial departments and municipalities. These comments have been assessed and where appropriate, integrated into the draft White Paper. Due to rapid developments within the renewable energy sector and to ensure and enhance the relevance of this document, the finalisation was delayed. The White Paper will be submitted to Provincial Cabinet for in-principle approval and thereafter advertised for public comment.
To promote environmental awareness.
Number of environmental awareness raising interventions and events.
Celebrate four environmental events.
Four environmental days were celebrated during the 2009/10 financial year, namely, World Environment Day, Arbour Day, Habitat Day and Wetlands Day.
Review the Environmental Implementation Plan (EIP).
Review the Environmental Implementation Plan.
Submit second annual review of Environmental Implementation Plan.
A 2008/09 (first) review of the second Edition EIP was submitted to the National Department of Environmental Affairs (DEA). The 2009/10 (second) review is in progress and in terms of NEMA must be submitted to DEA within four months of the end of the 2009/10 financial year.
Sub-Programme Outputs Output Performance
Measures/Service Delivery Indicators
Actual Performance against Target
Target Actual
Sub-
prog
ram
me
2.3:
Info
rmat
ion
Man
agem
ent
Serv
ices
To promote the use of spatial information technology to support environmental planning and management.
Web-enabled Information System enhanced and maintained.
Enhance and maintain web-enabled Information System.
The web GIS System functionality and data content have been enhanced and maintained and the system was deployed onto a new GIS server.
Number of Geographic Information System (GIS) awareness initiatives undertaken versus planned.
Undertake four Geographic Information System awareness initiatives.
13 GIS awareness sessions/events were held and participated in, which included the following:
• two GISSA GIS week events;
• one Departmental GIS day event;
• one Public Service week celebration; and
• nine Secondary schools visited.

33
PA
RT
2A n n u a l R e p o r t 2 0 0 9 / 1 0
2.10 Programme 3: Compliance and Enforcement
Purpose:
The aim of the programme is to ensure that environmental compliance monitoring systems are established and implemented, to enforce legislation and environmental authorisations, build compliance monitoring and enforcement capacity through the establishment and training of environmental management inspectorates, act on complaints and notifications of environmental infringements and undertake to monitor these complaints and enforce environmental compliance where required.
Measurable objective:
To support strategic decision-making and interventions to enhance planning and environmental management.
Service delivery objectives and indicators:
• 100% of complaints received from members of the public, referrals from municipalities, government departments and directorates within the Department were investigated by the Compliance and Enforcement unit.
• Joint inspections have served to strengthen ties between the Department and other organs of state. The inspections have further assisted in providing a view of government that is united in its fight to protect the environment.
• The Environmental Crime Forum was established on 29 June 2009. No further meetings were held due to poor attendance by other law enforcement agencies.

34
PE
RF
OR
MA
NC
EP r o g ra m m e
Service delivery achievements:
ProgrammeOutputs Output Performance
Measures/Service Delivery Indicators
Actual Performance against Target
Target Actual
Prog
ram
me
3: C
ompl
ianc
e an
d En
forc
emen
t
To ensure effective environmental compliance and enforcement of the relevant environmental legislation.
Percentage of complaints investigated versus received.
Investigate all complaints received and act on 70% of those that warrant further action.
Investigated 207 (100%) complaints received.
Of the 207 complaints received, 118 were resolved during investigation and 89 issued with warnings of pending legal notices.
Non-compliance with the legal notice resulted in 47 Compliance Notices and Directives being served.
Number of compliance inspections conducted per enforcement officer per year.
28 Compliance inspections conducted per enforcement officer per year.
On average 35 compliance inspections per enforcement officer were conducted resulting from a vacancy rate of 30% over a period of six months.
Number of monitoring exercises: 245.
Conduct cooperative government compliance and enforcement operations.
Number of joint enforcement operations.
16 Joint compliance and enforcement investigations.
Number of joint operations with DEA, CapeNature, Municipalities, DWAF and Metro Police: 26
To build environmental compliance and enforcement capacity.
Number of skills interventions
Conduct four internal/external capacity-building workshops.
Conducted three internal/external capacity-building workshops.
To improve cooperation between environmental compliance and enforcement regulatory bodies.
Western Cape Environmental Crime networking and skills-sharing forum established and operational.
Conduct quarterly meetings.
Conducted one quarterly meeting to improve cooperation between environmental compliance and enforcement regulatory bodies.

35
PA
RT
2A n n u a l R e p o r t 2 0 0 9 / 1 0
2.11 Programme 4: Environmental Quality Management
Purpose:
The aim of the programme is to develop legislation, policies, norms, standards and guidelines for environmental impact management, air quality management, climate change management and management of waste and pollution at provincial and local spheres of government.
The programme Environmental Quality Management comprises of the following sub-programmes:
4.1: Impact Management;
4.2: Air Quality Management;
4.3: Climate Change Management; and
4.4: Pollution and Waste Management.
Measurable objectives:
The measurable objectives relevant to the mentioned sub-programmes and as included in the 2009/10 Annual Performance Plan are as follows:
• To support strategic decision-making and intervention to enhance environmental management.
• To implement monitoring measures, policies and programmes for environmental protection.
• To render sound land-use management support services.
• To ensure sound processes for monitoring the effectiveness of land-use management.
• To facilitate and support strategic state interventions to enhance service delivery.
• To develop programmes aimed at clean, healthy and improved human settlements.
• To ensure sound land-use regulatory services.
• To unlock opportunities and potential for growth in the environmental sector.
• To develop and implement programmes that promote access to, and sustainable utilisation of, natural resources.

36
PE
RF
OR
MA
NC
EP r o g ra m m e
Service delivery objectives and indicators:
Sub-programme 4.1: Impact Management
• During the 2009/10 financial year six capacity-building workshops on the amendments to National Environmental Management Act (NEMA) and on the NEMA EIA regulations were hosted. These included the hosting of two internal, two with IAIA, one with West Coast District Municipality, and one with Eden District Municipality, capacity-building workshops.
• 286 Environmental authorisations were monitored for compliance to conditions of authorisation which exceeded the target of 160 as included in the 2009/10 Annual Performance Plan.
• During 2009/10, the sub-programme developed one new and reviewed two departmental guideline documents on public participation, transitional arrangements, appeals, alternatives and exemptions, Need and Desirability in terms of the implementation of the NEMA EIA Regulations.
• The sub-programme initiated the Saldanha Bay Environmental Management Framework (EMF) and completed the development of the Drakenstein Environmental Management Framework (EMF). The approval of all EMFs are dependent on the promulgation of the amended NEMA EIA Regulations which have not yet come into effect, hence the approval of the EMFs could not happen.
• On 1 April 2009, 1981 active environmental applications were pending within the Department. In terms of the applicable legislation with regard to Environmental Impact Assessment (EIA), the sub-programme received 786 EIA applications during the 2009/10 financial year. As such the total number of applications within the Department was 2767. During the past year the Department finalised 1013 applications. As at 31 March 2010 the Department had 1754 current applications pending of which the Department was able to respond to approximately 350 (20% i.e. cases where all information was received). It must however be noted that the Department is bound by legislated timeframes as stipulated in the NEMA EIA Regulations.
• On 1 April 2009, 1040 active planning applications were pending within the Department. In terms of the applicable legislation with regard to land-use management, the sub-programme received 1159 planning applications during the 2009/10 financial year. As such the total number of applications within the Department was 2199. During the past year the Department finalised 1109 applications. As at 31 March 2010 the Department had 1090 current applications pending of which the Department was able to respond to approximately 270 (25% i.e. cases where all information was received).
Sub-programme 4.2: Air Quality Management
• The Provincial Air Quality Management Plan (AQMP) was finalised, printed and announced at the 2Precious2Pollute programme ceremony with industry leaders, cabinet members, standing committee members, mayors and other municipal representatives. Four public participation and three sector workshops were held as part of the public participation process, while regular Project Steering and Technical Committee meetings were held. A Status Quo Report on Air Quality Management in the Western Cape was also produced.

37
PA
RT
2A n n u a l R e p o r t 2 0 0 9 / 1 0
• The monitoring of ambient air quality took place in Mossel Bay, Vredenburg and Paarl for a period of one year. Monthly reports on the data were produced. After the one year period, the monitoring stations were relocated, as planned, from Paarl to Worcester, from Vredenburg to Malmesbury and from Mossel Bay to George. A fourth monitoring station was also commissioned and began operating in Maitland, City of Cape Town. Measures for the installation of safety railings on three monitoring stations were initiated.
• Atmospheric Emission Licensing (AEL) training was undertaken with municipal officials from the Cape Winelands and Overberg District Municipalities, in preparation for the District Municipalities fulfilling the role of issuing AELs.
• Three Air Quality Officer’s Forum (AQOF) meetings were conducted in the Province, while two special meetings of the AQOF were held to discuss the relationship between the AEL process and the EIA process, as well as to discuss and provide comment to the National Department of Environmental Affairs on the National Ambient Air Quality Standards, draft Regulations and the AEL application form.
Sub-programme 4.3 : Climate Change Management
• The Climate Change Workstream Committee (CCWC) that was established was not functioning due to a lack of cooperation by other departments. The Department investigated an alternative governance structure but this process was overtaken by the provincial modernisation initiative and development of a new strategic direction and governance structures. In the interim, the Department continued to work on a variety of projects with other departments to implement the Climate Change Strategy and Action Plan.
• Good progress has been made with the development of the Monitoring and Evaluation (M&E) system to measure implementation of the Climate Change Response Strategy and Action Plan. This project was initiated in order to identify key indices of climate change response by provincial departments and municipalities and monitor the progressive mitigation and adaptation response activities of those organs of state into the future. The Department has reviewed a draft M&E System Report and data capture sheets. The M&E system was not completed during the financial year due to limited departmental capacity.
• Energy audits of six provincial buildings were undertaken in the 2008/09 financial year. During the current reporting period the audits and recommendations were submitted to the Department of Transport and Public Works with a view to the implementation of the technological aspects of energy management and efficiency in the buildings. A one-year contract position to advise on energy efficiency matters has been filled in the Department and building retro-fitting targets have been set in the Strategic Case dealing with Sustainability and Resource Efficiency.
• In August/September 2009 a 10-day environmental and climate change programme was presented to 43 teachers in partnership with the City of Cape Town and the provincial Education Department. The programme was accredited by the provincial Department of Education and educators that attended received formal training recognition by their department.

38
PE
RF
OR
MA
NC
EP r o g ra m m e
• The Department met with officials from the Department of Local Government and Housing regarding the training of Community Development Workers. Subsequently, the following training and capacity-building workshops on green and sustainable living were hosted during the 2009/10 financial year:
- Mitchell’s Plain (Metro North 2): 90 community members were trained;
- Riversdale (Hessequa Municipality): 60 people attended including 20 learners from Panorama Primary neighbouring night school; and
- Eerste River (Metro North 1): 60 people from various community networks and youth were trained.
The training workshops in Riversdale and Eerste River were concluded by planting indigenous trees donated by SA National Biodiversity Institute (SANBI).
A training project for the hospitality sector was launched at the first training session hosted by the Westin Grand Hotel adjacent to the Cape Town International Convention Centre that was also represented by their CEO. Subsequently about 130 people from about 30 institutions attended these training sessions. This project, particularly the launch, received excellent media coverage.
Climate Change workshops were arranged in conjunction with South African Local Government Association (SALGA); in Caledon, George and Worcester. Although the invitation was widely distributed very few people attended. This could be attributed to low levels of awareness in the rural areas. Further workshops are planned to inform local and provincial politicians and senior government officials to promote the mainstreaming of climate change mitigation and adaptation programmes in provincial and local government.
• 638 Solar water geysers were rolled out in various needy communities to stimulate the solar geyser industry in the Western Cape. Geysers were installed in Prince Albert (100), Oudtshoorn (100) and Mossel Bay (138). Unfortunately as a result of the delay in construction of the housing units, 118 units must still be installed in Mossel Bay to complete the project. This total included the installation of 300 solar geysers in Darling (Swartland Municipality) which was jointly funded by the Danish Aid organisation, DANIDA, as part of the 2010 World Cup Soccer carbon off-set programme.
The Department originally planned to train 240 unemployed persons, mainly from the recipient communities in fabrication and installation of solar water heating systems. In the 2009/10 financial year, the remaining 183 unemployed persons were trained to reach the target. In completion of the Darling project another 14 people were trained of which eight were employed on a full-time basis for the duration of the project.
• The Department initiated a project to determine the Sea Level Rise Risk assessment for the Eden District coastline. Draft Status and Modelling reports were provided while the final reports and digital maps need to be finalised. Similar studies for the remainder of the provincial coastline are planned to be undertaken in the current and subsequent financial years.

39
PA
RT
2A n n u a l R e p o r t 2 0 0 9 / 1 0
Sub-programme 4.4: Pollution and Waste Management
• The Department initiated a Provincial Programme of Action for Protection of the Marine Environment from land-based activities that supports the National Programme of Action, which forms part of the UNEP Global Programme of Action for the Protection of the Marine Environment from land-based activities. Estuaries were selected as the focus because of their important conservation, social and commercial value. An intergovernmental task team was formed and discussions on the rationale for prioritising actions and to guide initial work were held. A draft Provincial Action Plan was developed, which included a status quo and prioritisation matrix of the estuaries in the Province. Initial work was undertaken to assess the Diep River estuary for levels of metal accumulation in sediments and biota.
• In terms of the water use efficiency project, the schools that were retrofitted with water efficient fittings during 2008/2009 were monitored throughout the year and the per capita savings calculated. The results obtained were variable. The results were presented to the Department of Transport and Public Works for consideration in new school developments and were positively received. The Department was invited to participate with the Department of Transport and Public Works and the Department of Education in regular planning meetings regarding the maintenance of existing and development of new education infrastructure in the Province.
• A Quick Reference Guide on Chemicals Management was produced and distributed. The aim of the Quick Reference Guide on Chemicals Management is to assist companies with information on storing and handling hazardous chemicals responsibly to reduce chemical accidents and spills. The programme also facilitated responsible chemicals management in companies in the Consumer-formulated Goods, Metal Finishing and Drum Reconditioning sectors. Twenty-two (22) companies were trained to produce their own Chemicals Management Action Plans. As participation in this programme is voluntary, only three companies submitted completed plans. These were assessed and recommendations were made to these companies.
• The 2Precious2Pollute programme was launched to the broader public, industry and other spheres of Government with the purpose of raising awareness on pollution prevention, pollution reduction and resource efficiency. Under this programme, various fact-sheets on the different aspects of pollution management were developed for distribution. At the launch, responsible chemicals management in industry was recognised and promoted and the development of a provincial Air Quality Management Plan was announced.
• Two workshops were held with district municipalities regarding the implementation of Section 30 of NEMA that deals with emergency incidents. The first workshop reviewed the legislated actions with regard to both monitoring, management and reporting of emergency incidents. The second workshop provided specialised training on spill response measures to assist the disaster management officials to understand the risks of dealing with hazardous substances and respond appropriately. A previous developed Memorandum of Understanding (MOU) on the role of Province and of District Municipalities was amended and discussed for refinement. The revised MOU was verified by Provincial Legal Services before finalisation. The MOU will be forwarded for signature by the District Municipalities during the 2010/11 financial year.
• 47 Cases of remediation of contaminated land were evaluated and remediation options determined in terms of Section 28 of NEMA. As there are no clear national guidelines on remediation, this has been challenging. Initial discussions were held to draft provincial guidelines, but this was superseded by the development of national guidelines. The Department actively participated in the formulation of the draft Remediation framework guideline.

40
PE
RF
OR
MA
NC
EP r o g ra m m e
• The work to finalise the revision of the Provincial Noise Control Regulations (PN 627/1998) was delayed after submission to Provincial Legal Services for final verification. Only at this late stage of the process, Provincial Legal Services raised concerns on the constitutionality of the Regulations, which was contrary to their initial opinion. The Department requested an external legal opinion to verify this opinion. If upheld, the revised Regulations cannot be promulgated without substantial amendment or possible further enactment of framework legislation. For this reason, the promulgation as envisaged in the 2009/10 financial year was not achieved.
• The waste management licensing function for general waste was assigned to provinces as from 1 July 2009 in terms of the National Environmental Management: Waste Act (Act No. 59 of 2008) and the listed waste management activities in terms of Schedule 1 to the Waste Act and came into effect on 3 July 2009. The waste management licensing (previously known as permitting in terms of ECA) system was incrementally implemented during the financial year, with the administrative licensing processes established and staffing of the component. Seventeen (17) of the 125 (i.e. 13.6%) authorised waste management facilities were monitored for compliance and eight residents monitoring committees were attended as part of the compliance monitoring function (i.e. target of 5%). In order to build the capacity of municipal landfill operators and improve the management of landfills, a training manual was developed and three training sessions were conducted to provide them with the necessary technical knowledge to manage waste management facilities effectively.
• The Western Cape Health Care Waste Management Act (HCWMA) (Act No. 7 of 2007) and regulations could not be implemented due to alignment with the NEMA: Waste Act that commenced on 1 July 2009. The drafting of the amendment to the HCWMA commenced and the Draft Health Care Waste Management Amendment Bill was published in the Government Gazette for public comment. Comments on the draft were processed and the Health Care Waste Management Amendment Bill was certified by Provincial Legal Services and is currently in the parliamentary process. The regulations are in the process of being vetted by Provincial Legal Services. This process also impacted on the registration of Health Care Waste generators, treaters, transporters and disposers.
• The Waste Management in Education (WAME) programme was rolled out to 25 foundation phase educators from schools in the Matzikama area in conjunction with the Matzikama Municipality. A Monitoring and Evaluation (M&E) report was finalised after conducting a survey amongst all schools that participated in the WAME programme since its inception to ascertain the impact thereof. While the programme was well received by educators, a support plan is needed to ensure that resources and knowledge is transferred at school level to fellow educators and that the programme is sustained through the support of this Department, the Education Department, municipal and industry initiatives.
• The Provincial round of the National Cleanest Town Competition was concluded and an awards ceremony was held on 26 November 2009 to celebrate the provincial winners. Overstrand, George, Swartland, Witzenberg and Eden District Municipalities were awarded for their achievements. The aim of the competition is to promote improvements in integrated waste management in the Province. Payment of prize monies was carried over into the new financial year.
• Significant progress was made with the finalisation and translation of a draft Green Paper on a Green Procurement Policy after obtaining comments from the reference group that comprised of the Department of the Premier: Legal Services and Policy Coordination components, Provincial Treasury, the Department of Economic Development and Tourism and the Department of Environmental Affairs and Development Planning. Delays in the submission of these comments from key stakeholders created delays in the policy drafting phase. A memorandum was submitted to obtain approval from the Provincial Cabinet to publish the Green Procurement Policy as a Green Paper for public comment. A draft implementation plan has been

41
PA
RT
2A n n u a l R e p o r t 2 0 0 9 / 1 0
developed and will be presented to stakeholders for comment during the policy development process in the new financial year.
• The 2Wise2Waste programme, an environmental efficiency programme, was marketed to the Department of the Premier, Provincial Parliament, Premier’s official residence, Community Safety, Economic Development and Tourism, Provincial Treasury and CapeNature. Regular meetings with floor- and departmental champions were conducted to ensure the successful roll-out of the programme. Assistance was also provided to departments on request to facilitate implementation of the programme. A survey was conducted to gauge the impact of the implementation of the programme. Three training workshops were conducted with cleaning contractors in the provincial administration. There is general awareness of the environment, however, only a small percentage of employees engage in environmental friendly practices at the office. The successful implementation of the programme rests on the availability of committed departmental champions to drive the programme with the support of management.
• External promotion of the 2Wise2Waste programme was presented to municipalities and the general public. The Recycled Products Catalogue used to stimulate the demand and supply of recycled products was updated, printed and distributed to the public. The “Buy Recycled Products” campaign under the auspices of the programme was held at the Cape Gate Shopping Centre, which provided a platform for SMMEs to market their recycled products to the public and to facilitate awareness of recycling amongst the general public.
• A Waste Minimisation Summit was hosted on 3–4 March 2010 and attended by 300 stakeholders that provided a platform to shape actions pertaining to waste minimisation that will form part of the Western Cape Integrated Waste Management Plan. Seven (7) commissions covering pertinent aspects related to waste minimisation delivered the final outcomes of the summit. The summit also provided exhibition space that showcased waste minimisation technologies and products.
• An additional four municipalities took part in the pilot of the M&E system for Integrated Waste Management Plans (IWMPs) to test factors that could hamper full-scale implementation. Through the Department’s co-operative and supportive relationship with municipalities and their contribution to the initial development of the M&E indicators, this target was exceeded. Completion of reports on a quarterly basis against a set of performance indictors will facilitate the Department’s assessment on the implementation of municipal IWMPs.
• The development of industry waste management plans for the Consumer Formulated Chemical Sector (CFCS) was facilitated by developing a template, assessment criteria, reviewing the existing generic guideline and conducting targeted audits to inform the development process of plans. A workshop was conducted with industry representatives to discuss the development and assessment criteria and the audit findings. As this is a voluntary process, the industries partaking in the audits were requested to develop and submit their plans for assessment.

42
PE
RF
OR
MA
NC
EP r o g ra m m e
Service delivery achievements:
Sub-programme Outputs Output Performance
Measures/Service Delivery Indicators
Actual Performance against Target
Target Actual
Sub-
prog
ram
me
4.1:
Impa
ct M
anag
emen
t
To improve land-use management practices of stakeholders.
Number of capacity-building workshops conducted versus planned.
Plan and conduct six capacity-building workshops on the Amended National Environmental Management Act Environmental Impact Assessment Regulations.
Six capacity-building workshops were conducted for the year.
To render sound advisory services for land-use management.
Land-use applications accepted on first submission versus total applications received (%).
Monitor the quality of applications for acceptance on first submission.
Received 786 environmental applications of which 777 (98.9 %) were accepted on first submission.
Received 1159 planning applications of which 1145 (98.8 %) were accepted on first submission.
Requests for planning information responded to versus received (%).
Respond to 75% of requests by Regulatory Authorities and other external stakeholders for planning advice in terms of legal requirements.
104 Requests received and 111 finalised (includes requests from previous year).
Two planning requests for information were pending.
Requests for environmental information responded to versus received (%).
Respond to 70% of requests by Regulatory Authorities and other external stakeholders for environmental advice in terms of legal requirements.
563 Requests received and 538 finalised.
613 Environmental requests for information were pending.
To ensure a sound regulatory framework
(Legislative and policy instruments).
New or review existing policy instruments milestones met versus planned (%).
Develop one new Environmental Management Framework (EMF).
Initiated Saldanha Bay EMF and could not finalise Drakenstein EMF due to the NEMA EIA Amendment Regulations not being promulgated.
Gazette the approved Western Cape Biodiversity offsets guideline.
The Western Cape Biodiversity offsets guideline will be gazetted and approved after the promulgation of the amended NEMA EIA Regulations.
Compile a Provincial guideline on development parameters.
The draft Manual on Development Parameters was circulated in March 2010 to all municipalities and stakeholders for comment.
Existing policy instruments reviewed/amended versus planned.
Align existing policy instruments to current development paradigms and legislations.
Reviewed, amended and circulated the amended Departmental guidelines on public participation, transitional arrangements, appeals, alternatives and exemptions, Need and Desirability in terms of the implementation of the NEMA EIA Regulations.
Review all relevant Departmental guidelines, application forms and templates in order to accommodate the amendments to the NEMA EIA regulations.
Reviewed the Environmental Impact Assessment regulations application forms and templates and developed the NEM: Waste Act Application forms, templates and circulars for implementation.

43
PA
RT
2A n n u a l R e p o r t 2 0 0 9 / 1 0
Sub-Programme Outputs Output Performance
Measures/Service Delivery Indicators
Actual performance Against Target
Target ActualSu
b-pr
ogra
mm
e 4.
1: Im
pact
Man
agem
ent
To ensure sound regulatory control (Planning and Environment).
Percentage of environmental and planning applications finalised versus received.
70% Pending and new environmental and planning applications finalised.
During this financial year, 2122 environmental and planning applications were finalised and 1586 planning and environmental authorisations were issued. During the same period 1945 new environmental and planning applications were received. On 31 March 2010, 2844 environmental and planning applications were pending.
Percentage of environmental applications processed within legislated timeframes.
85% Environmental applications processed within legislated timeframes.
The Department managed to meet the EIA legislated timeframes for approximately 90% of environmental applications.
Average duration of Environmental Impact Assessment (EIA) processes for applications finalised.
Monitor the average duration of environmental applications.
The average duration of an application from the date of submission of the application to the date of issue of the environmental authorisation is 16 months.
To ensure a sound regulatory framework
(Legislative and policy instruments).
Percentage of pending and new environmental appeals processed versus received.
75% Pending and new environmental appeals finalised.
At 1 April 2009, the Department was in possession of 30 environmental appeals. During the 2009/10 financial year, 36 new environmental appeals were received and 32 (48%) environmental appeals were finalised by the Minister. Pending environmental appeals at 31 March 2010 were 34.
Compliance monitoring of environmental authorisations.
Monitor 160 environmental authorisations.
Monitored 286 environmental authorisations for compliance with conditions of authorisation.

44
PE
RF
OR
MA
NC
EP r o g ra m m e
Service delivery achievements:
Sub-Programme Outputs Output Performance
Measures/Service Delivery Indicators
Actual Performance against Target
Target Actual
Sub-
prog
ram
me
4.2:
Air
Qua
lity
Man
agem
ent
To promote sound air quality management.
Incremental implementation of Air Quality Management System.
Finalise and implement the Air Quality Management Plan and implement the National Environmental Management Air Quality Act.
Finalised the Air Quality Management Plan (AQMP) and announced the Plan at the 2Precious2Pollute programme ceremony.
Quarterly reports and air quality officers forum meetings on emissions inventory, ambient air quality monitoring and implementation of air quality management in the Province.
Four public participation and three sector workshops were held as part of the public participation process, while regular Project Steering and Technical Committee meetings were held.
Provide input and assistance into Air Pollution Prevention Act and National Environmental Management Air Quality Act applications within the Province.
Produced quarterly reports on the Ambient Air Quality Management System: emission inventory, ambient air quality monitoring and AQMP.
Capacity-building workshop on the implementation of the Air Quality Act with Municipalities.
Monitored ambient air quality in Mossel Bay, Vredenburg and Paarl for a period of one year. Monthly reports on the data were produced.
Relocated the Paarl monitoring station to Worcester, the Vredenburg monitoring station to Malmesbury and the Mossel Bay monitoring station to George.
Procured, commissioned and began operating a fourth ambient air quality monitoring station, which was located in Maitland, City of Cape Town. Initiated measures for the installation of safety railings on three monitoring stations.
The emissions inventory was updated to include various mobile sources and conducted desktop research into emissions inventory software.
Conducted three Air Quality Officer’s Forum (AQOF) meetings. Arranged and conducted two special meetings of the AQOF to discuss the relationship between the AEL process and the EIA process and Ambient Air Quality Standards, draft Regulations and the AEL application form respectively.
Revised four draft Air Pollution Prevention Act (APPA) registration certificates based on comments received by industry concerned.
Conducted two capacity-building workshops on the implementation of NEM:AQA and on Air Emission Licensing and the associated fee calculator respectively.

45
PA
RT
2A n n u a l R e p o r t 2 0 0 9 / 1 0
Service delivery achievements:
Sub-Programme Outputs Output Performance
Measures/Service Delivery Indicators
Actual Performance against Target
Target Actual
Sub-
prog
ram
me
4.3:
Clim
ate
Chan
ge M
anag
emen
t
To facilitate the implementation of the Western Cape Climate Change Strategy and Action Plan.
Annual progress report on implementation of the Western Cape Climate Change Response Strategy and Action Plan.
Facilitate the functioning of the Provincial Climate Change Workstream and report on the implementation of the Climate Change Response Strategy and Action Plan.
Develop a monitoring and evaluation system for the Climate Change Response implementation.
No workstream meetings were held. Way forward regarding approach to deal with workstreams yet to be clarified.
Progress has been made with the development of a Monitoring and Evaluation (M&E) system but was not completed during the financial year.
Service delivery achievements:
Sub-Programme Outputs Output Performance
Measures/Service Delivery Indicators
Actual Performance against Target
Target Actual
Sub-
prog
ram
me
4.4:
Pol
lutio
n an
d W
aste
Man
agem
ent
To promote sound pollution management.
Incremental roll-out of chemical management programme.
Facilitate responsible chemicals management in new businesses and report on implementation in targeted (Consumer-formulated Goods, Metal Finishing and Drum Reconditioning) sectors.
22 Companies trained for the year as planned. All Chemicals Management Action Plans (CMAPs) received were assessed and recommendations made to companies. 300 Copies of the Quick Reference Guides were printed and distributed to companies that drafted CMAPs.
Monitor and support municipalities to implement the Amended Provincial Noise Control Regulations.
Facilitate and monitor the implementation of the approved Amended Provincial Noise Control Regulations.
System to monitor and support implementation of Amended Provincial Noise Control Regulations could not be developed as amended Regulations were not promulgated. One training session on handling noise control issues and two Noise Control Forums were held with municipalities.
To promote resources efficiency and pollution prevention.
Measures and interventions for environmental resource efficiency developed and implemented.
Further develop and facilitate implementation of policy measures and interventions for environmental resource efficiency and pollution prevention.
A Provincial Programme of Action on Protection of the Marine Environment from Land-based Activities was initiated, and a draft Provincial Action Plan developed. First action completed with a study on the Diep River estuary on metal accumulation in sediments and biota.
The water efficiency of retrofitted schools were assessed and reported on. The results were presented and discussed with the Department of Transport and Public Works. The Department will join the Department of Transport and Public Works in future planning meetings on infrastructure in the Province.
Produced and distributed Quick Reference Guide on Chemicals Management and various fact-sheets on aspects of pollution management, as undertaken in the Department.

46
PE
RF
OR
MA
NC
EP r o g ra m m e
Sub-Programme Outputs Output Performance
Measures/Service Delivery Indicators
Actual Performance against Target
Target Actual
Sub-
prog
ram
me
4.4:
Pol
lutio
n an
d W
aste
Man
agem
ent
To promote resources efficiency and pollution prevention.
Measures and interventions for environmental resource efficiency developed and implemented.
Further develop and facilitate implementation of policy measures and interventions for environmental resource efficiency and pollution prevention.
Launched the 2Precious2Pollute programme to the broader public, industry and other spheres of Government, to recognise and promote responsible chemicals management in industry, and announce the development of a provincial Air Quality Management Plan. This included raising awareness among authorities and industry on pollution prevention, pollution reduction and resource efficiency.
Identified and developed brochures (tools) to reduce pollution sources.
To promote sound integrated waste management.
Incremental implementation of waste management facility permitting system.
Monitor permitted waste management facilities for compliance.
Incremental implementation of waste management licensing (previously known as facility permitting) system. Seventeen of the 125 (i.e. 13.6%) authorised waste management facilities monitored for compliance and attended eight residents’ monitoring committees as part of the compliance monitoring function.
Health Care Waste Management (HCWM) legislation implemented.
Facilitate and monitor implementation of the Health Care Waste Management Act and regulations.
Cabinet approved publication of the draft Health Care Waste Management Amendment Bill for public comment.
All comments on the Draft HCWM Amendment Bill were received and processed.
The Bill was certified by Provincial Legal Services for presentation to Cabinet and is currently in the parliamentary process to be published.
Facilitate the incremental implementation of Integrated Waste Management Plans (IWMPs).
Implementation of the Monitoring and Evaluating (M&E) system for Integrated Waste Management Plans.
Monitoring and Evaluating (M&E) system for IWMP was implemented in nine instead of five municipalities.
System was piloted in nine municipalities to assess the system and to identify possible problems before roll-out to all municipalities.
Compiled a Monitoring and Evaluation (M&E) assessment report on the first two quarters.
Implementation of the Provincial Hazardous Waste Management (PHWM) Plan with regard to industry waste management plans.
Implementation of PHWM by facilitating the development of industry waste management plans in the Consumer Formulated Chemical sector by conducting targeted audits and a waste planning workshop.

47
PA
RT
2A n n u a l R e p o r t 2 0 0 9 / 1 0
Sub-Programme Outputs Output Performance
Measures/Service Delivery Indicators
Actual Performance against Target
Target ActualSu
b-pr
ogra
mm
e 4.
4: P
ollu
tion
and
Was
te M
anag
emen
t
To promote integrated environmental quality management.
Functional Integrated Pollutant and Waste Information System (IPWIS).
Further development and implementation of Integrated Pollutant and Waste Information System.
Registration of Health Care Waste generators, treaters, transporters and disposers was delayed by the obligatory amendment of the Western Cape Health Care Waste Management Act to ensure alignment with the new Waste Act.
The system was enhanced to improve functionality. Bug fixing and user testing was conducted on the enhanced system. Data on waste management licences was captured.
To promote sound integrated waste management.
Monitoring and evaluation report.
Monitor and evaluate the Waste Management in Education (WAME) programme and roll-out to 30 educators.
A Monitoring and Evaluation (M&E) report was drafted on the Waste Management in Education programme.
A workshop was conducted with the 25 out of the 30 educators who accepted the invitation, in the Matzikama Municipal area.
Provincial round of the National Cleanest Town Competition (CTC) adjudicated.
Adjudicate the provincial round of the National Cleanest Town Competition.
Provincial round of the National Cleanest Town Competition (CTC) adjudicated. Payment of prize monies to winning municipalities will happen in the 2010/11 financial year.
To promote integrated environmental quality management.
Measures and interventions for environmental resource efficiency developed and implemented.
Further develop and facilitate implementation of policy measures and interventions for environmental resource efficiency for improved waste management.
Roll-out the 2Wise2Waste Programme by means of presentations and distribution of marketing material. Conducted a 2Wise2Waste survey and collated the responses in a report.
Meetings regularly held with floor- and departmental champions. Programme also introduced to the George Office of the Department.
Conducted awards session to celebrate efforts of floor- and departmental champions.
Established Working Group on Green Procurement to assist with the policy development process. Collated comments from Working Group members and amended the Draft Green Paper on Green Procurement.
Submitted a memorandum to Cabinet to request their approval to publish it as a Green Paper for public comment.
Reviewed the Recycling Strategy and updated, printed and distributed Recycled Products Catalogue and conducted Waste Minimisation Summit.

48
PE
RF
OR
MA
NC
EP r o g ra m m e
2.12 Programme 5: Biodiversity Management
Purpose:
The aim of the programme is to promote equitable and sustainable use of natural resources to contribute to economic development, by managing biodiversity and its components, processes, habitats, ecosystems and functions, and to effectively mitigate threats to sustainable management of biodiversity and natural resources.
The programme Biodiversity Management comprise of the following sub-programmes:
5.1: Biodiversity and Protected Area Planning and Management;
5.2: Western Cape Nature Conservation Board; and
5.3: Coastal Resource Use.
Measurable objectives:
The measurable objectives relevant to the mentioned sub-programmes and as included in the 2009/10 Annual Performance Plan are as follows:
• To create opportunities for access to our natural resources, specifically for marginalised communities.
• To support strategic decision-making and intervention to enhance planning and environmental management.
Service delivery objectives and indicators:
Sub-programme 5.1: Biodiversity and Protected Area Planning and Management
• The primary role of the Department with regards to this sub-programme has been to monitor the biodiversity management performance of CapeNature using the Biodiversity Monitoring System indicators developed and refined in previous financial years. The indicators have all been incorporated by CapeNature into their internal Monitoring and Evaluation (M&E) system and report regularly to the Department. A consolidated Annual Report for the financial year will be drafted and submitted to the Department during 2010/11.
Sub-programme 5.2: Western Cape Nature Conservation Board
The Western Cape Nature Conservation Board, trading as CapeNature, is the provincial public entity responsible for nature conservation matters within the Province. A total amount of R133.272 million was transferred to CapeNature and included the following earmarked allocations:

49
PA
RT
2A n n u a l R e p o r t 2 0 0 9 / 1 0
• R13 million for personnel issues;
• R15.445 million for infrastructure upgrades (the initial amount of R20 million was reduced during the adjusted estimates process with R4.555 million);
• R23.800 million for fire management capacity (including the Expanded Public Works Programme fire-fighting) and eradication of alien vegetation;
• R1.945 million for 2009/10 salary increases;
• R300 000 for Baboon Management;
• R120 000 for the Gouritz Biosphere Reserve initiative; and
• R216 000 for its internship programme.
On a quarterly basis, CapeNature reported on its 2009/10 Annual Performance Plan deliverables, expenditure and revenue position and on the earmarked funding. As required by the Western Cape Nature Conservation Board Act, CapeNature submitted its 2010/11 5-Year Strategic Plan, Annual Performance Plan and budget which was approved by the Minister.
Sub-programme 5.3: Coastal Resource Use
• The National Environmental Management: Integrated Coastal Management Act (Act No. 24 of 2008) was promulgated in February 2009, but only came into force on 1 December 2009, therefore the amended Provincial Integrated Coastal Management Programme could not be finalised. Selected priorities of the Integrated Coastal Management Programme, such as the survey on the Boat Launching Sites in the Province was initiated and finalised at the end of March 2010. The Department is now in a better position to manage and enforce compliance. It was agreed with the National Department not to proceed with the review of the Provincial Coastal Zone Policy until the National Guidelines have been developed.
The implementation of the Act will be rolled out in priority phases and the Department accomplished the following:
- appointed by the Provincial Cabinet as the lead agent for Coastal Management in the Province;
- publication of advertisement for Membership to the Provincial Coastal Committee (PCC);
- sustainable Coastal Livelihoods and Coastal Induction training courses were presented to organs of state and municipal officials; and
- awareness and education campaigns were rolled out during September and October 2009 respectively for Coastal Clean-up and Marine Week Celebrations.

50
PE
RF
OR
MA
NC
EP r o g ra m m e
Service delivery achievements:
Sub-programme Outputs Output Performance
Measures/Service Delivery Indicators
Actual Performance against Target
Target Actual
Sub-
prog
ram
me
5.1:
Bi
odiv
ersi
ty a
nd
Prot
ecte
d A
rea
Plan
ning
an
d M
anag
emen
t
To promote the sound management of biodiversity.
Annual review of CapeNature‘s Biodiversity Management Performance.
Monitor and report on CapeNature’s implementation of the recommendations of the 2008/09 annual biodiversity performance review.
Reports were received from CapeNature while a consolidated annual report for the financial year will be drafted and submitted to DEA&DP by May 2010.
Sub-
prog
ram
me
5.2:
W
este
rn C
ape
Nat
ure
Cons
erva
tion
Boar
d
To support the Western Cape Nature Conservation Board (WCNCB) financially.
The Western Cape Nature Conservation Board supported financially.
The Western Cape Nature Conservation Board financially supported.
Transferred R133.272 million to CapeNature. CapeNature’s budget reduced with R1.974 million during the Adjustments Estimate to R133.272 million. Transfer schedule amended.
Sub-
prog
ram
me
5.3
Coas
tal R
esou
rce
Use
Promote Integrated Coastal Management.
Approve amended Integrated Coastal Management Programme (ICMP).
Implementation of the National Environmental Management: Integrated Coastal Management Act.
The National Environmental Management: Integrated Coastal Management Act came into force on 1 December 2009, therefore the amended Integrated Coastal Management Programme could not be finalised.
The Department accomplished the following priority phases:
Appointed by the Provincial Cabinet as the lead agent for Coastal Management in the Province;
• Publication of advertisement for Membership to the Provincial Coastal Committee (PCC);
• Sustainable Coastal Livelihoods and Coastal Induction training courses were presented to organs of state and municipal officials; and
• Awareness and education campaigns were rolled out during September and October respectively for Coastal Clean-up and Marine Week Celebrations.
Implement and support selected priorities of the Integrated Coastal Management Programme.
Before the Act came into operation, a Draft Integrated Coastal Management Programme was implemented and these aspects are now reflected in the Act.
Selected priorities of the Integrated Coastal Management Programme such as the survey on the Boat Launching Sites in the Province was initiated and finalised at the end of March 2010.
Review the Coastal Zone Policy.
It was agreed with the National Department not to proceed with the review of the Provincial Coastal Zone Policy until the National Guidelines have been developed.

PA
RT
2A n n u a l R e p o r t 2 0 0 9 / 1 0
NOTES


52
TH
E A
UD
IT C
OM
MIT
TE
ER e p o r t o f
3. REPORT OF THE AUDIT COMMITTEE
PROVINCIAL GOVERNMENT WESTERN CAPE
DEPARTMENT OF ENVIRONMENTAL AFFAIRS AND DEVELOPMENT PLANNING (VOTE 9)
We are pleased to present our report for the financial year ended 31 March 2010.
Audit Committee Members and Attendance
In terms of Cabinet Resolution 55/2007, the Department of Environmental Affairs and Development Planning is served by the Economic Cluster Audit Committee. The Audit Committee consists of the members listed hereunder and should meet at least four times per annum as per its approved terms of reference. During the current year nine meetings were held.
Name of Member Number of Meetings Attended
Mr P Jones (Chairperson) 6
Mr Z Hoosain 8
Mr J Jarvis (Contract expired 31 December 2009) 8
Mr S Claassen (Contract expired 31 December 2009) 8
Mr R Kingwill (Contract commenced 1 January 2010) 1
Ms L Hassan (Contract commenced 1 January 2010) 1
Mr K Larkin (Contract commenced 1 January 2010) 0
Apologies were tendered and accepted for meetings not attended. A quorum of members was present at all meetings.
Audit Committee Responsibility
The Audit Committee reports that it has complied with its responsibilities arising from Section 38(1)(a) of the Public Finance Management Act (PFMA) and Treasury Regulation 3.1.
The Audit Committee also reports that it has adopted appropriate formal terms of reference as its Audit Committee Charter has regulated its affairs in compliance with this Charter and has discharged all its responsibilities as contained therein.
The Effectiveness of Internal Control
The system of internal control applied by the Department over financial risk and risk management is adequate.
In line with the PFMA and the King III Report on Corporate Governance requirements, Internal Audit provides the Audit Committee and management with assurance that the internal controls are adequate and effective. This is achieved by a risk-based Internal Audit Plan, internal audit assessing the adequacy of controls mitigating the risks and the Audit Committee monitoring implementation of corrective action. From the various reports
53
PA
RT
3A n n u a l R e p o r t 2 0 0 9 / 1 0
of the Internal Auditors, the Audit Report on the Annual Financial Statements and the management report of the Auditor-General South Africa, no material deficiencies in the system of internal control were noted.
Information Technology (IT)
The Committee previously reported on the growing crisis of IT within the Provincial Government and limited progress has been made towards implementation of the turn-around strategy to address the IT-related risks facing the Province. Until the turn-around strategy has been fully implemented, the risks facing the Department will not be mitigated to an acceptable level.
The Committee has been informed that IT services received priority consideration at Cabinet level for the implementation of the IT Services Blueprint.
The Quality of In-Year Management and Quarterly Reports Submitted in terms of the PFMA and the Division of Revenue Act
The Audit Committee is satisfied with the content and quality of quarterly reports prepared and issued by the Accounting Officer of the Department during the year under review.
Evaluation of Financial Statements
The Audit Committee has:
• reviewed and discussed the audited Annual Financial Statements to be included in the Annual Report, with the Auditor-General and the Accounting Officer;
• reviewed the Auditor-General’s Management Report and management’s response thereto;
• reviewed changes in accounting policies and practices where applicable;
• reviewed the Department’s processes for compliance with legal and regulatory provisions; and
• reviewed significant adjustments resulting from the audit.
The Audit Committee concurs and accepts the Auditor-General’s conclusions on the Annual Financial Statements, and is of the opinion that the audited Annual Financial Statements be accepted and read together with the report of the Auditor-General.
Internal Audit
In the year under review, the Shared Internal Audit unit experienced challenges relating to capacity and change management which impacted on its ability to achieve its plan. The Audit Committee acknowledged these challenges and in conjunction with the Head of the Department agreed to a revised Internal Audit Plan which the Audit Committee monitored and will continue to monitor in future years as Internal Audit achieves optimal capacity.

54
TH
E A
UD
IT C
OM
MIT
TE
ER e p o r t o f
Auditor-General South Africa
The Audit Committee has met with the Auditor-General South Africa to ensure that there are no unresolved issues that emanated from the regularity audit.
Appreciation
The Audit Committee wishes to express its appreciation to the Officials of the Department, Provincial Treasury, the Auditor-General South Africa and the Internal Audit unit for the cooperation and information they have provided to enable us to compile this report.
Mr P Jones
Chairperson of the Economic Cluster Audit Committee
Date: 9 August 2010

PA
RT
3A n n u a l R e p o r t 2 0 0 9 / 1 0
NOTES
PART 4
annual �nancial STATEMENTS

55
FIN
AN
CIA
L S
TAT
EM
EN
TS
A n n u a l
4. ANNUAL FINANCIAL STATEMENTS
Report by the Accounting Officer 55
Report of the Auditor-General 71
Appropriation Statement 75
Notes to the Appropriation Statement 87
Statement of Financial Performance 89
Statement of Financial Position 90
Cash Flow Statement 91
Accounting Policies 92
Notes to the Annual Financial Statements 101
Disclosure Notes to the Annual Financial Statements 112
Annexures 120

56
PA
RT
4A n n u a l R e p o r t 2 0 0 9 / 1 0
Report by the Accounting Officer to the Executive Authority and Provincial Legislature of the Republic of South Africa
1. General review of the state of financial affairs
The Department was faced with numerous policy decisions and strategic issues during the period under review, which includes, inter alia, the following:
Policy developments and strategic issues
• Amendments of the Provincial Noise Control Regulations
Following public comment and several iterations of amendments, a revised version of the Provincial Noise Control Regulations was submitted to Provincial Legal Services for review prior to promulgation. Provincial Legal Services raised a new concern with regards to the constitutionality of the Regulations and an external opinion on this matter was requested; the outcome of which is currently awaited.
• Section 30 NEMA Emergency Incidents
A Memorandum of Understanding (MOU) on the management of Section 30 of the emergency incidents between the Department and District Municipalities was circulated for comment. No comments were received from the District Municipalities and the MOU has been reviewed for its legality. The MOU has been sent to municipal managers for signing upon approval of its contents.
Officials continued to attend quarterly meetings at PetroSA, Mittal Steel and Chevron, in association with the Department of Environmental Affairs (DEA).
• Atmospheric Prevention Pollution Act (Act No. 45 of 1965) and NEM: Air Quality Act (Act No. 39 of 2004):
The Department assisted the Department of Environmental Affairs (DEA) with implementing the Atmospheric Pollution Prevention Act (APPA, Act No. 45 of 1965) and National Environmental Management: Air Quality Act (NEM:AQA, Act 39 of 2004) within the Province. Local municipalities were trained in terms of preparing for licensing of scheduled activities in terms of the APPA and the issuing of Atmospheric Emission Licenses in terms of the NEM:AQA. The Department assisted with the drafting of Registration Certificates that will be converted into Atmospheric Emission Licenses to be administered by the District Municipalities.
• Promulgation of the Amendments to the NEMA EIA Regulations
An important strategic issue facing the Department is the promulgation and implementation of the amendments to the NEMA EIA regulations. These amendments to the NEMA EIA regulations have been delayed for various reasons by the National Department of Environmental Affairs (DEA). This has negatively impacted on our EIA capacity-building programme for the 2009/10 financial year. However, communication from DEA has indicated that the promulgation of the amendments to the NEMA EIA regulations will be implemented by mid 2010.

57
FIN
AN
CIA
L S
TAT
EM
EN
TS
A n n u a l
• Environmental Management Frameworks (EMF)
During the 2009/10 financial year the sub-programme initiated the Saldanha Bay Environmental Management Framework and completed development of the Drakenstein Environmental Management Framework. The approval of all EMFs are dependent on the promulgation of the amended NEMA EIA Regulations which has not yet come into effect, hence the approval of the EMFs could not happen.
• Land Use Planning Legislation (LUPA)
A first draft of a LUPA was finalised in March 2009. However, a judgement issued by the Supreme Court of Appeal suggested that the approach followed in the first draft of LUPA needed to be revisited. To promote transparency and openness and to ensure the buy-in of other spheres of government, it was decided to develop a consensus legal framework that is constitutionally acceptable, to guide the development of the proposed new provincial planning law. A draft Legal Framework for the proposed provincial planning law was compiled and discussed with representatives of municipalities and presented during a meeting of the PCF that was attended by the Minister, Mayors and Municipal Managers on 17 March 2010. All parties had to submit their comments on the framework before 16 April 2010.
• Zoning Schemes
Two general amendments to all zoning schemes in the Western Cape in terms of Section 8 and 9 of LUPO were completed. These amendments resulted in a new zone for telecommunication facilities being incorporated into all zoning schemes while the definition of agriculture, and related consent uses and parameters were amended to provide clarity and resolve uncertainties.
• Sustainable Energy Strategy
The Department embarked on a process of developing a Sustainable Energy Strategy and Programme of Action for the Western Cape. The aim is to develop a sustainable strategy in partnership with key stakeholders in the Province. As part of the implementation of the Sustainable Energy Strategy and Programme of Action agreements were concluded with the British and German governments respectively whereby these governments assisted the Western Cape in the following ways:
- the promotion of Wind Energy in the Western Cape e.g. by means of a Western Cape Grid Study and Regional Regulatory Action Plan (RRAP);
- building capacity of departmental officials and other stakeholders through workshops and seminars; and
- the initiation of the development of a Western Cape White Paper and Bill on Sustainable Energy.
• Health Care Waste Management Amendment Bill
The amendment of the Western Cape Health Care Waste Management Act (Act No. 7 of 2007) commenced to bring about the alignment with the National Environmental Management: Waste Act (Act. No. 59 of 2009). The Draft Health Care Waste Management Amendment Bill was published in the government gazette (PN 361/2009) for public comment. Comments on the draft were processed and the Health Care Waste Management Amendment Bill was certified by Legal Services and is currently in the parliamentary process.

58
PA
RT
4A n n u a l R e p o r t 2 0 0 9 / 1 0
• Green Procurement Policy (GPP)
Commenced with the finalisation and translation of a draft Green Paper on a Green Procurement Policy after obtaining comments from a reference group, which comprises the Premier’s Department: Legal Services and Policy Coordination components, Provincial Treasury, the Department of Economic Affairs and Tourism and the Department of Environmental Affairs and Development Planning. A Cabinet memorandum was submitted to obtain approval from the Provincial Cabinet to publish it as a Green Paper on Green Procurement Policy for public comment.
• National Environmental Management: Waste Act
The NEM: Waste Act (Act No. 59 of 2009) was promulgated on 8 March 2009 and commenced on 1 July 2010. Regulations under the Waste Act related to the listing of waste management licensing activities were promulgated and came into effect on 3 July 2009, which assigned powers to the MEC as the competent licensing authority over general waste management activities. The commencement of the Waste Act and Waste Management Licensing Regulations has major impacts on both the financial and human resources administering these legislations.
Significant events
• Environment Events
Four internationally recognised environmental days were celebrated during the 2009/10 financial year.
- World Environment Day was celebrated in Prince Albert in conjunction with the Municipality. More than 300 children and senior officials of government departments in the town attended and a presentation on Climate Change was also communicated.
- Arbour Day was celebrated in conjunction with the Mossel Bay Municipality. More than 300 children from local schools attended the event that was accompanied by a tree planting ceremony in a public space close to the historical Post Office tree.
- World Habitat Day was celebrated through participation in a coastal clean-up event hosted by the Eden District Municipality.
- World Wetlands Day was celebrated at Rietenbosch primary school in Stellenbosch. The event involved the launch of a rehabilitation programme, partly funded by the Department, of a degraded wetland on the school premises and an art competition communicating the value of wetlands.
• 2Precious2Pollute
The 2Precious2Pollute programme was launched to convey the work of the Directorate: Pollution Management to Municipalities, the public and stakeholders. Work in the chemicals sector and in developing a Provincial Air Quality Management Plan was highlighted at the launch. Fact-sheets on the work undertaken by the Directorate were used to raise awareness on pollution prevention and resource efficiency.

59
FIN
AN
CIA
L S
TAT
EM
EN
TS
A n n u a l
• Air Quality Management Plan and Status Quo Report (AQMP)
The draft Air Quality Management Plan for the Western Cape was workshopped with various stakeholders during the public participation process of the project. Additional workshops were held with various industrial sectors to solicit comment to further inform the plan. These processes were very successful and resulted in the revision and publication of the draft AQMP for public comment. The Status Quo Report on Air Quality Management in the Western Cape and Western Cape Air Quality Management Plan was approved, printed and communicated to stakeholders at the 2Precious2Pollute Programme Launch.
• Provincial Spatial Development Framework (PSDF)
The Minister approved the Provincial Spatial Development Framework (PSDF) as a section 4(6) Structure Plan in terms of the Land Use Planning Ordinance, 1985 (Ordinance 15 of 1985) (LUPO) on 24 June 2009.
Although the first draft of the manuals were finalised departmentally in the 2008/09 financial year, the public participation process could not proceed before the Provincial Spatial Development Framework (PSDF) was approved. Due to the sensitive nature of some of the manuals it was necessary that the Executive Authority approve the publication of the manuals for public participation purposes. The approval of the PSDF was granted on 24 June 2009. Permission to go out on public participation of the manuals was obtained in September 2009. Subsequent to this, the Department advertised the manuals for comment and conducted workshops during November/December 2009. The closing date for comments on the manuals was 29 January 2010. The Department of Agriculture requested that the manual on Rural Land Use Planning and Management not be finalised until alignment between the manual and the Provincial Rural Development Strategy had been facilitated. Although a draft manual on Inclusionary Housing was produced it could not be finalised because the National Department of Human Settlements has not yet finalised their national framework on Inclusionary Housing. The Manual on Settlement Restructuring was completed but was not submitted to the Executive for approval as the Department considered the approval of all these manuals as a package that needed to be approved simultaneously as it forms the backbone of the PSDF.
The Department embarked on the following additional new projects:
- A process to review and update the Growth Potential Study which was an important informant in the drafting of the PSDF. The review of the Growth Potential Study will also form an important component of the Provincial Spatial Plan that the Department will embark upon in the 2010/11 financial year.
- A Biodiversity Fine Scale Plan to cover gap areas within the Province that were not covered by previous studies. The purpose of this study is to assist, especially rural municipalities, in compiling municipal and provincial spatial plans to recognise and protect areas of high biodiversity value within their jurisdiction.
• Biosphere Reserve Draft Bill
A Draft Biosphere Reserve Bill was published for comment during September 2009. Comments received were evaluated and the proposed Bill submitted to Provincial Legal Services for consideration and certification.

60
PA
RT
4A n n u a l R e p o r t 2 0 0 9 / 1 0
• Biosphere Reserves
The Department continued its financial support to the Kogelberg and Cape West Coast Biosphere Reserves, as well as provided funding towards the compilation of an application to UNESCO for the designation of the Gouritz Cluster Biosphere Reserve. In the case of the Kogelberg and Cape West Coast Biosphere Reserves, the funds were used for logistical support and the compilation of Biosphere Reserve Spatial Development Framework Plans that will form an integral part of the Municipal Spatial Development Frameworks.
• Western Cape Sustainable Development Report
The aim of the Sustainable Development Report is to review the sustainability of the performance of the Provincial Government, both in terms of carrying out its core policy and legislative functions, as well as (in the nature of ) its internal organisational activities. During 2009 the first Sustainable Development Report was issued by the Department. The Sustainable Development Report also provides a broad perspective on the environment and social status of the Western Cape as a geographic and economic region as evaluated in terms of its ecological footprint and the United Nations Human Development Index. The aim of the report is further to provide a benchmark of where the Province stands with regard to sustainability and propose how the agenda could be advanced – both within the Provincial Government itself, and between the government and its stakeholders. This will inform the further development of policies to stimulate equitable and environmentally sustainable economic growth in the Western Cape.
• Wind Conference
Together with the German Technical Cooperation (GTZ) the Department hosted wind energy workshops in May 2009 and a wind energy conference in November 2009. This conference was the final project event whereby the Grid Study and the Regional Regulatory Action Plan were officially presented. Wind Action Groups, which were established during the year, had the opportunity to share experiences and discuss challenges regarding the sector in breakaway sessions. Over 150 delegates attended the conference which served as an important networking and knowledge sharing opportunity for the growth of the wind energy industry.
• Climate Change Education for Teachers
A second workshop in collaboration with City of Cape Town (CoCT) and Education Department on climate change education for teachers was hosted by the Department. The purpose of the 10-day workshop was to educate teachers on the impacts of Climate Change so that they can educate learners. Fifty (50) teachers attended the workshop.
• Clean Development Mechanism Desk (CDM)
A Clean Development Mechanism Desk was hosted within the Department. The purpose of the Clean Development Mechanism Desk was to assist Provincial and Local Government to register Clean Development Mechanism projects with the National Designated Authority for the purpose of selling carbon credits. During 2009, developers were called upon by means of an advertisement in the newspapers to submit projects which could be evaluated for submission as Clean Development Mechanism projects. Eight proposals were received and evaluated, however none were found to be viable as a Clean Development Mechanism project.

61
FIN
AN
CIA
L S
TAT
EM
EN
TS
A n n u a l
• Cleanest Town Competition
The Provincial round of the National Cleanest Town Competition was concluded and an awards ceremony was held on 26 November 2009 to celebrate the provincial winners. Overstrand, George, Swartland, Witzenberg and Eden District Municipalities were awarded for its achievements. The aim of the competition was to promote improved integrated waste management in the Province and to encourage the improvement of the physical environment of the Province.
• 2Wise2Waste
The 2Wise2Waste programme, an environmental efficiency programme, was marketed to the Department of the Premier, Provincial Parliament, Premier’s official residence, Department of Community Safety, Department of Economic Development and Tourism, Treasury and CapeNature. Regular meetings with floor- and departmental champions were conducted to ensure the successful roll-out of the programme. Assistance was also provided to departments on request to facilitate implementation of the programme. A survey was conducted to gauge the impact of the implementation of the 2Wise2Waste programme.
External promotion of 2Wise2Waste programme was presented to market the programme to municipalities and the general public. The Recycled Products Catalogue used to stimulate the demand and supply of recycled products was updated, printed and distributed to the public. The “Buy Recycled Products” campaign under the auspices of 2Wise2Waste programme, was held at the Cape Gate Shopping Centre which provided a platform for SMMEs to market their recycled products to the public.
• Waste Management in Education Programme (WAME)
WAME programme was rolled out to 25 foundation phase educators from schools in the Matzikama area in conjunction with the Matzikama Municipality. A Monitoring and Evaluation (M&E) report was finalised after conducting a survey amongst all schools that participated in the WAME programme since its inception, to ascertain the impact thereof. While the programme was well received by the educators, a support plan is needed to ensure that resources and knowledge is transferred at school level to fellow educators and that the programme is sustained through the support of the Education and Environmental provincial departments and municipal and industry initiatives.
• Waste Minimisation Summit
The Department hosted a Waste Minimisation Summit on 3–4 March 2010 that was attended by 300 stakeholders that provided a platform to shape actions pertaining to waste minimisation that will form part of the Western Cape Integrated Waste Management Plan. Seven (7) commissions covering pertinent aspects related to waste minimisation delivered the final outcomes of the summit. The summit also provided exhibition space that showcased waste minimisation technologies and products.

62
PA
RT
4A n n u a l R e p o r t 2 0 0 9 / 1 0
Major projects
• Integrated Waste Management Planning:
- Monitoring and Evaluation of Municipal Integrated Waste Management Plans
Integrated waste planning is an important tool to address the waste management problems experienced in the Province and therefore a system to monitor and evaluate the implementation of the municipal integrated waste management plans was developed. A consultative process that took the form of two municipal workshops was followed as part of the development process where municipalities commented on the system. The development of the system was partly funded by the Urban Environmental Management Programme, funded by the Danish International Development Agency (DANIDA). The system was piloted in nine municipalities to test the challenges which could hamper full-scale implementation.
- Industry Waste Management Planning
The Department facilitated the development of industry waste management plans for the Consumer Formulated Chemical Sector by completing draft assessment criteria for industry waste management plans and conducting targeted audits to inform the development process. A workshop was held with industry representatives to discuss the assessment criteria and the audit findings.
• GreenStay SA
Continued participation on the National Steering Committee to establish Minimum National Responsible Tourism Standards for the hospitality and tourism industry, which are in final form and are due to be approved by the National Minister for Tourism. The GreenStay SA grading programme was endorsed in the Provincial GreenGoal Action Plan to green the 2010 World Cup Soccer event. Accommodation establishments were invited to be graded. Training workshops on the GreenStay SA grading programme was held.
• Chemicals Management Programme
Twenty-two companies were assisted to complete Chemicals Management Action Plans (CMAP) to reduce accidents and reduce the use of hazardous chemicals. These companies came from three targeted sectors, viz. Consumer-formulated products, Metal-finishing and the Drum-reconditioning sectors.
• Provincial Plan of Action to Reduce Marine Pollution from Land-Based Sources
In keeping with the UNEP/DEA National Plan of Action to address land-based sources of marine pollution, the Directorate: Pollution Management developed a draft Provincial Plan of Action to reduce marine pollution from land-based sources. Priority estuaries were also identified for intervention and a set of actions to be discussed with the responsible government Departments was proposed. The Directorate completed a pilot study on the accumulation of metal pollutants in the Diep River Estuary. The information obtained from this study will be used to determine future interventions towards addressing land-based sources of marine pollution.

63
FIN
AN
CIA
L S
TAT
EM
EN
TS
A n n u a l
• Ambient Air Quality Monitoring Programme
Ambient air quality monitoring stations continued operating in Paarl, Vredenburg and Mossel Bay until they will be relocated according to plan, to a location in George (Eden District Municipality), Malmesbury (West Coast district Municipality) and in Worcester (Cape Winelands District Municipality). Monitoring commenced at Worcester from September 2009. Commissioning and monitoring in Malmesbury and George will commence during the 2010/11 financial year as planned. The fourth continuous ambient air quality monitoring station procured at the end of the 2008/09 financial year was commissioned to operate within the City of Cape Town, and is up and running. This station also includes a Volatile Organic Compound (VOC) monitor.
The ambient air quality monitoring stations monitor the priority pollutants, viz. SO2, NOx, O3 and PM10. Each monitoring station has a complete meteorological station that measures wind speed, radiation, wind direction, temperature and humidity. Air quality data reports are received from these stations on a daily and monthly basis. A Volatile Organic Compound passive sampling programme was completed at each of the monitoring stations. Quarterly reports detailing monitoring results have also been produced. The purpose of the monitoring is to establish baseline data on air pollutants in the Western Cape that will be used to inform whether any priority areas are needed for air quality management in the Province.
• Built Environment Support Programme (BESP)
The BESP is a joint initiative between the Department of Human Settlements (previously the Department of Local Government and Housing) and this Department (DEA&DP). The aim of the programme is to support Municipalities in revising their Spatial Development Frameworks (SDFs) and Human Settlement Plans (HSPs), and to build capacity.
The first round of the BESP was started late in 2008. This round is concerned with revising the SDFs and HSPs of six municipalities, namely George, Knysna, Drakenstein, Stellenbosch, Saldanha and Overstrand. Although the programme is still on track to have the SDFs and HSPs of the aforementioned Municipalities completed by October 2010, a variety of challenges were encountered that influenced the finalisation of the outcomes of the products of this programme.
The second round of the BESP has been initiated. This round includes a further six Municipalities, namely Theewaterskloof, Hessequa, Mossel Bay, Bitou, Breede Valley, and Cape Agulhas.
• Develop a Monitoring and Evaluation System for the Climate Change Response Implementation
In order to assess Governments’ implementation of the Climate Change Response Strategy and Action Plan (CCRS&AP) by all line functions and spheres of government in the Province, a Monitoring and Evaluation system was inclusively developed which included an initial set of indicators and data capture templates covering the four key focus areas of the strategy, namely:
- The Integrated Water Programme;
- The Research, Monitoring and Validation Programme;

64
PA
RT
4A n n u a l R e p o r t 2 0 0 9 / 1 0
- The Linkages Programme between Land Stewardship, Livelihoods and the Economy; and
- The Mitigation Programme.
• Develop a Sea Level Rise Risk Assessment Model
A Risk Assessment Model and Report highlighting potential threats associated with sea level rise and floods along the Eden District coast as well as an action plan was developed. The expected outcome of this assessment is to mainstream climate change issues across all line functions and spheres of government to appropriately inform decision-making.
• Climate Change Capacity-Building Programme
This project will assist the Department in its oversight function in assessing governments’ efforts (through integration and implementation) of adapting to and mitigating against the consequences of climate change and implementing the Western Cape Climate Change Response Strategy and Action Plan. The Department partnered with SALGA in hosting one workshop in each of the five district municipalities targeting provincial and municipal officials and selected NGOs.
• Solar Water Geyser Programme
The Department continued with the roll-out of the Solar Water Heater Geyser programme. Through this programme the Department successfully installed 638 solar water heater geysers in Mossel Bay (138), Oudtshoorn (100), Prince Albert (100) and Darling (300).
Spending trends
• The original appropriation for the 2009/10 financial year was R266.757 million. This amount was decreased by R1.696 million during the Adjustment Estimates, and the final appropriation was thus R265.061 million. Total expenditure for the 2009/10 financial year amounted to R263.330 million, representing 99.3% of the total budget. Slow spending on earmarked funding for the Built Environment Support Programme (BESP), was due to the delay in advertising the bid for the second phase of the development of Municipal Spatial Development Frameworks and Human Settlement Plans. This was the major contributor to the unspent amount of R1.731 million.
Included in the total expenditure is R133.272 million which was transferred to the provincial biodiversity public entity, the Western Cape Nature Conservation Board, trading as CapeNature. CapeNature’s original appropriation of R135.246 million was reduced during the Adjustment Estimates to R133.272 million.
Department specific funding and expenditure, excluding CapeNature’s amounts, is thus R131.789 million and R130.058 million respectively. Based on this revised expenditure, 66.68% (R86.719 million) was in respect of compensation of employees, goods and services accounted for 28.57% (R37.159 million) and payments for capital assets accounted for 3.89% (R5.055 million).
The implementation of higher than budgeted 2009 annual salary increases and the Occupation Specific Dispensation (OSD) without additional funding placed tremendous pressure on the Department’s budget.

65
FIN
AN
CIA
L S
TAT
EM
EN
TS
A n n u a l
Cost-cutting measures were introduced but on a relatively small budget, any additional pressures have major implications. The OSD affected more than 60% of the staff establishment. The implementation of the further phases of the OSD will negatively impact on operational funding over the MTEF period. The Department is in the advanced stage of implementing a new organisational structure without any additional funding. In the long-term, the Department will not be in a position to fully implement the new organisational structure without additional funding.
• Virements
Virement was necessary to defray overspending on Programmes 1: Administration and 3: Compliance and Enforcement. Over expenditure of R1.815 million on Programme 1 was the result of increased costs related to the Information Communication Technology Plan, particularly in respect of network infrastructure equipment. This over expenditure was defrayed by means of applying virement from savings on Programmes 2: Policy Coordination and Environmental Planning (R1.14 million) and 4: Environmental Quality Management (R675 000). Increased legal fees resulted in the over expenditure of R1.48 million on Programme 3: Compliance and Enforcement which was defrayed by means of virement from savings on Programme 4: Environmental Quality Management.
• The Department received revenue from the following sources:
- Revenue from Section 24G fines;
- Boat launching site permits;
- Commission on Insurance;
- Access to information; and
- Charges for maps and posters.
The revenue budget of R106 000 was exceeded by R938 330.
2. Service rendered by the Department
A list of services rendered is reported on in Part 2 of the Annual Report.
• Tariff policy
Revenue tariffs are charged as per approved tariffs. The majority of the revenue tariffs are determined by law or at a national level. These tariffs include Access to Information requests, Boat launching sites, fines in terms of Section 24G of the National Environmental Management Act and Commission on Insurance. Charges for maps and posters are determined by the Department and depend on the printing size.
All the tariffs are reflected in a tariff register, which is revised annually.

66
PA
RT
4A n n u a l R e p o r t 2 0 0 9 / 1 0
• Inventory
Currently the Department does not have stores and all inventory items are procured as the need arises.
• Free Services
No free services were rendered by the Department.
3. Capacity constraints
Although the Department is in an advanced stage with an Institutional Review and Organisational Refinement Project in order to improve efficiencies and building institutional capacity to deliver on its mandates, funding for the implementation is a major challenge. Approval for the new proposed structure will be obtained early in the new financial year. A phased implementation strategy will have to be followed in an attempt to overcome budget limitations.
4. Utilisation of donor funds
In the 2009/10 financial year the Department continued to participate in the Urban Environmental Management Programme funded by the Government of the Kingdom of Denmark. Projects funded by DANIDA (the Danish Development Assistance programme) included the following:
- Air Quality Management Plan;
- Industry waste management planning in the consumer formulated chemical sector;
- Provincial Integrated Waste Management Plan;
- Installation of solar water heating in low-cost housing;
- Installation of energy efficiency floodlights at Phillipi Soccer Stadium; and
- Manuals for implementation of Spatial Development Frameworks.
Funding received during this financial year was R3.080 million while expenditure of R2.964 million was incurred.

67
FIN
AN
CIA
L S
TAT
EM
EN
TS
A n n u a l
5. Trading entities and public entities
• Western Cape Nature Conservation Board
The Western Cape Nature Conservation Board was established in terms of the Western Cape Nature Conservation Board Act, No 15 of 1998, as amended. Trading as CapeNature, the provincial biodiversity public entity, derives its mandate and functions from the Western Cape Nature Conservation Board Act. The Act describes the objectives of CapeNature as:
a) to promote and ensure nature conservation and related matters in the Province;
b) to render services and provide facilities for research and training in connection with nature conservation and related matters in the Province; and
c) in pursuing the objectives as set out in paragraphs (a) and (b), to generate income, within the framework of any applicable policy determined by the responsible Minister or the Provincial Cabinet.
Under the leadership of the Chairperson of the Board and the Chief Executive Officer, CapeNature compiled and submitted its five-year Strategic Plan and 2010/11 Annual Performance Plan and MTEF Budget to the Minister for approval. The approved five-year Strategic Plan, 2010/11 Annual Performance Plan and budget were tabled in the Provincial Legislature on 2 March 2010.
Similarly, the 2008/09 Annual Report was submitted for tabling at the Provincial Legislature on 30 September 2009.
From the Department’s total voted funds, R133.272 million was transferred to CapeNature. The original appropriation of R135.246 million was reduced during the Adjustment Estimates to R133.272 million. The decrease of R1.974 million is the net result after the deduction of R4.555 million from tourism infrastructure funding, while additional funding was in respect of Improvement of Conditions of Service (R1.945 million), funding the Baboon Management Project (R300 000), funding to assist with UNESCO’s application of biosphere reserve statutes for Gouritz (R120 000) and financial support for CapeNature’s internship programme (R216 000).
• Environmental Commissioner
The establishment of the Office of the Environmental Commissioner, as a Schedule 3, Part C Provincial Public entity in terms of the Public Finance Management Act, did not materialise. A process has been set in motion to provide clarity on the appropriate action on the future of the Office of the Environmental Commissioner.
6. Organisations to whom transfer payments have been made
A list of entities to whom transfer payments have been made, including the purpose for transfer payments and the accountability arrangements in place, are reported on in PART 2 of the Annual Report.

68
PA
RT
4A n n u a l R e p o r t 2 0 0 9 / 1 0
7. Public private partnerships (PPP)
No public/private partnerships were established by the Department during the 2009/10 financial year.
8. Corporate governance arrangements
The Department utilises the shared Audit Committee and Internal Audit Unit of the Province. The Audit Committee consists of four members; all external appointments. The Audit Committee met regularly during the 2009/10 financial year. The Audit Committee and Internal Audit Unit operated effectively during the 2009/10 financial year. The Audit Committee for the Economic Cluster was established and new members were appointed from 1 January 2010.
Corporate governance is the responsibility of all employees and the Enterprise Risk Management (ERM) Unit assists in strengthening this Departmental governance framework through embedding the culture of risk management as required in section 38(1) (a) (i) of the PFMA as well as Chapter 3 of the Provincial Treasury Instructions. During the 2009/10 financial year various fraud and risk awareness workshops were facilitated by this Unit as well as operational and strategic risk assessment workshops. All identified risks were adequately recorded in the Departmental Risk profile and officially handed over to the responsible risk owners to implement risk mitigating actions.
The Departmental Risk Management Policy as well as the Fraud Prevention Policy and Response Plan were completed. All risk management and fraud activities were reported quarterly to the Departmental Fraud and Risk Management Committee, Provincial Treasury and the Shared Audit Committee.
9. Discontinued activities/activities to be discontinued
There were no discontinued activities.
10. New/proposed activities
The implementation of the NEM:ICM Act will result in new functions being devolved to the Province.
Ongoing law reform process at National level may result in new functions being devolved to the Province. Planning legislation is receiving attention at National and Provincial level and the outcome may affect the different spheres of government. Additional funding for the Development Facilitation and Climate Change units components was received during the budgeting process.
11. Asset management
The Department utilises an electronic asset management system to record all its assets (capital and current). The asset register has been updated and also reconciled with the accounting records subsequent to year-end. Stock-taking for the 2009/10 financial year has been completed and the asset management component is currently following up on exceptions.
69
FIN
AN
CIA
L S
TAT
EM
EN
TS
A n n u a l
12. Events after the reporting date
The modernisation programme of the Provincial Government, which is at an advanced stage, proposes the shift of Human Resources (excluding the Departments of Health and Education), Internal Audit and Enterprise Risk Management functions to a shared Corporate Services within the Department of the Premier phased in from 1 April 2010. The financial implications of the function shift will be finalised during the 2010/11 Adjustment Estimates process once all of the human resource and other related issues have been finalised.
13. Performance information
The implementation of the objectives as included in the Annual Performance Plan was subjected to in-year monitoring, thereby ensuring that resources are utilised effectively and efficiently. This in-year monitoring and reporting provides insight into assessing whether the Department achieved its performance targets. The in-year monitoring and reporting process was done monthly and quarterly through monthly financial reporting and quarterly reporting in the form of the in-year monitoring reports that are submitted to the Minister and the Provincial Treasury.
The Quarterly Performance Reports on the non-financial information were submitted to the Provincial Treasury and the Shared Audit Committee. These assessments allow the Department to monitor actual performance relative to the targets as included in the Annual Performance Plan. Any deviations were identified at an early stage and the remedial steps were introduced where possible, to ensure that the projected targets were met at the end of the financial year. Complementary to the quarterly performance reports, the Department also reports on a monthly basis on its actual revenue and expenditure levels as well as the projected revenue and expenditure for the remainder of the financial year, whilst monthly progress reports on key measurable objectives were submitted to the monthly Management Finance and General meetings.
Performance information is reported on in PART 2 of the Annual Report.
14. Standing Committee on Public Accounts (SCOPA) resolutions
Herewith the following Standing Committee on Public Accounts resolutions.
- The Department should review their documentation management in order to improve the systems of those sections that do not have efficient document management.
- The Department should improve the ongoing monitoring and supervision over control processes and procedures to ensure the accuracy and completeness of reported performance information. Furthermore, management should ensure that staff members are conversant with the processes and procedures related to performance information.
- The stores should be visited regularly to confirm that the security has not been breached and security at the stores should be improved.
- Processes should be improved to track the movement of assets, record any losses, and investigate any losses recorded in a timely manner.

70
PA
RT
4A n n u a l R e p o r t 2 0 0 9 / 1 0
- The investigations should be completed as soon as possible and any risks identified should be addressed by improving the internal controls implemented.
- The Department should take the necessary steps to ensure that performance information is clear and concise. They must also ensure that targeted performance is specific, well defined and measurable, so as to ensure that actual performance for the year can be accurately compared to the targets set at the beginning of the period.
15. Progress made with regard to matters reported by the Auditor-General South Africa in prior periods
Nature of qualification, disclaimer, adverse opinion and matters of non-compliance
Financial year in which it first occurred
Progress made in clearing/resolving the matter
Significant difficulties were experienced during the audit concerning delays or the availability of requested information.
2008/09 Monitoring and Evaluation unit included in proposed new structure for the Department.
Modernisation project - Livelink document management system to be implemented transversally in the Province.
The financial statements were subject to material amendments resulting from the audit.
2008/09 Major and Minor assets were reconciled on a monthly basis, Interim Annual Financial Statements were compiled.
Adequate control processes and procedures are not designed and implemented to ensure the accuracy and completeness of reported performance information .
Lack of effective, efficient and transparent systems and internal controls regarding performance management.
Usefulness and reliability of reported performance information.
Reported performance information not relevant.
2008/09 Monitoring and Evaluation unit included in the proposed new structure. Programme managers sign quarterly reports. A Deputy Director was utilised to drive monitoring and evaluation processes in the meantime until the new structure was implemented.
Due to a break-in at the store of the Department, assets with a cost of R631 284 were damaged. The total value of the damages cannot be reliably estimated. The incident has been reported to the South African Police Services.
2008/09 Case was closed after police investigation. Assets were disposed. The specific store was used as a temporary measure during building renovations. A new store of SCM was secured with security gates and access was restricted to Asset Management unit. Maintenance and improvement in access control over asset stores. Reduction of asset stores to a single store.
Two investigations are being conducted by the Forensic Investigative Unit regarding alleged irregularities in the procurement of folders/files and in the payment of air travel accounts without the necessary authorisation. These investigations were still in progress at the reporting date.
2008/09 The case relating to air travel payments was disproved by the Forensic Investigative Unit (FIU) on 3 August 2009. The investigation of the case relating to the procurement irregularities, was only initiated by the Forensic Investigative Unit recently, due to a lack of capacity in the latter unit. All relevant documentation was provided to the FIU in November 2008.

71
FIN
AN
CIA
L S
TAT
EM
EN
TS
A n n u a l
16. Exemptions and deviations received from the National Treasury
None
17. Approval
The Annual Financial Statements set out on pages 75 to 126 have been approved by the Accounting Officer.
R Ellis
Accounting Officer
21 July 2010

72
PA
RT
4A n n u a l R e p o r t 2 0 0 9 / 1 0
Report of the Auditor-General to the Western Cape Provincial Parliament on the Financial Statements of Vote No. 9: Western Cape Department of Environmental Affairs and Development Planning for the year ended 31 March 2010
REPORT ON THE FINANCIAL STATEMENTS
Introduction
1. I have audited the accompanying financial statements of the Department of Environmental Affairs and Development Planning (Department), which comprise the appropriation statement, the statement of financial position as at 31 March 2010, and the statement of financial performance and cash flow statement for the year then ended and a summary of significant accounting policies and other explanatory information, as set out on pages 75 to 126.
Accounting Officer’s responsibility for the financial statements
2. The accounting officer is responsible for the preparation of these financial statements in accordance with the modified cash basis of accounting determined by the National Treasury, as set out in the accounting policy note 1.1 and in the manner required by the Public Finance Management Act of South Africa, 1999 (Act No. 1 of 1999) (PFMA) and Division of Revenue Act of South Africa, 2009 (Act No. 12 of 2009) (DoRA). This responsibility includes: designing, implementing and maintaining internal control relevant to the preparation and fair presentation of financial statements that are free from material misstatement, whether due to fraud or error; selecting and applying appropriate accounting policies and making accounting estimates that are reasonable in the circumstances.
Auditor-General’s responsibility
3. As required by section 188 of the Constitution of the Republic of South Africa 1996, and section 4 of the Public Audit Act of South Africa, 2004 (Act No.25 of 2004) (PAA) and section 40(2) of the PFMA, my responsibility is to express an opinion on these financial statements based on my audit.
4. I conducted my audit in accordance with International Standards on Auditing and General Notice 1570 of 2009 issued in Government Gazette 32758 of 27 November 2009. Those standards require that I comply with ethical requirements and plan and perform the audit to obtain reasonable assurance about whether the financial statements are free from material misstatement.
5. An audit involves performing procedures to obtain audit evidence about the amounts and disclosures in the financial statements. The procedures selected depend on the auditor’s judgement, including the assessment of the risks of material misstatement of the financial statements, whether due to fraud or error. In making those risk assessments, the auditor considers internal control relevant to the entity’s preparation of the financial statements in order to design audit procedures that are appropriate in the circumstances, but not for the purpose of expressing an opinion on the effectiveness of the entity’s internal control.

73
FIN
AN
CIA
L S
TAT
EM
EN
TS
A n n u a l
An audit also includes evaluating the appropriateness of accounting policies used and the reasonableness of accounting estimates made by management, as well as evaluating the overall presentation of the financial statements.
6. I believe that the audit evidence I have obtained is sufficient and appropriate to provide a basis for my audit opinion.
Opinion
7. In my opinion, the financial statements present fairly, in all material respects, the financial position of the Western Cape Department of Environmental Affairs and Development Planning for the year ended 31 March 2010, and its financial performance and its cash flows for the year then ended, in accordance with the modified cash basis of accounting determined by the National Treasury, determined in note 1.1 to the financial statements and in the manner required by the PFMA and DoRA.
Emphasis of matter
I draw attention to the matter below. My opinion is not modified in respect of this matter:
Basis of accounting
8. The department’s policy is to prepare financial statements on the modified cash basis of accounting determined by National Treasury, described in the accounting policy note 1.1 to the financial statements.
Additional matters
I draw attention to the matter below. My opinion is not modified in respect of this matter:
Unaudited supplementary schedules
9. The supplementary information set out on pages 120 to 126 does not form part of the financial statements and is presented as additional information. I have not audited these schedules and accordingly I do not express an opinion thereon.
REPORT ON OTHER LEGAL AND REGULATORY REQUIREMENTS
10. In terms of the PAA and General notice 1570 of 2009, issued in Government Gazette No. 32758 of 27 November 2009, I include below my findings on the report on predetermined objectives, compliance with the PFMA and DoRA and financial management (internal control).

74
PA
RT
4A n n u a l R e p o r t 2 0 0 9 / 1 0
Findings
Predetermined objectives
11. No matters to report.
Compliance with laws and regulations
12. No matters to report.
Internal control
13. I considered internal control relevant to my audit of the financial statements and the report on predetermined objectives and compliance with the PFMA and DoRA, but not for the purposes of expressing an opinion on the effectiveness of internal control.
14. No matters to report.
OTHER REPORTS
Investigations
Investigations in progress
15. Two investigations are being conducted with regard to alleged procurement corruption and alleged misuse of government resources. The investigations were still ongoing at the reporting date.
Investigations completed during the financial year
16. Two investigations were concluded during the year under review. One case with regard to alleged mismanagement of funds was finalised, as the allegation was disproved. The other case investigated was with regard to theft of petty cash. The case was finalised with no loss to the department and the offender was subsequently dismissed.

75
FIN
AN
CIA
L S
TAT
EM
EN
TS
A n n u a l
Performance audits
17. A performance audit was conducted during the year under review concerning the use of consultants and agencies as well as outsourced services. The objective of the audit was to evaluate the measures instituted by management to ensure that the department appointed consultants economically and utilised them efficiently and effectively. The audit was concluded in May 2010.
Cape Town
31 July 2010

76
PA
RT
4A n n u a l R e p o r t 2 0 0 9 / 1 0
App
ropr
iati
on S
tate
men
tFO
R TH
E YE
AR
END
ED 3
1 M
ARC
H 2
010
App
ropr
iatio
n pe
r Pro
gram
me
2009
/10
2008
/09
Det
ail p
er P
rogr
amm
e
Adj
uste
d A
ppro
pria
tion
Shift
ing
of
Fund
sVi
rem
ent
Fina
l A
ppro
pria
tion
Act
ual
Expe
nditu
reVa
rian
ceEx
pend
iture
as
% o
f Fin
al
App
ropr
iatio
n
Fina
l A
ppro
pria
tion
Act
ual
Expe
nditu
re
R’00
0R’
000
R’00
0R’
000
R’00
0R’
000
%R’
000
R’00
0
1.
Adm
inis
trat
ion
Curr
ent p
aym
ent
34,1
66(5
3)19
34,1
3234
,131
110
0.0
29,7
6729
,767
Tran
sfer
s an
d su
bsid
ies
485
18-
503
503
-10
0.0
106
105
Paym
ent f
or c
apita
l ass
ets
478
351,
796
2,30
92,
309
-10
0.0
996
996
2.
Polic
y Co
ordi
nati
on a
nd
Envi
ronm
enta
l Pla
nnin
g
Curr
ent p
aym
ent
22,2
70(2
10)
(1,0
93)
20,9
6719
,666
1,30
193
.816
,129
15,9
79Tr
ansf
ers
and
subs
idie
s51
4-
-51
451
4-
100.
02,
064
2,06
0Pa
ymen
t for
cap
ital a
sset
s73
421
0(4
7)89
788
611
98.8
166
137
3.
Com
plia
nce
and
Enfo
rcem
ent
Curr
ent p
aym
ent
9,12
6(1
5)1,
480
10,5
9110
,591
-10
0.0
7,06
27,
057
Tran
sfer
s an
d su
bsid
ies
--
--
--
-14
314
3Pa
ymen
t for
cap
ital a
sset
s13
715
-15
215
11
99.3
114
114
4.
Envi
ronm
enta
l Qua
lity
Man
agem
ent
Curr
ent p
aym
ent
58,0
68(3
07)
(2,1
55)
55,6
0655
,524
8299
.946
,781
46,4
35Tr
ansf
ers
and
subs
idie
s25
2-
-25
22
250
0.8
1,00
01,
000
Paym
ent f
or c
apita
l ass
ets
1,36
430
7-
1,67
11,
671
-10
0.0
2,17
02,
168
5.
Biod
iver
sity
Man
agem
ent
Curr
ent p
aym
ent
4,13
5(3
8)-
4,09
74,
012
8597
.93,
941
3,93
3Tr
ansf
ers
and
subs
idie
s13
3,33
2-
-13
3,33
213
3,33
2-
100.
094
,658
94,6
58Pa
ymen
t for
cap
ital a
sset
s-
38-
3838
-10
0.0
3432
TOTA
L26
5,06
1-
-26
5,06
126
3,33
01,
731
99.3
205,
131
204,
584

77
FIN
AN
CIA
L S
TAT
EM
EN
TS
A n n u a l
App
ropr
iati
on S
tate
men
tFO
R TH
E YE
AR
END
ED 3
1 M
ARC
H 2
010
2009
/10
2008
/09
Fina
l A
ppro
pria
tion
Act
ual
Expe
nditu
reFi
nal
App
ropr
iatio
nA
ctua
l Ex
pend
iture
TOTA
L (b
roug
ht fo
rwar
d)
Reco
ncili
atio
n w
ith
stat
emen
t of fi
nanc
ial p
erfo
rman
ce
AD
D Dep
artm
enta
l rec
eipt
s93
861
4A
id a
ssis
tanc
e3,
080
2,39
8
Act
ual a
mou
nts
per s
tate
men
t of fi
nanc
ial p
erfo
rman
ce (t
otal
reve
nue)
269,
079
208,
143
AD
D Aid
ass
ista
nce
2,96
41,
937
Act
ual a
mou
nts
per s
tate
men
t of fi
nanc
ial p
erfo
rman
ce (t
otal
exp
endi
ture
)26
6,29
420
6,52
1

78
PA
RT
4A n n u a l R e p o r t 2 0 0 9 / 1 0
App
ropr
iati
on S
tate
men
tFO
R TH
E YE
AR
END
ED 3
1 M
ARC
H 2
010
App
ropr
iatio
n pe
r Eco
nom
ic C
lass
ifica
tion
2009
/10
2008
/09
Adj
uste
d A
ppro
pria
tion
Shift
ing
of
Fund
sVi
rem
ent
Fina
l A
ppro
pria
tion
Act
ual
Expe
nditu
reVa
rian
ceEx
pend
iture
as
% o
f Fin
al
App
ropr
iatio
n
Fina
l A
ppro
pria
tion
Act
ual
Expe
nditu
re
R’00
0R’
000
R’00
0R’
000
R’00
0R’
000
%R’
000
R’00
0
Curr
ent p
aym
ents
Com
pens
atio
n of
em
ploy
ees
90,1
35(1
,884
)(1
,500
)86
,751
86,7
1932
100.
066
,999
66,5
48G
oods
and
ser
vice
s37
,603
1,24
2(2
49)
38,5
9637
,159
1,43
796
.336
,669
36,6
11In
tere
st a
nd re
nt o
n la
nd14
(4)
-10
10-
100.
0-
-Fi
nanc
ial t
rans
actio
ns in
ass
ets
and
liabi
litie
s13
23-
3636
-10
0.0
1212
Tran
sfer
s an
d su
bsid
ies
Prov
ince
s an
d m
unic
ipal
ities
250
--
250
-25
0-
350
350
Dep
artm
enta
l age
ncie
s an
d ac
coun
ts13
3,59
7(2
)-
133,
595
133,
595
-10
0.0
95,6
6095
,659
Uni
vers
ities
and
tech
niko
ns60
--
6060
-10
0.0
--
Non
-pro
fit in
stitu
tions
51
6-
-51
651
6-
100.
01,
107
1,10
3H
ouse
hold
s 16
020
-18
018
0-
100.
085
485
4
Paym
ents
for c
apit
al a
sset
s
Mac
hine
ry a
nd e
quip
men
t2,
536
591
1,74
94,
876
4,86
412
99.8
3,48
03,
447
Soft
war
e an
d ot
her i
ntan
gibl
e as
sets
177
14-
191
191
-10
0.0
--
TOTA
L26
5,06
1-
-26
5,06
126
3,33
01,
731
99.3
205,
131
204,
584

79
FIN
AN
CIA
L S
TAT
EM
EN
TS
A n n u a l
DET
AIL
PER
PRO
GR
AM
ME
1 –
AD
MIN
ISTR
ATIO
NFO
R TH
E YE
AR
END
ED 3
1 M
ARC
H 2
010
2009
/10
2008
/09
Det
ail p
er S
ub-p
rogr
amm
e
Adj
uste
d A
ppro
pria
tion
Shift
ing
of
Fund
sVi
rem
ent
Fina
l A
ppro
pria
tion
Act
ual
Expe
nditu
reVa
rian
ceEx
pend
iture
as
% o
f Fin
al
App
ropr
iatio
n
Fina
l A
ppro
pria
tion
Act
ual
Expe
nditu
re
R’00
0R’
000
R’00
0R’
000
R’00
0R’
000
%R’
000
R’00
0
1.1
Offi
ce o
f the
Pro
vinc
ial
Min
iste
r of L
ocal
G
over
nmen
t, En
viro
nmen
tal
Aff
airs
and
Dev
elop
men
t Pl
anni
ng
Curr
ent p
aym
ent
4,91
6(2
70)
-4,
646
4,64
6-
100.
04,
958
4,95
8Tr
ansf
ers
and
subs
idie
s1
--
11
-10
0.0
11
Paym
ent f
or c
apita
l ass
ets
4021
-61
61-
100.
017
217
2
1.2
Seni
or M
anag
emen
t
Curr
ent p
aym
ent
4,99
2(1
86)
-4,
806
4,80
6-
100.
04,
299
4,29
9Pa
ymen
t for
cap
ital a
sset
s16
818
61,
441
1,79
51,
795
-10
0.0
414
414
1.3
Corp
orat
e Se
rvic
es
Curr
ent p
aym
ent
16,6
7416
019
16,8
5316
,852
110
0.0
13,4
1313
,413
Tran
sfer
s an
d su
bsid
ies
484
18-
502
502
-10
0.0
105
104
Paym
ent f
or c
apita
l ass
ets
90-
355
445
445
-10
0.0
337
337
1.4
Fina
ncia
l Man
agem
ent
Curr
ent p
aym
ent
7,58
424
3-
7,82
77,
827
-10
0.0
7,09
77,
097
Paym
ent f
or c
apita
l ass
ets
180
(172
)-
88
-10
0.0
7373
TOTA
L35
,129
-1,
815
36,9
4436
,943
110
0.0
30,8
6930
,868

80
PA
RT
4A n n u a l R e p o r t 2 0 0 9 / 1 0
DET
AIL
PER
PRO
GR
AM
ME
1 –
AD
MIN
ISTR
ATIO
NFO
R TH
E YE
AR
END
ED 3
1 M
ARC
H 2
010
2009
/10
2008
/09
Prog
ram
me
1 –
Econ
omic
Cl
assi
ficat
ion
Adj
uste
d A
ppro
pria
tion
Shift
ing
of
Fund
sVi
rem
ent
Fina
l A
ppro
pria
tion
Act
ual
Expe
nditu
reVa
rian
ceEx
pend
iture
as
% o
f Fin
al
App
ropr
iatio
n
Fina
l A
ppro
pria
tion
Act
ual
Expe
nditu
re
R’00
0R’
000
R’00
0R’
000
R’00
0R’
000
%R’
000
R’00
0
Curr
ent p
aym
ents
Com
pens
atio
n of
em
ploy
ees
25,9
81(4
16)
-25
,565
25,5
65-
100.
021
,319
21,3
19G
oods
and
ser
vice
s8,
174
352
198,
545
8,54
41
100.
08,
443
8,44
3In
tere
st a
nd re
nt o
n la
nd9
(5)
-4
4-
100.
0-
-Fi
nanc
ial t
rans
actio
ns in
ass
ets
and
liabi
litie
s2
16-
1818
-10
0.0
55
Tran
sfer
s an
d su
bsid
ies
Dep
artm
enta
l age
ncie
s an
d ac
coun
ts32
5(2
)-
323
323
-10
0.0
1-
Non
-pro
fit in
stitu
tions
1
--
11
-10
0.0
--
Hou
seho
lds
159
20-
179
179
-10
0.0
105
105
Paym
ent
for c
apit
al a
sset
s
Mac
hine
ry a
nd e
quip
men
t47
835
1,79
62,
309
2,30
9-
100.
099
699
6
TOTA
L35
,129
-1,
815
36,9
4436
,943
110
0.0
30,8
6930
,868

81
FIN
AN
CIA
L S
TAT
EM
EN
TS
A n n u a l
DET
AIL
PER
PRO
GR
AM
ME
2 –
POLI
CY
COO
RDIN
ATIO
N A
ND
EN
VIR
ON
MEN
TAL
PLA
NN
ING
FOR
THE
YEA
R EN
DED
31
MA
RCH
201
0
2009
/10
2008
/09
Det
ail p
er S
ub-p
rogr
amm
e
Adj
uste
d A
ppro
pria
tion
Shift
ing
of
Fund
sVi
rem
ent
Fina
l A
ppro
pria
tion
Act
ual
Expe
nditu
reVa
rian
ceEx
pend
iture
as
% o
f Fin
al
App
ropr
iatio
n
Fina
l A
ppro
pria
tion
Act
ual
Expe
nditu
re
R’00
0R’
000
R’00
0R’
000
R’00
0R’
000
%R’
000
R’00
0
2.1
Inte
rgov
ernm
enta
l Co
ordi
nati
on, S
pati
al a
nd
Dev
elop
men
t Pla
nnin
g
Curr
ent p
aym
ent
14,1
92(2
84)
(892
)13
,016
11,7
701,
246
90.4
6,51
46,
486
Tran
sfer
s an
d su
bsid
ies
514
--
514
514
-10
0.0
1,96
91,
969
Paym
ent f
or c
apita
l ass
ets
108
220
-32
832
8-
100.
0-
-
2.2
Rese
arch
and
D
evel
opm
ent S
uppo
rt
Curr
ent p
aym
ent
5,07
464
(187
)4,
951
4,89
655
98.9
5,96
55,
941
Tran
sfer
s an
d su
bsid
ies
--
--
--
-95
91Pa
ymen
t for
cap
ital a
sset
s40
--
4030
1075
.013
010
1
2.3
Info
rmat
ion
Man
agem
ent
Serv
ices
Curr
ent p
aym
ent
3,00
410
(14)
3,00
03,
000
-10
0.0
3,65
03,
552
Paym
ent f
or c
apita
l ass
ets
586
(10)
(47)
529
528
199
.836
36
TOTA
L23
,518
-(1
,140
)22
,378
21,0
661,
312
94.1
18,3
5918
,176

82
PA
RT
4A n n u a l R e p o r t 2 0 0 9 / 1 0
DET
AIL
PER
PRO
GR
AM
ME
2 –
POLI
CY
COO
RDIN
ATIO
N A
ND
EN
VIR
ON
MEN
TAL
PLA
NN
ING
FOR
THE
YEA
R EN
DED
31
MA
RCH
201
0
2009
/10
2008
/09
Prog
ram
me
2 –
Econ
omic
Cl
assi
ficat
ion
Adj
uste
d A
ppro
pria
tion
Shift
ing
of
Fund
sVi
rem
ent
Fina
l A
ppro
pria
tion
Act
ual
Expe
nditu
reVa
rian
ceEx
pend
iture
as
% o
f Fin
al
App
ropr
iatio
n
Fina
l A
ppro
pria
tion
Act
ual
Expe
nditu
re
R’00
0R’
000
R’00
0R’
000
R’00
0R’
000
%R’
000
R’00
0
Curr
ent p
aym
ents
Com
pens
atio
n of
em
ploy
ees
11,1
18-
(120
)10
,998
10,9
962
100.
07,
281
7,17
0G
oods
and
ser
vice
s11
,152
(211
)(9
73)
9,96
88,
669
1,29
987
.08,
848
8,80
9In
tere
st a
nd re
nt o
n la
nd-
1-
11
-10
0.0
--
Tran
sfer
s an
d su
bsid
ies
Prov
ince
s an
d m
unic
ipal
ities
--
--
--
-10
010
0D
epar
tmen
tal a
genc
ies
and
acco
unts
--
--
--
-85
885
8
Non
-pro
fit in
stitu
tions
51
4-
-51
451
4-
100.
01,
105
1,10
1H
ouse
hold
s -
--
--
--
11
Paym
ent f
or c
apit
al a
sset
s
Mac
hine
ry a
nd e
quip
men
t60
318
1(4
7)73
772
611
98.5
166
137
Soft
war
e an
d ot
her i
ntan
gibl
e as
sets
131
29-
160
160
-10
0.0
--
TOTA
L23
,518
-(1
,140
)22
,378
21,0
661,
312
94.1
18,3
5918
,176

83
FIN
AN
CIA
L S
TAT
EM
EN
TS
A n n u a l
DET
AIL
PER
PRO
GR
AM
ME
3 –
COM
PLIA
NCE
AN
D E
NFO
RCEM
ENT
FOR
THE
YEA
R EN
DED
31
MA
RCH
201
0
2009
/10
2008
/09
Det
ail p
er S
ub-p
rogr
amm
e
Adj
uste
d A
ppro
pria
tion
Shift
ing
of
Fund
sVi
rem
ent
Fina
l A
ppro
pria
tion
Act
ual
Expe
nditu
reVa
rian
ceEx
pend
iture
as
% o
f Fin
al
App
ropr
iatio
n
Fina
l A
ppro
pria
tion
Act
ual
Expe
nditu
re
R’00
0R’
000
R’00
0R’
000
R’00
0R’
000
%R’
000
R’00
0
3.1
Aut
hori
sati
on, C
ompl
ianc
e an
d En
forc
emen
t
Curr
ent p
aym
ent
9,12
6(1
5)1,
480
10,5
9110
,591
-10
0.0
7,06
27,
057
Tran
sfer
s an
d su
bsid
ies
--
--
--
-14
314
3Pa
ymen
t for
cap
ital a
sset
s13
715
-15
215
11
99.3
114
114
TOTA
L9,
263
-1,
480
10,7
4310
,742
110
0.0
7,31
97,
314
2009
/10
2008
/09
Prog
ram
me
3 –
Econ
omic
Cl
assi
ficat
ion
Adj
uste
d A
ppro
pria
tion
Shift
ing
of
Fund
sVi
rem
ent
Fina
l A
ppro
pria
tion
Act
ual
Expe
nditu
reVa
rian
ceEx
pend
iture
as
% o
f Fin
al
App
ropr
iatio
n
Fina
l A
ppro
pria
tion
Act
ual
Expe
nditu
re
R’00
0R’
000
R’00
0R’
000
R’00
0R’
000
%R’
000
R’00
0
Curr
ent p
aym
ents
Com
pens
atio
n of
em
ploy
ees
5,38
0(9
8)-
5,28
25,
282
-10
0.0
3,21
53,
212
Goo
ds a
nd s
ervi
ces
3,74
682
1,48
05,
308
5,30
8-
100.
03,
847
3,84
5Fi
nanc
ial t
rans
actio
ns in
ass
ets
and
liabi
litie
s-
1-
11
-10
0.0
--
Tran
sfer
s an
d su
bsid
ies
Dep
artm
enta
l age
ncie
s an
d ac
coun
ts-
--
--
--
143
143
Paym
ent
for c
apit
al a
sset
s
Mac
hine
ry a
nd e
quip
men
t13
715
-15
215
11
99.3
114
114
TOTA
L9,
263
-1,
480
10,7
4310
,742
110
0.0
7,31
97,
314

84
PA
RT
4A n n u a l R e p o r t 2 0 0 9 / 1 0
DET
AIL
PER
PRO
GR
AM
ME
4 –
ENV
IRO
NM
ENTA
L Q
UA
LITY
MA
NA
GEM
ENT
FOR
THE
YEA
R EN
DED
31
MA
RCH
201
0
2009
/10
2008
/09
Det
ail p
er S
ub-p
rogr
amm
e
Adj
uste
d A
ppro
pria
tion
Shift
ing
of
Fund
sVi
rem
ent
Fina
l A
ppro
pria
tion
Act
ual
Expe
nditu
reVa
rian
ceEx
pend
iture
as
% o
f Fin
al
App
ropr
iatio
n
Fina
l A
ppro
pria
tion
Act
ual
Expe
nditu
re
R’00
0R’
000
R’00
0R’
000
R’00
0R’
000
%R’
000
R’00
0
4.1
Impa
ct M
anag
emen
t
Curr
ent p
aym
ent
33,1
05(1
46)
-32
,959
32,9
581
100.
028
,246
28,1
47Tr
ansf
ers
and
subs
idie
s1
--
11
-10
0.0
748
748
Paym
ent f
or c
apita
l ass
ets
9728
8-
385
385
-10
0.0
172
171
4.2
Air
Qua
lity
Man
agem
ent
Curr
ent p
aym
ent
6,07
8(1
44)
(435
)5,
499
5,47
623
99.6
4,40
74,
406
Paym
ent f
or c
apita
l ass
ets
1,02
02
-1,
022
1,02
2-
100.
01,
641
1,64
0
4.3
Clim
ate
Chan
ge
Man
agem
ent
Curr
ent p
aym
ent
3,41
226
2-
3,67
43,
674
-10
0.0
2,83
82,
604
Paym
ent f
or c
apita
l ass
ets
35(2
1)-
1414
-10
0.0
--
4.4
Pollu
tion
and
Was
te
Man
agem
ent
Curr
ent p
aym
ent
15,4
73(2
79)
(1,7
20)
13,4
7413
,416
5899
.611
,290
11,2
78Tr
ansf
ers
and
subs
idie
s25
1-
-25
11
250
0.4
252
252
Paym
ent f
or c
apita
l ass
ets
212
38-
250
250
-10
0.0
357
357
TOTA
L59
,684
-(2
,155
)57
,529
57,1
9733
299
.449
,951
49,6
03

85
FIN
AN
CIA
L S
TAT
EM
EN
TS
A n n u a l
DET
AIL
PER
PRO
GR
AM
ME
4 –
ENV
IRO
NM
ENTA
L Q
UA
LITY
MA
NA
GEM
ENT
FOR
THE
YEA
R EN
DED
31
MA
RCH
201
0
2009
/10
2008
/09
Prog
ram
me
4 –
Econ
omic
Cl
assi
ficat
ion
Adj
uste
d A
ppro
pria
tion
Shift
ing
of
Fund
sVi
rem
ent
Fina
l A
ppro
pria
tion
Act
ual
Expe
nditu
reVa
rian
ceEx
pend
iture
as
% o
f Fin
al
App
ropr
iatio
n
Fina
l A
ppro
pria
tion
Act
ual
Expe
nditu
re
R’00
0R’
000
R’00
0R’
000
R’00
0R’
000
%R’
000
R’00
0
Curr
ent p
aym
ents
Com
pens
atio
n of
em
ploy
ees
44,4
97(1
,365
)(1
,380
)41
,752
41,7
52-
100.
032
,850
32,5
17G
oods
and
ser
vice
s13
,555
1,05
2(7
75)
13,8
3213
,750
8299
.413
,924
13,9
11In
tere
st a
nd re
nt o
n la
nd5
--
55
-10
0.0
--
Fina
ncia
l tra
nsac
tions
in a
sset
s an
d lia
bilit
ies
116
-17
17-
100.
07
7
Tran
sfer
s an
d su
bsid
ies
Prov
ince
s an
d m
unic
ipal
ities
250
--
250
-25
0-
250
250
Non
-pro
fit in
stitu
tions
1
--
11
-10
0.0
22
Hou
seho
lds
1-
-1
1-
100.
074
874
8
Paym
ent f
or c
apit
al a
sset
s
Mac
hine
ry a
nd e
quip
men
t1,
318
322
-1,
640
1,64
0-
100.
02,
170
2,16
8So
ftw
are
and
othe
r int
angi
ble
asse
ts46
(15)
-31
31-
100.
0-
-
TOTA
L59
,684
-(2
,155
)57
,529
57,1
9733
299
.449
,951
49,6
03

86
PA
RT
4A n n u a l R e p o r t 2 0 0 9 / 1 0
DET
AIL
PER
PRO
GR
AM
ME
5 –
BIO
DIV
ERSI
TY M
AN
AG
EMEN
TFO
R TH
E YE
AR
END
ED 3
1 M
ARC
H 2
010
2009
/10
2008
/09
Det
ail p
er S
ub-p
rogr
amm
e
Adj
uste
d A
ppro
pria
tion
Shift
ing
of
Fund
sVi
rem
ent
Fina
l A
ppro
pria
tion
Act
ual
Expe
nditu
reVa
rian
ceEx
pend
iture
as
% o
f Fin
al
App
ropr
iatio
n
Fina
l A
ppro
pria
tion
Act
ual
Expe
nditu
re
R’00
0R’
000
R’00
0R’
000
R’00
0R’
000
%R’
000
R’00
0
5.1
Biod
iver
sity
and
Pro
tect
ed
Are
a Pl
anni
ng a
nd
Man
agem
ent
Curr
ent p
aym
ent
1,83
8(3
4)-
1,80
41,
719
8595
.32,
179
2,17
5Tr
ansf
ers
and
subs
idie
s60
--
6060
-10
0.0
--
Paym
ent f
or c
apita
l ass
ets
--
--
--
-23
21
5.2
Wes
tern
Cap
e N
atur
e Co
nser
vati
on B
oard
Tran
sfer
s an
d su
bsid
ies
133,
272
--
133,
272
133,
272
-10
0.0
94,6
5894
,658
5.3
Coas
tal R
esou
rce
Use
Curr
ent p
aym
ent
2,29
7(4
)-
2,29
32,
293
-10
0.0
1,76
21,
758
Paym
ent f
or c
apita
l ass
ets
-38
-38
38-
100.
011
11
TOTA
L13
7,46
7-
-13
7,46
713
7,38
285
99.9
98,6
3398
,623

87
FIN
AN
CIA
L S
TAT
EM
EN
TS
A n n u a l
DET
AIL
PER
PRO
GR
AM
ME
5 –
BIO
DIV
ERSI
TY M
AN
AG
EMEN
TFO
R TH
E YE
AR
END
ED 3
1 M
ARC
H 2
010
2009
/10
2008
/09
Prog
ram
me
5 –
Econ
omic
Cl
assi
ficat
ion
Adj
uste
d A
ppro
pria
tion
Shift
ing
of
Fund
sVi
rem
ent
Fina
l A
ppro
pria
tion
Act
ual
Expe
nditu
reVa
rian
ceEx
pend
iture
as
% o
f Fin
al
App
ropr
iatio
n
Fina
l A
ppro
pria
tion
Act
ual
Expe
nditu
re
R’00
0R’
000
R’00
0R’
000
R’00
0R’
000
%R’
000
R’00
0
Curr
ent p
aym
ents
Com
pens
atio
n of
em
ploy
ees
3,15
9(5
)-
3,15
43,
124
3099
.02,
334
2,33
0G
oods
and
ser
vice
s97
6(3
3)-
943
888
5594
.21,
607
1,60
3
Tran
sfer
s an
d su
bsid
ies
Dep
artm
enta
l age
ncie
s an
d ac
coun
ts13
3,27
2-
-13
3,27
213
3,27
2-
100.
094
,658
94,6
58
Uni
vers
ities
and
tech
niko
ns60
--
6060
-10
0.0
--
Paym
ent
for
capi
tal a
sset
s
Mac
hine
ry a
nd e
quip
men
t-
38-
3838
-10
0.0
3432
TOTA
L13
7,46
7-
-13
7,46
713
7,38
285
99.9
98,6
3398
,623

88
PA
RT
4A n n u a l R e p o r t 2 0 0 9 / 1 0
Not
es to
the
App
ropr
iati
on S
tate
men
tFO
R TH
E YE
AR
END
ED 3
1 M
ARC
H 2
010
1.
Det
ail o
f tra
nsfe
rs a
nd s
ubsi
dies
as
per A
ppro
pria
tion
Act
(aft
er V
irem
ent)
Det
ail o
f the
se tr
ansa
ctio
ns c
an b
e vi
ewed
in th
e no
te o
n Tr
ansf
ers
and
subs
idie
s, di
sclo
sure
not
es a
nd A
nnex
ure
1 (A
-H) t
o th
e A
nnua
l Fin
anci
al S
tate
men
ts.
2.
Det
ail o
f spe
cific
ally
and
exc
lusi
vely
app
ropr
iate
d am
ount
s vo
ted
(aft
er V
irem
ent)
Det
ail o
f the
se tr
ansa
ctio
ns c
an b
e vi
ewed
in n
ote
1 (A
nnua
l App
ropr
iatio
n) to
the
Ann
ual F
inan
cial
Sta
tem
ents
.
3.
Det
ail o
n fin
anci
al tr
ansa
ctio
ns in
ass
ets
and
liabi
litie
s
Det
ail o
f the
se tr
ansa
ctio
ns p
er p
rogr
amm
e ca
n be
vie
wed
in th
e no
te o
n fin
anci
al tr
ansa
ctio
ns in
ass
ets
and
liabi
litie
s to
the
Ann
ual F
inan
cial
Sta
tem
ents
.
4.
Expl
anat
ions
of m
ater
ial v
aria
nces
from
am
ount
s vo
ted
(aft
er V
irem
ent)
4.1
Pe
r Pro
gram
me
Fina
l A
ppro
pria
tion
R’00
0
Act
ual
Expe
nditu
re
R’00
0
Vari
ance
R’0
00
Vari
ance
as
a %
of F
inal
A
ppro
pria
tion
Prog
ram
me
1: A
dmin
istr
atio
n36
,944
36,9
431
0
Prog
ram
me
2: P
olic
y Co
ordi
natio
n an
d En
viro
nmen
tal P
lann
ing
22,3
7821
,066
1,31
26
The
savi
ngs
gene
rate
d on
this
Pro
gram
me
was
mai
nly
due
to u
nspe
nt fu
nds
on e
arm
arke
d al
loca
tions
for t
he B
uilt
Envi
ronm
ent S
uppo
rt P
rogr
amm
e. T
hese
mon
ies
will
be
requ
este
d fo
r rol
l-ove
r in
the
2010
/11
finan
cial
yea
r.
Prog
ram
me
3: C
ompl
ianc
e an
d En
forc
emen
t10
,743
10,7
421
0
Prog
ram
me
4: E
nviro
nmen
tal Q
ualit
y M
anag
emen
t57
,529
57,1
9733
21
The
savi
ngs
on th
is P
rogr
amm
e ar
e m
ainl
y du
e to
the
Clea
nest
Tow
n Co
mpe
titio
n aw
ards
whi
ch w
ill b
e pa
id in
the
2010
/11
finan
cial
yea
r.
Prog
ram
me
5: B
iodi
vers
ity M
anag
emen
t13
7,46
713
7,38
285
0

89
FIN
AN
CIA
L S
TAT
EM
EN
TS
A n n u a l
NO
TES
TO T
HE
APP
ROPR
IATI
ON
STA
TEM
ENT
FOR
THE
YEA
R EN
DED
31
MA
RCH
201
0
4.2
Per
Eco
nom
ic C
lass
ifica
tion
Fina
l A
ppro
pria
tion
Act
ual
Expe
nditu
reVa
rian
ceVa
rian
ce a
s a
% o
f Fin
al
App
ropr
iatio
n
R’00
0R’
000
R’00
0
Curr
ent p
aym
ents
Com
pens
atio
n of
em
ploy
ees
86,7
5186
,719
32-
Goo
ds a
nd s
ervi
ces
38,5
9637
,159
1,43
74
Inte
rest
and
rent
on
land
1010
--
Fina
ncia
l tra
nsac
tions
in a
sset
s an
d lia
bilit
ies
3636
--
Tran
sfer
s an
d su
bsid
ies
Prov
ince
s an
d m
unic
ipal
ities
250
-25
01
Dep
artm
enta
l age
ncie
s an
d ac
coun
ts13
3,59
513
3,59
5-
-U
nive
rsiti
es a
nd te
chni
kons
6060
--
Non
-pro
fit in
stitu
tions
516
516
--
Hou
seho
lds
180
180
--
Paym
ents
for c
apit
al a
sset
s
Mac
hine
ry a
nd e
quip
men
t4,
876
4,86
412
-So
ftw
are
and
othe
r int
angi
ble
asse
ts19
119
1-
-

90
PA
RT
4A n n u a l R e p o r t 2 0 0 9 / 1 0
Statement of Financial PerformanceFOR THE YEAR ENDED 31 MARCH 2010
Note 2009/10 2008/09
R’000 R’000
REVENUE
Annual appropriation 1 265,061 205,131
Departmental revenue 2 938 614
Aid assistance 3 3,080 2,398
TOTAL REVENUE 269,079 208,143
EXPENDITURE
Current expenditure
Compensation of employees 4 86,719 66,548
Goods and services 5 37,159 36,611
Interest and rent on land 6 10 -
Financial transactions in assets and liabilities 7 36 12
Aid assistance 3 2,964 1,937
Total current expenditure 126,888 105,108
Transfers and subsidies 134,351 97,966
Transfers and subsidies 8 134,351 97,966
Expenditure for capital assets
Tangible capital assets 9 4,864 3,447
Software and other intangible assets 9 191 -
Total expenditure for capital assets 5,055 3,447
TOTAL EXPENDITURE 266,294 206,521
SURPLUS FOR THE YEAR 2,785 1,622
Reconciliation of Net Surplus for the year
Voted funds 1,731 547
Departmental revenue 14 938 614
Aid assistance 3 116 461
SURPLUS FOR THE YEAR 2,785 1,622

91
FIN
AN
CIA
L S
TAT
EM
EN
TS
A n n u a l
Statement of Financial Positionas at 31 MARCH 2010
Note 2009/10 2008/09
R’000 R’000
ASSETS
Current assets 5,254 1,203
Cash and cash equivalents 10 5,070 1,013
Prepayments and advances 11 10 32
Receivables 12 174 158
TOTAL ASSETS 5,254 1,203
LIABILITIES
Current liabilities 5,254 1,203
Voted funds to be surrendered to the Revenue Fund 13 1,731 547
Departmental revenue to be surrendered to the Revenue Fund 14 93 16
Bank overdraft 15 1,832 92
Payables 16 1,482 115
Aid assistance unutilised 3 116 433
TOTAL LIABILITIES 5,254 1,203
NET ASSETS - -

92
PA
RT
4A n n u a l R e p o r t 2 0 0 9 / 1 0
Cash Flow StatementFOR THE YEAR ENDED 31 MARCH 2010
Note 2009/10 2008/09
R’000 R’000
CASH FLOWS FROM OPERATING ACTIVITIES
Receipts 269,145 208,259
Annual appropriated funds received 1.1 265,061 205,131
Departmental revenue received 2 1,004 730
Aid assistance received 3 3,080 2,398
Net (increase)/decrease in working capital 1,373 41
Surrendered to Revenue Fund (1,514) (2,442)
Surrendered to RDP Fund/Donor (433) -
Current payments (126,888) (105,108)
Transfers and subsidies paid (134,351) (97,966)
Net cash flow available from operating activities 17 7,332 2,784
CASH FLOWS FROM INVESTING ACTIVITIES
Payments for capital assets 9 (5,055) (3,447)
Proceeds from sale of capital assets 2.4 40 10
Net cash flows from investing activities (5,015) (3,437)
Net increase/(decrease) in cash and cash equivalents 2,317 (653)
Cash and cash equivalents at beginning of period 921 1,574
CASH AND CASH EqUIVALENTS AT END OF PERIOD 18 3,238 921

93
FIN
AN
CIA
L S
TAT
EM
EN
TS
A n n u a l
Accounting PoliciesFOR THE YEAR ENDED 31 MARCH 2010
The Financial Statements have been prepared in accordance with the following policies, which have been applied consistently in all material aspects, unless otherwise indicated. However, where appropriate and meaningful, additional information has been disclosed to enhance the usefulness of the Financial Statements and to comply with the statutory requirements of the Public Finance Management Act, Act 1 of 1999 (as amended by Act 29 of 1999), and the Treasury Regulations issued in terms of the Act and the Division of Revenue Act, Act 2 of 2009.
1. PRESENTATION OF THE FINANCIAL STATEMENTS
1.1. Basis of preparation
The Financial Statements have been prepared on a modified cash basis of accounting, except where otherwise stated. The modified cash basis constitutes the cash basis of accounting supplemented with additional disclosure items. Under the cash basis of accounting, transactions and other events are recognised when cash is received or paid.
1.2. Presentation currency
All amounts have been presented in the currency of the South African Rand (R) which is also the functional currency of the Department.
1.3. Rounding
Unless otherwise stated all financial figures have been rounded to the nearest one thousand Rand (R’000).
1.4. Comparative figures
Prior period comparative information has been presented in the current year’s financial statements. Where necessary figures included in the prior period financial statements have been reclassified to ensure that the format in which the information is presented is consistent with the format of the current year’s financial statements.
1.5. Comparative figures - Appropriation Statement
A comparison between actual amounts and final appropriation per major classification of expenditure is included in the Appropriation Statement.

94
PA
RT
4A n n u a l R e p o r t 2 0 0 9 / 1 0
2. REVENUE
2.1. Appropriated funds
Appropriated funds comprises of departmental allocations as well as direct charges against revenue fund (i.e. statutory appropriation).
Appropriated funds are recognised in the financial records on the date the appropriation becomes effective. Adjustments made in terms of the adjustments budget process are recognised in the financial records on the date the adjustments become effective.
The total appropriated funds received during the year are presented in the statement of financial performance.
Unexpended appropriated funds are surrendered to the Provincial Revenue Fund. Any amounts owing to the Provincial Revenue Fund at the end of the financial year are recognised as payable in the statement of financial position.
2.2. Departmental revenue
All Departmental revenue is recognised in the statement of financial performance when received and is subsequently paid into the Provincial Revenue Fund, unless otherwise stated.
Any amount owing to the Provincial Revenue Fund is recognised as a payable in the statement of financial position.
No accrual is made for the amount receivable from the last receipt date to the end of the reporting period. These amounts are however disclosed in the disclosure notes to the annual financial statements.
2.3. Direct ex-chequer receipts/payments
All direct ex-chequer receipts are recognised in the statement of financial performance when the cash is received and subsequently paid into the Provincial Revenue Fund, unless otherwise stated.
All direct ex-chequer payments are recognised in the statement of financial performance when final authorisation for payment is effected on the system (by no later than 31 March of each year).
Any amount owing to the Provincial Revenue Fund at the end of the financial year is recognised as a payable in the statement of financial position.
2.4. Aid assistance
Aids assistance is recognised as revenue when received.

95
FIN
AN
CIA
L S
TAT
EM
EN
TS
A n n u a l
All in-kind aid assistance is disclosed at fair value on the date of receipt in the Annexure to the Annual financial statements.
The cash payments made during the year relating to aid assistance projects are recognised as expenditure in the statement of financial performance when final authorisation for payments is effected on the system (by no later than 31 March of each year).
The value of the assistance expensed prior to the receipt of funds is recognised as a receivable in the statement of financial position.
Inappropriately expensed amounts using aid assistance and any unutilised amounts are recognised as payables in the statement of financial position.
All CARA funds received must be recorded as revenue when funds are received. The cash payments made during the year relating to CARA earmarked projects are recognised as expenditure in the statement of financial performance when final authorisation for payments is effected on the system (by no later then 31 March of each year).
Inappropriately expensed amounts using CARA funds are recognised as payables in the statement of financial position. Any unutilised amounts are transferred to retained funds as they are not surrendered to the revenue fund.
3. EXPENDITURE
3.1. Compensation of employees
3.1.1. Short-term employee benefits
The cost of short-term employee benefits are expensed in the statement of financial performance when financial authorisation for payment is effected on the system (by no later then 31 March each year).
Short-tem employee benefits that give rise to a present legal or constructive obligation are disclosed in the disclosure notes to the financial statements. These amounts must not be recognised in the statement of financial performance or position.
Employee costs are capitalised to the cost of a capital project when an employee spends more than 50% of his/her time on the project. These payments form part of expenditure for capital assets in the statement of financial performance.
3.1.2. Post retirement benefits
Employer contributions (i.e. social contributions) are expensed in the statement of financial performance when the final authorisation for payment is effected on the system (by no later than 31 March each year).

96
PA
RT
4A n n u a l R e p o r t 2 0 0 9 / 1 0
No provision is made for retirement benefits in the financial statements of the Department. Any potential liabilities are disclosed in the financial statements of the National Revenue Fund and not in the financial statements of the employer department.
Social contributions such as medical benefits, made by the department for certain of its ex-employees are classified as transfers to households in the statement of financial performance.
3.1.3. Termination benefits
Termination benefits such as severance packages are recognised as an expense in the statement of financial performance as a transfer (to households) when the final authorisation for payment is effected on the system (by no later than 31 March of each year).
3.1.4. Other long-term employee benefits
Other long-term employee benefits, such as capped leave, are recognised as an expense in the statement of financial performance as a transfer (to households) when the final authorisation for payment is effected on the system (by no later than 31 March of each year).
Long-term employee benefits that give rise to a present legal or constructive obligation are disclosed in the disclosure notes to the financial statements.
3.2. Goods and services
Payments made for goods and/or services are recognised as an expense in the statement of financial performance when the final authorisation for payment is effected on the system (by no later than 31 March of each year).
The expense is classified as capital if the goods and/or services were acquired for a capital project or if the total purchase price exceeds the capitalisation threshold (currently R5,000). All other expenditures are classified as current.
3.3. Interest and rent on land
Interest and rental payments are recognised as an expense in the statement of financial performance when the final authorisation for payment is effected on the system (by no later than 31 March of each year). This item excludes rental for the use of buildings or other fixed structures. If it is not possible to distinguish between payment for the use of land and the fixed structures on it, the whole amount should be recorded under goods and services.
3.4. Financial transactions in assets and liabilities
Debts are written off when identified as irrecoverable. Debts written off are limited to the amount of savings and/or underspending of appropriated funds. The write-off occurs at year-end or when funds are available. No provision is made for irrecoverable amounts but an estimate is included in the disclosure notes to the financial statements amounts.

97
FIN
AN
CIA
L S
TAT
EM
EN
TS
A n n u a l
All other losses are recognised when authorisation has been granted for the recognition thereof.
3.5. Transfers and subsidies
Transfers and subsidies are recognised as an expense when the final authorisation for payment is effected on the system (by no later than 31 March of each year).
3.6. Unauthorised expenditure
When confirmed, unauthorised expenditure is recognised as an asset in the statement of financial position until such time as the expenditure is either approved by the relevant authority, recovered from the responsible person or written off as irrecoverable in the statement of financial performance.
Unauthorised expenditure approved with funding is derecognised from the statement of financial position when the unauthorised expenditure is approved and the related funds are received.
Where the amount is approved without funding, it is recognised as expenditure in the statement of financial performance on the date of approval.
3.7. Fruitless and wasteful expenditure
Fruitless and wasteful expenditure is recognised as expenditure in the statement of financial performance according to the nature of the payment and not as a separate line item on the face of the statement. If the expenditure is recoverable, it is treated as an asset until it is recovered from the responsible person or written off as irrecoverable in the statement of financial performance.
3.8. Irregular expenditure
Irregular expenditure is recognised as expenditure in the statement of financial performance. If the expenditure is not condoned by the relevant authority, it is treated as an asset until it is recovered or written off as irrecoverable.
4. ASSETS
4.1. Cash and cash equivalents
Cash and cash equivalents are carried in the statement of financial position at cost.
Bank overdrafts are shown separately on the face of the statement of financial position.
For the purposes of the cash flow statement, cash and cash equivalents comprise cash on hand, deposits held, other short-term highly liquid investments and bank overdrafts.

98
PA
RT
4A n n u a l R e p o r t 2 0 0 9 / 1 0
4.2. Other financial assets
Other financial assets are carried in the statement of financial position at cost.
4.3. Pre-payments and advances
Amounts prepaid or advanced are recognised in the statement of financial position when the payments are made and where the goods and services have not been received by year-end.
Pre-payments and advances outstanding at the end of the year are carried in the statement of financial position at cost.
4.4. Receivables
Receivables included in the statement of financial position arise from cash payments made that are recoverable from another party or from the sale of goods/rendering of services.
Receivables outstanding at year-end are carried in the statement of financial position at cost plus any accrued interest. Amounts that are potentially irrecoverable are included in the disclosure notes.
4.5. Investments
Capitalised investments are shown at cost in the statement of financial position.
Investments are tested for an impairment loss whenever events or changes in circumstances indicate that the investment may be impaired. Any impairment loss is included in the disclosure notes.
4.6. Loans
Loans are recognised in the statement of financial position when the cash is paid to the beneficiary. Loans that are outstanding at year-end are carried in the statement of financial position at cost plus accrued interest.
Amounts that are potentially irrecoverable are included in the disclosure notes.
4.7. Inventory
Inventories that qualify for recognition must be initially reflected at cost. Where inventories are acquired at no cost, or for nominal consideration, their cost shall be their fair value at the date of acquisition.
All inventory items at year-end are reflected using the weighted average cost or FIFO cost formula.

99
FIN
AN
CIA
L S
TAT
EM
EN
TS
A n n u a l
4.8. Capital assets
4.8.1. Movable assets
• Initial recognition
A capital asset is recorded on receipt of the item at cost. Cost of an asset is defined as the total cost of acquisition. Where the cost cannot be determined accurately, the movable capital asset is stated at fair value. Where fair value cannot be determined, the capital asset is included in the asset register at R1.
• Subsequent recognition
Subsequent expenditure of a capital nature is recorded in the statement of financial performance as “expenditure for capital asset” and is capitalised in the asset register of the Department on completion of the project.
Repairs and maintenance is expensed as current “goods and services” in the statement of financial performance.
4.8.2. Immovable assets
• Initial recognition
A capital asset is recorded on receipt of the item at cost. Cost of an asset is defined as the total cost of acquisition. Where the cost cannot be determined accurately, the immovable capital asset is stated at R1 unless the fair value for the asset has been reliably estimated.
• Subsequent recognition
Work-in-progress of a capital nature is recorded in the statement of financial performance as “expenditure for capital asset”. On completion, the total cost of the project is included in the asset register of the Department that legally owns the asset or the Provincial Department of Public Works.
Repairs and maintenance is expensed as current “goods and services” in the statement of financial performance.
5. LIABILITIES
5.1. Payables
Recognised payables mainly comprise of amounts owing to other governmental entities. These payables are carried at cost in the statement of financial position.

100
PA
RT
4A n n u a l R e p o r t 2 0 0 9 / 1 0
5.2. Contingent liabilities
Contingent liabilities are included in the disclosure notes to the financial statements when it is possible that economic benefits will flow from the Department, or when an outflow of economic benefits or service potential is probable but cannot be measured reliably.
5.3. Contingent assets
Contingent assets are included in the disclosure notes to the financial statements when it is possible that an inflow of economic benefits will flow to the entity.
5.4. Commitments
Commitments are not recognised in the statement of financial position as a liability or as expenditure in the statement of financial performance but are included in the disclosure notes.
5.5. Accruals
Accruals are not recognised in the statement of financial position as a liability or as expenditure in the statement of financial performance but are included in the disclosure notes.
5.6. Employee benefits
Short-term employee benefits that give rise to a present legal or constructive obligation are disclosed in the disclosure notes to the financial statements. These amounts are not recognised in the statement of financial performance or the statement of financial position.
5.7. Lease commitments
• Finance lease
Finance leases are not recognised as assets and liabilities in the statement of financial position. Finance lease payments are recognised as an expense in the statement of financial performance and are apportioned between the capital and interest portions. The finance lease liability is disclosed in the disclosure notes to the financial statements.
• Operating lease
Operating lease payments are recognised as an expense in the statement of financial performance. The operating lease commitments are disclosed in the disclosure notes to the financial statement.

101
FIN
AN
CIA
L S
TAT
EM
EN
TS
A n n u a l
5.8. Provisions
Provisions are disclosed when there is a present legal or constructive obligation to forfeit economic benefits as a result of events in the past and it is probable that an outflow of resources embodying economic benefits will be required to settle the obligation and a reliable estimate of the obligation can be made.
6. RECEIVABLES FOR DEPARTMENTAL REVENUE
Receivables for Departmental revenue are disclosed in the disclosure notes to the annual financial statements.
7. NET ASSETS
7.1. Capitalisation reserve
The capitalisation reserve comprises of financial assets and/or liabilities originating in a prior reporting period but which are recognised in the statement of financial position for the first time in the current reporting period. Amounts are recognised in the capitalisation reserves when identified in the current period and are transferred to the Provincial Revenue Fund when the underlining asset is disposed and the related funds are received.
7.2. Recoverable revenue
Amounts are recognised as recoverable revenue when a payment made in a previous financial year becomes recoverable from a debtor in the current financial year. Amounts are either transferred to the Provincial Revenue Fund when recovered or are transferred to the statement of financial performance when written off.
8. RELATED PARTY TRANSACTIONS
Specific information with regards to related party transactions is included in the disclosure notes.
9. KEY MANAGEMENT PERSONNEL
Compensation paid to key management personnel including their family members where relevant, is included in the disclosure notes.
10. PUBLIC PRIVATE PARTNERSHIPS (PPP)
A description of the PPP arrangement, the contract fees and current and capital expenditure relating to the PPP arrangement is included in the disclosure notes.

102
PA
RT
4A n n u a l R e p o r t 2 0 0 9 / 1 0
Notes to the Annual Financial StatementsFOR THE YEAR ENDED 31 MARCH 2010
1. Annual Appropriation
Included are funds appropriated in terms of the Appropriation Act (and the Adjustments Appropriation Act) for Provincial Departments:
Final Appropriation
Actual Funds Received
Funds not Requested/
not Received
Appropriation Received 2008/09
R’000 R’000 R’000 R’000
Administration 36,944 36,944 - 30,869
Policy Coordination and Environmental Planning 22,378 22,378 - 18,359
Compliance and Enforcement 10,743 10,743 - 7,319
Environmental Quality Management 57,529 57,529 - 49,951
Biodiversity Management 137,467 137,467 - 98,633
TOTAL 265,061 265,061 - 205,131
2. Departmental revenue
Note 2009/10 2008/09
R’000 R’000
Sales of goods and services other than capital assets 2.1 63 27
Fines, penalties and forfeits 2.2 614 475
Interest, dividends and rent on land 2.3 4 18
Sales of capital assets 2.4 40 10
Financial transactions in assets and liabilities 2.5 323 210
Total revenue collected 1,044 740
Less: Own revenue included in appropriation 14 106 126
DEPARTMENTAL REVENUE COLLECTED 938 614
2.1. Sales of goods and services other than capital assets
Note 2009/10 2008/09
2 R’000 R’000
Sales of goods and services produced by the Department 59 25
Administrative fees 43 10
Other sales 16 15
Sales of scrap, waste and other used current goods 4 2
TOTAL 63 27

103
FIN
AN
CIA
L S
TAT
EM
EN
TS
A n n u a l
NOTES TO THE ANNUAL FINANCIAL STATEMENTS FOR THE YEAR ENDED 31 MARCH 2010
2.2. Fines, penalties and forfeits
Note 2009/10 2008/09
2 R’000 R’000
Fines 614 475
TOTAL 614 475
2.3. Interest, dividends and rent on land
Note 2009/10 2008/09
2 R’000 R’000
Interest 4 18
TOTAL 4 18
2.4. Sale of capital assets
Note 2009/10 2008/09
2 R’000 R’000
Tangible capital assets 40 10
Machinery and equipment 29 40 10
TOTAL 40 10
2.5. Financial transactions in assets and liabilities
Note 2009/10 2008/09
2 R’000 R’000
Other receipts including recoverable revenue 323 210
TOTAL 323 210
3. Aid assistance
3.1. Aid assistance received in cash from RDP
Note 2009/10 2008/09
R’000 R’000
Foreign 3
Opening Balance 433 (28)
Revenue 3,080 2,398
Expenditure (2,964) (1,937)
Current (2,964) (1,937)
Surrendered to the RDP (433) -
CLOSING BALANCE 116 433

104
PA
RT
4A n n u a l R e p o r t 2 0 0 9 / 1 0
NOTES TO THE ANNUAL FINANCIAL STATEMENTS FOR THE YEAR ENDED 31 MARCH 2010
3.2. Total assistance
2009/10 2008/09
R’000 R’000
Opening Balance 433 (28)
Revenue 3,080 2,398
Expenditure (2,964) (1,937)
Current (2,964) (1,937)
Surrendered/Transferred to retained funds 433 -
CLOSING BALANCE 116 433
Analysis of balance Note
Aid assistance unutilised 3 116 433
RDP 116 433
CLOSING BALANCE 116 433
4. Compensation of employees
4.1. Salaries and wages
Note 2009/10 2008/09
R’000 R’000
Basic salary 4 59,596 46,318
Performance award 1,371 1,102
Service based 150 370
Compensative/circumstantial 1,413 1,036
Periodic payments 851 539
Other non-pensionable allowances 12,662 9,017
TOTAL 76,043 58,382
4.2. Social contributions
Note 2009/10 2008/09
R’000 R’000
Employer contributions 4
Pension 7,474 5,541
Medical 3,192 2,614
Bargaining council 10 9
Insurance - 2
TOTAL 10,676 8,166
TOTAL COMPENSATION OF EMPLOYEES 86,719 66,548
Average number of employees 326 289

105
FIN
AN
CIA
L S
TAT
EM
EN
TS
A n n u a l
NOTES TO THE ANNUAL FINANCIAL STATEMENTS FOR THE YEAR ENDED 31 MARCH 2010
5. Goods and services
Note 2009/10 2008/09
R’000 R’000
Administrative fees 26 119
Advertising 2,292 4,301
Assets less than R5,000 5.1 359 595
Bursaries (employees) 335 261
Catering 625 896
Communication 1,435 1,297
Computer services 5.2 684 1,931
Consultants, contractors and agency/outsourced services 5.3 17,481 14,397
Entertainment 50 59
Audit cost – external 5.4 1,961 1,310
Inventory 5.5 2,957 2,341
Operating leases 998 838
Transport provided as part of departmental activities 61 81
Travel and subsistence 5.6 5,561 5,632
Venues and facilities 510 982
Training and staff development 1,109 843
Other operating expenditure 5.7 715 728
TOTAL 37,159 36,611
5.1. Assets less than R5,000
Note 2009/10 2008/09
5 R’000 R’000
Tangible assets 349 595
Machinery and equipment 349 595
Intangible assets 10 -
TOTAL 359 595
5.2. Computer services
Note 2009/10 2008/09
5 R’000 R’000
SITA computer services 405 1,474
External computer service providers 279 457
TOTAL 684 1,931

106
PA
RT
4A n n u a l R e p o r t 2 0 0 9 / 1 0
NOTES TO THE ANNUAL FINANCIAL STATEMENTS FOR THE YEAR ENDED 31 MARCH 2010
5.3. Consultants, contractors and agency/outsourced services
Note 2009/10 2008/09
5 R’000 R’000
Business and advisory services 11,941 10,885
Infrastructure and planning 27 46
Legal costs 4,910 3,036
Contractors 603 414
Agency and support/outsourced services - 16
TOTAL 17,481 14,397
5.4. Audit cost – external
Note 2009/10 2008/09
5 R’000 R’000
Regularity audits 1,961 1,310
TOTAL 1,961 1,310
5.5. Inventory
Note 2009/10 2008/09
5 R’000 R’000
Learning and teaching support material 43 -
Other consumable materials 64 57
Maintenance material 91 25
Stationery and printing 2,756 2,251
Medical supplies 3 8
TOTAL 2,957 2,341
5.6. Travel and subsistence
Note 2009/10 2008/09
5 R’000 R’000
Local 5,435 5,020
Foreign 126 612
TOTAL 5,561 5,632
5.7. Other operating expenditure
Note 2009/10 2008/09
5 R’000 R’000
Professional bodies, membership and subscription fees 4 2
Resettlement costs 242 217
Other 469 509
TOTAL 715 728

107
FIN
AN
CIA
L S
TAT
EM
EN
TS
A n n u a l
NOTES TO THE ANNUAL FINANCIAL STATEMENTS FOR THE YEAR ENDED 31 MARCH 2010
6. Interest and rent on land
Note 2009/10 2008/09
R’000 R’000
Interest paid 10 -
TOTAL 10 -
7. Financial transactions in assets and liabilities
Note 2009/10 2008/09
R’000 R’000
Material losses through criminal conduct 31 11
Other material losses 7.1 31 11
Other material losses written off 7.2 5 -
Debts written off 7.3 - 1
TOTAL 36 12
7.1. Other material losses
Note 2009/10 2008/09
7 R’000 R’000
Nature of other material losses
Incident Disciplinary steps taken/criminal proceedings
Motor Vehicle Damages
No disciplinary steps were taken against anyone involved in the 13 cases.
31 11
Total 31 11
7.2. Other material losses written off
Note 2009/10 2008/09
7 R’000 R’000
Nature of losses
Disallowances 5 -
TOTAL 5 -
7.3. Debts written off
Note 2009/10 2008/09
7 R’000 R’000
Nature of debts written off
Tax debt - 1
TOTAL - 1

108
PA
RT
4A n n u a l R e p o r t 2 0 0 9 / 1 0
NOTES TO THE ANNUAL FINANCIAL STATEMENTS FOR THE YEAR ENDED 31 MARCH 2010
7.4. Assets written off
Note 2009/10 2008/09
7 R’000 R’000
Nature of write-off
Audio visual equipment – Capital - 16
Computer hardware and systems – Capital 275 19
Computer hardware and systems – Current 21 3
Survey equipment – Capital 13 -
Photographic equipment – Current 1 -
Office furniture – Current 1 -
Electric wire & power supply – Current 1 -
Survey equipment – Current 4 -
TOTAL 316 38
8. Transfers and subsidies
Note 2009/10 2008/09
R’000 R’000
Provinces and municipalities Annex 1A - 350
Departmental agencies and accounts Annex 1B 133,595 95,659
Universities and technikons Annex 1C 60 -
Non-profit institutions Annex 1D 514 1,103
Households Annex 1E 180 854
Gifts, donations and sponsorships made Annex 1G 2 -
TOTAL 134,351 97,966
9. Expenditure for capital assets
Note 2009/10 2008/09
R’000 R’000
Tangible assets 4,864 3,447
Machinery and equipment 29 4,864 3,447
Software and other intangible assets 191 -
Computer software 30 191 -
TOTAL 5,055 3,447

109
FIN
AN
CIA
L S
TAT
EM
EN
TS
A n n u a l
NOTES TO THE ANNUAL FINANCIAL STATEMENTS FOR THE YEAR ENDED 31 MARCH 2010
9.1. Analysis of funds utilised to acquire capital assets – 2009/10
Voted Funds Aid Assistance Total
R’000 R’000 R’000
Tangible assets 4,864 - 4,864
Machinery and equipment 4,864 - 4,864
Software and other intangible assets 191 - 191
Computer software 191 - 191
TOTAL 5,055 - 5,055
9.2. Analysis of funds utilised to acquire capital assets – 2008/09
Voted Funds Aid Assistance Total
R’000 R’000 R’000
Tangible assets 3,447 - 3,447
Machinery and equipment 3,447 - 3,447
TOTAL 3,447 - 3,447
10. Cash and cash equivalents
Note 2009/10 2008/09
R’000 R’000
Cash on hand 2 2
Cash with commercial banks (Local) 5,068 1,011
TOTAL 5,070 1,013
11. Pre-payments and advances
Note 2009/10 2008/09
R’000 R’000
Travel and subsistence 10 32
TOTAL 10 32
12. Receivables
2009/10 2008/09
R’000 R’000 R’000 R’000 R’000
Note Less than one year
One to three years
Older than three years
Total Total
Staff debt 12.1 31 48 - 79 104
Other debtors 12.2 93 2 - 95 54
TOTAL 124 50 - 174 158

110
PA
RT
4A n n u a l R e p o r t 2 0 0 9 / 1 0
NOTES TO THE ANNUAL FINANCIAL STATEMENTS FOR THE YEAR ENDED 31 MARCH 2010
12.1. Staff debt
Note 2009/10 2008/09
12 R’000 R’000
Sal: Reversal Control - 6
Sal: Tax debt 4 4
Debt Account 75 94
TOTAL 79 104
12.2. Other debtors
Note 2009/10 2008/09
12 R’000 R’000
Disallowance: accidents 32 18
Claims recoverable 46 26
Disallowance: damages and losses 12 10
Sal: medical aid: current liabilities 5 -
TOTAL 95 54
13. Voted funds to be surrendered to the Revenue Fund
Note 2009/10 2008/09
R’000 R’000
Opening balance 547 1,717
Transfer from Statement of Financial Performance 1,731 547
Paid during the year (547) (1,717)
CLOSING BALANCE 1,731 547
14. Departmental revenue to be surrendered to the Revenue Fund
Note 2009/10 2008/09
R’000 R’000
Opening balance 16 1
Transfer from Statement of Financial Performance 938 614
Own revenue included in appropriation 106 126
Paid during the year (967) (725)
CLOSING BALANCE 93 16
15. Bank overdraft
Note 2009/10 2008/09
R’000 R’000
Consolidated Paymaster General Account 1,832 92
TOTAL 1,832 92

111
FIN
AN
CIA
L S
TAT
EM
EN
TS
A n n u a l
NOTES TO THE ANNUAL FINANCIAL STATEMENTS FOR THE YEAR ENDED 31 MARCH 2010
16. Payables – current
Note 2009/10
Total
2008/09
Total
Amounts owing to other entities Annex 3 880 -
Clearing accounts 16.1 602 102
Other payables 16.2 - 13
TOTAL 1,482 115
16.1. Clearing accounts
Note 2009/10 2008/09
16 R’000 R’000
Description
Sal: income tax 466 16
Debt receivable income 61 79
Debt receivable interest 2 (1)
Sal: Pension fund: Current Liabilities 73 8
TOTAL 602 102
16.2. Other payables
Note 2009/10 2008/09
16 R’000 R’000
Description
ACB recalls - 13
TOTAL - 13
17. Net cash flow available from operating activities
Note 2009/10 2008/09
R’000 R’000
Net surplus/(deficit) as per Statement of Financial Performance 2,785 1,622
Add back non-cash/cash movements not deemed operating activities 4,547 1,162
(Increase)/decrease in receivables – current (16) (71)
(Increase)/decrease in pre-payments and advances 22 60
Increase/(decrease) in payables – current 1,367 52
Proceeds from sale of capital assets (40) (10)
Expenditure on capital assets 5,055 3,447
Surrenders to Revenue Fund (1,514) (2,442)
Surrenders to RDP Fund/Donor (433) -
Own revenue included in appropriation 106 126
NET CASH FLOW GENERATED BY OPERATING ACTIVITIES 7,332 2,784

112
PA
RT
4A n n u a l R e p o r t 2 0 0 9 / 1 0
NOTES TO THE ANNUAL FINANCIAL STATEMENTS FOR THE YEAR ENDED 31 MARCH 2010
18. Reconciliation of cash and cash equivalents for cash flow purposes
Note 2009/10 2008/09
R’000 R’000
Consolidated Paymaster General account (1,832) (92)
Cash on hand 2 2
Cash with commercial banks (Local) 5,068 1,011
TOTAL 3,238 921

113
FIN
AN
CIA
L S
TAT
EM
EN
TS
A n n u a l
Disclosure Notes to the Annual Financial StatementsFOR THE YEAR ENDED 31 MARCH 2010
These amounts are not recognised in the Annual Financial Statements and are disclosed to enhance the usefulness of the Annual Financial Statements.
19. Contingent liabilities and contingent assets
19.1. Contingent liabilities
Note 2009/10 2008/09
R’000 R’000
Liable to Nature
Other departments (interdepartmental unconfirmed balances) Annex 3 46 70
TOTAL 46 70
19.2. Contingent assets
Note 2009/10 2008/09
R’000 R’000
Nature of contingent asset
24G fines 867 467
TOTAL 867 467
Note:
In January 2005, Section 24G of the National Environment Management Act (Act No. 107 of 1998, as amended) was enacted, which allowed for the rectification of unlawfully commenced activities in terms of the Environmental Impact Assessment Regulations issued in terms of both the Environment Conservation Act, 1989 (Act No. 73 of 1989) and the National Environment Management Act (Act No. 107 of 1998, as amended). The enactment prescribes a procedure to be followed for such applications and the issuing of an administrative fine by the competent authority when considering such applications.
The Department has to date processed the applications it received. This entails considering the application, the issuing of an administrative fine and the issuing of an authorisation upon payment of the administrative fine.
Whilst it is expected that all fines issued by the Department will be paid, this is not the case since the fines issued by the Department are appealable and could thus be reduced by the Appeals Authority. As such, the fine issued by the Department is regarded as contingent since the quantum of the fine can be reduced during the processing of the application.
In terms of the total receipt of administrative fines, the changes to legislation as a result of the replacement of the Environment Conservation Act (1989), Environmental Impact Assessment Regulations by the National Environment Management Act (1998), Environmental Impact Assessment Regulations has resulted in the Department having to accept the withdrawal of applications submitted in lieu of the Environment Conservation Act (1989). As a result, the fines issued in terms of processing the ECA applications, will not be received or realised and as such these fines are also regarded as contingent.

114
PA
RT
4A n n u a l R e p o r t 2 0 0 9 / 1 0
DISCLOSURE NOTES TO THE ANNUAL FINANCIAL STATEMENTS FOR THE YEAR ENDED 31 MARCH 2010
20. Commitments
Note 2009/10 2008/09
R’000 R’000
Current expenditure
Approved and contracted 5,317 8,488
5,317 8,488
Capital expenditure
Approved and contracted 7 1,049
7 1,049
TOTAL COMMITMENTS 5,324 9,537
Current expenditure commitments totalling R 419, 445 are older than 1 year and are approved and contracted as per the financial system.
21. Accruals
Listed by Economic Classification2009/10 2008/09
R’000 R’000
30 Days 30+ Days Total Total
Goods and services 381 175 556 1,433
Machinery and equipment - - - 5
Other 2 66 68 355
TOTAL 383 241 624 1,793
Listed by Programme LevelNote 2009/10 2008/09
R’000 R’000
Programme 1: Administration 48 408
Programme 2: Policy Coordination and Environmental Planning 15 129
Programme 3: Compliance and Enforcement 381 540
Programme 4: Environmental Quality Management 180 697
Programme 5: Biodiversity Management - 19
TOTAL 624 1,793
Note 2009/10 2008/09
R’000 R’000
Confirmed balances with other departments Annex 3 1,025 531
TOTAL 1,025 531

115
FIN
AN
CIA
L S
TAT
EM
EN
TS
A n n u a l
DISCLOSURE NOTES TO THE ANNUAL FINANCIAL STATEMENTS FOR THE YEAR ENDED 31 MARCH 2010
22. Employee benefits
Note 2009/10 2008/09
R’000 R’000
Leave entitlement 2,235 874
Service bonus (Thirteenth cheque) 2,286 1,707
Performance awards 1,588 1,380
Capped leave commitments 2,919 2,673
TOTAL 9,028 6,634
A credit amount of R258,782 was added back to leave entitlement.
23. Lease commitments
23.1. Operating lease expenditure
2009/10Land Buildings and
other Fixed Structures
Machinery and Equipment
Total
Not later than 1 year - - 884 884
Later than 1 year and not later than 5 years - - 501 501
TOTAL LEASE COMMITMENTS - - 1,385 1,385
2008/09 Land Buildings and other Fixed
Structures
Machinery and Equipment
Total
Not later than 1 year - - 785 785
Later than 1 year and not later than 5 years - - 870 870
TOTAL LEASE COMMITMENTS - - 1,655 1,655
23.2. Finance leases expenditure
2009/10Land Buildings and
other Fixed Structures
Machinery and Equipment
Not later than 1 year - - 94 94
Later than 1 year and not later than 5 years - - 19 19
TOTAL LEASE COMMITMENTS - - 113 113
LESS: finance costs - - 17 17
TOTAL PRESENT VALUE OF LEASE LIABILITIES - - 96 96
2008/09
Not later than 1 year - - 110 110
Later than 1 year and not later than 5 years - - 54 54
Total lease commitments 164 164
LESS: finance costs - - 16 16
TOTAL PRESENT VALUE OF LEASE LIABILITIES - - 148 148

116
PA
RT
4A n n u a l R e p o r t 2 0 0 9 / 1 0
DISCLOSURE NOTES TO THE ANNUAL FINANCIAL STATEMENTS FOR THE YEAR ENDED 31 MARCH 2010
24. Irregular expenditure
24.1. Reconciliation of irregular expenditure
Note 2009/10 2008/09
R’000 R’000
Opening balance
Add: Irregular expenditure – relating to prior year 34 -
Add: Irregular expenditure – relating to current year - 106
Less: Amounts condoned (34) (106)
IRREGULAR EXPENDITURE AWAITING CONDONATION - -
24.2. Details of irregular expenditure condoned
IncidentCondoned by (Condoning Authority)
2009/10
R’000
Production of DVD and other media footage Condoned by Accounting Officer
34
TOTAL 34
25. Fruitless and wasteful expenditure
25.1. Reconciliation of fruitless and wasteful expenditure
Note 2009/10 2008/09
R’000 R’000
Fruitless and wasteful expenditure – relating to current year 2 -
Less: Amounts condoned (2) -
FRUITLESS AND WASTEFUL EXPENDITURE AWAITING CONDONATION - -
25.2. Analysis of current year’s fruitless and wasteful expenditure
Incident
Disciplinary Steps Taken/Criminal Proceedings
2009/10
R’000
Non-attendance of training courses None 2
TOTAL 2
26. Related party transactions
Information about related party transactions is required for accountability purposes and to facilitate a better understanding of the financial position and performance of the Department. The principle issues in disclosing information about related parties are identifying which parties control or significantly influence the Department and determining what information should be disclosed about transactions with those parties.

117
FIN
AN
CIA
L S
TAT
EM
EN
TS
A n n u a l
DISCLOSURE NOTES TO THE ANNUAL FINANCIAL STATEMENTS FOR THE YEAR ENDED 31 MARCH 2010
Disclosure of:
• the types of the related party relationship;
• the types of transactions that have occurred; and
• the elements of the transactions necessary to clarify the significance of these transactions to its operations and sufficient to enable the Annual financial statements to provide relevant and reliable information for decision-making and accountability purposes.
The above excludes transfer payments and subsidies, as this is disclosed in the Annexures to the financial statements.
The Department occupied buildings managed by the Department of Transport and Public Works at no cost. The Department used information technology related infrastructure provided by the Department of the Premier free of charge. Western Cape Nature Conservation Board is a Schedule 3 Part C Public Entity in terms of the Public Finance Management Act and resorts under the Minister. The Board received transfer payments during the 2009/10 financial year and complied with section 38(1) (j) of the Public Finance Management Act. Redundant assets were transferred to the Board in terms of Section 42 of the Public Finance Management Act during the financial year. Other redundant assets were also sold to staff.
Revenue ReceivedNote 2009/10 2008/09
R’000 R’000
Sales of goods and services other than capital assets 2 -
Sales of capital assets 38 10
TOTAL 40 10
27. Key management personnel
No. of Individuals
2009/10 2008/09
R’000 R’000
Political office bearers 1,337 1,443
Officials:
Level 15 to 16 3 1,088 945
Level 14 (incl. CFO if at a lower level) 4 3,225 2,763
TOTAL 5,650 5,151
28. Non-adjusting events after reporting date
The modernisation programme of the Provincial Government, which is at an advanced stage, proposes the shift of Human Resources (excluding the Departments of Health and Education), Internal Audit and Enterprise Risk Management functions to a shared Corporate Services within the Department of the Premier phased in from 1 April 2010. The financial implications of the function shift will be finalised during the 2010/11 Adjustment Estimates process, once all the human resource and other related issues have been finalised.

118
PA
RT
4A n n u a l R e p o r t 2 0 0 9 / 1 0
DISCLOSURE NOTES TO THE ANNUAL FINANCIAL STATEMENTS FOR THE YEAR ENDED 31 MARCH 2010
29. Movable Tangible Capital Assets
MOVEMENT IN MOVABLE TANGIBLE CAPITAL ASSETS PER ASSET REGISTER FOR THE YEAR ENDED 31 MARCH 2010
Opening Balance
Current Year Adjustments to Prior Year
Balances
Additions Disposals Closing Balance
R’000 R’000 R’000 R’000 R’000
MACHINERY AND EQUIPMENT 19,898 54 4,864 2,263 22,553
Computer equipment 15,054 48 3,595 2,119 16,578
Furniture and office equipment 2,091 19 200 95 2,215
Other machinery and equipment 2,753 (13) 1,069 49 3,760
TOTAL MOVABLE TANGIBLE CAPITAL ASSETS
19,898 54 4,864 2,263 22,553
29.1. Additions
ADDITIONS TO MOVABLE TANGIBLE CAPITAL ASSETS PER ASSET REGISTER FOR THE YEAR ENDED 31 MARCH 2010
Cash Non-cash (Capital Work in Progress Current
Costs and Finance Lease
Payments)
Received Current, Not
Paid
(Paid Current Year, Received
Prior Year)
Total
R’000 R’000 R’000 R’000 R’000
MACHINERY AND EQUIPMENT 4,971 - (107) - 4,864
Computer equipment 3,595 - - - 3,595
Furniture and office equipment 200 - - - 200
Other machinery and equipment 1,176 - (107) - 1,069
TOTAL ADDITIONS TO MOVABLE TANGIBLE CAPITAL ASSETS
4,971 - (107) - 4,864
29.2. Disposals
DISPOSALS OF MOVABLE TANGIBLE CAPITAL ASSETS PER ASSET REGISTER FOR THE YEAR ENDED 31 MARCH 2010
Sold for Cash Transfer Out or Destroyed or
Scrapped
Total Disposals Cash Received Actual
R’000 R’000 R’000 R’000
MACHINERY AND EQUIPMENT 1,315 948 2,263 40
Computer equipment 1,315 804 2,119 40
Furniture and office equipment - 95 95 -
Other machinery and equipment - 49 49 -
TOTAL DISPOSAL OF MOVABLE TANGIBLE CAPITAL ASSETS
1,315 948 2,263 40

119
FIN
AN
CIA
L S
TAT
EM
EN
TS
A n n u a l
DISCLOSURE NOTES TO THE ANNUAL FINANCIAL STATEMENTS FOR THE YEAR ENDED 31 MARCH 2010
29.3. Movement for 2008/09
MOVEMENT IN MOVABLE TANGIBLE CAPITAL ASSETS PER ASSET REGISTER FOR THE YEAR ENDED 31 MARCH 2009
Opening Balance
Additions Disposals Closing Balance
R’000 R’000 R’000 R’000
MACHINERY AND EQUIPMENT 17,449 3,447 998 19,898
Computer equipment 14,387 1,620 953 15,054
Furniture and office equipment 1,834 286 29 2,091
Other machinery and equipment 1,228 1,541 16 2,753
TOTAL MOVABLE TANGIBLE ASSETS 17,449 3,447 998 19,898
29.4. Minor assets
MINOR ASSETS OF THE DEPARTMENT AS AT 31 MARCH 2010
Intangible Assets
Heritage Assets Machinery and Equipment
Biological Assets
Total
R’000 R’000 R’000 R’000 R’000
Minor assets 10 - 2,210 - 2,220
TOTAL 10 - 2,210 - 2,220
Number of R1 minor assets - - 3,628 3,628
Number of minor assets at cost 4 - 1,629 - 1,633
TOTAL NUMBER OF MINOR ASSETS 4 - 5,257 - 5,261
MINOR ASSETS OF THE DEPARTMENT AS AT 31 MARCH 2009
Intangible Assets
Heritage Assets Machinery and Equipment
Biological Assets
Total
R’000 R’000 R’000 R’000 R’000
Minor assets - - 1,967 - 1,967
TOTAL - - 1,967 - 1,967
Number of R1 minor assets - - 5,124 - 5,124
TOTAL NUMBER OF MINOR ASSETS - - 5,124 - 5,124

120
PA
RT
4A n n u a l R e p o r t 2 0 0 9 / 1 0
DISCLOSURE NOTES TO THE ANNUAL FINANCIAL STATEMENTS FOR THE YEAR ENDED 31 MARCH 2010
30. Intangible capital assets
MOVEMENT IN INTANGIBLE CAPITAL ASSETS PER ASSET REGISTER FOR THE YEAR ENDED 31 MARCH 2010
Opening Balance
Current Year Adjustments to Prior Year
Balances
Additions Disposals Closing Balance
R’000 R’000 R’000 R’000 R’000
Computer software 617 - 191 - 808
TOTAL INTANGIBLE CAPITAL ASSETS
617 - 191 - 808
30.1. Additions
ADDITIONS TO INTANGIBLE CAPITAL ASSETS PER ASSET REGISTER FOR THE YEAR ENDED 31 MARCH 2010
Cash Non-cash (Development Work in Progress – Current Costs)
Received Current Year,
Not Paid
(Paid Current Year, Received
Prior Year)
Total
R’000 R’000 R’000 R’000 R’000
Computer software 191 - - - 191
TOTAL ADDITIONS TO INTANGIBLE CAPITAL ASSETS
191 - - - 191
30.2. Movement for 2008/09
MOVEMENT IN INTANGIBLE CAPITAL ASSETS PER ASSET REGISTER FOR THE YEAR ENDED 31 MARCH 2009
Opening Balance
Additions Disposals Closing Balance
R’000 R’000 R’000 R’000
Computer software 617 - - 617
TOTAL INTANGIBLE CAPITAL ASSETS 617 - - 617

121
FIN
AN
CIA
L S
TAT
EM
EN
TS
A n n u a l
Ann
exur
esTO
TH
E A
NN
UA
L FI
NA
NCI
AL
STAT
EMEN
TS F
OR
THE
YEA
R EN
DED
31
MA
RCH
201
0
AN
NEX
URE
1A
STAT
EMEN
T O
F U
NCO
ND
ITIO
NA
L G
RAN
TS A
ND
TRA
NSF
ERS
TO M
UN
ICIP
ALI
TIES
NA
ME
OF
MU
NIC
IPA
LITY
GRA
NT
ALL
OCA
TIO
NTR
AN
SFER
SPEN
T20
08/0
9
Am
ount
Roll
Ove
rsA
djus
tmen
tsTo
tal
Avai
labl
eA
ctua
l Tr
ansf
er%
of
Avai
labl
e Fu
nds
Tran
sfer
red
Am
ount
Re
ceiv
ed
by
Mun
icip
alit
y
Am
ount
Sp
ent b
y M
unic
ipal
ity
% o
f Av
aila
ble
Fund
s Sp
ent b
y M
unic
ipal
ity
Tota
l Av
aila
ble
R’00
0R’
000
R’00
0R’
000
R’00
0%
R’00
0R’
000
%R’
000
Bree
de R
iver
--
--
--
--
-12
0
Cape
Win
elan
ds-
--
--
--
--
100
Ove
rstr
and
--
--
--
--
-40
Swar
tland
--
--
--
--
-60
Stel
lenb
osch
--
--
--
--
-30
--
--
--
--
-35
0

122
PA
RT
4A n n u a l R e p o r t 2 0 0 9 / 1 0
AN
NEX
URE
S TO
TH
E A
NN
UA
L FI
NA
NCI
AL
STAT
EMEN
TS F
OR
THE
YEA
R EN
DED
31
MA
RCH
201
0
AN
NEX
URE
1B
STAT
EMEN
T O
F TR
AN
SFER
S TO
DEP
ART
MEN
TAL
AG
ENCI
ES A
ND
ACC
OU
NTS
DEP
ART
MEN
T/A
GEN
CY/A
CCO
UN
T
TRA
NSF
ER A
LLO
CATI
ON
TRA
NSF
ER20
08/0
9
Adj
uste
d A
ppro
pria
tion
Roll
Ove
rsA
djus
tmen
tsTo
tal
Avai
labl
eA
ctua
l Tr
ansf
er%
of
Avai
labl
e Fu
nds
Tran
sfer
red
App
ropr
iatio
n A
ct
R’00
0R’
000
R’00
0R’
000
R’00
0%
R’00
0
Gov
ernm
ent M
otor
Tra
nspo
rt32
3-
-32
332
310
0.0
1,00
1
Wes
tern
Cap
e N
atur
e Co
nser
vatio
n Bo
ard
133,
272
--
133,
272
133,
272
100.
094
,658
133,
595
--
133,
595
133,
595
100.
095
,659
AN
NEX
URE
1C
STAT
EMEN
T O
F TR
AN
SFER
S TO
UN
IVER
SITI
ES A
ND
TEC
HN
IKO
NS
UN
IVER
SITY
/TEC
HN
IKO
N
TRA
NSF
ER A
LLO
CATI
ON
TRA
NSF
ER20
08/0
9
Adj
uste
d A
ppro
pria
tion
Roll
Ove
rsA
djus
tmen
tsTo
tal
Avai
labl
eA
ctua
l Tra
nsfe
rA
mou
nt N
ot
Tran
sfer
red
% o
f Av
aila
ble
Fund
s Tr
ansf
erre
d
App
ropr
iatio
n A
ct
R’00
0R’
000
R’00
0R’
000
R’00
0R’
000
%R’
000
Uni
vers
ity o
f Ste
llenb
osch
60-
-60
60-
100.
0-
60-
-60
60-
100.
0-

123
FIN
AN
CIA
L S
TAT
EM
EN
TS
A n n u a l
AN
NEX
URE
S TO
TH
E A
NN
UA
L FI
NA
NCI
AL
STAT
EMEN
TS F
OR
THE
YEA
R EN
DED
31
MA
RCH
201
0
AN
NEX
URE
1D
STAT
EMEN
T O
F TR
AN
SFER
S TO
NO
N-P
ROFI
T IN
STIT
UTI
ON
S
NO
N-P
ROFI
T IN
STIT
UTI
ON
S
TRA
NSF
ER A
LLO
CATI
ON
EXPE
ND
ITU
RE20
08/0
9
Adj
uste
d A
ppro
pria
tion
Act
Roll
Ove
rsA
djus
tmen
tsTo
tal
Avai
labl
eA
ctua
l Tr
ansf
er%
of
Avai
labl
e Fu
nds
Tran
sfer
red
App
ropr
iatio
n A
ct
R’00
0R’
000
R’00
0R’
000
R’00
0%
R’00
0
Tran
sfer
s
Koge
lber
g Bi
osph
ere
Rese
rve
Com
pany
200
--
200
200
100.
042
8
Wes
t Coa
st B
iosp
here
Res
erve
Com
pany
314
--
314
314
100.
058
3
Fynb
os F
ound
atio
n Tr
ust
--
--
--
90
Lang
a Ch
ristia
n Fe
llow
ship
--
--
--
2
TOTA
L51
4-
-51
451
410
0.0
1,10
3

124
PA
RT
4A n n u a l R e p o r t 2 0 0 9 / 1 0
AN
NEX
URE
S TO
TH
E A
NN
UA
L FI
NA
NCI
AL
STAT
EMEN
TS F
OR
THE
YEA
R EN
DED
31
MA
RCH
201
0
AN
NEX
URE
1E
STAT
EMEN
T O
F TR
AN
SFER
S TO
HO
USE
HO
LDS
HO
USE
HO
LDS
TRA
NSF
ER A
LLO
CATI
ON
EXPE
ND
ITU
RE20
08/0
9
Adj
uste
d A
ppro
pria
tion
Act
Roll
Ove
rsA
djus
tmen
tsTo
tal
Avai
labl
eA
ctua
l Tr
ansf
er%
of
Avai
labl
e Fu
nds
Tran
sfer
red
App
ropr
iatio
n A
ct
R’00
0R’
000
R’00
0R’
000
R’00
0%
R’00
0
Tran
sfer
s
Burs
arie
s17
8-
-17
817
810
010
1
Seve
ranc
e pa
ckag
e-
--
--
-74
8
Don
atio
ns-
--
--
-3
Inju
ry o
n du
ty2
--
22
100
2
TOTA
L18
0-
-18
018
010
085
4

125
FIN
AN
CIA
L S
TAT
EM
EN
TS
A n n u a l
AN
NEX
URE
S TO
TH
E A
NN
UA
L FI
NA
NCI
AL
STAT
EMEN
TS F
OR
THE
YEA
R EN
DED
31
MA
RCH
201
0
AN
NEX
URE
1F
STAT
EMEN
T O
F A
ID A
SSIS
TAN
CE R
ECEI
VED
NA
ME
OF
DO
NO
RPU
RPO
SEO
PEN
ING
BA
LAN
CERE
VEN
UE
EXP
END
ITU
RECL
OSI
NG
BA
LAN
CED
anis
h In
tern
atio
nal D
evel
opm
ent
Ass
ista
nce
(DA
NID
A)
R’00
0R’
000
R’00
0R’
000
Rece
ived
in c
ash
DA
NID
ACh
emic
al S
ecto
r Ind
ustr
ial W
aste
Man
agem
ent P
lans
52(5
2)-
-
DA
NID
AM
anua
ls: W
este
rn C
ape
Prov
inci
al S
patia
l Dev
elop
men
t Fra
mew
ork
6(6
)-
-
DA
NID
AM
anua
ls: W
este
rn C
ape
Prov
inci
al S
patia
l Dev
elop
men
t Fra
mew
ork
126
(126
)-
-
DA
NID
AM
anua
l for
Impl
emen
tatio
n of
Spa
tial D
evel
opm
ent F
ram
ewor
k-
130
116
14
DA
NID
AA
ir Q
ualit
y M
anag
emen
t Pla
ns-
750
688
62
DA
NID
AIn
stal
latio
n of
ene
rgy
effici
ency
floo
dlig
hts
at P
hilli
pi S
occe
r Sta
dium
-36
036
0-
DA
NID
ASo
lar W
ater
Hea
ters
in lo
w-c
ost h
ousi
ng in
sel
ecte
d vu
lner
able
com
mun
ities
in th
e W
este
rn C
ape
-1,
640
1,64
0-
DA
NID
AG
uide
lines
for C
limat
e Ch
ange
218
(218
)-
-
DA
NID
AIn
tegr
ated
Was
te M
anag
emen
t Pla
n (W
este
rn C
ape
Prov
ince
)31
169
160
40
TOTA
L43
32,
647
2,96
411
6

126
PA
RT
4A n n u a l R e p o r t 2 0 0 9 / 1 0
AN
NEX
URE
S TO
TH
E A
NN
UA
L FI
NA
NCI
AL
STAT
EMEN
TS F
OR
THE
YEA
R EN
DED
31
MA
RCH
201
0
AN
NEX
URE
1G
STAT
EMEN
T O
F G
IFTS
, DO
NAT
ION
S A
ND
SPO
NSO
RSH
IPS
MA
DE
AN
D R
EMIS
SIO
NS,
REF
UN
DS
AN
D P
AYM
ENTS
MA
DE
AS
AN
ACT
OF
GRA
CE
NAT
URE
OF
GIF
T, D
ON
ATIO
N O
R SP
ON
SORS
HIP
2009
/10
2008
/09
R’00
0R’
000
Paid
in c
ash
Wor
m c
ompo
stin
g ki
ts a
nd g
arde
ning
tool
s2
-
TOTA
L2
-
AN
NEX
URE
2
CLA
IMS
RECO
VER
ABL
E
GO
VER
NM
ENT
ENTI
TY
CON
FIRM
ED B
ALA
NCE
O
UTS
TAN
DIN
GU
NCO
NFI
RMED
BA
LAN
CE
OU
TSTA
ND
ING
TOTA
L
31/0
3/20
1031
/03/
2009
31/0
3/20
1031
/03/
2009
31/0
3/20
1031
/03/
2009
R’00
0R’
000
R’00
0R’
000
R’00
0R’
000
Dep
artm
ent
Gov
ernm
ent M
otor
Tra
nspo
rt-
5-
--
5
Kw
azul
u N
atal
Pro
vinc
ial T
reas
ury
20-
--
20-
Kw
azul
u N
atal
Agr
icul
ture
, Env
ironm
ent a
nd R
ural
Dev
elop
men
t11
--
-11
-
TOTA
L31
5-
-31
5

127
FIN
AN
CIA
L S
TAT
EM
EN
TS
A n n u a l
AN
NEX
URE
S TO
TH
E A
NN
UA
L FI
NA
NCI
AL
STAT
EMEN
TS F
OR
THE
YEA
R EN
DED
31
MA
RCH
201
0
AN
NEX
URE
3
INTE
R-G
OV
ERN
MEN
T PA
YABL
ES
GO
VERN
MEN
T EN
TITY
CON
FIRM
ED B
ALA
NCE
O
UTS
TAN
DIN
GU
NCO
NFI
RMED
BA
LAN
CE
OU
TSTA
ND
ING
TOTA
L
31/0
3/20
1031
/03/
2009
31/0
3/20
1031
/03/
2009
31/0
3/20
1031
/03/
2009
R’00
0R’
000
R’00
0R’
000
R’00
0R’
000
DEP
ART
MEN
TS
Curr
ent
Dep
artm
ent o
f Jus
tice
653
1-
-6
531
Dep
artm
ent o
f the
Pre
mie
r-
--
36-
36
Gov
ernm
ent M
otor
Tra
nspo
rt91
--
1691
16
Dep
artm
ent o
f Saf
ety
and
Secu
rity
--
-18
-18
Dep
artm
ent o
f For
eign
Affa
irs36
-46
-82
-
Dep
artm
ent o
f Env
ironm
enta
l Affa
irs88
0-
--
880
-
Pala
ma
1212
TOTA
L1,
025
531
4670
1,07
160
1
AN
NEX
URE
4
INV
ENTO
RY
INV
ENTO
RYN
ote
2009
/10
R’00
0
Add:
Add
ition
s/Pu
rcha
ses
- Cas
h 2,
957
(Les
s): I
ssue
s(2
,957
)
CLO
SIN
G B
ALA
NCE
-

PA
RT
4A n n u a l R e p o r t 2 0 0 9 / 1 0
NOTES
PART 5
human resource MANAGEMENT

129
RE
SO
UR
CE
MA
NA
GE
ME
NT
H u m a n
5.
HU
MA
N R
ESO
URC
E M
AN
AG
EMEN
T
5.1
Serv
ice
deliv
ery
impr
ovem
ent p
lan
Vi
sion
: Em
bedd
ing
sust
aina
ble
deve
lopm
ent i
n th
e gr
owth
and
dev
elop
men
t of t
he W
este
rn C
ape.
M
issi
on: T
o m
ains
trea
m th
e su
stai
nabl
e de
velo
pmen
t par
adig
m in
env
ironm
enta
l pla
nnin
g an
d m
anag
emen
t.
Ke
y m
easu
rabl
e ob
ject
ive:
To s
uppo
rt s
trat
egic
dec
isio
n-m
akin
g an
d in
terv
entio
n to
enh
ance
pla
nnin
g an
d en
viro
nmen
tal m
anag
emen
t.
Key
Serv
ice
Serv
ice
Bene
ficia
ries
Curr
ent S
tand
ard
Des
ired
Stan
dard
Ach
ieve
men
ts(b
ased
on
repo
rt u
p to
Dec
200
9)
To p
rom
ote
the
soun
d m
anag
emen
t of
biod
iver
sity
•Ci
tizen
s of
W
este
rn C
ape
•Ca
peN
atur
e
Qua
ntity
(Ref
ers t
o th
e am
ount
, nu
mbe
r or
asp
ects
th
at ca
n be
m
easu
red,
w
eigh
ted
or
coun
ted)
•Th
e Bi
odiv
ersi
ty
Man
agem
ent
Perf
orm
ance
of
Cape
Nat
ure
was
m
easu
red
over
two
finan
cial
yea
rs
•Th
e Bi
odiv
ersi
ty
Man
agem
ent
Syst
em w
as
revi
ewed
and
re
vise
d to
mak
e it
mor
e pr
actic
al a
nd
impl
emen
tabl
e
Qua
ntity
•M
onito
r and
repo
rt
on C
apeN
atur
e’s
impl
emen
tatio
n of
the
reco
mm
enda
tions
of
200
8/09
ann
ual
biod
iver
sity
pe
rfor
man
ce re
view
The
indi
cato
rs w
hich
are
use
d to
mon
itor C
apeN
atur
e’s
biod
iver
sity
pe
rfor
man
ce w
ere
inte
grat
ed in
to C
apeN
atur
e’s
inte
rnal
Mon
itorin
g an
d Ev
alua
tion
Syst
em. T
here
are
too
man
y in
dica
tors
to li
st in
divi
dual
ly
here
. H
owev
er s
ome
of th
e ke
y se
rvic
e de
liver
y im
prov
emen
ts in
clud
ed:
•Th
e St
ate
of B
iodi
vers
ity a
nd F
ire d
atab
ases
wer
e al
l upd
ated
and
ve
tted
;
•A
new
Alie
n In
vasi
ve P
lant
Dat
abas
e ha
s be
en d
evel
oped
;
•A
ll C.
A.P.
E. s
yste
mat
ic c
onse
rvat
ion
plan
ning
was
com
plet
ed.
80%
of
the
Wes
tern
Cap
e no
w h
as fi
ne-s
cale
con
serv
atio
n pl
ans.
Plan
ning
of
the
Cent
ral K
aroo
is in
pro
gres
s an
d th
e In
tegr
ated
Bio
dive
rsity
co
vera
ge is
ava
ilabl
e. C
ritic
al B
iodi
vers
ity A
rea
(CBA
) map
s w
ere
inco
rpor
ated
into
the
Prov
inci
al S
patia
l Dev
elop
men
t Fra
mew
ork;
Ca
peN
atur
e Ex
ecut
ive
sign
-off
was
rece
ived
on
the
CBA
map
s.
•A
pro
tect
ed A
rea
Expa
nsio
n St
rate
gy a
nd A
ctio
n Pl
an w
as fi
nalis
ed fo
r th
e W
este
rn C
ape;
•A
n In
vasi
ve A
lien
Spec
ies
Stra
tegy
and
Act
ion
Plan
was
dev
elop
ed;
•Fo
ur Te
rres
tria
l pro
tect
ed A
rea
Man
agem
ent P
lans
wer
e co
mpl
eted
(R
obbe
rg, K
eurb
oom
s, G
ouka
mm
a an
d O
uten
iqua
nat
ure
rese
rves
);
•A
t lea
st 2
4 69
8ha
initi
al a
nd 7
0 81
3ha
follo
w-u
p cl
earin
g of
alie
n ve
geta
tion
com
plet
ed;
•A
t lea
st 2
8 w
ildfir
es w
ere
supp
ress
ed;
•A
t lea
st 3
3 bi
odiv
ersi
ty c
rime
case
s w
ere
succ
essf
ully
fina
lised
;

130
PA
RT
5A n n u a l R e p o r t 2 0 0 9 / 1 0
Key
Serv
ice
Serv
ice
Bene
ficia
ries
Curr
ent S
tand
ard
Des
ired
Stan
dard
Ach
ieve
men
ts(b
ased
on
repo
rt u
p to
Dec
200
9)
To p
rom
ote
the
soun
d m
anag
emen
t of
biod
iver
sity
•A
t lea
st 1
3 aw
aren
ess
rais
ing
inte
rven
tions
rega
rdin
g da
mag
e-ca
usin
g w
ildlif
e w
ere
cond
ucte
d;
•A
t lea
st 8
ste
war
dshi
p co
ntra
ct a
gree
men
ts, 2
bio
dive
rsity
ag
reem
ents
, 6 v
olun
tary
agr
eem
ents
and
4 c
onse
rvan
cies
wer
e es
tabl
ishe
d;
•A
t lea
st 8
0 Co
nser
vatio
n ec
onom
y pr
ojec
ts u
nder
take
n co
mpr
isin
g 30
EPW
P, 2
livel
ihoo
d an
d 48
ser
vice
s, to
talli
ng 3
9 09
9 pe
rson
day
s of
em
ploy
men
t (yo
uth
1 11
7, w
omen
682
and
dis
able
d 26
);
•A
t lea
st 2
3 38
9 le
arne
rs w
ere
prov
ided
with
env
ironm
enta
l edu
catio
n op
port
uniti
es; a
nd
•Ac
cess
was
pro
vide
d fo
r at l
east
24,
205
and
194
indi
vidu
als
for
cultu
ral,
spiri
tual
and
sus
tain
able
har
vest
ing
activ
ities
resp
ectiv
ely.
Qua
lity
(Ref
ers t
o th
e de
gree
of
exc
elle
nce
at w
hich
the
serv
ice
is
rend
ered
or t
o be
rend
ered
)
•Pr
ofes
sion
al le
vel
Qua
lity
•Th
is in
itiat
ive
will
be
with
Cap
eNat
ure
at
prof
essi
onal
leve
l
•In
itiat
ive
with
Cap
eNat
ure
at p
rofe
ssio
nal l
evel
.
Cons
ulta
tion
(Wha
t m
echa
nism
s ar
e in
pla
ce to
co
nsul
t with
cl
ient
s to
obta
in
thei
r inp
ut)
•W
orks
hops
•M
eetin
gs w
ith
seni
or a
nd m
iddl
e m
anag
ers
of
Cape
Nat
ure,
in
clud
ing
Cape
Nat
ure’
s M
&E
Man
ager
Cons
ulta
tion
•M
eetin
gs w
ith
seni
or a
nd m
iddl
e m
anag
ers
of
Cape
Nat
ure,
in
clud
ing
Cape
Nat
ure’
s M
&E
Man
ager
•Co
rres
pond
ence
•Re
port
s
•28
Apr
il 20
09 m
eetin
g w
ith Q
ualit
y M
anag
er o
f Cap
eNat
ure
abou
t the
BM
S re
port
s.
•Em
ail c
omm
unic
atio
n to
offi
cial
resp
onsi
ble
for B
iodi
vers
ity
Man
agem
ent a
t Cap
eNat
ure
abou
t the
late
sub
mis
sion
of t
he B
MS
repo
rt to
Bio
dive
rsity
Man
agem
ent S
ectio
n.
•Em
ail c
omm
unic
atio
n w
ith th
e CE
O’s
secr
etar
y of
Cap
eNat
ure
abou
t th
e BM
S re
port
.
•Li
aiso
n co
mm
ittee
mee
ting
with
Cap
eNat
ure
in F
eb 2
009
was
po
stpo
ned.
•A
noth
er L
iais
on C
omm
ittee
was
pos
tpon
ed in
May
200
9 as
MEC
was
ne
w.
• 1
7 O
ctob
er 2
009
a Li
aiso
n Co
mm
ittee
mee
ting
betw
een
Cape
Nat
ure
and
DEA
&D
P to
ok p
lace
.
•21
Oct
ober
200
9 m
eetin
g to
ok p
lace
.

131
RE
SO
UR
CE
MA
NA
GE
ME
NT
H u m a n
Key
Serv
ice
Serv
ice
Bene
ficia
ries
Curr
ent S
tand
ard
Des
ired
Stan
dard
Ach
ieve
men
ts(b
ased
on
repo
rt u
p to
Dec
200
9)
To p
rom
ote
the
soun
d m
anag
emen
t of
biod
iver
sity
Acce
ss
(Whe
re is
th
e se
rvic
e pr
ovid
ed)
•1
Dor
p St
reet
, Cap
e To
wn
Acce
ss•
1 D
orp
Stre
et, C
ape
Tow
n •
A m
eetin
g w
as h
eld
rega
rdin
g th
e BM
S sy
stem
on
5 Fe
brua
ry 2
010.
M
ost i
nter
actio
n is
ver
bal t
hrou
gh th
e m
eetin
gs li
sted
abo
ve.
•Re
port
s su
bmitt
ed in
clud
e th
e 8
Mar
ch 2
010.
Cour
tesy
(Wha
t m
echa
nism
s ar
e in
pla
ce
to re
port
on
beha
viou
r of
empl
oyee
s)
•Co
mm
unic
atio
n (w
ritte
n a
nd v
erba
l)
•Co
ntac
t with
Su
perv
isor
and
M
anag
emen
t
Cour
tesy
•Co
mm
unic
atio
n (w
ritte
n a
nd v
erba
l)
•Co
ntac
t with
Su
perv
isor
and
M
anag
emen
t
•A
ll in
tera
ctio
ns w
ere
unde
rtak
en in
a p
rofe
ssio
nal a
nd c
ourt
eous
m
anne
r and
the
rela
tions
hip
betw
een
seni
or m
anag
ers
of
Cape
Nat
ure
and
the
Dep
artm
ent h
as m
arke
dly
impr
oved
dur
ing
the
finan
cial
yea
r in
ques
tion.
Ope
nnes
s an
d Tr
ansp
aren
cy
(Wha
t m
echa
nism
s ar
e in
pla
ce to
al
low
clie
nts t
o se
e/ob
tain
thei
r in
put)
•W
orks
hops
•M
eetin
gs w
ith
seni
or a
nd m
iddl
e m
anag
ers
of
Cape
Nat
ure,
in
clud
ing
Cape
Nat
ure’
s M
&E
Man
ager
Ope
nnes
s an
d Tr
ansp
aren
cy•
Mee
tings
with
se
nior
and
mid
dle
man
ager
s of
Ca
peN
atur
e,
incl
udin
g Ca
peN
atur
e’s
M&
E M
anag
er
•Co
rres
pond
ence
•Re
port
s
•A
n op
en a
nd tr
ansp
aren
t rel
atio
nshi
p ex
ists
.
•Fo
rmal
mee
tings
are
reco
rded
in m
inut
es.
Info
rmat
ion
(Wha
t m
echa
nism
s ar
e in
pla
ce to
co
mm
unic
ate
rele
vant
in
form
atio
n w
ith c
lient
s)
•Fi
nal p
roje
ct re
port
Info
rmat
ion
•Fi
nal p
roje
ct re
port
•M
onth
ly re
port
s
•Q
uart
erly
revi
ews
•M
eetin
gs
•Co
rres
pond
ence
•A
nnua
l Rep
ort
•28
Apr
il 20
09 m
eetin
g w
ith Q
ualit
y M
anag
er o
f Cap
eNat
ure
abou
t the
BM
S re
port
s.
•Em
ail c
omm
unic
atio
n to
offi
cial
resp
onsi
ble
for B
iodi
vers
ity
Man
agem
ent a
t Cap
eNat
ure
abou
t the
late
sub
mis
sion
of t
he B
MS
repo
rt to
Bio
dive
rsity
Man
agem
ent S
ectio
n.
•Em
ail c
omm
unic
atio
n w
ith th
e CE
O’s
secr
etar
y of
Cap
eNat
ure
abou
t th
e BM
S re
port
.
•Li
aiso
n co
mm
ittee
mee
ting
with
Cap
eNat
ure
in F
ebru
ary
2009
was
po
stpo
ned.
•A
noth
er L
iais
on C
omm
ittee
was
pos
tpon
ed in
May
200
9 as
MEC
was
ne
w.
•17
Oct
ober
200
9 a
Liai
son
Com
mitt
ee m
eetin
g be
twee
n Ca
peN
atur
e an
d D
EA&
DP
took
pla
ce.
•21
Oct
ober
200
9 m
eetin
g to
ok p
lace
.

132
PA
RT
5A n n u a l R e p o r t 2 0 0 9 / 1 0
Key
Serv
ice
Serv
ice
Bene
ficia
ries
Curr
ent S
tand
ard
Des
ired
Stan
dard
Ach
ieve
men
ts(b
ased
on
repo
rt u
p to
Dec
200
9)
To p
rom
ote
the
soun
d m
anag
emen
t of
biod
iver
sity
Redr
ess
(Wha
t m
echa
nism
s ar
e in
pla
ce
for c
lient
s to
add
ress
pr
oble
m a
reas
, co
mpl
aint
s or
com
plim
ents
)
•Co
mm
unic
atio
n (w
ritte
n a
nd v
erba
l)
•Co
ntac
t with
Su
perv
isor
and
M
anag
emen
t
Redr
ess
•Co
mm
unic
atio
n (w
ritte
n a
nd v
erba
l)
•Co
ntac
t with
Su
perv
isor
and
M
anag
emen
t
•Th
e Li
aiso
n Co
mm
ittee
mee
ting
is th
e pr
imar
y m
echa
nism
to a
ddre
ss
prob
lem
are
as. O
ther
min
or p
robl
ems
are
addr
esse
d th
roug
h re
leva
nt
supe
rvis
ors.
Valu
e fo
r M
oney
(Is th
e se
rvic
e re
nder
ed
at th
e m
ost
econ
omic
al a
nd
effici
ent l
evel
)
•Ye
s, w
ithin
ap
prov
ed b
udge
tVa
lue
for
Mon
ey•
Yes,
with
in
oper
atio
nal b
udge
t•
All
mat
ters
hav
e be
en a
ddre
ssed
with
the
avai
labl
e op
erat
iona
l bu
dget
.
Tim
e
(Wha
t is t
he
curr
ent l
evel
of
serv
ice
in
resp
ect o
f tim
efra
me)
•31
Mar
ch 2
009
Tim
e•
31 M
arch
201
0•
Ther
e w
as a
del
ay d
ue to
Cap
eNat
ure
Qua
lity
Man
ager
bei
ng o
n m
ater
nity
leav
e an
d cl
ashe
s w
ith h
er o
ther
resp
onsi
bilit
ies
to p
rodu
ce
Cape
Nat
ure’
s A
nnua
l Rep
ort a
nd A
nnua
l Per
form
ance
Pla
n.
Cost
(Wha
t is t
he
cost
of t
he
serv
ice)
•R5
24 1
14 (V
AT in
cl.)
Cost
•W
ithin
Bio
dive
rsity
M
anag
emen
t op
erat
iona
l bud
get
•R3
00 0
00 (S
ervi
ce
and
HR
cost
in
clud
ed)
•Th
e A
ssis
tant
Dire
ctor
: Pol
icy
and
Plan
ning
pos
t was
onl
y fil
led
in
Janu
ary
2010
and
in th
e in
terim
the
func
tion
was
per
form
ed b
y th
e A
ssis
tant
Dire
ctor
: CBN
RM. T
he S
enio
r Env
ironm
enta
l Offi
cer l
eft t
he
Dep
artm
ent i
n N
ovem
ber 2
009.
Hum
an
Reso
urce
s
(How
man
y hu
man
re
sour
ces a
re
used
to re
nder
th
e se
rvic
e)
•1
x A
ssis
tant
D
irect
or
(SL
10)
•Se
rvic
e pr
ovid
er
Hum
an
Reso
urce
s•
1 x
Ass
ista
nt
Dire
ctor
(S
L 10
)
•1
x Se
nior
En
viro
nmen
tal
Offi
cer (
SL 8
)

133
RE
SO
UR
CE
MA
NA
GE
ME
NT
H u m a n
Key
Serv
ice
Serv
ice
Bene
ficia
ries
Curr
ent S
tand
ard
Des
ired
Stan
dard
Ach
ieve
men
ts(b
ased
on
repo
rt u
p to
Dec
200
9)
The
roll-
out/
impl
emen
tatio
n of
the
NEM
A
(Nat
iona
l En
viro
nmen
tal
Man
agem
ent
Act)
regu
latio
ns
to M
unic
ipal
ities
•M
unic
ipal
ities
•O
ffici
als
•Co
nsul
tant
s
•Pu
blic
Qua
ntity
(Ref
ers t
o th
e am
ount
, nu
mbe
r or
asp
ects
th
at ca
n be
m
easu
red,
w
eigh
ted
or
coun
ted)
•Im
plem
enta
tion
wor
ksho
ps a
t Dis
tric
t le
vel
Qua
ntity
•Si
x im
plem
enta
tion
wor
ksho
ps a
t D
istr
ict l
evel
•Im
plem
enta
tion
wor
ksho
ps o
n th
e am
ende
d N
EMA
EIA
regu
latio
ns
coul
d no
t be
host
ed b
ecau
se th
e am
ende
d N
EMA
EIA
regu
latio
ns h
ad
not b
een
final
ised
and
pro
mul
gate
d by
the
natio
nal D
epar
tmen
t of
Envi
ronm
enta
l Affa
irs.
•H
owev
er, t
he D
epar
tmen
t con
duct
ed s
ix c
apac
ity-b
uild
ing
wor
ksho
ps o
n th
e am
endm
ents
to N
EMA
itse
lf an
d on
the
impl
emen
tatio
n of
the
curr
ent N
EMA
EIA
regu
latio
ns.
Qua
lity
(Ref
ers t
o th
e de
gree
of
exc
elle
nce
at w
hich
the
serv
ice
is
rend
ered
or t
o be
rend
ered
)
•Cr
eate
kno
wle
dge
and
unde
rsta
ndin
g fo
r offi
cial
s at
al
l sph
eres
of
gove
rnm
ent,
cons
ulta
nts
and
publ
ic a
t the
di
ffere
nt le
vels
of
com
pete
ncie
s
Qua
lity
•A
ll in
tere
sted
and
aff
ecte
d pa
rtie
s w
ill
be a
ppro
pria
tely
sk
illed
in th
e ap
plic
atio
n an
d in
terp
reta
tion
of
the
Act a
nd th
e Re
gula
tions
•Tw
o in
tern
al D
EA&
DP
wor
ksho
ps w
ere
cond
ucte
d on
the
Am
endm
ents
to N
EMA
.
•Tw
o ex
tern
al w
orks
hops
wer
e co
nduc
ted
with
mun
icip
al o
ffici
als
(Wes
t Coa
st D
istr
ict M
unic
ipal
ity a
nd E
den
Dis
tric
t Mun
icip
ality
) with
re
gard
s to
the
Am
endm
ents
to N
EMA
itse
lf an
d th
e im
plem
enta
tion
of th
e cu
rren
t NEM
A E
IA re
gula
tions
.
•Tw
o ex
tern
al w
orks
hops
wer
e co
nduc
ted
with
the
Inte
rnat
iona
l A
ssoc
iatio
n of
Impa
ct A
sses
sors
(IA
IA) o
n th
e am
endm
ents
to N
EMA
its
elf a
nd o
n th
e im
plem
enta
tion
of th
e cu
rren
t NEM
A E
IA re
gula
tions
.
Cons
ulta
tion
(Wha
t m
echa
nism
s ar
e in
pla
ce
to co
nsul
t w
ith c
lient
s to
obta
in th
eir
inpu
t)
•Ci
rcul
ars
•Fo
rum
and
Indi
vidu
al
mee
tings
•Co
rres
pond
ence
Cons
ulta
tion
•Ci
rcul
ars
•Fo
rum
and
In
divi
dual
m
eetin
gs
•Co
rres
pond
ence
•Im
plem
enta
tion
wor
ksho
ps
•W
ebsi
te
•Ev
alua
tion
Que
stio
nnai
re
•In
form
atio
n w
as d
isse
min
ated
via
circ
ular
s w
here
nec
essa
ry a
nd a
lso
post
ed o
nto
the
web
site
. Bec
ause
the
wor
ksho
ps to
be
pres
ente
d by
ex
tern
al s
ervi
ce p
rovi
ders
wer
e no
t hel
d, th
e ev
alua
tion
ques
tionn
aire
to
ol w
as n
ot u
tilis
ed.
Acce
ss
(Whe
re is
th
e se
rvic
e pr
ovid
ed)
•1
Dor
p St
reet
, Cap
e To
wn
Acce
ss•
1 D
orp
Stre
et, C
ape
Tow
n
•Yo
rk S
tree
t, G
eorg
e
•Tw
o w
orks
hops
wer
e he
ld in
the
Eden
Dis
tric
t; on
e in
the
City
of
Cape
Tow
n an
d on
e in
the
Wes
t Coa
st D
istr
ict M
unic
ipal
ity. T
he s
taff
wor
ksho
ps w
ere
held
in C
ape
Tow
n.

134
PA
RT
5A n n u a l R e p o r t 2 0 0 9 / 1 0
Key
Serv
ice
Serv
ice
Bene
ficia
ries
Curr
ent S
tand
ard
Des
ired
Stan
dard
Ach
ieve
men
ts(b
ased
on
repo
rt u
p to
Dec
200
9)
The
roll-
out/
impl
emen
tatio
n of
the
NEM
A
(Nat
iona
l En
viro
nmen
tal
Man
agem
ent
Act)
regu
latio
ns
to M
unic
ipal
ities
Cour
tesy
(Wha
t m
echa
nism
s ar
e in
pla
ce
to re
port
on
beha
viou
r of
empl
oyee
s
•Ev
alua
tion
Que
stio
nnai
re
•D
irect
con
tact
with
Su
perv
isor
/Man
ager
Cour
tesy
•Ev
alua
tion
Que
stio
nnai
re
•D
irect
con
tact
w
ith S
uper
viso
r/
Man
ager
•W
ebsi
te
•Th
e pu
blic
has
dire
ct a
cces
s to
Sup
ervi
sors
and
Man
ager
s w
hen
requ
este
d. In
form
atio
n is
ava
ilabl
e on
the
Dep
artm
ent's
web
site
.
Ope
nnes
s an
d Tr
ansp
aren
cy
(Wha
t m
echa
nism
s ar
e in
pla
ce to
al
low
clie
nts
to se
e/ob
tain
th
eir i
nput
)
•In
tera
ctiv
e w
orks
hops
•Ev
alua
tion
Que
stio
nnai
re
Ope
nnes
s an
d Tr
ansp
aren
cy
•In
tera
ctiv
e w
orks
hops
•Ev
alua
tion
Que
stio
nnai
re
•A
nnua
l Rep
ort
•W
ebsi
te
•Ci
rcul
ars
•In
form
atio
n w
as d
isse
min
ated
via
circ
ular
s w
here
nec
essa
ry a
nd a
lso
post
ed o
nto
the
web
site
.
Info
rmat
ion
(Wha
t m
echa
nism
s ar
e in
pla
ce to
co
mm
unic
ate
rele
vant
in
form
atio
n w
ith c
lient
s)
•W
orks
hops
•W
ebsi
te
•In
form
atio
n le
tter
s
Info
rmat
ion
•W
orks
hops
•W
ebsi
te
•In
form
atio
n le
tter
s
•A
nnua
l Rep
ort
•Ci
rcul
ars
•Co
rres
pond
ence
•In
form
atio
n w
as d
isse
min
ated
via
circ
ular
s w
here
nec
essa
ry a
nd a
lso
post
ed o
nto
the
web
site
.

135
RE
SO
UR
CE
MA
NA
GE
ME
NT
H u m a n
Key
Serv
ice
Serv
ice
Bene
ficia
ries
Curr
ent S
tand
ard
Des
ired
Stan
dard
Ach
ieve
men
ts(b
ased
on
repo
rt u
p to
Dec
200
9)
The
roll-
out/
impl
emen
tatio
n of
the
NEM
A
(Nat
iona
l En
viro
nmen
tal
Man
agem
ent
Act)
regu
latio
ns
to M
unic
ipal
ities
Redr
ess
(Wha
t m
echa
nism
s ar
e in
pla
ce
for c
lient
s to
add
ress
pr
oble
m a
reas
- co
mpl
aint
s or
com
plim
ents
)
•In
tera
ctiv
e w
orks
hops
•Ev
alua
tion
Que
stio
nnai
re
•D
irect
con
tact
with
Su
perv
isor
/Man
ager
Redr
ess
•In
tera
ctiv
e w
orks
hops
•Ev
alua
tion
Que
stio
nnai
re
•D
irect
con
tact
w
ith S
uper
viso
r/M
anag
er
•Ca
pe G
atew
ay
(Pro
vinc
ial
Hel
pdes
k)
•In
form
atio
n w
as d
isse
min
ated
via
circ
ular
s w
here
nec
essa
ry a
nd a
lso
post
ed o
nto
the
web
site
. The
pub
lic h
as d
irect
acc
ess
to S
uper
viso
rs
and
Man
ager
s w
hen
requ
este
d.
Valu
e fo
r M
oney
(Is th
e se
rvic
e re
nder
ed
at th
e m
ost
econ
omic
al
and
effici
ent
leve
l)
•Ye
s, w
ithin
app
rove
d bu
dget
Valu
e fo
r M
oney
•Ye
s, w
ithin
ap
prov
ed b
udge
t•
A li
mite
d N
EMA
Impl
emen
tatio
n ro
ll-ou
t occ
urre
d in
acc
orda
nce
with
th
e al
loca
ted
budg
et d
ue to
the
NEM
A E
IA R
egul
atio
ns n
ot b
eing
pr
omul
gate
d.
Tim
e
(Wha
t is t
he
curr
ent l
evel
of
serv
ice
in
resp
ect o
f tim
efra
me)
•31
Mar
ch 2
009
Tim
e•
31 M
arch
201
0•
31 M
arch
201
0
Cost
(Wha
t is t
he
cost
of t
he
serv
ice)
•R
500
000
Cost
•R
500
000
(Ser
vice
an
d H
R co
st
incl
uded
)
•R
140
000
(Ser
vice
and
HR
cost
incl
uded
)
Hum
an
Reso
urce
s
(How
man
y hu
man
re
sour
ces a
re
used
to re
nder
th
e se
rvic
e)
•6
(Dire
ctor
-SL
13 ,
Dep
uty
Dire
ctor
-SL
12,
Ass
ista
nt D
irect
or-
SL 1
1, P
rinci
pal
Envi
ronm
enta
l O
ffice
r-SL
9)
Hum
an
Reso
urce
s•
6 (D
irect
or-
SL13
, D
eput
y D
irect
or-S
L 12
, A
ssis
tant
Dire
ctor
-SL
11,
Prin
cipa
l En
viro
nmen
tal
Offi
cer-
SL 9
)
•6
(2 x
Dire
ctor
-SL1
3 , 4
x D
eput
y D
irect
or-S
L 12
)

136
PA
RT
5A n n u a l R e p o r t 2 0 0 9 / 1 0
Prog
ram
me
Tota
l Vot
ed
Expe
nditu
re
Com
pens
atio
n of
Em
ploy
ees
Expe
nditu
re
Trai
ning
Ex
pend
iture
Pr
ofes
sion
al a
nd
Spec
ial S
ervi
ces
Com
pens
atio
n of
Em
ploy
ees
as %
of T
otal
Ex
pend
iture
Aver
age
Com
pens
atio
n of
Em
ploy
ees
Cost
pe
r Em
ploy
ee
Tota
l Num
ber o
f Em
ploy
ees
R’00
0R’
000
R’00
0R’
000
%R’
000
1: A
dmin
istr
atio
n *
36,
943
25,
565
418
4
78
69
232
11
0
2: P
olic
y Co
ordi
natio
n an
d En
viro
nmen
tal P
lann
ing
21,
066
10,
996
94
6,4
40
52
282
39
3: C
ompl
ianc
e an
d En
forc
emen
t 1
0,74
2 5
,282
3
9 4
,274
4
9 2
78
19
4: E
nviro
nmen
tal Q
ualit
y M
anag
emen
t 5
7,19
7 4
1,75
2 8
72
5,4
20
73
256
16
3
5: B
iodi
vers
ity M
anag
emen
t 1
37,3
82
3,1
24
21
265
2
3
12
10
TOTA
L 2
63,3
30
86,
719
1,4
44
16,
877
33
254
3
41
5.2
Expe
ndit
ure
The
Dep
artm
ent’s
bud
get i
n te
rms
of c
lear
ly d
efine
d pr
ogra
mm
es. T
he fo
llow
ing
tabl
es s
umm
aris
e fin
al a
udite
d ex
pend
iture
by
prog
ram
me
(Tab
le 5
.2.1
) and
by
sala
ry b
ands
(T
able
5.2
.2).
In p
artic
ular
, it
prov
ides
an
indi
catio
n of
the
am
ount
spe
nt o
n co
mpe
nsat
ion
of e
mpl
oyee
s in
ter
ms
of e
ach
of t
he p
rogr
amm
es o
r sa
lary
ban
ds w
ithin
the
D
epar
tmen
t.
TABL
E 5.
2.1
- Com
pens
atio
n of
em
ploy
ees
by p
rogr
amm
e, 2
009/
10
The
info
rmat
ion
refle
cted
in th
e ab
ove
tabl
e w
ere
extr
acte
d fr
om th
e fin
anci
al s
yste
m (t
he B
asic
Acc
ount
ing
Syst
em (B
AS)
) and
is in
acc
orda
nce
with
the
envi
ronm
enta
l sec
tor b
udge
t pro
gram
me
stru
ctur
e.
All
furt
her fi
gure
s in
the
othe
r tab
les
wer
e ex
trac
ted
from
the
sala
ries
(PER
SAL)
sys
tem
.
* Min
iste
r inc
lude
d

137
RE
SO
UR
CE
MA
NA
GE
ME
NT
H u m a n
Sala
ry B
ands
Com
pens
atio
n of
Em
ploy
ees
Cost
R’00
0
Perc
enta
ge o
f Tot
al
Com
pens
atio
n of
Em
ploy
ees
Cost
s
Aver
age
Com
pens
atio
n Co
st p
er E
mpl
oyee
To
tal N
umbe
r of
Empl
oyee
s
Low
er s
kille
d (L
evel
s 1-
2)
264
0.3
8
8 3
Skill
ed (L
evel
s 3-
5)
8,48
0 9
.8
116
73
Hig
hly
skill
ed p
rodu
ctio
n (L
evel
s 6-
8)
19,0
24
22.
0 1
94
98
Hig
hly
skill
ed s
uper
visi
on (L
evel
s 9-
12)
48,3
73
56.
0 3
14
154
Seni
or m
anag
emen
t (Le
vels
13-
16) *
10,2
62
11.
9 7
89
13
TOTA
L86
,403
1
00
253
3
41
* Min
iste
r inc
lude
d
Prog
ram
me
Sala
ries
O
vert
ime
Hom
e O
wne
rs A
llow
ance
M
edic
al A
ssis
tanc
e
Am
ount
Sala
ries
as
% o
f Co
mpe
nsat
ion
of
Empl
oyee
s Co
sts
Am
ount
Ove
rtim
e as
% o
f Co
mpe
nsat
ion
of
Empl
oyee
s Co
sts
Am
ount
Hom
e O
wne
rs
Allo
wan
ce a
s %
of
Com
pens
atio
n of
Em
ploy
ees
Cost
s
Am
ount
Med
ical
A
ssis
tanc
e as
% o
f Co
mpe
nsat
ion
of
Empl
oyee
s Co
sts
R’00
0%
R’00
0%
R’00
0%
R’00
0%
1: A
dmin
istr
atio
n 1
7,17
3 6
7.2
213
0
.8
397
1.
6 9
58
3.7
2: P
olic
y Co
ordi
natio
n an
d En
viro
nmen
tal P
lann
ing
7,2
59
66.
0 -
- 9
2 0.
8 3
81
3.5
3: C
ompl
ianc
e an
d En
forc
emen
t 3
,791
7
1.8
- -
66
1.2
223
4
.2
4: E
nviro
nmen
tal Q
ualit
y M
anag
emen
t 2
9,50
7 7
0.7
- -
512
1.
2 1
,503
3
.6
5: B
iodi
vers
ity M
anag
emen
t 1
,990
6
3.7
- -
32
1.0
126
4
.0
TOTA
L 5
9,72
0 6
9.1
213
0
.2
1,0
99
1.3
3
,191
3
.7
The
follo
win
g ta
bles
pro
vide
a s
umm
ary
per
prog
ram
me
(Tab
le 5
.2.3
) and
sal
ary
band
s (T
able
5.2
.4),
of e
xpen
ditu
re in
curr
ed a
s a
resu
lt of
sal
arie
s, ov
ertim
e, h
ome
owne
rs
allo
wan
ce a
nd m
edic
al a
ssis
tanc
e. In
eac
h ca
se, t
he ta
ble
prov
ides
an
indi
catio
n of
the
perc
enta
ge o
f the
Com
pens
atio
n of
Em
ploy
ees
budg
et th
at w
as u
sed
for t
hese
item
s.
TABL
E 5.
2.3
- Sal
arie
s, o
vert
ime,
hom
e ow
ners
allo
wan
ce (H
OA
) and
med
ical
ass
ista
nce
by p
rogr
amm
e, 2
009/
10
TABL
E 5.
2.2
- Com
pens
atio
n of
em
ploy
ees
cost
s by
sal
ary
band
, 200
9/10

138
PA
RT
5A n n u a l R e p o r t 2 0 0 9 / 1 0
Sala
ry B
ands
Sala
ries
O
vert
ime
Hom
e O
wne
rs A
llow
ance
M
edic
al A
ssis
tanc
e
Am
ount
Sala
ries
as
% o
f Co
mpe
nsat
ion
of
Empl
oyee
s Co
sts
Am
ount
Ove
rtim
e as
% o
f Co
mpe
nsat
ion
of
Empl
oyee
s Co
sts
Am
ount
Hom
e O
wne
rs
Allo
wan
ce a
s %
of
Com
pens
atio
n of
Em
ploy
ees
Cost
s
Am
ount
Med
ical
A
ssis
tanc
e as
% o
f Co
mpe
nsat
ion
of
Empl
oyee
s Co
sts
R’00
0%
R’00
0%
R’00
0%
R’00
0%
Low
er s
kille
d (L
evel
s 1-
2)
198
7
5 -
- 1
2 4
.5
- -
Skill
ed (L
evel
s 3-
5)
6,0
02
71
67
0.8
3
00
3.5
4
68
5.5
Hig
hly
skill
ed p
rodu
ctio
n (L
evel
s 6-
8)
14,
170
74
98
0.5
4
03
2.1
8
66
4.6
Hig
hly
skill
ed s
uper
visi
on (L
evel
s 9-
12)
33,
678
70
48
0.1
3
84
0.8
1
,675
3
.5
Seni
or m
anag
emen
t (Le
vels
13-
16) *
5,6
72
55
- -
- -
182
1
.8
TOTA
L 5
9,72
0 6
9.1
213
0
.2
1,0
99
1.3
3
,191
3
.7
Inte
rns
(per
iodi
c ap
poin
tmen
ts e
xclu
ded)
TABL
E 5.
2.4
- Sal
arie
s, h
ome
owne
rs a
llow
ance
(HO
A) a
nd m
edic
al a
ssis
tanc
e by
sal
ary
band
, 200
9/10

139
RE
SO
UR
CE
MA
NA
GE
ME
NT
H u m a n
5.3
Empl
oym
ent a
nd v
acan
cies
The
follo
win
g ta
bles
sum
mar
ise
the
num
ber
of p
osts
on
the
esta
blis
hmen
t, th
e nu
mbe
r of
em
ploy
ees,
the
vaca
ncy
rate
, and
whe
ther
the
re a
re a
ny s
taff
that
are
add
ition
al
to t
he e
stab
lishm
ent.
This
info
rmat
ion
is p
rese
nted
in t
erm
s of
thr
ee k
ey v
aria
bles
: pro
gram
me
(Tab
le 5
.3.1
), sa
lary
ban
d (T
able
5.3
.2) a
nd c
ritic
al o
ccup
atio
ns (
Tabl
e 5.
3.3)
. D
epar
tmen
ts h
ave
iden
tified
crit
ical
occ
upat
ions
that
nee
d to
be
mon
itore
d. T
able
5.3
.3 p
rovi
des
esta
blis
hmen
t and
vac
ancy
info
rmat
ion
for t
he k
ey c
ritic
al o
ccup
atio
ns o
f the
D
epar
tmen
t.
The
vaca
ncy
rate
refle
cts
the
perc
enta
ge o
f pos
ts th
at a
re n
ot fi
lled.
TABL
E 5.
3.1
- Em
ploy
men
t and
vac
anci
es b
y pr
ogra
mm
e, 3
1 M
arch
201
0
Prog
ram
me
Num
ber o
f Pos
tsN
umbe
r of P
osts
Fill
ed V
acan
cy %
Rat
e N
umbe
r of P
osts
Fill
ed
Add
ition
al to
the
Esta
blis
hmen
t
1: A
dmin
istr
atio
n *
118
9
7 1
7.8
13
2: P
olic
y Co
ordi
natio
n an
d En
viro
nmen
tal P
lann
ing
46
32
30.
4 7
3: C
ompl
ianc
e an
d En
forc
emen
t 2
3 1
8 2
1.7
1
4: E
nviro
nmen
tal Q
ualit
y M
anag
emen
t 1
79
146
1
8.4
17
5: B
iodi
vers
ity M
anag
emen
t 1
2 8
3
3.3
2
TOTA
L 3
78
301
2
0.4
40
* Min
iste
r inc
lude
d

140
PA
RT
5A n n u a l R e p o r t 2 0 0 9 / 1 0
TABL
E 5.
3.2
- Em
ploy
men
t and
vac
anci
es b
y sa
lary
ban
d, 3
1 M
arch
201
0
Sala
ry B
ands
Num
ber o
f Pos
tsN
umbe
r of P
osts
Fill
ed V
acan
cy %
Rat
e N
umbe
r of P
osts
Fill
ed
Add
ition
al to
the
Esta
blis
hmen
t
Low
er s
kille
d (L
evel
s 1-
2) 2
1
5
0.0
2
Skill
ed (L
evel
s 3-
5) 7
2 5
7 2
0.8
16
Hig
hly
skill
ed p
rodu
ctio
n (L
evel
s 6-
8) 1
23
86
30.
1 1
2
Hig
hly
skill
ed s
uper
visi
on (L
evel
s 9-
12)
166
1
44
13.
3 1
0
Seni
or m
anag
emen
t (Le
vels
13-
16) *
15
13
13.
3 -
TOTA
L 3
78
301
2
0.4
40
* Min
iste
r inc
lude
d
TABL
E 5.
3.3
- Em
ploy
men
t and
vac
anci
es b
y cr
itic
al o
ccup
atio
n, 3
1 M
arch
201
0
Criti
cal O
ccup
atio
nsN
umbe
r of P
osts
Num
ber o
f Pos
ts F
illed
Vac
ancy
% R
ate
Num
ber o
f Pos
ts F
illed
A
dditi
onal
to th
e Es
tabl
ishm
ent
Envi
ronm
enta
l offi
cer
136
1
09
19.
9 2
2
Tow
n an
d re
gion
al p
lann
er 3
5 2
7 2
2.9
-
Indu
stria
l tec
hnic
ian
13
9
30.
8 1
TOTA
L 1
84
145
2
1.2
23

141
RE
SO
UR
CE
MA
NA
GE
ME
NT
H u m a n
5.4
Job
eval
uati
on
The
Publ
ic S
ervi
ce R
egul
atio
ns, 2
001
intr
oduc
ed jo
b ev
alua
tion
as a
way
of e
nsur
ing
that
wor
k of
equ
al v
alue
is re
mun
erat
ed e
qual
ly. W
ithin
a n
atio
nally
det
erm
ined
fram
ewor
k,
exec
utin
g au
thor
ities
may
eva
luat
e or
re-e
valu
ate
any
job
in h
is o
r her
org
anis
atio
n. In
term
s of
the
Regu
latio
ns a
ll va
canc
ies
on s
alar
y le
vels
9 a
nd h
ighe
r mus
t be
eval
uate
d be
fore
they
are
fille
d. T
his
was
com
plem
ente
d by
a d
ecis
ion
by th
e M
inis
ter f
or th
e Pu
blic
Ser
vice
and
Adm
inis
trat
ion
that
all
Seni
or M
anag
emen
t Ser
vice
(SM
S) jo
bs m
ust b
e ev
alua
ted
befo
re 3
1 D
ecem
ber 2
002.
The
follo
win
g ta
ble
(Tab
le 5
.4.1
) sum
mar
ises
the
num
ber o
f job
s tha
t wer
e ev
alua
ted
durin
g th
e ye
ar u
nder
revi
ew. T
he ta
ble
also
pro
vide
s sta
tistic
s on
the
num
ber o
f pos
ts th
at
wer
e up
grad
ed o
r dow
ngra
ded.
TABL
E 5.
4.1
- Job
eva
luat
ion,
1 A
pril
2009
to 3
1 M
arch
201
0
Sala
ry B
and
Num
ber o
f Pos
tsN
umbe
r of J
obs
Eval
uate
d%
of P
osts
Eva
luat
ed b
y Sa
lary
Ban
dsPo
sts
Upg
rade
dPo
sts
Dow
ngra
ded
Num
ber
% o
f Pos
ts
Eval
uate
dN
umbe
r%
of P
osts
Ev
alua
ted
Low
er s
kille
d (L
evel
s 1-
2)
2
- -
- -
- -
Skill
ed (L
evel
s 3-
5)
72
6
8.3
3
6 60
0 -
-
Hig
hly
skill
ed p
rodu
ctio
n (L
evel
s 6-
8)
123
3
2
.4
3
100
- -
Hig
hly
skill
ed s
uper
visi
on (L
evel
s 9-
12)
166
3
1
.8
17
567
- -
Seni
or m
anag
emen
t ser
vice
ban
d A
1
0 -
- -
- -
-
Seni
or m
anag
emen
t ser
vice
ban
d B
3
- -
- -
- -
Seni
or m
anag
emen
t ser
vice
ban
d C
1
- -
- -
- -
Polit
ical
offi
ce b
eare
r 1
-
- -
- -
-
TOTA
L 3
78
12
3.2
5
6 4
67
- -

142
PA
RT
5A n n u a l R e p o r t 2 0 0 9 / 1 0
The
follo
win
g ta
ble
prov
ides
a s
umm
ary
of t
he n
umbe
r of
em
ploy
ees
who
se s
alar
y po
sitio
ns w
ere
upgr
aded
due
to t
heir
post
s be
ing
upgr
aded
. The
num
ber
of e
mpl
oyee
s m
ight
diff
er fr
om th
e nu
mbe
r of p
osts
upg
rade
d si
nce
not a
ll em
ploy
ees
are
auto
mat
ical
ly a
bsor
bed
into
the
new
pos
ts a
nd s
ome
of th
e po
sts
upgr
aded
cou
ld a
lso
be v
acan
t.
TABL
E 5.
4.2
- Pro
file
of e
mpl
oyee
s w
hose
pos
itio
ns w
ere
upgr
aded
due
to th
eir p
osts
bei
ng u
pgra
ded,
1 A
pril
2009
to 3
1 M
arch
201
0
Bene
ficia
ries
Afr
ican
Asi
anCo
lour
edW
hite
Tota
l
Fem
ale
9
- 1
9 1
2
9
Mal
e 4
-
7
1
12
TOTA
L 1
3 -
26
2
41
Empl
oyee
s w
ith a
dis
abili
ty
Non
e
The
follo
win
g ta
ble
sum
mar
ises
the
num
ber o
f cas
es w
here
rem
uner
atio
n le
vels
exc
eede
d th
e gr
ade
dete
rmin
ed b
y jo
b ev
alua
tion.
Rea
sons
for t
he d
evia
tion
are
prov
ided
in
each
cas
e.
TABL
E 5.
4.3
- Em
ploy
ees
who
se s
alar
y le
vel e
xcee
d th
e gr
ade
dete
rmin
ed b
y jo
b ev
alua
tion
, 1 A
pril
2009
to 3
1 M
arch
201
0 [in
term
s of
PSR
1.V
.C.3
]
Occ
upat
ion
Num
ber o
f Em
ploy
ees
Job
Eval
uatio
n Le
vel
Rem
uner
atio
n Le
vel
Reas
on fo
r Dev
iatio
n
Non
e
Tota
l num
ber o
f em
ploy
ees
who
se s
alar
ies
exce
eded
the
leve
l by
job
eval
uatio
n in
200
9/20
10 -
Perc
enta
ge o
f Tot
al E
mpl
oym
ent
0.0

143
RE
SO
UR
CE
MA
NA
GE
ME
NT
H u m a n
The
follo
win
g ta
ble
sum
mar
ises
the
bene
ficia
ries
of th
e ab
ove
in te
rms
of ra
ce, g
ende
r, an
d di
sabi
lity.
TABL
E 5.
4.4
- Pro
file
of e
mpl
oyee
s w
hose
sal
ary
leve
l exc
eede
d th
e gr
ade
dete
rmin
ed b
y jo
b ev
alua
tion
, 1 A
pril
2009
to 3
1 M
arch
201
0 [in
term
s of
PSR
1.V
.C.3
]
Bene
ficia
ries
Afr
ican
Asi
anCo
lour
edW
hite
Tota
l
Fem
ale
- -
- -
Non
e
Mal
e -
- -
- N
one
TOTA
L -
- -
- N
one
5.5
Empl
oym
ent c
hang
es
This
sec
tion
prov
ides
info
rmat
ion
on c
hang
es in
em
ploy
men
t ove
r the
fina
ncia
l yea
r.
Turn
over
rate
s pr
ovid
e an
indi
catio
n of
tren
ds in
the
empl
oym
ent p
rofil
e of
the
Dep
artm
ent.
The
follo
win
g ta
bles
pro
vide
a s
umm
ary
of tu
rnov
er ra
tes
by s
alar
y ba
nd
(Tab
le 5
.5.1
) and
by
criti
cal o
ccup
atio
ns (T
able
5.5
.2).
TABL
E 5.
5.1
- Ann
ual t
urno
ver r
ates
by
sala
ry b
and
for t
he p
erio
d 1
Apr
il 20
09 to
31
Mar
ch 2
010
Sala
ry B
ands
Num
ber o
f Em
ploy
ees
per B
and
as o
n 1
Apr
il 20
09
App
oint
men
ts a
nd
Tran
sfer
s in
to th
e D
epar
tmen
t
Term
inat
ions
and
Tr
ansf
ers
out o
f the
D
epar
tmen
t
Turn
over
Rat
e %
Low
er s
kille
d (L
evel
s 1-
2)
4
2
4
100
.0
Skill
ed (L
evel
s 3-
5)
68
29
28
41.
2
Hig
hly
skill
ed p
rodu
ctio
n (L
evel
s 6-
8)
102
4
4 3
5 3
4.3
Hig
hly
skill
ed s
uper
visi
on (L
evel
s 9-
12)
122
3
4 1
6 1
3.1
Seni
or m
anag
emen
t ser
vice
ban
d A
9
3
1
1
1.1
Seni
or m
anag
emen
t ser
vice
ban
d B
3
- 1
3
3.3
Seni
or m
anag
emen
t ser
vice
ban
d C
- -
- -
Polit
ical
offi
ce b
eare
r 1
1
1
1
00.0
TOTA
L 3
09
113
8
6 2
7.8

144
PA
RT
5A n n u a l R e p o r t 2 0 0 9 / 1 0
TABL
E 5.
5.2
- Ann
ual t
urno
ver r
ates
by
crit
ical
occ
upat
ion
for t
he p
erio
d 1
Apr
il 20
09 to
31
Mar
ch 2
010
Occ
upat
ion
Num
ber o
f Em
ploy
ees
per O
ccup
atio
n as
on
1 A
pril
2009
App
oint
men
ts a
nd
Tran
sfer
s in
to th
e D
epar
tmen
t
Term
inat
ions
and
Tr
ansf
ers
out o
f the
D
epar
tmen
t
Turn
over
Rat
e %
Envi
ronm
enta
l offi
cer
68
46
13
19.
1
Tow
n an
d re
gion
al p
lann
er 2
2 3
2
9
.1
Indu
stria
l tec
hnic
ian
4
8
- -
TOTA
L 9
4 5
7 1
5 1
6.0
The
follo
win
g ta
ble
iden
tifies
the
maj
or re
ason
s w
hy s
taff
left
the
depa
rtm
ent.
TABL
E 5.
5.3
- Rea
sons
why
sta
ff a
re le
avin
g th
e de
part
men
t
Term
inat
ion
Type
Num
ber
% o
f Tot
al
Resi
gnat
ion
24
28
Expi
ry o
f con
trac
t 4
5 52
Dis
mis
sal -
mis
cond
uct
1
1
Retir
emen
t 1
1
Tran
sfer
s to
oth
er p
ublic
ser
vice
dep
artm
ents
15
17
TOTA
L 8
6 10
0
Tota
l num
ber o
f em
ploy
ees
who
left
as
a %
of t
he to
tal e
mpl
oym
ent
28

145
RE
SO
UR
CE
MA
NA
GE
ME
NT
H u m a n
TABL
E 5.
5.4
- Pro
mot
ions
by
crit
ical
occ
upat
ion
Occ
upat
ion
Empl
oyee
s as
at
1 A
pril
2009
Prom
otio
ns to
ano
ther
Sa
lary
Lev
elSa
lary
Lev
el P
rom
otio
ns
as a
% o
f Em
ploy
ees
by
Occ
upat
ion
Prog
ress
ions
to a
noth
er
notc
h w
ithin
Sal
ary
Leve
lN
otch
Pro
gres
sion
s as
a
% o
f Em
ploy
ees
by
Occ
upat
ion
Envi
ronm
enta
l offi
cer
6811
16.
2 -
-
Tow
n an
d re
gion
al p
lann
er22
2 9
.1
- -
Indu
stria
l tec
hnic
ian
41
25.
0 -
-
TOTA
L 9
4 1
4 1
4.89
-
-
TABL
E 5.
5.5
- Pro
mot
ions
by
sala
ry b
and
Sala
ry B
ands
Empl
oyee
s as
at
1 A
pril
2009
Prom
otio
ns to
ano
ther
Sa
lary
Lev
elSa
lary
Ban
d Pr
omot
ions
as
a %
of E
mpl
oyee
s by
Sa
lary
Lev
el
Prog
ress
ions
to a
noth
er
notc
h w
ithin
Sal
ary
Leve
lN
otch
Pro
gres
sion
s as
a
% o
f Em
ploy
ees
by S
alar
y Ba
nd
Low
er s
kille
d (L
evel
s 1-
2)4
- -
- -
Skill
ed (L
evel
s 3-
5)68
- -
- -
Hig
hly
skill
ed p
rodu
ctio
n (L
evel
s 6-
8)10
28
7.8
-
-
Hig
hly
skill
ed s
uper
visi
on (L
evel
s 9-
12)
122
17 1
3.9
- -
Seni
or m
anag
emen
t (Le
vels
13-
16) *
132
15.
4 -
-
TOTA
L 3
09
27
8.7
-
-
* Min
iste
r inc
lude
d

146
PA
RT
5A n n u a l R e p o r t 2 0 0 9 / 1 0
5.6
Empl
oym
ent e
quit
y
The
tabl
es in
this
sec
tion
are
base
d on
the
form
ats
pres
crib
ed b
y th
e Em
ploy
men
t Equ
ity A
ct, 5
5 of
199
8.
TABL
E 5.
6.1
- Tot
al n
umbe
r of e
mpl
oyee
s (in
clud
ing
empl
oyee
s w
ith
disa
bilit
ies)
in e
ach
of th
e fo
llow
ing
occu
pati
onal
cat
egor
ies
as a
t 31
Mar
ch 2
010
Occ
upat
iona
l Cat
egor
ies
Mal
eFe
mal
eTo
tal
Afr
ican
Col
oure
dIn
dian
Whi
teA
fric
an C
olou
red
Indi
anW
hite
Legi
slat
ors,
seni
or o
ffici
als
and
man
ager
s *
- 6
-
5
1
1
--
13
Prof
essi
onal
s 2
3 3
5 5
2
9 2
6 4
1 1
1
7 1
77
Tech
nici
ans
and
asso
ciat
e pr
ofes
sion
als
1
6
- 1
1 4
8
1
7
3
8
Cler
ks
9
21
- 3
1
1 5
3 -
11
108
Serv
ice
and
sale
s w
orke
rs
- 1
-
- 1
2
-
- 4
Plan
t and
mac
hine
ope
rato
rs a
nd a
ssem
bler
s -
1
--
--
--
1
TOTA
L 3
3 7
0 5
4
8 4
3 1
05
2
35
341
Empl
oyee
s w
ith a
dis
abili
ty
11
-1
1-
--
4
* Min
iste
r inc
lude
d

147
RE
SO
UR
CE
MA
NA
GE
ME
NT
H u m a n
TABL
E 5.
6.2
- Tot
al n
umbe
r of e
mpl
oyee
s (in
clud
ing
empl
oyee
s w
ith
disa
bilit
ies)
in e
ach
of th
e fo
llow
ing
occu
pati
onal
ban
ds a
s at
31
Mar
ch 2
010
Occ
upat
iona
l Ban
dsM
ale
Fem
ale
Tota
l
Afr
ican
Col
oure
dIn
dian
Whi
teA
fric
an C
olou
red
Indi
anW
hite
Top
man
agem
ent *
--
- 2
-
--
- 2
Seni
or m
anag
emen
t-
6
- 3
1
1
-
- 1
1
Prof
essi
onal
ly q
ualifi
ed a
nd e
xper
ienc
ed s
peci
alis
ts a
nd m
id-m
anag
emen
t 1
5 3
0 3
3
7 1
7 3
1 2
1
8 1
53
Skill
ed te
chni
cal a
nd a
cade
mic
ally
qua
lified
wor
kers
, jun
ior m
anag
emen
t, su
perv
isor
s, fo
rem
en 1
4 1
8 2
4
1
4 3
1 -
12
95
Sem
i-ski
lled
and
disc
retio
nary
dec
isio
n-m
akin
g 4
1
4 -
2
10
40
- 5
7
5
Uns
kille
d an
d de
fined
dec
isio
n-m
akin
g-
2
--
1
2
- 5
TOTA
L 3
3 7
0 5
4
8 4
3 1
05
2
35
341
Empl
oyee
s w
ith a
dis
abili
ty
11
-1
1-
--
4
* Min
iste
r inc
lude
d
TABL
E 5.
6.3
- Rec
ruit
men
t for
the
peri
od 1
Apr
il 20
09 to
31
Mar
ch 2
010
Occ
upat
iona
l Ban
ds
Mal
eFe
mal
eTo
tal
Afr
ican
Colo
ured
Indi
anW
hite
Afr
ican
Colo
ured
Indi
anW
hite
Top
man
agem
ent
--
--
--
--
-
Seni
or m
anag
emen
t-
--
2
--
--
2
Prof
essi
onal
ly q
ualifi
ed a
nd e
xper
ienc
ed s
peci
alis
ts a
nd m
id-m
anag
emen
t 4
5
-
6
4
4
1
5
29
Skill
ed te
chni
cal a
nd a
cade
mic
ally
qua
lified
wor
kers
, jun
ior m
anag
emen
t, su
perv
isor
s, fo
rem
en 1
0 1
1 1
2
3
8
-
6
41
Sem
i-ski
lled
and
disc
retio
nary
dec
isio
n-m
akin
g 3
8
-
- 3
1
1 -
2
27
Uns
kille
d an
d de
fined
dec
isio
n-m
akin
g-
--
--
2
--
2
TOTA
L 1
7 2
4 1
1
0 1
0 2
5 1
1
3 1
01
Empl
oyee
s w
ith a
dis
abili
ty
Non
e

148
PA
RT
5A n n u a l R e p o r t 2 0 0 9 / 1 0
TABL
E 5.
6.4
- Pro
mot
ions
for t
he p
erio
d 1
Apr
il 20
09 to
31
Mar
ch 2
010
Occ
upat
iona
l Ban
dsM
ale
Fem
ale
Tota
l
Afr
ican
Col
oure
dIn
dian
Whi
teA
fric
an C
olou
red
Indi
anW
hite
Top
man
agem
ent
- -
- 1
-
--
- 1
Seni
or m
anag
emen
t-
--
--
--
- -
Prof
essi
onal
ly q
ualifi
ed a
nd e
xper
ienc
ed s
peci
alis
ts a
nd m
id-m
anag
emen
t 2
4
2
5
1
1
1
1
1
7
Skill
ed te
chni
cal a
nd a
cade
mic
ally
qua
lified
wor
kers
, jun
ior m
anag
emen
t, su
perv
isor
s, fo
rem
en 2
2
-
- 1
3
-
- 8
Sem
i-ski
lled
and
disc
retio
nary
dec
isio
n-m
akin
g-
--
--
--
- -
Uns
kille
d an
d de
fined
dec
isio
n-m
akin
g-
--
--
--
- -
TOTA
L 4
6
2
6
2
4
1
1
2
6
Empl
oyee
s w
ith a
dis
abili
tyN
one
TABL
E 5.
6.5
- Ter
min
atio
ns fo
r the
per
iod
1 A
pril
2009
to 3
1 M
arch
201
0
Occ
upat
iona
l Ban
dsM
ale
Fem
ale
Tota
l
Afr
ican
Col
oure
dIn
dian
Whi
teA
fric
an C
olou
red
Indi
anW
hite
Top
man
agem
ent
--
--
--
--
-
Seni
or m
anag
emen
t-
--
1
--
--
1
Prof
essi
onal
ly q
ualifi
ed a
nd e
xper
ienc
ed s
peci
alis
ts a
nd m
id-m
anag
emen
t 1
1
-
3
1
1
- 3
1
0
Skill
ed te
chni
cal a
nd a
cade
mic
ally
qua
lified
wor
kers
, jun
ior m
anag
emen
t, su
perv
isor
s, fo
rem
en 3
1
8 -
- 7
1
-
1
30
Sem
i-ski
lled
and
disc
retio
nary
dec
isio
n-m
akin
g 2
6
-
- 2
1
3 -
1
24
Uns
kille
d an
d de
fined
dec
isio
n-m
akin
g-
--
- 1
3
-
- 4
TOTA
L 6
2
5 -
4
11
18
- 5
6
9
Empl
oyee
s w
ith a
dis
abili
ty
Non
e

149
RE
SO
UR
CE
MA
NA
GE
ME
NT
H u m a n
TABL
E 5.
6.6
- Dis
cipl
inar
y ac
tion
for t
he p
erio
d 1
Apr
il 20
09 to
31
Mar
ch 2
010
Dis
cipl
inar
y A
ctio
nM
ale
Fem
ale
Tota
l
Afr
ican
Col
oure
dIn
dian
Whi
teA
fric
an C
olou
red
Indi
anW
hite
Corr
ectiv
e co
unse
lling
- 1
-
--
1
--
2
Verb
al w
arni
ng 1
-
--
- 4
-
- 5
Writ
ten
war
ning
2
3
- 1
2
2
-
1
11
Fina
l writ
ten
war
ning
3
--
--
2
--
5
Susp
ensi
on w
ithou
t pay
1
--
--
--
- 1
TOTA
L 7
5
-
1
2
9
- 1
2
5
TABL
E 5.
6.7
- Ski
lls d
evel
opm
ent f
or th
e pe
riod
1 A
pril
2009
to 3
1 M
arch
201
0
Occ
upat
iona
l Cat
egor
ies
Mal
eFe
mal
eTo
tal
Afr
ican
Col
oure
dIn
dian
Whi
teA
fric
an C
olou
red
Indi
anW
hite
Legi
slat
ors,
seni
or o
ffici
als
and
man
ager
s -
--
1
- 2
-
- 3
Prof
essi
onal
s 9
2
0 6
5
5
2
3 -
9
77
Tech
nici
ans
and
asso
ciat
e pr
ofes
sion
als
--
--
--
1
1
Cler
ks
1
13
--
- 1
0 -
8
32
TOTA
L 1
0 3
3 6
6
5
3
5 1
8 1
13
Empl
oyee
s w
ith a
dis
abili
ty
11

150
PA
RT
5A n n u a l R e p o r t 2 0 0 9 / 1 0
TABL
E 5.
6.8
- Gra
ntin
g of
em
ploy
ee in
itia
ted
seve
ranc
e pa
ckag
es
Cate
gory
No.
of A
pplic
atio
ns
Rece
ived
No.
of A
pplic
atio
ns
Refe
rred
to th
e M
PSA
No.
of A
pplic
atio
ns
Supp
orte
d by
MPS
AN
o. o
f Pac
kage
s A
ppro
ved
by
Dep
artm
ent
Low
er s
kille
d (S
alar
y Le
vel 1
-2)
--
--
Skill
ed (S
alar
y Le
vel 3
-5)
--
--
Hig
hly
skill
ed p
rodu
ctio
n (S
alar
y Le
vel 6
-8)
--
--
Hig
hly
skill
ed s
uper
visi
on (S
alar
y Le
vel 9
-12)
1
1
1
1
Seni
or m
anag
emen
t (Sa
lary
Lev
el 1
3 an
d hi
gher
)-
--
-

151
RE
SO
UR
CE
MA
NA
GE
ME
NT
H u m a n
5.7
SMS
perf
orm
ance
agr
eem
ents
and
pos
ts
The
tabl
es in
thi
s se
ctio
n pr
ovid
es in
form
atio
n re
gard
ing
sign
ing
of p
erfo
rman
ce a
gree
men
ts a
nd fi
lling
of p
osts
for S
MS
mem
bers
as
requ
ired
by re
gula
tion
4/III
/B.3
of t
he
Publ
ic S
ervi
ce R
egul
atio
ns, 2
001.
5.7.
1 Si
gnin
g of
Per
form
ance
Agr
eem
ents
by
SMS
Mem
bers
TABL
E 5.
7.1.
1 - S
igni
ng o
f per
form
ance
agr
eem
ents
by
SMS
mem
bers
as
at 3
1 Ju
ly 2
009
SMS
Leve
l
Tota
l Num
ber o
f Fun
ded
SMS
Post
s pe
r Lev
elTo
tal N
umbe
r of S
MS
Mem
bers
per
Lev
elTo
tal N
umbe
r of S
igne
d Pe
rfor
man
ce A
gree
men
ts
per L
evel
Sign
ed P
erfo
rman
ce
Agr
eem
ents
as
% o
f Tot
al
Num
ber o
f SM
S M
embe
rs
per L
evel
Hea
d of
Dep
artm
ent (
HO
D)
1-
--
Sala
ry le
vel 1
6, b
ut n
ot H
OD
--
--
Sala
ry le
vel 1
5 -
--
-
Sala
ry le
vel 1
4 3
3
3
10
0
Sala
ry le
vel 1
3 1
0 9
9
1
00
TOTA
L 1
4 1
2 1
2 10
0
TABL
E 5.
7.1.
2 - R
easo
ns fo
r not
hav
ing
conc
lude
d pe
rfor
man
ce a
gree
men
ts fo
r all
SMS
mem
bers
as
on 3
1 Ju
ly 2
009
Non
e
TABL
E 5.
7.1.
3 - D
isci
plin
ary
step
s ta
ken
agai
nst S
MS
mem
bers
for n
ot h
avin
g co
nclu
ded
perf
orm
ance
agr
eem
ents
as
on 3
1 Ju
ly 2
009
Non
e

152
PA
RT
5A n n u a l R e p o r t 2 0 0 9 / 1 0
5.7.
2 Fi
lling
of S
MS
Post
s
TABL
E 5.
7.2.
1 - S
MS
post
s in
form
atio
n as
at 3
1 M
arch
201
0
SMS
Leve
lTo
tal N
umbe
r of F
unde
d SM
S Po
sts
per L
evel
Tota
l Num
ber o
f SM
S Po
sts
Fille
d pe
r Lev
el%
of S
MS
Post
s Fi
lled
per
Leve
lTo
tal N
umbe
r of S
MS
post
s Vac
ant p
er L
evel
% o
f SM
S Po
sts V
acan
t pe
r Lev
el
Hea
d of
Dep
artm
ent (
HO
D)
1
1
100.
0-
0.0
Sala
ry le
vel 1
6, b
ut n
ot H
OD
--
--
-
Sala
ry le
vel 1
5-
--
--
Sala
ry le
vel 1
4 3
2
66
.7 1
33
.3
Sala
ry le
vel 1
3 1
0 9
90
.0 1
10
.0
TOTA
L 1
4 1
2 85
.7 2
14
.3
TABL
E 5.
7.2.
2 - S
MS
post
s in
form
atio
n as
at 3
0 Se
ptem
ber 2
009
SMS
Leve
lTo
tal N
umbe
r of F
unde
d SM
S Po
sts
per L
evel
Tota
l Num
ber o
f SM
S Po
sts
Fille
d pe
r Lev
el%
of S
MS
Post
s Fi
lled
per
Leve
lTo
tal N
umbe
r of S
MS
post
s Vac
ant p
er L
evel
% o
f SM
S Po
sts V
acan
t pe
r Lev
el
Hea
d of
Dep
artm
ent (
HO
D)
1
- 0.
0 1
10
0
Sala
ry le
vel 1
6, b
ut n
ot H
OD
- -
- -
-
Sala
ry le
vel 1
5 -
- -
- -
Sala
ry le
vel 1
4 3
3
10
0.0
- 0
Sala
ry le
vel 1
3 1
0 8
80
.0 2
20
TOTA
L 1
4 1
1 78
.6 3
21
.4

153
RE
SO
UR
CE
MA
NA
GE
ME
NT
H u m a n
TABL
E 5.
7.2.
3 - A
dver
tisi
ng a
nd fi
lling
of S
MS
post
s as
on
31 M
arch
201
0
SMS
Leve
l
Adv
ertis
ing
Filli
ng o
f Pos
ts
Num
ber o
f Vac
anci
es
per L
evel
Adv
ertis
ed in
6
Mon
ths
of b
ecom
ing
Vaca
nt
Num
ber o
f Vac
anci
es p
er
Leve
l fille
d in
6 M
onth
s af
ter b
ecom
ing
Vaca
nt
Num
ber o
f Vac
anci
es
per L
evel
not
fille
d in
6
Mon
ths
but fi
lled
in 1
2 M
onth
s
Hea
d of
Dep
artm
ent (
HO
D)
--
-
Sala
ry le
vel 1
6, b
ut n
ot H
OD
--
-
Sala
ry le
vel 1
5-
--
Sala
ry le
vel 1
4-
--
Sala
ry le
vel 1
3 -
- 1
TOTA
L -
- 1
TABL
E 5.
7.2.
4 - R
easo
ns fo
r no
t ha
ving
com
plie
d w
ith
the
fillin
g of
fun
ded
vaca
nt S
MS
- adv
erti
sed
wit
hin
6 m
onth
s an
d fil
led
wit
hin
12 m
onth
s af
ter
beco
min
g va
cant
Reas
ons
for v
acan
cies
not
adv
ertis
ed w
ithin
6 m
onth
s:
1 N
ew e
stab
lishm
ent a
nd S
MS
post
s in
pro
cess
- fun
ctio
nal c
hang
es o
n cu
rren
t dut
ies
of S
MS
post
s
Reas
ons
for v
acan
cies
not
fille
d w
ithin
12
mon
ths:
1 N
ew e
stab
lishm
ent a
nd S
MS
post
s in
pro
cess
- fun
ctio
nal c
hang
es o
n cu
rren
t dut
ies
of S
MS
post
s
TABL
E 5.
7.2.
5 - D
isci
plin
ary
step
s ta
ken
for n
ot c
ompl
ying
wit
h th
e pr
escr
ibed
tim
efra
mes
for fi
lling
SM
S po
sts
wit
hin
12 m
onth
s
Non
e

154
PA
RT
5A n n u a l R e p o r t 2 0 0 9 / 1 0
5.8
Perf
orm
ance
rew
ards
To e
ncou
rage
goo
d pe
rfor
man
ce, t
he d
epar
tmen
t has
gra
nted
the
follo
win
g pe
rfor
man
ce re
war
ds d
urin
g th
e ye
ar u
nder
revi
ew. T
he in
form
atio
n is
pre
sent
ed in
term
s of
race
, ge
nder
, and
dis
abili
ty (T
able
5.8
.1),
sala
ry b
ands
(Tab
le 5
.8.2
) and
crit
ical
occ
upat
ion.
TABL
E 5.
8.1
- Per
form
ance
rew
ards
by
race
, gen
der a
nd d
isab
ility
, 1 A
pril
2009
to 3
1 M
arch
201
0
Be
nefic
iary
Pro
file
Cost
Num
ber o
f Ben
efici
arie
sTo
tal N
umbe
r of
Empl
oyee
s in
Gro
up%
of T
otal
with
in G
roup
Cost
R'
000
Aver
age
Cost
per
Em
ploy
ee
Afr
ican
9
67
13.4
56
6 2
22
Mal
e 4
2
5 16
.0 2
0 5
000
Fem
ale
5
42
11.9
36
7 2
00
Asi
an 3
4
75
.0 3
1 1
0 33
3
Mal
e 2
3
66
.7 2
6 1
3 00
0
Fem
ale
1
1
100.
0 5
5
000
Colo
ured
70
164
42
.7 6
39
9 1
29
Mal
e 2
6 6
8 38
.2 2
95
11
346
Fem
ale
44
96
45.8
344
7
818
Whi
te 4
4 7
1 62
.0 6
51
14
795
Mal
e 2
8 4
4 63
.6 4
92
17
571
Fem
ale
16
27
59.3
159
9
938
TOTA
L 1
26
306
41
.2 1
,377
1
0 92
9

155
RE
SO
UR
CE
MA
NA
GE
ME
NT
H u m a n
TABL
E 5.
8.2
- Per
form
ance
rew
ards
by
sala
ry b
ands
for p
erso
nnel
bel
ow s
enio
r man
agem
ent s
ervi
ce, 1
Apr
il 20
09 to
31
Mar
ch 2
010
Sala
ry B
ands
Bene
ficia
ry P
rofil
eCo
st
Num
ber o
f Be
nefic
iari
esN
umbe
r of
Empl
oyee
s%
of T
otal
with
in
Sala
ry B
ands
Tota
l Cos
t Av
erag
e Co
st p
er
Empl
oyee
To
tal C
ost a
s a
% o
f the
Tot
al
Com
pens
atio
n of
Em
ploy
ees
R’00
0R’
000
Low
er s
kille
d (L
evel
s 1-
2)
- 4
-
- -
-
Skill
ed (L
evel
s 3-
5)
22
67
33 6
6 3
000
0
.8
Hig
hly
skill
ed p
rodu
ctio
n (L
evel
s 6-
8)
38
102
37
262
6
895
1
.4
Hig
hly
skill
ed s
uper
visi
on (L
evel
s 9-
12)
59
121
49
900
1
5 25
4 1
.9
TOTA
L 1
19
294
40
1,2
28
10,3
19 1
.4
TABL
E 5.
8.3
- Per
form
ance
rew
ards
by
crit
ical
occ
upat
ion,
1 A
pril
2009
to 3
1 M
arch
201
0
Criti
cal O
ccup
atio
ns
Bene
ficia
ry P
rofil
eCo
st
Num
ber o
f Be
nefic
iari
esN
umbe
r of E
mpl
oyee
s%
of T
otal
with
in
Occ
upat
ion
Tota
l Cos
t R'
000
Aver
age
Cost
per
Em
ploy
ee
Envi
ronm
enta
l offi
cer
24
57
42 3
79
15
792
Tow
n an
d re
gion
al p
lann
er 1
1 2
5 44
146
1
3 27
3
Indu
stria
l tec
hnic
ian
1
2
50 1
1 1
1 00
0
TOTA
L 3
6 8
4 43
536
14
,889

156
PA
RT
5A n n u a l R e p o r t 2 0 0 9 / 1 0
TABL
E 5.
8.4
- Per
form
ance
rela
ted
rew
ards
(cas
h bo
nus)
by
sala
ry b
and
for s
enio
r man
agem
ent s
ervi
ce
Sala
ry B
ands
Bene
ficia
ry P
rofil
eCo
st
Num
ber o
f Be
nefic
iari
esN
umbe
r of E
mpl
oyee
s%
of T
otal
with
in B
and
Tota
l Cos
t R'
000
Aver
age
Cost
per
Em
ploy
ee
Tota
l Cos
t as
a %
of t
he T
otal
Co
mpe
nsat
ion
of
Empl
oyee
s
Band
A 4
9
44
104
26
000
1.7
Band
B
2
3
67 4
5 22
500
2.7
TOTA
L 6
1
2 50
149
4
8,50
0 1
.5

157
RE
SO
UR
CE
MA
NA
GE
ME
NT
H u m a n
5.9
Fore
ign
wor
kers
The
tabl
es b
elow
sum
mar
ise
the
empl
oym
ent o
f for
eign
nat
iona
ls in
the
depa
rtm
ent i
n te
rms
of s
alar
y ba
nds
and
by m
ajor
occ
upat
ion.
The
tabl
es a
lso
sum
mar
ise
chan
ges
in
the
tota
l num
ber o
f for
eign
wor
kers
in e
ach
sala
ry b
and
and
by e
ach
maj
or o
ccup
atio
n.
TABL
E 5.
9.1
- For
eign
wor
kers
by
sala
ry b
and
Sala
ry B
ands
Empl
oym
ent a
t Beg
inni
ng P
erio
d(1
Apr
il 20
09)
Empl
oym
ent a
t End
of P
erio
d (3
1 M
arch
201
0)Ch
ange
in E
mpl
oym
ent
Num
ber
% o
f Tot
alN
umbe
r%
of T
otal
Num
ber
% C
hang
e
Low
er s
kille
d (L
evel
s 1-
2) -
- -
- -
-
Skill
ed (L
evel
s 3-
5) -
- -
- -
-
Hig
hly
skill
ed p
rodu
ctio
n (L
evel
s 6-
8) 1
1
00
3
75
2
67
Hig
hly
skill
ed s
uper
visi
on (L
evel
s 9-
12)
- -
1
25
1
33
Seni
or m
anag
emen
t (Le
vels
13-
16)
- -
- -
- -
TOTA
L1
100
4
1
00
3
100
TABL
E 5.
9.2
- For
eign
wor
kers
by
maj
or o
ccup
atio
n
Maj
or O
ccup
atio
n
Empl
oym
ent a
t Beg
inni
ng P
erio
d(1
Apr
il 20
09)
Empl
oym
ent a
t End
of P
erio
d (3
1 M
arch
201
0)Ch
ange
in E
mpl
oym
ent
Num
ber
% o
f Tot
alN
umbe
r%
of T
otal
Num
ber
% C
hang
e
Prof
essi
onal
s 1
1
00
4
100
3
1
00
TOTA
L 1
1
00
4
100
3
1
00

158
PA
RT
5A n n u a l R e p o r t 2 0 0 9 / 1 0
5.10
Le
ave
utili
sati
on fo
r the
per
iod
1 Ja
nuar
y 20
09 to
31
Dec
embe
r 200
9
The
Publ
ic S
ervi
ce C
omm
issi
on id
entifi
ed th
e ne
ed fo
r car
eful
mon
itorin
g of
sick
leav
e w
ithin
the
publ
ic se
rvic
e. T
he fo
llow
ing
tabl
es p
rovi
de a
n in
dica
tion
of th
e us
e of
sick
leav
e (T
able
5.1
0.1)
and
dis
abili
ty le
ave
(Tab
le 5
.10.
2). I
n bo
th c
ases
, the
est
imat
ed c
ost o
f the
leav
e is
als
o pr
ovid
ed.
TABL
E 5.
10.1
- Si
ck le
ave,
1 Ja
nuar
y 20
09 to
31
Dec
embe
r 200
9
Sala
ry B
ands
Tota
l Day
s Ta
ken
% D
ays
with
Med
ical
Ce
rtifi
catio
nN
umbe
r of E
mpl
oyee
s us
ing
Sick
Lea
ve%
of T
otal
Em
ploy
ees
usin
g Si
ck L
eave
Aver
age
Day
s pe
r Em
ploy
eeEs
timat
ed C
ost
(R'0
00)
Low
er s
kille
d (L
evel
s 1-
2)
2396
31
8
2
Skill
ed (L
evel
s 3-
5)
546
7574
25 7
2
Hig
hly
skill
ed p
rodu
ctio
n (L
evel
s 6-
8)
618
7189
31 7
4
Hig
hly
skill
ed s
uper
visi
on (L
evel
s 9-
12)
1,05
782
115
40 9
1
Seni
or m
anag
emen
t (Le
vels
13-
16)
4168
103
4
2
TOTA
L2,
285
7729
110
0 8
1
1
TABL
E 5.
10.2
- D
isab
ility
leav
e (t
empo
rary
and
per
man
ent)
, 1 Ja
nuar
y 20
09 to
31
Dec
embe
r 200
9
Sala
ry B
ands
Tota
l Day
s Ta
ken
% D
ays
with
Med
ical
Ce
rtifi
catio
nN
umbe
r of E
mpl
oyee
s us
ing
Dis
abili
ty L
eave
% o
f Tot
al E
mpl
oyee
s us
ing
Dis
abili
ty L
eave
Ave
rage
Day
s pe
r Em
ploy
ee
Est
imat
ed C
ost
(R'0
00)
Low
er s
kille
d (L
evel
s 1-
2)
- -
- -
- -
Skill
ed (L
evel
s 3-
5)
- -
- -
- -
Hig
hly
skill
ed p
rodu
ctio
n (L
evel
s 6-
8)
610
01
25 6
4
Hig
hly
skill
ed s
uper
visi
on (L
evel
s 9-
12)
215
100
250
108
5
Seni
or m
anag
emen
t (Le
vels
13-
16)
1010
01
25 1
0 2
TOTA
L23
130
0 4
10
0 5
8 1
1

159
RE
SO
UR
CE
MA
NA
GE
ME
NT
H u m a n
TABLE 5.10.3 - Annual leave, 1 January 2009 to 31 December 2009
Salary Bands Total Days Taken Average Days per Employee
Lower skilled (Levels 1-2) 62 16
Skilled (Levels 3-5) 1,492 20
Highly skilled production (Levels 6-8) 1,814 19
Highly skilled supervision (Levels 9-12) 3,101 21
Senior management (Levels 13-16) 259 20
TOTAL 6,728 20
TABLE 5.10.4 - Capped leave, 1 January 2009 to 31 December 2009
Salary BandsTotal Days of Capped
Leave TakenAverage Number of Days
Taken per EmployeeAverage Capped Leave
per Employee as at 31 December 2009
Lower skilled (Levels 1-2) - - -
Skilled (Levels 3-5) 23 - 1
Highly skilled production (Levels 6-8) 1 - 6
Highly skilled supervision (Levels 9-12) - - 11
Senior management (Levels 13-16) 53 4 30
TOTAL 77 0 8
TABLE 5.10.5 - Leave payouts for the period 1 April 2009 to 31 March 2010
The following table summarises payments made to employees as a result of leave that was not taken.
Reason
Total Amount
R'000
Number of Employees
Average Payment
per Employee
R’000
Leave payout for 2009/10 due to non-utilisation of leave for the previous cycle 8 1 7,904
Capped leave payouts on termination of service for 2009/10 - - -
Current leave payout on termination of service for 2009/10 25 5 24,596
TOTAL 33 6 32,500

160
PA
RT
5A n n u a l R e p o r t 2 0 0 9 / 1 0
5.11
H
IV a
nd A
IDS
and
heal
th p
rom
otio
n pr
ogra
mm
es
TABL
E 5.
11.1
- St
eps
take
n to
redu
ce th
e ri
sk o
f occ
upat
iona
l exp
osur
e
Uni
ts/C
ateg
orie
s of
Em
ploy
ees
Iden
tified
to b
e at
Hig
h Ri
sk o
f Con
trac
ting
HIV
& R
elat
ed D
isea
ses
(if a
ny)
Key
Step
s Tak
en to
Red
uce
the
Risk
Non
eN
one
TABL
E 5.
11.2
- D
etai
ls o
f hea
lth
prom
otio
n an
d H
IV/A
IDS
prog
ram
mes
que
stio
nYe
sN
oD
etai
ls, i
f yes
1. H
as th
e de
part
men
t des
igna
ted
a m
embe
r of t
he S
MS
to im
plem
ent t
he p
rovi
sion
s co
ntai
ned
in P
art V
I E o
f Cha
pter
1 o
f the
Pub
lic S
ervi
ce R
egul
atio
ns, 2
001?
If s
o, p
rovi
de h
is/
her n
ame
and
posi
tion.
X
Mr.
I. Ca
rolu
s
D
irect
or: H
uman
Res
ourc
e M
anag
emen
t and
Sha
red
L
ogis
tical
Ser
vice
s
2. D
oes
the
depa
rtm
ent h
ave
a de
dica
ted
unit
or h
ave
you
desi
gnat
ed s
peci
fic s
taff
mem
bers
to p
rom
ote
heal
th a
nd w
ell-b
eing
of y
our e
mpl
oyee
s? If
so,
indi
cate
the
num
ber
of e
mpl
oyee
s w
ho a
re in
volv
ed in
this
task
and
the
annu
al b
udge
t tha
t is
avai
labl
e fo
r thi
s pu
rpos
e.
X
Five
mem
bers
wer
e ap
poin
ted
in th
e Su
b D
irect
orat
e D
evel
opm
ent a
nd T
rans
form
atio
n M
anag
emen
t. N
o sp
ecifi
c bu
dget
is m
ade
avai
labl
e fo
r HIV
/Aid
s. A
n am
ount
of R
10,6
00 w
as
spen
t on
HIV
/Aid
s ac
tiviti
es fo
r the
yea
r und
er re
view
.
3. H
as th
e de
part
men
t int
rodu
ced
an E
mpl
oyee
Ass
ista
nce
or H
ealth
Pro
mot
ion
Prog
ram
me
for y
our e
mpl
oyee
s? If
so,
indi
cate
the
key
elem
ents
/ser
vice
s of
the
prog
ram
me.
X
An
inde
pend
ent s
ervi
ce p
rovi
der r
ende
rs a
con
fiden
tial 2
4-ho
ur p
erso
nal s
uppo
rt s
ervi
ce to
al
l sta
ff m
embe
rs a
nd th
eir i
mm
edia
te fa
mili
es. K
ey e
lem
ents
of t
he s
ervi
ce in
clud
e: F
amily
m
atte
rs, S
tres
s, Fi
nanc
ial A
dvic
e, R
elat
ions
hips
, Tra
uma,
Sub
stan
ce a
buse
, Leg
al is
sues
, Hea
lth
issu
es, T
elep
honi
c Co
unse
lling
, Fac
e-to
-Fac
e Co
unse
lling
, Life
Man
agem
ent a
nd R
efer
ral
Serv
ices
.
4. H
as th
e de
part
men
t est
ablis
hed
(a) c
omm
ittee
(s) a
s co
ntem
plat
ed in
Par
t VI E
.5 (e
) of
Chap
ter 1
of t
he P
ublic
Ser
vice
Reg
ulat
ions
, 200
1? If
so,
ple
ase
prov
ide
the
nam
es o
f the
m
embe
rs o
f the
com
mitt
ee a
nd th
e st
akeh
olde
r(s)
that
they
repr
esen
t.
X
An
EAP
and
HIV
Com
mitt
ee e
xist
s an
d co
nduc
ts m
eetin
gs o
n a
quar
terly
bas
is.
Mem
bers
hip
are
as fo
llow
s: I
. Car
olus
(Cha
irper
son)
, C.
Car
else
-Tra
nsfo
rmat
ion
Man
agem
ent,
P. Vi
sser
- (Se
cret
aria
t),
N. v
an d
er S
chyff
-Tra
nsfo
rmat
ion
Man
agem
ent,
A. M
alan
-Str
ateg
ic
Envi
ronm
enta
l Man
agem
ent,
C. W
erne
r-In
tegr
ated
Env
ironm
enta
l Man
agem
ent,
D. S
yste
r-H
uman
Res
ourc
e M
anag
emen
t, H
. Sau
l-Fin
ance
, J.
Her
bert
-Inte
grat
ed E
nviro
nmen
tal
Man
agem
ent R
egio
n A
, K. T
hom
pson
-Com
mun
icat
ion,
M. M
abun
da-S
patia
l Pla
nnin
g, M
. Ke
nned
y-In
tegr
ated
Env
ironm
enta
l Man
agem
ent R
egio
n B,
R. S
ahab
odie
n-Sp
atia
l Pla
nnin
g,
R. M
ehl-P
ollu
tion
Man
agem
ent a
nd S
. Mis
bach
-Pol
lutio
n M
anag
emen
t.

161
RE
SO
UR
CE
MA
NA
GE
ME
NT
H u m a n
5. H
as th
e de
part
men
t rev
iew
ed th
e em
ploy
men
t pol
icie
s an
d pr
actic
es o
f you
r dep
artm
ent
to e
nsur
e th
at th
ese
do n
ot u
nfai
rly d
iscr
imin
ate
agai
nst e
mpl
oyee
s on
the
basi
s of
thei
r HIV
st
atus
? If
so, l
ist t
he e
mpl
oym
ent p
olic
ies/
prac
tices
so
revi
ewed
. X
Dra
ft E
mpl
oym
ent E
quity
Pla
n, D
raft
Hum
an R
ight
s M
ains
trea
min
g Po
licy,
Dra
ft W
orkp
lace
Pr
ogra
mm
e on
HIV
/Aid
s an
d D
raft
Em
ploy
ee H
ealth
and
Wel
lnes
s Po
licy.
6. H
as th
e de
part
men
t int
rodu
ced
mea
sure
s to
pro
tect
HIV
-pos
itive
em
ploy
ees
or th
ose
perc
eive
d to
be
HIV
-pos
itive
from
dis
crim
inat
ion?
If s
o, li
st th
e ke
y el
emen
ts o
f the
se
mea
sure
s.
X
The
follo
win
g br
oad
obje
ctiv
es h
as b
een
iden
tified
in re
spec
t of p
rogr
amm
es a
imed
at c
are,
tr
eatm
ent a
nd s
uppo
rt o
f em
ploy
ees
livin
g w
ith H
IV:
To im
plem
ent a
wel
lnes
s pr
ogra
mm
e th
at w
ill:
- Pro
vide
app
ropr
iate
med
ical
, psy
cho-
soci
al s
uppo
rt a
nd c
are
aim
ed a
t im
prov
ing
the
qua
lity
of li
fe o
f em
ploy
ees
livin
g w
ith H
IV; a
nd
- Pro
vide
app
ropr
iate
psy
cho-
soci
al s
uppo
rt to
em
ploy
ees
affec
ted
by H
IV. A
lso
the
Dra
ft D
epar
tmen
tal E
mpl
oym
ent E
quity
Pla
n w
ill a
ssis
t in
the
crea
tion
of a
non
-dis
crim
ator
y e
nviro
nmen
t with
rega
rds
to, a
mon
gst o
ther
s, H
IV/A
ids
stat
us.
7. D
oes
the
depa
rtm
ent e
ncou
rage
its
empl
oyee
s to
und
ergo
Vol
unta
ry C
ouns
ellin
g an
d Te
stin
g? If
so,
list
the
resu
lts th
at y
ou h
ave
achi
eved
. X
Thre
e VC
T an
d aw
aren
ess
rais
ing
sess
ions
wer
e co
nduc
ted
in 2
009/
2010
. One
of t
he s
essi
ons
wer
e al
so c
oupl
ed w
ith c
ompl
ete
Hea
lth a
nd W
elln
ess T
estin
g. 6
9 Em
ploy
ees
from
Hea
d O
ffice
and
30
from
the
Geo
rge
Regi
onal
Offi
ces
unde
rwen
t VC
T. Te
sts
wer
e al
l neg
ativ
e fo
r H
IV/A
ids.
8. H
as th
e de
part
men
t dev
elop
ed m
easu
res/
indi
cato
rs to
mon
itor a
nd e
valu
ate
the
impa
ct
of y
our h
ealth
pro
mot
ion
prog
ram
me?
If s
o, li
st th
ese
mea
sure
s/in
dica
tors
.
X
The
Hea
lth p
rom
otio
n pr
ogra
mm
e is
mon
itore
d on
a q
uart
erly
bas
is th
roug
h th
e Q
uart
erly
En
gage
men
t Rep
orts
rece
ived
from
the
EAP
Serv
ice
Prov
ider
. H
ealth
is fu
rthe
r mon
itore
d th
roug
h W
elln
ess T
estin
g (c
hole
ster
ol, B
MI,
gluc
ose
and
bloo
d pr
essu
re a
nd th
is y
ear e
ye
test
ing
was
als
o co
nduc
ted)
. A to
tal o
f 143
em
ploy
ees
part
icip
ated
in th
e W
elln
ess T
estin
g.
Staff
mem
bers
are
als
o ab
le to
mon
itor t
heir
own
wel
lnes
s by
reco
rdin
g it
in W
elln
ess
pass
port
s. Th
ere
was
als
o a
sign
ifica
nt in
crea
se th
is y
ear i
n st
aff c
reat
ing
thei
r ow
n Pe
rson
al
Profi
les
on E
-car
e (s
uch
as w
ork
habi
ts, m
edic
al c
ondi
tions
, fam
ily h
isto
ry, h
ealth
and
oth
er
inte
rest
). A
tota
l of 6
7 st
aff m
embe
rs re
gist
ered
this
yea
r for
E-c
are.
que
stio
nYe
sN
oD
etai
ls, i
f yes

162
PA
RT
5A n n u a l R e p o r t 2 0 0 9 / 1 0
5.12
La
bour
rela
tion
s
The
follo
win
g co
llect
ive
agre
emen
ts w
ere
ente
red
into
with
trad
e un
ions
with
in th
e de
part
men
t.
TABL
E 5.
12.1
- Co
llect
ive
agre
emen
ts, 1
Apr
il 20
09 to
31
Mar
ch 2
010
Tota
l col
lect
ive
agre
emen
ts :
The
Dep
artm
ent d
oes
not e
nter
into
col
lect
ive
agre
emen
ts. C
olle
ctiv
e ag
reem
ents
are
bei
ng e
nter
ed
into
on
Prov
inci
al le
vel w
ith th
e D
epar
tmen
t of t
he P
rem
ier a
ctin
g as
the
Prin
cipa
l.
The
follo
win
g ta
ble
sum
mar
ises
the
outc
ome
of d
isci
plin
ary
hear
ings
con
duct
ed w
ithin
the
Dep
artm
ent f
or th
e ye
ar u
nder
revi
ew.
TABL
E 5.
12.2
- M
isco
nduc
t and
dis
cipl
inar
y he
arin
gs fi
nalis
ed, 1
Apr
il 20
09 to
31
Mar
ch 2
010
Out
com
es o
f Dis
cipl
inar
y H
eari
ngs
Num
ber
% o
f Tot
al
Corr
ectio
nal c
ouns
ellin
g 2
8.
0
Verb
al w
arni
ng 5
20
.0
Writ
ten
war
ning
11
44.0
Fina
l writ
ten
war
ning
5
20.0
Susp
ende
d w
ithou
t pay
1
4.0
Fine
- -
Dem
otio
n -
-
Dis
mis
sal
1
4.0
Not
gui
lty -
-
Case
with
draw
n -
-
TOTA
L 2
5 10
0

163
RE
SO
UR
CE
MA
NA
GE
ME
NT
H u m a n
TABLE 5.12.3 - Types of misconduct addressed at disciplinary hearings, 1 April 2009 to 31 March 2010
Type of Misconduct Number % of Total
False statements/evidence in execution of duties 1 16.7
Misuse of GG vehicle 1 16.7
Misuse of State property 1 16.7
Mismanagement of state funds 1 16.7
Unauthorised absence 1 16.7
Under the influence of alcohol 1 16.7
TOTAL 6 100
TABLE 5.12.4 - Grievances lodged for the period 1 April 2009 to 31 March 2010
Grievances Number % of Total
Number of grievances resolved 14 77.8
Number of grievances not resolved 4 22.2
TOTAL NUMBER OF GRIEVANCES LODGED 18 100
TABLE 5.12.6 - Strike actions for the period 1 April 2009 to 31 March 2010
Strike Actions
Total number of person working days lost 0
Total cost (R'000) of working days lost 0
AMOUNT (R'000) RECOVERED AS A RESULT OF NO WORK NO PAY 0
TABLE 5.12.5 - Disputes lodged with councils, 1 April 2009 to 31 March 2010
Disputes Number % of Total
Number of disputes upheld - 0
Number of disputes dismissed 2 100
TOTAL NUMBER OF DISPUTES LODGED 2 100
TABLE 5.12.7 - Precautionary suspensions for the period 1 April 2009 to 31 March 2010
Precautionary Suspensions
Number of people suspended 1
Number of people whose suspension exceeded 30 days 1
Average number of days suspended 116
COST (R'000) OF SUSPENSIONS 58

164
PA
RT
5A n n u a l R e p o r t 2 0 0 9 / 1 0
5.13
Sk
ills
deve
lopm
ent
This
sec
tion
high
light
s th
e eff
orts
of t
he D
epar
tmen
t with
rega
rd to
ski
lls d
evel
opm
ent.
TABL
E 5.
13.1
- Tr
aini
ng n
eeds
iden
tifie
d 1
Apr
il 20
09 to
31
Mar
ch 2
010
Occ
upat
iona
l Cat
egor
ies
Gen
der
Num
ber o
f Em
ploy
ees
as a
t 1 A
pril
2009
Trai
ning
Nee
ds Id
entifi
ed a
t Sta
rt o
f Rep
ortin
g Pe
riod
Lear
ners
hips
Skill
s Pr
ogra
mm
es &
ot
her S
hort
Cou
rses
Oth
er F
orm
s of
Tra
inin
gTo
tal
Legi
slat
ors,
seni
or o
ffici
als
and
man
ager
s Fe
mal
e 2
-
--
-
M
ale
11
--
- -
Prof
essi
onal
s Fe
mal
e 8
0 -
134
7
7 2
11
M
ale
89
- 1
11
64
175
Tech
nici
ans
and
asso
ciat
e pr
ofes
sion
als
Fem
ale
2
- 2
3
5
M
ale
2
--
- -
Cler
ks
Fem
ale
80
- 8
2 1
04
186
M
ale
38
- 2
7 4
1 6
8
Serv
ice
and
sale
s w
orke
rs
Fem
ale
- -
--
-
M
ale
- -
--
-
Skill
ed a
gric
ultu
re a
nd fi
sher
y w
orke
rs
Fem
ale
- -
--
-
M
ale
- -
--
-
Craf
t and
rela
ted
trad
es w
orke
rs
Fem
ale
- -
--
-
M
ale
- -
--
-
Plan
t and
mac
hine
ope
rato
rs a
nd a
ssem
bler
s Fe
mal
e 4
-
1
1
2
M
ale
1
- 1
1
2
Elem
enta
ry o
ccup
atio
ns
Fem
ale
- -
--
-
M
ale
- -
- -

165
RE
SO
UR
CE
MA
NA
GE
ME
NT
H u m a n
Sub
Tota
lFe
mal
e 1
68
- 2
19
185
4
04
Mal
e 1
41
- 1
39
106
2
45
TOTA
L
309
-
358
2
91
649
Empl
oyee
s w
ith d
isab
ilitie
sFe
mal
e -
--
--
Mal
e 2
-
--
2
Occ
upat
iona
l Cat
egor
ies
Gen
der
Num
ber o
f Em
ploy
ees
as a
t 1 A
pril
2009
Trai
ning
Nee
ds Id
entifi
ed a
t Sta
rt o
f Rep
ortin
g Pe
riod
Lear
ners
hips
Skill
s Pr
ogra
mm
es &
ot
her S
hort
Cou
rses
Oth
er F
orm
s of
Tra
inin
gTo
tal

166
PA
RT
5A n n u a l R e p o r t 2 0 0 9 / 1 0
TABL
E 5.
13.2
- Tr
aini
ng p
rovi
ded
1 A
pril
2009
to 3
1 M
arch
201
0
Occ
upat
iona
l Cat
egor
ies
Gen
der
Num
ber o
f Em
ploy
ees
as a
t 1 A
pril
2009
Trai
ning
Pro
vide
d w
ithin
the
Repo
rtin
g Pe
riod
Lear
ners
hips
Skill
s Pr
ogra
mm
es &
ot
her S
hort
Cou
rses
Oth
er F
orm
s of
Tra
inin
gTo
tal
Legi
slat
ors,
seni
or o
ffici
als
and
man
ager
s Fe
mal
e 2
-
2
- 2
M
ale
11
- 1
2
3
Prof
essi
onal
s Fe
mal
e 8
0 -
37
149
1
86
M
ale
89
- 4
0 1
59
199
Tech
nici
ans
and
asso
ciat
e pr
ofes
sion
als
Fem
ale
2
- 1
7
8
M
ale
2
- -
7
7
Cler
ks
Fem
ale
80
- 1
8 1
57
175
M
ale
38
- 1
4 7
3 8
7
Serv
ice
and
sale
s w
orke
rs
Fem
ale
- -
--
-
M
ale
- -
--
-
Skill
ed a
gric
ultu
re a
nd fi
sher
y w
orke
rs
Fem
ale
- -
--
-
M
ale
- -
--
-
Craf
t and
rela
ted
trad
es w
orke
rs
Fem
ale
- -
--
-
M
ale
- -
--
-
Plan
t and
mac
hine
ope
rato
rs a
nd
asse
mbl
ers
Fem
ale
4
--
- -
M
ale
1
--
- -
Elem
enta
ry o
ccup
atio
ns
Fem
ale
- -
--
-
M
ale
- -
--
-
Sub
Tota
l Fe
mal
e 1
68
- 5
8 3
13
371
M
ale
141
-
55
241
2
96
TOTA
L
309
-
113
5
54
667
Empl
oyee
s w
ith d
isab
ilitie
sFe
mal
e -
--
--
Mal
e 2
-
1
- 1
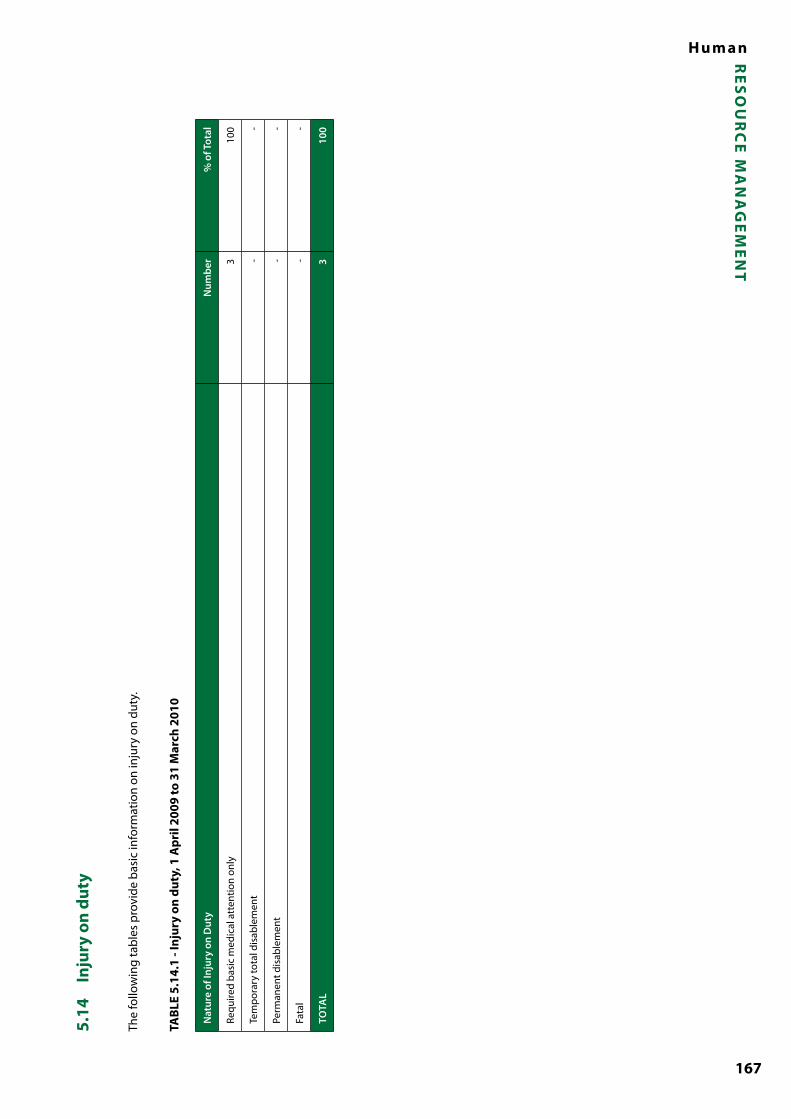
167
RE
SO
UR
CE
MA
NA
GE
ME
NT
H u m a n
5.14
In
jury
on
duty
The
follo
win
g ta
bles
pro
vide
bas
ic in
form
atio
n on
inju
ry o
n du
ty.
TABL
E 5.
14.1
- In
jury
on
duty
, 1 A
pril
2009
to 3
1 M
arch
201
0
Nat
ure
of In
jury
on
Dut
yN
umbe
r%
of T
otal
Requ
ired
basi
c m
edic
al a
tten
tion
only
3
10
0
Tem
pora
ry to
tal d
isab
lem
ent
--
Perm
anen
t dis
able
men
t -
-
Fata
l -
-
TOTA
L 3
10
0

168
PA
RT
5A n n u a l R e p o r t 2 0 0 9 / 1 0
5.15
U
tilis
atio
n of
con
sult
ants
TABL
E 5.
15.1
- Re
port
on
cons
ulta
nt a
ppoi
ntm
ents
usi
ng A
ppro
pria
ted
Fund
s
Proj
ect
Title
Tota
l Num
ber o
f Co
nsul
tant
s w
ho
Wor
ked
on th
e Pr
ojec
t
Dur
atio
n:
Wor
king
Day
sCo
ntra
ct V
alue
Paym
ents
20
09/1
0 -
Vote
d Fu
nds
% O
wne
rshi
p by
H
DI G
roup
s%
Man
agem
ent
by H
DI G
roup
sN
umbe
r of
Cons
ulta
nts
from
H
DI G
roup
s th
at
Wor
k on
the
Proj
ect
Revi
ew th
e St
atus
of B
oat L
aunc
hing
site
s in
the
Wes
tern
Cap
e12
128
R 26
5 39
2.00
R 26
5 39
2.00
100%
100%
5
Det
erm
ine
effec
ts o
f hea
vy m
etal
acc
umul
atio
n th
roug
h sa
mpl
e co
llect
ion
and
heav
y m
etal
ana
lysi
s, fr
om la
nd-b
ased
sou
rces
of p
ollu
tion
in th
e vi
cini
ty
of th
e D
iep
Rive
r Est
uary
in th
e W
este
rn C
ape
632
R 18
3 08
4.00
R 18
3 08
4.00
100%
100%
3
Trai
ning
of s
tude
nts
in m
anuf
actu
ring
and
inst
alla
tion
of s
olar
wat
er g
eyse
rs31
210
R 52
0 00
0.00
R 18
9 46
3.42
100%
100%
25
Sola
r wat
er h
eatin
g pr
ojec
t5
56R
5 96
2 26
5.15
R 1
509
046.
5010
0%10
0%5
Info
rmat
ion
sess
ion
web
-ena
bled
GIS
sys
tem
for t
he
Dep
artm
ent
25
Hou
rsR
3 20
6.25
R 3
206.
2552
%13
%1
Revi
ew o
f EIA
app
licat
ions
and
app
eals
136
R 14
2 66
0.00
R 14
2 66
0.00
34%
34%
1
Des
ign
trai
ning
mat
eria
l and
con
duct
trai
ning
for
the
oper
atio
nal a
nd te
chni
cal m
unic
ipal
sta
ff at
the
was
te d
ispo
sal f
acili
ties
with
in th
e W
este
rn C
ape
532
R 22
9 00
0.00
R 22
9 00
0.00
100%
100%
4
Revi
ew a
nd e
valu
atio
n of
the
draf
t Sw
artla
nd
Mun
icip
al Z
onin
g Sc
hem
e Re
gula
tions
140
R 35
000
.00
R 35
000
.00
0%0%
0
Regi
onal
Reg
ulat
ory
Actio
n Pl
an9
48R
471
732.
00R
471
731.
800%
0%1
Supp
ly a
nd in
stal
latio
n of
sol
ar w
ater
gey
sers
217
R 2
686
747.
00R
1 04
6 74
7.00
100%
100%
14
Ana
lyse
effl
uent
sam
ples
1-
R 27
421
.50
R 27
421
.50
N/A
N/A
0
Com
pile
a g
uide
line
docu
men
t for
mun
icip
aliti
es
to a
ssis
t with
the
draf
ting
of c
redi
ble
Spat
ial
Dev
elop
men
t Fra
mew
orks
(SD
Fs)
111
R 49
8 33
1.00
R 16
228
.93
89%
91%
1

169
RE
SO
UR
CE
MA
NA
GE
ME
NT
H u m a n
Proj
ect
Title
Tota
l Num
ber o
f Co
nsul
tant
s w
ho
Wor
ked
on th
e Pr
ojec
t
Dur
atio
n:
Wor
king
Day
sCo
ntra
ct V
alue
Paym
ents
20
09/1
0 -
Vote
d Fu
nds
% O
wne
rshi
p by
H
DI G
roup
s%
Man
agem
ent
by H
DI G
roup
sN
umbe
r of
Cons
ulta
nts
from
H
DI G
roup
s th
at
Wor
k on
the
Proj
ect
Mai
nten
ance
of a
sset
regi
ster
and
ass
et v
erifi
catio
n8
13 M
onth
sR
368
871.
44R
35 2
37.4
020
%26
%7
Ana
lysi
s of
VO
C pa
ssiv
e am
bien
t air
qual
ity s
ampl
es
for t
he e
xten
ded
ambi
ent a
ir qu
ality
scr
eeni
ng
surv
ey2
-R
462
751.
40R
11 4
00.0
0N
/AN
/A1
Capa
city
-bui
ldin
g fo
r NEM
A E
IA R
egul
atio
ns1
2R
392
641.
40R
34 4
96.0
0N
/AN
/A0
Ener
gy c
onsu
ltant
to G
TZ p
rogr
amm
e1
N/A
R 40
7 74
5.00
R 21
712
.25
0%0%
0
Inte
rdep
artm
enta
l cla
im: B
uilt
Envi
ronm
ent S
uppo
rt
Prog
ram
me
N/A
N/A
-R
2 16
6 00
5.79
N/A
N/A
N/A
Hum
an R
ight
s m
ains
trea
min
g pl
an ro
ll-ou
t ses
sion
13
R 13
997
.00
R 13
997
.00
0%0%
0
Set u
p, o
pera
te a
nd m
aint
ain
thre
e am
bien
t Air
Qua
lity
mon
itorin
g st
atio
ns in
the
Wes
tern
Cap
e Pr
ovin
ce2
33R
1 53
6 10
6.47
R 52
0 25
3.23
0%0%
0
Com
pile
a s
yste
mat
ic b
iodi
vers
ity/la
nd-u
se p
lan
for
the
Cent
ral K
aroo
Dis
tric
t Mun
icip
ality
314
R 43
7 07
6.00
R 18
4 88
8.98
0%0%
0
Com
pile
a s
yste
mat
ic b
iodi
vers
ity p
lan
for t
he
mun
icip
aliti
es o
f Kan
nala
nd, O
udts
hoor
n, E
den
DM
A a
nd W
est C
oast
DM
A3
49R
149
616.
00R
149
616.
000%
0%0
Des
ign,
layo
ut, e
ditin
g an
d pr
intin
g of
ene
rgy
docu
men
ts1
2R
147
865.
84R
26 1
51.6
010
0%10
0%1
Revi
ew o
f EIA
app
licat
ions
and
app
eals
130
R 67
500
.00
R 67
500
.00
70%
70%
1
Dev
elop
a P
rovi
ncia
l Int
egra
ted
Was
te M
anag
emen
t Pl
an fo
r the
Wes
tern
Cap
e7
39R
1 03
0 37
8.00
R 22
367
.80
1%0%
0
Empl
oyee
Ass
ista
nce
Prog
ram
me
N/A
12 M
onth
sR
194
871.
60R
105
555.
4549
%57
%N
/A
WC
PSD
F: ru
ral l
and
use
plan
ning
and
man
agem
ent
guid
elin
es5
119
R 48
6 60
9.00
R 53
165
.00
100%
50%
2
Sust
aina
bilit
y Re
port
for t
he W
este
rn C
ape
236
R 68
4 00
0.00
R 17
1 00
0.00
0%0%
0
Verifi
catio
n of
qua
lifica
tions
and
iden
tity
docu
men
ts1
2 D
ays
R 5
429.
82R
5 42
9.82
42%
50%
1

170
PA
RT
5A n n u a l R e p o r t 2 0 0 9 / 1 0
Proj
ect
Title
Tota
l Num
ber o
f Co
nsul
tant
s w
ho
Wor
ked
on th
e Pr
ojec
t
Dur
atio
n:
Wor
king
Day
sCo
ntra
ct V
alue
Paym
ents
20
09/1
0 -
Vote
d Fu
nds
% O
wne
rshi
p by
H
DI G
roup
s%
Man
agem
ent
by H
DI G
roup
sN
umbe
r of
Cons
ulta
nts
from
H
DI G
roup
s th
at
Wor
k on
the
Proj
ect
Verifi
catio
n of
qua
lifica
tions
and
iden
tity
docu
men
ts1
2 D
ays
R 5
429.
82R
5 42
9.82
42%
50%
1
Verifi
catio
n of
qua
lifica
tions
and
iden
tity
docu
men
ts1
8 D
ays
R 17
326
.86
R 17
326
.86
100%
100%
1
Prov
ide
a se
rvic
e an
d ve
nue
incl
usiv
e of
cat
erin
g,
exhi
bitio
n sp
ace
and
equi
pmen
t to
host
a W
aste
M
inim
isat
ion
Sum
mit
on 3
-4 M
arch
201
0 to
st
imul
ate
the
recy
clin
g ec
onom
y
1N
/AR
288
146.
40R
315
519.
9210
0%10
0%1
Clim
ate
chan
ge c
apac
ity b
uild
ing
sess
ions
for
Wes
tern
Cap
e G
over
nmen
t offi
cial
s3
40R
253
908.
15R
110
325.
210%
0%2
Revi
ew o
f Pro
vinc
ial N
oise
Reg
ulat
ions
312
R 21
075
.75
R 21
075
.75
0%0%
0
Trai
ning
on
emer
genc
y re
spon
se a
nd c
lean
-up
mea
sure
s fo
r haz
ardo
us m
ater
ial s
pills
11
R 22
914
.00
R 22
914
.00
50%
50%
0
Com
pile
an
Envi
ronm
enta
l Man
agem
ent F
ram
ewor
k fo
r the
Dra
kens
tein
mun
icip
al a
rea
352
R 92
7 88
8.60
R 16
1 83
9.33
50%
50%
2
Com
pila
tion
of a
200
9/10
Sus
tain
able
Dev
elop
men
t Re
port
214
R283
290
.00
R 76
152
.00
50%
50%
3
Com
pile
an
Envi
ronm
enta
l Man
agem
ent F
ram
ewor
k fo
r the
Sal
danh
a M
unic
ipal
Are
a5
12R
1 41
8 21
7.00
R 29
8 03
4.14
50%
50%
0
Esta
blis
hmen
t and
man
agem
ent o
f a c
lean
de
velo
pmen
t mec
hani
sm d
esk
in th
e W
este
rn C
ape
and
impl
emen
tatio
n of
CD
M p
ilot p
roje
ct2
171
R 84
7 20
0.00
R 46
1 65
1.99
0%0%
0
Rem
uner
atio
ns p
ayab
le to
mem
bers
of t
he P
lann
ing
Advi
sory
Boa
rd7
6-
R 30
6 88
0.39
N/A
N/A
3
Revi
ew o
f EIA
app
licat
ions
and
app
eals
77
R 36
594
.00
R 36
594
.00
0%0%
2
Impl
emen
tatio
n of
C.A
.P.E
Land
-use
Pla
nnin
g Co
mpo
nent
9N
/A-
R 15
4 36
8.81
N/A
N/A
5
Reha
bilit
atio
n an
d ad
min
istr
atio
n fe
e fo
r a s
taff
mem
ber
11
Day
R 16
600
.00
R 16
600
.00
N/A
N/A
0
Trai
ning
edu
cato
rs th
roug
h th
e W
aste
Man
agem
ent
in E
duca
tion
(WA
ME)
Pro
gram
me
115
R 42
217
.50
R 42
217
.50
0%0%
0
Clim
ate
Chan
ge E
duca
tion
Prog
ram
me
1181
R 93
7 89
9.99
R 24
7 89
7.99
N/A
N/A
4

171
RE
SO
UR
CE
MA
NA
GE
ME
NT
H u m a n
Proj
ect
Title
Tota
l Num
ber o
f Co
nsul
tant
s w
ho
Wor
ked
on th
e Pr
ojec
t
Dur
atio
n:
Wor
king
Day
sCo
ntra
ct V
alue
Paym
ents
20
09/1
0 -
Vote
d Fu
nds
% O
wne
rshi
p by
H
DI G
roup
s%
Man
agem
ent
by H
DI G
roup
sN
umbe
r of
Cons
ulta
nts
from
H
DI G
roup
s th
at
Wor
k on
the
Proj
ect
Mai
nten
ance
, fur
ther
refin
emen
t and
enh
ance
men
t of
the
depa
rtm
enta
l int
egra
ted
web
-ena
bled
GIS
as
wel
l as
trai
n de
part
men
tal o
ffici
als
to fu
lfil t
he
func
tions
ther
eaft
er
823
R 22
0 00
0.00
R 22
0 00
0.00
N/A
N/A
6
Hea
lth ri
sk m
anag
er fo
r Env
ironm
enta
l Affa
irs a
nd
Dev
elop
men
t Pla
nnin
g1
12 M
onth
sR
140
000.
00R
28 2
03.4
210
0%10
0%0
Dra
ft a
n A
ir Q
ualit
y M
anag
emen
t Pla
n fo
r the
Pr
ovin
ce, c
ompi
le a
ir qu
ality
situ
atio
n as
sess
men
t an
d ga
p an
alys
is
510
6R
1 65
2 77
3.00
R 13
5 75
3.19
40%
40%
1
Dev
elop
men
t of a
mon
itorin
g an
d ev
alua
tion
syst
em fo
r the
Wes
tern
Cap
e cl
imat
e ch
ange
re
spon
se s
trat
egy
and
actio
n pl
an10
36R
417
532.
00R
387
307.
9832
%0%
1
Del
iver
a s
ea le
vel r
ise
and
flood
risk
ass
essm
ent f
or
a se
lect
dis
aste
r pro
ne a
rea
alon
g th
e W
este
rn C
ape
coas
t6
36R
431
883.
00R
225
215.
5532
%0%
1
Revi
ew a
nd u
pdat
e th
e 20
04 g
row
th p
oten
tial s
tudy
of
tow
ns4
61R
651
825.
00R
273
600.
00N
/AN
/A1
Dev
elop
and
test
a m
etho
dolo
gy fo
r defi
ning
and
ad
optin
g co
asta
l dev
elop
men
t set
back
line
s1
36R
448
610.
00R
448
610.
000%
0%0
Colle
ctio
n of
effl
uent
sam
ples
215
R 21
888
.00
R 21
888
.00
0%0%
2
