covid-19 school snapshot panel
TRANSCRIPT

COVID-19 School Snapshot Panel Findings from the May survey
July 2021
IFF Research Ltd

2
Contents
List of figures 4
Executive Summary 6
A note on the reporting 6
Pupil behaviour and attendance 6
Knife crime 7
Pupil mental health 7
School day 7
Education recovery 8
National Tutoring Programme (NTP) 8
Remote Education 9
Relationships, Sex and Health Education (RSHE) 9
Clinically Extremely Vulnerable (CEV) school staff 10
Operating in a COVID-secure way 10
Rapid Asymptomatic Testing 11
Introduction 12
Methodology 12
Weighting 13
Interpreting the findings 14
Pupil behaviour and attendance 15
Concerns regarding pupil behaviour and attendance (leaders) 15
Concerns regarding pupil behaviour and attendance (teachers) 17
Unauthorised pupil absence 18
Level of disruptive behaviour in the classroom 20
Types of disruptive behaviour occurring in the classroom 20
Knife Crime 23
Pupil mental health 25
School day 27
Number of lessons taught 27
The school day for year 3 pupils 28

3
The school day for year 9 pupils 28
Education recovery 30
Small group tuition 31
National Tutoring Programme 34
Participation in the NTP 34
Reasons for not participating in the NTP 36
Remote education 38
Relationships, Sex and Health Education (RSHE) 41
Clinically Extremely Vulnerable (CEV) school staff 46
Staff considered to be clinically extremely vulnerable (CEV) 46
CEV staff returning to work 47
Reasons CEV staff had not physically returned to work 48
Operating in a COVID-19-secure way 50
Pupil bubbles 52
COVID-19 vaccination 52
Impact on breakfast/after school clubs 53
Rapid Asymptomatic Testing 55

4
List of figures Figure 1. Leaders’ concerns this term regarding behaviour and attendance ................... 16
Figure 2. Teachers’ concerns this term regarding pupil behaviour and attendance ......... 17
Figure 3. Level of disruptive behaviour reported by teachers on their most recent day of teaching ........................................................................................................................... 20
Figure 4. Frequency of the following types of disruptive behaviour in teachers’ most recent day of teaching...................................................................................................... 21
Figure 5. Number of safeguarding incidents involving knife crime that schools are actively dealing with per 1,000 pupils ........................................................................................... 24
Figure 6. Whether staff have received new or additional training on pupil mental health since September .............................................................................................................. 25
Figure 7. Number of lessons taught on most recent day of teaching, by school phase ... 27
Figure 8. Lunch and other breaks for Year 3 pupils before and after COVID ................... 28
Figure 9. Lunch and other breaks for Year 9 pupils before and after COVID ................... 29
Figure 10. Since schools reopened, to what extent have teachers had to make changes to the content they would normally teach ......................................................................... 30
Figure 11. Why teachers had changed the content of what they teach ........................... 31
Figure 12. Suitable for delivering small group tuition ....................................................... 32
Figure 13. Whether schools had applied to participate in the National Tutoring Programme, by school phase .......................................................................................... 35
Figure 14. Reason for not participating in the NTP, by school phase .............................. 37
Figure 15. The minimum hours of work set per day over the last week for pupils in primary school not attending in-person ............................................................................ 39
Figure 16. The minimum hours of work set per day over the last week for pupils in secondary school not attending in-person ....................................................................... 40
Figure 17. Proportion of teachers who personally teach each strand of RSHE ............... 42
Figure 18. Confidence in teaching each strand of RSHE ................................................. 43

5
Figure 19. Extent to which different aspects of RSHE will be covered by the end of this academic year ................................................................................................................. 44

6
Executive Summary This report presents findings from the fifth wave of the School Snapshot Panel (run in May 2021). It covers a range of key issues affecting schools during the COVID-19 pandemic, such as education recovery, pupil behaviour and mental health, summarised in the following sections.
A note on the reporting
The report covers questions asked about the individual experiences of teachers and leaders, and others asked of leaders at the school level. Because of this, two types of weighting were applied to the data depending on whether questions were asking for school-level or individual-level answers from leaders and teachers. Where responses from ‘leaders’, ‘teachers’ or ‘leaders and teachers’ are referred to in the report, individual-level weighting has been applied. Where responses from ‘schools’ are referred to, leaders have answered the survey question and a school-level weighting has been applied. Further detail on the weighting approach can be found in the methodology section.
Findings from each wave should be interpreted in the context of guidelines in place at that time. From 8th March 2021, schools were fully reopened to all children, and the survey explored the experiences of school leaders and teachers since the reopening.
Caution should be taken when comparing results between waves as any changes and patterns may be impacted by the guidelines in place at each timepoint.
Pupil behaviour and attendance
Leaders and teachers were asked about their level of concern regarding increased behaviour issues, disengagement from learning, and pupil attendance due to authorised and unauthorised absence. Most leaders were concerned about each aspect, with at least two-thirds (68%) concerned with each to at least a small extent. They were most concerned about increase in behavioural issues and pupil disengagement from learning (13% and 10% respectively were concerned about these aspects to a great extent).
As with leaders, teachers were most likely to be concerned about disengagement from learning and an increase in behaviour issues, although levels of concern expressed by teachers were significantly higher than leaders. Nearly nine-in-ten (87%) teachers were concerned about pupil disengagement from learning at least to a small extent, and a quarter (25%) to a great extent, while 80% were concerned at least to a small extent and 21% to a great extent about an increase in behaviour issues.

7
Schools were also asked an open-text question about what, if any, reasons for unauthorised pupil absence they find most concerning. Key themes emerging included pupils taking holidays during term time and a disengagement from school and the usual routine of attending.
The survey also asked about teachers’ views on pupil behaviour in their classroom on the most recent day of teaching. Four-in-five (80%) teachers experienced at least some disruptive behaviour on the most recent day of teaching, although they were considerably more likely to report some (68%) than lots (12%) of disruptive behaviour. The most common form of disruptive behaviour was pupils chatting when they were not supposed to (36% of teachers reported this had occurred frequently during their most recent day of teaching).
Knife crime
Schools were asked whether knife crime is an issue that they are currently actively dealing with. The vast majority of schools (86%) were not currently dealing with any knife crime related safeguarding issues. Secondary schools were far more likely to report dealing with knife crime (38%) than primary (8%). Secondary schools indicated that they were dealing with incidents at an average rate of 1 incident per 1,000 pupils.
Pupil mental health
Pupil mental health and wellbeing is an ongoing priority for the Department for Education. The pandemic and associated lockdown measures have affected children and young people’s mental health and wellbeing in a variety of ways.
Leaders were asked whether staff in their school had received any new or additional training on pupil mental health since September 2020. The majority of schools (80%) reported that some or all of their staff had received additional training on pupil mental health. This is significantly higher than when the question was previously asked in late February 2021 (76%). As in February, it was also more common for schools to say they had not received new or additional training but would have welcomed it (13% of all schools) than for schools to report their staff did not require such training (5%).
School day
On their most recent day of teaching, teachers typically taught between three and six lessons (89% reported this), with the average number of lessons taught being five for primary teachers and four for secondary teachers.

8
Schools were asked how long pupils in year 3 and year 9 were given for lunch and other breaks1 before the COVID-19 pandemic (March 2020), and currently. Primary schools gave year 3 pupils on average 54 minutes for lunch break and 19 minutes for the sum total of other breaks, whereas secondary schools gave year 9 pupils an average 38-minute lunch break and 20 minutes of other breaks. Although slight variation was seen (the average lunch break being slightly shorter), results showed that the length of time given for lunch and other breaks remained largely unchanged since before the pandemic.
Education recovery
Teachers were asked to what extent, if at all, they had to make changes to the content they would normally teach following the return to in-person learning on 8th March. A quarter of all teachers reported that they had to make changes to a large extent. Only around one-in-twenty (6%) said that they did not have to make any changes at all.
Of those teachers who had had to make changes to at least to some extent, going over key concepts was the most common reason why they changed (79%), followed by addressing pupil misunderstandings (68%) and working around challenges accessing classrooms with suitable equipment for practical lessons (46%).
Schools were asked to what extent they thought pupils at their school would benefit from small group tuition2 to help recover on any lost learning. Around four-in-five schools (82%) felt that pupils would benefit from small group tuition at least some extent, with 36% saying they would benefit to a large extent. Most schools (82%) felt that, if training and funding were provided, teachers permanently employed by the school would be most suitable to deliver this; and a majority felt the same about delivery by teaching assistants (69%), and former teachers who have retired or left the profession but were known to the school (53%).
National Tutoring Programme (NTP)
The National Tutoring Programme (NTP) provides additional, targeted support for pupils who need the most help. It has two pillars:
• Approved Tuition Partners offer high quality, subsidised tuition to schools; and
• Schools in the most disadvantaged areas are supported to employ in-house Academic Mentors.
Schools were asked about their participation in the NTP. One-third (33%) had applied to participate, with this more likely amongst secondary schools than primary (49% vs. 30%).
1 When calculating time for other breaks, leaders were asked to sum time across all other breaks during the school day, but exclude school assemblies, form/registration and transition time. 2 Small group tuition refers to tutoring delivered at a maximum ratio of one tutor to three pupils.

9
A further15% of schools were considering participating. Over two-fifths had not applied and were not considering it (43%). The most common reason for this was a preference for using staff known to the school or pupils (86%), followed by concern about whether the programme represented value for money (38%).
Remote Education
Primary school teachers reported that on average in the past week pupils in key stages 1 and 2 who were currently learning from home were being set a minimum of three hours of work per day.
One quarter of teachers (25%) said a minimum of three or more hours of work is set for pupils in key stage 1 who were not attending in-person. Two-thirds (66%) of teachers do not know how much work is being set for pupils in key stage 1. Similarly, in key stage 2, 27% of teachers reported that a minimum of four hours of work is set, but over half do not know (56%). These figures relate to primary school teachers who teach that particular key stage and had pupils who were not in attendance at schools.
For secondary school pupils, teachers reported the average minimum number of hours of work set per day over the past week was four hours for both key stages 3 and 4.
Around a third (35%) of secondary school teachers who teach in key stage 3 said that pupils in this group who were not attending in-person were set five or more hours of work per day. For key stage 4, 39% reported this number of hours. Similar to their primary school counterparts, a substantial proportion of secondary teachers do not know how much work was set for pupils not attending their school physically (46% for pupils in key stage 3, 47% in key stage 4). Likewise, these figures relate to secondary teachers who teach that particular key stage and had pupils who were not in attendance at schools.3
Relationships, Sex and Health Education (RSHE)
Teachers were more likely to be confident in delivering health education (93%) than relationships education (89%). For both of these strands of RSHE, primary school teachers were more likely to be confident than secondary school teachers (91% vs. 84% for relationships education and 96% vs. 85% for health education).
When asked to what extent the aspects of RSHE will be covered by the end of this academic year, 86% of teachers in primary schools who teach one or more aspects of
3 Please note that the question was asked of all teachers, with respondents able to select that they do not teach the key stage in question, or that all pupils in the key stage are attending school. Pupils not attending school may include pupils who are staying at home due to illness, for example, and would therefore not be expected or required to have remote education provision. Further, teachers may not have felt able to estimate the hours set by other teachers at their school at each Key Stage. These factors may have contributed to the high proportion of “don’t know” responses.

10
the subject thought that ‘respectful relationships’ will be mostly or fully covered. This is significantly higher than reported by secondary school teachers (74%). Similarly, on the aspect of ‘being safe’, around nine in ten primary school teachers reported that this topic will be mostly or fully covered (88%), higher than found among secondary school teachers (74%).
Teachers who reported that a specific aspect of RSHE would be ‘slightly’ or ‘not at all’ covered in the current academic year were asked whether they plan to cover these areas early in the 2021/2022 school year. Half (50%) of these teachers planned to cover ‘mental wellbeing’ early in the next academic year; the figure was slightly lower for covering ‘respectful relationships’ (40%) and ‘being safe’ (43%). Few said they did not plan to cover these aspects early in the next academic year, around half were unsure (ranging from 48% unsure if they will teach mental wellbeing to 56% unsure if they will teach respectful relationships).
Clinically Extremely Vulnerable (CEV) school staff
Workforce absence has been an ongoing concern throughout the most recent academic year. Prior to 31st March, a proportion of workforce absence was due to clinically extremely vulnerable (CEV) staff shielding. Therefore, it is important to ask questions regarding the proportion of CEV staff returning to settings following the lifting of shielding in order to determine if there are confidence issues leading to continued staff absence.
Schools were asked about the number of staff in their school that they considered to be CEV, and the proportion that had returned to school since shielding was lifted on 31st March. Most schools reported that at least one member of teaching or non-teaching staff was considered to be CEV (only 26% reported that none were). Across all schools the mean number of CEV staff was two, with the average higher among secondary schools (three) than primary schools (two).
On average, across all schools, 91% of CEV staff had returned to work since shielding was lifted on 31st March. For the minority (20%) of schools that reported at least some of their CEV staff had not physically returned to work, the most common reasons were health issues unrelated to COVID-19, and conflicting advice regarding shielding, for example from doctors or consultants.
Operating in a COVID-secure way
Schools were asked to indicate in an open-text question the biggest challenges in terms of operating in a COVID-19 secure way for pupils and staff. The most commonly reported challenge was implementing social distancing and maintaining class bubbles particularly amongst schools that said they already have limited space and resources.
11
Schools were asked what size their pupil bubbles are on average. Most primary schools (65%) reported that their pupil bubbles included 21-50 pupils, whereas half (50%) of secondary schools reported bubble sizes of 101-200 pupils.
Schools were also asked how, if at all, their implementation of COVID-19 safety measures had affected their ability to run breakfast or after school clubs this term. Schools most commonly reported that they had had to cancel clubs (40%) or reduce the number of places available (33%). One-in-five (20%) reported COVID-19 safety measures had not had any impact on their breakfast or after school clubs. This was significantly higher for primary schools (22%) compared to secondary schools (8%).
Leaders and teachers were asked whether or not they have been vaccinated against COVID-19. In total, 69% of all leaders and teachers had received at least one dose of the COVID-19 vaccine. Amongst those who had not yet been vaccinated, the vast majority (87%) said that they were fairly or very likely to have the vaccine if offered.
Rapid Asymptomatic Testing
Secondary leaders and teachers were asked how important they felt regular COVID-19 testing of pupils was to effective on-site schooling at present. Overall, more than half (54%) of secondary leaders and teachers felt testing to be very important, a significant decrease compared to when the same question was asked in April 2021 (60%).
Teachers were also asked how important they felt COVID-19 testing of staff was to effective schooling at present. More than half reported it to be very important (54%), and 85% reported it to be at least fairly important. This is significantly fewer than when the same question was asked in April 2021, when 61% of teachers reported that testing of staff was very important.
In an open-text question, leaders and teachers who indicated that testing of pupils and/or staff was not very or not at all important were asked to explain further why they felt this. The findings mirror those of the April survey, with key concerns being around the difficulty of ensuring compliance with testing, and doubts about accuracy of the tests.

12
Introduction This report details findings from the May 2021 wave of the School Snapshot Panel, a panel of leaders and teachers sampled from the Schools Workforce Census to provide rapid feedback to the Department for Education.
In this report there is occasional reference to findings from previous School Snapshot Surveys (including the COVID-19 School Snapshot Survey run in May 2020). Due to differences in methodology between the School Snapshot Survey and the School Snapshot Panel, direct comparisons should be treated with caution.4
Methodology The School Snapshot Panel consists of a group of teachers and leaders that have agreed to participate in short regular research surveys on topical issues in education. Teachers and leaders agreed to be part of the panel in late 2020 and early 2021. They were recruited from School Workforce Census data provided by the Department for Education. One leader from each chosen school was invited to take part. Teachers were selected from the full population of teachers, meaning at some schools multiple teachers were invited to participate.
The survey was administered online, with the fieldwork lasting from 12th May to 19th May 2021. Leaders and teachers received an email invite and two reminder emails.
The tables below show the response rate for the survey for leaders and teachers by school phase, for the May survey.
4 The School Snapshot Survey was administered to one leader and three teachers at each school sampled, whereas the School Snapshot Panel is a randomised sample of leaders and teachers taken from the Schools Workforce Census. Therefore, teachers are invited from schools that may not have been sampled for a leader survey.

13
Table 1. Response rate by key group
Primary Leaders
Secondary Leaders
Primary Teachers
Secondary Teachers
Starting sample 1,397 861 1,134 1,090
Complete surveys
662 351 527 527
Response rate 47% 41% 46% 48%
Weighting Two types of weighting were applied to the data, depending on whether questions were asking for school-level or individual-level answers from leaders and teachers.
School-level weighting
At the analysis stage, the school-level/leaders’ data was grossed up to the overall popu-lation of schools. This process corrects for the over-sampling of secondary schools (rela-tive to the proportion of the population that they represent) so that the findings can be in-terpreted as being representative of all (in scope) state-funded schools.5
The population data for weighting was drawn from Get Information about Schools (GIAS).
Teachers / individual weighting
For the analysis on a teacher rather than a school base, the responses from leaders and classroom teachers were combined and weighted together to the overall population of teachers. The population data for the teachers weighting was taken from the Schools Workforce Census based on November 2019 data (the most current available data).
5 Note that no responses were received from secondary studio schools in the May wave, therefore responses are representative of all in scope state-funded schools excluding secondary studio schools (secondary studio schools comprise 0.1% of the total school population).

14
Interpreting the findings Data presented in this report is from a sample of teachers and senior leaders rather than the total population of teachers and leaders. Although the leader sample and the teacher sample have been weighted to be nationally representative (by school type and by teacher demographics), the data is still subject to sampling error. The extent of sampling error depends on the sampling approach (the closer it is to a random sample the less the sampling error), the sample size (the larger the sample the lower the likely sampling error) and the survey result (the closer to 50% the less confident statistically we are in the finding).
Given the sample size in this survey (2,067), statistically we can be 95% confident that for a survey finding of 50% based on all respondents, the ‘true’ value (if all leaders and teachers had answered rather than a sample of 2,067) lies within a +/- 2.2% range of this figure (i.e. 47.8% - 52.2%). Results based on a sub-set of schools interviewed are subject to a wider margin of error. For example, for results among school leaders, we can be 95% confident that for a survey result of 50% the sampling error is +/- 3.1%.
Differences between sub-groups and previous waves are only commented on in the text if they are statistically significant at the 95% confidence level, unless otherwise stated, i.e. statistically we can be 95% confident that the differences are ‘real’ differences andnot a result of the fact that the findings are based on a sample of schools rather than acensus of all schools.
Free School Meal (FSM) entitlement is used as a proxy for deprivation levels at the school. All schools in England were listed in ascending order of the proportion of their pupils that are entitled to FSM. This ordered list was then split into five equal groups (or quintiles). Quintile 1, which is referred to as the ‘lowest proportion’ throughout the report represents the schools with the lowest proportion of pupils entitled to FSM. This group thus equates to the schools with the least disadvantaged/deprived pupil population. The proportion of pupils entitled to FSM increases progressively as the quintiles increase. In the report, significant differences tend to be tested between schools with the lowest proportion of pupils eligible for FSM and schools with the highest proportion of pupils eligible for FSM.
Due to rounding to the nearest whole number, percentages may not total to exactly 100% or precisely reflect statistics provided in the data tables.
In this report there is occasional reference to findings from previous School Snapshot Surveys (including the COVID-19 School Snapshot Survey run in May 2020). It should be noted that due to differences in methodology between the School Snapshot Survey and the School Snapshot Panel, direct comparisons should be treated with caution.

15
Pupil behaviour and attendance This section of the report looks at leaders’ and teachers’ concerns about aspects of school attendance since the wider opening of schools this term. Understanding concerns related to attendance and engagement is a priority for DfE and will inform guidance and best practice products for schools and local authorities, and policy development during the medium-term COVID-recovery period.
It also covers teachers’ views on pupil behaviour in their classroom on their most recent day of teaching. It looks at:
• The number of classes taught by teachers on their most recent day of teaching;
• The level of disruptive behaviour they had experienced in their classes on that day; and
• The frequency of different types of low-level disruption in their classes on that day.
Concerns regarding pupil behaviour and attendance (leaders) Leaders were asked how concerned they were with disengagement from learning, an increase in behavioural issues, and pupil attendance (both authorised and unauthorised absence). Over 70% of leaders were concerned with each to at least a small extent, and on each around one in ten were concerned to a great extent. They were most concerned about an increase in behaviour issues (14% were concerned to a great extent, a further 32% to some extent).

16
Figure 1. Leaders’ concerns this term regarding behaviour and attendance
Source: School Snapshot Panel, May 2021 survey. C1: All leaders (n=1,013).
Secondary leaders were significantly more likely than primary leaders to be concerned to a great extent about all areas of behaviour and attendance asked about. The difference was most notable for pupil attendance due to authorised absence, where 14% of secondary leaders were concerned to a great extent compared with 5% of primary leaders. A very similar question was asked in the March 2021 survey, when there was no significant difference in the proportion concerned to a great extent between primary and secondary leaders.
Leaders at schools with the highest proportion of pupils eligible for FSM were significantly more likely than those with the lowest proportion to be concerned to a great extent about:
• Pupil attendance due to authorised absence (18% vs. 4%);
• Pupil attendance due to unauthorised absence (27% vs. 5%); and
• Disengagement from learning (16% vs. 6%).
This exactly mirrors the findings from March 2021, when leaders at schools with the highest proportion of pupils eligible for FSM were significantly more likely than those with the lowest proportion to be concerned by all areas explored to a great extent.
In addition to the March 2021 survey, a similar question6 was asked throughout the DfE School Snapshot Panel surveys in 2020. Comparisons between the datasets highlight
6 Areas of concern have varied, covering a range including: Teacher absence; Pupil attendance due to authorised absence (e.g. due to illness or following public health advice); Pupil attendance due to
11%
14%
12%
8%
31%
32%
26%
30%
38%
33%
35%
33%
19%
21%
27%
28%
Disengagement from learning
Increase in behaviour issues
Pupil attendance due tounauthorised absence
Pupil attendance due to authorisedabsence (e.g. due to illness orfollowing public health advice)
A great extent Some extent A small extent Not at all Don't know
To any extent
81%
73%
71%
79%
Schools May 2021

17
key changes in leaders’ concerns over time. Concern has generally decreased over time, with those concerned to a great extent about the following aspects of attendance significantly decreasing since the December 2020 survey:
• Pupil attendance due to authorised absence (down from 37% in December 2020, to 9% in March 2021, to 8% in May 2021).
• Pupil attendance due to unauthorised absence (down from 19% in December 2020, to 9% in March 2021, to 12% in May 2021).
Concerns regarding pupil behaviour and attendance (teachers) As with leaders, teachers were most likely to be concerned about disengagement from learning and an increase in behaviour issues, although levels of concern expressed by teachers were significantly higher than leaders. Nearly nine-in-ten (87%) teachers were concerned at least to a small extent, and a quarter (25%) to a great extent, about pupil disengagement from learning, while 80% were concerned at least to a small extent and 21% to a great extent about an increase in behaviour issues (see Figure 2).
Figure 2. Teachers’ concerns this term regarding pupil behaviour and attendance
unauthorised absence; Pupils' home to school transport; Availability of PPE; Funding; Ensuring appropriate social distancing for staff and pupils; Increase in behaviour issues; Disengagement from learning; Providing remote education for pupils unable to attend school (e.g. due to further lockdown or pupils self-isolating); Offering appropriate mental health support for pupils, including those who have experienced trauma or bereavement as a result of COVID-19; Access to specialist services (e.g. CAMHS, Children's Social Care Services or educational psychology services); and Staff wellbeing.
25%
21%
8%
11%
33%
31%
27%
26%
29%
28%
32%
28%
13%
19%
32%
34%
Disengagement from learning
Increase in behaviour issues
Pupil attendance due to authorisedabsence (e.g. due to illness orfollowing public health advice)
Pupil attendance due tounauthorised absence
A great extent Some extent A small extent Not at all Don't know
87%
67%
65%
80%
Teachers May 2021

18
Source: School Snapshot Panel, May 2021 survey. C1: All teachers (n=1,054).
As with leaders, secondary teachers were significantly more likely than primary teachers to be concerned to a great extent about all of the aspects of pupil attendance and behaviour covered. Most notably, over one third (36%) of secondary teachers were greatly concerned about disengagement from learning, compared with 15% of primary teachers.
Differences by eligibility for FSM reflected the leader results, with teachers based at schools with the highest proportion of pupils eligible for FSM more likely to be concerned to a great extent about three out of the four areas covered in the survey:
• Increase in behaviour issues (23%, compared with 13% of teachers at schools with the lowest proportion of pupils eligible for FSM);
• Pupil attendance due to authorised absence (12% vs. 6%); and
• Pupil attendance due to unauthorised absence (15% vs. 4%).
As with leaders, teachers were generally less concerned about aspects of school attendance than they had been previously for the School Snapshot Panel surveys conducted in 2020. This was particularly so for:
• Pupil attendance due to authorised absence, where the proportion of teachers concerned to a great extent has fallen significantly from 41% in December 2020, to 16% in March 2021, to 8% in May 2021; and
• Pupil attendance due to unauthorised absence, which has decreased significantly from 18% in December 2020, to 12% in March 2021, to 11% in May 2021.
As with leaders, concern about disengagement from learning increased significantly from December 2020 (when 21% were concerned to a great extent) to March 2021 (34%) but has fallen to 25% in May 2021. It should be noted that this was still the aspect of attendance that teachers were most likely to be concerned about.
Due to differences in the methodologies and question wording between the surveys, differences should be treated with caution.
Unauthorised pupil absence In May 2021, schools were asked an open-text question about what, if any, reasons for unauthorised pupil absence they find most concerning.

19
Holidays
Of the themes emerging, the most frequently reported concern related to pupils taking holidays during term time. Some families who missed out on holidays booked during the pandemic were rescheduling them outside of school holidays due to issues around cost and availability. This was a particular concern because pupils have already missed out on a lot of teaching over the past year.
“Holidays that have been re-booked in term time as they were missed due to Covid last year and parents concerned that they are losing their money if they do not take them.”
Leader, primary school
“Parents who haven't been able to take their family on holiday are beginning to book holidays in school time due to costs and availability. Children have missed enough school, they shouldn't be missing more.”
Leader, primary school
Disengagement from routine
Parent and pupil disengagement from school and the usual routine was also cited as a common concern. This included a general feeling that attendance is not seen as important by parents or pupils.
“There appears to be a lethargy about attending school as it has been okay not to attend during the lockdown. The importance of school and attending seems to have been diluted.”
Leader, primary school
“Small number of Year 11 students who are disengaged from learning and from the assessment process, and so are reluctant to attend.”
Leader, secondary school
Anxiety around the pandemic and other mental health concerns
Another aspect of unauthorised pupil absence that schools found concerning related to anxiety and mental health, including continued pupil and parent anxiety related to COVID-19, but also an increase in mental health issues more generally.
“Absence linked to anxiety over coming into school after time off where we feel that it is being used as an excuse for parents to not send children to school. Most of these parents have attendance concerns in the past but the lockdown has reset this and gains have been lost.”
20
Leader, secondary school
“Anxieties are becoming increasingly common with pupils electing to refuse to come to school.”
Leader, secondary school
Level of disruptive behaviour in the classroom
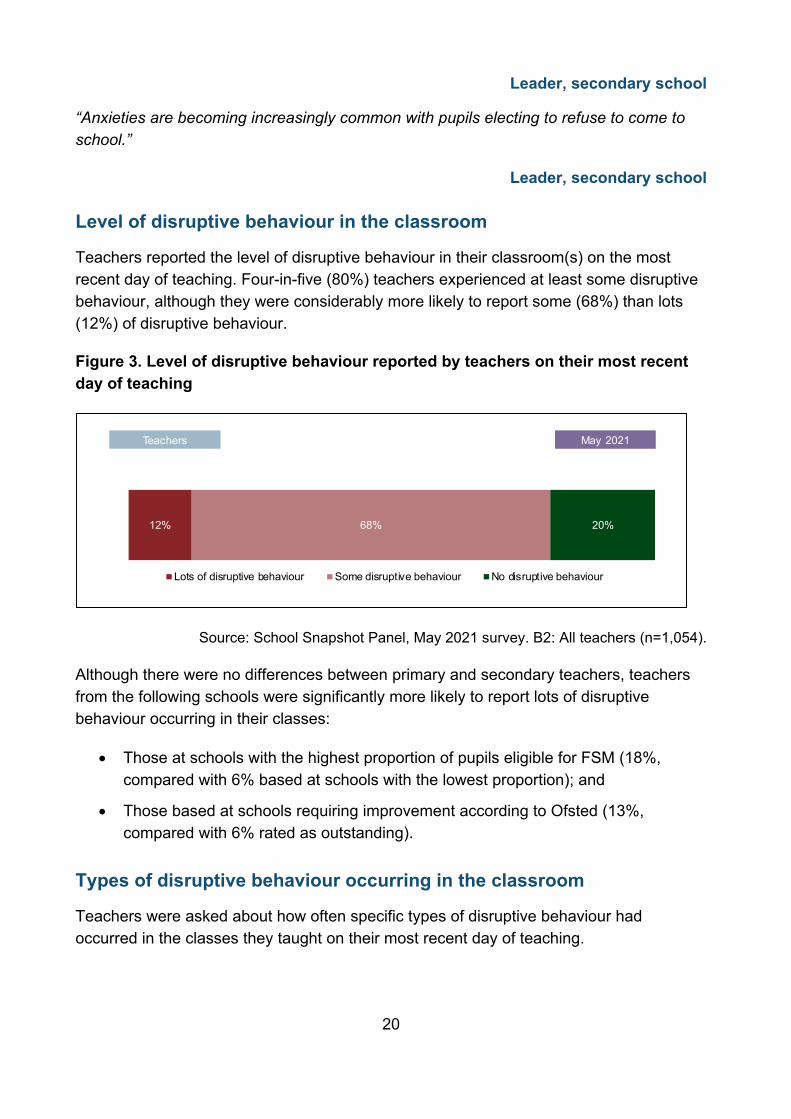
Teachers reported the level of disruptive behaviour in their classroom(s) on the most recent day of teaching. Four-in-five (80%) teachers experienced at least some disruptive behaviour, although they were considerably more likely to report some (68%) than lots (12%) of disruptive behaviour.
Figure 3. Level of disruptive behaviour reported by teachers on their most recent day of teaching
Source: School Snapshot Panel, May 2021 survey. B2: All teachers (n=1,054).
Although there were no differences between primary and secondary teachers, teachers from the following schools were significantly more likely to report lots of disruptive behaviour occurring in their classes:
• Those at schools with the highest proportion of pupils eligible for FSM (18%, compared with 6% based at schools with the lowest proportion); and
• Those based at schools requiring improvement according to Ofsted (13%, compared with 6% rated as outstanding).
Types of disruptive behaviour occurring in the classroom
Teachers were asked about how often specific types of disruptive behaviour had occurred in the classes they taught on their most recent day of teaching.
12% 68% 20%
Lots of disruptive behaviour Some disruptive behaviour No disruptive behaviour
Teachers May 2021

21
The most common form of disruptive behaviour was pupils chatting when they were not supposed to (36% of teachers reported this had occurred frequently during their most recent day of teaching). Pupils shouting out was the other relatively common form of disruptive behaviour (18% reported this had occurred frequently).
By contrast, a quarter of teachers reported that pupils throwing things in the classroom had occurred frequently (2%) or sometimes (23%). Just over a fifth reported that use of mobile phone had occurred frequently (5%) or sometimes (18%) during their most recent day of teaching.
Figure 4. Frequency of the following types of disruptive behaviour in teachers’ most recent day of teaching
Source: School Snapshot Panel, May 2021 survey. B3: All teachers (n=1,054).
Certain types of disruptive behaviour were more prevalent in different education settings.
While primary teachers were significantly more likely to report that pupils shouting out occurred in the classes frequently or sometimes (83%) than secondary teachers (69%), secondary teachers were significantly more likely to report the following occurred frequently or sometimes:
• Pupil(s) throwing things (28% vs. 21% of primary teachers)
• Pupil(s) answering back or challenging instructions (55% vs. 40%) and
• Pupil(s) using mobile devices when not supposed to (47% vs <1%).
36%
18%
8%
2%
5%
61%
59%
40%
23%
18%
3%
23%
51%
74%
58%
1%
1%
1%
19%
Pupils chatting when not supposedto
Pupil(s) shouting out
Pupil(s) answering back orchallenging instructions
Pupil(s) throwing things (non-aggressive)
Pupil(s) using mobile devices whennot supposed to
Frequently Sometimes Never Don't know / Not applicable
97%
76%
48%
At all
25%
23%
Teachers May 2021

22
When teachers were asked about other types of disruptive behaviour, most said that no other types of disruption had occurred in their classroom. Of those that did describe other types of disruptive behaviour, the most common theme was pupil(s) fiddling or fidgeting. This comprised a range of habits, from note passing to playing with face coverings and rocking on classroom chairs. This theme was more commonly reported by primary than secondary teachers.

23
Knife Crime There has been concern that knife crime incidents would rise following the easing of COVID-19 related restrictions. As schools are uniquely placed to understand the prevalence of these issues for their pupils, this question has been asked in order to track any trends in knife incidences involving school pupils.
In May 2021, 13% of schools were currently dealing with knife crime related safeguarding issues. Schools with the following characteristics were significantly more likely to be dealing with knife crime as a safeguarding issue:
• Secondary schools (38%, compared with 8% of primary schools);
• Schools with the highest proportion of pupils eligible for FSM (22%, compared with 7% of schools with the lowest proportion of pupils eligible for FSM);
• Urban schools7 (16%, compared with 3% of rural schools); and
• Schools in London (29%, compared with 13% of schools on average across regions).
Amongst the minority of schools that were currently dealing with a knife crime safeguarding issue, most (63%) reported they were actively dealing with a single incident. Less than one per cent of schools actively dealing with knife crime were dealing with five or more incidents. Amongst schools actively dealing with knife crime, the mean number of incidents was 1.3. It should be noted that almost a quarter (24%) of schools actively dealing with knife crime did not know how many incidents they were dealing with.
The majority of schools (86%) were currently not dealing with any safeguarding incidents involving knife crime, although this figure is lower for secondary schools (57%) than primary (92%). Taken as a proportion of all pupils in the school, less than 1% of all schools reported they were dealing with more than 10 incidents per 1,000 pupils. Schools with the following characteristics were not only more likely to be dealing with knife crime but reported more incidents as a proportion of all pupils in the school:
• Secondary schools were dealing with an average of 1 incident per 1,000 pupils, compared with 0 per 1,000 pupils in primary schools
• Schools with the highest proportion of pupils eligible for FSM were dealing with an average of 1 incident per 1,000 pupils, compared with 0 per 1,000 pupils in schools with the lowest proportion of pupils eligible for FSM
7 https://www.gov.uk/government/collections/rural-urban-classification

24
Figure 5. Number of safeguarding incidents involving knife crime that schools are actively dealing with per 1,000 pupils
Source: School Snapshot Panel, May 2021 survey. I2: All leaders (n=1,013)
86%
92%*
57%
1%
9%
2%
1%
9%
3%
3%
5%
1%
1%
1%
1%
1%
1%
4%
2%
18%
All
Primary
Secondary
0 Less than 1 1-1.9 2-2.9 3-3.9 4-9.9 Don't know
Mean average
0
0
1
May 2021Schools

25
Pupil mental health Pupil mental health and wellbeing is an ongoing priority for the Department for Education. The pandemic and associated lockdown measures have affected children and young people’s mental health and wellbeing in a variety of ways as a result of less contact with friends, less access to supportive adults and less structure and routine. School staff being knowledgeable and prepared to identify and respond to emerging needs as pupils return to school is key to supporting their recovery. During the COVID-19 pandemic, the DfE introduced a new £8m initiative called Wellbeing for Education Return, which helped local areas to provide training and support to schools and colleges to help them promote wellbeing and good mental health, identify emerging issues and access additional support where required.
Leaders were asked whether staff in their school had received any new or additional training on pupil mental health since September 2020. The majority of schools (80%) reported that some or all of their staff had received new or additional training on pupil mental health. This was significantly higher than when the question was previously asked in late February of this year (76%). It was also more common for schools to say they would have welcomed such training (13%) than for them to feel staff did not require such training (5%); these figures are little changed from February (14% and 5% respectively).
Figure 6. Whether staff have received new or additional training on pupil mental health since September
80%*
13%
5%
1%
1%
76%
14%
5%
1%
4%
Yes, some or all staff have received additionaltraining
No, I would have welcomed new or additionaltraining for staff, but there was no training
available to my school
No, staff don't require additional training
No, there was training available to my schoolbut we did not take it up
Don't knowMay 2021
Late Feb 2021
No: 19% May 202120% Late Feb 2021
Late Feb 2021May 2021Schools

26
Source: School Snapshot Panel, May 2021 survey. G1: All Leaders (n=1,013). Late February 2021 survey. G1: All Leaders (n=1,178). * Indicates a statistically significant differences between
the May 2021 and Late February 2021 surveys.
27
School day A number of questions were asked about the school day. Teachers were asked about the number of lessons they taught per day and schools were asked how long pupils in year 3 and year 98 were given for lunch and other breaks9 before the COVID-19 pandemic (March 2020) and now.
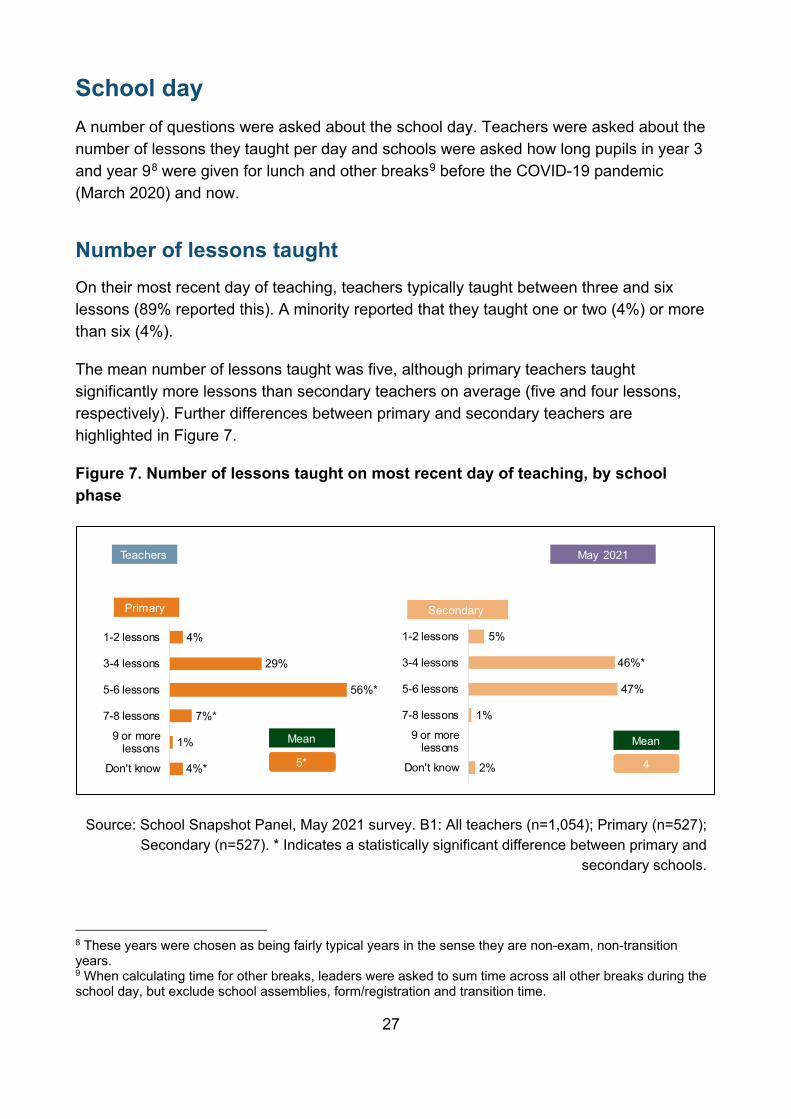
Number of lessons taught On their most recent day of teaching, teachers typically taught between three and six lessons (89% reported this). A minority reported that they taught one or two (4%) or more than six (4%).
The mean number of lessons taught was five, although primary teachers taught significantly more lessons than secondary teachers on average (five and four lessons, respectively). Further differences between primary and secondary teachers are highlighted in Figure 7.
Figure 7. Number of lessons taught on most recent day of teaching, by school phase
Source: School Snapshot Panel, May 2021 survey. B1: All teachers (n=1,054); Primary (n=527); Secondary (n=527). * Indicates a statistically significant difference between primary and
secondary schools.
8 These years were chosen as being fairly typical years in the sense they are non-exam, non-transition years. 9 When calculating time for other breaks, leaders were asked to sum time across all other breaks during the school day, but exclude school assemblies, form/registration and transition time.
2%
1%
47%
46%*
5%
Don't know
9 or morelessons
7-8 lessons
5-6 lessons
3-4 lessons
1-2 lessons
Secondary
Teachers
4%*
1%
7%*
56%*
29%
4%
Don't know
9 or morelessons
7-8 lessons
5-6 lessons
3-4 lessons
1-2 lessons
Primary
5*
Mean
4
Mean
May 2021

28
The school day for year 3 pupils
Amongst schools who taught year 3 pupils, the average lunch break was 56 minutes before COVID-19 and 54 mins currently. As shown in figure 10 there was a slight decrease in the proportion of primary schools giving lunch breaks of 46 – 60 minutes (from 82% to 70%) and an increase in schools giving a lunch break of 31 – 45 minutes (from 13% to 22%) compared to before COVID-19.
In contrast, there was a slightly increase in the average time for other breaks, currently at 19 minutes overall, compared to 18 minutes before COVID. There was a decrease in the number of primary schools with an overall break time of 15 minutes or less (65% to 59%).
Figure 8. Lunch and other breaks for Year 3 pupils before and after COVID
Source: School Snapshot Panel, May 2021 survey. D1/D2: All leaders who teach year 3 and know number of hours (n=621). *Indicates significant difference between “before COVID”
measure and now
The school day for year 9 pupils
The average lunch break for year 9 pupils was shorter now (38 minutes) than pre-COVID (42 minutes). Prior to COVID, more than half (52%) of schools reported year 9 pupils were given a lunch break of 31-45 minutes, falling to 34% currently, whereas the number reporting a 16–30 minute lunch break doubled from 22% before COVID to 44% currently. Although the mean time for other breaks remained at 20 minutes, as seen with primary schools the percentage of secondary schools reporting break time of 15 minutes or less increased slightly from 23% before COVID to 30% currently.
2%
82%*
13%
1%
2%
3%
71%
22%*
4%
1%
More than 1hour
46-60 mins
31-45 mins
16-30 mins
0-15 mins
Now Before COVID
56 mins
0%
0%
1%
34%
65%
1%
2%
38%
59%
More than 1hour
46-60 mins
31-45 mins
16-30 mins
0-15 mins
Now Before COVID
Other breaks
18 mins
54 mins
Mean
19 mins
Mean
May 2021
Lunch
Primary (Year 3)

29
Figure 9. Lunch and other breaks for Year 9 pupils before and after COVID
Source: School Snapshot Panel, May 2021 survey. D1/D2: All leaders who teach year 9 and know number of hours (n=320).
1%
25%
52%*
22%
0%
1%
21%
34%
44%*
0%
More than 1hour
46-60 mins
31-45 mins
16-30 mins
0-15 mins
Now Before COVID 42 mins0%
1%
0%
76%
23%
1%
2%
67%
30%
More than 1hour
46-60 mins
31-45 mins
16-30 mins
0-15 mins
Now Before COVID
Other breaks
20 mins
38 mins
Mean
20 mins
Mean
May 2021
Lunch
Secondary (Year 9)

30
Education recovery Following the lifting of lockdown restrictions, schools fully reopened on 8th March. Teachers were asked to what extent, if at all, they have had to make changes to the content they would normally teach. Nearly all teachers (94%) have had to make at least some changes and a quarter (25%) said they have had to change content to a large extent. Only 6% of teachers said they had not needed to change content at all.
Figure 10. Since schools reopened, to what extent have teachers had to make changes to the content they would normally teach
Source: School Snapshot Panel, May 2021 survey. E1: All Teachers (n=1,054)
Of those teachers who had to make changes, going over key concepts was the most common reason why they changed, reported by around four-in-five of these teachers (79%). This was followed by addressing pupil misunderstandings (68%) and working around challenges accessing classrooms with suitable equipment for practical lessons (46%).
6%
6%
6%
21%
20%
22%
49%
51%
46%
25%
23%
26%
All
Primary
Secondary
Not at all To a small extent To some extent To a large extent
Primary
Secondary
Teachers May 2021
All

31
Figure 11. Why teachers had changed the content of what they teach
Primary school teachers were more likely to have had to go over key concepts and address pupil misunderstandings (89% and 77% respectively) than secondary school teachers (69% and 59% respectively). Secondary teachers were more likely to report having to work around challenges accessing classrooms with suitable equipment for practical lessons (52%, compared to 40% of primary school teachers).
Around a third of teachers working in schools with the highest proportion of FSM said that they had to reteach whole topics (34%), this significantly higher than teachers in schools with the lowest proportion of FSM (18%).
Small group tuition Schools were asked to what extent they think pupils at their school would benefit from small group tuition to help recover any lost learning. Small group tuition refers to tutoring delivered at a maximum ratio of one tutor to three pupils and can be used to aid catch up. It can be delivered both inside and outside of school hours.
79%
68%
46%
27%
27%
3%
2%
2%
1%
1%
1%
3%
To go over key concepts
To address pupil misunderstandings
To workaround challenges accessing classrooms withsuitable equipment for practical lessons
To teach new/different topics
To reteach whole topics
To catch up on missed learning / review topics previouslytaught
To workaround challenges of time spent complying withCOVID rules
To put greater emphasis on mental health / emotionalwellbeing
To fit around a new assessment schedule
Group / close contact work is is not allowed / limited
To re-engage children in learning
Other
Teachers May 2021

32
Around four-in-five schools (82%) felt that pupils would benefit from small group tuition at least to some extent, with 36% saying they would benefit to a large extent. Primary schools were significantly more likely than secondary schools to say that pupils would benefit to a large extent from small group tuition (37% vs. 30%). Schools with the highest proportion of pupils eligible for FSM were also significantly more likely to say this than schools with the lowest proportion of pupils eligible for FSM (45% vs. 25%).
Schools were also asked if training and funding were provided, who would be most suitable to deliver small group tuition in the school. Schools were most likely to consider teachers permanently employed by the school to be most suitable (82%) (Figure 14). Over two-in-three schools (69%) felt that Teaching Assistants, and over half (53%) that former teachers who have retired or left the profession but were known to the school, would be suitable.
Figure 12. Suitable for delivering small group tuition
Source: School Snapshot Panel, May 2021 survey. L5: All schools (n=1,013); Primary (n=662); Secondary (n=351). * Indicates a significant difference between primary and secondary schools.
82%
69%
53%
27%
23%
22%
0%
0%
1%
1%
1%
82%
72%*
50%
29%*
22%
18%
0%
0%
1%
1%
1%
84%
53%
65%*
17%
28%*
39%*
1%
1%
2%
1%
1%
Teachers permanently employed at the school
Teaching Assistants
Former teachers who have retired/left the profession(known to the school)
Supply teachers
Former teachers who have retired/left the profession(not known to the school)
Private tutors
Trainees / unqualified teachers
Graduates
Other
None of the above
Don't know
AllPrimarySecondary
Spontaneous
May 2021Schools

33
Primary schools were significantly more likely to feel that the following would be suitable to deliver small group tuition:
• Teaching Assistants (72%, compared with 53% of secondary schools); and
• Supply teachers (29% vs. 17%).
On the other hand, secondary schools were significantly more likely to feel that the following would be suitable to deliver small group tuition:
• Former teachers who have retired/left the profession (known to the school) (65%, compared with 50% of primary schools);
• Former teachers who have retired/left the profession (not known to the school) (28% vs. 22%); and
• Private tutors (39% vs. 18%).

34
National Tutoring Programme In July 2020, the Government announced a £650 million Catch Up Premium for schools to aid recovery from lost learning, alongside a £350 million National Tutoring Programme (NTP) to provide additional, targeted support for pupils who need the most help.10,11
The NTP has two pillars:
• Approved Tuition Partners offer high quality, subsidised tuition to schools; and
• Schools in the most disadvantaged areas are supported to employ in-house Academic Mentors.
Participation in the NTP A third (33%) of schools had applied to participate in the NTP, and 15% were considering it. Almost one-in-10 (9%) were unsure if their school had applied or not, leaving just over two-fifths (43%) remaining that had not applied and were not considering it.
Secondary schools were significantly more likely to have applied to participate in the programme (49%) compared with primary schools (30%) – see Figure 13. Almost half of primary schools (47%) had not applied and were not considering it.
10 https://www.gov.uk/government/publications/catch-up-premium-coronavirus-covid-19/catch-up-premium 11 https://nationaltutoring.org.uk/

35
Figure 13. Whether schools had applied to participate in the National Tutoring Programme, by school phase
Source: School Snapshot Panel, May 2021 survey. A1: All leaders (n=1,013); Primary (n=662); Secondary (n=351). * Indicates a statistically significant difference between primary and
secondary schools.
The following school types were also significantly more likely to have applied to participate in the NTP:
• Schools with the highest proportion of pupils eligible for FSM (43%, compared with 31% of those with the lowest proportion);
• Schools with an Ofsted rating of requires improvement (42%, compared with 29% rated as outstanding); and
• Schools based in urban areas (36%, compared with 23% of rural schools).
The question was also asked in the December wave of the School Snapshot Panel. While there were no differences at the overall level, secondary schools were significantly less likely in May to be considering applying (12%, significantly down from 19% in December 2020).
Due to differences in makeup of the December panel, direct comparisons should be treated with caution.
33%
30%
49%*
15%
15%
12%
43%
47%*
26%
9%
8%
13%*
All
Primary
Secondary
Yes No, but we are considering applying No, and we are not considering applying Don't know
Schools May 2021

36
Reasons for not participating in the NTP
Of the schools that reported they were not considering participating in the National Tutoring Programme, the most common reason by a considerable margin was a preference for using staff known to the school or pupils (86%) – see Figure 14. Concern about whether the programme represented value for money was the second-most common concern (38%).
There were key differences by school phase, with secondary schools significantly more likely to report the following reasons for not participating:
• Concern about whether the programme represented value for money (52%, compared with 37% of primary schools); and
• Not thinking the programme would improve pupil outcomes (26% vs. 15%).
Schools with the highest proportion of pupils eligible for FSM were also more likely to have concerns around value for money compared to those with the lowest proportion (50% vs 28%).
Primary schools, on the other hand, were significantly more likely to not be eligible for funding (6%, compared with 1% of secondary schools).

37
Figure 14. Reason for not participating in the NTP, by school phase
Source: School Snapshot Panel, May 2021 survey. A2: Leaders at schools that had not applied to participate in the National Tutoring Programme (n=403); Primary (n=309); Secondary (n=94). *
Indicates a statistically significant difference between primary and secondary schools.
Although differences in the methodology between the School Snapshot Panel in December 2020 and the current COVID-19 School Snapshot Panel mean differences should be treated with caution, results suggest that thinking the programme would not improve pupil outcomes was much less of a reason for not participating in May 2021 (61% reported this in December 2020, but only 17% in the current wave), while preference for using staff known to the school and pupils had become a more prominent reason (86% mentioned this in May compared with 24% in December 2020).
86%
38%
17%
5%
3%
1%
4%
2%
2%
4%
86%
37%
15%
6%*
3%
1%
4%
2%
2%
4%
80%
52%*
26%*
1%
3%
1%
1%
2%
2%
5%
Prefer to use own staff / staff known to pupils
Concern about whether the programme representsvalue for money
Do not think the programme will improve pupiloutcomes
School not eligible for funding
Application to participate is too complicated
Pupils do not need additional help
Other accessibility issues (e.g. cannot afford theprogramme, no local providers available)
Do not think it is appropriate to ask pupils/staff to dothis (either additional hours or away from their lessons)
Other
Don't know
AllPrimarySecondary
Schools May 2021
Spontaneous responses

38
Remote education Though schools have been fully open since 8th March, schools affected by the remote education temporary continuity direction are still required to provide remote education for pupils where their attendance would be contrary to government guidance or legislation around coronavirus (COVID-19).
DfE guidance states that the amount of remote education should be a minimum of:
• Key stage 1: 3 hours a day, on average across the cohort, with fewer hours for younger children;
• Key stage 2: 4 hours a day;
• Key stages 3 and 4: 5 hours a day
Four-in-ten primary school teachers who teach key stage 1 (39%) and key stage 2 (39%) reported that they had any pupils not attending school over the last week. The mean minimum number of hours of work being set for pupils learning from home reported by Key Stage 1 and Key Stage 2 teachers was three hours, as shown in figure 15 below.12
One quarter of teachers (25%) said at least three hours minimum was set per day for key stage 1 pupils who were not attending in-person. Two-thirds (66%) of teachers do not know how much work is being set for pupils in key stage 1. Similarly, in key stage 2, 27% of teachers reported that a minimum of four hours of work was set per day but over half do not know (56%). When primary schools (as opposed to primary teachers) were asked in the late February13 survey about the minimum number of hours of work that they aim to set per day for pupils not attending school, 96% said a minimum of three hours for key stage 1 and 91% a minimum of four hours for key stage 2. It should be noted, however, that the policy landscape has changed significantly since February 2021, including government guidelines and requirements for what remote education schools have to provide.
12 Please note that the question was asked of all teachers, with respondents able to select that they do not teach the key stage in question, or that all pupils in the key stage are attending school. Pupils not attending school may include pupils who are staying at home due to illness, for example, and would therefore not be expected or required to have remote education provision. Further, teachers may not have felt able to estimate the hours set by other teachers at their school at each Key Stage. These factors may have contributed to the high proportion of “don’t know” responses. 13 Please note that in the late February survey the question was asked of school leaders rather than teachers. The findings were therefore reported with school level weighting.

39
Figure 15. The minimum hours of work set per day over the last week for pupils in primary school not attending in-person
Source: School Snapshot Panel, May 2021 survey. F1: All primary school teachers who teach this key stage and have pupils not attending school in-person (key stage 1 n=126, key stage 2
n=157)
Seven-in-ten secondary school teachers who teach key stage 3 (70%) and key stage 4 (70%) reported that they had any pupils not attending school over the last week. The mean minimum number of hours of work being set for pupils learning from home reported by these teachers was four hours for both key stages 3 and 4, as shown in Figure 16 below.
Around a third of secondary school teachers (35%) who teach in key stage 3 stated that pupils in this group who were not attending in-person received at least five hours minimum of work set per day. For key stage 4, this proportion was 39%. Similar to their primary school counterparts, a substantial proportion of secondary teachers do not know how much work is set for pupils not attending their school physically (46% for pupils in key stage 3, 47% in key stage 4). When secondary schools were asked in the late February survey about the minimum number of hours of work that they aimed to set per day for pupils not attending school, 86% said a minimum of five hours for key stage 3 and 91% for key stage 4.
56%8%
18%8%
3%2%
5%
Don't know5+ hours
4 hours3 hours2 hours1 hour
0 hours
66%4%
6%16%
1%0%
8%
Don't know5+ hours
4 hours3 hours2 hours1 hour
0 hours
Key Stage 1
2.7 hours
Mean
Primary
Key Stage 2
Teachers May 2021
3.3 hours
Mean
3+ hours: 26%
4+ hours: 26%

40
Figure 16. The minimum hours of work set per day over the last week for pupils in secondary school not attending in-person
47%39%
6%2%2%3%
2%
Don't know5+ hours
4 hours3 hours2 hours1 hour
0 hours
46%35%
7%5%
3%3%
2%
Don't know5+ hours
4 hours3 hours2 hours1 hour
0 hours
Secondary
4.2 hours
Mean
4.4 hours
Mean
Key Stage 3
Key Stage 4
Teachers May 2021

41
Relationships, Sex and Health Education (RSHE) Relationships, Sex and Health Education (RSHE) is a compulsory part of the curriculum which aims, among other things, to provide pupils with the skills to manage their mental health and wellbeing.
The law requires schools to provide some relationships, sex and health education to all secondary age pupils in the academic year 2020/21, and to provide some relationships and health education to all primary age pupils. Schools are also required to publish a Relationships and Sex Education (RSE) policy and to consult parents on this, online if face-to-face engagement is not possible.
Some schools may have chosen to focus this year’s RSHE teaching on the immediate needs of their pupils, introducing a more comprehensive RSHE programme in September 2021. The intention is that RSHE teaching in the 2021/22 academic year should seek to address any gaps in pupils’ RSHE education this year.
Teachers were asked if they personally taught any of the individual strands of RSHE. Over half of all teachers taught relationships education (55%) and health education (57%). Primary school teachers were significantly more likely to teach each of these strands compared to their secondary school counterparts: 75% vs. 33% for relationships education and 77% vs. 37% for health education respectively. Sex education was only asked to secondary school teachers and around a third (31%) personally taught this element of RSHE.

42
Figure 17. Proportion of teachers who personally teach each strand of RSHE
Source: School Snapshot Panel, May 2021 survey. H1: All Teachers (n=1,058) * Indicates a statistically significant differences between primary school and secondary school teachers.
Teachers were more likely to be confident in delivering health education (93%) than relationships education (89%) as shown below in Figure 18. For both of these strands of RSHE, primary school teachers were more confident compared to secondary school teachers (91% vs. 84% for relationships education and 96% vs. 85% for health education). A similar question was asked in 2018 and as shown in Figure 18 below, the confidence levels were similar.
55%
57%
31%
75%*
77%*
33%
37%
31%
Relationships education
Health education
Sex education (only asked to secondaryschool teachers)
AllPrimarySecondary
May 2021
N/A
Teachers

43
Figure 18. Confidence in teaching each strand of RSHE
Source: School Snapshot Panel, May 2021 survey. H2: All those who teach each strand (Relationships education for primary school n=391, secondary school n=176 , Health education in
primary school n=407, secondary school n=193, Sex education in secondary school n=166,) Responses less than 1% are not shown in the charts.
When asked to what extent the aspects of RSHE will be covered by the end of this academic year, 86% of teachers in primary schools who teach one or more aspects of the subject think that ‘respectful relationships’ will be mostly or fully covered. This is significantly higher than reported among secondary school teachers (74%). Similarly, primary school teachers were more likely than secondary school teachers to expect to mostly or fully cover the topic of ‘being safe’ (88% vs. 74%). Overall, 82% of RSHE teachers expected mental wellbeing to be mostly or fully covered, there was no significant difference between primary and secondary leaders on this measure.
1%
2%
3%
5%
8%*
14%
4%*
12%
16%
61%
55%
62%*
50%
43%
30%
29%
34%
36%
36%
Relationships education
Relationships education
Health education
Health education
Sex education (only asked tosecondary school teachers)
Not at all confident Not very confident Fairly confident Very confident
Confident
96%
84%
91%
Teachers May 2021
85%
80%
Primary
Secondary
Primary
Secondary
May 21 Winter 18
91%
87%
77%
N/A
N/A
Winter 2018

44
Figure 19. Extent to which different aspects of RSHE will be covered by the end of this academic year
Source: School Snapshot Panel, May 2021 survey. H3: All those who teach at least one or more aspects of RSHE (primary school n=422, secondary school n=210) * indicates a statistically
significant differences between primary school teachers and secondary school teachers. Responses less than 1% are not shown in the charts
Teachers who reported that a specific aspect of RSHE would be covered either ‘slightly’ or ‘not at all’ in the academic year were asked whether they plan to cover these areas early in the 2021/2022 school year. Four-in-ten teachers planned this for ‘respectful relationships’ (40%), with a similar figure for ‘being safe’ (43%), rising to half (50%) for covering ‘mental wellbeing’ early in the next academic year. For each aspect, around half of teachers did not know if they would be covering it or not early in the next academic year (56% for ‘respectful relationships’, 51% for ‘being safe’ and 48% for ‘mental wellbeing’).
12%
14%
9%
16%*
13%
16%
41%
46%
37%
44%
41%
42%
44%*
29%
51%*
30%
44%
36%
2%
10%*
2%
8%*
2%
6%*
Respectful relationships
Respectful relationships
Being safe
Being safe
Mental wellbeing
Mental wellbeing
Not at all Slightly Mostly Fully Don't know
Teachers May 2021
Primary
Secondary
Primary
Secondary
Primary
Secondary

45
Figure 20. Whether teachers who were planning to cover aspects of RSHE ‘slightly’ or ‘not at all’ by the end of this academic year, planned to cover these aspects early in the 2021/2022 academic year
5%
5%
2%
40%
43%
50%
56%
51%
48%
Respectful relationships
Being safe
Mental wellbeing
No Yes Don't know
Teachers May 2021

46
Clinically Extremely Vulnerable (CEV) school staff Guidance for individuals identified as clinically extremely vulnerable (CEV) from coronavirus (COVID-19) changed on 31st March 2021, when shielding was lifted. From this point, CEV people were expected to follow the rules in place for the general public and were advised to take precautions to minimise their risk of exposure to COVID-19.
In the May survey, schools were asked about their experiences with CEV teaching and non-teaching staff. They were asked about the number of staff in their school who were considered to be CEV and the proportion that had returned to school since shielding was lifted.
Staff considered to be clinically extremely vulnerable (CEV) Most schools reported that at least one member of teaching or non-teaching staff was considered to be CEV (only 26% reported that there were none). The proportion reporting no teaching staff were considered to be CEV was higher among primary (29%) than secondary schools (8%), though among the latter quite a high proportion were not sure of the number (15%). The mean number of CEV staff across schools was two, with this higher among secondary schools (three) than primary schools (two). This reflects larger average staff teams within secondary schools. Around one in ten (9%) secondary schools reported more than five members of staff were considered to be CEV (see Figure 21).
Taken as a proportion of all staff in the school, 18% of schools reported that more than 1% of their staff was considered to be CEV. This was significantly more likely among primary than secondary schools (21% vs. 2%). On average, 0.6% of staff in primary schools were considered to be CEV, higher than the mean 0.3% of staff in secondary schools. This illustrates that, although secondary schools have a higher average number of CEV staff, they make up a larger proportion of staff in primary schools.

47
Figure 21. Number of staff (both teaching and non-teaching) currently employed by the schools considered to be clinically extremely vulnerable (CEV)
Source: School Snapshot Panel, May 2021 survey. J1: All leaders (n=1,013); Primary (n=662); Secondary (n=351). * Indicates a statistically significant difference between primary and
secondary schools.
CEV staff returning to work
Four-in-five (80%) schools with any CEV staff reported that all of the CEV staff had physically returned to work since shielding was lifted on the 31st March 2021, with just a small minority (3%) reporting that none had.
On average, across all schools, 91% of CEV staff had returned to work, with this higher among primary schools than secondary (91% and 88%, respectively).
15%*
8%
9%*
10%*
12%*
20%*
16%
10%
Don't know
None of the staff in myschool are CEV
More than 5 CEV staffmembers
5 CEV staff members
4 CEV staff members
3 CEV staff members
2 CEV staff members
1 CEV staff member
Secondary
3%
29%*
3%
3%
5%
12%
20%
24%*
Don't know
None of the staff in myschool are CEV
More than 5 CEV staffmembers
5 CEV staff members
4 CEV staff members
3 CEV staff members
2 CEV staff members
1 CEV staff member
Primary
2
Mean
3*
Mean
May 2021Schools

48
Figure 22. Proportion of CEV staff that had physically returned to work since restrictions were lifted on 31st March
Source: School Snapshot Panel, May 2021 survey. J1/2: Leaders with any staff considered to be CEV (n=716).
Reasons CEV staff had not physically returned to work
For the minority (20%) of schools that reported that at least some of their CEV staff had not physically returned to work, a range of reasons were cited. The most common were health issues unrelated to COVID-19, such as staff recovering from surgery, and conflicting advice regarding shielding, which included advice from the staff member’s doctor to stay at home and continue shielding.
“They have been told by their consultant they should not be in the workplace yet and should continue shielding until he says otherwise.”
Leader, primary school
80%
1%
10%
5%
1%
3%
All returned
Between 81% and 99%
Between 61% and 80%
Between 41% and 60%
Between 21% and 40%
Between 1% and 20%
0%
91%
Mean
May 2021Schools

49
“The staff member in question is suffering from a number of medical problems not associated with COVID-19.”
Leader, primary school
Other, less common reasons included maternity leave, anxiety and mental health issues, as well as the ability to work from home with minimal disruption (meaning it made more sense for these staff members to continue working from home).

50
Operating in a COVID-19-secure way In this chapter we examine aspects of how schools have operated in a COVID-19 secure way. This includes challenges for pupils and staff, the size of pupil bubbles, vaccinations and the effect that the COVID-19 safety measures have had on the school’s ability to run breakfast and after-school clubs.
Firstly, schools were asked to indicate in an open-text question the biggest challenges in terms of operating in a COVID-19 secure way for pupils and staff.
Implementing social distancing measures in school Of the themes emerging, the most frequently reported challenge to operating in a COVID-19 secure way was implementing social distancing and maintaining class bubbles. This was a key issue for schools that reported having limited space and resources. In addition to logistical concerns about social distancing within school due to a lack of space, lunch and break times were mentioned as particularly difficult times for maintaining social distancing. Schools reported that the need to supervise social distancing and the inability to cross bubbles has placed a lot of additional pressure on staff.
“Keeping pupils in bubbles meaning that their movement around the school is limited. Having to stagger break and lunches so there is sufficient space for each year group to be in their own space. Less space in staff areas for staff to meet which is impacting on some staff wellbeing Due to the bubbles staff are not teaching in specialist areas i.e science lessons are only in a lab once a week which means lesson content has to be adjusted accordingly.”
Leader, secondary school
“Maintaining enough adult supervision for each separate 'bubble' during break and lunchtimes whilst also ensuring all staff get a break.”
Leader, primary school
Issues around staffing
School leaders also often cited staffing as a challenge. This included issues such as absences, lack of cover staff, and the lack of mixing among staff due to bubbles and social distancing. Demands on staff to maintain COVID-19 measures in schools were high, and this is exacerbated when there were staff absences due to the lack of flexibility to redeploy staff across bubbles.
“In order to run the school in a Covid secure way, I need more staff. My budget is so stretched that I cannot afford these, nor can I afford extra cleaning hours. This means

51
that staff are undertaking far more, as am I, and this is having a negative impact on my mental health and wellbeing.”
Leader, primary school
“Difficulties in covering staff absence. Moving adults from different bubbles cannot occur to protect school and this makes day-to-day operations difficult.”
Leader, primary school
Impact on time management and how education is delivered
Schools also expressed concern around the challenges of time management and education delivery, including staggered arrival, departure, and break times, and additional time needed to complete tasks. There are also limitations placed on curriculum delivery, and many leaders felt that offering a balanced curriculum and catching up on lost learning was difficult.
“Lack of flexibility, for example children sitting in rows and not able to mix seats means teachers are not able to group children together who all need the same support during a lesson.”
Leader, primary school
“Maintaining the re-structure of the day in terms of timings for break to accommodate the different bubbles. This is causing a strain on staffing due to restrictions with teaching time and the need for split breaks. The school in itself is operating in a COVID-19 secure way each and every day. It is the additional workload and logistics that are causing the challenges.”
Leader, secondary school
Mental health and wellbeing
Some schools reported issues around the mental health and wellbeing of pupils, parents and staff as a result of operating in a COVID-secure way, such as increased anxiety. Challenges were reported around pupils and staff being unable to mix with friends or colleagues, and reduced social interaction including a reduction in whole-school gatherings such as assemblies and collective worship. Schools also reported that reduced access to facilities and clubs negatively impacted young people’s experience of school.
“Simply not having classes together for assemblies for instance, staff not being able to gather in communal spaces for social interactions…Everyone is missing connecting with [the] wider school community.”

52
Leader, primary school
Other challenges
Other challenges mentioned included access to space and facilities within the school; the cost of putting measures in place; issues with pupils and parents not following guidelines; maintaining cleaning and hygiene standards and keeping up with changing regulations.
Pupil bubbles Schools were asked what size their pupil bubbles were on average. Most primary schools (65%) reported that their pupil bubbles included 21-50 pupils, whereas half (50%) of secondary schools reported bubble sizes of 101-200 pupils. As a proportion of all pupils, most schools (70%) reported that their pupil bubbles comprise between 1% and 20% of pupils, with the mean average at 18%.
Figure 23. Size of pupil bubbles
Source: School Snapshot Panel, May 2021 survey. K2: All schools (n=1,013); Primary (n=662); Secondary (n=351). * Indicates a significant difference between primary and secondary schools.
COVID-19 vaccination Leaders and teachers were asked whether or not they have been vaccinated against COVID-19. Overall, 53% of all leaders and teachers had received exactly one dose of a vaccine (51% of teachers, 69% of leaders) and 15% had received two doses (15% of teachers, 17% of leaders). Significantly more leaders than teachers reported that they had received at least one dose (86% vs. 66%).
1%
1%
2%
3%*
56%
65%*
13%
26%
29%*
8%
9%
1%
50%*
4%
24%* 2%*
2%
1%
2%
All
Primary
Secondary
0-10 11-20 21-50 51-100 101-200 201-300 301+ Don't know
Mean average
61.3
41.4
161.1
May 2021Schools

53
Leaders and teachers who had not yet been vaccinated were asked how likely or unlikely they would be to have a vaccine if one was offered to them. The vast majority (87%) said that they were fairly or very likely to have the vaccine if offered, while 7% said that they would be fairly or very unlikely. There was no significant difference between the proportion of leaders or teachers who were likely to have the vaccine if offered.
Figure 24. Likelihood that leaders and teachers will have the COVID-19 vaccine if offered
Source: School Snapshot Panel, May 2021 survey. K4: Leaders and teachers who have not been vaccinated against COVID-19 (n=491).
Impact on breakfast/after school clubs Schools were asked how, if at all, their implementation of COVID-19 safety measures had affected their ability to run breakfast or after school clubs this term, compared to before the COVID-19 pandemic (March 2020). Schools most commonly reported that they had had to cancel clubs (40%) or reduce the number of places available (33%). Around one-fifth of schools had had to reduce the hours that clubs operate (21%). One in five schools reported that the implementation of COVID-19 safety measures had not had any impact on their breakfast or after school clubs (20%).
There were some significant differences by phase. Primary schools were significantly more likely to say that COVID-19 safety measures had not impacted their ability to run breakfast or after school clubs this term (22%, compared with 8% of secondary schools) (Figure 25). They were also significantly more likely than secondary schools to say that they had had to reduce the number of places available (35% vs. 24%). On the other hand, secondary schools were significantly more likely to say that they had had to cancel clubs (62% vs. 36%), and to reduce the hours that clubs operate (35% vs. 18%).
79% 8% 3%2%5%
2%1%
Very likely Fairly likelyNeither likely nor unlikely Fairly unlikelyVery unlikely Don't knowPrefer not to say
Leaders & Teachers May 2021
Likely: 87%
Unlikely: 7%

54
Figure 25. Impact of COVID-19 safety measures on breakfast/after school clubs this term
Source: School Snapshot Panel, May 2021 survey. K5: All schools (n=1,013); Primary (n=662); Secondary (n=351). * Indicates a significant difference between primary and secondary schools.
40%
33%
21%
4%
3%
3%
2%
4%
20%
1%
36%
35%*
18%
5%*
4%*
4%*
2%
4%
22%*
1%
62%*
24%
35%*
2%
0%
0%
2%
2%
8%
2%
We have had to cancel clubs
We have had to reduce the number of places available
We have had to reduce the hours that clubs operate
We have had to reduce access to certain clubs to avoidbubbles mixing
We have had to move location / source more space tomaintain bubble system
We have had to incur costs of sourcing additional staff
We hold our breakfast / after school clubs in bubbles
Other
It has had no impact
Don't know
AllPrimarySecondary
Spontaneous
May 2021Schools

55
Rapid Asymptomatic Testing As part of the return to face-to-face education on 8th March 2021, schools were asked to facilitate testing three times for each secondary pupil at an on-site Asymptomatic Testing Site before transitioning to twice-weekly testing at home.
Secondary leaders and teachers were asked how important they felt regular COVID-19 testing of pupils was to effective on-site schooling at present. Overall, more than half (54%) of secondary leaders and teachers said testing was very important, a significant decrease compared to when the same question was asked in the April 2021 survey (60%). However, 84% said it was at least fairly important, which is in line with the findings of the April survey (86%). Also in line with the April survey, there was a difference of opinion by role, with significantly more teachers reporting that testing was at least fairly important than leaders (85% vs. 77%, compared with 88% of teachers and 73% of leaders in April).
Figure 26. How important is regular COVID-19 testing of pupils to effective on-site schooling at present
Source: School Snapshot Panel, May 2021 survey. L1: All secondary leaders and teachers (n=878); Leader (n=351); Teacher (n=527). * Indicates a significant difference between leaders
and teachers.
Both primary and secondary teachers were asked how important they felt COVID-19 testing of staff was to effective schooling at present. More than half said it was very important (54%) and 85% said was at least fairly important. This is significantly fewer than when the same question was asked in April 2021, when 69% of teachers reported
54%
39%
56%*
30%
38%*
29%
9%
14%*
8%
4%
6%
3%
3%
3%
3%
All
Leader
Teacher
Very important Fairly important Not very importantNot at all important Unsure/undecided
Important
84%
77%
85%*
Leaders & Teachers May 2021
Important(April 2021)
86%
73%
88%

56
that testing of staff was very important and 89% reported it to be at least fairly important. In May 2021, secondary teachers were more likely than primary teachers to say testing of staff was very important (58% vs. 51%).
Figure 27. Importance of regular COVID-19 testing of staff to effective on-site schooling at present
Source: School Snapshot Panel, May 2021 survey. L2: All teachers (n=1,054); Primary (n=527); Secondary (n=527). * Indicates a significant difference between primary and secondary teachers.
In an open-text question, leaders and teachers who indicated that testing of pupils and/or staff was not very or not at all important were asked to say why they felt this was the case. The findings mirror those of the April survey, outlined below.
Difficulties with ensuring compliance Leaders and teachers most commonly reported that it is difficult to control whether pupils and staff are actually taking their tests. This was particularly a concern among secondary leaders, many of whom reported that only a minority of pupils take them, and that they struggled to monitor which pupils are testing and whether the tests are being carried out correctly.
“I believe that the majority of staff and students are choosing not to use the home test kits that they have been provided with. Therefore, the testing is ineffective in its operation.”
54%
51%
58%*
31%
33%
28%
8%
8%
8%
3%
2%
3%
4%
5%*
3%
All
Primary
Secondary
Very important Fairly important Not very importantNot at all important Unsure/undecided
Important
85%
84%
87%
May 2021Teachers
Important(April 2021)
89%
89%
90%
57
Teacher, secondary school
“We have had minimal positive results, the on-site testing was a nightmare to run and administer and there are no guarantees that students are now doing the tests themselves at home.”
Leader, secondary school
“At the beginning, it provided confidence for staff/students/parents - it maybe still does but there has been a significant decline in the number of reported tests. Not clear if this means they are not doing it or not reporting it?”
Leader, secondary school
“Tests not administered properly, students lying about the result. Add to that the costs of the tests and the low risk associated with school aged children... what is the point?”
Teacher, secondary school
Doubts about accuracy
Many leaders and teachers expressed concerns about the accuracy and reliability of the test results. Many reported that their school had received very few positive results and expressed doubts about whether the tests were properly administered. Others had received false positive and negative results which created significant disruption to learning.
“The tests miss so many cases that they lack credibility; they engender false confidence and hence a more relaxed approach to safety and distancing.”
Leader, secondary school
Low infections and high vaccination rates
Other leaders and teachers felt that testing is less important now because most staff and vulnerable pupils had received at least one dose of the vaccine, and because infection rates were already low in the community.
“We are in an area of low incidence of the virus. As yet we haven't had a single positive test outcome from the lateral flow tests.”

58
Leader, secondary school
Other reasons
Some leaders and teachers felt that regular testing of pupils and staff does not effectively protect against COVID-19, that social distancing and other preventative measures are more important, and that testing places a disproportionate burden on schools. A small minority of respondents did not believe that COVID-19 poses a risk as infection rates were low.

59
© Department for Education 2021
Reference: DFE- RR1160
ISBN: 978-1-83870-302-8
For any enquiries regarding this publication, contact us at www.education.gov.uk/contactus.
This document is available for download at www.gov.uk/government/publications.