covid-19 weekly epidemiology brief
TRANSCRIPT

S O U T H A F R I C A W E E K 1 2 2 0 2 1
PROVINCES AT A GLANCE
EASTERN CAPE
CA
SES 195 349 2 900,9
IN TOTAL /100,000*
NORTH WEST
CA
SES 63 521 1 546,0
IN TOTAL /100,000*
MPUMALANGA
CA
SES 74 659 1 595,4
IN TOTAL /100,000*
GAUTENG
CA
SES 413 491 2 669,7
IN TOTAL /100,000*
LIMPOPO
CA
SES 63 112 1 078,4
IN TOTAL /100,000*
KWAZULU-NATAL
CA
SES 333 748 2 894,2
IN TOTAL /100,000*
FREE STATE
CA
SES 83 006 2 834,0
IN TOTAL /100,000*
NORTHERN CAPE
CA
SES 36 105 2 792,8
IN TOTAL /100,000*
WESTERN CAPE
CA
SES 282 440 4 031,6
IN TOTAL /100,000*
CASES PERSONS
CUMULATIVE DATA FROM
MARCH MARCH03 27
1 545 431 2 592,0
5 870 40
IN TOTAL INCIDENCE RISK*
THIS WEEK** MEDIAN AGE
* Incidence risk - cases per 100 000 persons** based on samples collected/received in current reporting week
COVID-19 WEEKLY EPIDEMIOLOGY BRIEF
TOLL-FREE NUMBER 0800 029 999 PAGE 1www.nicd.ac.za

W E E K 1 2 2 0 2 1
COVID-19 WEEKLY EPIDEMIOLOGY BRIEF
TOLL-FREE NUMBER 0800 029 999 PAGE 2www.nicd.ac.za
Overview of report Disease surveillance is a core function of the National Institute for Communicable Diseases (NICD), a division of the National Health Laboratory Service (NHLS). This report summarises data from a national laboratory-based surveillance system that is used to monitor the coronavirus disease 2019 (COVID-19) pandemic in South Africa. This report is based on data collected up to 27 March 2021 (week 12 of 2021). Note: COVID-19 is the name of the disease and SARS-CoV-2 is the name of the virus. Trends in numbers of new cases by province and age group may be affected by changes in testing practice and delays in testing of specimens. The numbers reported may change as more data become available.
Highlights• As of 27 March 2021, a total of 1 545 431 laboratory-confirmed COVID-19 cases
had been detected in South Africa. Of these, 7 579 were cases reported since the last report (week 11 of 2021). There was a 19.1% decrease in number of new cases detected in week 12 of 2021 (5 870) compared to the number of new cases detected in week 11 of 2021 (7 258), possibly related in part to delays in reporting.
• An additional 552 deaths were reported since the last report. The overall case-fatality ratio is 3.4% (52 663/1 545 431).
• In the past week, the Gauteng Province reported the highest proportion of the new cases detected (1 725/5 870, 29.4%), followed by the Western Cape Province (922/5 870, 15.7%), and the Free State Province (696/5 870, 11.9%).
• In the past week, all provinces reported a decrease in weekly incidence risk, except the Limpopo Province which showed no change in weekly incidence risk, compared to the previous week. The decrease ranged from 0.3 cases per 100 000 persons (2.3% decrease) in the Western Cape Province to 20.5 cases per 100 000 persons (37.2% decrease) in the Northern Cape Province.
• In the past week, the Northern Cape Province reported the highest weekly incidence risk (34.7 cases per 100 000 persons), followed by the Free State Province (23.8 cases per 100 000 persons), and the Mpumalanga Province (14.6 cases per 100 000 persons).
SUMMARY
9,8CASES PER
100 000 PERSONS
INCIDENCE RISK FOR
CURRENT WEEK
29,4%OF CASES
REPORTED IN GAUTENG IN
CURRENT WEEK
IN CURRENT WEEK, THE
HIGHEST WEEKLY
INCIDENCE RISK WAS IN CASES AGED
80+ YEARS (24,9 CASES PER 100 000 PERSONS)

W E E K 1 2 2 0 2 1
COVID-19 WEEKLY EPIDEMIOLOGY BRIEF
TOLL-FREE NUMBER 0800 029 999 PAGE 3www.nicd.ac.za
Methods
Testing for SARS-CoV-2 began on 28 January 2020 at the NICD and after the first case was confirmed in early March 2020, testing was expanded to a larger network of private and NHLS laboratories. Respiratory specimens were submitted from persons under investigation (PUI). Initially, tested individuals were those who had travelled to countries with COVID-19 transmission but the PUI definition was changed over time. Community symptom screening and referral for PCR testing was implemented in April 2020 but the strategy was changed to a more targeted approach in May 2020. Community screening was largely discontinued and testing efforts then focussed on areas identified as hot spots and on investigating clusters. Contacts of cases were traced and tested if symptomatic. In some provinces and in certain circumstances (e.g. closed settings, workplaces), asymptomatic contacts were tested. In recent weeks, testing has been prioritised for healthcare workers and hospitalised patients. Laboratories used any one of several in-house and commercial PCR assays to test for the presence of SARS-CoV-2 RNA. Testing for SARS-CoV-2 using rapid antigen-based tests was implemented during November 2020. We excluded specimens collected outside South Africa. Date of specimen receipt in the laboratory was used when date of specimen collection was missing. A case of COVID-19 was defined as any person, resident in South Africa, with a single positive SARS-CoV-2 PCR or antigen test. For reports published from week 41 of 2020 onwards we used mid-year population estimates from Statistics South Africa for 2020 to calculate the incidence risk (cumulative or weekly incidence), expressed as cases per 100 000 persons. In historical reports published from epidemiologic week 10 (during the start of COVID-19 epidemic in South Africa) to week 40 of 2020, 2019 mid-year population estimates were used. Aggregate data on the number of deaths by province were obtained from the Department of Health. Data on number of tests conducted in the past week as reported in the simultaneously-published COVID-19 weekly testing report was used to calculate tests conducted per 100 000 population. Data on province and district allocation was based on geocoding algorithm using in order of priority (i) completeness of patient data, (ii) submitting doctor’s address, (iii) registering doctor’s address and as final option, (iv) the guarantor’s address data. The geocoding algorithm used the most complete data for assigning data on province and district where adequate information was provided on the lab request form at the time of sample collection. Data on district allocation may lag resulting in number of cases in recent weeks missing district allocation. Prevalence and incidence risk by districts should be interpreted with caution.
We estimated the time-varying (weekly) doubling time of the COVID-19 epidemic for the provinces with sufficient data and from weeks with sufficient number of cases and complete data (week 12 to the week before the current reporting period). The unit of analysis (epidemiological week) was defined from Sunday to the following Saturday. We first estimated the weekly growth rate of the epidemic by fitting a linear regression model to the logarithm of the daily cumulative number of laboratory-confirmed COVID-19 cases. We then estimated the doubling time for each week using the following formula log(2)/gr (where gr is the estimated weekly growth rate). An increase in the doubling time may suggest a slowing of transmission but this may also be affected by changes in testing strategy or care seeking. Until the week 29 report, new cases were defined as all cases reported since the last report, irrespective of when the sample was collected. Subsequent to the week 29 of 2020 report, new cases are now defined as cases detected in the past epidemiologic week based on date of sample collection or sample receipt. It is therefore possible for numbers reported as new cases for the current reporting week not to tally with total additional cases reported since the last report. This will be the case when there was a delay in reporting of cases.
National and provincial trends of COVID-19 cases in South Africa
As of 27 March 2021, a total of 1 545 431 laboratory-confirmed COVID-19 cases were reported in South Africa (Figures 1 and 2). This is 7 579 more cases than the number reported in the last report (week 11 of 2021 report). The number of new cases detected in week 12 of 2021 (5 870) was lower than the number of new cases detected in week 11 of 2021 (7 258), this represented a 19.1% decrease in the number of new cases compared to the previous week, possibly in part related to delays in reporting. In the past week, the Gauteng Province reported the highest number of new cases (1 725/5 870, 29.4%), followed by the Western Cape Province (922/5 870, 15.7%) and the Free State Province (696/5 870, 11.9%) (Table 1). Five provinces, Gauteng (413 491/1 545 431, 26.8%), KwaZulu-Natal (333 748/1 545 431, 21.6%), Western Cape (282 440/1 545 431, 18.3%), Eastern Cape (195 349/1 545 431, 12.6%), and Free State (83 006/1 545 431, 5.4%) continued to report the majority (1 308 034/1 545 431, 84.6%) of total COVID-19 cases in South Africa. In keeping with the data reported in the previous weeks, there was minimal change in percent contribution of cases in the different provinces from week 11 to week 12 of 2021.The cumulative incidence risk for the country increased from 2 582.2 cases per 100 000 persons in week 11 of 2021 to 2 592.0 cases per 100 000 persons in week 12 of 2021. The cumulative incidence risk varied by province over time (Figure 3). This is partly explained by testing differences by province (Table 1). The Western Cape Province reported

DATE SPECIMEN COLLECTED*
2020 2021
*Date specimen received where date collected missing
0
100000
200000
300000
400000
500000
600000
700000
800000
900000
1000000
1100000
1200000
1300000
1400000
1500000
1600000
0
3000
6000
9000
12000
15000
18000
21000
24000
27000
30000
33000
Cu
mu
lative nu
mb
er of casesN
um
ber
of c
ases
Gauteng Western Cape
Eastern Cape KwaZulu Natal
Free State Limpopo
Mpumalanga North West
Northern Cape Cumulative
02-M
ar10
-Mar
16-M
ar22
-Mar
28-M
ar03
-Apr
09-A
pr15
-Apr
21-A
pr27
-Apr
03-M
ay09
-May
15-M
ay21
-May
27-M
ay02
-Jun
08-Ju
n14
-Jun
20-Ju
n26
-Jun
02-Ju
l08
-Jul
14-Ju
l20
-Jul
26-Ju
l01
-Aug
07-A
ug13
-Aug
19-A
ug25
-Aug
31-A
ug06
-Sep
12-S
ep18
-Sep
24-S
ep30
-Sep
06-O
ct12
-Oct
18-O
ct24
-Oct
30-O
ct05
-Oct
11-N
ov17
-Nov
23-N
ov29
-Nov
05-D
ec11
-Dec
17-D
ec23
-Dec
29-D
ec04
-Jan
10-Ja
n16
-Jan
22-Ja
n28
-Jan
03-F
eb09
-Feb
15-F
eb21
-Feb
27-F
eb05
-Mar
11-M
ar17
-Mar
24-M
ar
W E E K 1 2 2 0 2 1
COVID-19 WEEKLY EPIDEMIOLOGY BRIEF
TOLL-FREE NUMBER 0800 029 999 PAGE 4www.nicd.ac.za
Figure 1. Number and cumulative number of laboratory-confirmed cases of COVID-19 by province and date of specimen collection, South Africa, 3 March 2020 – 27 March 2021 (n=1 545 431)
the highest cumulative incidence risk (4 031.6 cases per 100 000 persons), followed by the Eastern Cape Province (2 900.9 cases per 100 000 persons), the KwaZulu-Natal Province (2 894.2 cases per 100 000 persons), the Free State Province (2 834..0 cases per 100 000 persons), the Northern Cape Province (2 792.8 cases per 100 000 persons), and the Gauteng Province (2 669.7 cases per 100 000 persons). The other provinces continued to report cumulative incidence risk below 2 000 cases per 100 000 persons, with Limpopo Province reporting the lowest cumulative incidence risk (1 078.4 cases per 100 000 persons).Similar to the past five weeks, the Northern Cape Province reported the highest weekly incidence risk (34.7 cases per 100 000 persons) in week 12 of 2021, followed by the Free State Province (23.8 cases per 100 000 persons), and the Mpumalanga Province (14.6 cases per 100 000 persons). In the past week, all provinces reported a decrease in weekly incidence risk, except Limpopo Province which showed no change in weekly incidence risk, compared to the previous week. The decrease in weekly incidence risk ranged from 0.3 cases per 100 000 persons (2.3% decrease) in the Western Cape Province to 20.5 cases per 100 000 persons (37.2% decrease) in the Northern Cape Province (Figure 4). Some of the reductions in week 12 of 2021 weekly incidence risk could be as a result of reporting delays. Among the five provinces reporting the majority of cases in South Africa to date, doubling time of number of cases varied with time.
In week 11 of 2021, the estimated doubling time of number of cases
increased in all provinces. The doubling time in the Eastern Cape
Province increased (from 6 180.0 days to 6 516.5 days, 5.4% increase),
the KwaZulu-Natal Province (from 1 297.8 days to 1 604.2 days, 23.6%
increase), the Western Cape Province (from 1 123.0 days to 1 285.1 days,
14.4% increase), the Gauteng Province (from 840.1 days to 868.1 days,
3.3% increase), and the Free State Province (from 461.8 days to 469.9
days, 1.8% increase) (Figure 5).
The case-fatality ratio (CFR) was 3.4% (52 663/1 545 431); an additional
552 deaths were reported since the last report. The number of deaths
reported in the past week was lower than the number reported in the
previous week, 552 deaths compared to 785 deaths. A CFR calculated
in this way (number of deaths/number of diagnosed cases) is subject
to numerous limitations. Because deaths are delayed in relation to
cases, as case numbers decrease rapidly, the crude CFR may increase
as a result of a more rapid reduction in the denominator compared
to the numerator. The CFR may be an underestimate as deaths in
hospital are more likely to be reported than deaths out of hospital.
In addition, occurrence and reporting of deaths may be delayed to
several weeks after case diagnoses.

2020 2021
0
100000
200000
300000
400000
500000
600000
700000
800000
900000
1000000
1100000
1200000
1300000
1400000
1500000
1600000
0
3000
6000
9000
12000
15000
18000
21000
24000
27000
30000
33000
Cu
mu
lative nu
mb
er of casesN
um
ber
of c
ases
Public-sector
Private-sector
Cumulative number private-sector cases
Cumulative number public-sector cases
Cumulative number of total cases
02-M
ar11
-Mar
18-M
ar25
-Mar
01-A
pr08
-Apr
15-A
pr22
-Apr
29-A
pr06
-May
13-M
ay20
-May
27-M
ay03
-Jun
10-Ju
n17
-Jun
24-Ju
n01
-Jul
08-Ju
l15
-Jul
22-Ju
l29
-Jul
05-A
ug12
-Aug
19-A
ug26
-Aug
02-S
ep09
-Sep
16-S
ep23
-Sep
30-S
ep07
-Oct
14-O
ct21
-Oct
28-O
ct04
-Nov
11-N
ov18
-Nov
25-N
ov02
-Dec
09-D
ec16
-Dec
23-D
ec30
-Dec
06-Ja
n13
-Jan
20-Ja
n27
-Jan
03-F
eb10
-Feb
17-F
eb24
-Feb
05-M
ar11
-Mar
17-M
ar24
-Mar
W E E K 1 2 2 0 2 1
COVID-19 WEEKLY EPIDEMIOLOGY BRIEF
TOLL-FREE NUMBER 0800 029 999 PAGE 5www.nicd.ac.za
Figure 2. Number and cumulative number of laboratory-confirmed cases of COVID-19, by testing laboratory sector and date of specimen collection, South Africa, 3 March 2020 –27 March 2021 (n=1 545 431)
DATE SPECIMEN COLLECTED**Date specimen received where date collected missing
Province Cumulative cases (n)
(percentage, n/total cases in South Africa)
New cases1
detected in week 12 (21-27
Mar 2021), n (percentage2,
n/total)
Population in mid-20203, n
Cumulative incidence risk
(cases per 100 000 persons)
Incidence risk of new cases detected in
week 12 of 2021 (cases/100 000
persons)
Tests4 per 100 000 persons,
21-27 Mar 2021
Eastern Cape 195 349 (12.6) 110 (1.9) 6 734 001 2 900.9 1.6 151.1
Free State 83 006 (5.4) 696 (11.9) 2 928 903 2 834.0 23.8 318.4
Gauteng 413 491 (26.58) 1 725 (29.4) 15 488 137 2 669.7 11.1 333.2
KwaZulu-Natal 333 748 (21.6) 554 (9.4) 11 531 628 2 894.2 4.8 269.7
Limpopo 63 112 (4.1) 186 (3.2) 5 852 553 1 078.4 3.2 64.0
Mpumalanga 74 659 (4.8) 682 (11.6) 4 679 786 1 595.4 14.6 195.4
North West 63 521 (4.1) 547 (9.3) 4 108 816 1 546.0 13.3 189.2
Northern Cape 36 105 (2.3) 448 (7.6) 1 292 786 2 792.8 34.7 387.8
Western Cape 282 440 (18.3) 922 (15.7) 7 005 741 4 031.6 13.2 399.9
Unknown
Total 1 545 431 5 870 59 622 350 2 592.0 9.8 261.5
Table 1. Number and cumulative/weekly incidence risk of laboratory-confirmed cases of COVID-19 and testing per 100 000 persons by province, South Africa, 3 March 2020 –27 March 2021 (n=1 545 431)
1New cases refer to cases whose samples were collected or received in the current reporting week; 2Percentage=n/total number of new cases (specimen collected or received in current reporting week); 32020 Mid-year population Statistics South Africa 4Data on number of tests conducted sourced from COVID-19 weekly testing report of the same reporting week

0
50
100
150
200
250
300
350
400
10 11 12 13 14 15 16 17 18 19 20 21 22 23 24 25 26 27 28 29 30 31 32 33 34 35 36 37 38 39 40 41 42 43 44 45 46 47 48 49 50 51 52 53
2020 2021
Wee
kly
inci
den
ce r
isk
(cas
es p
er 10
0 0
00
per
son
s)
Epidemiologic week
Eastern Cape Free State Gauteng KwaZulu-Natal
Limpopo Mpumalanga North West Northern Cape
Western Cape South Africa
0
300
600
900
1200
1500
1800
2100
2400
2700
3000
3300
3600
3900
4200
4500
10 11 12 13 14 15 16 17 18 19 20 21 22 23 24 25 26 27 28 29 30 31 32 33 34 35 36 37 38 39 40 41 42 43 44 45 46 47 48 49 50 51 52 53
2020 2021
Cu
mu
lati
ve i
nci
den
ce r
isk
(cas
es p
er 10
0 0
00
per
son
s)
Epidemiologic week
Eastern Cape Free State Gauteng
KwaZulu-Natal Limpopo Mpumalanga
North West Northern Cape Western Cape
South Africa
W E E K 1 2 2 0 2 1
COVID-19 WEEKLY EPIDEMIOLOGY BRIEF
TOLL-FREE NUMBER 0800 029 999 PAGE 6www.nicd.ac.za
Figure 4. Weekly incidence risk of laboratory-confirmed cases of COVID-19 by province and epidemiologic week, South Africa, 3 March 2020 –27 March 2021 (n=1 545 431)
Figure 3. Cumulative incidence risk of laboratory-confirmed cases of COVID-19 by province and epidemiologic week, South Africa, 3 March 2020 –27 March 2021 (n= 1 545 431)

0
300
600
900
1200
1500
1800
2100
2400
2700
3000
3300
3600
3900
4200
4500
4800
5100
5400
5700
6000
6300
6600
12 13 14 15 16 17 18 19 20 21 22 23 24 25 26 27 28 29 30 31 32 33 34 35 36 37 38 39 40 41 42 43 44 45 46 47 48 49 50 51 52 53
2020 2021
Dou
blin
g t
ime
(day
s)
Epidemiologic week
Eastern Cape Free State GautengKwaZulu-Natal Western Cape
W E E K 1 2 2 0 2 1
COVID-19 WEEKLY EPIDEMIOLOGY BRIEF
TOLL-FREE NUMBER 0800 029 999 PAGE 7www.nicd.ac.za
Figure 5. Doubling time of number of laboratory-confirmed cases of COVID-19 by province (for 5 provinces with the majority of cases) and epidemiologic week, South Africa, 23 March-2020 –20 March 2021 (n= 1 539 474)
Characteristics of COVID-19 cases in South Africa by age and sex
Cases of COVID-19 were reported across all age groups. The median age of COVID-19 cases in South Africa to date was 40 years with an interquartile range (IQR) of 29-53 years. The distribution of cases varied by age, with highest number of all cases to date in the 35-39-year (181 505/1 531 017, 11.9%) and 30-34-year (176 557/1 531 017, 11.5%) age groups (Figure 6). Similarly, among the cases reported in the past week, the highest number of cases was in the 30-34-year age group (569/5 784, 9.8%) and the 35-39-year age group (564/5 784, 9.8%). The median age for cases reported in week 12 of 2021 was similar (39 years, IQR 26-54), to that of total cases (40 years). The highest cumulative incidence risk remained among cases aged 50-54 years (5 254.0 cases per 100 000 persons), followed by cases aged 55-59 years (5 196.3 cases per 100 000 persons) and ≥80 years (5 103.8 cases per 100 000 persons). The lowest cumulative incidence risk was reported in the younger age-groups, 322.2 cases per 100 000 persons and 399.9 cases per 100 000 persons in the 0-4-and 5-9-year age groups, respectively (Figure 7 and Table 2). The highest weekly incidence risk among cases detected in week 12 of 2021 was reported in cases aged ≥80 years (24.9 cases per 100 000 persons), followed by cases in the 50-54-year age group (20.1 cases per 100 000 persons), and the lowest weekly
incidence risk was in the 0-4-year age group (1.5 cases per 100 000 persons) (Figure 8 and table 2). To date, the majority of COVID-19 cases reported were female 57.8% (883 590/1 528 573). This trend continued in the past week where 54.9% (3 197/5 825) of cases were female. The cumulative incidence risk has remained consistently higher among females (2 872.4 cases per 100 000 persons) than among males (2 195.9 cases per 100 000 persons) (Figure 9). The peak cumulative incidence risk was in the 50-54-year-age group (5 494.5 cases per 100 000 persons) for females, and in the ≥80-year-age group (5 299.3 cases per 100 000 persons) for males (Figure 10). In week 12 of 2021, the highest weekly incidence risk was in the ≥80-year age group (23.3 cases per 100 000 persons) and (27.9 cases per 100 000 persons) for both females and males, respectively. The higher prevalence and incidence risk among females compared to males could be explained by the fact that females are likely to be more represented in occupations, which put them in close proximity to others and thus exposing them to a higher risk of infection (e.g. teaching and health). This may also be partly explained by varying testing practices by age and sex (data not shown) and by different health seeking behaviour.

W E E K 1 2 2 0 2 1
COVID-19 WEEKLY EPIDEMIOLOGY BRIEF
TOLL-FREE NUMBER 0800 029 999 PAGE 8www.nicd.ac.za
Figure 6. Number of laboratory-confirmed cases of COVID-19 by age group and sex, South Africa, 3 March 2020 –27 March 2021 (n = 1 515 533, sex/age missing for 29 898)
Figure 7. Cumulative incidence risk of laboratory-confirmed cases of COVID-19 by age group in years and epidemiologic week, South Africa, 3 March 2020-27 March 2021 (n=1 531 017, 14 414 missing age)
0
500
1000
1500
2000
2500
3000
3500
4000
4500
5000
10 11 12 13 14 15 16 17 18 19 20 21 22 23 24 25 26 27 28 29 30 31 32 33 34 35 36 37 38 39 40 41 42 43 44 45 46 47 48 49 50 51 52 53
2020 2021
Cu
mu
lati
ve in
cid
ence
ris
k(c
ases
per
100
00
0 p
erso
ns)
Epidemiologic week
0-4 5-9 10-14 15-19
20-39 40-59 60 All ages
0
10000
20000
30000
40000
50000
60000
70000
80000
0-4 5-
9
10-1
4
15-1
9
20-2
4
25-2
9
30-3
4
35-3
9
40
-44
45-
49
50-5
4
55-5
9
60-6
4
65-6
9
70-7
4
75-7
9
80+
Nu
mb
er o
f cas
es
Age group (years)
Female Male

W E E K 1 2 2 0 2 1
COVID-19 WEEKLY EPIDEMIOLOGY BRIEF
TOLL-FREE NUMBER 0800 029 999 PAGE 9www.nicd.ac.za
Figure 8. Weekly incidence risk of laboratory-confirmed cases of COVID-19 by age group in years and epidemiologic week, South Africa, 3 March 2020 -27 March 2021 (n=1 531 017, 14 414 missing age)
Figure 9. Cumulative incidence risk by sex and epidemiologic week, South Africa, 3 March 2020 –27 March 2021 (n=1 528 573, sex missing for 16 858)
0
250
500
750
1000
1250
1500
1750
2000
2250
2500
2750
3000
10 11 12 13 14 15 16 17 18 19 20 21 22 23 24 25 26 27 28 29 30 31 32 33 34 35 36 37 38 39 40 41 42 43 44 45 46 47 48 49 50 51 52 53
2020 2021
Cu
mu
latv
e in
cid
ence
ris
k(c
ases
per
100
00
0 p
erso
ns)
Epidemiologic week
Female Male All
0
50
100
150
200
250
300
350
400
450
500
10 11 12 13 14 15 16 17 18 19 20 21 22 23 24 25 26 27 28 29 30 31 32 33 34 35 36 37 38 39 40 41 42 43 44 45 46 47 48 49 50 51 52 53
2020 2021
Wee
kly
inci
den
ce r
isk
(Cas
es p
er 10
0 0
00
per
son
s)
Epidemiologic week
0-4 5-9 10-14 15-19 20-39 40-59 60 All ages

Age group (years)
Cumulative cases (n) (percentage, n/total cases in South
Africa)
New cases1 detected in week 12 (21-27 Mar 2021), n (percentage2, n/total)
Population in mid-20203, n
Cumulative incidence risk (cases per 100 000 persons)
Incidence risk of new cases detected
in week 12 of 2021 (cases/100 000
persons)
0-4 18 506 (1.2) 84 (1.5) 5 743 450 322.2 1.5
5-9 22 856 (1.5) 90 (1.6) 5 715 952 399.9 1.6
10-14 38 736 (2.5) 250 (4.3) 5 591 553 692.8 4.5
15-19 63 471 (4.1) 427 (7.4) 4 774 579 1 329.4 8.9
20-24 93 158 (6.1) 489 (8.5) 4 823 367 1 931.4 10.1
25-29 149 305 (9.8) 438 (7.6) 5 420 754 2 754.3 8.1
30-34 176 557 (11.5) 569 (9.8) 5 641 750 3 129.5 10.1
35-39 181 505 (11.9) 564 (9.8) 4 798 293 3 782.7 11.8
40-44 157 030 (10.3) 477 (8.2) 3 733 942 4 205.5 12.8
45-49 149 143 (9.7) 492 (8.5) 3 169 648 4 705.3 15.5
50-54 135 095 (8.8) 518 (9.0) 2 571 263 5 254.0 20.1
55-59 114 907 (7.5) 413 (7.1) 2 211 309 5 196.3 18.7
60-64 82 402 (5.4) 305 (5.3) 1 796 316 4 587.3 17.0
65-69 55 206 (3.6) 232 (4.0) 1 408 665 3 919.0 16.5
70-74 39 150 (2.6) 169 (2.9) 1 007 174 3 887.1 16.8
75-79 24 527 (1.6) 123 (2.1) 637 062 3 850.0 19.3
≥80 29 463 (1.9) 144 (2.5) 577 273 5 103.8 24.9
Unknown 14 414 86
Total 1 545 431 5 870 59 622 350 2 592.0 9.8
Table 2. Number of laboratory-confirmed cases of COVID-19 and cumulative/weekly incidence risk by age group, South Africa, 3 March 2020 –27 March 2021, n= 1 531 017, 14 414 missing age)
1New cases refer to cases whose samples were collected or received in the current reporting week; 2Percentage=n/total number of new cases (specimen collected or received in current reporting week); 32020 Mid-year population Statistics South Africa
W E E K 1 2 2 0 2 1
COVID-19 WEEKLY EPIDEMIOLOGY BRIEF
TOLL-FREE NUMBER 0800 029 999 PAGE 10www.nicd.ac.za

0
500
1000
1500
2000
2500
3000
3500
4000
4500
0-4 5-9
10-1
4
15-1
9
20-2
4
25-2
9
30-3
4
35-3
9
40
-44
45-
49
50-5
4
55-5
9
60-6
4
65-6
9
70-7
4
75-7
9
80+
Cu
mu
lati
ve in
cid
ence
ris
k (c
ases
per
100
00
0 p
erso
ns)
Age group (years)
Female incidence Male incidence
W E E K 1 2 2 0 2 1
COVID-19 WEEKLY EPIDEMIOLOGY BRIEF
TOLL-FREE NUMBER 0800 029 999 PAGE 11www.nicd.ac.za
Figure 10. Cumulative risk by age group and sex, South Africa, 3 March 2020 –27 March 2021 (n=1 515 533, sex/age missing for 29 898)
Provincial trends of COVID-19 cases
All provinces have been reporting a decline in number of new cases since week 2 of 2021, except Northern Cape which reported an increase from week 10 of 2021 to week 11 and North West in week 11 of 2021. Changes in trends by district and age group for each province are presented below.
Eastern Cape Province
Of the 195 349 cases reported from the Eastern Cape Province, 173 189 (88.7%) cases had allocation by district. In the past week, three districts reported an increase in weekly incidence risk, the Chris Hani (0.5 cases per 100 000 persons, 44.4% increase), the Alfred Nzo (0.6 cases per 100 000 persons, 250.0% increase) and the Sarah Baartman (1.7 cases per 100 000 persons, 100.0% increase) districts, compared to the previous week (Figure 11).
In the past week, all age groups reported a decrease in weekly incidence risk, except the 40-59-year age group which reported no change in weekly incidence risk, compared to the previous week (Figure 12).
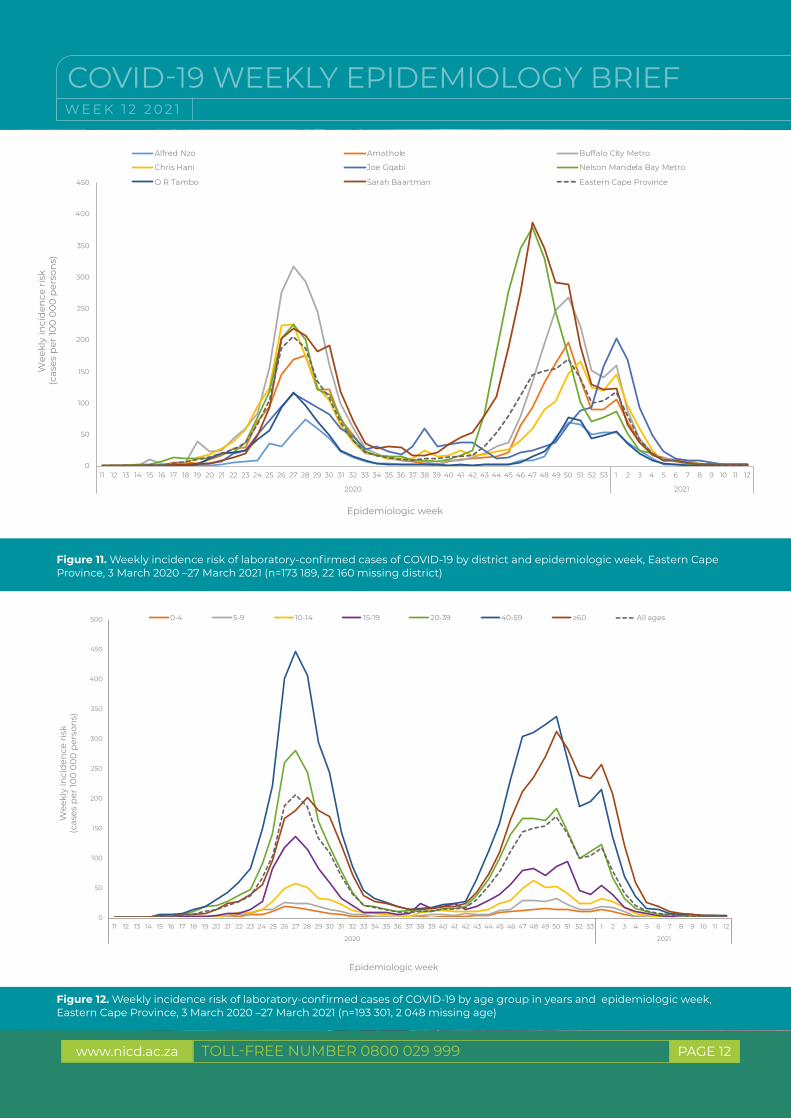
Figure 12. Weekly incidence risk of laboratory-confirmed cases of COVID-19 by age group in years and epidemiologic week, Eastern Cape Province, 3 March 2020 –27 March 2021 (n=193 301, 2 048 missing age)
Figure 11. Weekly incidence risk of laboratory-confirmed cases of COVID-19 by district and epidemiologic week, Eastern Cape Province, 3 March 2020 –27 March 2021 (n=173 189, 22 160 missing district)
0
50
100
150
200
250
300
350
400
450
500
11 12 13 14 15 16 17 18 19 20 21 22 23 24 25 26 27 28 29 30 31 32 33 34 35 36 37 38 39 40 41 42 43 44 45 46 47 48 49 50 51 52 53
2020 2021
Wee
kly
inci
den
ce r
isk
(cas
es p
er 10
0 0
00
per
son
s)
Epidemiologic week
0-4 5-9 10-14 15-19 20-39 40-59 60 All ages
0
50
100
150
200
250
300
350
400
450
11 12 13 14 15 16 17 18 19 20 21 22 23 24 25 26 27 28 29 30 31 32 33 34 35 36 37 38 39 40 41 42 43 44 45 46 47 48 49 50 51 52 53
2020 2021
Wee
kly
inci
den
ce r
isk
(cas
es p
er 10
0 0
00
per
son
s)
Epidemiologic week
Alfred Nzo Amathole Buffalo City Metro
Chris Hani Joe Gqabi Nelson Mandela Bay Metro
O R Tambo Sarah Baartman Eastern Cape Province
W E E K 1 2 2 0 2 1
COVID-19 WEEKLY EPIDEMIOLOGY BRIEF
TOLL-FREE NUMBER 0800 029 999 PAGE 12www.nicd.ac.za
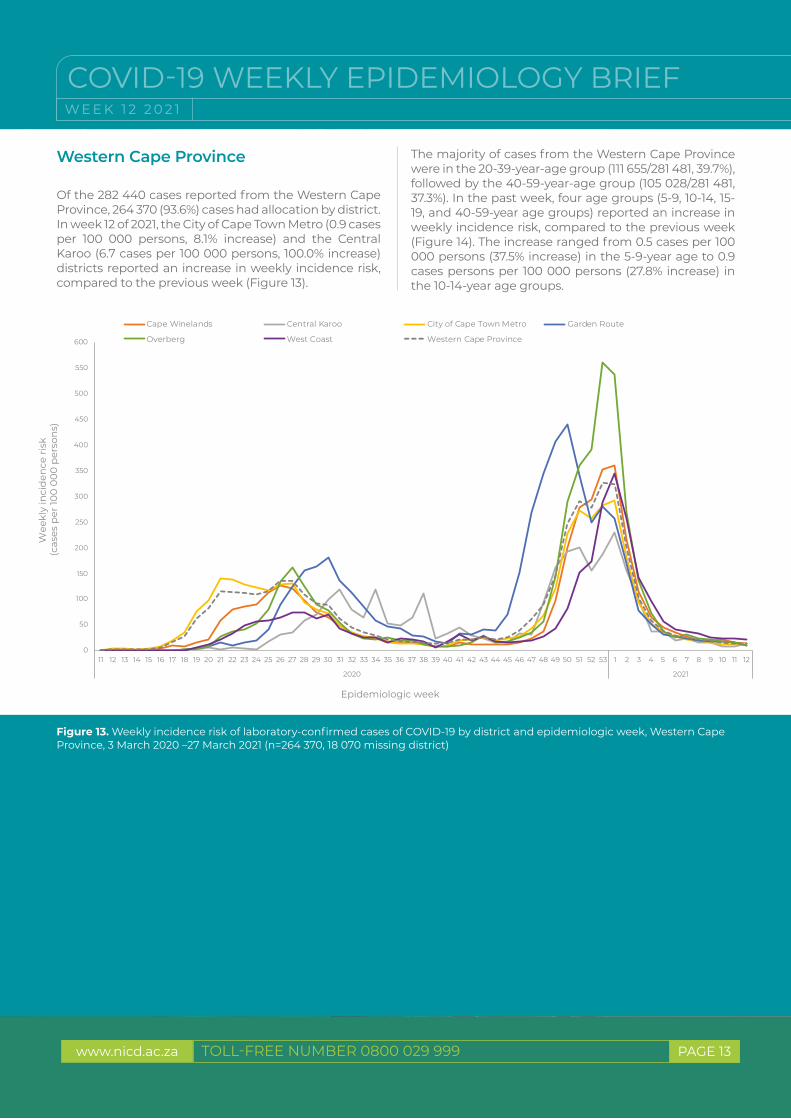
Figure 13. Weekly incidence risk of laboratory-confirmed cases of COVID-19 by district and epidemiologic week, Western Cape Province, 3 March 2020 –27 March 2021 (n=264 370, 18 070 missing district)
0
50
100
150
200
250
300
350
400
450
500
550
600
11 12 13 14 15 16 17 18 19 20 21 22 23 24 25 26 27 28 29 30 31 32 33 34 35 36 37 38 39 40 41 42 43 44 45 46 47 48 49 50 51 52 53
2020 2021
Wee
kly
inci
den
ce r
isk
(cas
es p
er 10
0 0
00
per
son
s)
Epidemiologic week
Cape Winelands Central Karoo City of Cape Town Metro Garden Route
Overberg West Coast Western Cape Province
W E E K 1 2 2 0 2 1
COVID-19 WEEKLY EPIDEMIOLOGY BRIEF
TOLL-FREE NUMBER 0800 029 999 PAGE 13www.nicd.ac.za
Western Cape Province
Of the 282 440 cases reported from the Western Cape Province, 264 370 (93.6%) cases had allocation by district. In week 12 of 2021, the City of Cape Town Metro (0.9 cases per 100 000 persons, 8.1% increase) and the Central Karoo (6.7 cases per 100 000 persons, 100.0% increase) districts reported an increase in weekly incidence risk, compared to the previous week (Figure 13).
The majority of cases from the Western Cape Province were in the 20-39-year-age group (111 655/281 481, 39.7%), followed by the 40-59-year-age group (105 028/281 481, 37.3%). In the past week, four age groups (5-9, 10-14, 15-19, and 40-59-year age groups) reported an increase in weekly incidence risk, compared to the previous week (Figure 14). The increase ranged from 0.5 cases per 100 000 persons (37.5% increase) in the 5-9-year age to 0.9 cases persons per 100 000 persons (27.8% increase) in the 10-14-year age groups.

W E E K 1 2 2 0 2 1
COVID-19 WEEKLY EPIDEMIOLOGY BRIEF
TOLL-FREE NUMBER 0800 029 999 PAGE 14www.nicd.ac.za
Figure 14. Weekly incidence risk of laboratory-confirmed cases of COVID-19 by age group in years and epidemiologic week, Western Cape Province, 3 March 2020 –27 March 2021 (n=281 481, 959 missing age)
Gauteng Province
Of the 413 491 cases reported from the Gauteng Province, 358 564 (86.7%) had allocation by district. In the past week, two districts reported an increase in weekly incidence risk, the Sedibeng District (1.0 cases per 100 000 persons, 6.4% increase) and the City of Tshwane Metro (1.1 cases per 100 000 persons, 10.8% increase), compared to the previous week (Figure 15).
In the past week, the 0-4-year (0.2 cases per 100 000 persons, 12.0% increase) and the 15-19-year (0.8 cases per 100 000 persons, 6.8% increase) age groups reported an increase in weekly incidence risk, and the 10-14-year age showed no change in weekly incidence risk, compared to the previous week (Figure 16).
0
50
100
150
200
250
300
350
400
450
500
550
600
650
11 12 13 14 15 16 17 18 19 20 21 22 23 24 25 26 27 28 29 30 31 32 33 34 35 36 37 38 39 40 41 42 43 44 45 46 47 48 49 50 51 52 53
2020 2021
Wee
kly
inci
den
ce r
isk
(cas
es p
er 10
0 0
00
per
son
s)
Epidemiologic week
0-4 5-9 10-14 15-19 20-39 40-59 60 All ages

W E E K 1 2 2 0 2 1
COVID-19 WEEKLY EPIDEMIOLOGY BRIEF
TOLL-FREE NUMBER 0800 029 999 PAGE 15www.nicd.ac.za
Figure 15. Weekly incidence risk of laboratory-confirmed cases of COVID-19 by district and epidemiologic week, Gauteng Province, 3 March 2020 –27 March 2021 (n=358 564, 54 927 missing district)
Figure 16. Weekly incidence risk of laboratory-confirmed cases of COVID-19 by age group in years and epidemiologic week, Gauteng Province, 3 March 2020 -27 March 2021 (n=408 752, 4 739 missing age).
0
50
100
150
200
250
300
350
400
450
10 11 12 13 14 15 16 17 18 19 20 21 22 23 24 25 26 27 28 29 30 31 32 33 34 35 36 37 38 39 40 41 42 43 44 45 46 47 48 49 50 51 52 53
2020 2021
Wee
kly
inci
den
ce r
isk
(cas
es p
er 10
0 0
00
per
son
s)
Epidemiologic week
0-4 5-9 10-14 15-19 20-39 40-59 60 All ages
0
50
100
150
200
250
300
350
10 11 12 13 14 15 16 17 18 19 20 21 22 23 24 25 26 27 28 29 30 31 32 33 34 35 36 37 38 39 40 41 42 43 44 45 46 47 48 49 50 51 52 53
2020 2021
Wee
kly
inci
den
ce r
isk
(Cas
es p
er 10
0 0
00
per
son
s)
Epidemiologic week
City of Johannesburg Metro City of Tshwane Metro Ekurhuleni Metro Sedibeng West Rand Gauteng Province

W E E K 1 2 2 0 2 1
COVID-19 WEEKLY EPIDEMIOLOGY BRIEF
TOLL-FREE NUMBER 0800 029 999 PAGE 16www.nicd.ac.za
Figure 17. Weekly incidence risk of laboratory-confirmed cases of COVID-19 by district and epidemiologic week, KwaZulu-Natal Province, 3 March 2020 –27 March 2021 (n=250 094, 83 654 missing district)
KwaZulu-Natal Province
Of the 333 748 cases reported from the KwaZulu-Natal Province, 250 094 (74.9%) had allocation by district. In the past week, the Amajuba District reported an increase in weekly incidence risk (2.3 cases per 100 000 persons, 28.3% increase), compared to the previous week (Figure 17).
In week 12, all age groups reported a decrease in weekly incidence risk, compared to the previous week (Figure 18).
0
500
1000
1500
2000
2500
10 11 12 13 14 15 16 17 18 19 20 21 22 23 24 25 26 27 28 29 30 31 32 33 34 35 36 37 38 39 40 41 42 43 44 45 46 47 48 49 50 51 52 53
2020 2021
Wee
kly
inci
den
ce r
isk
(cas
es p
er 10
0 0
00
per
son
s)
Epidemiologic week
Amajuba Harry Gwala King Cetshwayo Ugu
Zululand eThekwini iLembe uMgungundlovu
uMkhanyakude uMzinyathi uThukela KwaZulu-Natal Province

W E E K 1 2 2 0 2 1
COVID-19 WEEKLY EPIDEMIOLOGY BRIEF
TOLL-FREE NUMBER 0800 029 999 PAGE 17www.nicd.ac.za
Figure 18. Weekly incidence risk of laboratory-confirmed cases of COVID-19 by age group in years and epidemiologic week, KwaZulu-Natal Province, 3 March 2020 –27 March 2021 (n=330 271, 3 477 missing age)
Free State Province
Of the 83 006 cases reported from the Free State Province, 75 595 (91.1%) had allocation by district. In the past week, the Mangaung Metro (1.6 cases per 100 000 persons, 7.6% increase), Fezile Dabi (2.2 cases per 100 000 persons, 14.9% increase) and the Xhariep (10.8 cases per 100 000 persons, 93.3% increase) districts reported
an increase in weekly incidence risk, compared to the previous week (Figure 19).
In the past week, the 10-14-year (1.0 cases per 100 000 persons, 8.3% increase) and the 40-59-year (1.2 cases per 100 000 persons, 3.0% increase) age groups reported an increase in weekly incidence risks, compared to the previous week (Figure 20)
0
100
200
300
400
500
600
700
800
10 11 12 13 14 15 16 17 18 19 20 21 22 23 24 25 26 27 28 29 30 31 32 33 34 35 36 37 38 39 40 41 42 43 44 45 46 47 48 49 50 51 52 53
2020 2021
Wee
kly
inci
den
ce r
isk
(cas
es p
er 10
0 0
00
per
son
s)
Epidemiologic week
0-4 5-9 10-14 15-19 20-39 40-59 60 All ages

W E E K 1 2 2 0 2 1
COVID-19 WEEKLY EPIDEMIOLOGY BRIEF
TOLL-FREE NUMBER 0800 029 999 PAGE 18www.nicd.ac.za
Figure 19. Weekly incidence risk of laboratory-confirmed cases of COVID-19 by district and epidemiologic week, Free State Province, 3 March 2020 –27 March 2021 (n=75 595, 7 411 missing district)
Figure 20. Weekly incidence risk of laboratory-confirmed cases of COVID-19 by age group in years and epidemiologic week, Free State Province, 3 March 2020 –27 March 2021 (n=82 649, 357 missing age)
0
50
100
150
200
250
300
350
400
450
500
12 13 14 15 16 17 18 19 20 21 22 23 24 25 26 27 28 29 30 31 32 33 34 35 36 37 38 39 40 41 42 43 44 45 46 47 48 49 50 51 52 53
2020 2021
Wee
kly
inci
den
ce r
isk
(cas
es p
er 10
0 0
00
per
son
s)
Epidemiologic week
0-4 5-9 10-14 15-19 20-39 40-59 60 All ages
0
50
100
150
200
250
300
350
12 13 14 15 16 17 18 19 20 21 22 23 24 25 26 27 28 29 30 31 32 33 34 35 36 37 38 39 40 41 42 43 44 45 46 47 48 49 50 51 52 53
2020 2021
Wee
kly
inci
den
ce r
isk
(cas
es p
er 10
0 0
00
per
son
s)
Epidemiologic week
Fezile Dabi Lejweleputswa Mangaung Metro Thabo Mofutsanyane Xhariep Free State Province

W E E K 1 2 2 0 2 1
COVID-19 WEEKLY EPIDEMIOLOGY BRIEF
TOLL-FREE NUMBER 0800 029 999 PAGE 19www.nicd.ac.za
Figure 21. Weekly incidence risk of laboratory-confirmed cases of COVID-19 by district and epidemiologic week, Limpopo Province, 3 March 2020 –27 March 2021 (n=55 046, 8 066 missing district)
Limpopo Province
Of the 63 112 cases reported from the Limpopo Province, 55 046 (87.2%) had allocation by district. In the past week, the Capricorn District (1.8 cases per 100 000 persons, 109.5% increase) reported an increase in weekly incidence risk, and the Sekhukhune District showed no change in weekly incidence risk, compared to the previous week (Figure 21).
In the past week, the 20-39-year (0.1 cases per 100 000 persons, 3.0% increase), 10-14-year (0.2 cases per 100 000 persons, 100.0% increase), and 15-19-year (2.0 cases per 100 000 persons, 220.0% increase) age groups reported an increase in weekly incidence risk, and 0-4 and 5-9-year age groups showed no change in weekly incidence risk, compared to the previous week (Figure 22).
0
20
40
60
80
100
120
140
160
180
200
220
240
260
280
11 12 13 14 15 16 17 18 19 20 21 22 23 24 25 26 27 28 29 30 31 32 33 34 35 36 37 38 39 40 41 42 43 44 45 46 47 48 49 50 51 52 53
2020 2021
Wee
kly
inci
den
ce r
isk
(cas
es p
er 10
0 0
00
per
son
s)
Epidemiologic week
Capricorn Mopani Sekhukhune Vhembe Waterberg Limpopo Province

W E E K 1 2 2 0 2 1
COVID-19 WEEKLY EPIDEMIOLOGY BRIEF
TOLL-FREE NUMBER 0800 029 999 PAGE 20www.nicd.ac.za
Figure 22. Weekly incidence risk of laboratory-confirmed cases of COVID-19 by age group in years and epidemiologic week, Limpopo Province, 3 March 2020 –27 March 2021 (n= 62 753, 359 missing age)
Mpumalanga Province
Of the 74 659 cases reported from the Mpumalanga Province, 60 121 (80.5%) had allocation by district. In the past week, the Gert Sibande Districts (1.8 cases per 100 000 persons, 9.6% increase) reported an increase in weekly incidence risk, compared to the previous week (Figure 24).
In the past week, the 15-19-year (1.8 cases per 100 000 persons, 14.6% increase) and the 10-14-year (2.4 cases per 100 000 persons, 26.2% increase) age groups reported an increase in weekly incidence risk, compared to the previous week (Figure 23).
0
50
100
150
200
250
300
350
400
450
500
11 12 13 14 15 16 17 18 19 20 21 22 23 24 25 26 27 28 29 30 31 32 33 34 35 36 37 38 39 40 41 42 43 44 45 46 47 48 49 50 51 52 53
2020 2021
Wee
kly
inci
den
ce r
isk
(cas
es p
er 10
0 0
00
per
son
s)
Epidemiologic week
0-4 5-9 10-14 15-19 20-39 40-59 60 All ages

W E E K 1 2 2 0 2 1
COVID-19 WEEKLY EPIDEMIOLOGY BRIEF
TOLL-FREE NUMBER 0800 029 999 PAGE 21www.nicd.ac.za
Figure 23. Weekly incidence risk of laboratory-confirmed cases of COVID-19 by district and epidemiologic week, Mpumalanga Province, 3 March 2020 -27 March 2021 (n=60 121, 14 538 missing district)
Figure 24. Weekly incidence risk of laboratory-confirmed cases of COVID-19 by age group and epidemiologic week, Mpumalanga Province, 3 March 2020 -27 March 2021 (n=73 237, 1 422 missing age)
0
50
100
150
200
250
300
350
400
11 12 13 14 15 16 17 18 19 20 21 22 23 24 25 26 27 28 29 30 31 32 33 34 35 36 37 38 39 40 41 42 43 44 45 46 47 48 49 50 51 52 53
2020 2021
Wee
kly
inci
den
ce r
isk
(Cas
es p
er 10
0 0
00
per
ons)
Epidemiologic week
0-4 5-9 10-14 15-19 20-39 40-59 60 All ages
0
20
40
60
80
100
120
140
160
180
200
220
11 12 13 14 15 16 17 18 19 20 21 22 23 24 25 26 27 28 29 30 31 32 33 34 35 36 37 38 39 40 41 42 43 44 45 46 47 48 49 50 51 52 53
2020 2021
Wee
kly
inci
den
ce r
isk
(cas
es p
er 10
0 0
00
per
son
s)
Epidemiologic week
Ehlanzeni Gert Sibande Nkangala Mpumalanga Province
W E E K 1 2 2 0 2 1
COVID-19 WEEKLY EPIDEMIOLOGY BRIEF
TOLL-FREE NUMBER 0800 029 999 PAGE 22www.nicd.ac.za
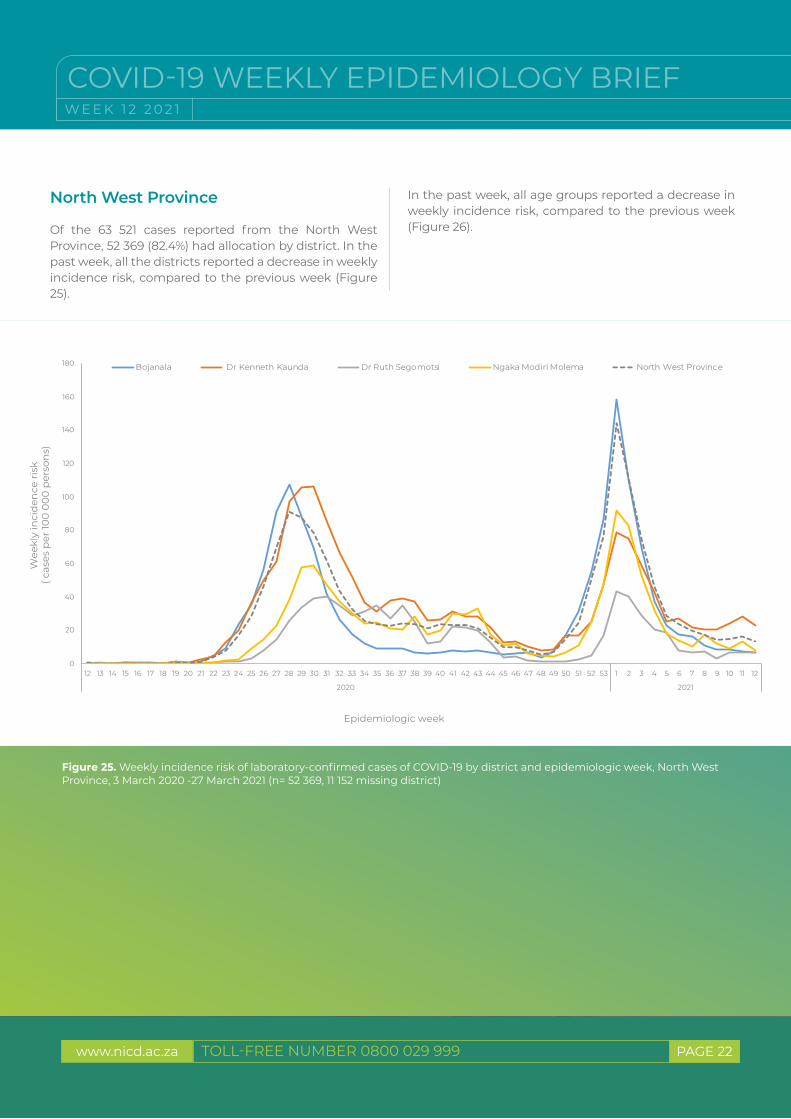
Figure 25. Weekly incidence risk of laboratory-confirmed cases of COVID-19 by district and epidemiologic week, North West Province, 3 March 2020 -27 March 2021 (n= 52 369, 11 152 missing district)
North West Province
Of the 63 521 cases reported from the North West Province, 52 369 (82.4%) had allocation by district. In the past week, all the districts reported a decrease in weekly incidence risk, compared to the previous week (Figure 25).
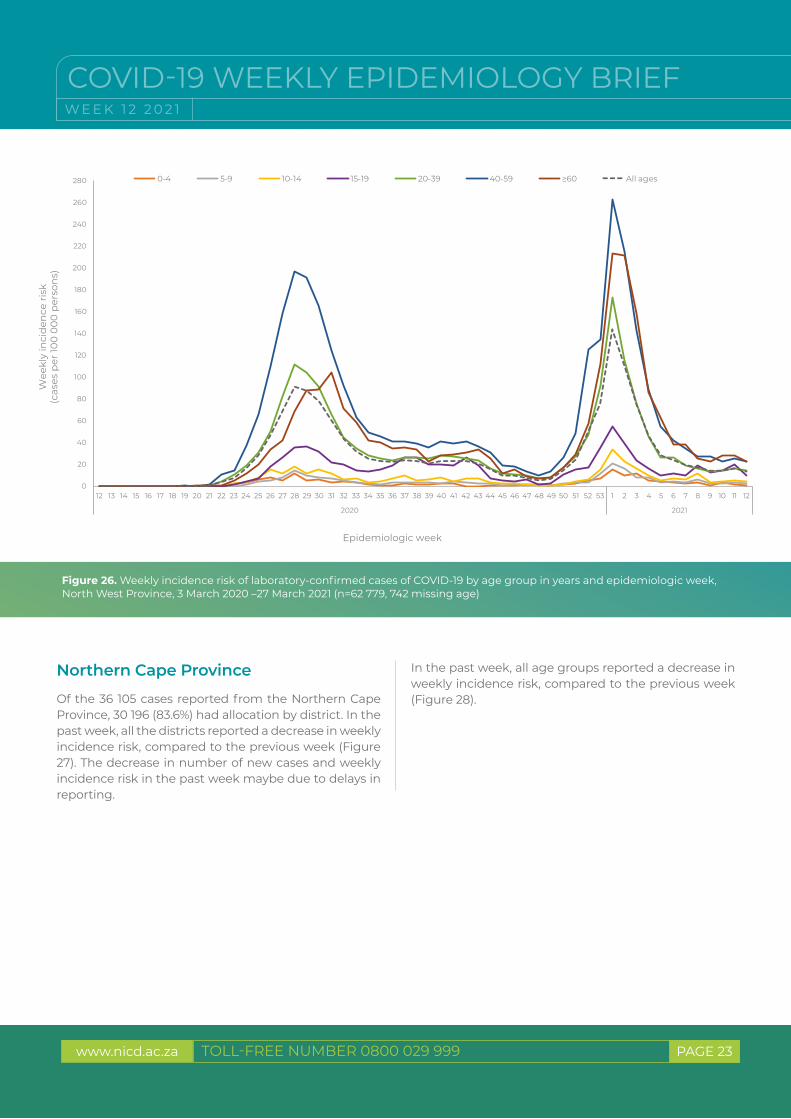
In the past week, all age groups reported a decrease in weekly incidence risk, compared to the previous week (Figure 26).
0
20
40
60
80
100
120
140
160
180
12 13 14 15 16 17 18 19 20 21 22 23 24 25 26 27 28 29 30 31 32 33 34 35 36 37 38 39 40 41 42 43 44 45 46 47 48 49 50 51 52 53
2020 2021
Wee
kly
inci
den
ce r
isk
( cas
es p
er 10
0 0
00
per
son
s)
Epidemiologic week
Bojanala Dr Kenneth Kaunda Dr Ruth Segomotsi Ngaka Modiri Molema North West Province
W E E K 1 2 2 0 2 1
COVID-19 WEEKLY EPIDEMIOLOGY BRIEF
TOLL-FREE NUMBER 0800 029 999 PAGE 23www.nicd.ac.za
Figure 26. Weekly incidence risk of laboratory-confirmed cases of COVID-19 by age group in years and epidemiologic week, North West Province, 3 March 2020 –27 March 2021 (n=62 779, 742 missing age)
Northern Cape Province
Of the 36 105 cases reported from the Northern Cape Province, 30 196 (83.6%) had allocation by district. In the past week, all the districts reported a decrease in weekly incidence risk, compared to the previous week (Figure 27). The decrease in number of new cases and weekly incidence risk in the past week maybe due to delays in reporting.
In the past week, all age groups reported a decrease in weekly incidence risk, compared to the previous week (Figure 28).
0
20
40
60
80
100
120
140
160
180
200
220
240
260
280
12 13 14 15 16 17 18 19 20 21 22 23 24 25 26 27 28 29 30 31 32 33 34 35 36 37 38 39 40 41 42 43 44 45 46 47 48 49 50 51 52 53
2020 2021
Wee
kly
inci
den
ce r
isk
(cas
es p
er 10
0 0
00
per
son
s)
Epidemiologic week
0-4 5-9 10-14 15-19 20-39 40-59 60 All ages

W E E K 1 2 2 0 2 1
COVID-19 WEEKLY EPIDEMIOLOGY BRIEF
TOLL-FREE NUMBER 0800 029 999 PAGE 24www.nicd.ac.za
Figure 27. Weekly incidence risk of laboratory-confirmed cases of COVID-19 by district and epidemiologic week, Northern Cape Province, 3 March 2020 -27 March 2021 (n=30 196, 5 909 missing district)
Figure 28. Weekly incidence risk of laboratory-confirmed cases ofCOVID-19 by age group in years and epidemiologic week, Northern Cape Province, 3 March 2020 –27 March 2021 (n=35 794, 311 missing age)
0
50
100
150
200
250
300
350
12 13 14 15 17 18 19 20 21 22 23 24 25 26 27 28 29 30 31 32 33 34 35 36 37 38 39 40 41 42 43 44 45 46 47 48 49 50 51 52 53
2020 2021
Wee
kly
inci
den
ce r
isk
(cas
es p
er 10
0 0
00
per
son
s)
Epidemiologic week
0-4 5-9 10-14 15-19 20-39 40-59 60 All ages
0
50
100
150
200
250
300
350
400
450
12 13 14 15 17 18 19 20 21 22 23 24 25 26 27 28 29 30 31 32 33 34 35 36 37 38 39 40 41 42 43 44 45 46 47 48 49 50 51 52 53
2020 2021
Wee
kly
inci
den
ce r
isk
(cas
es p
er 10
0 0
00
per
son
s)
Epidemiologic week
Frances Baard John Taolo Gaetsewe Namakwa Pixley ka Seme ZF Mgcawu Northern Cape Province

W E E K 1 2 2 0 2 1
COVID-19 WEEKLY EPIDEMIOLOGY BRIEF
TOLL-FREE NUMBER 0800 029 999 PAGE 25www.nicd.ac.za
Limitations
This report is based on laboratory-based surveillance of laboratory-confirmed cases. The number of reported cases is heavily dependent on testing practices. Although trends over time and comparisons by geographic area are presented in this report, changes in testing practices over time or differences by region may partially explain the results. The crude CFR reported here is subject to numerous limitations: it is likely to be an underestimation as reporting of deaths may be delayed and deaths which occurred outside health facilities may be missed. Differences in health-seeking behaviour by age group and sex could also contribute to observed differences in case numbers between groups. The reported doubling time estimates are affected by the number of tests conducted; if fewer tests are performed, this will also increase the doubling time estimate. Delays in reporting may result in incomplete data for recent weeks, leading to an apparent reduction in number of cases.
Conclusions
To date, 1 545 431 cases, including 52 663 deaths have been reported. The increase in number of new cases and weekly incidence risk reported in the Northern Cape Province in week 10 and week 11 was possibly due to community transmission and localised outbreaks/ clusters in school-going age groups. Individual clusters are investigated by local epidemiologic teams. The decrease in the Northern Cape Province in the past week maybe in part due to delays in reporting. Demographic trends have remained unchanged this reporting period, children aged <10 years had the lowest incidence risk and individuals aged 40-59 years had the highest incidence. The decreasing trends in other provinces in numbers of new cases in the last week may be in part as a result of delay in reporting or changes in testing practices in the different provinces. In addition, number of confirmed cases diagnosed on antigen tests maybe underestimated as they are used in a number of different settings and results may not be fully reported yet.