covid epi update
TRANSCRIPT

COVID EPI UPDATE
5 August 2021

7-day moving average number of new cases by province and date of reporting, 12 April 2020 to date, South Africa
0
2000
4000
6000
8000
10000
12000
14000
18-Apr
18-May
18-Jun
18-Jul
18-Aug
18-Sep
18-Oct
18-Nov
18-Dec
18-Jan
18-Feb
18-Mar
18-Apr
18-May
18-Jun
18-Jul
7-d
ay
mo
vin
g a
ve
rag
e n
o.
of
ne
w d
ail
y c
ase
s
Date reported (2020/2021)
Eastern Cape Free State Gauteng KwaZulu-Natal Limpopo
Mpumalanga North West Northern Cape Western Cape Unknown

Provincial updates
4
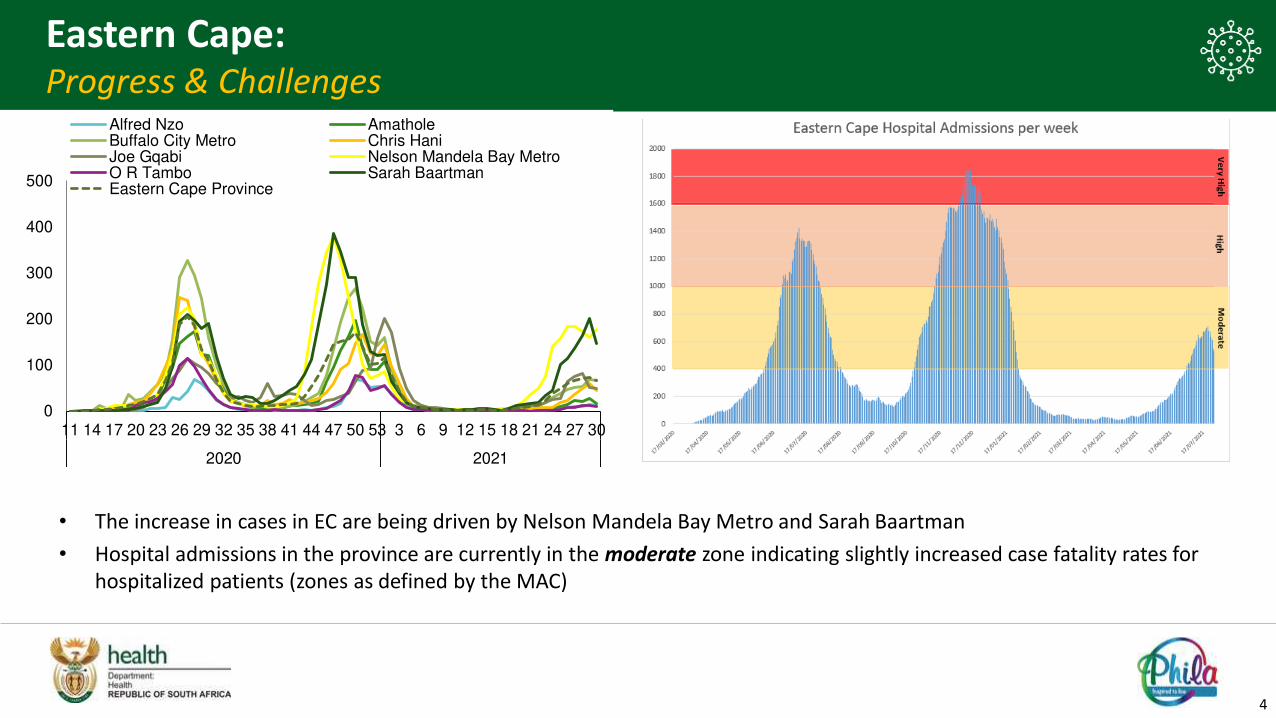
Eastern Cape: Progress & Challenges
• The increase in cases in EC are being driven by Nelson Mandela Bay Metro and Sarah Baartman
• Hospital admissions in the province are currently in the moderate zone indicating slightly increased case fatality rates for
hospitalized patients (zones as defined by the MAC)
0
100
200
300
400
500
11 14 17 20 23 26 29 32 35 38 41 44 47 50 53 3 6 9 12 15 18 21 24 27 30
2020 2021
Alfred Nzo AmatholeBuffalo City Metro Chris HaniJoe Gqabi Nelson Mandela Bay MetroO R Tambo Sarah BaartmanEastern Cape Province

5
Free State: Progress & Challenges
• All districts in the FS are contributing to the high case loads observed in the province
• Hospital admissions in the province are currently in the high zone indicating increased case fatality rates for hospitalized patients
(zones as defined by the MAC) – admissions have remained in this zone since March, indicating continued strain on HCWs in the
province
0
50
100
150
200
250
300
350
12 15 18 21 24 27 30 33 36 39 42 45 48 51 1 4 7 10 13 16 19 22 25 28
2020 2021
Fezile Dabi Lejweleputswa
Mangaung Metro Thabo Mofutsanyane
Xhariep Free State Province

6
KwaZulu-Natal: Progress & Challenges
• Increase in new cases, nearing the pre-unrest levels. Increase in eThekwini and Zululand
• Hospital admissions in the province are currently in the moderate zone
• There are several clusters across the province contributing to the upsurge in number of cases.
• Compliance to COVID-19 regulations is a challenge as there are few protests especially in eThekwini Metro Municipality.
• Non-compliance of COVID-19 regulations during funeral services.
0
100
200
300
400
500
10 13 16 19 22 25 28 31 34 37 40 43 46 49 52 2 5 8 11 14 17 20 23 26 29
2020 2021
Amajuba Harry GwalaKing Cetshwayo UguZululand eThekwiniiLembe uMgungundlovuuMkhanyakude uMzinyathiuThukela KwaZulu-Natal Province
7
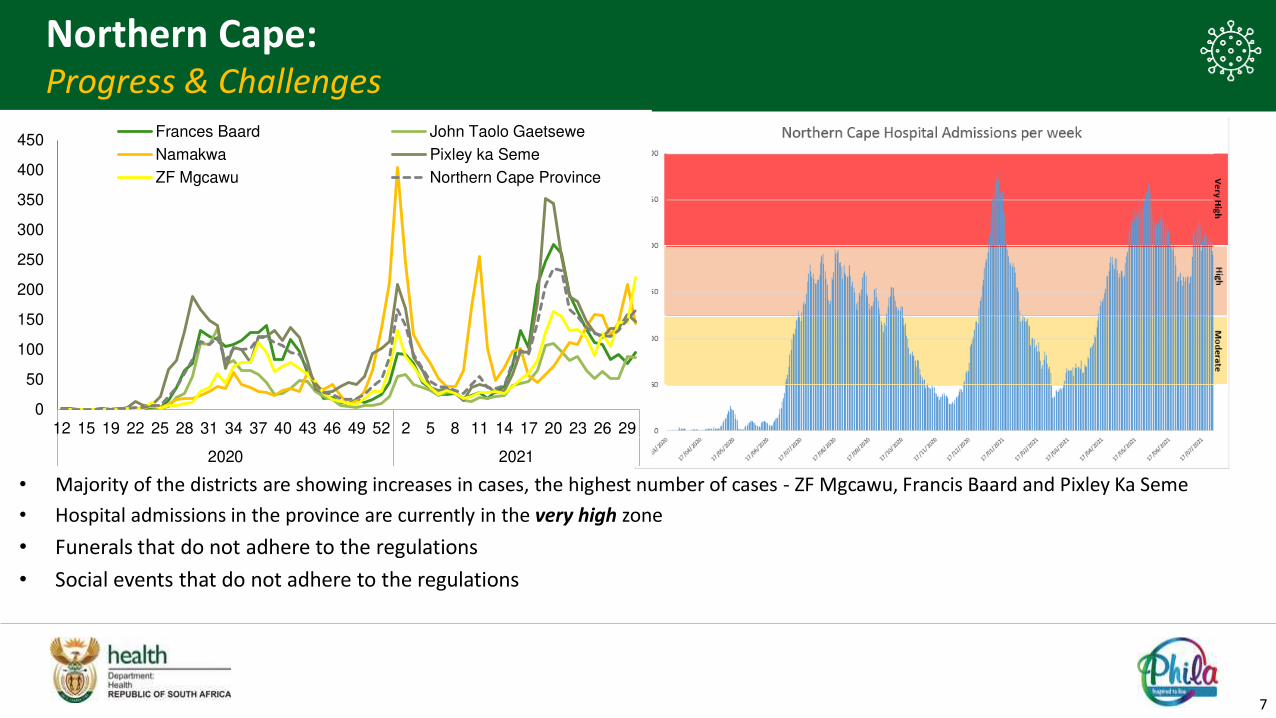
Northern Cape: Progress & Challenges
• Majority of the districts are showing increases in cases, the highest number of cases - ZF Mgcawu, Francis Baard and Pixley Ka Seme
• Hospital admissions in the province are currently in the very high zone
• Funerals that do not adhere to the regulations
• Social events that do not adhere to the regulations
0
50
100
150
200
250
300
350
400
450
12 15 19 22 25 28 31 34 37 40 43 46 49 52 2 5 8 11 14 17 20 23 26 29
2020 2021
Frances Baard John Taolo Gaetsewe
Namakwa Pixley ka Seme
ZF Mgcawu Northern Cape Province

8
Western Cape: Progress & Challenges
• Majority of the districts are showing increases in cases, highest - Cape Town Metro.
• Hospital admissions in the province are currently in the very high zone indicating high case fatality rates
• Household, workplace and congregate residential cluster outbreaks contributing to increases
• The recent taxi violence and resultant decrease in mobility
• It is therefore difficult to say whether the province has reached the peak of the third wave
0
50
100
150
200
250
300
350
400
450
500
550
600
11 14 17 20 23 26 29 32 35 38 41 44 47 50 53 3 6 9 12 15 18 21 24 27 30
2020 2021
Cape Winelands Central KarooCity of Cape Town Metro Garden RouteOverberg West CoastWestern Cape Province

Week
number
Week
beginning
Percentage
testing positive
(%)
14 04-Apr-21 4.0
15 11-Apr-21 4.8
16 18-Apr-21 5.1
17 25-Apr-21 5.8
18 02-May-21 6.9
19 09-May-21 8.3
20 16-May-21 9.8
21 23-May-21 11.4
22 30-May-21 13.4
23 06-Jun-21 17.7
24 13-Jun-21 23.8
25 20-Jun-21 27.4
26 27-Jun-21 29.9
27 04-Jul-21 32.1
28 11-Jul-21 31.8
29 18-Jul-21 28.6
30 25-Jul-21 25.9
Testing – PCR and antigen
Number of new daily tests for SARS-CoV-2 and proportion positive by date of reporting and health
sector, and 7-day moving average proportion positive, 6 April 2020 to date, South Africa
The percentage testing positive in week 30 of 2021
was 25.9%, which was 2.7% lower than the
previous week (28.6%)
Sector Total tested
PRIVATE 8 305 131 56%
PUBLIC 6 621 451 44%
Total 14 926 582

Weekly percentage testing positiveP
erc
en
tag
e p
osi
tive
te
sts
• Highest in Mpumalanga (34.5%), Limpopo (33.9%), Western Cape (32.5%), and Northern Cape (30.5%)
provinces.
• Decreased in the North West, Gauteng, Mpumalanga and Limpopo. The percentage testing positive remained
unchanged in the Western Cape, Eastern Cape, Northern Cape, Free State and KwaZulu-Natal.

Red text indicates median at
the beginning and end of the
most recent forecast period
Daily new
cases
forecast
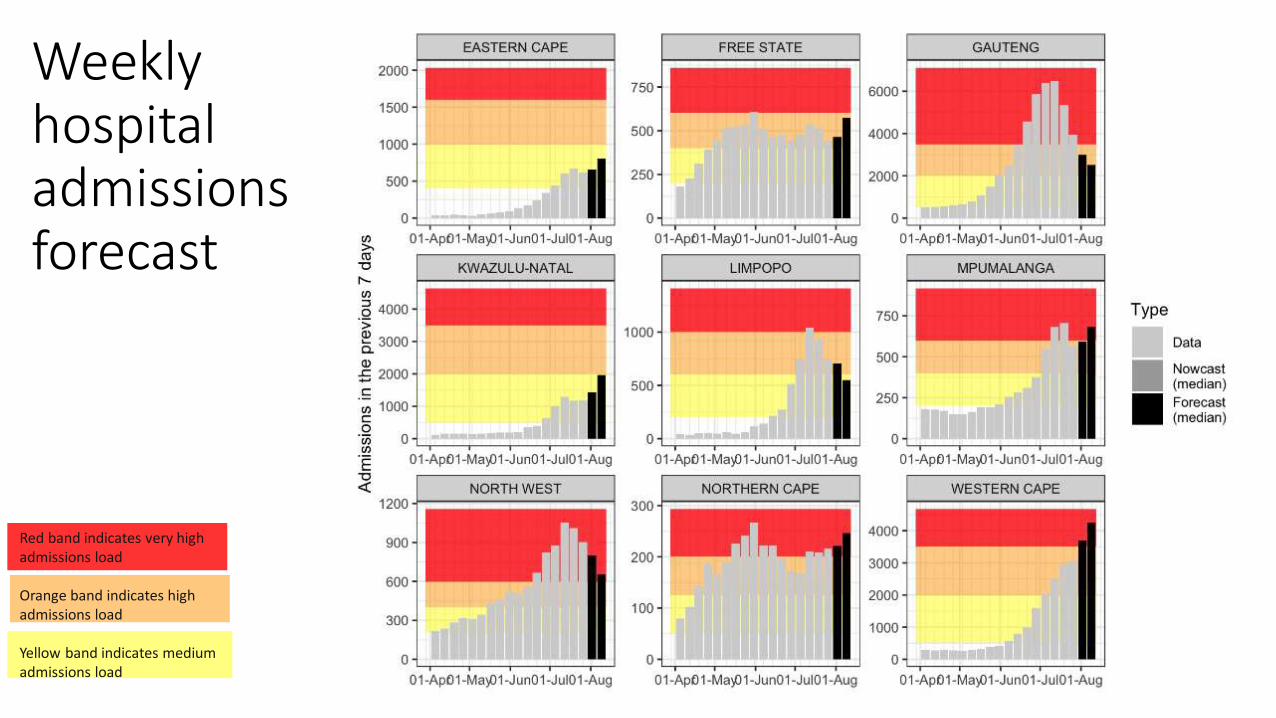
Weekly
hospital
admissions
forecast
Red band indicates very high
admissions load
Orange band indicates high
admissions load
Yellow band indicates medium
admissions load

Previous 14 days and current 14 days average COVID-19 admissions and deaths
and percentage changes, South Africa, 26 June-24 July 2021
Province Hospital admissions Percentage
change in
admissions
Hospital deaths Percentage
change in
deathsPrevious 14 days
admissions
average
Current 14
days
admissions
average
Previous 14
days deaths
average
Current 14 days
deaths average
Eastern Cape 89.21 81.86 -8.25 22.21 24.71 11.25
Free State 74.64 59.50 -20.29 18.21 15.86 -12.94
Gauteng 863.64 466.00 -46.04 229.86 163.07 -29.06
KwaZulu-Natal 173.93 165.43 -4.89 34.64 40.93 18.14
Limpopo 140.57 91.14 -35.16 38.43 33.57 -12.64
Mpumalanga 99.86 72.43 -27.47 24.36 22.57 -7.33
North West 145.57 109.36 -24.88 29.57 26.86 -9.18
Northern Cape 30.07 25.71 -14.49 6.93 8.36 20.62
Western Cape 383.71 434.14 13.14 69.57 94.50 35.83