covid slide: research on learning loss & recommendations
TRANSCRIPT
WHITEPAPER
COVID Slide: Research on Learning Loss & Recommendations to Close the Gap
August 2020
John Bielinski, Ph.D.Rachel Brown, Ph.D., NCSPKyle Wagner, Ph.D., NCSP

CONTENTS
2 |
3 |
1 7 |
1 9 |
2 0 |
EXECUTIVE SUMMARY
CALCULATING LEARNING LOSS
03 PRIOR RESEARCH AROUND THE SUMMER SLIDE
06 NEW RESEARCH CALCULATES THE COVID-19 SLIDE
13 WHAT TO EXPECT WHEN YOU RETURN TO LEARNING THIS FALL
16 SUMMARY OF RESEARCH
RECOMMENDATIONS
17 STRATEGIES FOR CLOSING GAPS
18 CLIMB THE COVID-19 SLIDE WITH FASTBRIDGE
REFERENCES
ABOUT THE AUTHORS
1
COVID SLIDE: RESEARCH ON LEARNING LOSS & RECOMMENDATIONS TO CLOSE THE GAP
E X E C U T I V E S U M M A R Y
Many educators have wondered what effects the COVID-19-related school closures and disruptions will have on student learning. Using cohort data from the prior year, we took scores from the FastBridge aReading, aMath and CBMreading assessments to estimate typical learning losses from the spring to fall.
The Process
• Seasonal growth (i.e. fall to winter and winter to spring) was used to produce a more precise estimate of learning loss over the summer break absent of formal classroom instruction.
• The refined summer score losses were used to estimate the effect on scores if the summer loss rate was in effect from mid-March through the end of the school year.
The FindingsAnalysis showed that while estimated score loss varied by assessment and grade level, with younger students showing more loss on aReading and aMath and older students showing greater losses on CBMreading*, students across the board will start this school year behind where they are after a typical summer break. Schools should expect to have higher numbers of students needing remedial reading and math instruction as well as strategic supports in order to achieve grade-level learning goals.
RecommendationsMulti-Tiered System of Supports (MTSS) is one way schools can be prepared to address student needs when they return to learning. Fall screening will be critical to determine school, class and individual student learning loss. Because of the vast need that is anticipated, it will not be possible to remediate the loss due to COVID-19 using Tier II interventions. Therefore, schools must intensify Tier 1 instruction to help all students catch up.
In early grades, K-3, more time should be spent on reading and math, even at the expense of other subjects. Learning loss is likely to be greatest in these grades so it will be necessary to spend more time focused on core subjects to make up for disruptions in instruction that occurred during spring school closures.
Across all grades, rely on Rate of Improvement (ROI) as a key metric when progress monitoring. While norms are still valid and important, growth will be a more significant indicator of student risk. ROI will be the best tool for teachers to use to identify students who need more intensive intervention during the 2020-2021 school year.
*The differences in the amount of loss across assessments and grades is possibly due to differences in what each assessment
measures as well as the importance of regular learning and practice in relation to the skills measured across grades.
2
COVID SLIDE: RESEARCH ON LEARNING LOSS & RECOMMENDATIONS TO CLOSE THE GAP
C A L C U L A T I N G L E A R N I N G L O S S
PRIOR RESEARCH AROUND THE SUMMER SLIDE Across the U.S., the COVID-19 pandemic forced most school buildings to abruptly shutter. Almost overnight educators had to convert their well-established in-person instructional methods and routines to online learning protocols. This change not only affected how teachers teach, it also disrupted how students engage in the formal academic learning process.
According to a recent survey conducted by the Education Week Research Center, many educators experienced spotty internet access and technical problems and low online student engagement (EdWeek, 2020) during spring remote teaching. Many teachers also reported spending more time troubleshooting technical problems and less time on instruction.
Access to the necessary technology varied across school systems and particularly across household income strata as well. Among elementary and middle schools with at least 75% of students from low-income households, about 50% had at least one device per student. Among schools with less than 25% of students from low-income households, about 90% had at least one device per student. These differences in technology access in relation to family income suggest that school efforts to provide online learning during the COVID-19 closures were not fully equitable. Additionally, although this study did not make it clear whether devices included internet access, students with limited or no access to the internet cannot participate in online learning.
The impact on student achievement of this expansive and abrupt change, as well as inequity of access to resources for remote learning, will not be known for some time. However, providing empirically derived estimates of learning outcomes for key academic skills with large cohort samples could help educators and school administrators better prepare to address student needs in the 2020–2021 school year and beyond.
What Do the Data Tell Us?
Due to disparities in digital access, schools
must take into account their population
and use knowledge of students’ access to
devices and the internet when planning
fall instruction.
3
COVID SLIDE: RESEARCH ON LEARNING LOSS & RECOMMENDATIONS TO CLOSE THE GAP

What We Know: Income Has an ImpactPrior research about typical learning loss over the summer break (“summer slide”) provides a starting point for understanding the potential impact of the COVID-19 crisis disruption. As with many other education research studies, there are many more outcomes reported about reading skills than for math or other subject areas.
In 1996, Cooper and colleagues published the results from a meta-analytic study which compiled the effects of summer break on reading and math achievement from 13 studies of elementary and middle school students. They found that, on average, students lost about one-month's worth of learning over the entire summer break (Cooper et al., 1996). They also reported a negative effect of household income on learning loss. In other words, among students from low income households, the decline was nearly two-months’ worth of learning, whereas the performance of students from moderate- to high-income households remained flat or slightly increased.
A more recent meta-analysis examined the effects of summer reading programs on student achievement. For that study, the authors reviewed summer reading program research conducted between 1998 and 2011 (Kim & Quinn, 2014). In total, 35 studies involving children from Kindergarten through Grade 5 met the criterion for inclusion. Although the study focused on the impact of summer reading programs, it also included results from students who did not participate in a program (i.e., the control groups). Among the studies in which more than 50% of the sample was from low-income households, children in the control group showed no change from spring to fall on the total reading achievement measure. Among the mixed-income samples, however, the reading achievement of children in the control group showed a modest positive gain from spring to fall. In other words, reading achievement of students who did not participate in a summer reading program remained flat across the summer for low-income students but increased in the moderate to high- income group.
In a quasi-experimental study of a specific summer reading instruction program titled Kids Read Now, Borman and colleagues (2019) reported a mix of small declines and small gains in reading achievement among the control group over the summer break. The overall net effect was a small gain equivalent to about one and one-half months' growth (Borman et al., 2019).
A larger three-year longitudinal study of home-based summer reading instruction for students in high-poverty schools used randomized assignment to treatment and control groups to assess the cumulative effect of providing students in the treatment group with books to read over the summer (Allington et al., 2010). For three consecutive years the children in the experimental treatment selected books during a book fair for summer reading. The children in the control group received no trade books. After three years, the average effect size difference in reading achievement in the experimental group compared to the control group was 0.139. Although this study did not directly assess summer loss, the long-term difference in reading achievement between the groups was attributed to differences in summer reading activity and could shed light on why overall reading achievement has been found to increase in some groups over the summer break, while it decreases in others. In other words, engaging in regular reading over the summer may stem learning loss.
4
COVID SLIDE: RESEARCH ON LEARNING LOSS & RECOMMENDATIONS TO CLOSE THE GAP
What We Know: Certain Skills Suffer MoreAnother important finding in the summer slide research is that the size and direction of the effect varies by the type of skill assessed. According to Cooper et al. (1996) the effect of summer break was more detrimental for math than for reading and most detrimental for math computation.
Kim and Quinn found larger effect size gains for students in decoding and fluency skills than for reading comprehension and vocabulary. Among the mixed-income group they studied, the mean effect of summer interventions on decoding was 0.43 compared to only 0.04 on vocabulary. And, it is worth noting, in the low-income group there was a small positive effect on reading comprehension skills.
In a study that specifically measured oral reading fluency (ORF) skill changes over the summer, Sandberg-Patton and Reschly found statistically significant performance declines from spring to fall in Grades 2 and 3, but not in Grades 4 and 5. That study used the same oral reading passages across all testing sessions so the results were a direct measure of the students’ ORF performance over time. These studies suggest that summer learning loss is related to the nature of the skill.
One of the challenges in estimating summer learning loss is accounting for differences in the difficulty levels between spring and fall test forms. When students return to school each fall, they usually complete assessments based on the skills expected in the new (current) grade level and not the prior school year. For this reason, fall assessments in the next higher grade tends to be more difficult than spring ones.
Computer-Adaptive Tests (CAT) provide a method for measuring student skills to address this problem. CATs are vertically scaled, meaning that all of the scores are converted to values that represent a continuum of skills regardless of the student’s grade level. This method provides a better way to compare student learning both within and between school years.
A recent study using adaptive reading and math achievement tests evaluated summer learning loss from Kindergarten through Grade 8 in terms of the number of months of learning lost or gained in the summer (Kuhfeld, 2019). Average learning losses over the summer break in math of one and one-half to three months and in reading about one and two-tenths to two and two-tenths months were reported. Learning losses were smaller in Kindergarten and Grade 1 than in higher grades. These data suggest that when differences in the difficulty level of the assessment are controlled, some amount of learning loss is still present. Nonetheless, what is not clear from that study was whether the researchers accounted for instruction following spring testing and preceding fall testing. Also, it is not clear whether monthly learning loss was based on grade-specific growth comparisons or on average growth across grades. This is important because achievement growth rates decrease across grades (Kuhfeld & Tarasawa, 2020) and within-grade growth rates are more likely to provide accurate indicators of how much summer learning loss is typical at different grades.
5
COVID SLIDE: RESEARCH ON LEARNING LOSS & RECOMMENDATIONS TO CLOSE THE GAP

NEW RESEARCH CALCULATES THE COVID-19 SLIDEIn the current study, we first evaluated summer learning loss in reading and math by tracking the performance of student cohorts from the fall of 2018 through the fall of 2019 using both adaptive reading and math assessments as well as a measure of oral reading fluency. Our analysis accounted for the additional learning that could be attributed to classroom instruction between spring and fall screening. The results were then used to estimate the total learning loss due to the COVID-19 pandemic disruption. We also examined the effect of prior growth on summer learning loss.
Analysis of Student Cohort DataIn order to use the most complete sample, only students with scores in all four screening periods (fall 2018, winter 2019, spring 2019, and fall 2019) were included. The number of students by grade and assessment is summarized in Table 1. Scores from the following three specific FastBridge assessments were evaluated.
• aReading is a computer-adaptive reading assessment that measures reading ability on foundational reading skills, vocabulary and reading comprehension.
• aMath is a computer-adaptive math assessment that measures concepts and problem-solving skills in whole numbers and fractions, computation, algebraic thinking, geometry, measurement, and data analysis and probability.
• CBMreading includes a timed sample of a student’s oral reading fluency to document the number of words read correctly in one minute. This metric is widely recognized as an excellent predictor of overall reading skills.
CALCULATING COVID-19 SLIDE
Track performance of student cohorts from fall 2018–fall 2019
Calculate the learning attributed to classroom instruction between spring and fall screening
Estimate of total learning loss due to the COVID-19 school closures
– =
Table 1. Student count by grade and assessment.
Grade aReading aMath CBMreading
KG 7,693 7,132 —
1 30,847 25,501 7,569
2 53,531 46,173 65,738
3 57,342 48,079 57,649
4 56,073 46,228 48,599
5 47,866 37,534 24,626
6
COVID SLIDE: RESEARCH ON LEARNING LOSS & RECOMMENDATIONS TO CLOSE THE GAP
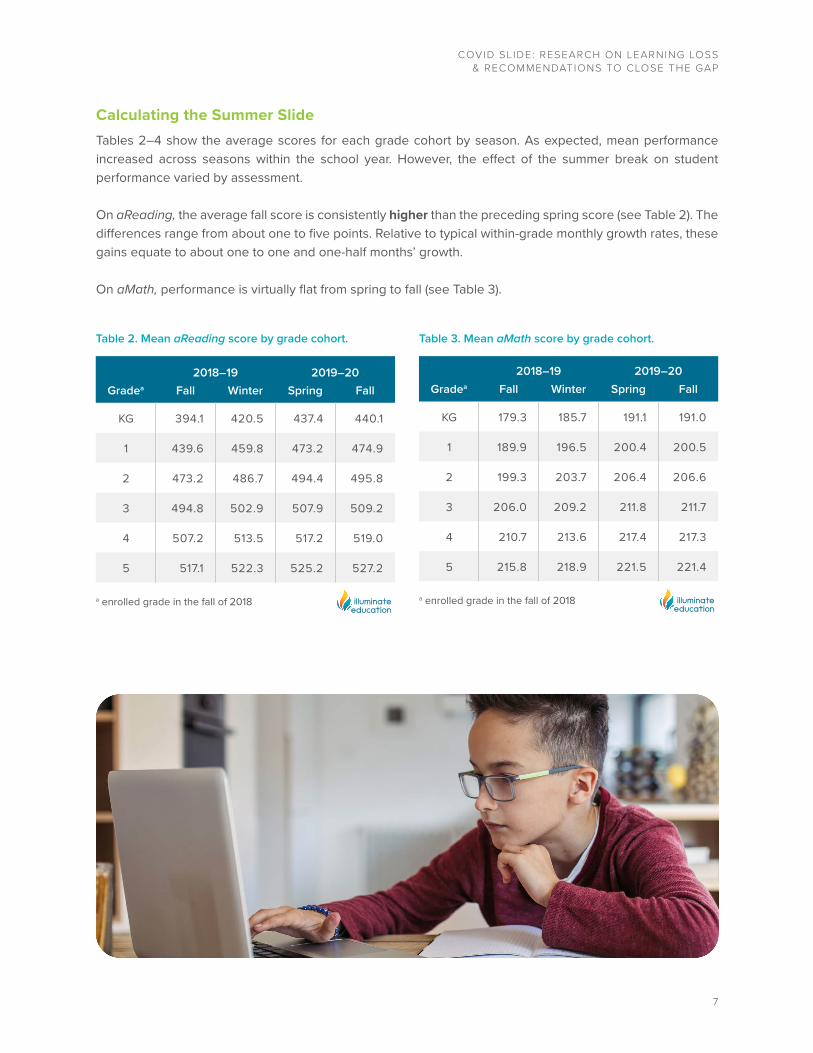
Calculating the Summer SlideTables 2–4 show the average scores for each grade cohort by season. As expected, mean performance increased across seasons within the school year. However, the effect of the summer break on student performance varied by assessment.
On aReading, the average fall score is consistently higher than the preceding spring score (see Table 2). The differences range from about one to five points. Relative to typical within-grade monthly growth rates, these gains equate to about one to one and one-half months’ growth.
On aMath, performance is virtually flat from spring to fall (see Table 3).
Table 2. Mean aReading score by grade cohort.
2018–19 2019–20Gradea Fall Winter Spring Fall
KG 394.1 420.5 437.4 440.1
1 439.6 459.8 473.2 474.9
2 473.2 486.7 494.4 495.8
3 494.8 502.9 507.9 509.2
4 507.2 513.5 517.2 519.0
5 517.1 522.3 525.2 527.2
a enrolled grade in the fall of 2018
Table 3. Mean aMath score by grade cohort.
2018–19 2019–20Gradea Fall Winter Spring Fall
KG 179.3 185.7 191.1 191.0
1 189.9 196.5 200.4 200.5
2 199.3 203.7 206.4 206.6
3 206.0 209.2 211.8 211.7
4 210.7 213.6 217.4 217.3
5 215.8 218.9 221.5 221.4
a enrolled grade in the fall of 2018
7
COVID SLIDE: RESEARCH ON LEARNING LOSS & RECOMMENDATIONS TO CLOSE THE GAP

Since CBMreading is not a CAT, the cohort analysis required equating the forms between adjacent grades. This was necessary because the text complexity of the passages increases across grades such that spring screening passages are easier than those used in the following grade for fall. To equate the scales, we used the mean difference in the words correct per minute score for students who completed passages in adjacent grades. For example, among Grade 2 students who were screened using both the Grade 2 and Grade 1 passages, the mean score on the Grade 1 passages was 12.5 words correct per minute higher. Therefore, 12.5 points were added to the fall 2019 scores for the Grade 1 cohort.
The next step in calculating the summer slide was to account for the effects of instruction following spring screening and preceding fall screening. For most schools, spring screening occurs a few weeks prior to the summer break and fall screening begins a few weeks after school commences in the fall. Using the actual test date for each student and seasonal growth rates, we estimated what each student’s score would have been on June 1 and September 1.
The spring score adjustment used winter to spring growth. For students tested before June 1, the spring adjustment raised the observed score. For students tested after June 1, the adjustment lowered the observed score.
A similar procedure was used to adjust the fall scores to reflect a September 1 assessment date. The fall score adjustment used fall to winter growth rates. For students screened after September 1, performance was adjusted downward, and for students screened prior to September 1, the score was adjusted upward. The difference between the adjusted spring and fall scores approximates the effect of a three-month summer break on overall performance.
Table 4. Mean CBMreading scores by grade cohort.
2018–19 2019–20Grade Fall Winter Spring Fall
1 27.3 51.2 74.7 73.0
2 65.6 92.4 109.3 112.3
3 96.5 119.0 133.0 133.8
4 123.8 142.0 155.5 155.5
5 141.7 158.7 172.0 170.0
8
COVID SLIDE: RESEARCH ON LEARNING LOSS & RECOMMENDATIONS TO CLOSE THE GAP
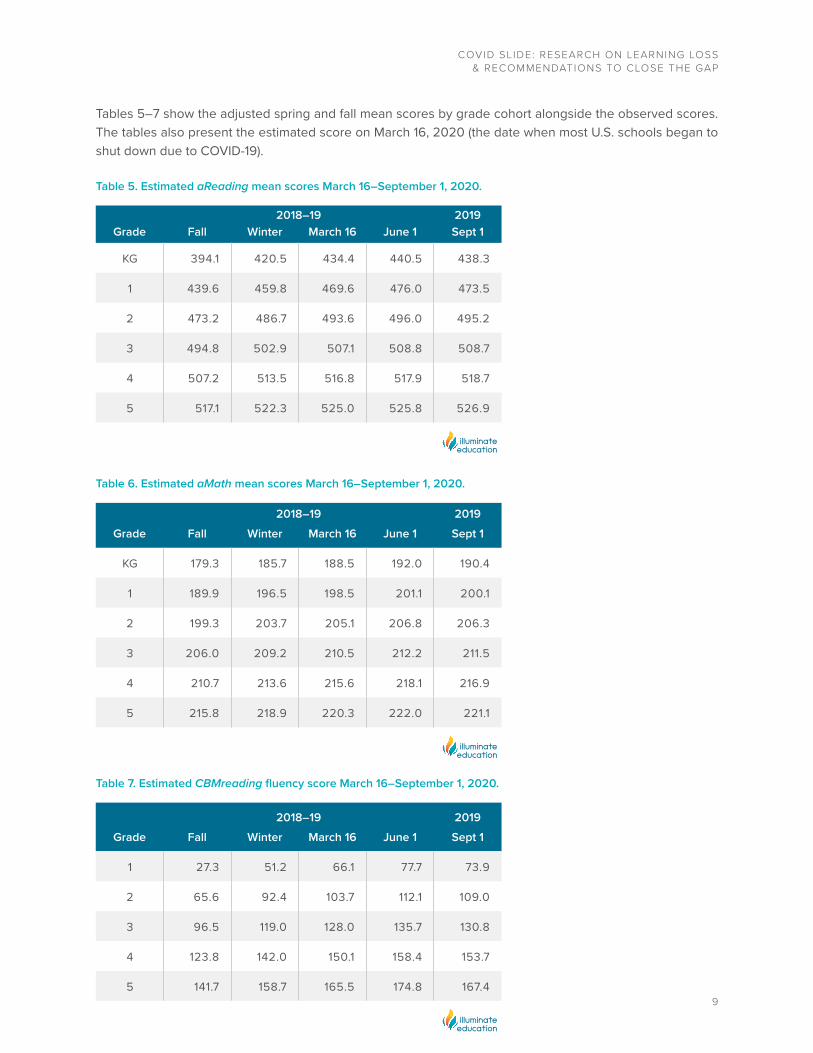
Tables 5–7 show the adjusted spring and fall mean scores by grade cohort alongside the observed scores. The tables also present the estimated score on March 16, 2020 (the date when most U.S. schools began to shut down due to COVID-19).
Table 5. Estimated aReading mean scores March 16–September 1, 2020.
2018–19 2019Grade Fall Winter March 16 June 1 Sept 1
KG 394.1 420.5 434.4 440.5 438.3
1 439.6 459.8 469.6 476.0 473.5
2 473.2 486.7 493.6 496.0 495.2
3 494.8 502.9 507.1 508.8 508.7
4 507.2 513.5 516.8 517.9 518.7
5 517.1 522.3 525.0 525.8 526.9
Table 6. Estimated aMath mean scores March 16–September 1, 2020.
2018–19 2019Grade Fall Winter March 16 June 1 Sept 1
KG 179.3 185.7 188.5 192.0 190.4
1 189.9 196.5 198.5 201.1 200.1
2 199.3 203.7 205.1 206.8 206.3
3 206.0 209.2 210.5 212.2 211.5
4 210.7 213.6 215.6 218.1 216.9
5 215.8 218.9 220.3 222.0 221.1
2018–19 2019Grade Fall Winter March 16 June 1 Sept 1
1 27.3 51.2 66.1 77.7 73.9
2 65.6 92.4 103.7 112.1 109.0
3 96.5 119.0 128.0 135.7 130.8
4 123.8 142.0 150.1 158.4 153.7
5 141.7 158.7 165.5 174.8 167.4
Table 7. Estimated CBMreading fluency score March 16–September 1, 2020.
9
COVID SLIDE: RESEARCH ON LEARNING LOSS & RECOMMENDATIONS TO CLOSE THE GAP
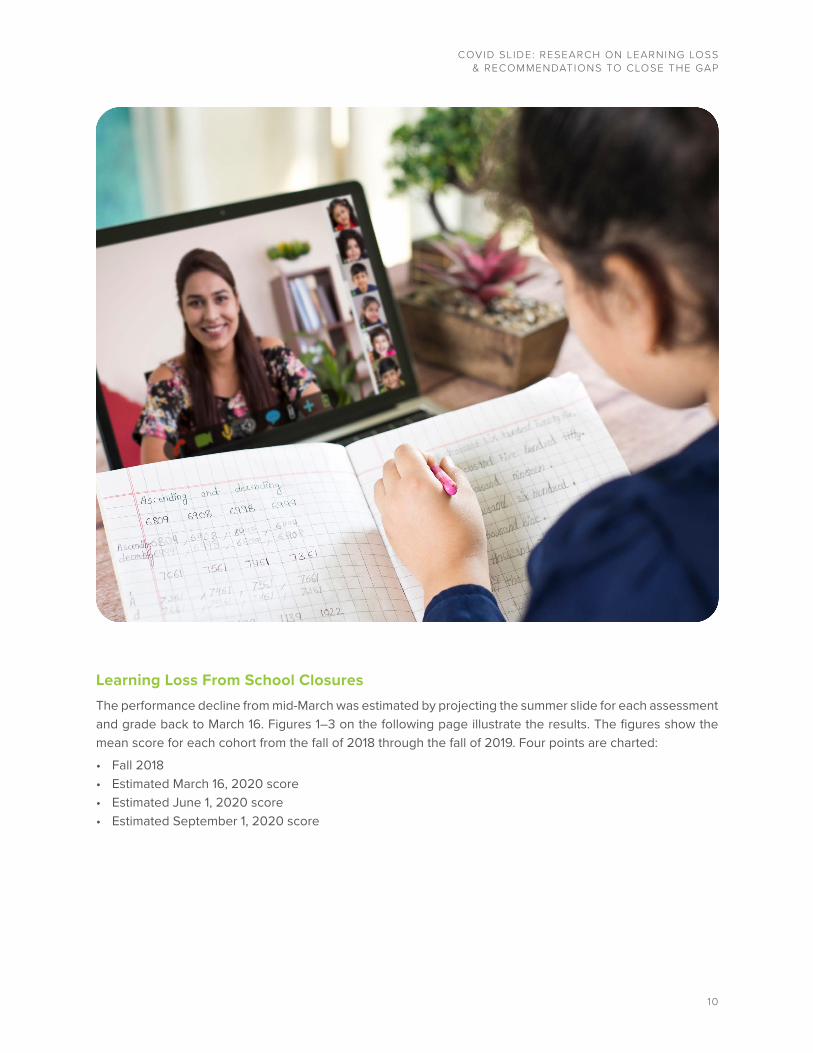
Learning Loss From School Closures The performance decline from mid-March was estimated by projecting the summer slide for each assessment and grade back to March 16. Figures 1–3 on the following page illustrate the results. The figures show the mean score for each cohort from the fall of 2018 through the fall of 2019. Four points are charted:
• Fall 2018• Estimated March 16, 2020 score• Estimated June 1, 2020 score • Estimated September 1, 2020 score
10
COVID SLIDE: RESEARCH ON LEARNING LOSS & RECOMMENDATIONS TO CLOSE THE GAP
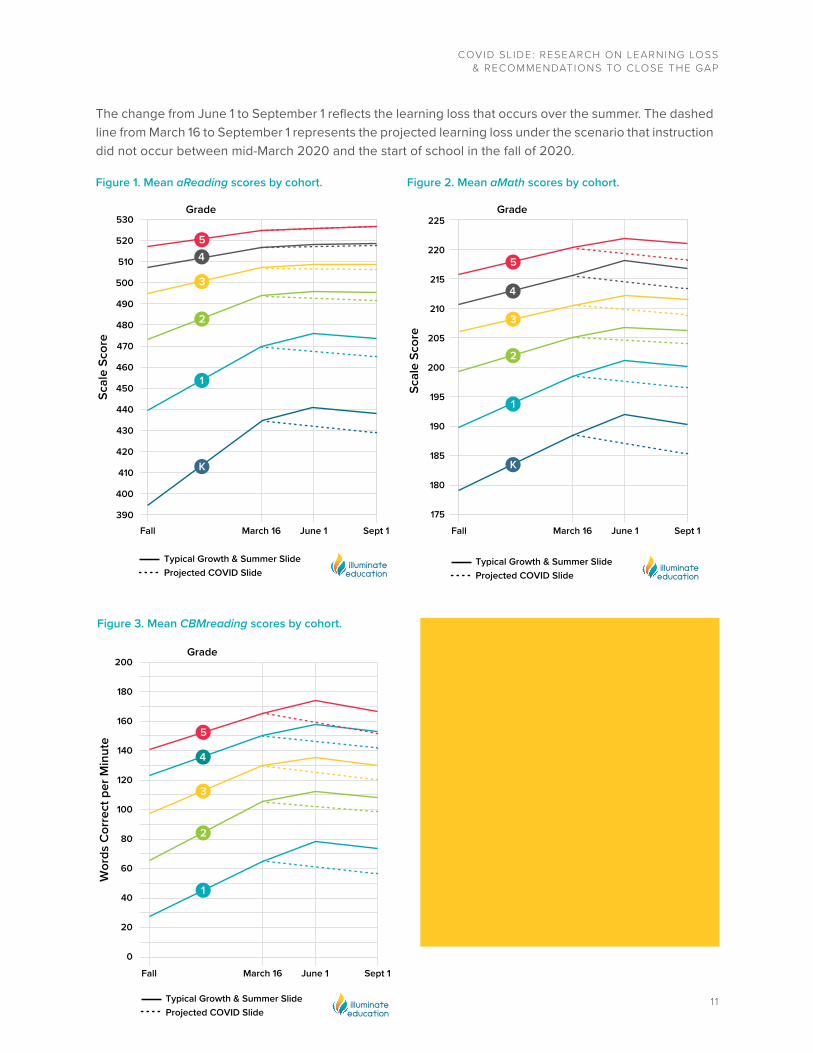
It is important to note that these charts represent a worst-case scenario because many students did engage in some school activities and learning during this time. According to recent surveys, most schools in the U.S. deployed remote learning protocols within two weeks of school closure, but with less direct instruc- tional time with students.
Thus, the actual loss due to the COVID pandemic interruption is likely to fall between the dashed line and the solid line for each grade.
Figure 1. Mean aReading scores by cohort.
Figure 3. Mean CBMreading scores by cohort.
Figure 2. Mean aMath scores by cohort.
530
520
510
500
490
480
470
460
450
440
430
420
410
400
390
Scal
e Sc
ore
Fall
Grade
March 16 June 1 Sept 1
54
3
2
1
K
Typical Growth & Summer SlideProjected COVID Slide
200
180
160
140
120
100
80
60
40
20
0
Wor
ds C
orre
ct p
er M
inut
e
Fall
Grade
March 16 June 1 Sept 1
5
4
3
2
1
Typical Growth & Summer SlideProjected COVID Slide
Fall
Grade
March 16 June 1 Sept 1
Scal
e Sc
ore
225
220
215
210
205
200
195
190
185
180
175
5
4
3
2
1
K
Typical Growth & Summer SlideProjected COVID Slide
The change from June 1 to September 1 reflects the learning loss that occurs over the summer. The dashed line from March 16 to September 1 represents the projected learning loss under the scenario that instruction did not occur between mid-March 2020 and the start of school in the fall of 2020.
1 1
COVID SLIDE: RESEARCH ON LEARNING LOSS & RECOMMENDATIONS TO CLOSE THE GAP
Learning Loss by Assessment
As shown in Figures 1–3, the amount of learning loss varies by assessment type and grade. For example, all grades show some level of learning loss in reading, but it is most pronounced in Kindergarten. On the adaptive reading assessment (aReading), summer losses, as well as the projected loss due to the COVID-19 interruption, shrink across grades.
For example, in standard deviation (SD) units (i.e., mean loss ÷ standard deviation) Kindergarten students could be expected to fall 0.18 SD units without any instruction (i.e., worst-case scenario) from mid-March through September 1. By comparison, the Grade 5 data indicate that scores would go up about 0.07 SD units. These data are consistent with findings from Kim and Quinn (2014), as well as Sandberg Patton and Reschly (2013), who found similar grade-level differences in summer loss across grades. The variation in summer slide across grades might be due to the prior findings that decoding and fluency are more sensitive to summer loss than comprehension, which is a greater focus in the older grades.
By contrast, math achievement loss as measured by aMath was observed across all grades from Kindergarten through Grade 5, which is new information since most prior research focuses on reading. As with reading, the estimated losses were greatest in Kindergarten, where scores might drop by as much as 0.41 SD units. In other grades, losses of about 0.20 SD units were estimated in the absence of instruction. These more uniform math loss estimates might be due to the more limited generalizability of math skills when students are not in school every day.
Without instruction after mid-March, oral reading fluency (CBMreading) scores were estimated to decline in Grades 1 through 5. The estimated decline is greatest for Grade 5 students at about 0.32 SD units, with other grades expected to decline about 0.20 SD units. Notably, oral reading fluency was found in prior research (Sandberg Patton & Reschly, 2013) to be more susceptible to summer loss. Losses at all grades could reflect that when students are out of school, their incidental reading might not be sufficient to maintain in-school reading fluency performance levels.
What Do the Data Tell Us? • Learning loss in reading is seen across
all grades, but is most pronounced in Kindergarten.
• Oral reading fluency loss impacts all grades, but is most pronounced in Grade 5.
• Math learning loss is observed at higher rates across all grades levels (K-5).
12
COVID SLIDE: RESEARCH ON LEARNING LOSS & RECOMMENDATIONS TO CLOSE THE GAP
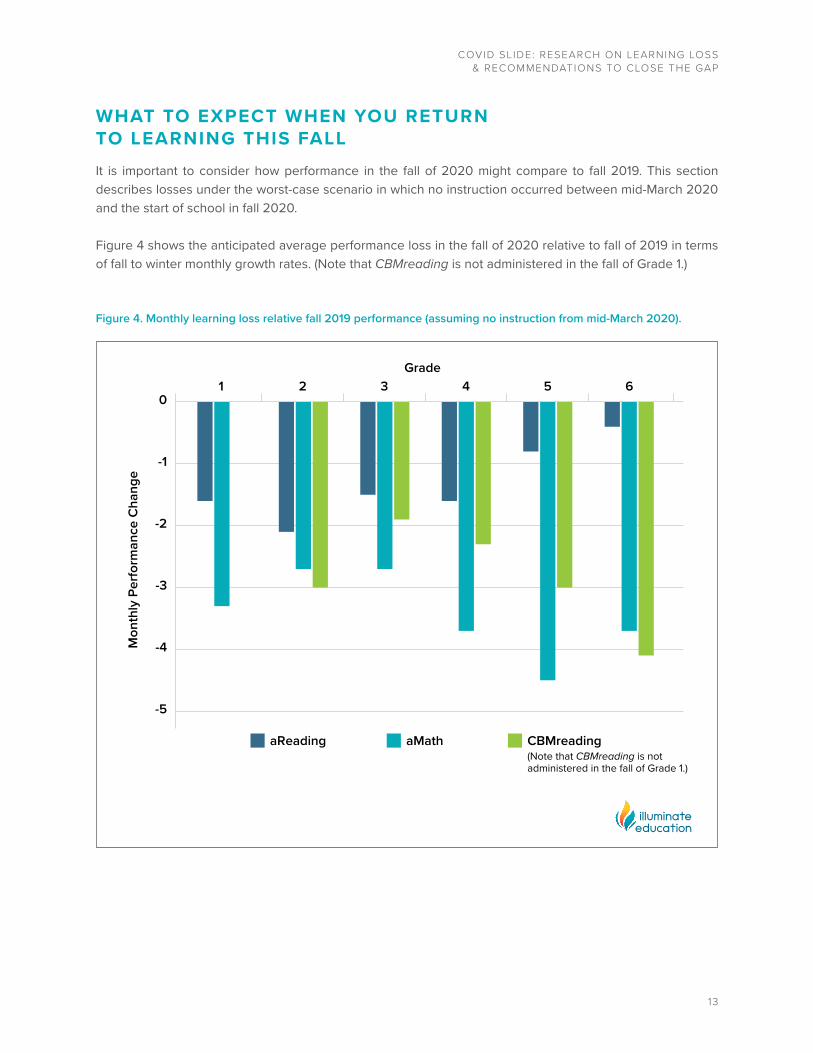
WHAT TO EXPECT WHEN YOU RETURN TO LEARNING THIS FALLIt is important to consider how performance in the fall of 2020 might compare to fall 2019. This section describes losses under the worst-case scenario in which no instruction occurred between mid-March 2020 and the start of school in fall 2020.
Figure 4 shows the anticipated average performance loss in the fall of 2020 relative to fall of 2019 in terms of fall to winter monthly growth rates. (Note that CBMreading is not administered in the fall of Grade 1.)
Figure 4. Monthly learning loss relative fall 2019 performance (assuming no instruction from mid-March 2020).
Mon
thly
Per
form
ance
Cha
nge
Grade
aReading
1 2 3 4 5 6
-5
-4
-3
-2
-1
0
aMath CBMreading(Note that CBMreading is not administered in the fall of Grade 1.)
13
COVID SLIDE: RESEARCH ON LEARNING LOSS & RECOMMENDATIONS TO CLOSE THE GAP

Findings:
• If no instruction was provided from mid-March until the start of school in Grade 1, the estimated aReading scores could be about one and six-tenths months behind performance in 2019.
• Across all the included grades, performance in broad reading achievement as measured by aReading was estimated to be about one to two months behind 2019.
• Without instruction, performance in broad math achievement (aMath) was estimated to be two and one-half to four and one-half months behind 2019.
• In oral reading fluency (CBMreading), performance was estimated to be about two to four months behind 2019.
These results suggest that students are likely to return to school in fall 2020 with less developed reading and math skills than typical at each grade level in prior years.
What Do the Data Tell Us?
Schools can expect to see significant
losses in overall reading and math
achievement, and higher percentages
of students at moderate to high risk of
significant academic difficulties when
school begins in the fall of 2020.
14
COVID SLIDE: RESEARCH ON LEARNING LOSS & RECOMMENDATIONS TO CLOSE THE GAP
ImplicationsChanges at the Group Level That said, score declines were estimated to vary by assessment and grade. Under the worst-case scenario, the mean scores on aReading could drop as much as nine points in Kindergarten and Grade 1, and about one to two points in Grades 3 through 8. For aMath the average score decline was estimated to be about three to four points in each grade. For CBMreading the average score decline could range from 10 to 15 points.
Changes at the Student LevelIt is not possible to predict how remote learning will affect individual students. Using outcomes from prior research on summer learning loss (Borman & Dowling, 2006), it seems likely that a student’s level of engagement with remote learning activities when school was closed is the strongest predictor of learning loss due to COVID-19.
Students who participated in frequent virtual interactions with teachers, especially one-on-one with videoconferencing, and completed homework assignments will likely have smaller losses than students who did not. Some schools maintained online attendance records as well as assignment scores during the COVID-19 closures and might be able to predict which students will need greater assistance when school resumes in fall 2020. Nonetheless, in many instances this information will not be easily available when students return to fall instruction.
For schools that did not collect such data, and for students who did not participate regularly, or who moved, conducting universal screening in the fall of 2020 will be very important. Universal screening scores will help teachers learn which students exhibited the greatest losses and gains and provide information to plan instruction.
We also know that prior growth is related to summer declines. Other research has shown that students with the greatest winter to spring growth tend to have the largest declines over the summer. In a recent study of this phenomenon, researchers found prior growth accounted for as much as 40% of the variation in summer loss compared to only 1% based on a student’s race/ethnicity or household income level (Kuhfeld, 2019).
What Do the Data Tell Us?
Findings suggest that the students
who most benefit from daily systematic
instruction when schools are open are
the ones most likely to demonstrate
learning loss when regular lessons are
not available, such as in the summer or
during the COVID-19 closures.
15
COVID SLIDE: RESEARCH ON LEARNING LOSS & RECOMMENDATIONS TO CLOSE THE GAP
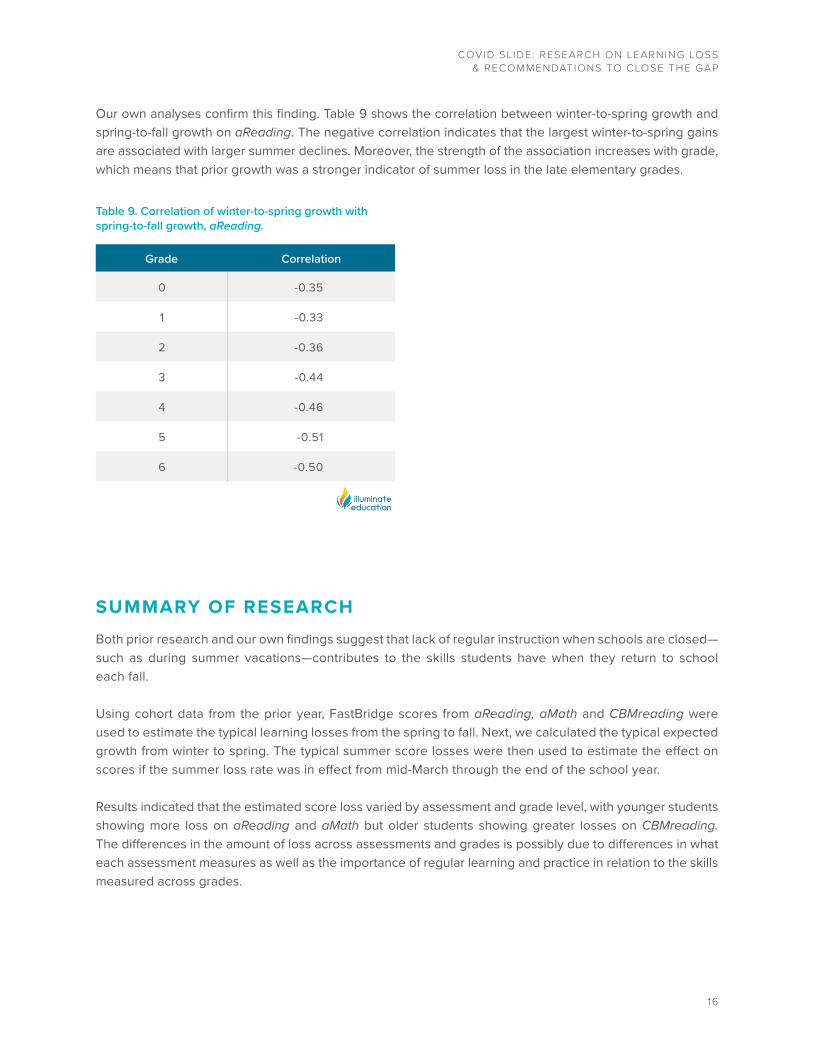
Table 9. Correlation of winter-to-spring growth with spring-to-fall growth, aReading.
Grade Correlation
0 -0.35
1 -0.33
2 -0.36
3 -0.44
4 -0.46
5 -0.51
6 -0.50
Our own analyses confirm this finding. Table 9 shows the correlation between winter-to-spring growth and spring-to-fall growth on aReading. The negative correlation indicates that the largest winter-to-spring gains are associated with larger summer declines. Moreover, the strength of the association increases with grade, which means that prior growth was a stronger indicator of summer loss in the late elementary grades.
SUMMARY OF RESEARCHBoth prior research and our own findings suggest that lack of regular instruction when schools are closed—such as during summer vacations—contributes to the skills students have when they return to school each fall.
Using cohort data from the prior year, FastBridge scores from aReading, aMath and CBMreading were used to estimate the typical learning losses from the spring to fall. Next, we calculated the typical expected growth from winter to spring. The typical summer score losses were then used to estimate the effect on scores if the summer loss rate was in effect from mid-March through the end of the school year.
Results indicated that the estimated score loss varied by assessment and grade level, with younger students showing more loss on aReading and aMath but older students showing greater losses on CBMreading. The differences in the amount of loss across assessments and grades is possibly due to differences in what each assessment measures as well as the importance of regular learning and practice in relation to the skills measured across grades.
16
COVID SLIDE: RESEARCH ON LEARNING LOSS & RECOMMENDATIONS TO CLOSE THE GAP
STRATEGIES TO CLOSE THE GAPThe findings reported here suggest that there will be more students who need additional academic support when school resumes in the fall of 2020 than when instruction was disrupted in the spring of 2020. There are likely to also be significant social and emotional effects from the COVID-19 school disruptions which will require school resources (Center on Positive Behavioral Interventions and Supports, 2020). At the same time, many states are facing challenges with school funding due to the significant economic stress that COVID-19 created (Griffith, 2020).
So, what can be done to support students and make up expected COVID-19 learning loss?Student support models such as a MTSS (Brown-Chidsey & Bickford, 2016) are one way that schools can be prepared to address students’ learning needs. However, tiered supports such as supplemental interventions are not likely to be enough to meet the expected, widespread need. For this reason, we recommend schools:
1. Conduct fall screening to identify the largest learning gaps and address these through intensified Tier 1 instruction. As noted by Gibbons, Brown, and Niebling (2018), Tier 1 core instruction is the single most effective way to improve all students’ learning outcomes.
2. Focus on strong core instruction within school-wide social-emotional behavior (SEB) supports so that students are mentally and emotionally ready to resume learning.
3. Look to norms as the goal for all students to get back to but understand that Rate of Improvement (ROI) is the key metric to focus on when conducting progress monitoring this school year because many students will start the year significantly behind the norms.
4. Front load intervention and progress monitoring as quickly and efficiently as possible for students well below norms rather than requesting a special education evaluation as you might in typical school years. If students in Tier 2 and Tier 3 interventions make gains quickly, you’ll know that deficits are more likely due to a lack of effective instruction than a disability.
5. Spend more time focused on reading and math in K-3 classrooms. The risk of learning loss is greater in these grades, so it is even more critical to spend time helping students make up for the lack of instruction in these foundational subjects that occurred as a result of COVD-19 school closures.
R E C O M M E N D A T I O N S
Learn tips and strategies from education experts to nurture students’ SEB functioning and ensure everyone — children and adults — feels safe and supported when school resumes. Implement these practices from the district to the classroom to transition successfully back to learning, no matter where it’s taking place.
Get the Playbook
17
COVID SLIDE: RESEARCH ON LEARNING LOSS & RECOMMENDATIONS TO CLOSE THE GAP
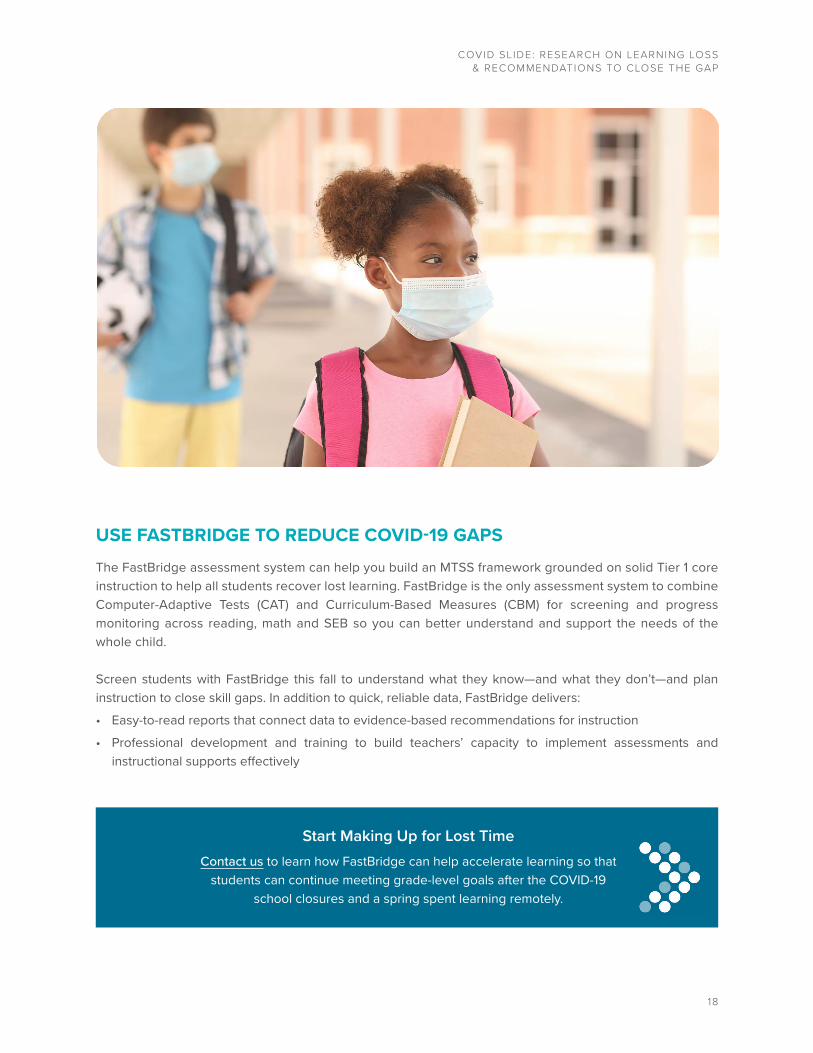
USE FASTBRIDGE TO REDUCE COVID-19 GAPSThe FastBridge assessment system can help you build an MTSS framework grounded on solid Tier 1 core instruction to help all students recover lost learning. FastBridge is the only assessment system to combine Computer-Adaptive Tests (CAT) and Curriculum-Based Measures (CBM) for screening and progress monitoring across reading, math and SEB so you can better understand and support the needs of the whole child.
Screen students with FastBridge this fall to understand what they know—and what they don’t—and plan instruction to close skill gaps. In addition to quick, reliable data, FastBridge delivers:
• Easy-to-read reports that connect data to evidence-based recommendations for instruction
• Professional development and training to build teachers’ capacity to implement assessments and instructional supports effectively
Start Making Up for Lost TimeContact us to learn how FastBridge can help accelerate learning so that
students can continue meeting grade-level goals after the COVID-19 school closures and a spring spent learning remotely.
18
COVID SLIDE: RESEARCH ON LEARNING LOSS & RECOMMENDATIONS TO CLOSE THE GAP
R E F E R E N C E S
Allington, R. L., McGill-Franzen, A., Camilli, G., Williams, L., Graff, J., Zeig, J., Zmach, C., & Nowak, R. (2010). Addressing summer reading setback among economically disadvantaged elementary students. Reading Psychology, 31, 411-427.
Borman, G. D., & Dowling, N. M. (2006). Longitudinal achievement effects of multiyear summer school: evidence from the Teach Baltimore randomized field trial. Educational Evaluation and Policy Analysis, 28, 25-48.
Borman, G. D., Yang, H., & Xie, X. (2019). A quasi-experimental study of the impacts of the Kids Read Now summer reading program. https://kidsreadnow.org/wp-content/uploads/2019/08/BormanReport.pdf
Brown-Chidsey, R., & Bickford, R. (2016). Practical handbook of multi-tiered system of support: Building academic and behavioral success in schools. Guilford Press.
Burnette, D., Herold, B., Heubeck, E., Sale Rauf, D., Shwartz, S., Will, M. (2020, June 2). COVID-19 is shaping tech use: What that means for schools. EdWeek.
Center on Positive Behavioral Interventions and Support. (2020, June 19). Returning to school during and after crisis: A guide to supporting states, districts, schools, educators, and students through a multi-tiered systems of support framework during the 2020–2021 school year. https://www.pbis.org/resource/returning-to-school-during-and-after-crisis
Cooper, H., Nye, B., Charlton, K., Lindsay, J., & Greathouse, S. (1996). The effects of summer vacation on achievement test scores: A narrative and meta-analytic review. Review of Educational Research, 66, 227-268.
Griffith, M. (2020. May 22). COVID-19 and school funding: What to expect and what states can do. Education Commission of the States. https://www.ecs.org/covid-19-and-school-funding-what-to-expect- and-what-states-can-do/
Gibbons, K., Brown, S., Niebling, B. C (2018). Effective universal instruction: An action-oriented approach to improving tier 1. Guilford Press.
Kim, J. S. & Quinn, D. M. (2014). The effects of summer reading on low-income children's literacy achievement from Kindergarten to Grade 8: A meta-analysis of classroom and home interventions. Review of Educational Research 83(3), 386-431.
Kuhfeld, M. (2019, June 6). Rethinking summer slide: The more you gain, the more you lose. KappanOnline. https://kappanonline.org/rethinking-summer-slide-the-more-you-gain-the-more-you-lose/
Kuhfeld, M., & Tarasawa, B. (2020). The COVID-19 slide: What summer learning loss can tell us about the potential impact of school closures on student academic achievement. https://www.nwea.org/content/uploads/2020/05/Collaborative-Brief_Covid19-Slide-APR20.pdf
Sandberg Patton, K. L., & Reschly, A. L. (2013). Using curriculum-based measurement to examine summer learning loss. Psychology in the Schools, 50(7), 738-753.
19
COVID SLIDE: RESEARCH ON LEARNING LOSS & RECOMMENDATIONS TO CLOSE THE GAP

A B O U T T H E A U T H O R S
John Bielinski, Ph.D.Senior Director of Research & Development
Dr. Bielinski is a psychometrician by training and has led development of educational tests and educational research in the industry for 20 years. Dr. Bielinski began his career in education policy at the National Center on Educational Outcomes and joined FastBridge in 2018. His expertise is in CBM and modeling growth.
Rachel Brown, Ph.D., NCSPSenior Academic Officer
Dr. Brown joined FastBridge in 2015 after teaching at the University of Southern Maine for 16 years. She has experience as a general education teacher, special educator, and school psychologist. Her area of expertise is Multi-Tiered Systems of Support. She splits her time between Alaska and Maine.
Kyle Wagner, Ph.D., NCSPResearch Associate
Dr. Wagner is a research associate at Illuminate Education. He has several years of experience as a school psychologist in Texas and Minnesota. He also has several publications and presentations on topics including psychometrics, curriculum-based measures, and academic intervention. Kyle is currently working with the FastBridge suite of products at Illuminate Education.
20
COVID SLIDE: RESEARCH ON LEARNING LOSS & RECOMMENDATIONS TO CLOSE THE GAP
Warning: No part of this publication may be reproduced or transmitted in any form or by any means, electronic or mechanical, now known or later developed, including, but not limited to, photocopying, recording, or the process of scanning and digitizing, transmitted, or stored in a database or retrieval system, without permission in writing from the copyright owner.
Illuminate Education partners with K-12 educators to equip them with data to serve the whole child and reach new levels of student performance. Our solution brings together holistic data and collaborative tools and puts them in the hands of educators. Moment-by-moment, our users can visualize each student’s progress, determine the right instructional or intervention strategy, and take the next best action. Headquartered in Irvine, CA., Illuminate supports over 17 million students and 5200 districts and schools across all 50 states.
Published and Distributed by Illuminate Education, Inc.150 South Fifth Street, Suite 600Minneapolis, MN 55402Email: [email protected] Website: www.fastbridge.org Phone: 612.254.2534
© 2020 Illuminate Education. All rights reserved.
21
COVID SLIDE: RESEARCH ON LEARNING LOSS & RECOMMENDATIONS TO CLOSE THE GAP