cowen 2015 tech conference (05-15)
TRANSCRIPT
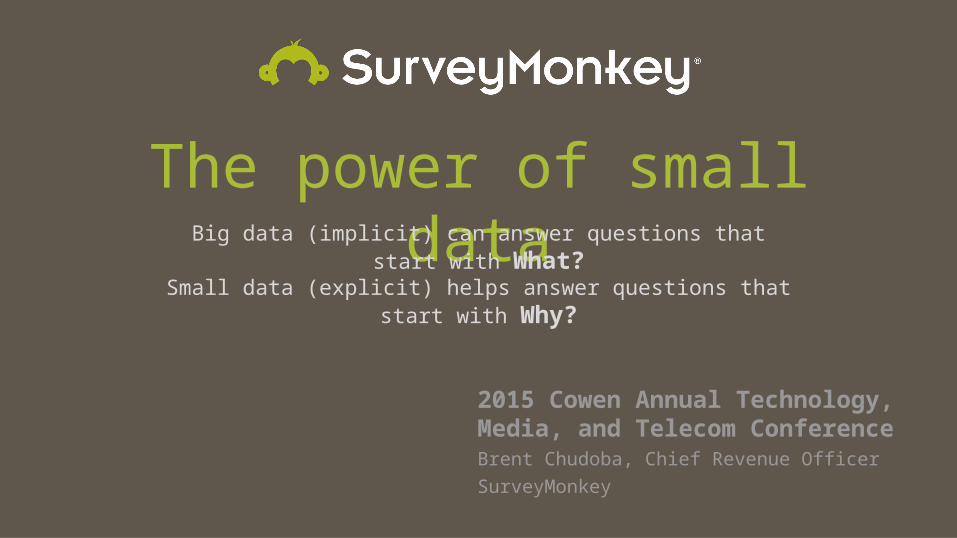
The power of small dataBig data (implicit) can answer questions that start with What?
Small data (explicit) helps answer questions that start with Why?
2015 Cowen Annual Technology, Media, and Telecom ConferenceBrent Chudoba, Chief Revenue Officer
SurveyMonkey

We asked >500 people questions on several topics
Topics/Companies:● Travel/Airbnb● Transportation/Uber● Online Reviews/Yelp
Methodology:● We surveyed >500 US consumers from Tue, 5/26/15 to Wed, 5/27/15
○ The survey was conducted using an online audience, which can have a higher income and education skew vs. the US population
○ Target: US Internet consumers and a focused San Francisco metro segment○ Balancing: US Census on age and gender
● Source: SurveyMonkey’s proprietary Audience panel
2
● Online dating/Tinder, IAC● Social networking/FB, Twitter, Pinterest

Deriving insights by discovering the ‘Why’
How Many? Why? Why not? Why replace?
Market size(Current state)
Growth(Past use)
Potential(Future looking)
Evolving industry(New markets)
3
Airbnb

How many people use Airbnb?
– We found that around 5% of respondents use Airbnb
N=442Have you booked a place to stay on Airbnb in the past year?
What we were trying to figure out
5

Exploring Airbnb’s growth further
5% 12%of all respondents of San Francisco
respondents
Have you booked a place to stay on Airbnb in the past year? N=442; SF=136 6
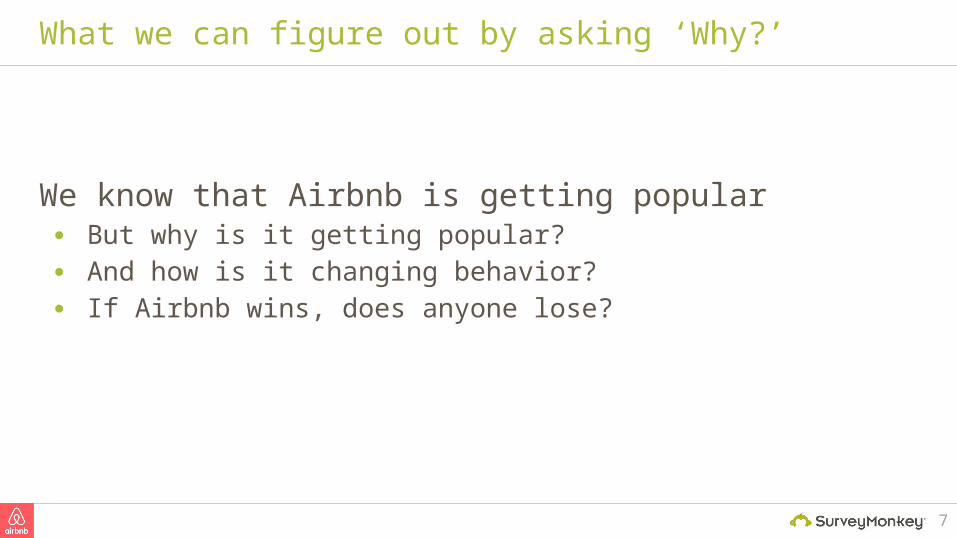
What we can figure out by asking ‘Why?’
We know that Airbnb is getting popular ● But why is it getting popular? ● And how is it changing behavior? ● If Airbnb wins, does anyone lose?
7

Asking ‘Why?’ helps us understand the growth
Q: Why are people using Airbnb?
“I now have more options to stay in places I travel to”
“I book...through Airbnb or a similar site before using a hotel”
“I like staying in homes not hotels”
“It's made it easier and better. Airbnb is a fantastic way to travel”
“It allows for a more "local" experience at wider range of prices”
N=22 8
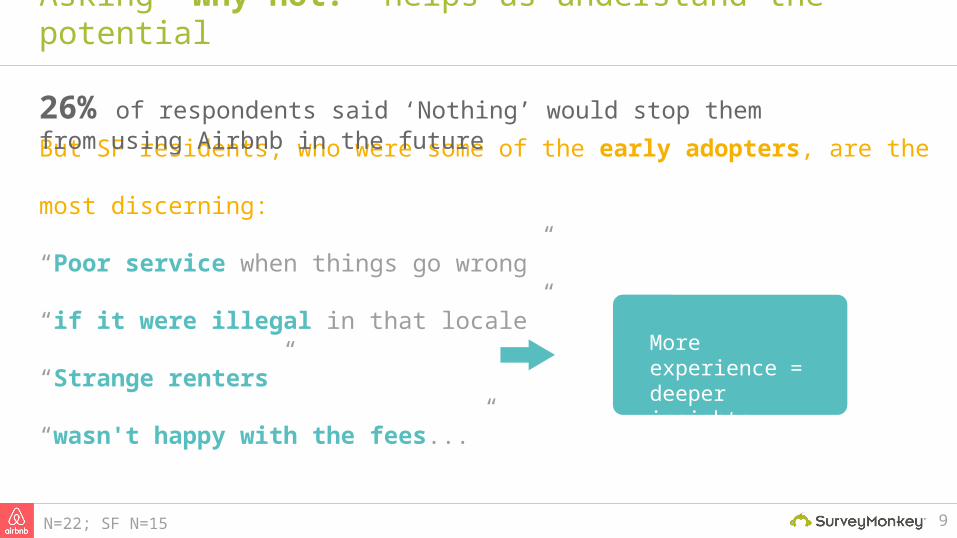
But SF residents, who were some of the early adopters, are the most discerning:
“Poor service when things go wrong”
“if it were illegal in that locale”
“Strange renters”
“wasn't happy with the fees...”
Asking ‘Why not?’ helps us understand the potential
More experience = deeper insights
N=22; SF N=15 9
26% of respondents said ‘Nothing’ would stop them from using Airbnb in the future

Asking ‘Why replace?’ helps us understand the industry
In fact, 11% of all Airbnb users said “it wasn’t replacing anything”
“not traveling, boring hotels”
“Nothing. It was basically the only option where we're going”
Q: When you use Airbnb, what is it replacing?
N=22 10

Uber

How many people use Uber?
– We found that around 12% of respondents use Uber
N=442Have you ever paid to take a ride on Uber?
What we were trying to figure out
12
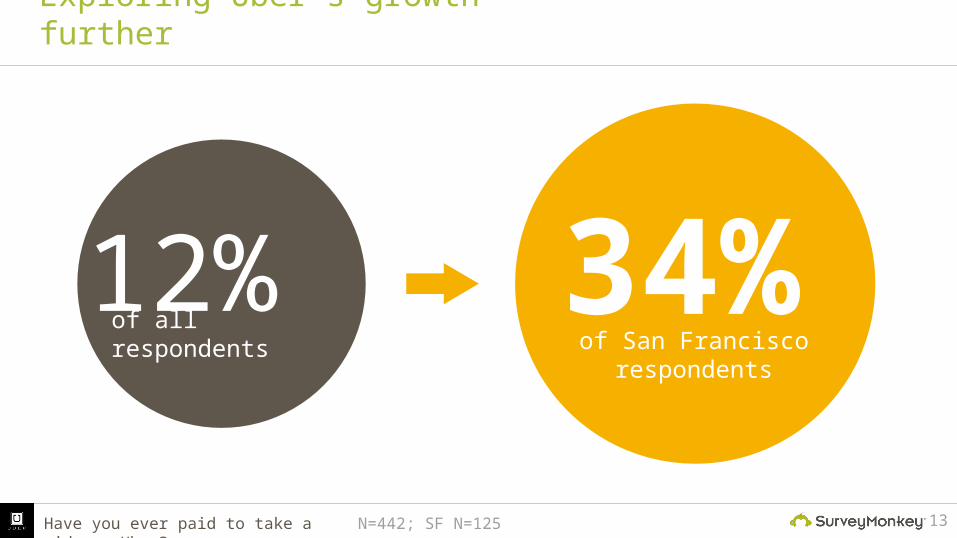
N=442; SF N=125Have you ever paid to take a ride on Uber?
Exploring Uber’s growth further
12% 34%of all respondents of San Francisco
respondents
13

What we can figure out by asking ‘Why?’
We know Uber is getting very popular ● But why is it getting more popular? ● And how is it changing behavior? ● If Uber wins, does anything lose?
14

Asking ‘Why?’ helps us understand the growth
Q: Why are people using Uber?
“It's meant I basically stopped taking taxis...”
“less inclined to drive...”
“The drivers relate well with my age group and sometimes they have candy!”
“cheap, fun way to get wherever you need to go”
“Made me feel safer and was reliable & convenient…”
N=21 15

Asking ‘Why not?’ helps us understand the potential
32% of Uber users said ‘Cost’ would stop them from using Uber in the future
But SF residents, who were some of the early adopters, are the most discerning:
“...negative relations with female journalists”
“...I don't like their reputation for huge surprise fares…”
“Surge pricing”
“...number of cancelled pickups…”
N=52; SF N=42 16
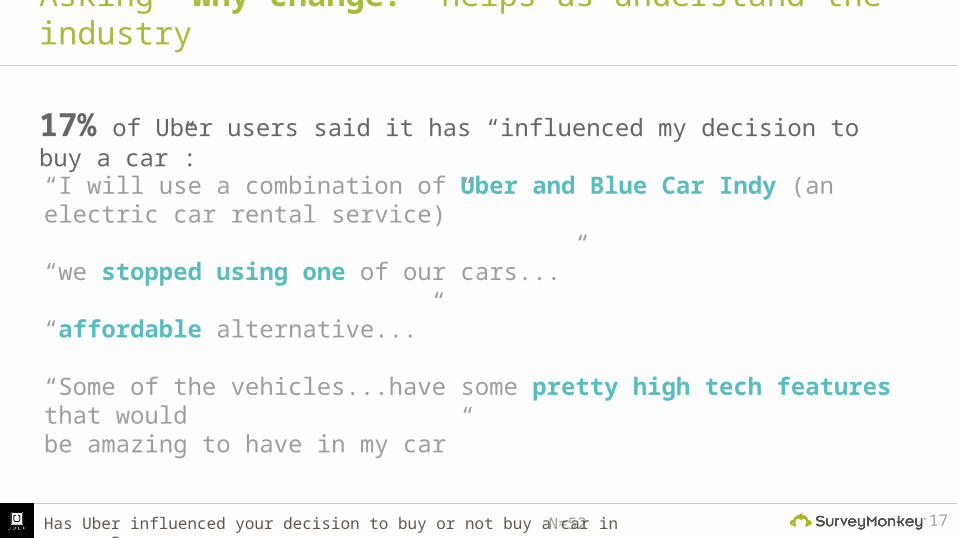
Asking ‘Why change?’ helps us understand the industry
17% of Uber users said it has “influenced my decision to buy a car”:
N=52
“I will use a combination of Uber and Blue Car Indy (an electric car rental service)”
“we stopped using one of our cars...”
“affordable alternative...”
“Some of the vehicles...have some pretty high tech features that wouldbe amazing to have in my car”
Has Uber influenced your decision to buy or not buy a car in any way? 17

Asking ‘Why change?’ helps us understand the industry
N=21
Q: How has Uber changed your life the most?
Saves me money
Decreases my need to take taxis
10%
Decreases my need for a car
Increases my enjoyment for getting around
Makes me feel safer
10% 20% 30%0%
14%
19%
14%
24%
10%
10%
Is a more reliable way to get around
Other (please specify)
18

Yelp

N=442
Q: What is the best consumer review site on local merchants?
– 30% of respondents said Yelp was the best consumer review site
What we were trying to figure out
30%
7%
6%
4%
3%
2%
2%
Yelp
Angie’s List
Amazon
Consumer Reports
Trip Advisor
Yahoo
20
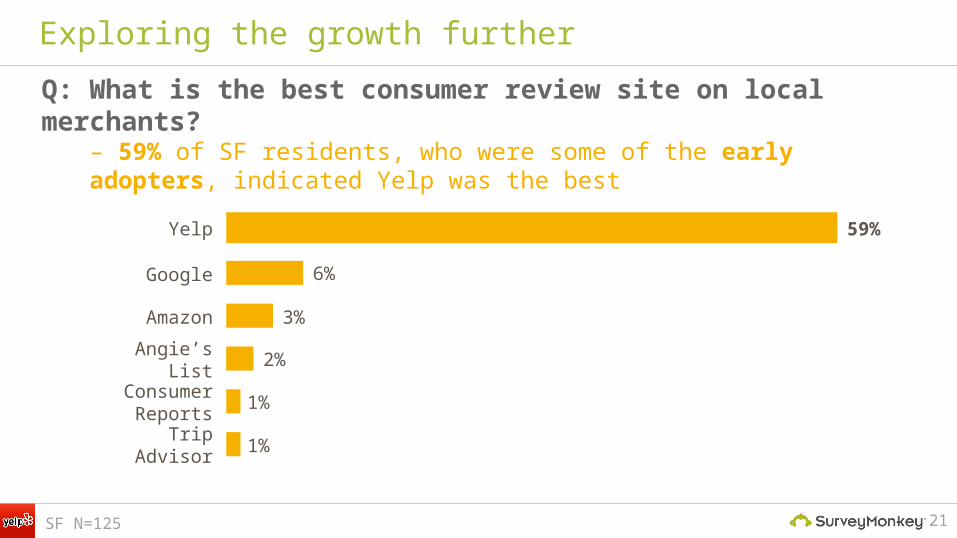
SF N=125
Q: What is the best consumer review site on local merchants?– 59% of SF residents, who were some of the early adopters, indicated Yelp was the best
Exploring the growth further
Amazon
Angie’s List
Consumer Reports
Trip Advisor 1%
1%
2%
3%
6%
21
59%Yelp
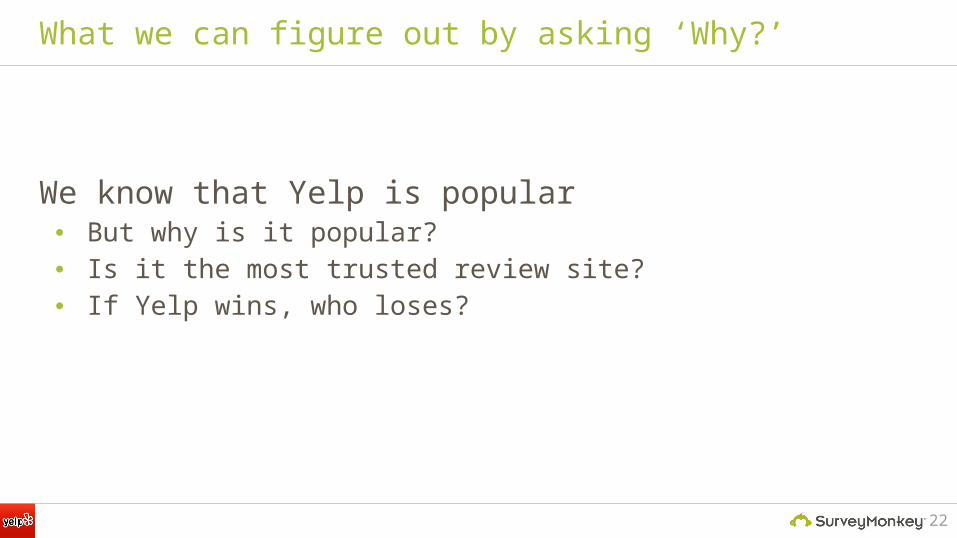
What we can figure out by asking ‘Why?’
We know that Yelp is popular● But why is it popular? ● Is it the most trusted review site? ● If Yelp wins, who loses?
22

How many people trust Yelp?
– We found that around 58% of US Yelp users trust the
reviews on Yelp*
How much do you trust the reviews on Yelp?
*No significant difference between US and SF respondents
N=244; SF N=103
Asking ‘Why?’ helps us understand the growth
23
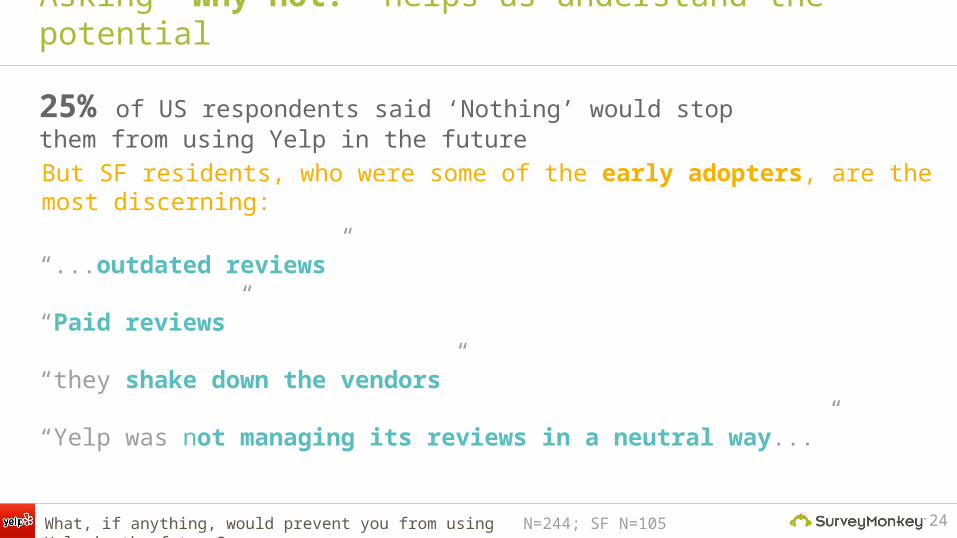
Asking ‘Why not?’ helps us understand the potential
25% of US respondents said ‘Nothing’ would stop them from using Yelp in the future
But SF residents, who were some of the early adopters, are the most discerning:
“...outdated reviews”
“Paid reviews”
“they shake down the vendors”
“Yelp was not managing its reviews in a neutral way...”
N=244; SF N=105 24What, if anything, would prevent you from using Yelp in the future?

Online Dating

What we were trying to figure out
N=423
Q: Have you ever used an online dating service?
Yes
No
No, but I’ve considered it
28%
64%
8%
0% 10% 20% 30% 40% 50% 60% 70%
26
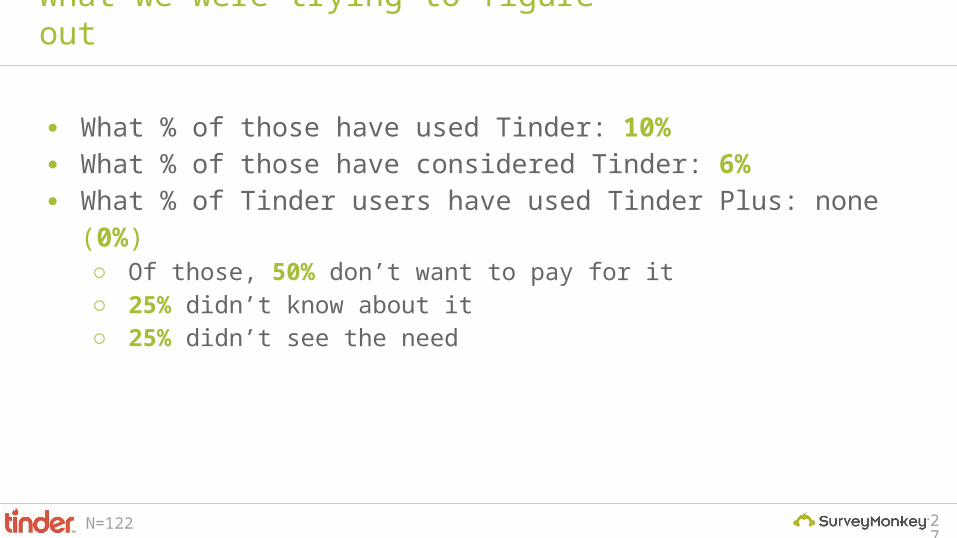
● What % of those have used Tinder: 10%● What % of those have considered Tinder: 6%● What % of Tinder users have used Tinder Plus: none (0%)
○ Of those, 50% don’t want to pay for it○ 25% didn’t know about it○ 25% didn’t see the need
N=122
What we were trying to figure out
27

Social Networking
What we were trying to figure out
N=342
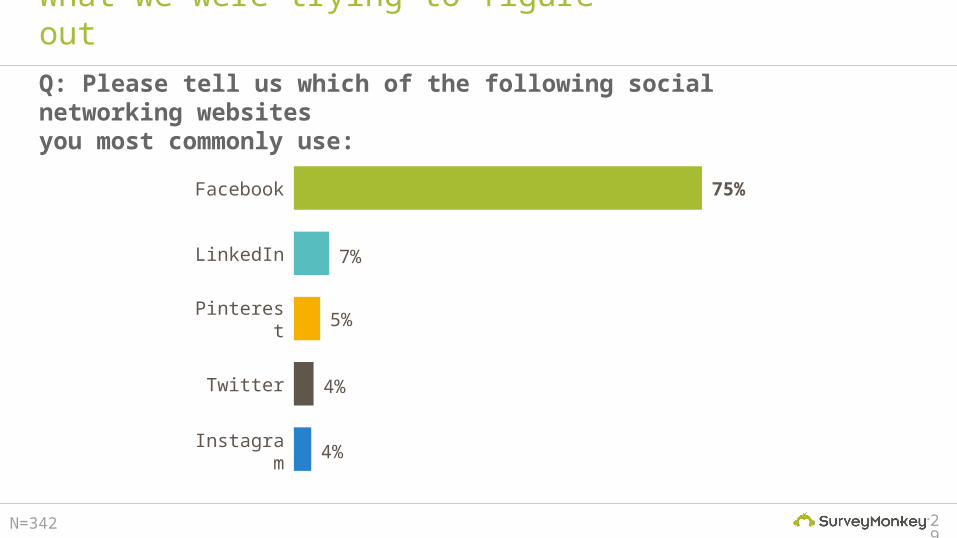
Q: Please tell us which of the following social networking websitesyou most commonly use:
28%75%
7%
5%
4%
4%
29
What we were trying to figure out
N=342
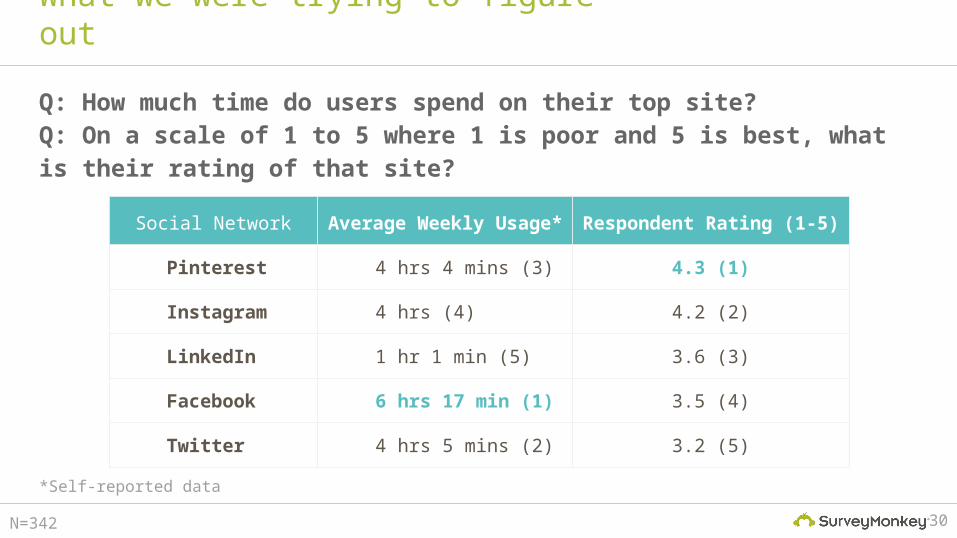
Social Network Average Weekly Usage* Respondent Rating (1-5)
Pinterest 4 hrs 4 mins (3) 4.3 (1)
Instagram 4 hrs (4) 4.2 (2)
LinkedIn 1 hr 1 min (5) 3.6 (3)
Facebook 6 hrs 17 min (1) 3.5 (4)
Twitter 4 hrs 5 mins (2) 3.2 (5)
30
Q: How much time do users spend on their top site?Q: On a scale of 1 to 5 where 1 is poor and 5 is best, what is their rating of that site?
*Self-reported data

Questions?
Learn more aboutSurveyMonkey Audience:
Contact us to get started
Thank you.