cpb system technology assessment final report system technology assessment final report may 21st,...
TRANSCRIPT
WWW.EAGLEHILLCONSULTING.COM
CPB System Technology Assessment Final Report
MAY 21ST, 2017
WWW.EAGLEHILLCONSULTING.COM 2
The Corporation for Public Broadcasting commissioned Eagle Hill Consulting to conduct System Technology Assessment project. The project ran from September 2016 through May 2017.
Eagle Hill Consulting241 18th Street South #615Arlington, VA 22202(703) 229-8600
WWW.EAGLEHILLCONSULTING.COM 3
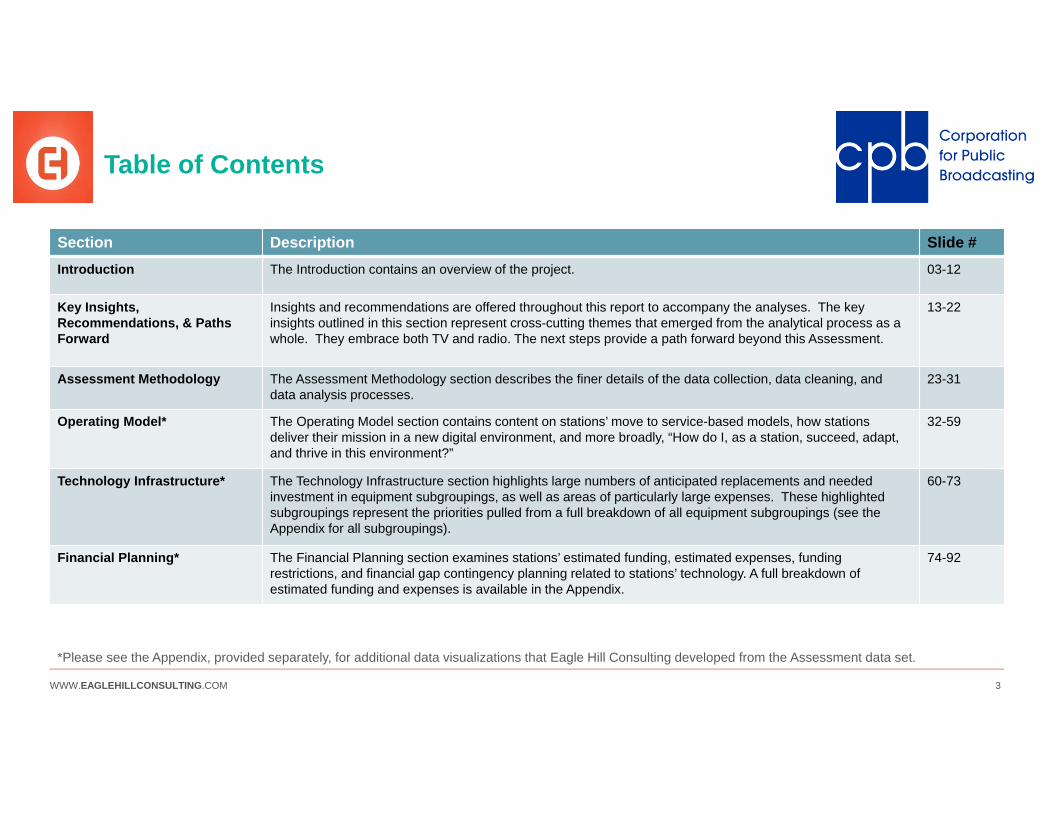
Table of Contents
Section Description Slide #Introduction The Introduction contains an overview of the project. 03-12
Key Insights, Recommendations, & Paths Forward
Insights and recommendations are offered throughout this report to accompany the analyses. The key insights outlined in this section represent cross-cutting themes that emerged from the analytical process as a whole. They embrace both TV and radio. The next steps provide a path forward beyond this Assessment.
13-22
Assessment Methodology The Assessment Methodology section describes the finer details of the data collection, data cleaning, and data analysis processes.
23-31
Operating Model* The Operating Model section contains content on stations’ move to service-based models, how stations deliver their mission in a new digital environment, and more broadly, “How do I, as a station, succeed, adapt, and thrive in this environment?”
32-59
Technology Infrastructure* The Technology Infrastructure section highlights large numbers of anticipated replacements and needed investment in equipment subgroupings, as well as areas of particularly large expenses. These highlighted subgroupings represent the priorities pulled from a full breakdown of all equipment subgroupings (see the Appendix for all subgroupings).
60-73
Financial Planning* The Financial Planning section examines stations’ estimated funding, estimated expenses, funding restrictions, and financial gap contingency planning related to stations’ technology. A full breakdown of estimated funding and expenses is available in the Appendix.
74-92
*Please see the Appendix, provided separately, for additional data visualizations that Eagle Hill Consulting developed from the Assessment data set.
WWW.EAGLEHILLCONSULTING.COM 4WWW.EAGLEHILLCONSULTING.COM 4
INTRODUCTION
WWW.EAGLEHILLCONSULTING.COM 5
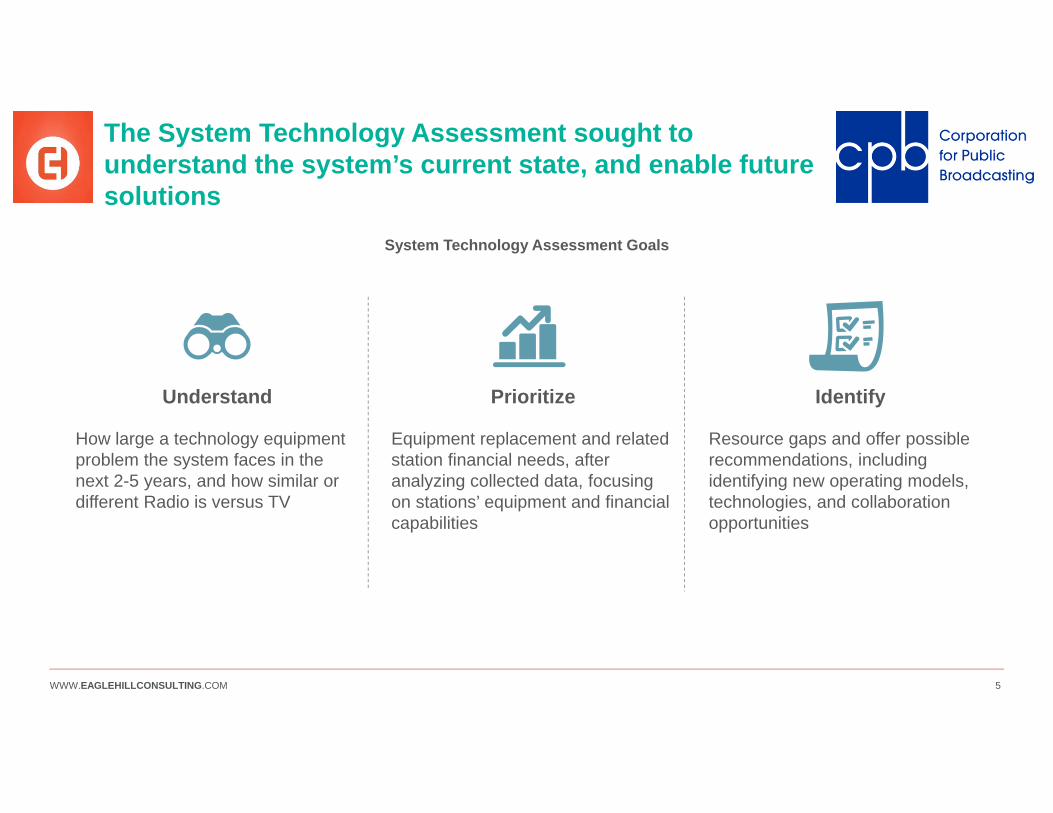
Prioritize
Equipment replacement and related station financial needs, after analyzing collected data, focusing on stations’ equipment and financial capabilities
The System Technology Assessment sought to understand the system’s current state, and enable future solutions
Identify
Resource gaps and offer possible recommendations, including identifying new operating models, technologies, and collaboration opportunities
Understand
How large a technology equipment problem the system faces in the next 2-5 years, and how similar or different Radio is versus TV
System Technology Assessment Goals
WWW.EAGLEHILLCONSULTING.COM 6
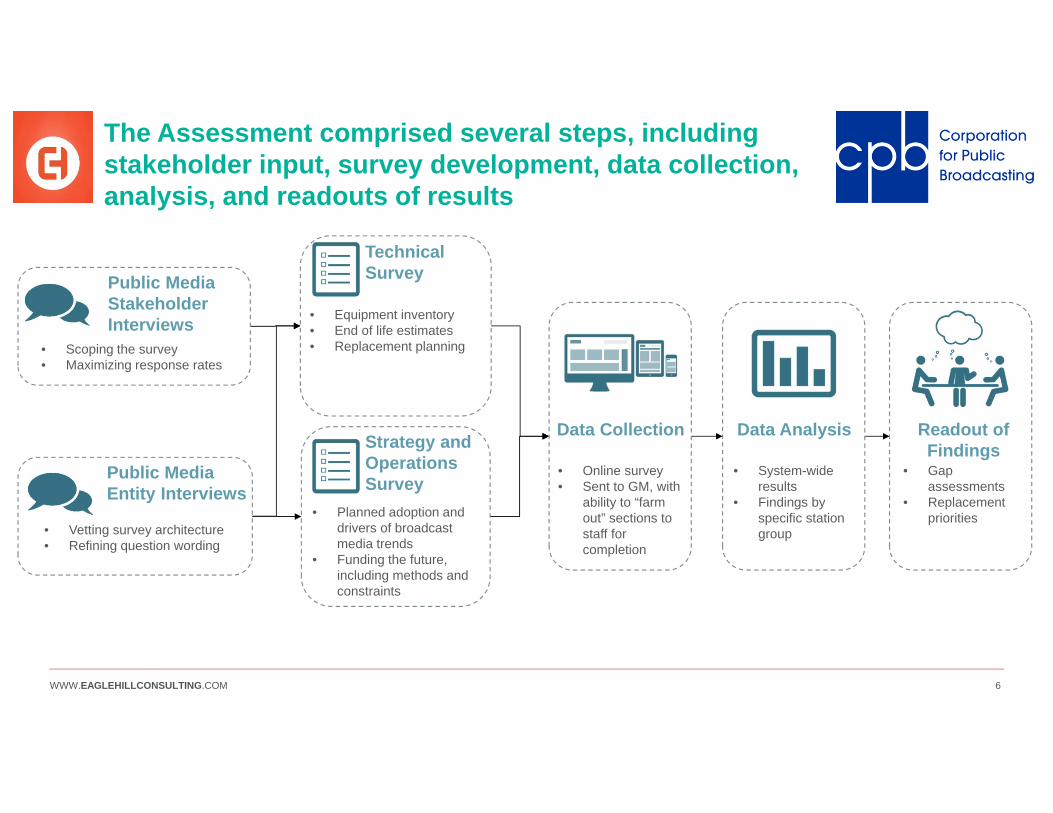
The Assessment comprised several steps, including stakeholder input, survey development, data collection, analysis, and readouts of results
Public Media Stakeholder Interviews
• Scoping the survey• Maximizing response rates
Public Media Entity Interviews
• Vetting survey architecture• Refining question wording
Technical Survey
• Equipment inventory• End of life estimates• Replacement planning
Strategy and Operations Survey
• Planned adoption and drivers of broadcast media trends
• Funding the future, including methods and constraints
• Gap assessments
• Replacement priorities
Readout of Findings
Data Analysis
• System-wide results
• Findings by specific station group
Data Collection
• Online survey• Sent to GM, with
ability to “farm out” sections to staff for completion
WWW.EAGLEHILLCONSULTING.COM 7
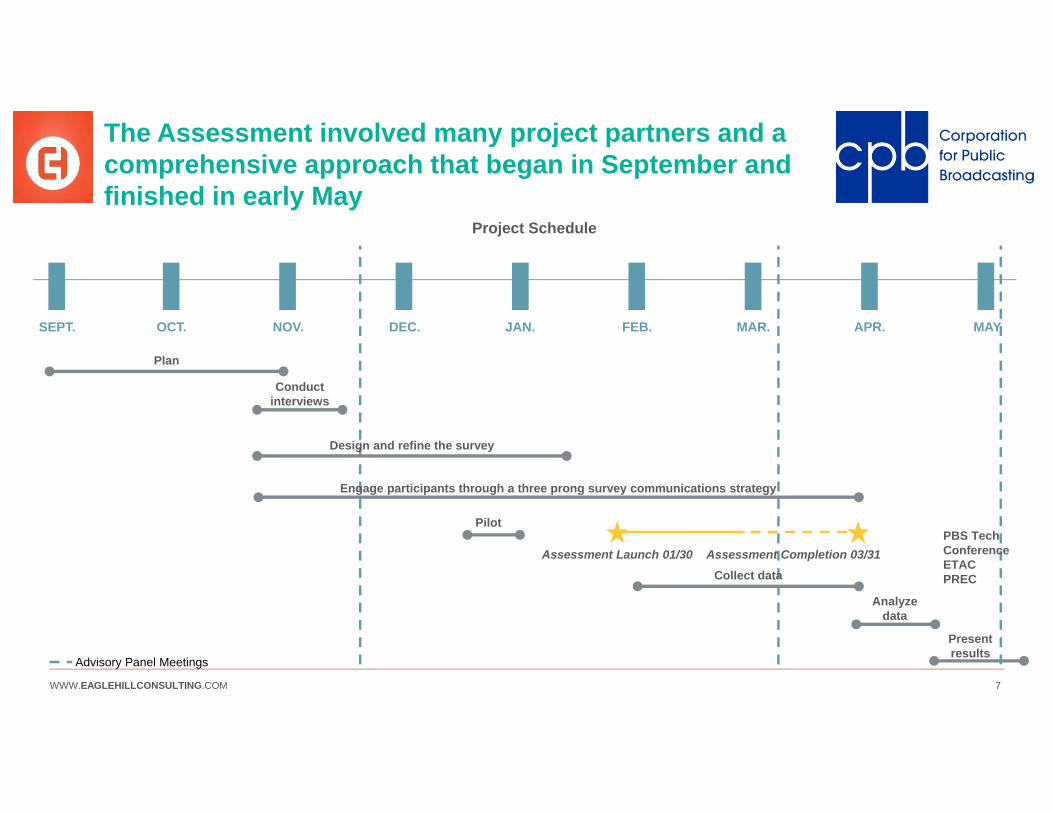
The Assessment involved many project partners and a comprehensive approach that began in September and finished in early May
Project Schedule
SEPT. NOV.OCT. DEC. JAN. MAR. APR.FEB.
Assessment Launch 01/30
Plan
Conduct interviews
Design and refine the survey
Pilot
Collect data
Analyze data
MAY
Assessment Completion 03/31
Engage participants through a three prong survey communications strategy
Present results
Advisory Panel Meetings
PBS Tech Conference ETACPREC

WWW.EAGLEHILLCONSULTING.COM 8
CPB extended the survey end date to March 31st to support stations during a particularly busy time
Incorporated additional feedback into survey instrument design. Launched survey. Engaged member
organizations in station outreach.
JANUARY
Kicked off the project and began planning phases. CPB prepared for GM
conference.
SEPTEMBER
Continued planning phase, including preparing for
interviews. Interview list is expanded to include
additional stakeholders. Began two rounds of
stakeholder interviews.
OCTOBER
Conducted pilot, which pushed into holidays,
causing minimized pilot participation. Continued
refining the survey. Developed interim report.
DECEMBER
Wrapped up stakeholder interviews. Began refining
survey based on stakeholders’ feedback.
Hosted first Advisory Panel Meeting. Pilot was
delayed.
NOVEMBER
Extended survey end date to March 31st to answer
station feedback regarding ongoing industry activities. Began developing analysis frameworks and outlined
final report.
FEBRUARY
Finished analyzing the data. Developed final
report and advisory panel webinar. Communicated
results at industry events.
APRIL
Encouraged station support through mailer and
personalized outreach. Analyzed preliminary data. Hosted second Advisory
Panel Meeting.
MARCH
Submitted final deliverables, delivered advisory panel webinar,
and wrapped up the project.
MAY
WWW.EAGLEHILLCONSULTING.COM 9
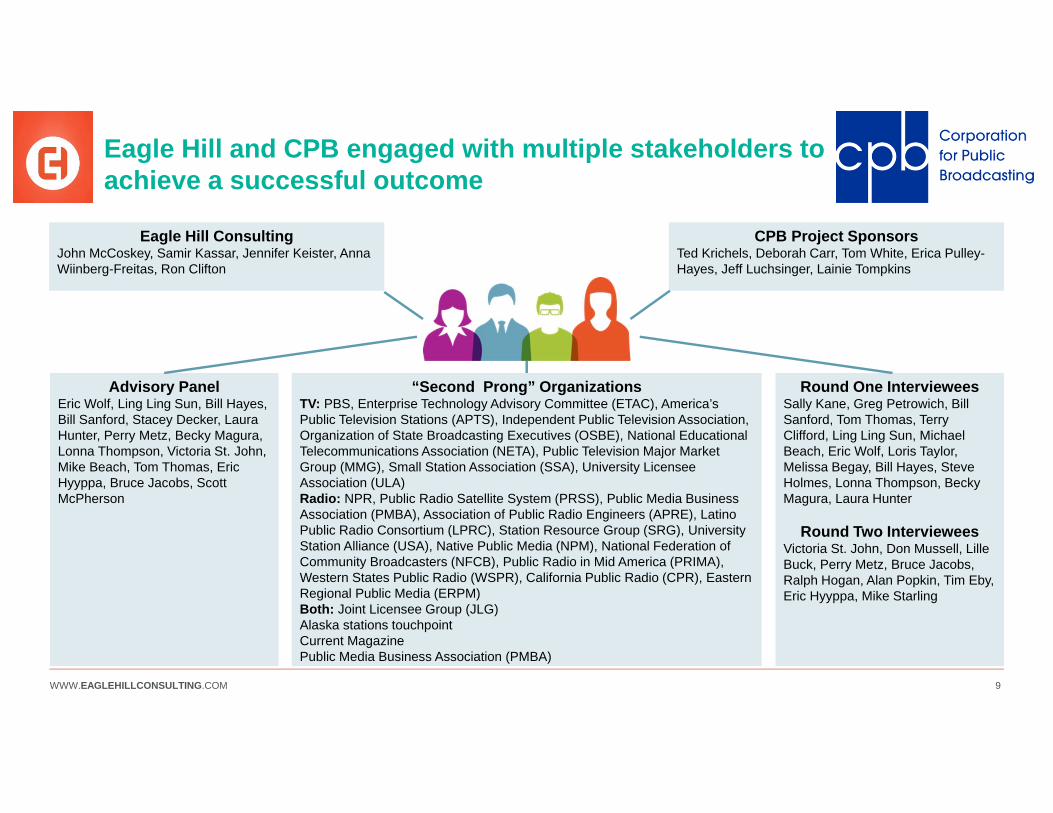
Eagle Hill and CPB engaged with multiple stakeholders to achieve a successful outcome
Eagle Hill ConsultingJohn McCoskey, Samir Kassar, Jennifer Keister, Anna Wiinberg-Freitas, Ron Clifton
CPB Project SponsorsTed Krichels, Deborah Carr, Tom White, Erica Pulley-Hayes, Jeff Luchsinger, Lainie Tompkins
Advisory PanelEric Wolf, Ling Ling Sun, Bill Hayes, Bill Sanford, Stacey Decker, Laura Hunter, Perry Metz, Becky Magura, Lonna Thompson, Victoria St. John, Mike Beach, Tom Thomas, Eric Hyyppa, Bruce Jacobs, Scott McPherson
“Second Prong” OrganizationsTV: PBS, Enterprise Technology Advisory Committee (ETAC), America’s Public Television Stations (APTS), Independent Public Television Association, Organization of State Broadcasting Executives (OSBE), National Educational Telecommunications Association (NETA), Public Television Major Market Group (MMG), Small Station Association (SSA), University Licensee Association (ULA)Radio: NPR, Public Radio Satellite System (PRSS), Public Media Business Association (PMBA), Association of Public Radio Engineers (APRE), Latino Public Radio Consortium (LPRC), Station Resource Group (SRG), University Station Alliance (USA), Native Public Media (NPM), National Federation of Community Broadcasters (NFCB), Public Radio in Mid America (PRIMA), Western States Public Radio (WSPR), California Public Radio (CPR), Eastern Regional Public Media (ERPM)Both: Joint Licensee Group (JLG)Alaska stations touchpointCurrent MagazinePublic Media Business Association (PMBA)
Round One IntervieweesSally Kane, Greg Petrowich, Bill Sanford, Tom Thomas, Terry Clifford, Ling Ling Sun, Michael Beach, Eric Wolf, Loris Taylor, Melissa Begay, Bill Hayes, Steve Holmes, Lonna Thompson, Becky Magura, Laura Hunter
Round Two IntervieweesVictoria St. John, Don Mussell, Lille Buck, Perry Metz, Bruce Jacobs, Ralph Hogan, Alan Popkin, Tim Eby, Eric Hyyppa, Mike Starling
WWW.EAGLEHILLCONSULTING.COM 10
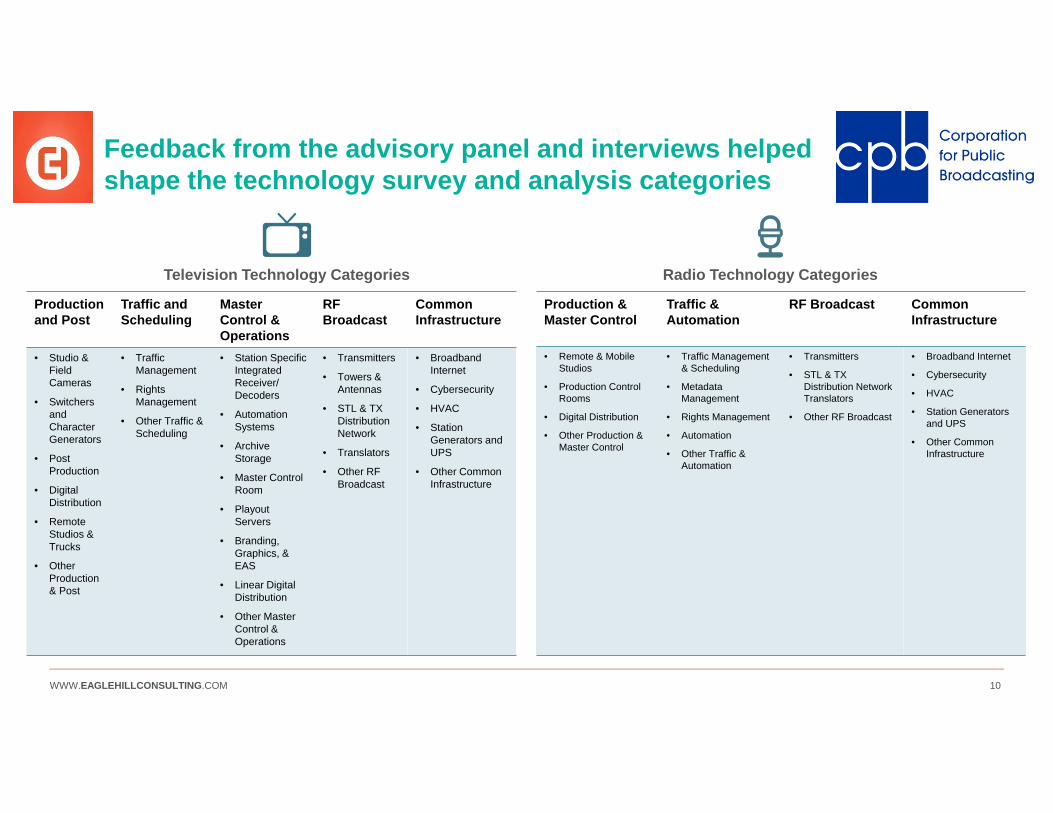
Feedback from the advisory panel and interviews helped shape the technology survey and analysis categories
Productionand Post
Traffic and Scheduling
Master Control & Operations
RF Broadcast
Common Infrastructure
• Studio & Field Cameras
• Switchersand Character Generators
• Post Production
• Digital Distribution
• Remote Studios & Trucks
• Other Production & Post
• Traffic Management
• RightsManagement
• Other Traffic & Scheduling
• Station SpecificIntegrated Receiver/ Decoders
• Automation Systems
• Archive Storage
• Master Control Room
• Playout Servers
• Branding, Graphics, & EAS
• Linear Digital Distribution
• Other Master Control & Operations
• Transmitters
• Towers & Antennas
• STL & TX Distribution Network
• Translators
• Other RF Broadcast
• Broadband Internet
• Cybersecurity
• HVAC
• Station Generators and UPS
• Other CommonInfrastructure
Television Technology Categories Radio Technology Categories
Production & Master Control
Traffic & Automation
RF Broadcast Common Infrastructure
• Remote & Mobile Studios
• Production Control Rooms
• Digital Distribution
• Other Production & Master Control
• Traffic Management & Scheduling
• Metadata Management
• Rights Management
• Automation
• Other Traffic & Automation
• Transmitters
• STL & TX Distribution Network Translators
• Other RF Broadcast
• Broadband Internet
• Cybersecurity
• HVAC
• Station Generators and UPS
• Other CommonInfrastructure
WWW.EAGLEHILLCONSULTING.COM 11
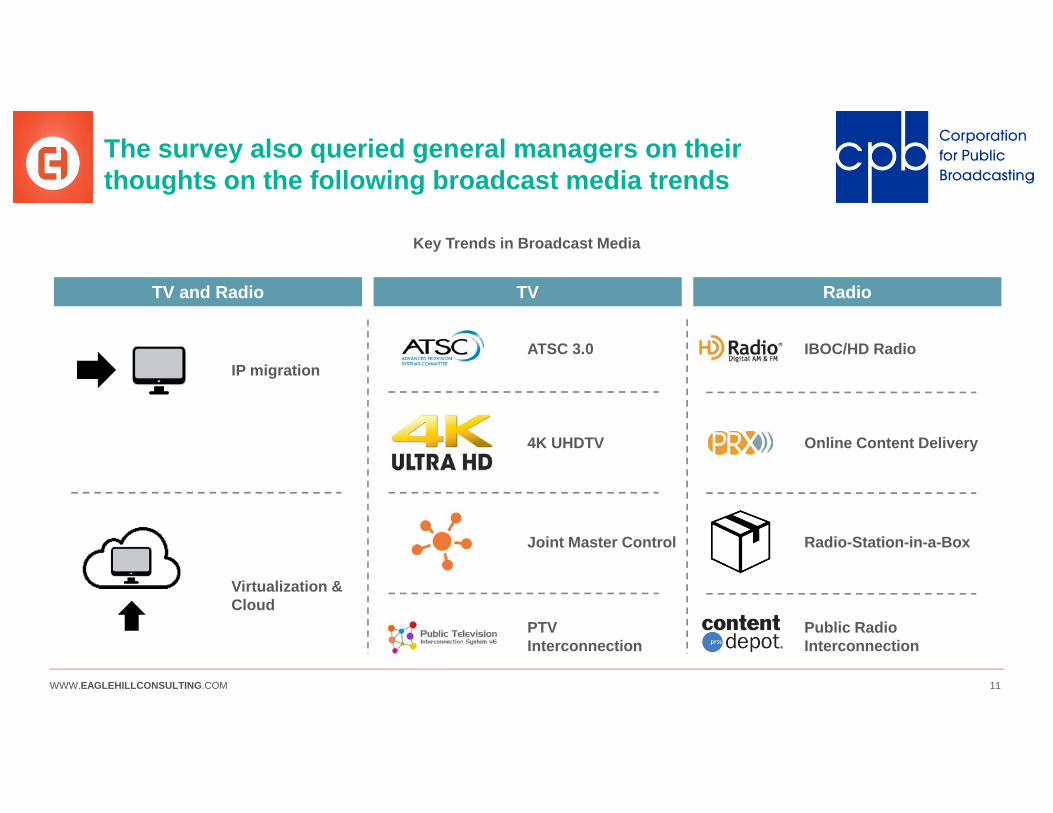
The survey also queried general managers on their thoughts on the following broadcast media trends
TV and Radio TV Radio
Key Trends in Broadcast Media
IP migrationATSC 3.0
Virtualization & Cloud
Radio-Station-in-a-Box
IBOC/HD Radio
Joint Master Control
Online Content Delivery4K UHDTV
Public Radio Interconnection
PTV Interconnection
WWW.EAGLEHILLCONSULTING.COM 12
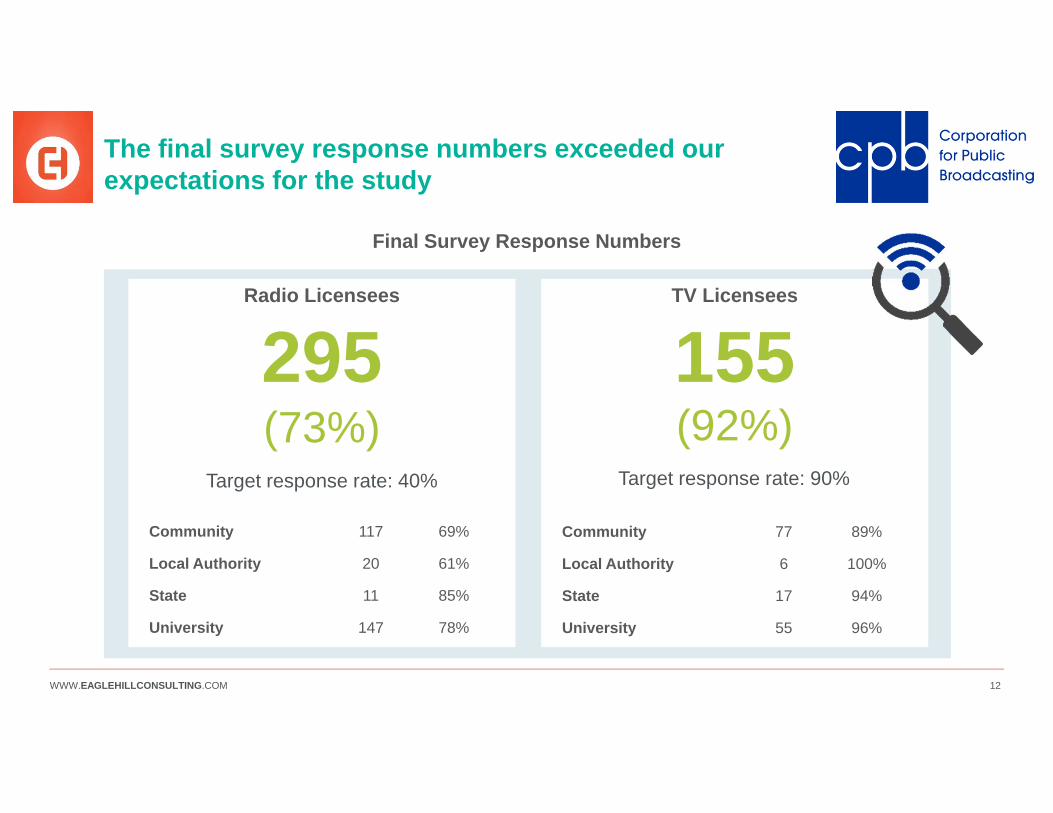
The final survey response numbers exceeded our expectations for the study
Radio Licensees TV Licensees
(73%) (92%)295 155
Community 117 69%
Local Authority 20 61%
State 11 85%
University 147 78%
Community 77 89%
Local Authority 6 100%
State 17 94%
University 55 96%
Final Survey Response Numbers
Target response rate: 40% Target response rate: 90%
WWW.EAGLEHILLCONSULTING.COM 13
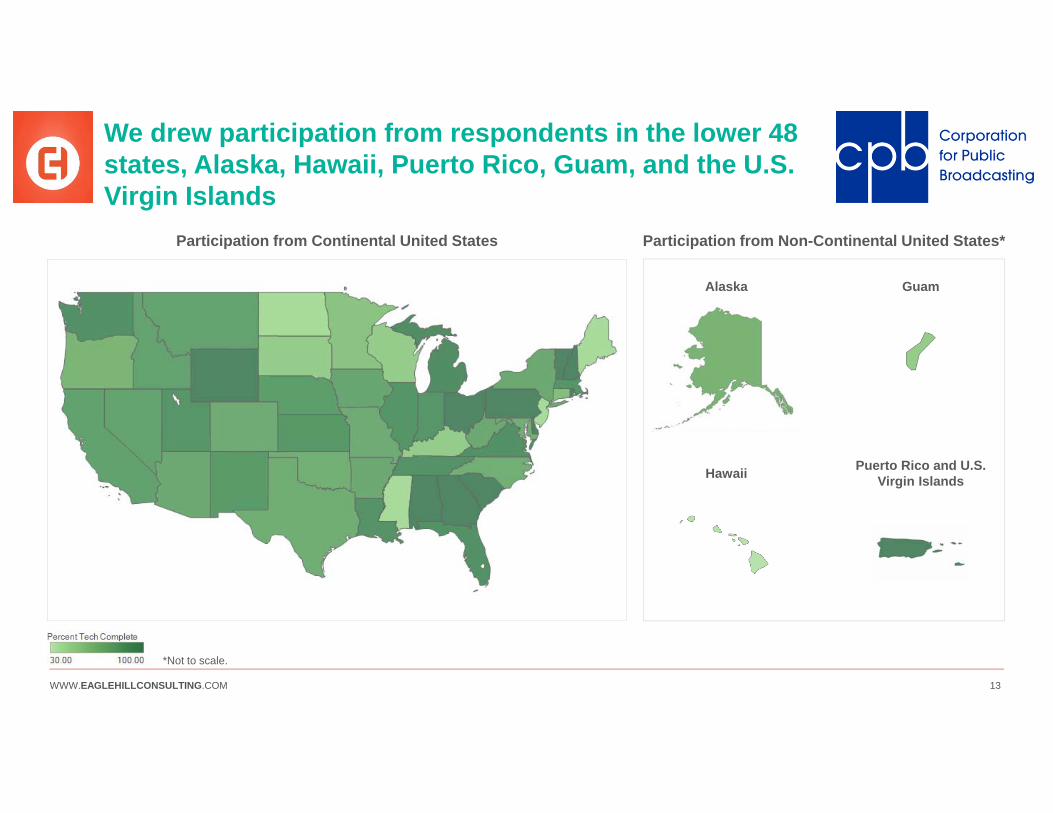
We drew participation from respondents in the lower 48 states, Alaska, Hawaii, Puerto Rico, Guam, and the U.S. Virgin Islands
Participation from Continental United States
Guam
Hawaii Puerto Rico and U.S. Virgin Islands
Alaska
Participation from Non-Continental United States*
*Not to scale.

WWW.EAGLEHILLCONSULTING.COM 14WWW.EAGLEHILLCONSULTING.COM 14
KEY INSIGHTS, RECOMMENDATIONS, & PATHS FORWARD
WWW.EAGLEHILLCONSULTING.COM 15
Section Overview
Insights and recommendations are offered throughout this report to accompany the analyses. The key insights outlined in this section represent cross-cutting themes that emerged from the analytical process as a whole. They embrace both TV and radio. The next steps provide a path forward beyond this Assessment towards a system that balances individuality with sustainability
KEY INSIGHTS, RECOMMENDATIONS, & PATHS FORWARD
WWW.EAGLEHILLCONSULTING.COM 16
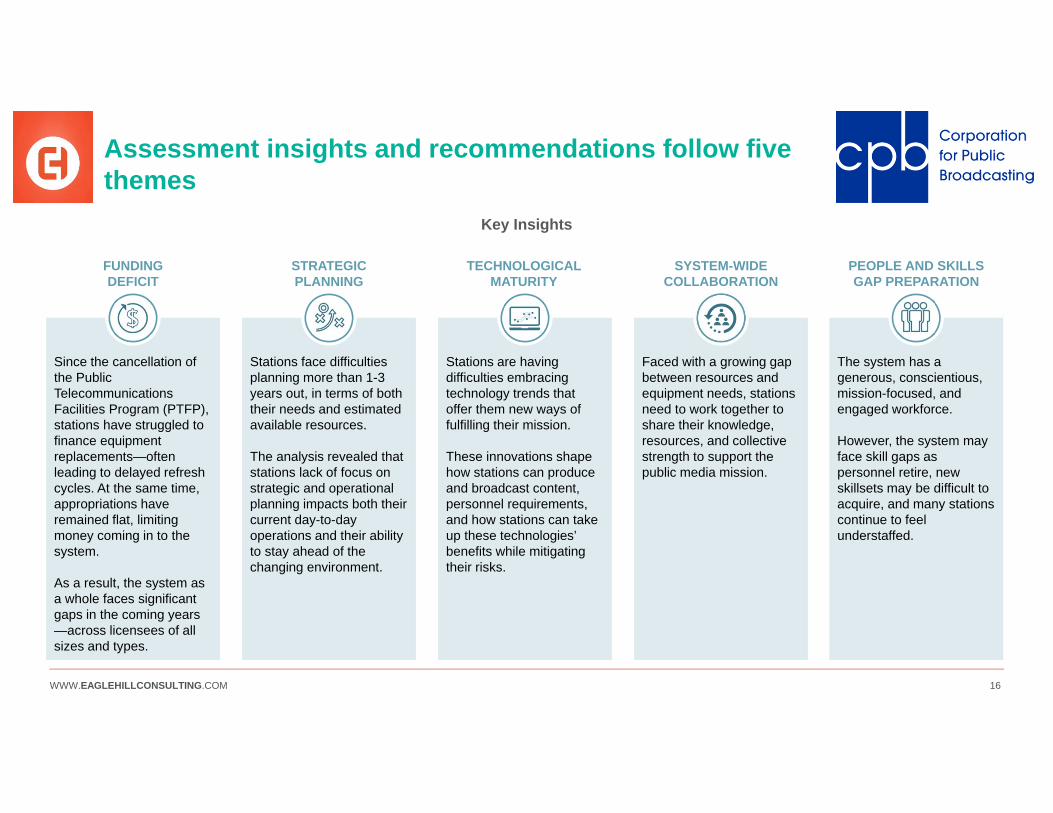
Assessment insights and recommendations follow five themes
Key Insights
The system has a generous, conscientious, mission-focused, and engaged workforce.
However, the system may face skill gaps as personnel retire, new skillsets may be difficult to acquire, and many stations continue to feel understaffed.
Faced with a growing gap between resources and equipment needs, stations need to work together to share their knowledge, resources, and collective strength to support the public media mission.
Stations are having difficulties embracing technology trends that offer them new ways of fulfilling their mission.
These innovations shape how stations can produce and broadcast content, personnel requirements, and how stations can take up these technologies’ benefits while mitigating their risks.
Since the cancellation of the Public Telecommunications Facilities Program (PTFP), stations have struggled to finance equipment replacements—often leading to delayed refresh cycles. At the same time, appropriations have remained flat, limiting money coming in to the system.
As a result, the system as a whole faces significant gaps in the coming years —across licensees of all sizes and types.
Stations face difficulties planning more than 1-3 years out, in terms of both their needs and estimated available resources.
The analysis revealed that stations lack of focus on strategic and operational planning impacts both their current day-to-day operations and their ability to stay ahead of the changing environment.
TECHNOLOGICAL MATURITY
STRATEGICPLANNING
SYSTEM-WIDECOLLABORATION
FUNDINGDEFICIT
PEOPLE AND SKILLSGAP PREPARATION

WWW.EAGLEHILLCONSULTING.COM 17
The system faces significant funding gaps in the coming years, and will need to find new revenue and minimize expenses
FUNDING DEFICIT
Key Insights and Supporting Analysis Recommendations
• Significant gaps between general managers’ estimated funds available, and needs estimated by both general managers and engineers—this gap persists across licensees of all sizes and types.
• A number of equipment groupings show significant replacement needs in the next four years.
• Stations may be hanging on to equipment beyond its optimal end of life, as they defer purchases in the face of financial uncertainty—and this risk has piled up.
Supporting Analysis
Since the cancellation of the Public Telecommunications Facilities Program (PTFP), stations have struggled to finance equipment replacements. At the same time, appropriations have remained flat, limiting money coming in to the system.
As a result, the system as a whole will face significant gaps in the coming years—across licensees of all sizes and types.
Key Insights• Use the Assessment results to support funding requests from all levels of
government and private foundations.• Develop educational packets in collaboration with licensees to support funder
education around technology needs and shifts to service-based models.• Approach less traditional funders whose interests align with public media’s
mission and reach, for example, Department of Homeland Security.
Advocate for new funding01
• Leverage new technologies to collaborate with commercial broadcasters, for example, ATSC 3.0 lighthouse services.
• Consider alternate funding sources such as public safety datacasting.• Connect with industry organizations, e.g. APTS, SRG, to target ancillary funding
sources.
Generate ancillary revenue02
• Consider collective purchase agreements to support replacements needed across the system, or particularly expensive equipment groupings.
• Consolidate the variety of technology that stations use to achieve economies of scale, and support national platforms such as PBS interconnection and JMCs.
• Prioritize replacements at the station level to avoid incurring a backlog of expired equipment.
Reduce expenses03
WWW.EAGLEHILLCONSULTING.COM 18
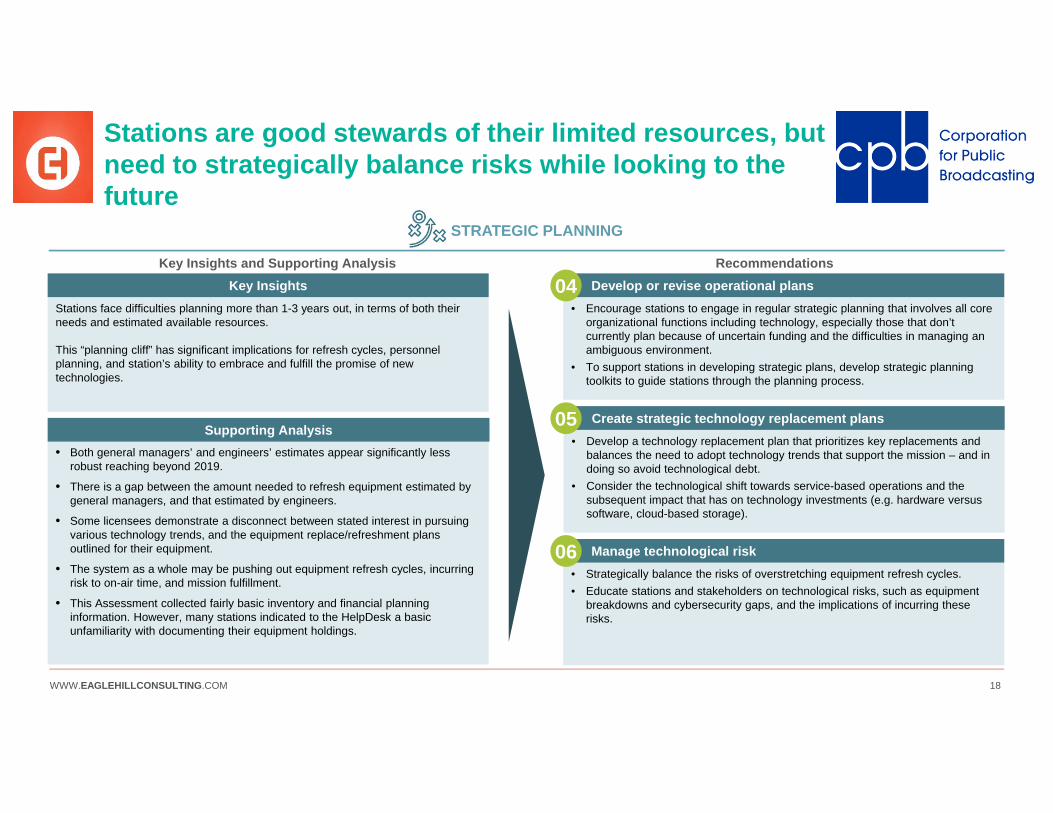
Stations are good stewards of their limited resources, but need to strategically balance risks while looking to the future
STRATEGIC PLANNING
Key Insights and Supporting Analysis Recommendations
• Both general managers’ and engineers’ estimates appear significantly less robust reaching beyond 2019.
• There is a gap between the amount needed to refresh equipment estimated by general managers, and that estimated by engineers.
• Some licensees demonstrate a disconnect between stated interest in pursuing various technology trends, and the equipment replace/refreshment plans outlined for their equipment.
• The system as a whole may be pushing out equipment refresh cycles, incurring risk to on-air time, and mission fulfillment.
• This Assessment collected fairly basic inventory and financial planning information. However, many stations indicated to the HelpDesk a basic unfamiliarity with documenting their equipment holdings.
Supporting Analysis
Stations face difficulties planning more than 1-3 years out, in terms of both their needs and estimated available resources.
This “planning cliff” has significant implications for refresh cycles, personnel planning, and station’s ability to embrace and fulfill the promise of new technologies.
Key Insights• Encourage stations to engage in regular strategic planning that involves all core
organizational functions including technology, especially those that don’t currently plan because of uncertain funding and the difficulties in managing an ambiguous environment.
• To support stations in developing strategic plans, develop strategic planning toolkits to guide stations through the planning process.
Develop or revise operational plans04
• Develop a technology replacement plan that prioritizes key replacements and balances the need to adopt technology trends that support the mission – and in doing so avoid technological debt.
• Consider the technological shift towards service-based operations and the subsequent impact that has on technology investments (e.g. hardware versus software, cloud-based storage).
Create strategic technology replacement plans 05
• Strategically balance the risks of overstretching equipment refresh cycles.• Educate stations and stakeholders on technological risks, such as equipment
breakdowns and cybersecurity gaps, and the implications of incurring these risks.
Manage technological risk06

WWW.EAGLEHILLCONSULTING.COM 19
Many stations are excited about new opportunities, but need some support to pursue these strategically on a path towards greater technological maturity
TECHNOLOGICAL MATURITY
Key Insights and Supporting Analysis Recommendations
• A noteworthy proportion of both TV and radio licensees have no plans to embrace IP or cloud-based or virtualized solutions.
• Some stations have a disconnect between the formats that they are planning to replace their equipment with and the indicated interest in moving towards service-based technologies such as cloud i.e. are stations’ procurement practices in line with their digital trajectory?
• Some stations have internet access challenges that prevent them from upgrading to newer technologies.
Supporting Analysis
Stations have an opportunity to embrace technology trends that offer them new ways of fulfilling their mission.
These innovations shape how stations can produce and broadcast content, personnel requirements, and how stations can take up these technologies’ benefits while mitigating their risks.
Key Insights• Educate station GMs and engineers on the technological and financial benefits
of changes in equipment formats.• Encourage greater collaboration between GMs and engineers to help them
understand opportunities from new technology solutions, such as IP and cloud, and make sure they are aligned in embracing these technologies.
• Consider subsidizing attendance at annual technical conferences.
Educate stations and stakeholders on new trends07
• Evaluate what supporting technologies are required to adopt certain technologies. For example, if stations want to migrate to IP, then they need to make sure that they have robust cybersecurity.
• Develop a system-wide approach to acquiring new technology, for example, cyber security.
Develop a maturity path 08
• Connect stations that face similar technology challenges to organizations that can advocate for them. For example, connect stations faced with internet access challenges to organizations that can advocate for them.
• Connect university and state stations to their governance boards to explore the possibility of lifting operational constraints that hinder them from adopting new technologies.
Connect stakeholders09
WWW.EAGLEHILLCONSULTING.COM 20
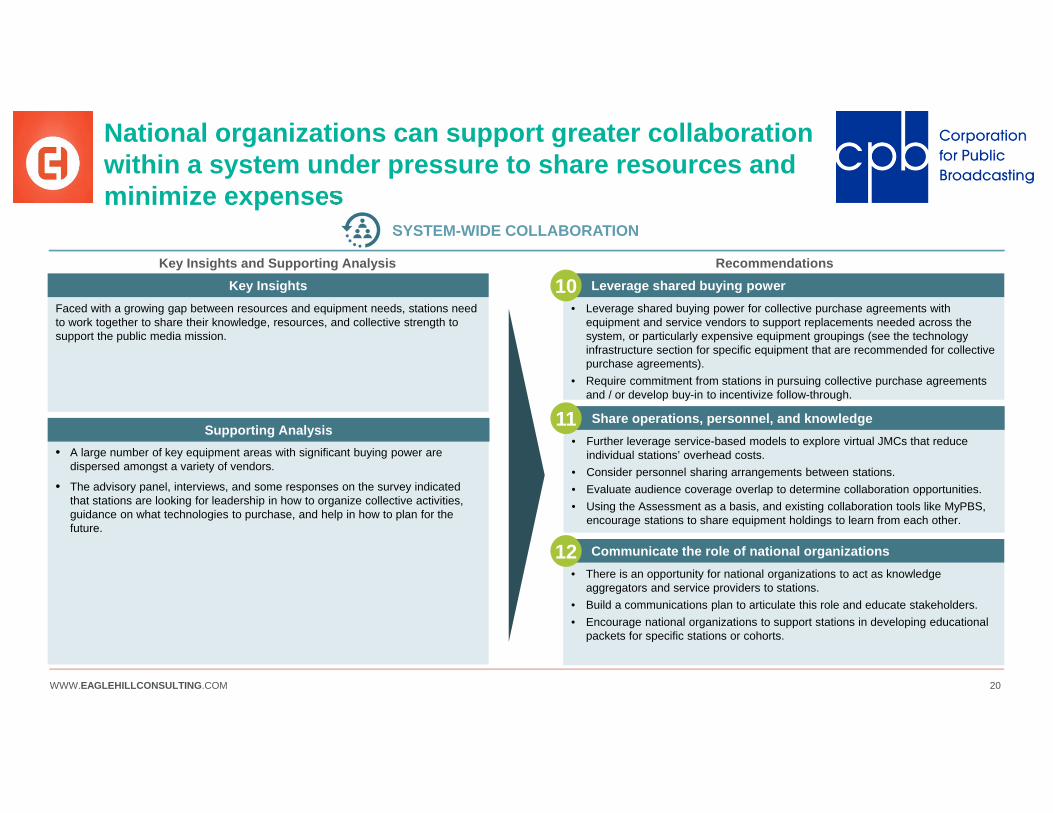
National organizations can support greater collaboration within a system under pressure to share resources and minimize expenses
SYSTEM-WIDE COLLABORATION
Key Insights and Supporting Analysis Recommendations
• A large number of key equipment areas with significant buying power are dispersed amongst a variety of vendors.
• The advisory panel, interviews, and some responses on the survey indicated that stations are looking for leadership in how to organize collective activities, guidance on what technologies to purchase, and help in how to plan for the future.
Supporting Analysis
Faced with a growing gap between resources and equipment needs, stations need to work together to share their knowledge, resources, and collective strength to support the public media mission.
Key Insights• Leverage shared buying power for collective purchase agreements with
equipment and service vendors to support replacements needed across the system, or particularly expensive equipment groupings (see the technology infrastructure section for specific equipment that are recommended for collective purchase agreements).
• Require commitment from stations in pursuing collective purchase agreements and / or develop buy-in to incentivize follow-through.
Leverage shared buying power10
• Further leverage service-based models to explore virtual JMCs that reduce individual stations’ overhead costs.
• Consider personnel sharing arrangements between stations.• Evaluate audience coverage overlap to determine collaboration opportunities.• Using the Assessment as a basis, and existing collaboration tools like MyPBS,
encourage stations to share equipment holdings to learn from each other.
Share operations, personnel, and knowledge11
• There is an opportunity for national organizations to act as knowledge aggregators and service providers to stations.
• Build a communications plan to articulate this role and educate stakeholders.• Encourage national organizations to support stations in developing educational
packets for specific stations or cohorts.
Communicate the role of national organizations12
WWW.EAGLEHILLCONSULTING.COM 21
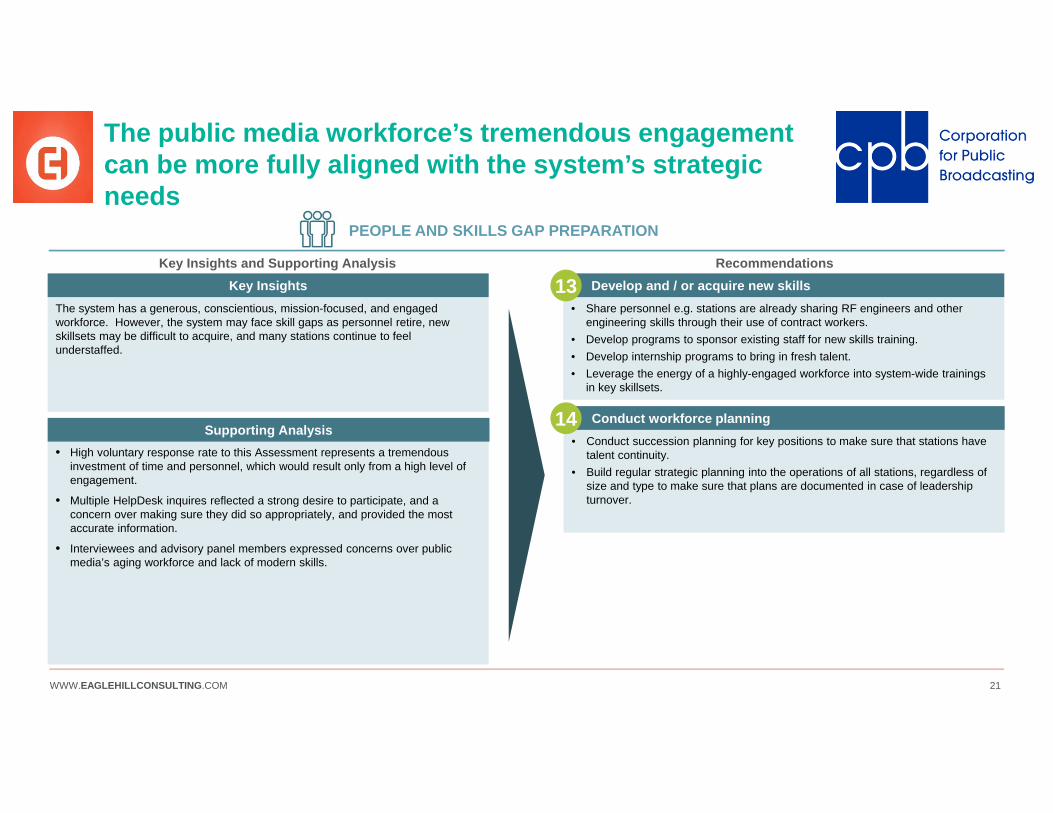
The public media workforce’s tremendous engagement can be more fully aligned with the system’s strategic needs
PEOPLE AND SKILLS GAP PREPARATION
Key Insights and Supporting Analysis Recommendations
• High voluntary response rate to this Assessment represents a tremendous investment of time and personnel, which would result only from a high level of engagement.
• Multiple HelpDesk inquires reflected a strong desire to participate, and a concern over making sure they did so appropriately, and provided the most accurate information.
• Interviewees and advisory panel members expressed concerns over public media’s aging workforce and lack of modern skills.
Supporting Analysis
The system has a generous, conscientious, mission-focused, and engaged workforce. However, the system may face skill gaps as personnel retire, new skillsets may be difficult to acquire, and many stations continue to feel understaffed.
Key Insights• Share personnel e.g. stations are already sharing RF engineers and other
engineering skills through their use of contract workers.• Develop programs to sponsor existing staff for new skills training.• Develop internship programs to bring in fresh talent.• Leverage the energy of a highly-engaged workforce into system-wide trainings
in key skillsets.
Develop and / or acquire new skills13
• Conduct succession planning for key positions to make sure that stations have talent continuity.
• Build regular strategic planning into the operations of all stations, regardless of size and type to make sure that plans are documented in case of leadership turnover.
Conduct workforce planning14

WWW.EAGLEHILLCONSULTING.COM 22
Next steps: towards a system that balances individuality with sustainability
Continue momentum and demonstrate Assessment’s immediate value
• The Assessment collected a rich dataset that may be mined further, but is perishable.
• The Final Report identifies several low-cost actions that have a high return on investment (e.g. investment in cybersecurity education and systems).
• Releasing the Final Report and the dataset offers value to the system and Assessment participants, and build momentum for paths forward. However, analyzing these data will require experienced analysts.
1
Reach consensus at the national organization level on a blueprint for system collaboration around:• Education and guidance for stations on technological and business
operations, sharing existing knowledge and skills, and gaining skills for the future
• Enabling more robust funding asks and support a cost structure changing to operational expenses
• Leveraging shared market power
• No one organization can provide a path forward on all of these issues—national organizations will need to share ownership.
• National organizations need to be prepared to construct initiatives that build in accountability measures.
2
Build broad, system-wide consensus on this blueprint. Devise initiatives to operationalize this blueprint, and agree on ownership for these initiatives
• Participation in these initiatives should be voluntary but enforceable. Negotiating collective purchase agreements, developing operational and strategic guidance, educational programs, and other paths forward must be coupled with commitments and accountability measures to be worth the investment—and avoid the fate of previous such efforts.
• Ownership and accountability cannot stop with the national-level organizations. Stations and affinity organizations play a vital role in the system’s future, and any initiative’s success is contingent on shared agreement and participation.
3
Be the same in ways that make you stronger: allowing you to be different in ways that matter“
“Steps Considerations
WWW.EAGLEHILLCONSULTING.COM 23WWW.EAGLEHILLCONSULTING.COM 23
ASSESSMENT METHODOLOGY
WWW.EAGLEHILLCONSULTING.COM 24
Section Overview
This section describes the finer details of the data collection, data cleaning, and data analysis processes.
ASSESSMENT METHODOLOGY
WWW.EAGLEHILLCONSULTING.COM 25
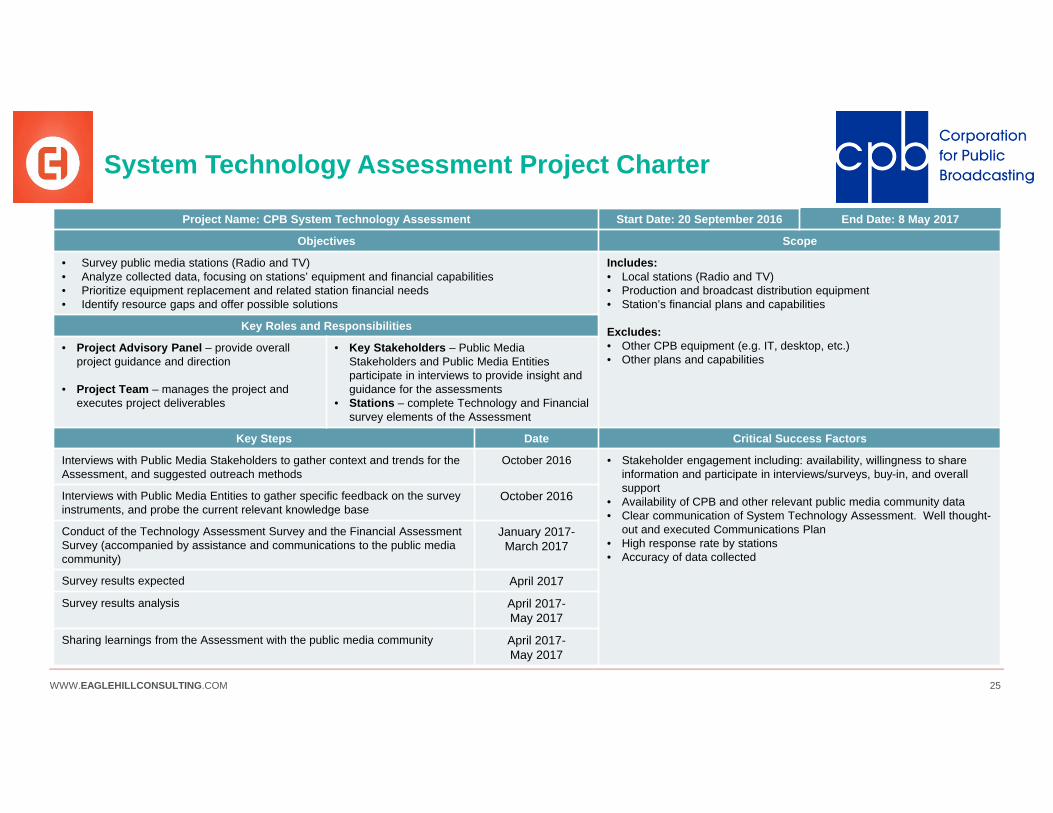
Project Name: CPB System Technology Assessment Start Date: 20 September 2016 End Date: 8 May 2017
Objectives Scope
• Survey public media stations (Radio and TV)• Analyze collected data, focusing on stations’ equipment and financial capabilities• Prioritize equipment replacement and related station financial needs• Identify resource gaps and offer possible solutions
Includes: • Local stations (Radio and TV)• Production and broadcast distribution equipment• Station’s financial plans and capabilities
Excludes:• Other CPB equipment (e.g. IT, desktop, etc.)• Other plans and capabilities
Key Roles and Responsibilities
• Project Advisory Panel – provide overall project guidance and direction
• Project Team – manages the project and executes project deliverables
• Key Stakeholders – Public Media Stakeholders and Public Media Entities participate in interviews to provide insight and guidance for the assessments
• Stations – complete Technology and Financial survey elements of the Assessment
Key Steps Date Critical Success Factors
Interviews with Public Media Stakeholders to gather context and trends for the Assessment, and suggested outreach methods
October 2016 • Stakeholder engagement including: availability, willingness to share information and participate in interviews/surveys, buy-in, and overall support
• Availability of CPB and other relevant public media community data• Clear communication of System Technology Assessment. Well thought-
out and executed Communications Plan• High response rate by stations• Accuracy of data collected
Interviews with Public Media Entities to gather specific feedback on the survey instruments, and probe the current relevant knowledge base
October 2016
Conduct of the Technology Assessment Survey and the Financial Assessment Survey (accompanied by assistance and communications to the public media community)
January 2017-March 2017
Survey results expected April 2017
Survey results analysis April 2017-May 2017
Sharing learnings from the Assessment with the public media community April 2017-May 2017
System Technology Assessment Project Charter
WWW.EAGLEHILLCONSULTING.COM 26
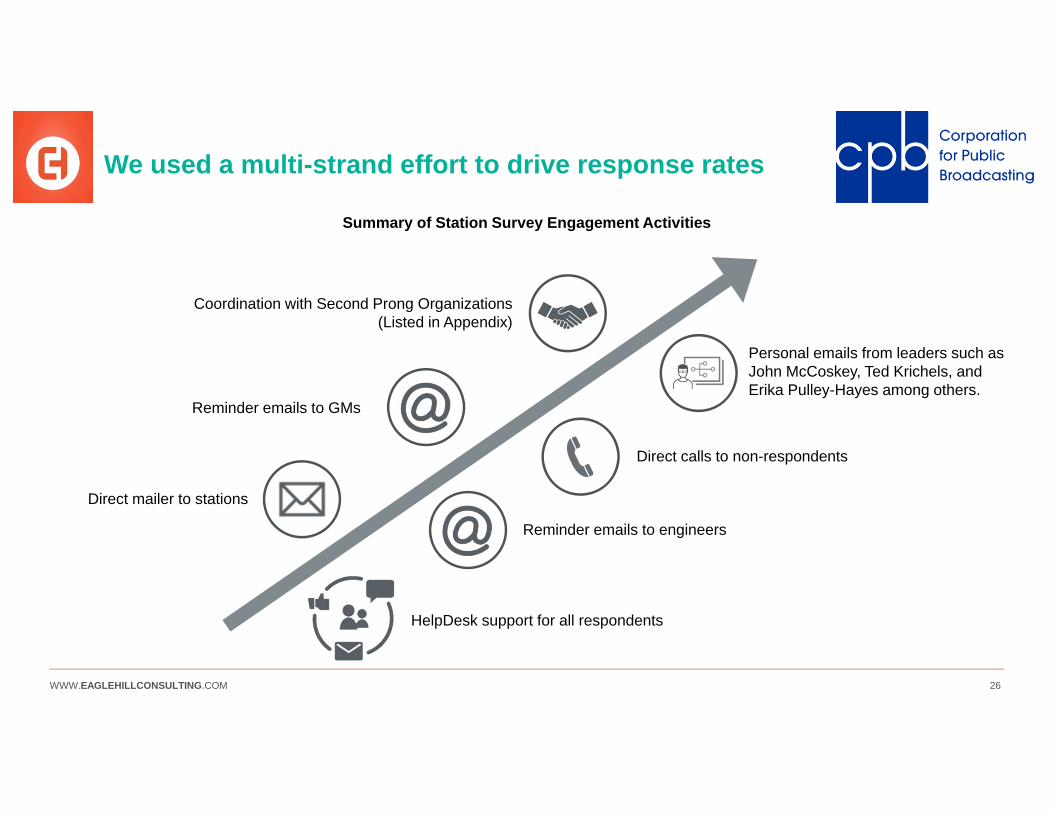
We used a multi-strand effort to drive response rates
HelpDesk support for all respondents
Reminder emails to GMs
Direct mailer to stations
Coordination with Second Prong Organizations (Listed in Appendix)
Personal emails from leaders such as John McCoskey, Ted Krichels, and Erika Pulley-Hayes among others.
Reminder emails to engineers
Direct calls to non-respondents
Summary of Station Survey Engagement Activities
WWW.EAGLEHILLCONSULTING.COM 27
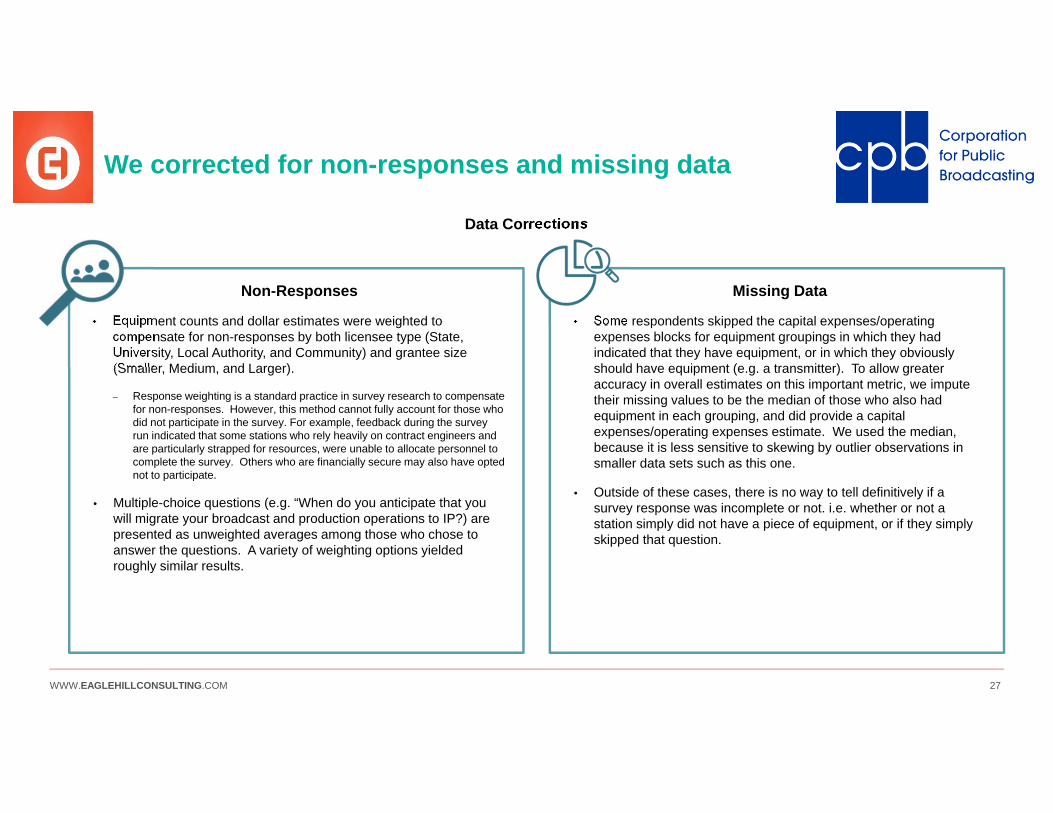
We corrected for non-responses and missing data
Missing Data
• Some respondents skipped the capital expenses/operating expenses blocks for equipment groupings in which they had indicated that they have equipment, or in which they obviously should have equipment (e.g. a transmitter). To allow greater accuracy in overall estimates on this important metric, we impute their missing values to be the median of those who also had equipment in each grouping, and did provide a capital expenses/operating expenses estimate. We used the median, because it is less sensitive to skewing by outlier observations in smaller data sets such as this one.
• Outside of these cases, there is no way to tell definitively if a survey response was incomplete or not. i.e. whether or not a station simply did not have a piece of equipment, or if they simply skipped that question.
Non-Responses
• Equipment counts and dollar estimates were weighted to compensate for non-responses by both licensee type (State, University, Local Authority, and Community) and grantee size (Smaller, Medium, and Larger).
– Response weighting is a standard practice in survey research to compensate for non-responses. However, this method cannot fully account for those who did not participate in the survey. For example, feedback during the survey run indicated that some stations who rely heavily on contract engineers and are particularly strapped for resources, were unable to allocate personnel to complete the survey. Others who are financially secure may also have opted not to participate.
• Multiple-choice questions (e.g. “When do you anticipate that you will migrate your broadcast and production operations to IP?) are presented as unweighted averages among those who chose to answer the questions. A variety of weighting options yielded roughly similar results.
Data Corrections
WWW.EAGLEHILLCONSULTING.COM 28
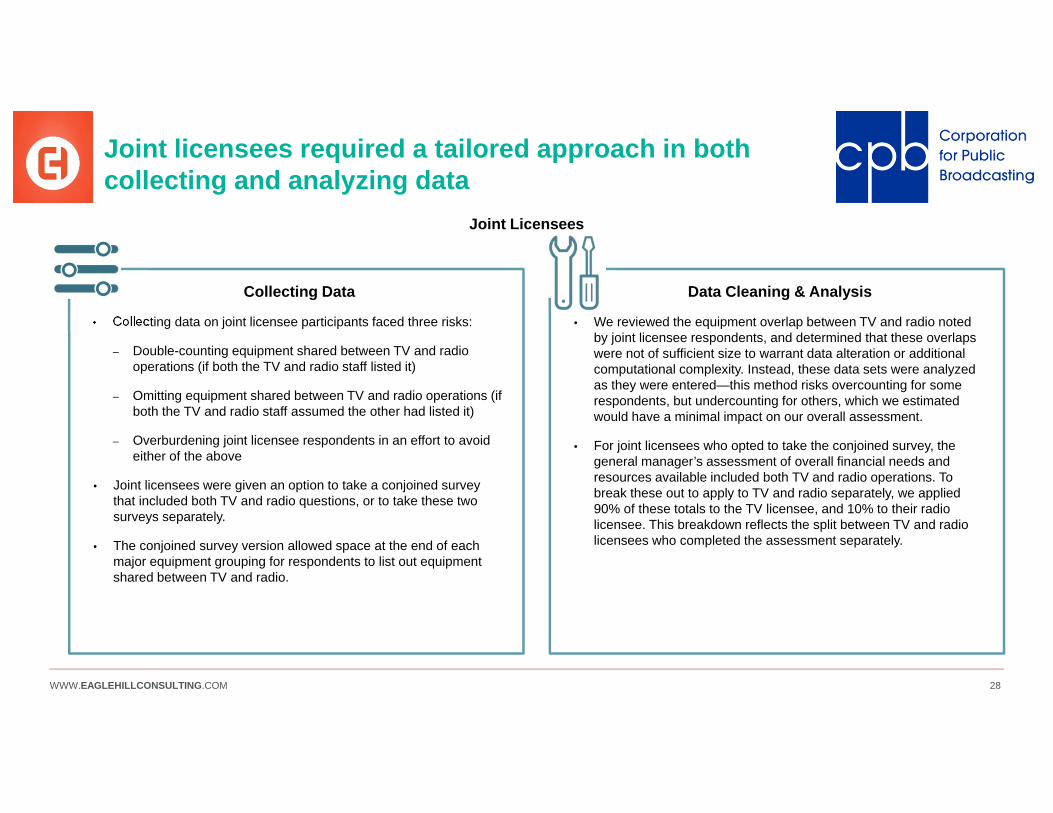
Joint licensees required a tailored approach in both collecting and analyzing data
Data Cleaning & Analysis
• We reviewed the equipment overlap between TV and radio noted by joint licensee respondents, and determined that these overlaps were not of sufficient size to warrant data alteration or additional computational complexity. Instead, these data sets were analyzed as they were entered—this method risks overcounting for some respondents, but undercounting for others, which we estimated would have a minimal impact on our overall assessment.
• For joint licensees who opted to take the conjoined survey, the general manager’s assessment of overall financial needs and resources available included both TV and radio operations. To break these out to apply to TV and radio separately, we applied 90% of these totals to the TV licensee, and 10% to their radio licensee. This breakdown reflects the split between TV and radio licensees who completed the assessment separately.
Collecting Data
• Collecting data on joint licensee participants faced three risks:
– Double-counting equipment shared between TV and radio operations (if both the TV and radio staff listed it)
– Omitting equipment shared between TV and radio operations (if both the TV and radio staff assumed the other had listed it)
– Overburdening joint licensee respondents in an effort to avoid either of the above
• Joint licensees were given an option to take a conjoined survey that included both TV and radio questions, or to take these two surveys separately.
• The conjoined survey version allowed space at the end of each major equipment grouping for respondents to list out equipment shared between TV and radio.
Joint Licensees
WWW.EAGLEHILLCONSULTING.COM 29
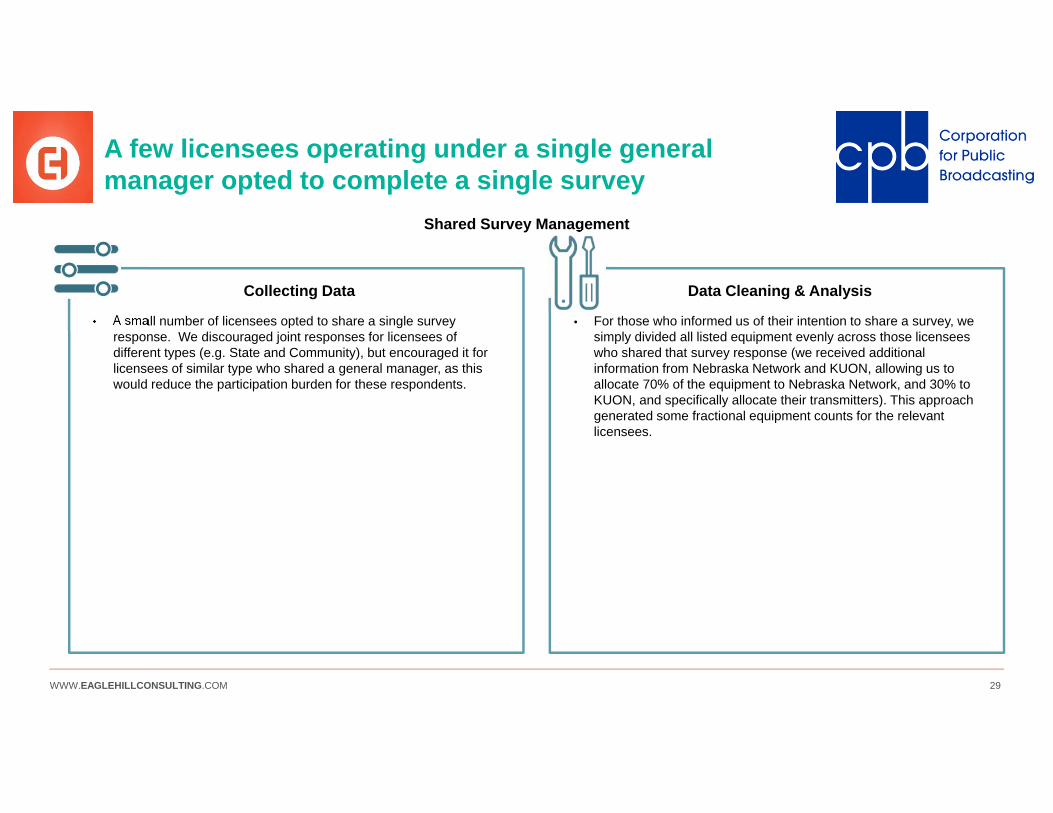
A few licensees operating under a single general manager opted to complete a single survey
Data Cleaning & Analysis
• For those who informed us of their intention to share a survey, we simply divided all listed equipment evenly across those licensees who shared that survey response (we received additional information from Nebraska Network and KUON, allowing us to allocate 70% of the equipment to Nebraska Network, and 30% to KUON, and specifically allocate their transmitters). This approach generated some fractional equipment counts for the relevant licensees.
Collecting Data
• A small number of licensees opted to share a single survey response. We discouraged joint responses for licensees of different types (e.g. State and Community), but encouraged it for licensees of similar type who shared a general manager, as this would reduce the participation burden for these respondents.
Shared Survey Management
WWW.EAGLEHILLCONSULTING.COM 30
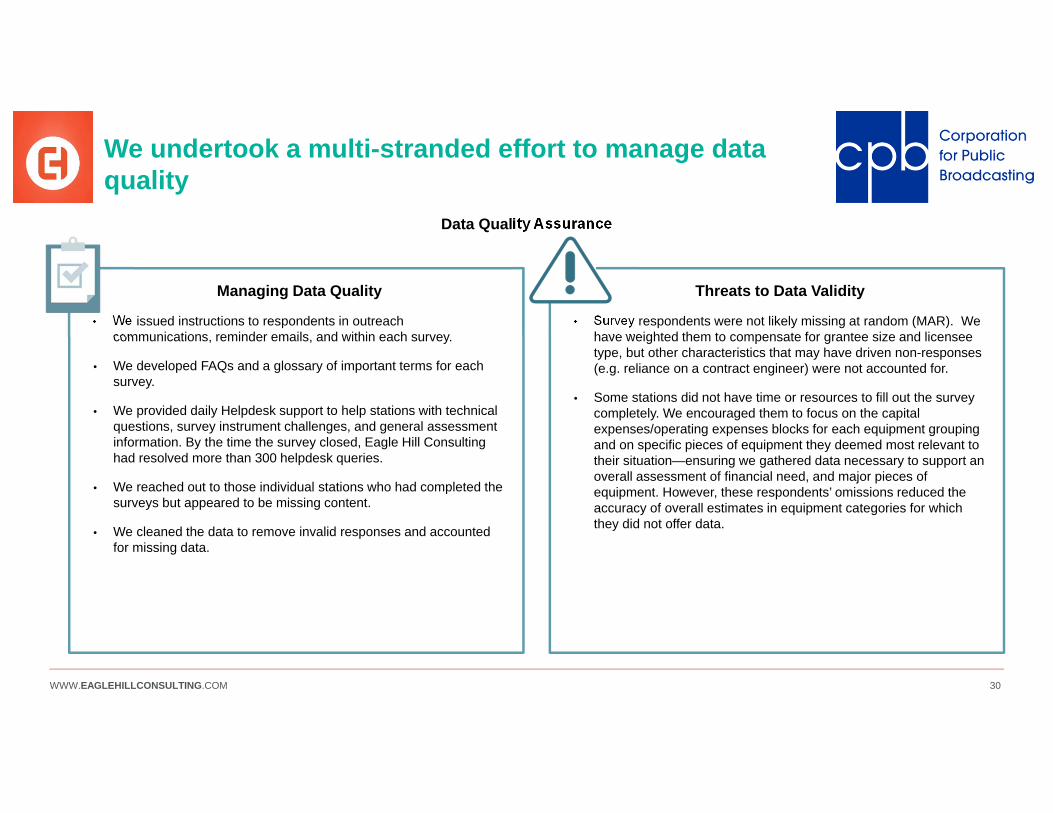
Threats to Data Validity
• Survey respondents were not likely missing at random (MAR). We have weighted them to compensate for grantee size and licensee type, but other characteristics that may have driven non-responses (e.g. reliance on a contract engineer) were not accounted for.
• Some stations did not have time or resources to fill out the survey completely. We encouraged them to focus on the capital expenses/operating expenses blocks for each equipment grouping and on specific pieces of equipment they deemed most relevant to their situation—ensuring we gathered data necessary to support an overall assessment of financial need, and major pieces of equipment. However, these respondents’ omissions reduced the accuracy of overall estimates in equipment categories for which they did not offer data.
We undertook a multi-stranded effort to manage data quality
Managing Data Quality
• We issued instructions to respondents in outreach communications, reminder emails, and within each survey.
• We developed FAQs and a glossary of important terms for each survey.
• We provided daily Helpdesk support to help stations with technical questions, survey instrument challenges, and general assessment information. By the time the survey closed, Eagle Hill Consulting had resolved more than 300 helpdesk queries.
• We reached out to those individual stations who had completed the surveys but appeared to be missing content.
• We cleaned the data to remove invalid responses and accounted for missing data.
Data Quality Assurance
WWW.EAGLEHILLCONSULTING.COM 31
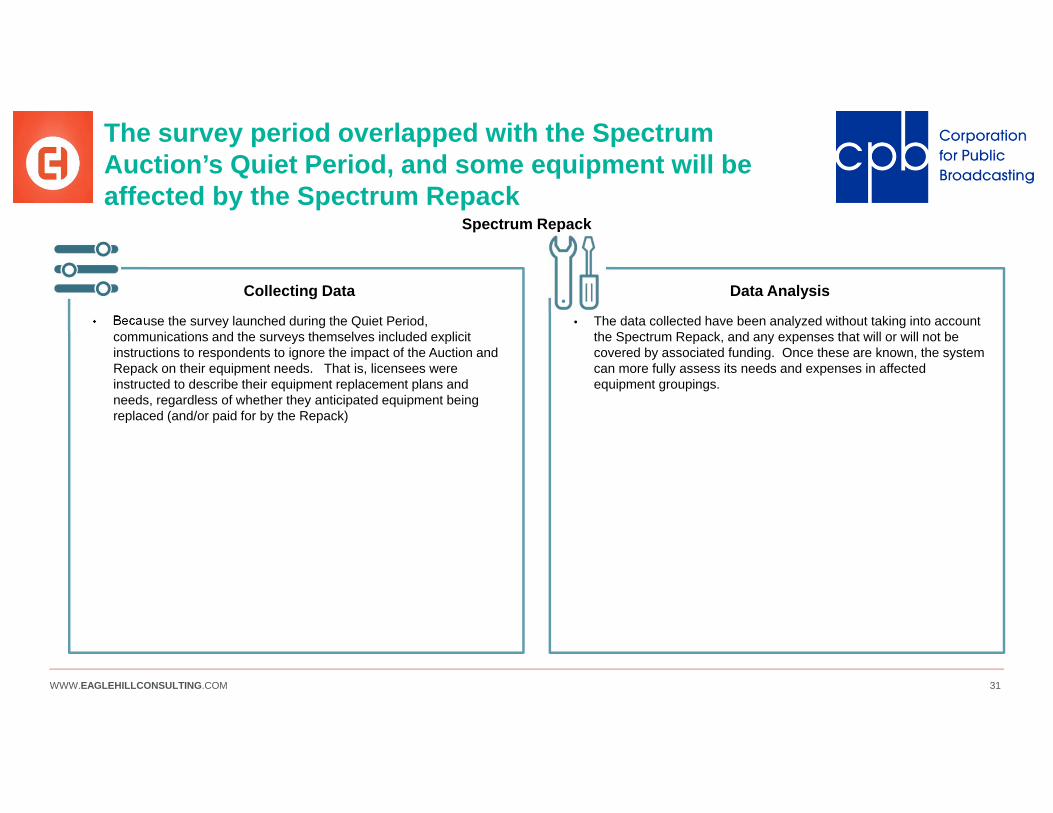
The survey period overlapped with the Spectrum Auction’s Quiet Period, and some equipment will be affected by the Spectrum Repack
Data Analysis
• The data collected have been analyzed without taking into account the Spectrum Repack, and any expenses that will or will not be covered by associated funding. Once these are known, the system can more fully assess its needs and expenses in affected equipment groupings.
Collecting Data
• Because the survey launched during the Quiet Period, communications and the surveys themselves included explicit instructions to respondents to ignore the impact of the Auction and Repack on their equipment needs. That is, licensees were instructed to describe their equipment replacement plans and needs, regardless of whether they anticipated equipment being replaced (and/or paid for by the Repack)
Spectrum Repack

WWW.EAGLEHILLCONSULTING.COM 32WWW.EAGLEHILLCONSULTING.COM 32
OPERATING MODEL
WWW.EAGLEHILLCONSULTING.COM 33
Section Overview
The Operating Model section contains content on stations’ move to service-based models, how stations deliver their mission in a new digital environment, and more broadly, “How do I, as a station, succeed, adapt, and thrive in this environment?”
Sub-sections:
TRENDS: variety of technology trends are reshaping the media industry. The public media community varies in their interest in adopting these trends and the challenges faced in doing so, but all of these shifts have deep implications for how stations plan for and fund technology replacements.
CYBERSECURITY: In the face of trends towards IP migration, Virtualization, and Cloud service-based models, cybersecurity issues are increasingly pressing for stations. With the advent of the next iteration of the public TV Interconnection system, individual stations’ cybersecurity profiles will also impact the community as a whole.
SMALLER STATIONS: Smaller stations face many of the same challenges as their larger colleagues. While smaller in absolute dollars, these challenges may be particularly concerning for smaller stations, given their more limited pool of resources.
TV SPECIFIC TRENDS: Like their commercial colleagues, public television stations have the opportunity to adopt trends like 4K UHDTV and ATSC 3.0 in the coming years.
RADIO SPECIFIC TRENDS: Like their commercial colleagues, public radio stations have the opportunity to adopt trends like online content delivery, renew or adopt IBOC/HD radio capabilities, or move to radio Station-in-a-Box solutions that might ease equipment replacement.
OPERATING MODEL
WWW.EAGLEHILLCONSULTING.COM 34
Sub-Section Overview
The Operating Model section contains content on stations’ move to service-based models, how stations deliver their mission in a new digital environment, and more broadly, “How do I, as a station, succeed, adapt, and thrive in this environment?”
Sub-sections:
TRENDS: variety of technology trends are reshaping the media industry. The public media community varies in their interest in adopting these trends and the challenges faced in doing so, but all of these shifts have deep implications for how stations plan for and fund technology replacements.
CYBERSECURITY: In the face of trends towards IP migration, Virtualization, and Cloud service-based models, cybersecurity issues are increasingly pressing for stations. With the advent of the next iteration of the public TV Interconnection system, individual stations’ cybersecurity profiles will also impact the community as a whole.
SMALLER STATIONS: Smaller stations face many of the same challenges as their larger colleagues. While smaller in absolute dollars, these challenges may be particularly concerning for smaller stations, given their more limited pool of resources.
TV-SPECIFIC TRENDS: Like their commercial colleagues, public television stations have the opportunity to adopt trends like 4K UHDTV and ATSC 3.0 in the coming years.
RADIO-SPECIFIC TRENDS: Like their commercial colleagues, public radio stations have the opportunity to adopt trends like online content delivery, renew or adopt IBOC/HD radio capabilities, or move to radio Station-in-a-Box solutions that might ease equipment replacement.
OPERATING MODEL

WWW.EAGLEHILLCONSULTING.COM 35
The primary driver for stations migrating to IP is financial health, not technology enablement
• Almost half of all radio stations and about a third of TV stations have already migrated to IP.
• Television and radio stations plan to adopt IP at a similar pace over the next 6 years.
• Improving their station’s financial health is the most important driver for choosing to migrate to IP, which is an admirable, but less forward-looking and strategic driver than an interest in accessing newer technologies.
• Among the 30 respondents indicating no intention to migrate, licensees indicated an inability to afford the investment, a disbelief that migration would improve their workflow, and several wrote in that their bandwidth capabilities limited their options.
22%6%
61%
11%26%
5%
60%
7%
Access to newer technologies Flexibility/efficiency inmanaging workflows
Improved financial health Other
Reasons for interest in migrating to IP, of those who have already migrated or intend to migrate, full system(% of respondents)
5%
34%26% 26%
8%9%
45%
20% 16%9%
Do not intend to migrate Already migrated Migrate in 0-2yrs Migrate in 3-5yrs Migrate in 6+yrs
Interest in migrating to IP, full system(% of respondents)
Insights
Internet Protocol (IP) is the principal communications protocol in the industry IP suite for relaying packetized information known as datagrams across network boundaries. Its routing function enables internetworking, and essentially establishes the Internet as well as private Local Area Networks (LANs).
Internet Protocol (IP) Migration
Definition
RadioTV
WWW.EAGLEHILLCONSULTING.COM 36
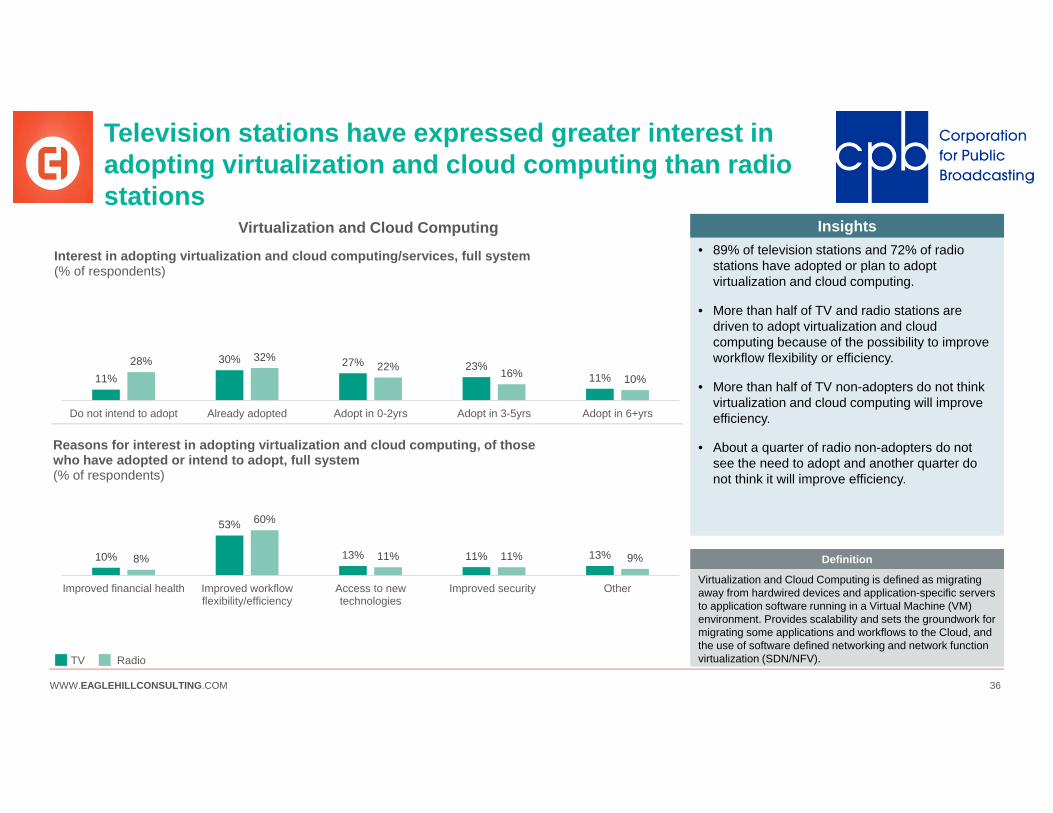
Television stations have expressed greater interest in adopting virtualization and cloud computing than radio stations
11%
30% 27% 23%11%
28% 32%22% 16% 10%
Do not intend to adopt Already adopted Adopt in 0-2yrs Adopt in 3-5yrs Adopt in 6+yrs
Interest in adopting virtualization and cloud computing/services, full system(% of respondents)
10%
53%
13% 11% 13%8%
60%
11% 11% 9%
Improved financial health Improved workflowflexibility/efficiency
Access to newtechnologies
Improved security Other
Reasons for interest in adopting virtualization and cloud computing, of those who have adopted or intend to adopt, full system(% of respondents)
• 89% of television stations and 72% of radio stations have adopted or plan to adopt virtualization and cloud computing.
• More than half of TV and radio stations are driven to adopt virtualization and cloud computing because of the possibility to improve workflow flexibility or efficiency.
• More than half of TV non-adopters do not think virtualization and cloud computing will improve efficiency.
• About a quarter of radio non-adopters do not see the need to adopt and another quarter do not think it will improve efficiency.
Insights
Virtualization and Cloud Computing is defined as migrating away from hardwired devices and application-specific servers to application software running in a Virtual Machine (VM) environment. Provides scalability and sets the groundwork for migrating some applications and workflows to the Cloud, and the use of software defined networking and network function virtualization (SDN/NFV).
Definition
RadioTV
Virtualization and Cloud Computing

WWW.EAGLEHILLCONSULTING.COM 37
While a majority of public media licensees are interested in shifting to IP and Cloud/Virtualization, stations will have to overcome several challenges
Factors Affecting Shift to IP and Virtualization/Cloud
• The public media community is projected to spend about $10 million per year over the next three years on Internet access.
• Many choosing not to migrate to IP and Cloud indicated they do not have enough bandwidth to support these trends.
Internet Access• TV respondents report that some 48% of the
funding they use to support broadcast and 44% of the funding they use to support production can be spent only on capital, not operating expenses.
• Radio respondents report that 36% of funds supporting broadcast and 32% of funds supporting production face this restriction.
Funding Constraints• A minority of TV and radio licensees are
skeptical of migrating to IP and Virtualization/cloud computing.
• University licensees wrote that current campus IT policies prohibit them from taking advantage of IP and virtualization/cloud computing technologies.
• Other non-adopters are concerned about their own IT security if they were to move to IP and/or virtualization/cloud computing.
Education
• Consider developing a funding education packet in collaboration with licensees in order to educate funders and stakeholders on topics such as stations’ technology needs, importance of specific technologies, and the shift towards operating expenses over time.
• There is an opportunity to connect stations that have internet access challenges with organizations that advocate for broadband access in disadvantaged geographic areas, and an opportunity to create collective purchase agreements with key broadband providers.
Considerations

WWW.EAGLEHILLCONSULTING.COM 38
Most licensees anticipate replacing existing equipment with “more of the same”
Replacement equipment
On-premise dedicated equipment
Software running on a dedicated on-premises processor/server
Software running on shared (e.g. VM) processor/server
Off-premises application, e.g. Cloud-based service
Cur
rent
equi
pmen
t
On-premise dedicated equipment
93%(271)
6%(17)
1%(2)
0%(0)
Software running on a dedicated on-premises processor/server
92%(1,468)
5%(84)
3%(41)
Software running on shared (e.g. VM) processor/server
96%(2,007)
4%(78)
Off-premises application, e.g. Cloud-based service
100%(372)
• Most engineers anticipate replacing their equipment with “more of the same”, regardless of how technologically advanced that equipment is.
• These numbers represent unweighted responses. Our assessment is that the trends shown (particularly in the first row) are actually stronger than they appear here—there is reason to believe that licensees who skipped this question are more likely than not to be replacing “On-premise dedicated equipment” with the same.
Insights
There is an educational opportunity to help GMs and engineers understand the technological and financial benefits of changes in equipment formats.
Considerations
Trends in Equipment Replacement Formats Current Versus Anticipated Equipment Format
(% of pieces of equipment being replaced with identical or more advanced technologies)(# of pieces of equipment)
WWW.EAGLEHILLCONSULTING.COM 39
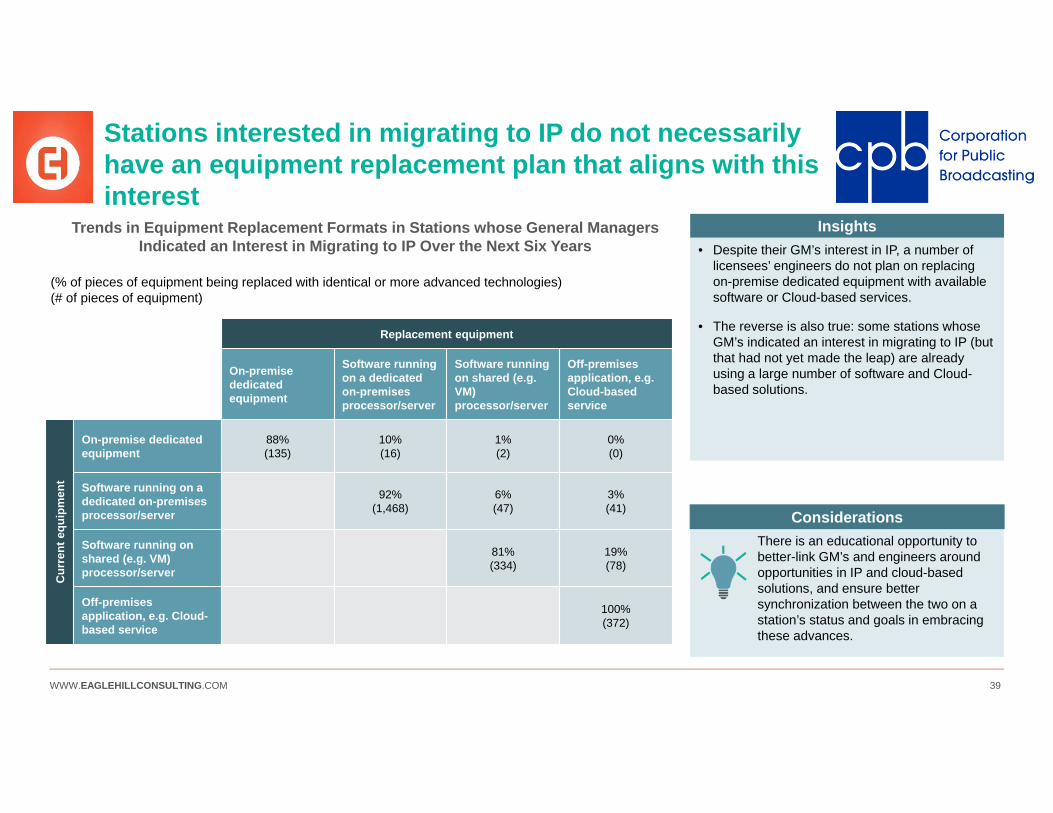
Stations interested in migrating to IP do not necessarily have an equipment replacement plan that aligns with this interest
• Despite their GM’s interest in IP, a number of licensees’ engineers do not plan on replacing on-premise dedicated equipment with available software or Cloud-based services.
• The reverse is also true: some stations whose GM’s indicated an interest in migrating to IP (but that had not yet made the leap) are already using a large number of software and Cloud-based solutions.
Insights
There is an educational opportunity to better-link GM’s and engineers around opportunities in IP and cloud-based solutions, and ensure better synchronization between the two on a station’s status and goals in embracing these advances.
Considerations
Replacement equipment
On-premise dedicated equipment
Software running on a dedicated on-premises processor/server
Software running on shared (e.g. VM) processor/server
Off-premises application, e.g. Cloud-based service
Cur
rent
equi
pmen
t
On-premise dedicated equipment
88%(135)
10%(16)
1%(2)
0%(0)
Software running on a dedicated on-premises processor/server
92%(1,468)
6%(47)
3%(41)
Software running on shared (e.g. VM) processor/server
81%(334)
19%(78)
Off-premises application, e.g. Cloud-based service
100%(372)
Trends in Equipment Replacement Formats in Stations whose General Managers Indicated an Interest in Migrating to IP Over the Next Six Years
(% of pieces of equipment being replaced with identical or more advanced technologies)(# of pieces of equipment)

WWW.EAGLEHILLCONSULTING.COM 40
Initial interviews, advisory panel feedback, and write-in answers on the survey suggest the system may have an educational opportunity around technology trends
Some station leaders may not see the advantages, recognize the risks, or understand the skillsets needed to embrace new technologies.
Insights
Only five radio respondents, two TV respondents, and one joint licensee indicated that they did “not have the people capabilities to migrate” to either IP or Cloud/Virtualized solutions.
In contrast, a variety of interview subjects and advisory panel members indicated serious concerns about the public media system’s human capital skillsets in these areas, as well as digital platforms more broadly.
Results
Undecided, need more information [about Cloud and virtualization options]
- Survey respondent
Some station leaders may be “retired in place,” and hold back their stations from taking advantage of new technologies
- Advisory panel discussion
The "Cloud" does not exist—it is someone else's computer
- Survey respondent
Don’t know enough about [the Cloud]
- Survey respondent
““
““ “ “
““
Educational Opportunities
WWW.EAGLEHILLCONSULTING.COM 41
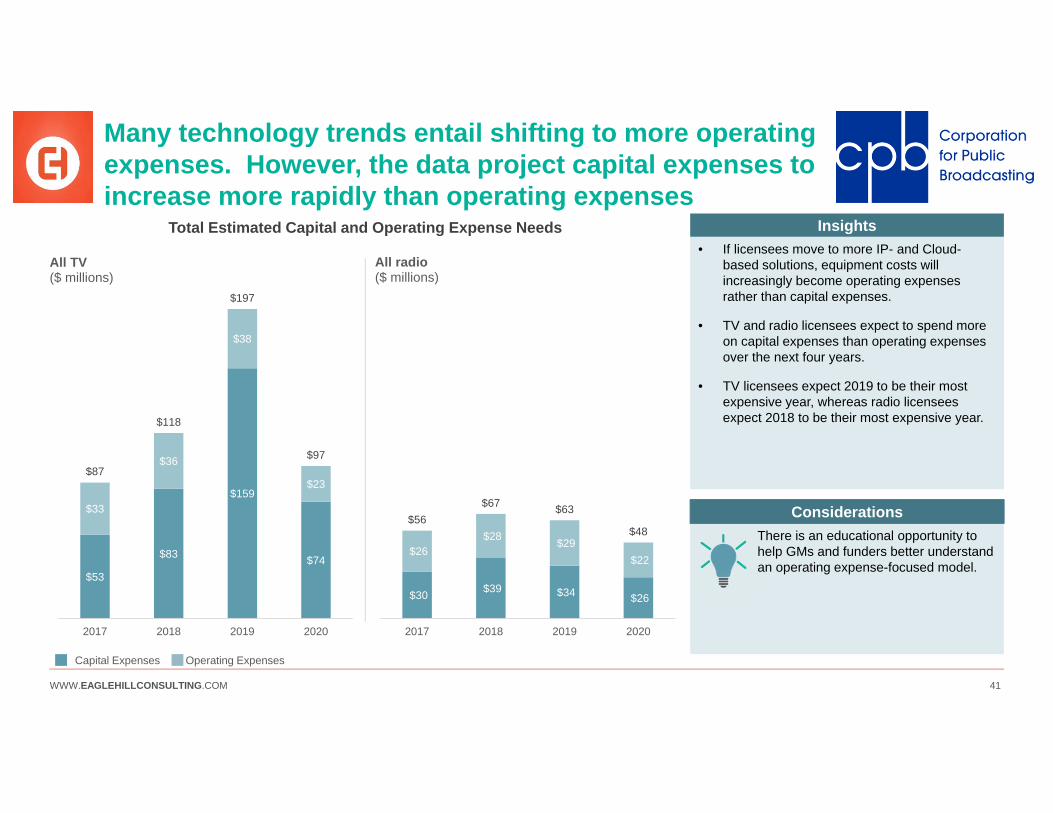
Many technology trends entail shifting to more operating expenses. However, the data project capital expenses to increase more rapidly than operating expenses
• If licensees move to more IP- and Cloud-based solutions, equipment costs will increasingly become operating expenses rather than capital expenses.
• TV and radio licensees expect to spend more on capital expenses than operating expenses over the next four years.
• TV licensees expect 2019 to be their most expensive year, whereas radio licensees expect 2018 to be their most expensive year.
$53
$83
$159
$74
$33
$36
$38
$23$87
$118
$197
$97
2017 2018 2019 2020
All TV($ millions)
Operating ExpensesCapital Expenses
Total Estimated Capital and Operating Expense Needs
$30 $39 $34 $26
$26 $28 $29
$22
$56$67 $63
$48
2017 2018 2019 2020
All radio($ millions)
Insights
There is an educational opportunity to help GMs and funders better understand an operating expense-focused model.
Considerations
WWW.EAGLEHILLCONSULTING.COM 42
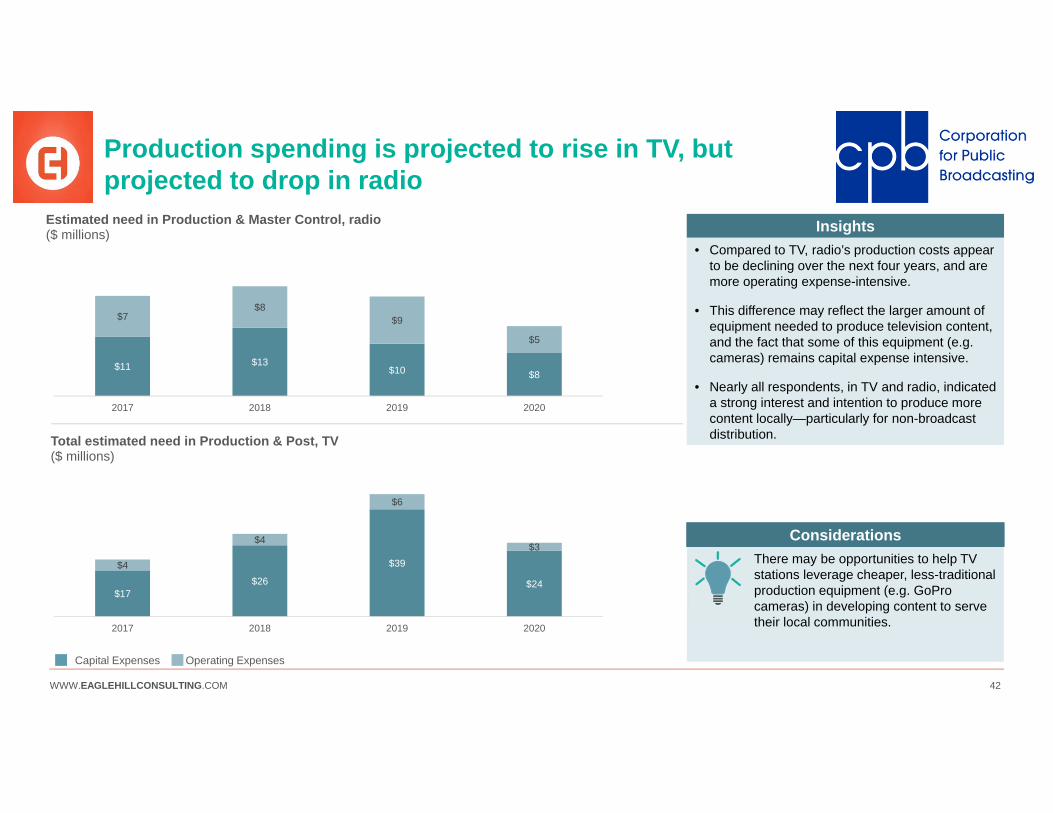
Production spending is projected to rise in TV, but projected to drop in radio
$11 $13$10 $8
$7$8
$9
$5
2017 2018 2019 2020
Estimated need in Production & Master Control, radio($ millions)
$17$26
$39
$24
$4
$4
$6
$3
2017 2018 2019 2020
Total estimated need in Production & Post, TV($ millions)
• Compared to TV, radio’s production costs appear to be declining over the next four years, and are more operating expense-intensive.
• This difference may reflect the larger amount of equipment needed to produce television content, and the fact that some of this equipment (e.g. cameras) remains capital expense intensive.
• Nearly all respondents, in TV and radio, indicated a strong interest and intention to produce more content locally—particularly for non-broadcast distribution.
Insights
There may be opportunities to help TV stations leverage cheaper, less-traditional production equipment (e.g. GoPro cameras) in developing content to serve their local communities.
Considerations
Operating ExpensesCapital Expenses
WWW.EAGLEHILLCONSULTING.COM 43
Sub-Section Overview
The Operating Model section contains content on stations’ move to service-based models, how stations deliver their mission in a new digital environment, and more broadly, “How do I, as a station, succeed, adapt, and thrive in this environment?”
Sub-sections:
TRENDS: variety of technology trends are reshaping the media industry. The public media community varies in their interest in adopting these trends and the challenges faced in doing so, but all of these shifts have deep implications for how stations plan for and fund technology replacements.
CYBERSECURITY: In the face of trends towards IP migration, Virtualization, and Cloud service-based models, cybersecurity issues are increasingly pressing for stations. With the advent of the next iteration of the public TV Interconnection system, individual stations’ cybersecurity profiles will also impact the community as a whole.
SMALLER STATIONS: Smaller stations face many of the same challenges as their larger colleagues. While smaller in absolute dollars, these challenges may be particularly concerning for smaller stations, given their more limited pool of resources.
TV-SPECIFIC TRENDS: Like their commercial colleagues, public television stations have the opportunity to adopt trends like 4K UHDTV and ATSC 3.0 in the coming years.
RADIO-SPECIFIC TRENDS: Like their commercial colleagues, public radio stations have the opportunity to adopt trends like online content delivery, renew or adopt IBOC/HD radio capabilities, or move to radio Station-in-a-Box solutions that might ease equipment replacement.
OPERATING MODEL
WWW.EAGLEHILLCONSULTING.COM 44
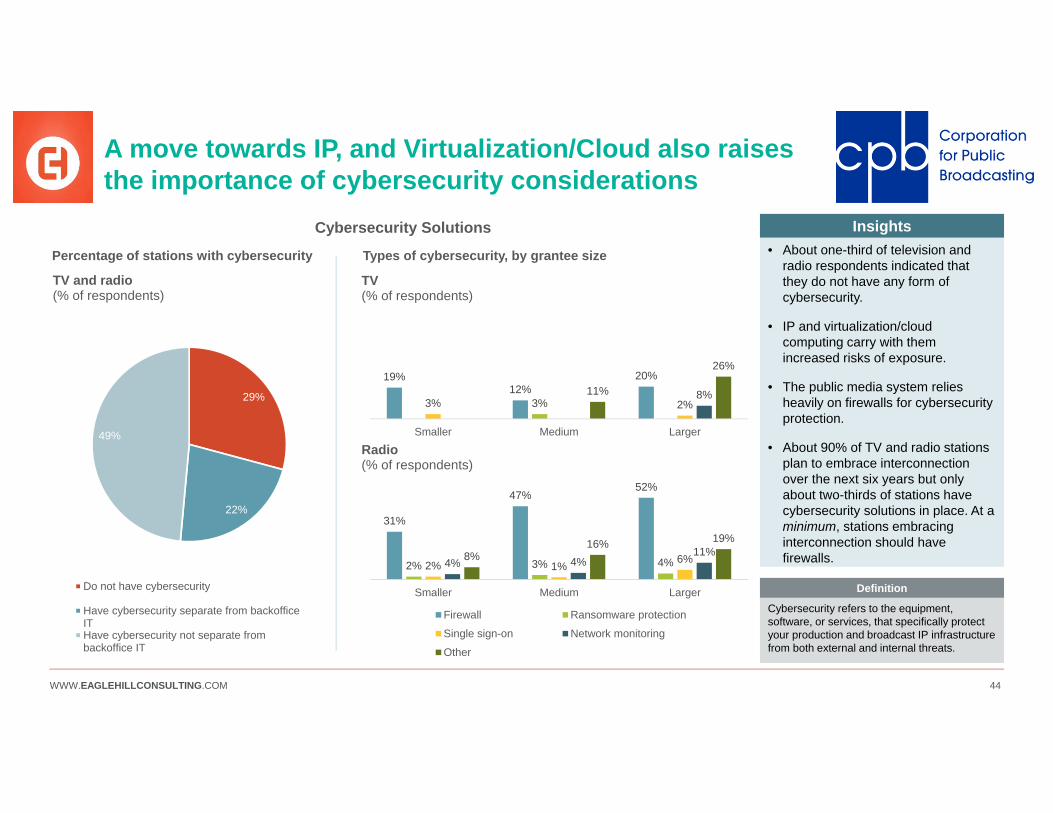
A move towards IP, and Virtualization/Cloud also raises the importance of cybersecurity considerations
• About one-third of television and radio respondents indicated that they do not have any form of cybersecurity.
• IP and virtualization/cloud computing carry with them increased risks of exposure.
• The public media system relies heavily on firewalls for cybersecurity protection.
• About 90% of TV and radio stations plan to embrace interconnection over the next six years but only about two-thirds of stations have cybersecurity solutions in place. At a minimum, stations embracing interconnection should have firewalls.
Insights
Cybersecurity refers to the equipment, software, or services, that specifically protect your production and broadcast IP infrastructure from both external and internal threats.
Definition
19%12%
20%
3%3% 2%8%11%
26%
Smaller Medium Larger
TV(% of respondents)
29%
22%
49%
TV and radio(% of respondents)
Do not have cybersecurity
Have cybersecurity separate from backofficeITHave cybersecurity not separate frombackoffice IT
Cybersecurity Solutions
Types of cybersecurity, by grantee sizePercentage of stations with cybersecurity
31%
47%52%
2% 3% 4%2% 1%6%4% 4%
11%8%16% 19%
Smaller Medium Larger
Radio(% of respondents)
Firewall Ransomware protection
Single sign-on Network monitoring
Other
WWW.EAGLEHILLCONSULTING.COM 45
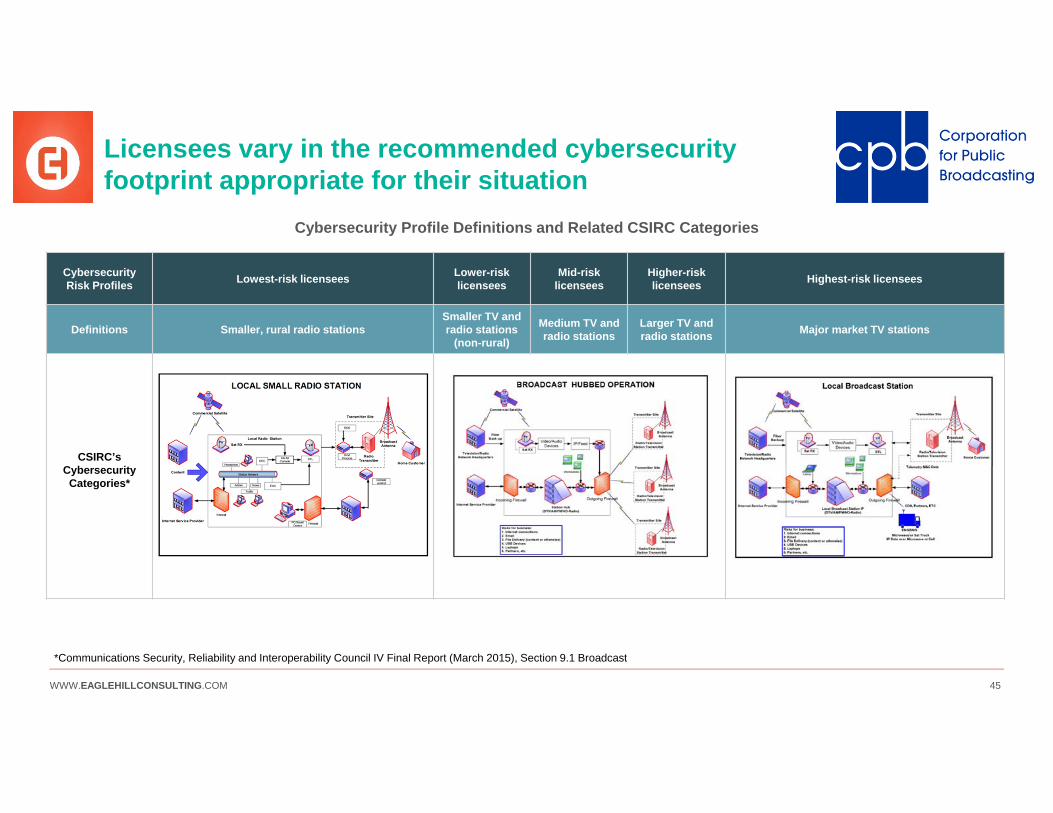
Cybersecurity Risk Profiles Lowest-risk licensees Lower-risk
licensees Mid-risk
licensees Higher-risklicensees Highest-risk licensees
Definitions Smaller, rural radio stationsSmaller TV and radio stations
(non-rural)
Medium TV and radio stations
Larger TV and radio stations Major market TV stations
CSIRC’s CybersecurityCategories*
Licensees vary in the recommended cybersecurity footprint appropriate for their situation
*Communications Security, Reliability and Interoperability Council IV Final Report (March 2015), Section 9.1 Broadcast
Cybersecurity Profile Definitions and Related CSIRC Categories

WWW.EAGLEHILLCONSULTING.COM 46
The system’s cybersecurity profile shows gaps, with larger and major-market stations at the most risk
Lowest-risk licensees (35 respondents)
Lower-risk licensees (112 respondents)
Mid-risk licensees(97 respondents)
Higher-risk licensees(123 respondents)
Highest-risk licensees(12 respondents)
Smaller, rural radio stations
Smaller TV and radio stations (non-rural)
Medium TV and radio stations
Larger TV and radio stations Major market TV stations
Survey Questions and Answers Target Actual Target Actual Target Actual Target Actual Target Actual
Hav
e C
yber
secu
rity?
Yes, and it is separate from IT/Back office 5% 20% 10% 22% <25% 43% 50% 25% 80% 33%
Yes, and it is integrated with IT/Back office 10% 37% 10% 43% 50% 29% <50% 53% <10% 50%
No cybersecurity <85% 43% <80% 36% 25% 28% 0-1% 22% 10% 17%
Cyb
erse
curit
y Ty
pe?
Firewall 100% 43% 100% 29% 100% 38% 100% 49% 100% 33%
Other Intrusion/Penetration Detection 10% 0% 10% 0% 50% 0% 75% 0% 75% 0%
Network Monitoring 10% 3% 10% 3% 50% 3% 75% 9% 75% 33%
Single Sign-On Access Control 10% 0% <5% 4% 25% 1% 50% 5% 50% 8%
Ransomware detection/prevention <5% 3% 10% 1% 25% 3% 50% 1% 50% 0%
Other, write-in 17% 3% 15% 15% 83%
Degree to Which Survey Respondents Align with Target Cybersecurity Profiles
Approximately at or better than target Worse than target
WWW.EAGLEHILLCONSULTING.COM 47
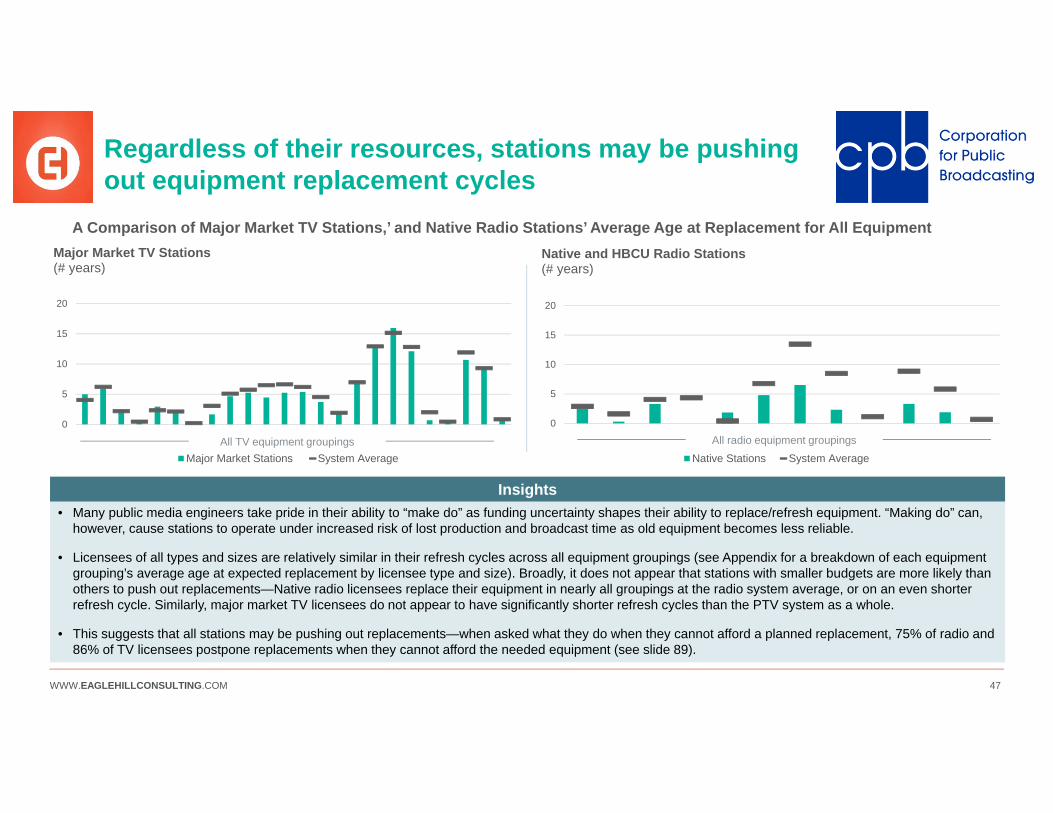
Regardless of their resources, stations may be pushing out equipment replacement cycles
0
5
10
15
20
Native and HBCU Radio Stations(# years)
Native Stations System Average
0
5
10
15
20
Major Market TV Stations(# years)
Major Market Stations System Average
• Many public media engineers take pride in their ability to “make do” as funding uncertainty shapes their ability to replace/refresh equipment. “Making do” can, however, cause stations to operate under increased risk of lost production and broadcast time as old equipment becomes less reliable.
• Licensees of all types and sizes are relatively similar in their refresh cycles across all equipment groupings (see Appendix for a breakdown of each equipment grouping’s average age at expected replacement by licensee type and size). Broadly, it does not appear that stations with smaller budgets are more likely than others to push out replacements—Native radio licensees replace their equipment in nearly all groupings at the radio system average, or on an even shorter refresh cycle. Similarly, major market TV licensees do not appear to have significantly shorter refresh cycles than the PTV system as a whole.
• This suggests that all stations may be pushing out replacements—when asked what they do when they cannot afford a planned replacement, 75% of radio and 86% of TV licensees postpone replacements when they cannot afford the needed equipment (see slide 89).
Insights
All TV equipment groupings All radio equipment groupings
A Comparison of Major Market TV Stations,’ and Native Radio Stations’ Average Age at Replacement for All Equipment
WWW.EAGLEHILLCONSULTING.COM 48
Sub-Section Overview
The Operating Model section contains content on stations’ move to service-based models, how stations deliver their mission in a new digital environment, and more broadly, “How do I, as a station, succeed, adapt, and thrive in this environment?”
Sub-sections:
TRENDS: variety of technology trends are reshaping the media industry. The public media community varies in their interest in adopting these trends and the challenges faced in doing so, but all of these shifts have deep implications for how stations plan for and fund technology replacements.
CYBERSECURITY: In the face of trends towards IP migration, Virtualization, and Cloud service-based models, cybersecurity issues are increasingly pressing for stations. With the advent of the next iteration of the public TV Interconnection system, individual stations’ cybersecurity profiles will also impact the community as a whole.
SMALLER STATIONS: Smaller stations face many of the same challenges as their larger colleagues. While smaller in absolute dollars, these challenges may be particularly concerning for smaller stations, given their more limited pool of resources.
TV-SPECIFIC TRENDS: Like their commercial colleagues, public television stations have the opportunity to adopt trends like 4K UHDTV and ATSC 3.0 in the coming years.
RADIO-SPECIFIC TRENDS: Like their commercial colleagues, public radio stations have the opportunity to adopt trends like online content delivery, renew or adopt IBOC/HD radio capabilities, or move to radio Station-in-a-Box solutions that might ease equipment replacement.
OPERATING MODEL
WWW.EAGLEHILLCONSULTING.COM 49
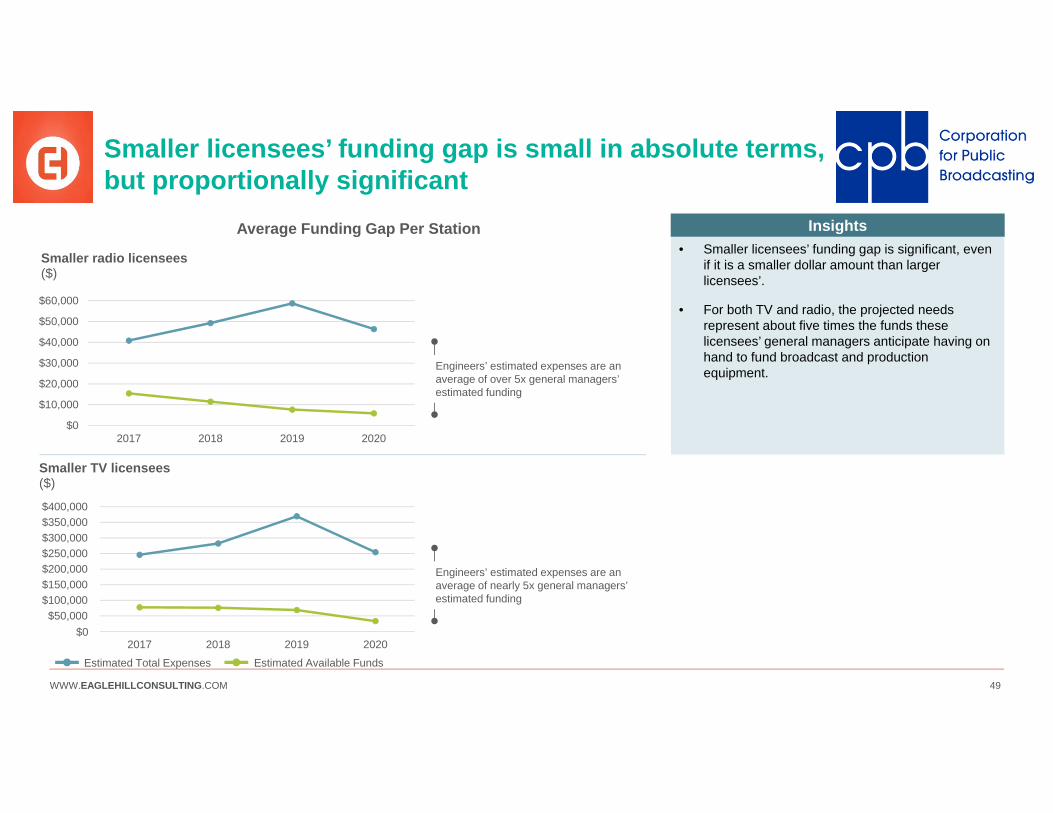
Smaller licensees’ funding gap is small in absolute terms, but proportionally significant
Estimated Total Expenses Estimated Available Funds
$0
$10,000
$20,000
$30,000
$40,000
$50,000
$60,000
2017 2018 2019 2020
Smaller radio licensees($)
$- $50,000
$100,000 $150,000 $200,000 $250,000 $300,000 $350,000 $400,000
2017 2018 2019 2020
Smaller TV licensees($)
Average Funding Gap Per Station
Engineers’ estimated expenses are an average of over 5x general managers’ estimated funding
Engineers’ estimated expenses are an average of nearly 5x general managers’ estimated funding
• Smaller licensees’ funding gap is significant, even if it is a smaller dollar amount than larger licensees’.
• For both TV and radio, the projected needs represent about five times the funds these licensees’ general managers anticipate having on hand to fund broadcast and production equipment.
Insights
$0

WWW.EAGLEHILLCONSULTING.COM 50
Similarly, the gap between general managers’ predicted needs and engineers’ is proportionally large for smaller licensees
Insights
$41$49
$59
$46
$20$25
$18$9
2017 2018 2019 2020
Smaller radio Licensees($ thousands)
Engineer’s Estimated Total Expenses General Manager’s Estimated Total Expenses
$246 $282
$369
$254 $244
$166 $168
$109
2017 2018 2019 2020
Smaller TV licensees($ thousands)
Engineers’ estimated expenses average 3x general managers’ estimated expenses
Engineers’ estimated expenses average nearly 2x general managers’ estimated expenses
Gap between Engineers’ and General Managers’ Average Expense Estimates Per Station• Like other licensees, smaller
licensees also have a gap between engineers’ and general managers’ expense estimates.
• This difference may be numerically small, but represents a two-fold difference for radio, and three-fold difference for TV.
WWW.EAGLEHILLCONSULTING.COM 51
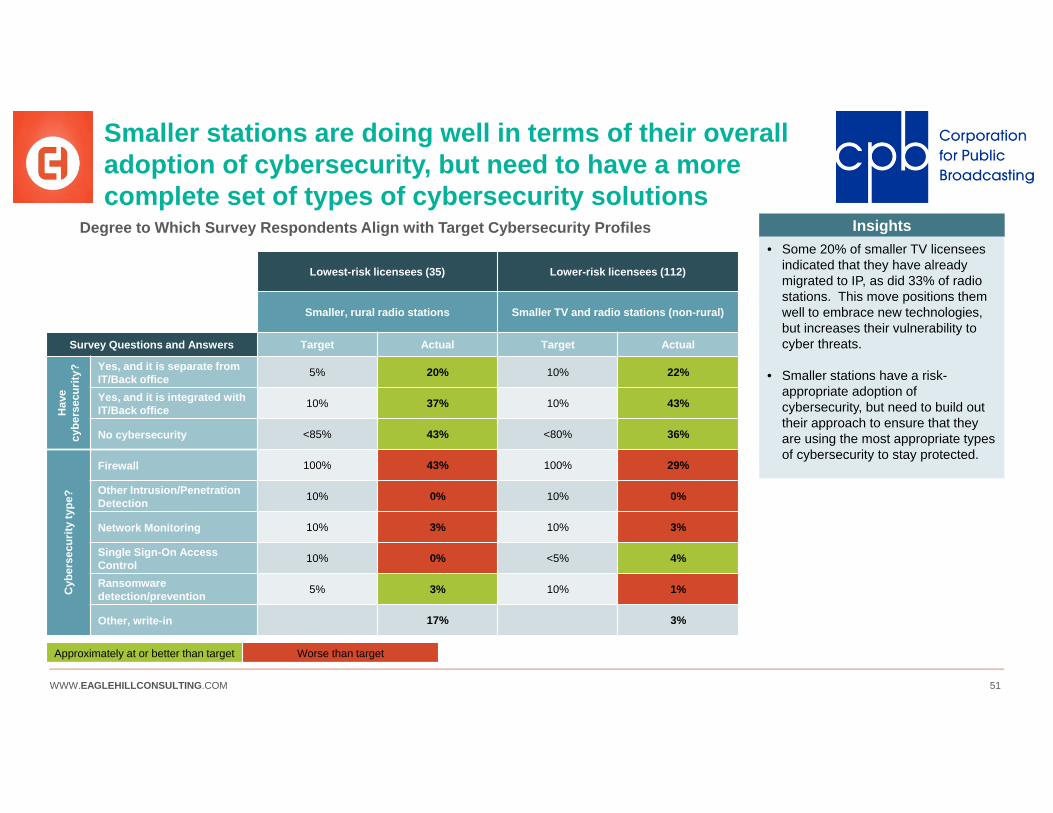
Smaller stations are doing well in terms of their overall adoption of cybersecurity, but need to have a more complete set of types of cybersecurity solutions
Degree to Which Survey Respondents Align with Target Cybersecurity Profiles Insights• Some 20% of smaller TV licensees
indicated that they have already migrated to IP, as did 33% of radio stations. This move positions them well to embrace new technologies, but increases their vulnerability to cyber threats.
• Smaller stations have a risk-appropriate adoption of cybersecurity, but need to build out their approach to ensure that they are using the most appropriate types of cybersecurity to stay protected.
Lowest-risk licensees (35) Lower-risk licensees (112)
Smaller, rural radio stations Smaller TV and radio stations (non-rural)
Survey Questions and Answers Target Actual Target Actual
Hav
ecy
bers
ecur
ity? Yes, and it is separate from
IT/Back office 5% 20% 10% 22%
Yes, and it is integrated with IT/Back office 10% 37% 10% 43%
No cybersecurity <85% 43% <80% 36%
Cyb
erse
curit
yty
pe?
Firewall 100% 43% 100% 29%
Other Intrusion/Penetration Detection 10% 0% 10% 0%
Network Monitoring 10% 3% 10% 3%
Single Sign-On Access Control 10% 0% <5% 4%
Ransomware detection/prevention 5% 3% 10% 1%
Other, write-in 17% 3%
Approximately at or better than target Worse than target
WWW.EAGLEHILLCONSULTING.COM 52
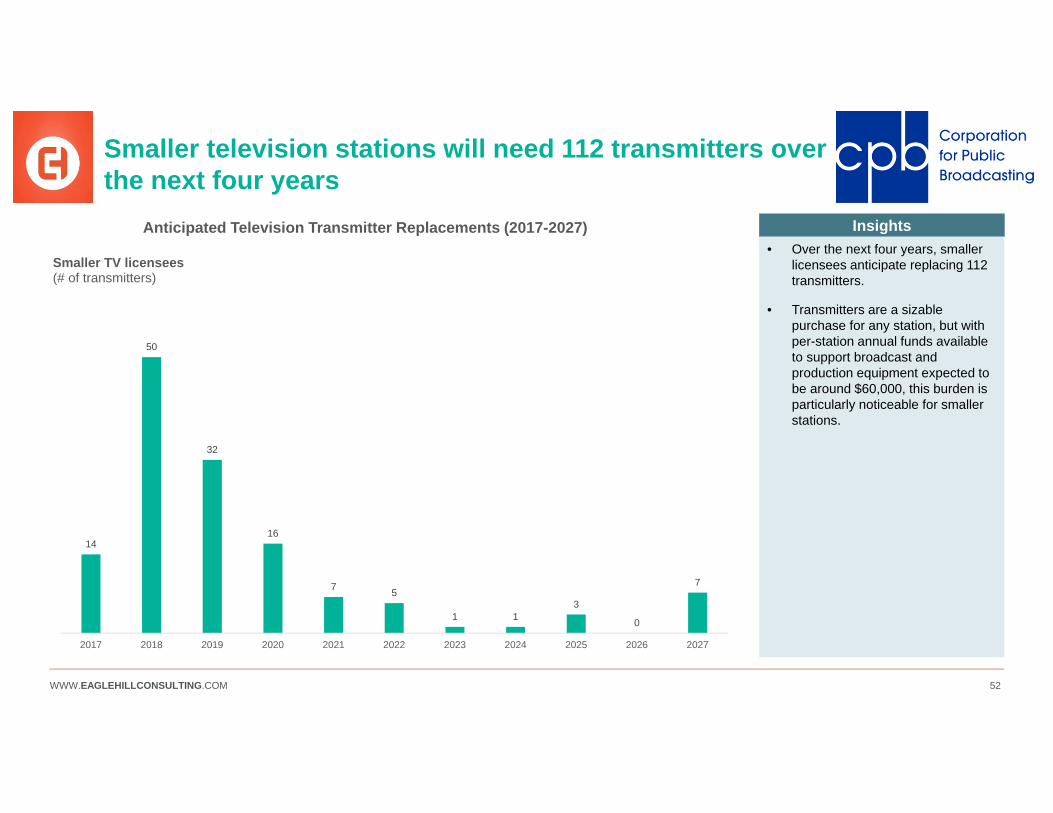
Smaller television stations will need 112 transmitters over the next four years
Anticipated Television Transmitter Replacements (2017-2027)
14
50
32
16
7 5
1 13
0
7
2017 2018 2019 2020 2021 2022 2023 2024 2025 2026 2027
Smaller TV licensees(# of transmitters)
Insights• Over the next four years, smaller
licensees anticipate replacing 112 transmitters.
• Transmitters are a sizable purchase for any station, but with per-station annual funds available to support broadcast and production equipment expected to be around $60,000, this burden is particularly noticeable for smaller stations.
WWW.EAGLEHILLCONSULTING.COM 53
Sub-Section Overview
The Operating Model section contains content on stations’ move to service-based models, how stations deliver their mission in a new digital environment, and more broadly, “How do I, as a station, succeed, adapt, and thrive in this environment?”
Sub-sections:
TRENDS: variety of technology trends are reshaping the media industry. The public media community varies in their interest in adopting these trends and the challenges faced in doing so, but all of these shifts have deep implications for how stations plan for and fund technology replacements.
CYBERSECURITY: In the face of trends towards IP migration, Virtualization, and Cloud service-based models, cybersecurity issues are increasingly pressing for stations. With the advent of the next iteration of the public TV Interconnection system, individual stations’ cybersecurity profiles will also impact the community as a whole.
SMALLER STATIONS: Smaller stations face many of the same challenges as their larger colleagues. While smaller in absolute dollars, these challenges may be particularly concerning for smaller stations, given their more limited pool of resources.
TV-SPECIFIC TRENDS: Like their commercial colleagues, public television stations have the opportunity to adopt trends like 4K UHDTV and ATSC 3.0 in the coming years.
RADIO-SPECIFIC TRENDS: Like their commercial colleagues, public radio stations have the opportunity to adopt trends like online content delivery, renew or adopt IBOC/HD radio capabilities, or move to radio Station-in-a-Box solutions that might ease equipment replacement.
OPERATING MODEL
WWW.EAGLEHILLCONSULTING.COM 54
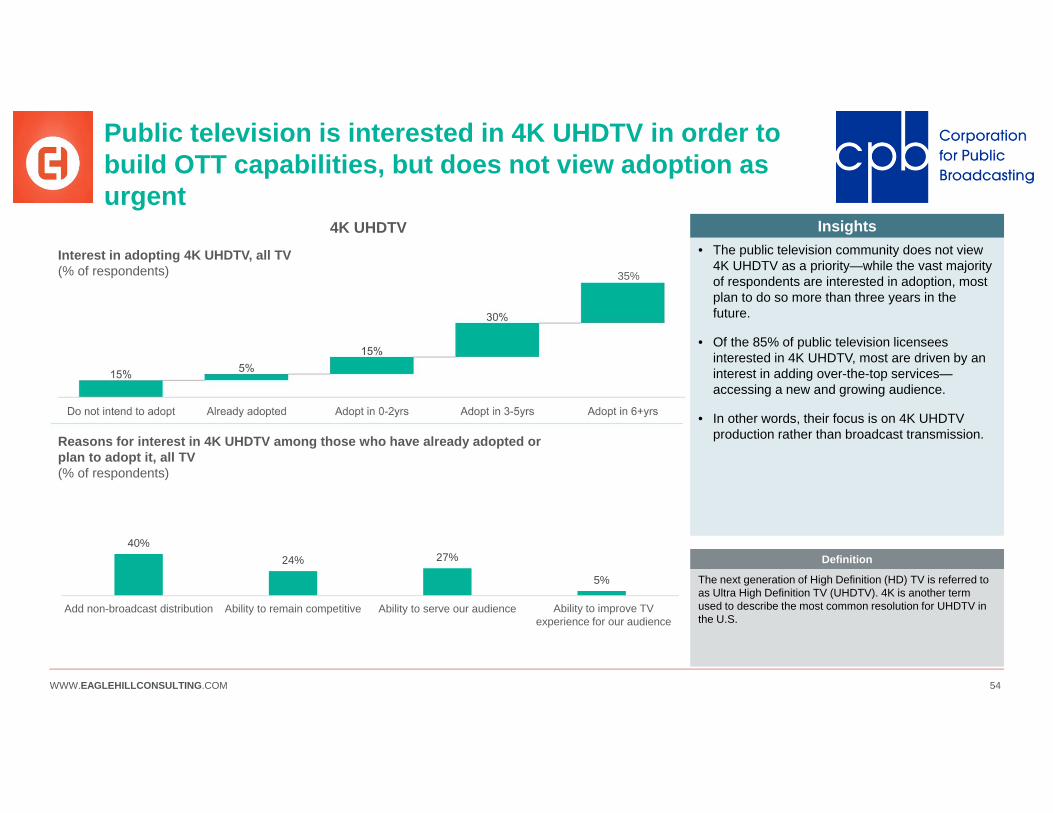
Public television is interested in 4K UHDTV in order to build OTT capabilities, but does not view adoption as urgent
Interest in adopting 4K UHDTV, all TV(% of respondents)
Reasons for interest in 4K UHDTV among those who have already adopted or plan to adopt it, all TV(% of respondents)
• The public television community does not view 4K UHDTV as a priority—while the vast majority of respondents are interested in adoption, most plan to do so more than three years in the future.
• Of the 85% of public television licensees interested in 4K UHDTV, most are driven by an interest in adding over-the-top services—accessing a new and growing audience.
• In other words, their focus is on 4K UHDTV production rather than broadcast transmission.
Insights
The next generation of High Definition (HD) TV is referred to as Ultra High Definition TV (UHDTV). 4K is another term used to describe the most common resolution for UHDTV in the U.S.
Definition
4K UHDTV
35%
40%24% 27%
5%
Add non-broadcast distribution Ability to remain competitive Ability to serve our audience Abilility to improve TVexperience for our audience
Ability to improve TV experience for our audience
WWW.EAGLEHILLCONSULTING.COM 55
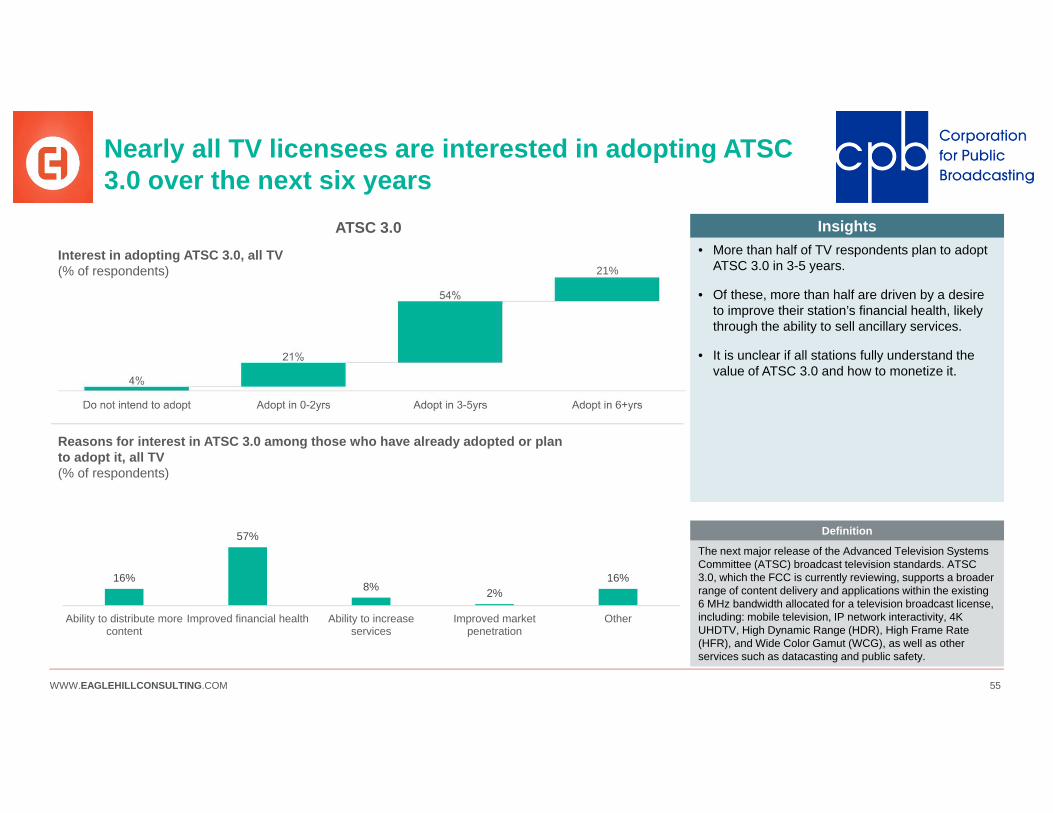
Nearly all TV licensees are interested in adopting ATSC 3.0 over the next six years
Reasons for interest in ATSC 3.0 among those who have already adopted or plan to adopt it, all TV(% of respondents)
16%
57%
8% 2%16%
Ability to distribute morecontent
Improved financial health Ability to increaseservices
Improved marketpenetration
Other
• More than half of TV respondents plan to adopt ATSC 3.0 in 3-5 years.
• Of these, more than half are driven by a desire to improve their station’s financial health, likely through the ability to sell ancillary services.
• It is unclear if all stations fully understand the value of ATSC 3.0 and how to monetize it.
Insights
The next major release of the Advanced Television Systems Committee (ATSC) broadcast television standards. ATSC 3.0, which the FCC is currently reviewing, supports a broader range of content delivery and applications within the existing 6 MHz bandwidth allocated for a television broadcast license, including: mobile television, IP network interactivity, 4K UHDTV, High Dynamic Range (HDR), High Frame Rate (HFR), and Wide Color Gamut (WCG), as well as other services such as datacasting and public safety.
Definition
ATSC 3.0Interest in adopting ATSC 3.0, all TV(% of respondents) 21%

WWW.EAGLEHILLCONSULTING.COM 56
Sub-Section Overview
The Operating Model section contains content on stations’ move to service-based models, how stations deliver their mission in a new digital environment, and more broadly, “How do I, as a station, succeed, adapt, and thrive in this environment?”
Sub-sections:
TRENDS: variety of technology trends are reshaping the media industry. The public media community varies in their interest in adopting these trends and the challenges faced in doing so, but all of these shifts have deep implications for how stations plan for and fund technology replacements.
CYBERSECURITY: In the face of trends towards IP migration, Virtualization, and Cloud service-based models, cybersecurity issues are increasingly pressing for stations. With the advent of the next iteration of the public TV Interconnection system, individual stations’ cybersecurity profiles will also impact the community as a whole.
SMALLER STATIONS: Smaller stations face many of the same challenges as their larger colleagues. While smaller in absolute dollars, these challenges may be particularly concerning for smaller stations, given their more limited pool of resources.
TV-SPECIFIC TRENDS: Like their commercial colleagues, public television stations have the opportunity to adopt trends like 4K UHDTV and ATSC 3.0 in the coming years.
RADIO-SPECIFIC TRENDS: Like their commercial colleagues, public radio stations have the opportunity to adopt trends like online content delivery, renew or adopt IBOC/HD radio capabilities, or move to radio Station-in-a-Box solutions that might ease equipment replacement.
OPERATING MODEL
WWW.EAGLEHILLCONSULTING.COM 57
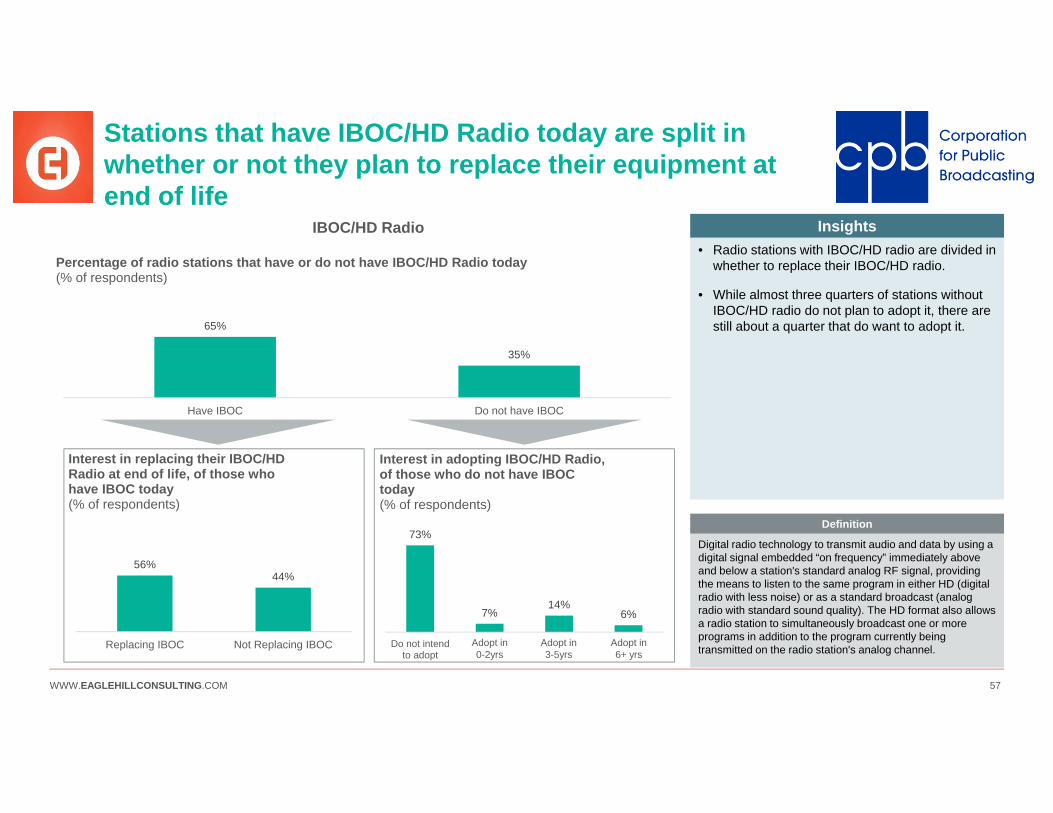
Stations that have IBOC/HD Radio today are split in whether or not they plan to replace their equipment at end of life
65%
35%
Have IBOC Do not have IBOC
Percentage of radio stations that have or do not have IBOC/HD Radio today(% of respondents)
56%44%
Replacing IBOC Not Replacing IBOC
Interest in replacing their IBOC/HD Radio at end of life, of those who have IBOC today (% of respondents)
73%
7%14%
6%
Do not intendto adopt
Adopt in 0-2yrs Adopt in 3-5yrs Adopt in 6+yrs
Interest in adopting IBOC/HD Radio, of those who do not have IBOC today(% of respondents)
• Radio stations with IBOC/HD radio are divided in whether to replace their IBOC/HD radio.
• While almost three quarters of stations without IBOC/HD radio do not plan to adopt it, there are still about a quarter that do want to adopt it.
Insights
Digital radio technology to transmit audio and data by using a digital signal embedded “on frequency” immediately above and below a station's standard analog RF signal, providing the means to listen to the same program in either HD (digital radio with less noise) or as a standard broadcast (analog radio with standard sound quality). The HD format also allows a radio station to simultaneously broadcast one or more programs in addition to the program currently being transmitted on the radio station's analog channel.
Definition
IBOC/HD Radio
Adopt in 0-2yrs
Adopt in 3-5yrs
Adopt in 6+ yrs
WWW.EAGLEHILLCONSULTING.COM 58
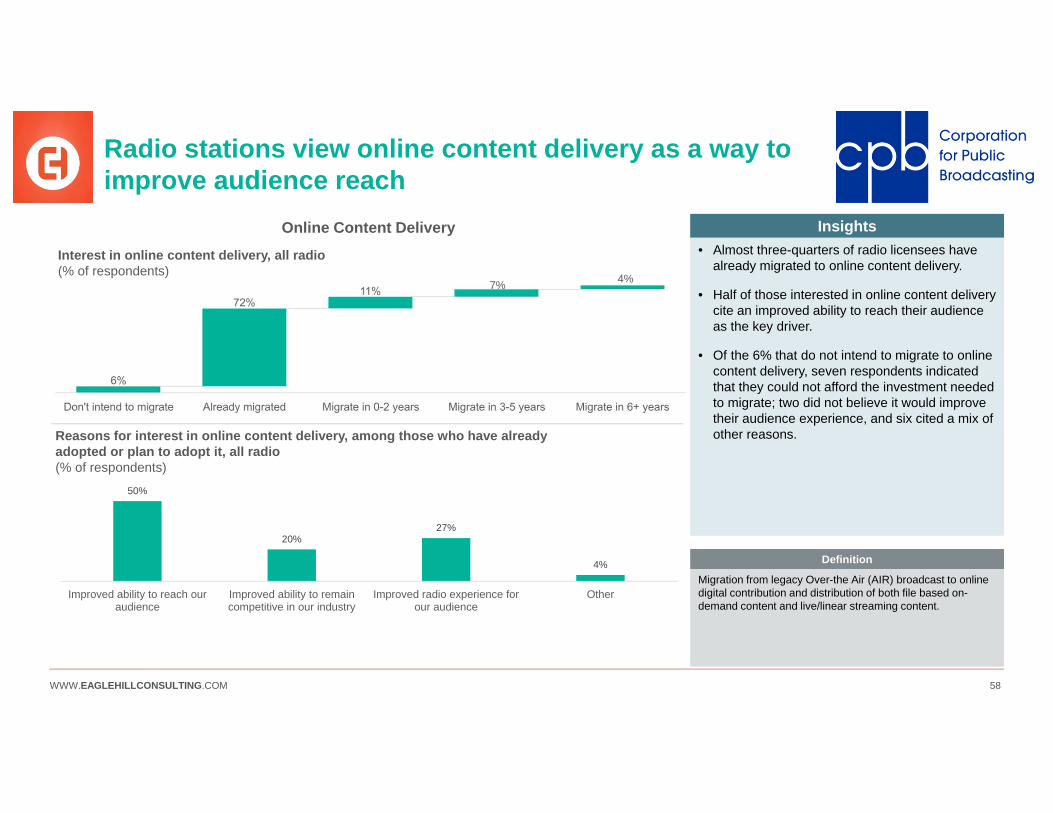
Radio stations view online content delivery as a way to improve audience reach
50%
20%27%
4%
Improved ability to reach ouraudience
Improved ability to remaincompetitive in our industry
Improved radio experience forour audience
Other
• Almost three-quarters of radio licensees have already migrated to online content delivery.
• Half of those interested in online content delivery cite an improved ability to reach their audience as the key driver.
• Of the 6% that do not intend to migrate to online content delivery, seven respondents indicated that they could not afford the investment needed to migrate; two did not believe it would improve their audience experience, and six cited a mix of other reasons.
Insights
Migration from legacy Over-the Air (AIR) broadcast to online digital contribution and distribution of both file based on-demand content and live/linear streaming content.
Definition
Online Content DeliveryInterest in online content delivery, all radio(% of respondents)
Reasons for interest in online content delivery, among those who have already adopted or plan to adopt it, all radio(% of respondents)
7% 4%

WWW.EAGLEHILLCONSULTING.COM 59
More than half of all radio stations have no intention of adopting radio station-in-a-box
Interest in radio Station-in-a-Box, all radio(% of respondents)
16%
45%
3%
17% 19%
Cannot afford theinvestment to adopt
Do not see the need toadopt
Do not think it willimprove financial health
Do not think it willimprove operational
efficency
Other
• Most of the public radio system is uninterested in radio-in-a-box.
• Almost half of those uninterested do not see the need to adopt.
• Likely, this is because their equipment needs are relatively straightforward, and an all-in-one solution offers limited convenience, particularly for those who do not need to replace everything all at once.
Insights
Combining many traditionally separate traffic, automation, production and playout functionalities in a single redundant equipment implementation - referred to occasionally as a “station-in-a-box.” This move may help stations reduce costs and take advantage of the potential benefits of advanced server and applications technology.
Definition
10%
Reasons for disinterest in Radio Station-in-a-Box, all radio(% of respondents)
Radio Station-In-A-Box

WWW.EAGLEHILLCONSULTING.COM 60WWW.EAGLEHILLCONSULTING.COM 60
TECHNOLOGY INFRASTRUCTURE
WWW.EAGLEHILLCONSULTING.COM 61
Section Overview
The Technology Infrastructure section highlights large numbers of anticipated replacements and needed investment in equipment subgroupings, as well as areas of particularly large expenses. These highlighted subgroupings represent the priorities pulled from a full breakdown of all equipment subgroupings (see the Appendix for all subgroupings).
Sub-sections:
TV TECHNOLOGY INFRASTRUCTURE: This subsection contains the prioritized anticipated replacements, investments, and large expenses that are specific to TV licensees.
RADIO TECHNOLOGY INFRASTRUCTURE: This subsection contains the prioritized anticipated replacements, investments, and large expenses that are specific to Radio licensees.
TECHNOLOGY INFRASTRUCTURE
WWW.EAGLEHILLCONSULTING.COM 62
Sub-Section Overview
The Technology Infrastructure section highlights large numbers of anticipated replacements and needed investment in equipment subgroupings, as well as areas of particularly large expenses. These highlighted subgroupings represent the priorities pulled from a full breakdown of all equipment subgroupings (see the Appendix for all subgroupings).
Sub-sections:
TV TECHNOLOGY INFRASTRUCTURE: This subsection contains the prioritized anticipated replacements, investments, and large expenses that are specific to TV licensees.
RADIO TECHNOLOGY INFRASTRUCTURE: This subsection contains the prioritized anticipated replacements, investments, and large expenses that are specific to Radio licensees.
TECHNOLOGY INFRASTRUCTURE

WWW.EAGLEHILLCONSULTING.COM 63
TV stations expect to replace 126 transmitters in 2019 – a $40M system-wide investment – and an opportunity for stations to plan strategically about ATSC 3.0
Public television anticipates replacing a large number of transmitters over the next 2-3 years, which will be a large financial investment but also an opportunity to:
• Explore pricing advantages to a collective purchase agreement around transmitters.
• Embrace ATSC 3.0, by choosing to invest in transmitters capable of supporting this technology – considering additional power requirements, and vertical polarization.
Insights
Consider a collective purchase agreement on transmitters. Major vendors include Harris, Axcera, and Larcan (for a full listing, see Appendix slide 23).
Considerations
21
91
126
56
2017 2018 2019 2020
Anticipated transmitter replacements, 2017-2020(# of transmitters)
$3$8
$40
$12
2017 2018 2019 2020
Projected financial needs for transmitters($ millions)
21% interested in adopting ATSC 3.0 in 0-2 years 54% interested in adopting ATSC 3.0 in
3-5 years
Interest in adopting ATSC 3.0 (% respondents)
Operating ExpensesCapital Expenses
Transmitter Replacements and ATSC 3.0, all TV
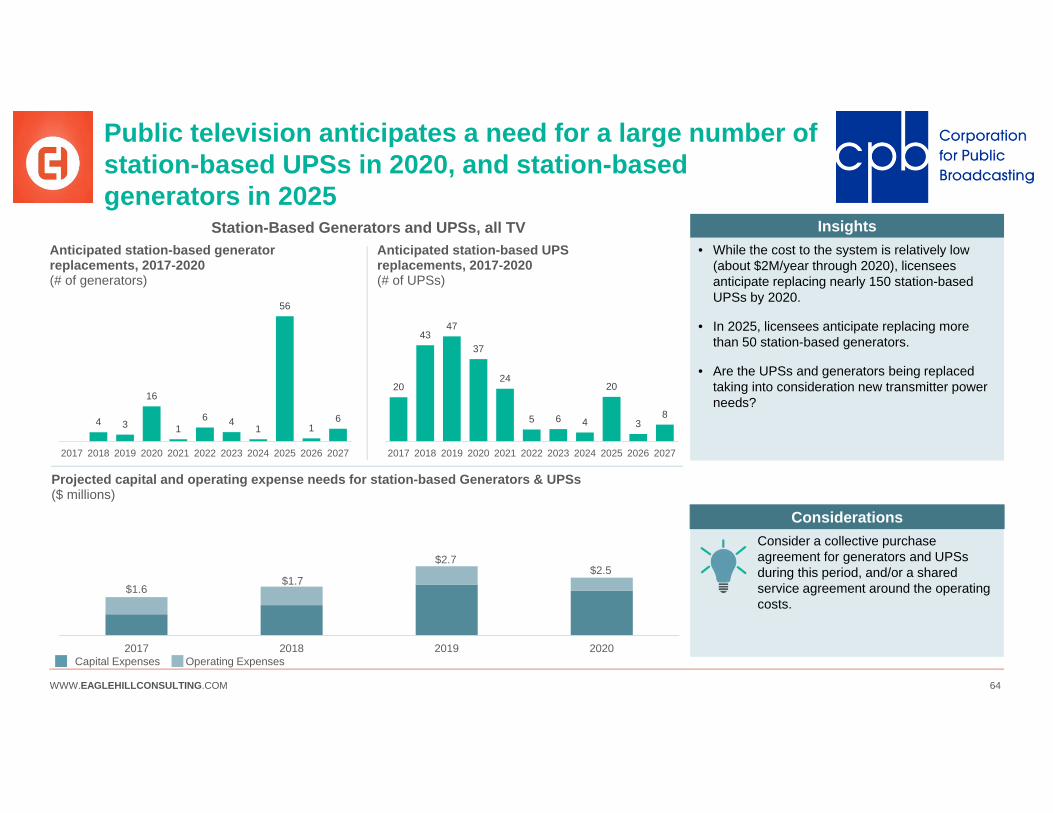
WWW.EAGLEHILLCONSULTING.COM 64
Public television anticipates a need for a large number of station-based UPSs in 2020, and station-based generators in 2025
4 3
16
16 4
1
56
16
2017 2018 2019 2020 2021 2022 2023 2024 2025 2026 2027
Anticipated station-based generator replacements, 2017-2020(# of generators)
20
4347
37
24
5 6 4
20
38
2017 2018 2019 2020 2021 2022 2023 2024 2025 2026 2027
Anticipated station-based UPS replacements, 2017-2020(# of UPSs)
2017 2018 2019 2020
Projected capital and operating expense needs for station-based Generators & UPSs($ millions)
• While the cost to the system is relatively low (about $2M/year through 2020), licensees anticipate replacing nearly 150 station-based UPSs by 2020.
• In 2025, licensees anticipate replacing more than 50 station-based generators.
• Are the UPSs and generators being replaced taking into consideration new transmitter power needs?
Insights
Consider a collective purchase agreement for generators and UPSs during this period, and/or a shared service agreement around the operating costs.
Considerations
$1.6$1.7
$2.7$2.5
Station-Based Generators and UPSs, all TV
Operating ExpensesCapital Expenses
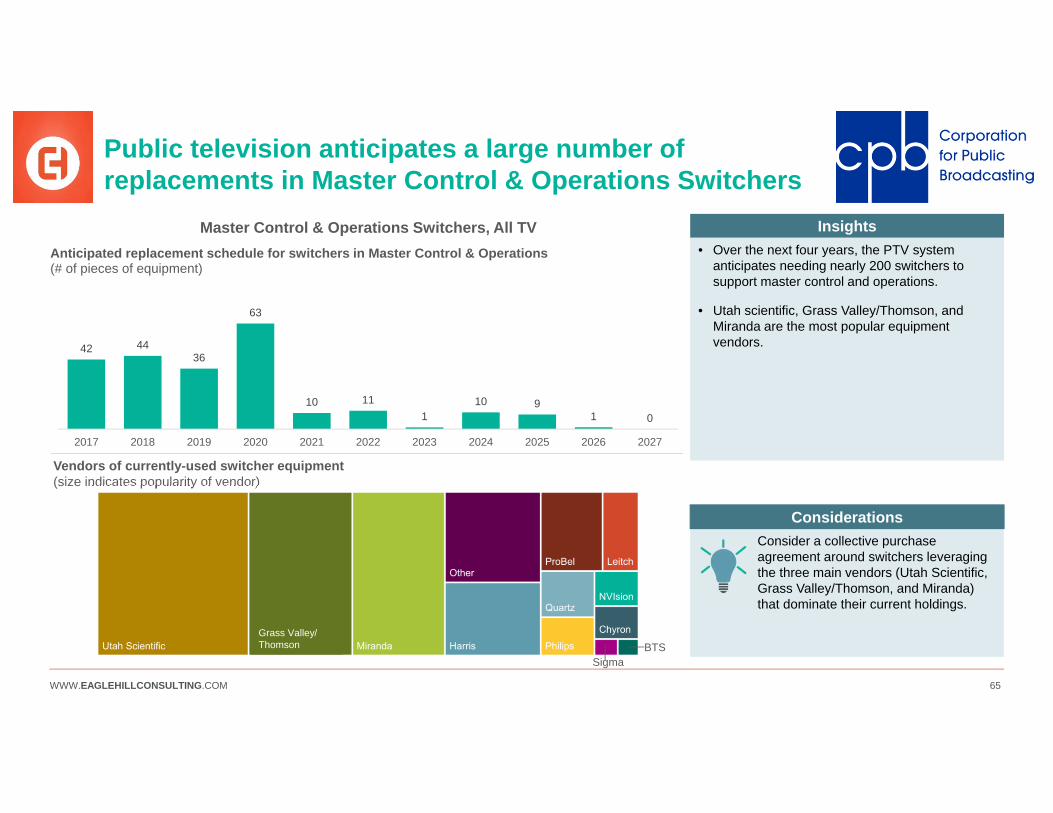
WWW.EAGLEHILLCONSULTING.COM 65
Public television anticipates a large number of replacements in Master Control & Operations Switchers
42 4436
63
10 111
10 91 0
2017 2018 2019 2020 2021 2022 2023 2024 2025 2026 2027
Anticipated replacement schedule for switchers in Master Control & Operations(# of pieces of equipment)
Vendors of currently-used switcher equipment(size indicates popularity of vendor)
• Over the next four years, the PTV system anticipates needing nearly 200 switchers to support master control and operations.
• Utah scientific, Grass Valley/Thomson, and Miranda are the most popular equipment vendors.
Insights
Consider a collective purchase agreement around switchers leveraging the three main vendors (Utah Scientific, Grass Valley/Thomson, and Miranda) that dominate their current holdings.
Considerations
Master Control & Operations Switchers, All TV
BTSSigma
Grass Valley/ Thomson

WWW.EAGLEHILLCONSULTING.COM 66
Public TV anticipates a large number of replacements in Encoding, Mux, & PSIP over the next four years
159
104 105124
33
84
8 10
38
7 4
2017 2018 2019 2020 2021 2022 2023 2024 2025 2026 2027
Anticipated replacement schedule for Encoding, Mux, & PSIP in RF Broadcast(# of pieces of equipment)
Vendors of currently-used Encoding, Mux, & PSIP equipment(size indicates popularity of vendor)
• Stations anticipate a large number of equipment replacements this year relative to later years.
• Harmonic, Tanberg, and Harris are the most popular vendors in this category.
Insights
Consider a collective purchase agreement. Right now, most licensees use a mix of “Other” vendors, but the system could leverage Harmonic, Tanberg, and Harris’ relative predominance.
Considerations
Tiernan
Encoding, Mux, and Program & System Information Protocol (PSIP) Replacements, all TV

WWW.EAGLEHILLCONSULTING.COM 67
Sub-Section Overview
The Technology Infrastructure section highlights large numbers of anticipated replacements and needed investment in equipment subgroupings, as well as areas of particularly large expenses. These highlighted subgroupings represent the priorities pulled from a full breakdown of all equipment subgroupings (see the Appendix for all subgroupings).
Sub-sections:
TV TECHNOLOGY INFRASTRUCTURE: This subsection contains the prioritized anticipated replacements, investments, and large expenses that are specific to TV licensees.
RADIO TECHNOLOGY INFRASTRUCTURE: This subsection contains the prioritized anticipated replacements, investments, and large expenses that are specific to Radio licensees.
TECHNOLOGY INFRASTRUCTURE
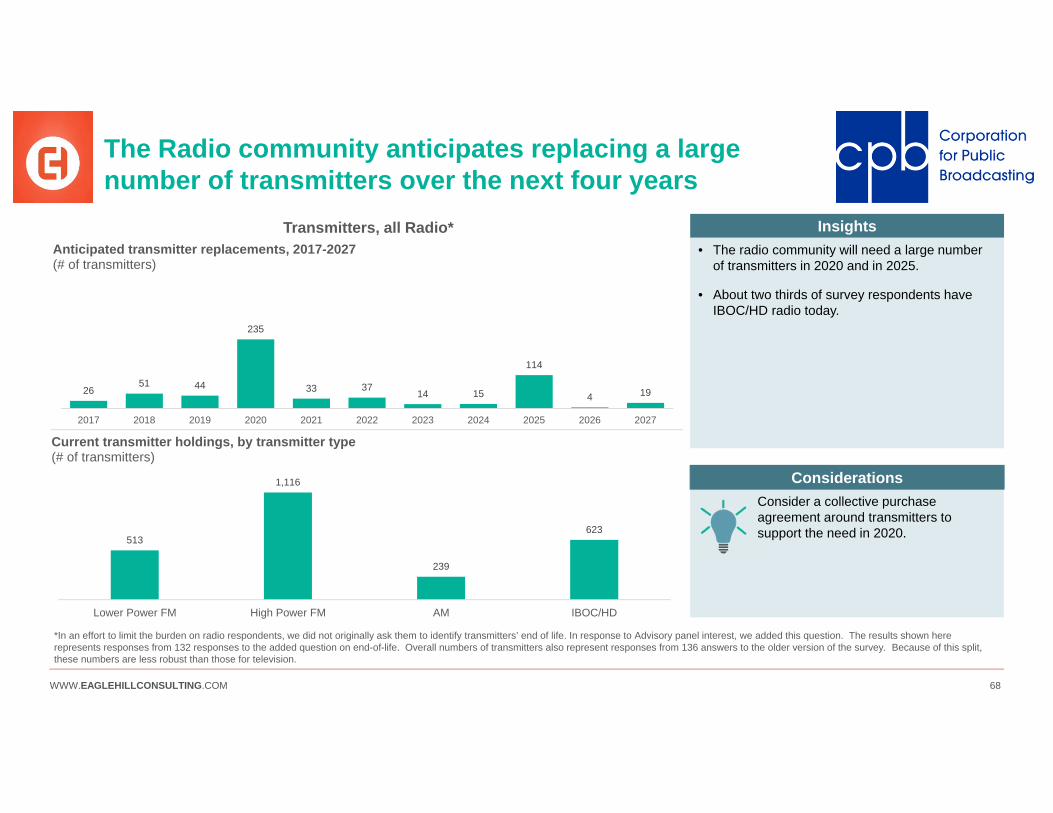
WWW.EAGLEHILLCONSULTING.COM 68
The Radio community anticipates replacing a large number of transmitters over the next four years
2651 44
235
33 3714 15
114
4 19
2017 2018 2019 2020 2021 2022 2023 2024 2025 2026 2027
Anticipated transmitter replacements, 2017-2027(# of transmitters)
• The radio community will need a large number of transmitters in 2020 and in 2025.
• About two thirds of survey respondents have IBOC/HD radio today.
Insights
Consider a collective purchase agreement around transmitters to support the need in 2020.
Considerations
*In an effort to limit the burden on radio respondents, we did not originally ask them to identify transmitters’ end of life. In response to Advisory panel interest, we added this question. The results shown here represents responses from 132 responses to the added question on end-of-life. Overall numbers of transmitters also represent responses from 136 answers to the older version of the survey. Because of this split, these numbers are less robust than those for television.
513
1,116
239
623
Lower Power FM High Power FM AM IBOC/HD
Current transmitter holdings, by transmitter type(# of transmitters)
Transmitters, all Radio*
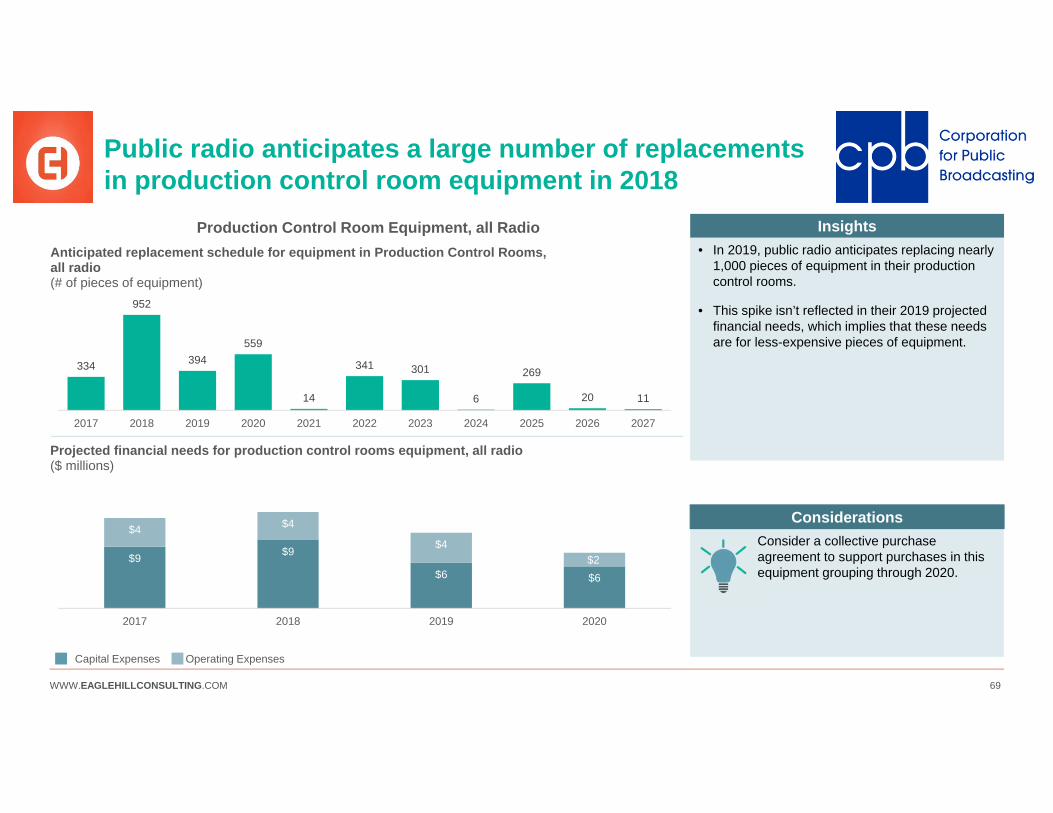
WWW.EAGLEHILLCONSULTING.COM 69
Public radio anticipates a large number of replacements in production control room equipment in 2018
334
952
394559
14
341 301
6
269
20 11
2017 2018 2019 2020 2021 2022 2023 2024 2025 2026 2027
Anticipated replacement schedule for equipment in Production Control Rooms, all radio(# of pieces of equipment)
$9 $9
$6 $6
$4 $4
$4$2
2017 2018 2019 2020
Projected financial needs for production control rooms equipment, all radio($ millions)
• In 2019, public radio anticipates replacing nearly 1,000 pieces of equipment in their production control rooms.
• This spike isn’t reflected in their 2019 projected financial needs, which implies that these needs are for less-expensive pieces of equipment.
Insights
Consider a collective purchase agreement to support purchases in this equipment grouping through 2020.
Considerations
Operating ExpensesCapital Expenses
Production Control Room Equipment, all Radio

WWW.EAGLEHILLCONSULTING.COM 70
Public radio expects a significant number of replacements in Encoding, Mux, EAS/CAP & Modulators over the next four years
129
211 235
358
60
182
112 94
298
4276
2017 2018 2019 2020 2021 2022 2023 2024 2025 2026 2027
Anticipated replacement schedule for Encoding, Mux, EAS/CAP, & Modulators(# of pieces of equipment)
$2$3 $3 $3
$2
$2 $2$2
2017 2018 2019 2020
Projected financial needs for encoding, mux, EAS/CAP & modulators equipment($ millions)
• The public radio system anticipates needing nearly 1,000 pieces of equipment in encoding, mux, EAS/CAP, and modulators over the next four years.
• This equipment comprises an estimated $19 million investment.
Insights
Consider a collective purchase agreement to support purchases in this equipment grouping through 2020. Major vendors include Burk, Broadcast Electronics, Harris, Sage. For a full listing, see Appendix (slide 50 ).
Considerations
Operating ExpensesCapital Expenses
Encoding, Mux, EAS/CAP, and Modulators, all Radio
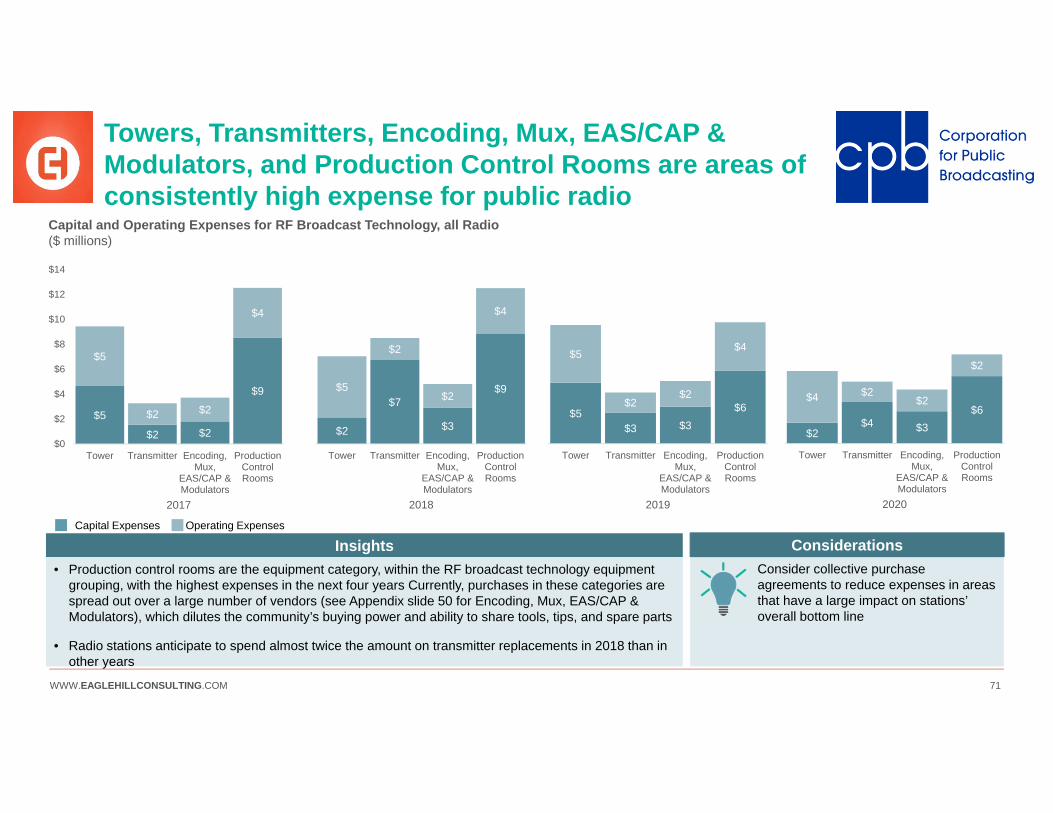
WWW.EAGLEHILLCONSULTING.COM 71
Towers, Transmitters, Encoding, Mux, EAS/CAP & Modulators, and Production Control Rooms are areas of consistently high expense for public radio
$2$4 $3
$6$4 $2
$2
$2
Tower Transmitter Encoding,Mux,
EAS/CAP &Modulators
ProductionControlRooms
2020
$5
$2 $2
$9
$5
$2 $2
$4
$0
$2
$4
$6
$8
$10
$12
$14
Tower Transmitter Encoding,Mux,
EAS/CAP &Modulators
ProductionControlRooms
2017
$2
$7
$3
$9$5
$2
$2
$4
Tower Transmitter Encoding,Mux,
EAS/CAP &Modulators
ProductionControlRooms
2018
$5$3 $3
$6
$5
$2$2
$4
Tower Transmitter Encoding,Mux,
EAS/CAP &Modulators
ProductionControlRooms
2019
Consider collective purchase agreements to reduce expenses in areas that have a large impact on stations’ overall bottom line
ConsiderationsOperating ExpensesCapital Expenses
• Production control rooms are the equipment category, within the RF broadcast technology equipment grouping, with the highest expenses in the next four years Currently, purchases in these categories are spread out over a large number of vendors (see Appendix slide 50 for Encoding, Mux, EAS/CAP & Modulators), which dilutes the community’s buying power and ability to share tools, tips, and spare parts
• Radio stations anticipate to spend almost twice the amount on transmitter replacements in 2018 than in other years
Insights
Capital and Operating Expenses for RF Broadcast Technology, all Radio($ millions)

WWW.EAGLEHILLCONSULTING.COM 72
Public radio anticipates a large number of replacements in automation systems in 2020
265210 242
710
131 12523 12 32 2 8
2017 2018 2019 2020 2021 2022 2023 2024 2025 2026 2027
Anticipated replacement schedule for automation equipment, all radio(# of pieces of equipment)
$1 $2$3
$2
$1 $1
$1
$1
2017 2018 2019 2020
Projected financial needs for automation systems equipment, all radio($ millions)
• Over the next four years, public radio anticipates needing nearly 1,500 pieces of equipment in automation systems.
• While there is a spike in anticipated number of replacements in 2020, the anticipated expenses decline in 2020.
Insights
Consider a collective purchase agreement to leverage system buying power. Major vendors (and possible targets for collective negotiations) include Broadcast Electronics, Enco, and Wide Orbit. For a full listing, see Appendix (slide 44).
Considerations
Operating ExpensesCapital Expenses
Automation Equipment, all Radio
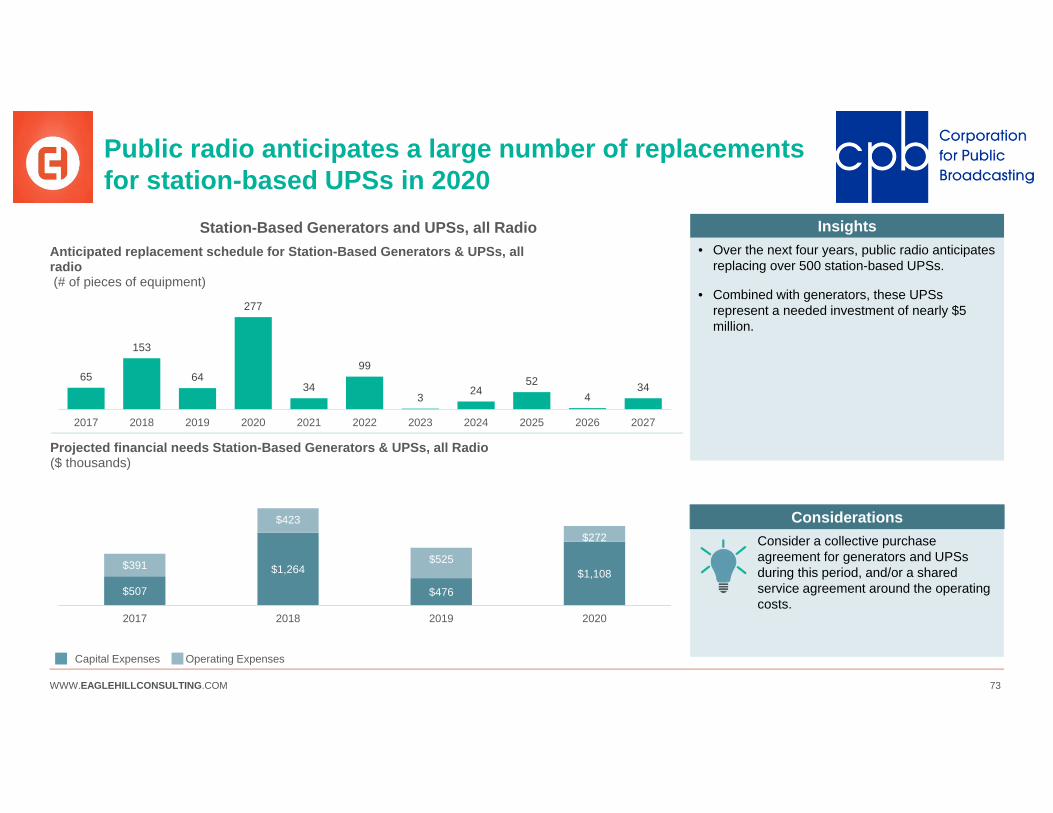
WWW.EAGLEHILLCONSULTING.COM 73
Public radio anticipates a large number of replacements for station-based UPSs in 2020
65
153
64
277
34
99
3 2452
434
2017 2018 2019 2020 2021 2022 2023 2024 2025 2026 2027
Anticipated replacement schedule for Station-Based Generators & UPSs, all radio(# of pieces of equipment)
$507
$1,264
$476$1,108
$391
$423
$525
$272
2017 2018 2019 2020
Projected financial needs Station-Based Generators & UPSs, all Radio($ thousands)
Operating ExpensesCapital Expenses
• Over the next four years, public radio anticipates replacing over 500 station-based UPSs.
• Combined with generators, these UPSs represent a needed investment of nearly $5million.
Insights
Consider a collective purchase agreement for generators and UPSs during this period, and/or a shared service agreement around the operating costs.
Considerations
Station-Based Generators and UPSs, all Radio

WWW.EAGLEHILLCONSULTING.COM 74WWW.EAGLEHILLCONSULTING.COM 74
FINANCIAL PLANNING
WWW.EAGLEHILLCONSULTING.COM 75
Section Overview
The Financial Planning section examines stations’ estimated funding, estimated expenses, funding restrictions, and financial gap contingency planning related to stations’ technology. A full breakdown of estimated funding and expenses is available in the Appendix.
Sub-sections:
FUNDING GAPS: Depicts the cumulative and annual funding gaps for 2017-2020 between estimated available funds and expenses for TV and Radio.
DIFFERENCES BETWEEN GENERAL MANAGERS’ AND ENGINEERS’ PREDICTED NEEDS: Compares General Managers’ and Engineers’ estimates for expenses between 2017-2020.
FUNDING APPROACHES AND CONSTRAINTS: Examines stations’ approaches for managing a deficit in funding, constraints that their funding is subject to, and their approach to funding depreciation.
FINANCIAL PLANNING

WWW.EAGLEHILLCONSULTING.COM 76
Sub-Section Overview
The Financial Planning section examines stations’ estimated funding, estimated expenses, funding restrictions, and financial gap contingency planning related to stations’ technology. A full breakdown of estimated funding and expenses is available in the Appendix.
Sub-sections:
FUNDING GAPS: Depicts the cumulative and annual funding gaps for 2017-2020 between estimated available funds and expenses for TV and Radio.
DIFFERENCES BETWEEN GENERAL MANAGERS’ AND ENGINEERS’ PREDICTED NEEDS: Compares General Managers’ and Engineers’ estimates for expenses between 2017-2020.
FUNDING APPROACHES AND CONSTRAINTS: Examines stations’ approaches for managing a deficit in funding, constraints that their funding is subject to, and their approach to funding depreciation.
FINANCIAL PLANNING
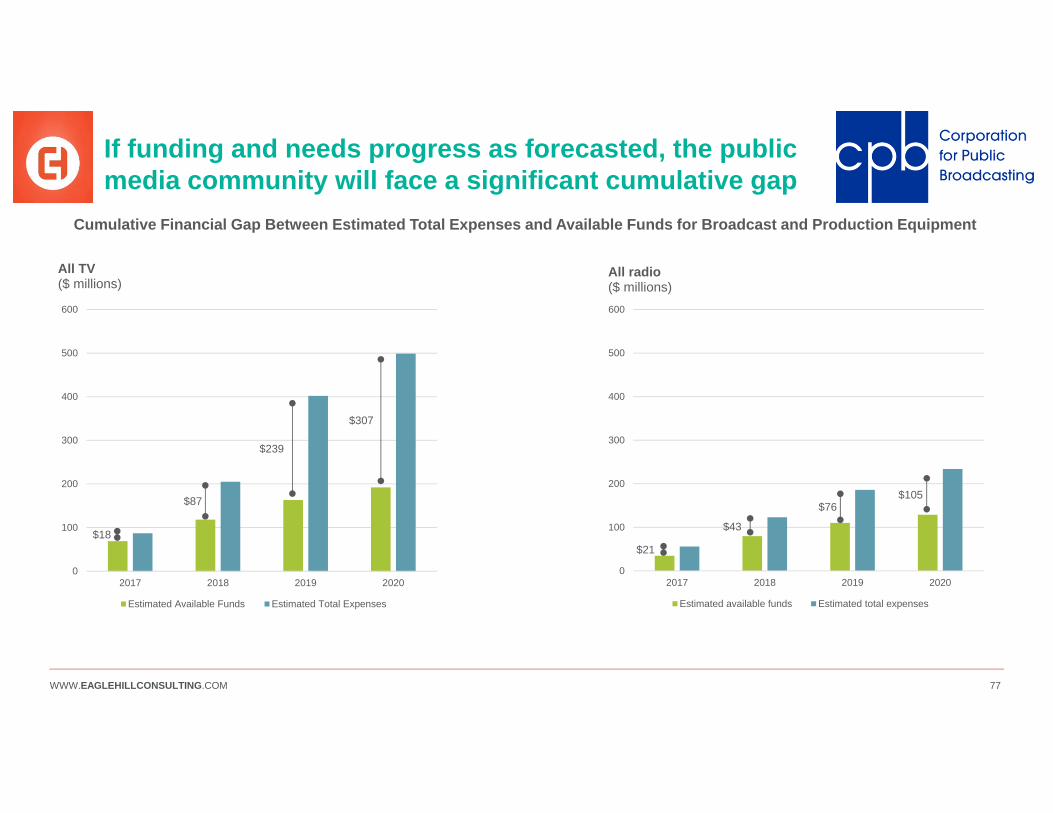
WWW.EAGLEHILLCONSULTING.COM 77
If funding and needs progress as forecasted, the public media community will face a significant cumulative gap
0
100
200
300
400
500
600
2017 2018 2019 2020
All TV($ millions)
Estimated Available Funds Estimated Total Expenses
$18
$87
$239
$307
0
100
200
300
400
500
600
2017 2018 2019 2020
All radio($ millions)
Estimated available funds Estimated total expenses
$21
$105
Cumulative Financial Gap Between Estimated Total Expenses and Available Funds for Broadcast and Production Equipment
$43
$76

WWW.EAGLEHILLCONSULTING.COM 78
$87
$118
$197
$97
$69
$49 $45
$29
2017 2018 2019 2020
All TV($ millions)
System-wide, stations face a gap between estimated technology needs and funding over the next four years
• Stations anticipate a gap between their estimated technology needs (expenses) and their available funding to pay for those needs.
• This financial gap widens substantially in 2019.$152M
Estimated Total Expenses Estimated Available Funds
Financial Gap Between Engineer-Estimated Needs and GM-Estimated Available Funds
Insights
Average Gap Per Station ($)
2017 2018 2019 2020
TV -$105,239 -$411,759 -$903,562 -$408,466
Radio -$51,154 -$53,985 -$80,042 -$72,996
Public media constituents can use this Assessment to develop robust advocacy for both public and private funders.
Consider partnerships with commercial stations (particularly in conjunction with ATSC 3.0) to develop ancillary revenue.
Consider finding new efficiencies (including increased collaboration) throughout the system to reduce costs.
Considerations
$56 $67 $63
$48
$35 $45
$30 $19
2017 2018 2019 2020
All radio($ millions)
$33M
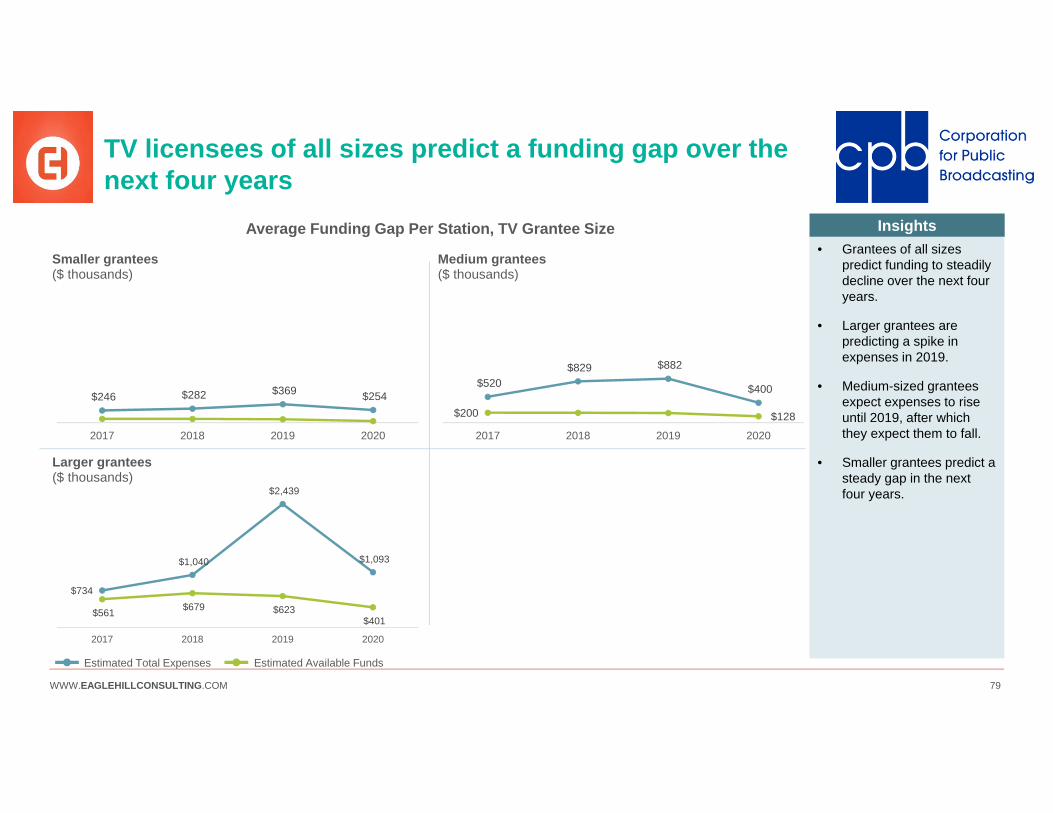
WWW.EAGLEHILLCONSULTING.COM 79
TV licensees of all sizes predict a funding gap over the next four years
Estimated Total Expenses Estimated Available Funds
Average Funding Gap Per Station, TV Grantee Size• Grantees of all sizes
predict funding to steadily decline over the next four years.
• Larger grantees are predicting a spike in expenses in 2019.
• Medium-sized grantees expect expenses to rise until 2019, after which they expect them to fall.
• Smaller grantees predict a steady gap in the next four years.
Insights
$246 $282 $369 $254
2017 2018 2019 2020
Smaller grantees($ thousands)
$520 $829 $882
$400
$200 $128
2017 2018 2019 2020
Medium grantees($ thousands)
$734
$1,040
$2,439
$1,093
$561 $679 $623 $401
2017 2018 2019 2020
Larger grantees($ thousands)

WWW.EAGLEHILLCONSULTING.COM 80
Each TV licensee type expects a funding gap over the next four years and all but one type expect 2019 to have the largest gap
Average Funding Gap Per Station, TV Licensee Type
Estimated Total Expenses Estimated Available Funds
$424 $647
$1,610
$554
$152 $90 2017 2018 2019 2020
University licensees($ thousands)
$699
$340 $409 $229
$88 $54 2017 2018 2019 2020
Local authority licensees($ thousands)
$361 $531
$749
$420
$233 $176
2017 2018 2019 2020
Community licensees($ thousands)
$1,493
$1,832 $2,097
$1,540
$757 $1,073 $779
$433
2017 2018 2019 2020
State licensees($ thousands)
• Local Authority licensees are predicting their funding gap to narrow over the next four years as their expenses fall.
• Community, State, and University licensees all anticipate to have a particularly large funding gap in 2019.
• All licensee types expect funding to decline over the next four years.
Insights

WWW.EAGLEHILLCONSULTING.COM 81
Radio licensees of all sizes also anticipate a funding gap over the next four years
Estimated Total Expenses Estimated Available Funds
Average Funding Gap Per Station, Radio Grantee Size• Stations of all sizes
predict a funding gap.
• While larger licensees have the largest gap, the estimated expenses and funds follow a similar and declining pattern between 2017 and 2020.
• Radio licensees of all sizes expect funding to decline over the next four years.
Insights
$279
$358$310
$246
$202
$290
$201
$124
2017 2018 2019 2020
Larger grantees($ thousands)
$134 $118 $125 $85
$68 $17
2017 2018 2019 2020
Medium grantees($ thousands)
$41 $49 $59 $46
2017 2018 2019 2020
Smaller grantees($ thousands)
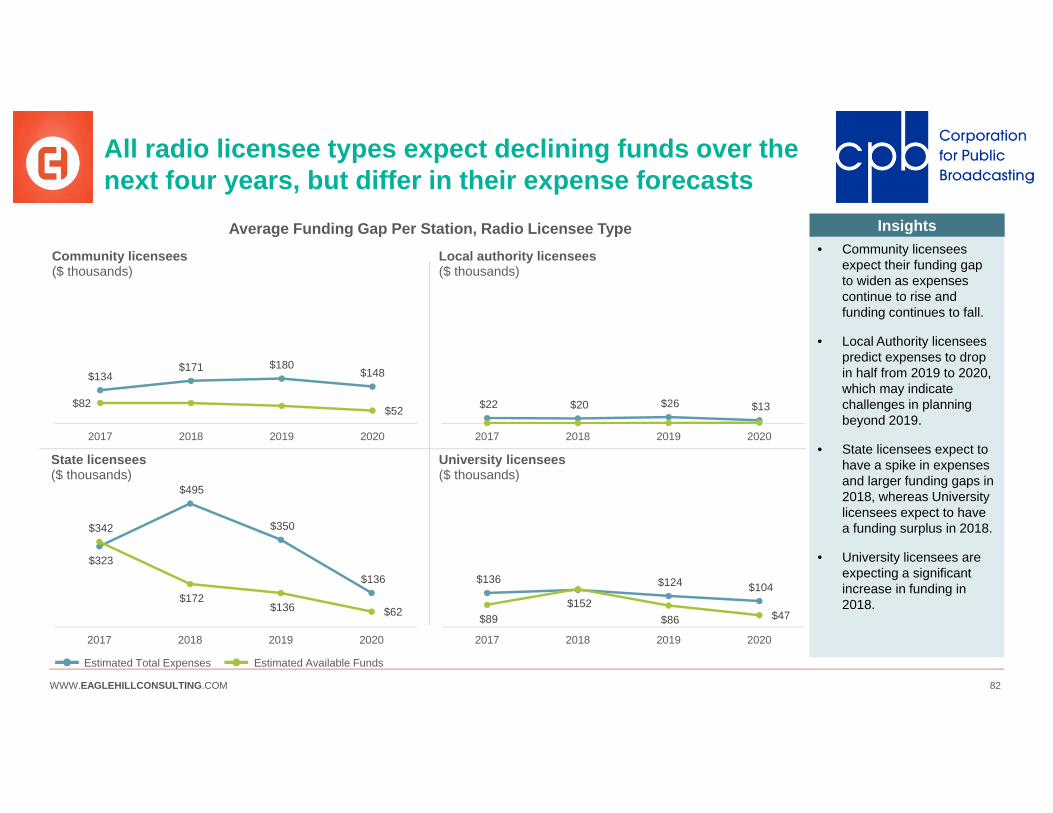
WWW.EAGLEHILLCONSULTING.COM 82
All radio licensee types expect declining funds over the next four years, but differ in their expense forecasts
Average Funding Gap Per Station, Radio Licensee Type• Community licensees
expect their funding gap to widen as expenses continue to rise and funding continues to fall.
• Local Authority licensees predict expenses to drop in half from 2019 to 2020, which may indicate challenges in planning beyond 2019.
• State licensees expect to have a spike in expenses and larger funding gaps in 2018, whereas University licensees expect to have a funding surplus in 2018.
• University licensees are expecting a significant increase in funding in 2018.
Insights
$134$171 $180
$148
$82 $52
2017 2018 2019 2020
Community licensees($ thousands)
$22 $20 $26 $13
2017 2018 2019 2020
Local authority licensees($ thousands)
$323
$495
$350
$136
$342
$172 $136 $62
2017 2018 2019 2020
State licensees($ thousands)
$136 $124 $104
$89 $152
$86 $47
2017 2018 2019 2020
University licensees($ thousands)
Estimated Total Expenses Estimated Available Funds
WWW.EAGLEHILLCONSULTING.COM 83
Sub-Section Overview
The Financial Planning section examines stations’ estimated funding, estimated expenses, funding restrictions, and financial gap contingency planning related to stations’ technology. A full breakdown of estimated funding and expenses is available in the Appendix.
Sub-sections:
FUNDING GAPS: Depicts the cumulative and annual funding gaps for 2017-2020 between estimated available funds and expenses for TV and Radio.
DIFFERENCES BETWEEN GENERAL MANAGERS’ AND ENGINEERS’ PREDICTED NEEDS: Compares General Managers’ and Engineers’ estimates for expenses between 2017-2020.
FUNDING APPROACHES AND CONSTRAINTS: Examines stations’ approaches for managing a deficit in funding, constraints that their funding is subject to, and their approach to funding depreciation.
FINANCIAL PLANNING
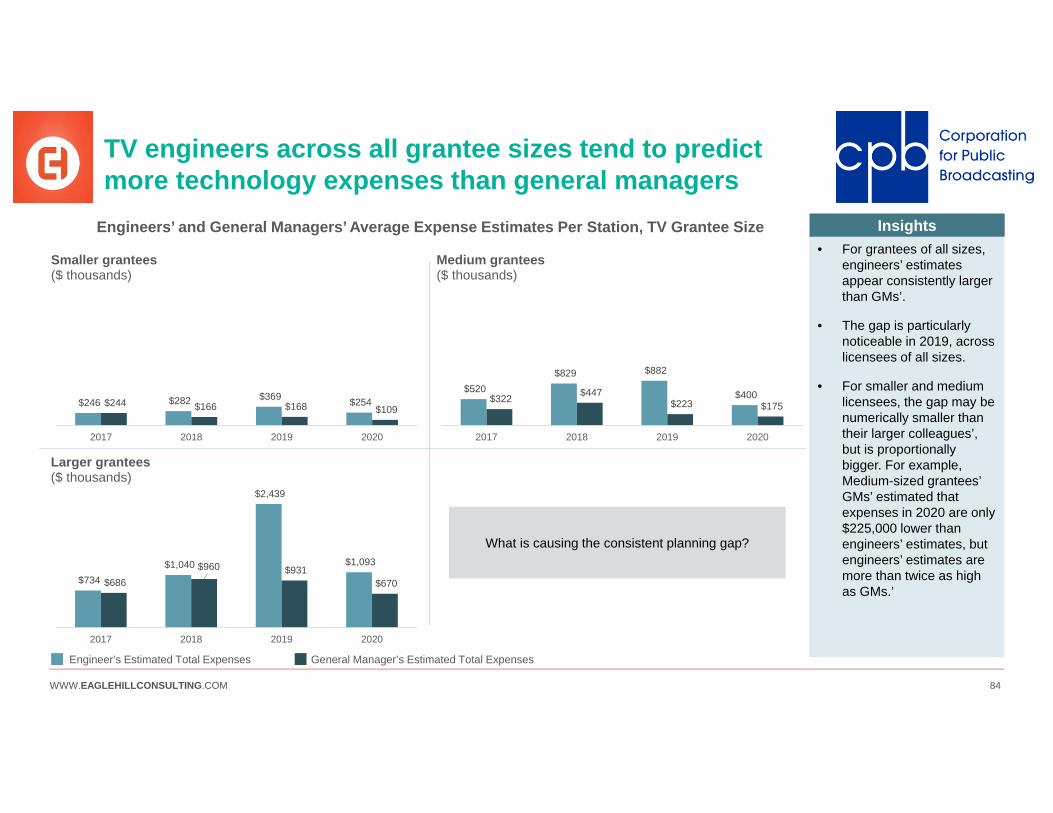
WWW.EAGLEHILLCONSULTING.COM 84
TV engineers across all grantee sizes tend to predict more technology expenses than general managers
Engineers’ and General Managers’ Average Expense Estimates Per Station, TV Grantee Size• For grantees of all sizes,
engineers’ estimates appear consistently larger than GMs’.
• The gap is particularly noticeable in 2019, across licensees of all sizes.
• For smaller and medium licensees, the gap may be numerically smaller than their larger colleagues’, but is proportionally bigger. For example, Medium-sized grantees’ GMs’ estimated that expenses in 2020 are only $225,000 lower than engineers’ estimates, but engineers’ estimates are more than twice as high as GMs.’
Insights
Engineer’s Estimated Total Expenses General Manager’s Estimated Total Expenses
$246 $282 $369 $254 $244 $166 $168 $109
2017 2018 2019 2020
Smaller grantees($ thousands)
$520 $829 $882
$400 $322 $447 $223 $175
2017 2018 2019 2020
Medium grantees($ thousands)
$734 $1,040
$2,439
$1,093
$686 $960 $931
$670
2017 2018 2019 2020
Larger grantees($ thousands)
What is causing the consistent planning gap?
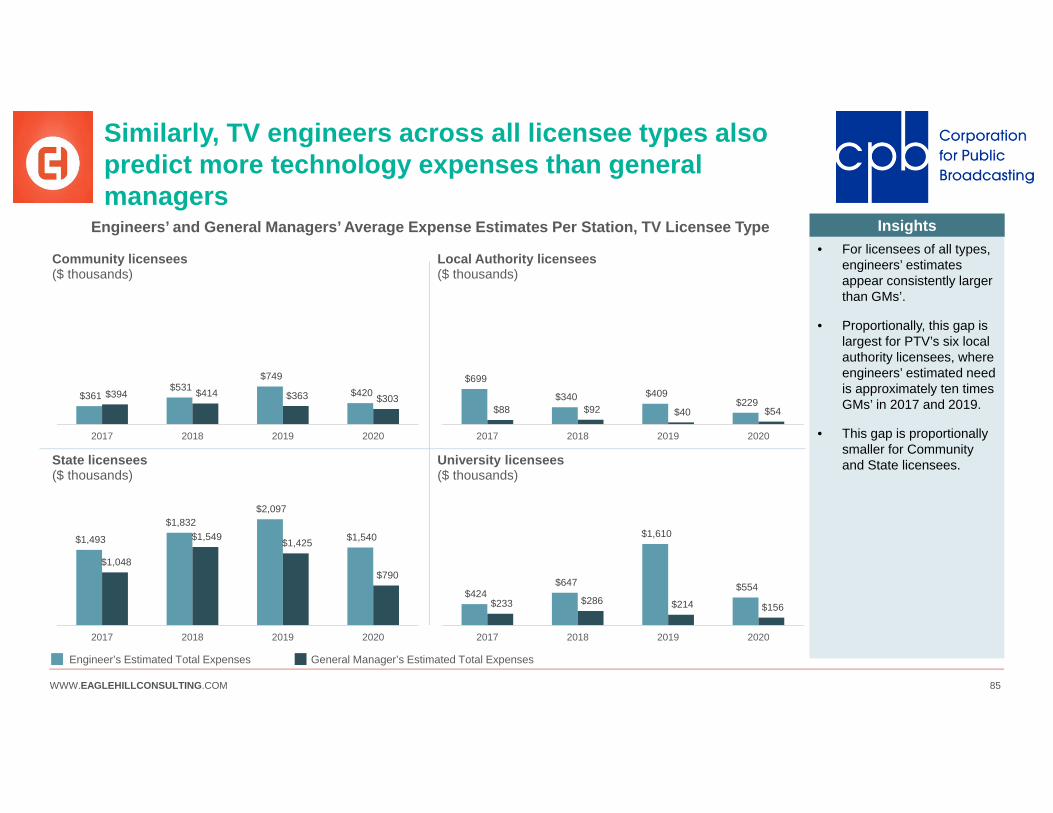
WWW.EAGLEHILLCONSULTING.COM 85
Similarly, TV engineers across all licensee types also predict more technology expenses than general managers
$1,493
$1,832 $2,097
$1,540
$1,048
$1,549 $1,425
$790
2017 2018 2019 2020
State licensees($ thousands)
$424 $647
$1,610
$554 $233 $286 $214 $156
2017 2018 2019 2020
University licensees($ thousands)
$699
$340 $409 $229
$88 $92 $40 $54
2017 2018 2019 2020
Local Authority licensees($ thousands)
$361 $531
$749
$420 $394 $414 $363 $303
2017 2018 2019 2020
Community licensees($ thousands)
• For licensees of all types, engineers’ estimates appear consistently larger than GMs’.
• Proportionally, this gap is largest for PTV’s six local authority licensees, where engineers’ estimated need is approximately ten times GMs’ in 2017 and 2019.
• This gap is proportionally smaller for Community and State licensees.
Insights
Engineer’s Estimated Total Expenses General Manager’s Estimated Total Expenses
Engineers’ and General Managers’ Average Expense Estimates Per Station, TV Licensee Type
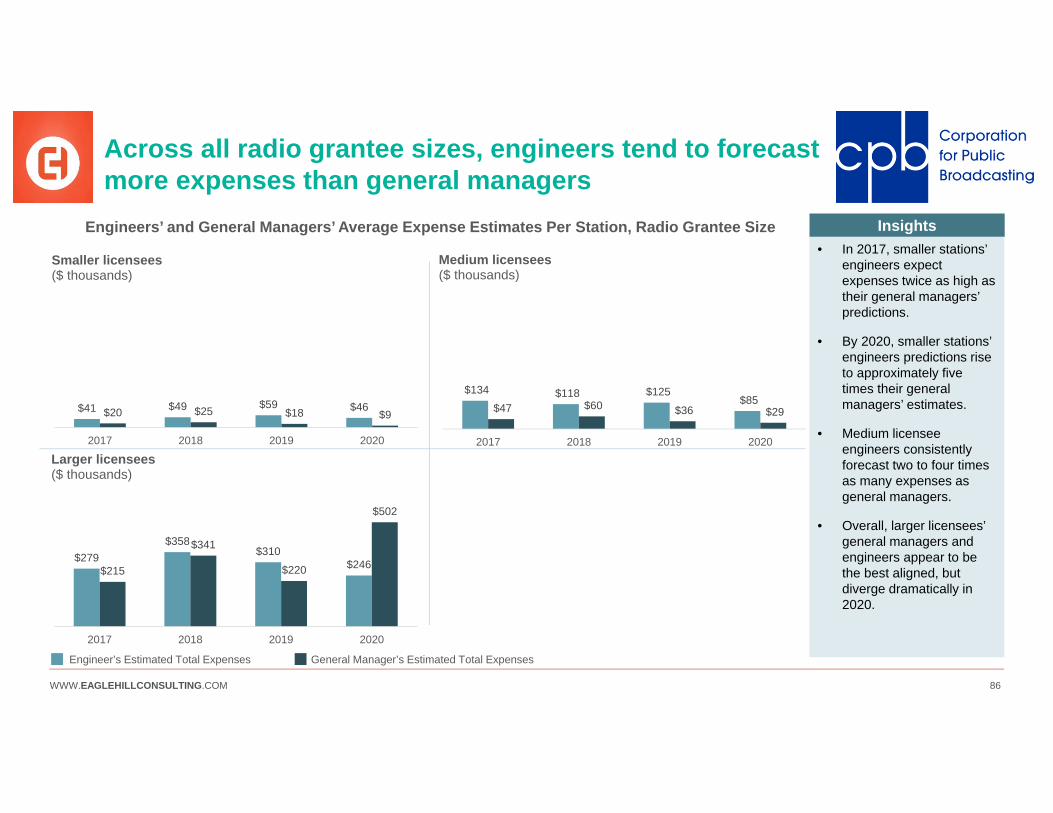
WWW.EAGLEHILLCONSULTING.COM 86
Across all radio grantee sizes, engineers tend to forecast more expenses than general managers
• In 2017, smaller stations’ engineers expect expenses twice as high as their general managers’ predictions.
• By 2020, smaller stations’ engineers predictions rise to approximately five times their general managers’ estimates.
• Medium licensee engineers consistently forecast two to four times as many expenses as general managers.
• Overall, larger licensees’ general managers and engineers appear to be the best aligned, but diverge dramatically in 2020.
Insights
$279$358
$310$246$215
$341
$220
$502
2017 2018 2019 2020
Larger licensees($ thousands)
$134 $118 $125 $85
$47 $60 $36 $29
2017 2018 2019 2020
Medium licensees($ thousands)
$41 $49 $59 $46$20 $25 $18 $9
2017 2018 2019 2020
Smaller licensees($ thousands)
Engineer’s Estimated Total Expenses General Manager’s Estimated Total Expenses
Engineers’ and General Managers’ Average Expense Estimates Per Station, Radio Grantee Size
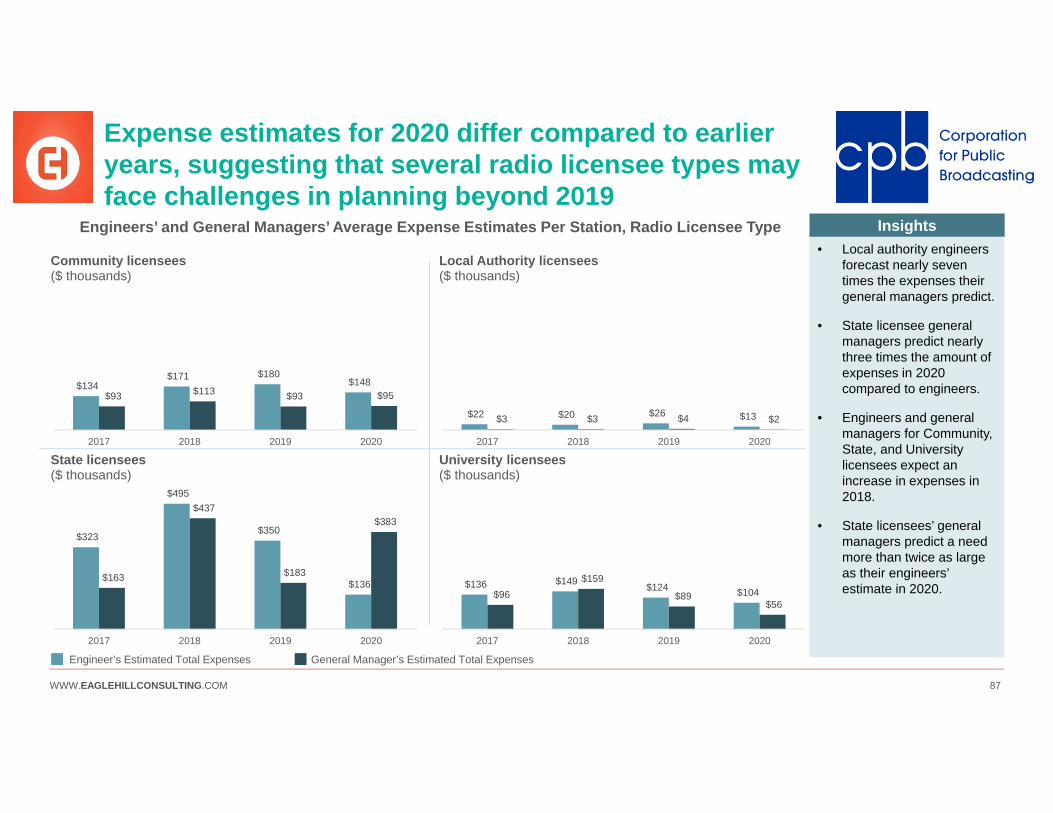
WWW.EAGLEHILLCONSULTING.COM 87
Expense estimates for 2020 differ compared to earlier years, suggesting that several radio licensee types may face challenges in planning beyond 2019
• Local authority engineers forecast nearly seven times the expenses their general managers predict.
• State licensee generalmanagers predict nearly three times the amount of expenses in 2020 compared to engineers.
• Engineers and generalmanagers for Community, State, and University licensees expect an increase in expenses in 2018.
• State licensees’ general managers predict a need more than twice as large as their engineers’ estimate in 2020.
Insights
$134 $171 $180
$148 $93 $113 $93 $95
2017 2018 2019 2020
Community licensees($ thousands)
$22 $20 $26 $13 $3 $3 $4 $2
2017 2018 2019 2020
Local Authority licensees($ thousands)
$323
$495
$350
$136 $163
$437
$183
$383
2017 2018 2019 2020
State licensees($ thousands)
$136 $149 $124 $104 $96 $159
$89 $56
2017 2018 2019 2020
University licensees($ thousands)
Engineer’s Estimated Total Expenses General Manager’s Estimated Total Expenses
Engineers’ and General Managers’ Average Expense Estimates Per Station, Radio Licensee Type
WWW.EAGLEHILLCONSULTING.COM 88
Sub-Section Overview
The Financial Planning section examines stations’ estimated funding, estimated expenses, funding restrictions, and financial gap contingency planning related to stations’ technology. A full breakdown of estimated funding and expenses is available in the Appendix.
Sub-sections:
FUNDING GAPS: Depicts the cumulative and annual funding gaps for 2017-2020 between estimated available funds and expenses for TV and Radio.
DIFFERENCES BETWEEN GENERAL MANAGERS’ AND ENGINEERS’ PREDICTED NEEDS: Compares General Managers’ and Engineers’ estimates for expenses between 2017-2020.
FUNDING APPROACHES AND CONSTRAINTS: Examines stations’ approaches for managing a deficit in funding, constraints that their funding is subject to, and their approach to funding depreciation.
FINANCIAL PLANNING

WWW.EAGLEHILLCONSULTING.COM 89
44%
75%
22%
4%
45%
27%
36%
Reach out to funders
Postpone replacement
Scale back replacement
Borrow money
Start capital campaign
Dip into contingency funds
Cut other budget items
Stations employ a variety of tactics to replace/refresh equipment when faced with a lack of funds
All TV(% TV respondents, answers are not mutually exclusive)
All radio(% Radio respondents, answers are not mutually exclusive)
What Stations Do When They Lack Funds to Cover Technology Replacement Costs• 86% of TV stations and 75% of radio stations
tend to postpone replacing their technology equipment when faced with a lack of funds.
• By postponing replacement, stations are at a greater risk of going off the air, not being able to fulfil their missions, and/or are squeezed to make purchases without having the lead time to negotiate better equipment deals.
• Almost half of TV stations and a quarter of radio stations will scale back their replacement plans to equipment with less optimal specifications.
Insights
Consider educating stations on balancing the risk incurred to on-air time and mission fulfillment caused by extensively postponed replacements (see Slide 47).
Considerations
36%
86%
44%
10%
20%
34%
30%
Reach out to funders
Postpone replacement
Scale back replacement
Borrow money
Start a capital campaign
Dip into contingency funds
Cut other budget items

WWW.EAGLEHILLCONSULTING.COM 90
Public TV and radio stations are restricted in how they acquire and spend their technology funds
• Public TV and radio stations face similar challenges in funding restrictions, with a required one year lead time being the largest hurdle.
• The high percentage of funding that must be spent on capital expenses may limit stations’ ability to upgrade their technology because vendors increasingly develop operating-expense intensive technologies.
51%
14%
48%
42%
13%
44%
Requires over 1yr oflead time
Requires matchingfunds
Can be spent only onCapEx
All TV(% of funds, not mutually exclusive)
ProductionBroadcast
46%
16%
36%39%
15%
32%
Requires over 1yr oflead time
Requires matchingfunds
Can be spent only onCapEx
All radio(% of funds, not mutually exclusive)
Percentage of Funds Spent on Broadcast and Production
TV Radio
Broadcast 54% 60%
Production 46% 40%
Funding Restrictions Affecting Stations
InsightsGiven that many funds require more than a year of lead time, consider helping stations get out ahead of the 2019 need for equipment funding.
Considerations
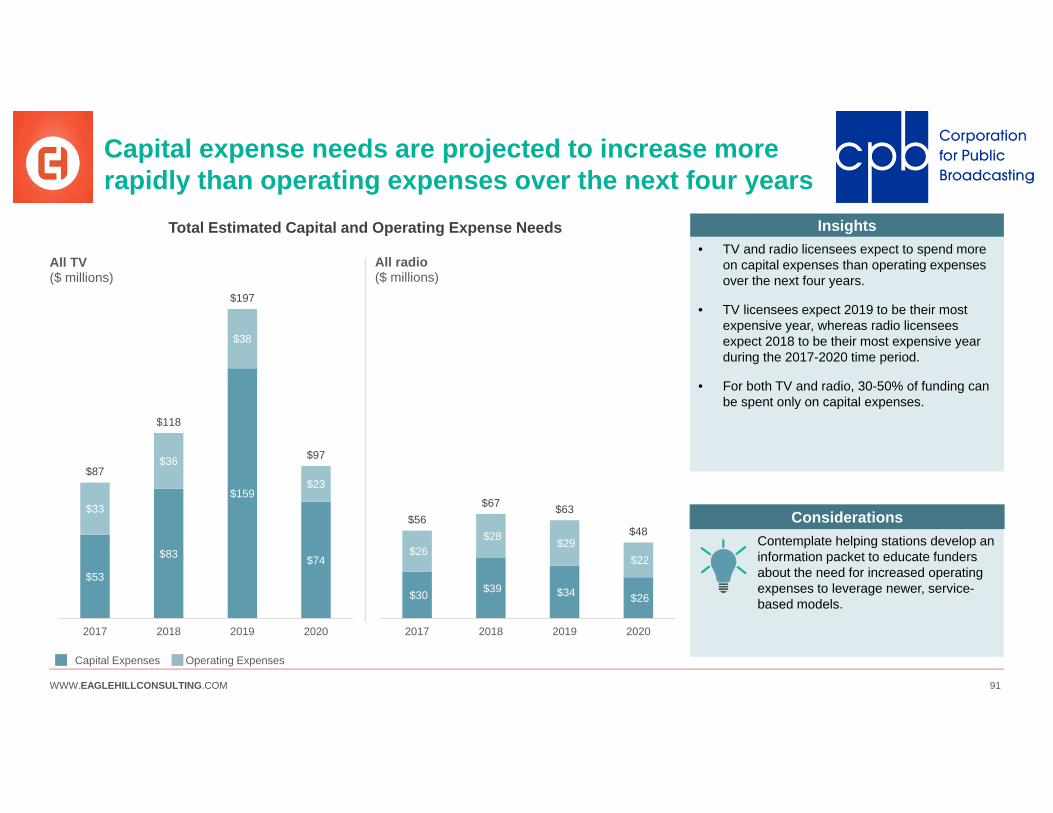
WWW.EAGLEHILLCONSULTING.COM 91
Capital expense needs are projected to increase more rapidly than operating expenses over the next four years
• TV and radio licensees expect to spend more on capital expenses than operating expenses over the next four years.
• TV licensees expect 2019 to be their most expensive year, whereas radio licensees expect 2018 to be their most expensive year during the 2017-2020 time period.
• For both TV and radio, 30-50% of funding can be spent only on capital expenses.
$53
$83
$159
$74
$33
$36
$38
$23$87
$118
$197
$97
2017 2018 2019 2020
All TV($ millions)
Operating ExpensesCapital Expenses
Total Estimated Capital and Operating Expense Needs
$30 $39 $34 $26
$26 $28 $29
$22
$56$67 $63
$48
2017 2018 2019 2020
All radio($ millions)
Insights
Contemplate helping stations develop an information packet to educate funders about the need for increased operating expenses to leverage newer, service-based models.
Considerations
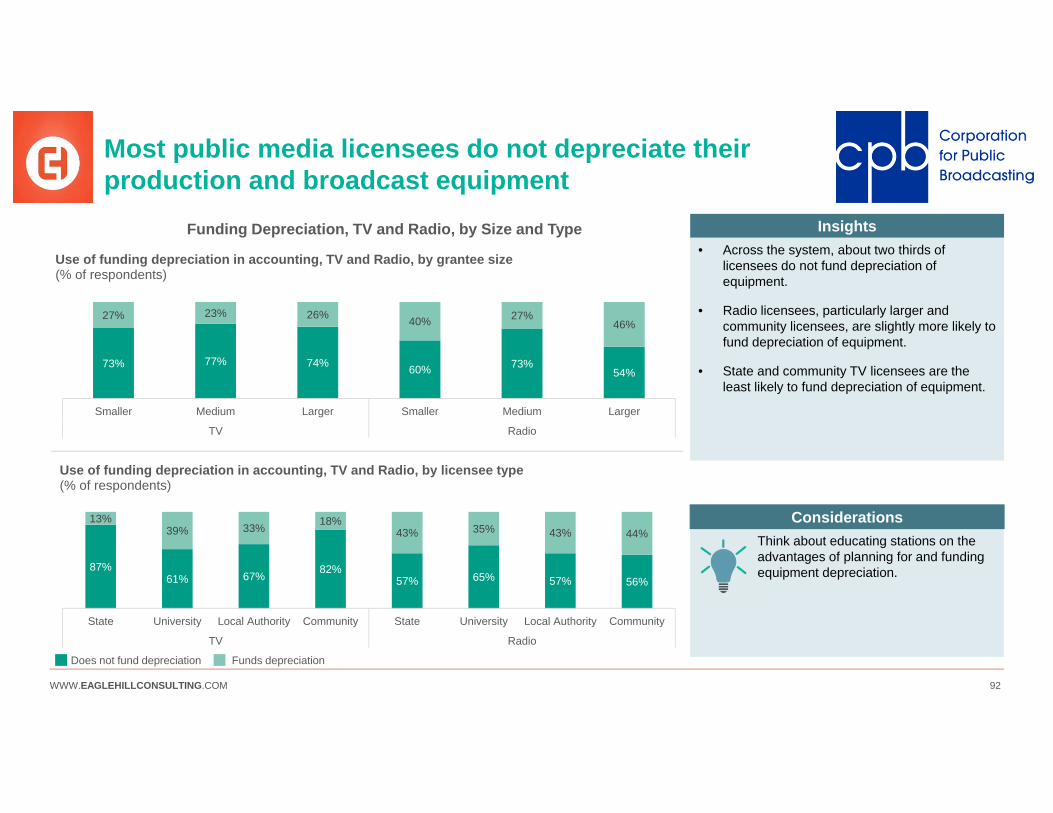
WWW.EAGLEHILLCONSULTING.COM 92
Most public media licensees do not depreciate their production and broadcast equipment
• Across the system, about two thirds of licensees do not fund depreciation of equipment.
• Radio licensees, particularly larger and community licensees, are slightly more likely to fund depreciation of equipment.
• State and community TV licensees are the least likely to fund depreciation of equipment.
Insights
Think about educating stations on the advantages of planning for and funding equipment depreciation.
Considerations
87%61% 67% 82%
57% 65% 57% 56%
13%39% 33% 18%
43% 35% 43% 44%
State University Local Authority Community State University Local Authority Community
TV Radio
Use of funding depreciation in accounting, TV and Radio, by licensee type(% of respondents)
Funding Depreciation, TV and Radio, by Size and Type
Funds depreciationDoes not fund depreciation
73% 77% 74% 60% 73%54%
27% 23% 26% 40% 27%46%
Smaller Medium Larger Smaller Medium Larger
TV Radio
Use of funding depreciation in accounting, TV and Radio, by grantee size(% of respondents)

WWW.EAGLEHILLCONSULTING.COM 93WWW.EAGLEHILLCONSULTING.COM 93

WWW.EAGLEHILLCONSULTING.COM
CPB System Technology Assessment Final ReportAppendix
MAY 21 2017

WWW.EAGLEHILLCONSULTING.COM 95
Table of Contents
Section Slide #
Television Technology 3-32
All TV Equipment 4-5
TV Production and Post 6-11
TV Traffic and Scheduling 12-13
TV Master Control and Operations 14-18
TV RF Broadcast 19-23
TV Common Infrastructure 24-29
TV Joint Master Control 30-32
Radio Technology 33-55
All Radio Equipment 34-35
Radio Production and Master Control 36-39
Radio Traffic and Automation 40-44
Radio RF Broadcast 45-49
Radio Common Infrastructure 51-55
Key Learnings from Interviews and Pilot 56-61
This document is an Appendix to the CPB System Technology Assessment Final Report. It contains additional data visualizations that Eagle Hill Consulting produced, were not prioritized for analysis as part of the final report, and are included here for completeness. It also contains key learnings from the interviews and pilot that were conducted prior to launching the survey. The Appendix is intended as a reference document from which CPB can draw its own conclusions about the data.

WWW.EAGLEHILLCONSULTING.COM 96WWW.EAGLEHILLCONSULTING.COM 96
Television Technology
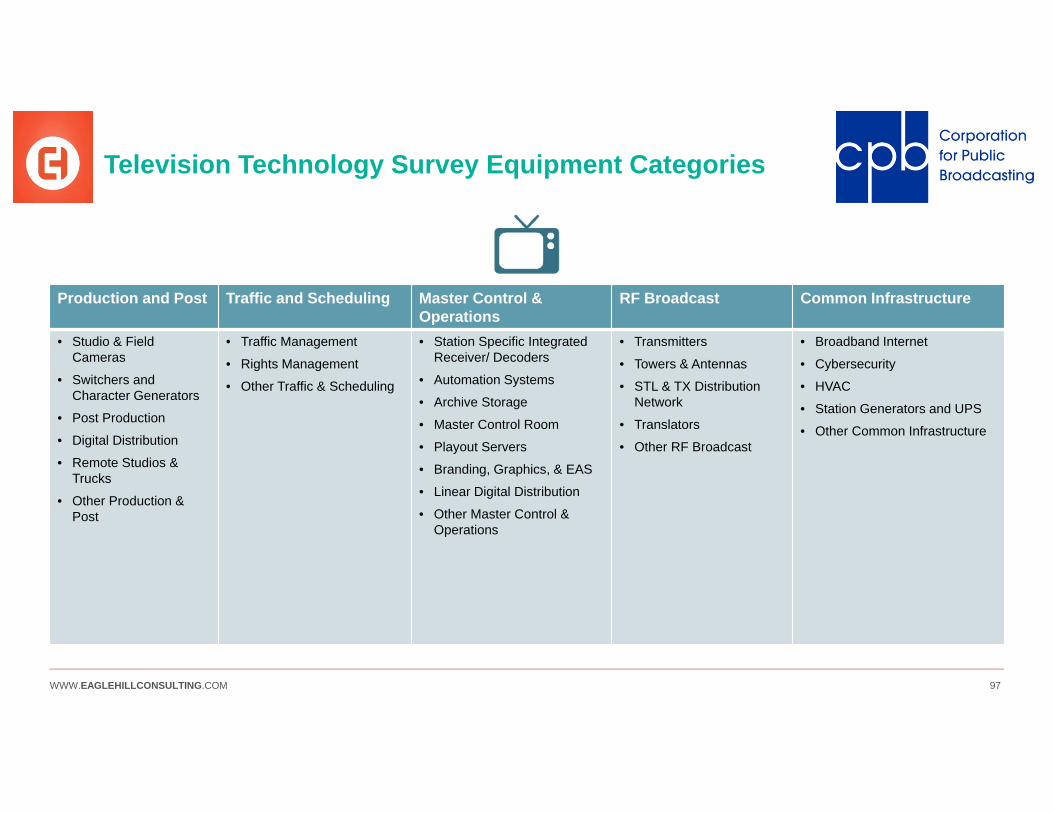
WWW.EAGLEHILLCONSULTING.COM 97
Television Technology Survey Equipment Categories
Production and Post Traffic and Scheduling Master Control & Operations
RF Broadcast Common Infrastructure
• Studio & Field Cameras
• Switchers and Character Generators
• Post Production
• Digital Distribution
• Remote Studios & Trucks
• Other Production & Post
• Traffic Management
• Rights Management
• Other Traffic & Scheduling
• Station Specific Integrated Receiver/ Decoders
• Automation Systems
• Archive Storage
• Master Control Room
• Playout Servers
• Branding, Graphics, & EAS
• Linear Digital Distribution
• Other Master Control & Operations
• Transmitters
• Towers & Antennas
• STL & TX Distribution Network
• Translators
• Other RF Broadcast
• Broadband Internet
• Cybersecurity
• HVAC
• Station Generators and UPS
• Other Common Infrastructure
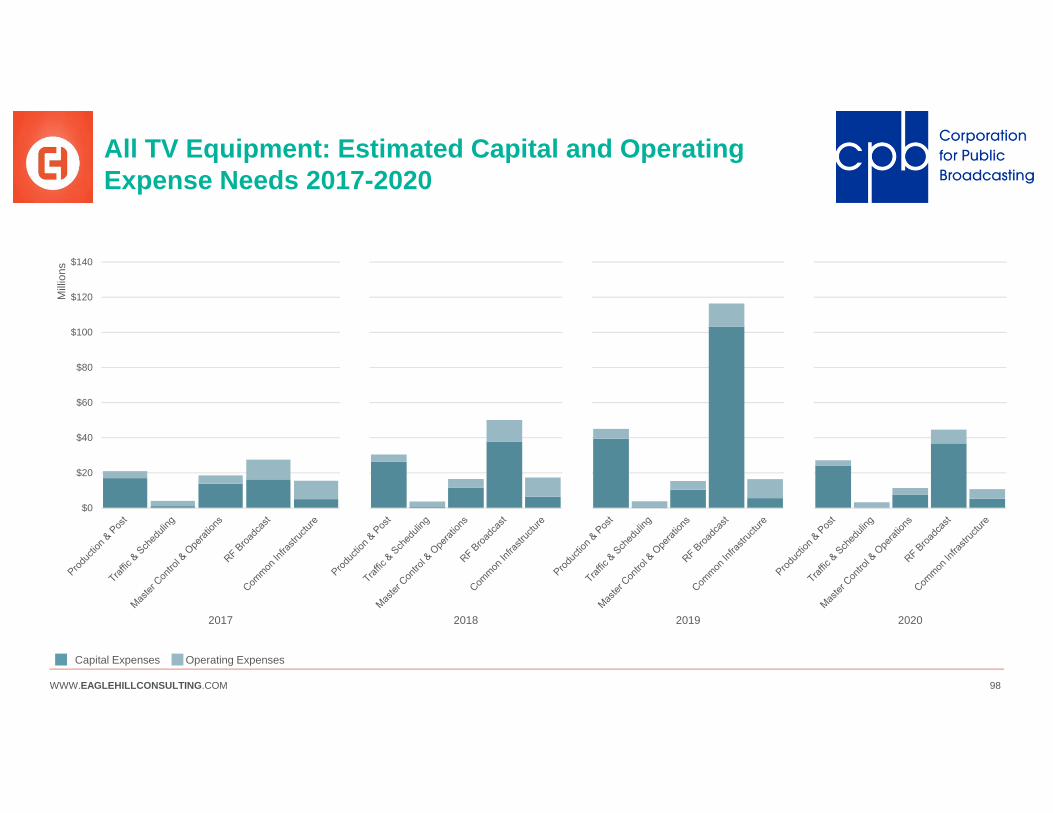
WWW.EAGLEHILLCONSULTING.COM 98
All TV Equipment: Estimated Capital and Operating Expense Needs 2017-2020
2020
$0
$20
$40
$60
$80
$100
$120
$140
Mill
ions
2017 2018 2019
Operating ExpensesCapital Expenses
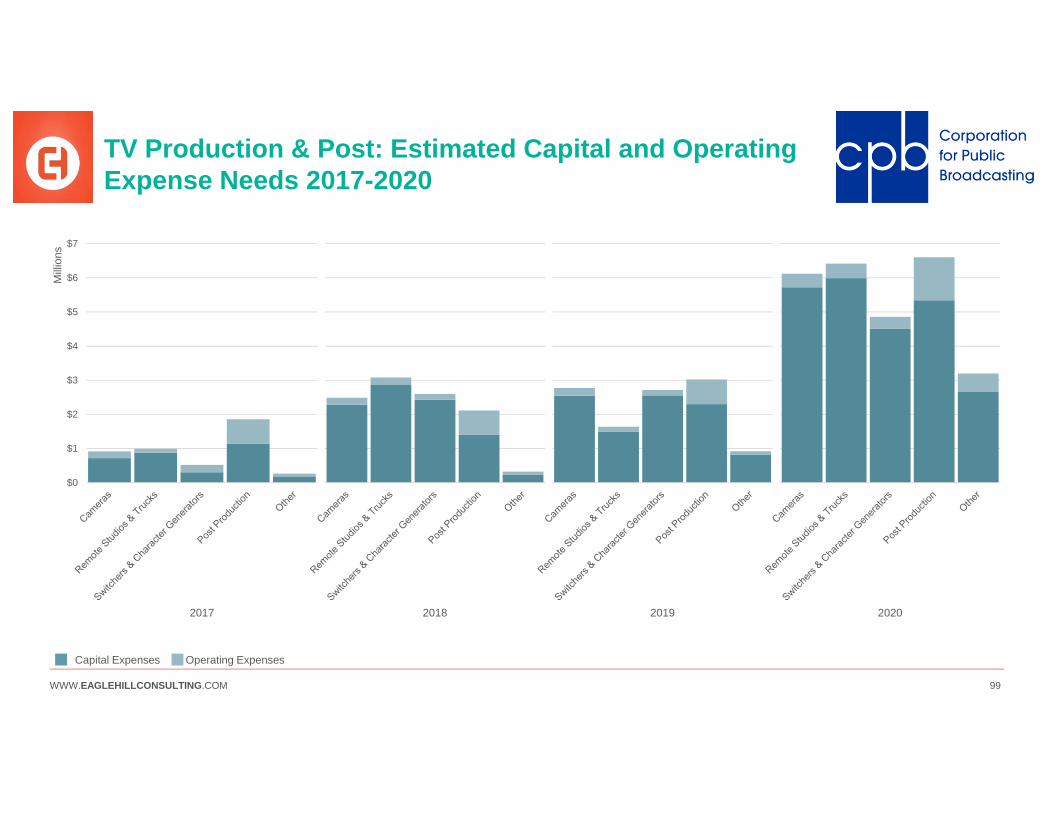
WWW.EAGLEHILLCONSULTING.COM 99
TV Production & Post: Estimated Capital and Operating Expense Needs 2017-2020
2020
$0
$1
$2
$3
$4
$5
$6
$7
Mill
ions
2017 2018 2019
Operating ExpensesCapital Expenses

WWW.EAGLEHILLCONSULTING.COM 100
TV Production & Post: Anticipated Replacements 2017-2027
0
50
100
150
200
250
2017 2018 2019 2020 2021 2022 2023 2024 2025 2026 2027
(# p
iece
s of
equ
ipm
ent)
Remote Studios*
0
50
100
150
200
250
2017 2018 2019 2020 2021 2022 2023 2024 2025 2026 2027
(# p
iece
s of
equ
ipm
ent)
Trucks
0
50
100
150
200
250
2017 2018 2019 2020 2021 2022 2023 2024 2025 2026 2027
(# p
iece
s of
equ
ipm
ent)
Character Generators
0
50
100
150
200
250
2017 2018 2019 2020 2021 2022 2023 2024 2025 2026 2027
(# p
iece
s of
equ
ipm
ent)
Switchers
* The 2017 spike in remote studios is driven by WIPR-TV’s purchase of 200 Strand Studio lights.
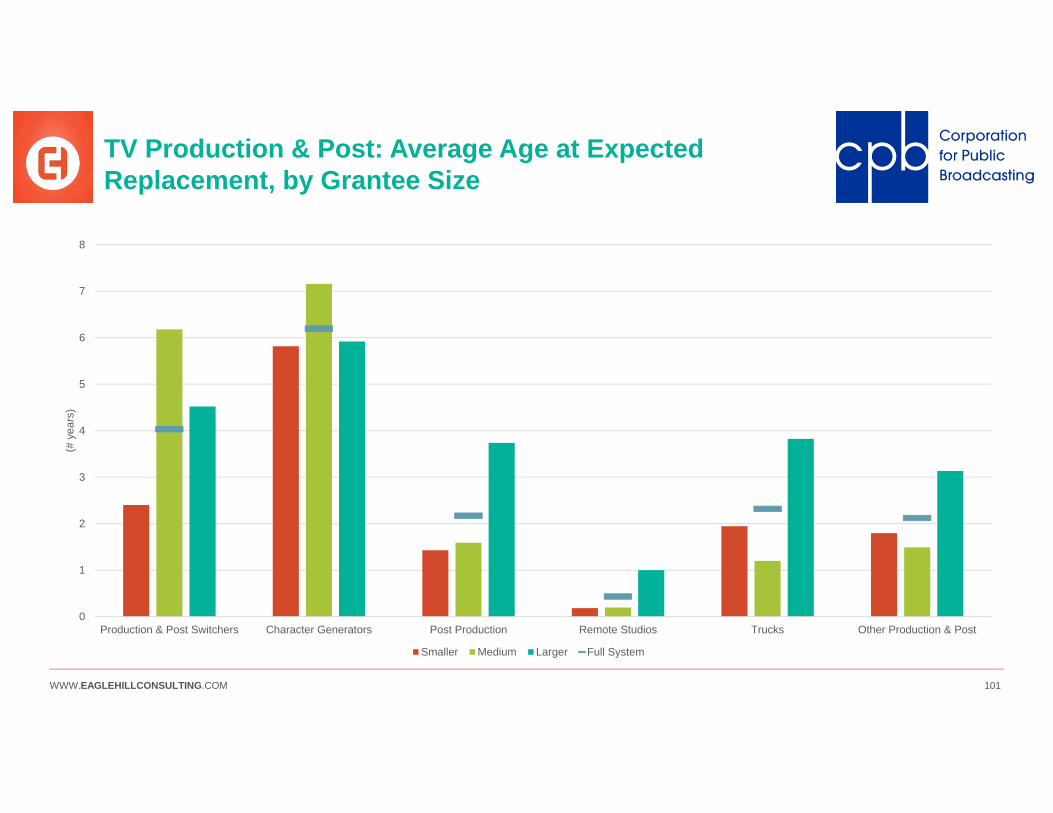
WWW.EAGLEHILLCONSULTING.COM 101
TV Production & Post: Average Age at Expected Replacement, by Grantee Size
0
1
2
3
4
5
6
7
8
Production & Post Switchers Character Generators Post Production Remote Studios Trucks Other Production & Post
(# y
ears
)
Smaller Medium Larger Full System
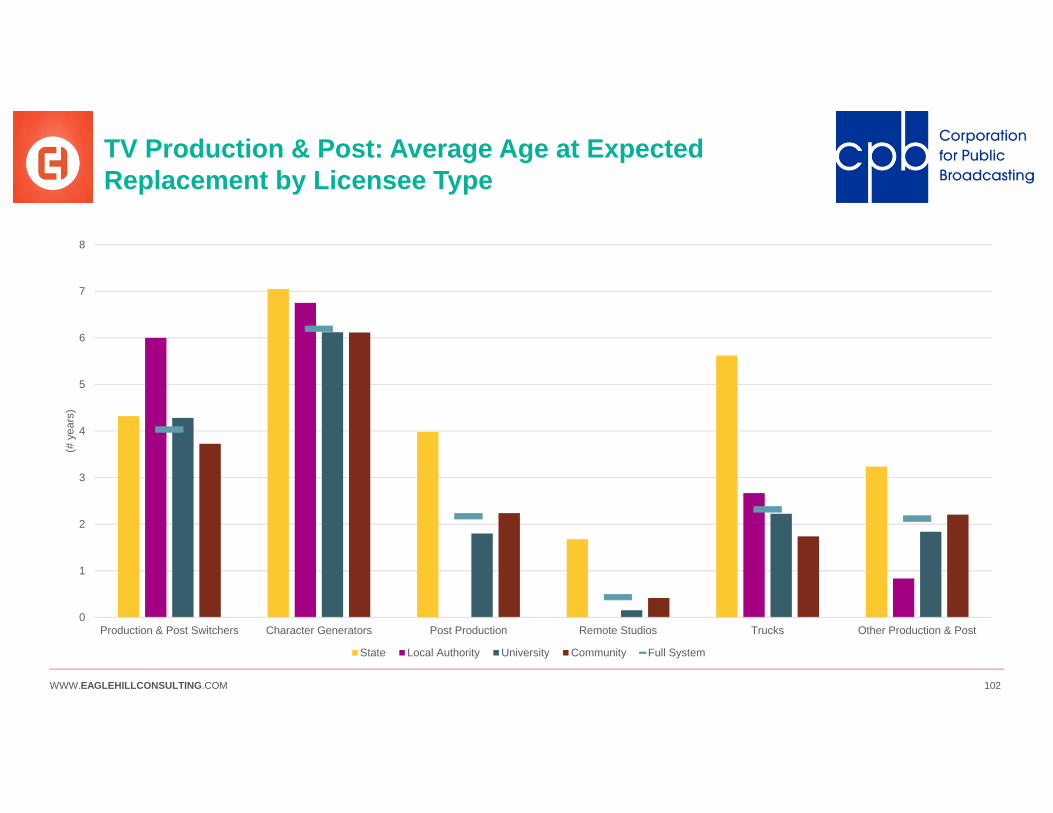
WWW.EAGLEHILLCONSULTING.COM 102
TV Production & Post: Average Age at Expected Replacement by Licensee Type
0
1
2
3
4
5
6
7
8
Production & Post Switchers Character Generators Post Production Remote Studios Trucks Other Production & Post
(# y
ears
)
State Local Authority University Community Full System
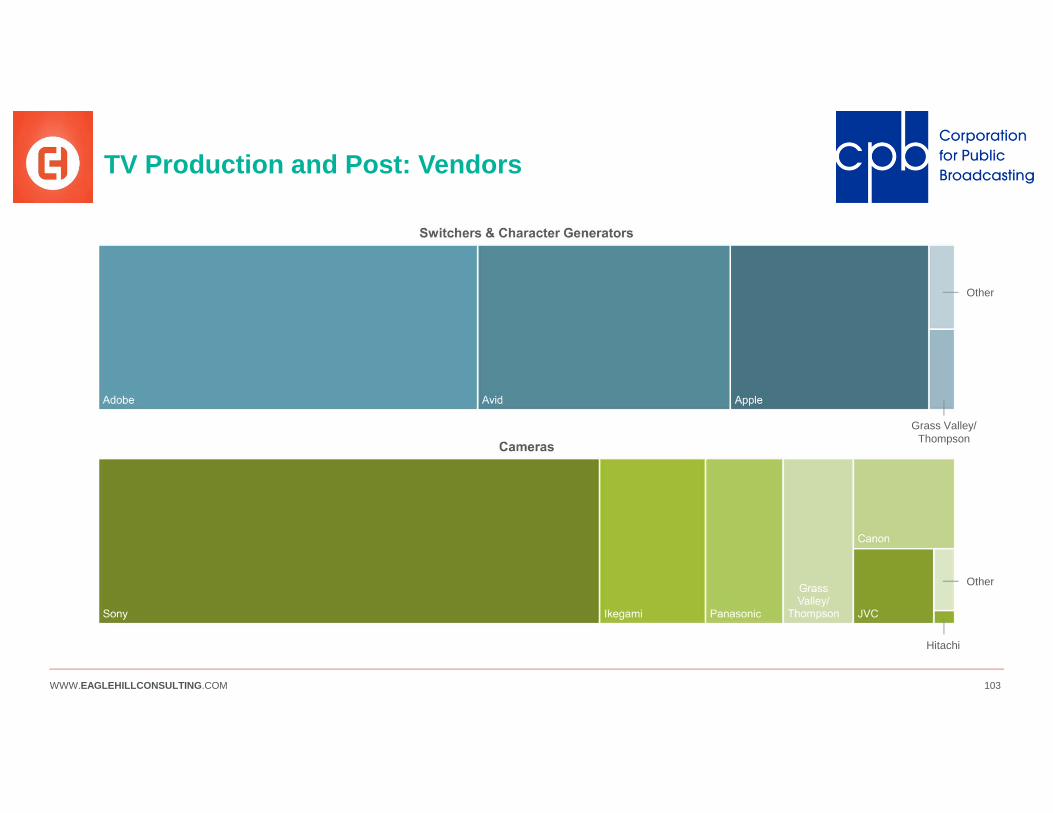
WWW.EAGLEHILLCONSULTING.COM 103
TV Production and Post: Vendors
Hitachi
Other
Grass Valley/ Thompson
Other
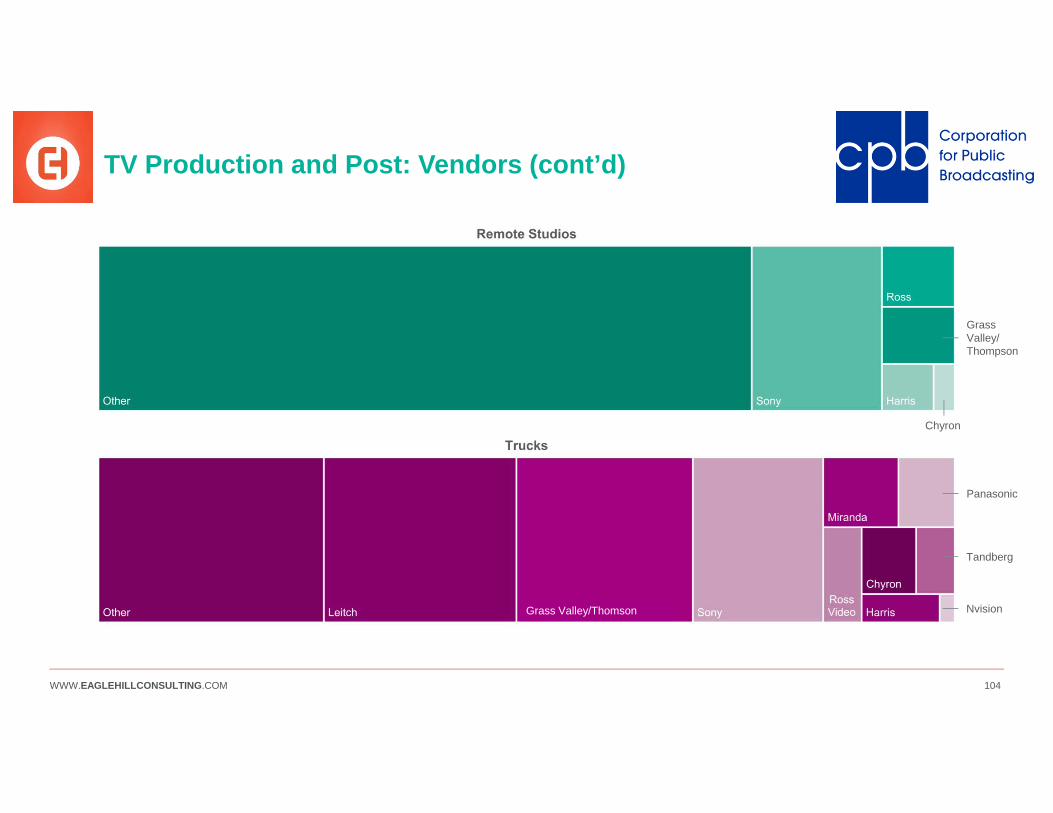
WWW.EAGLEHILLCONSULTING.COM 104
TV Production and Post: Vendors (cont’d)
Chyron
Grass Valley/ Thompson
Panasonic
Tandberg
NvisionGrass Valley/Thomson

WWW.EAGLEHILLCONSULTING.COM 105
TV Traffic & Scheduling: Estimated Capital and Operating Expense Needs 2017-2020
Traffic & Rights Other2020
$0
$1
$1
$2
$2
$3
$3
$4
$4
Traffic & Rights Other
Mill
ions
2017Traffic & Rights Other
2018Traffic & Rights Other
2019
Operating ExpensesCapital Expenses
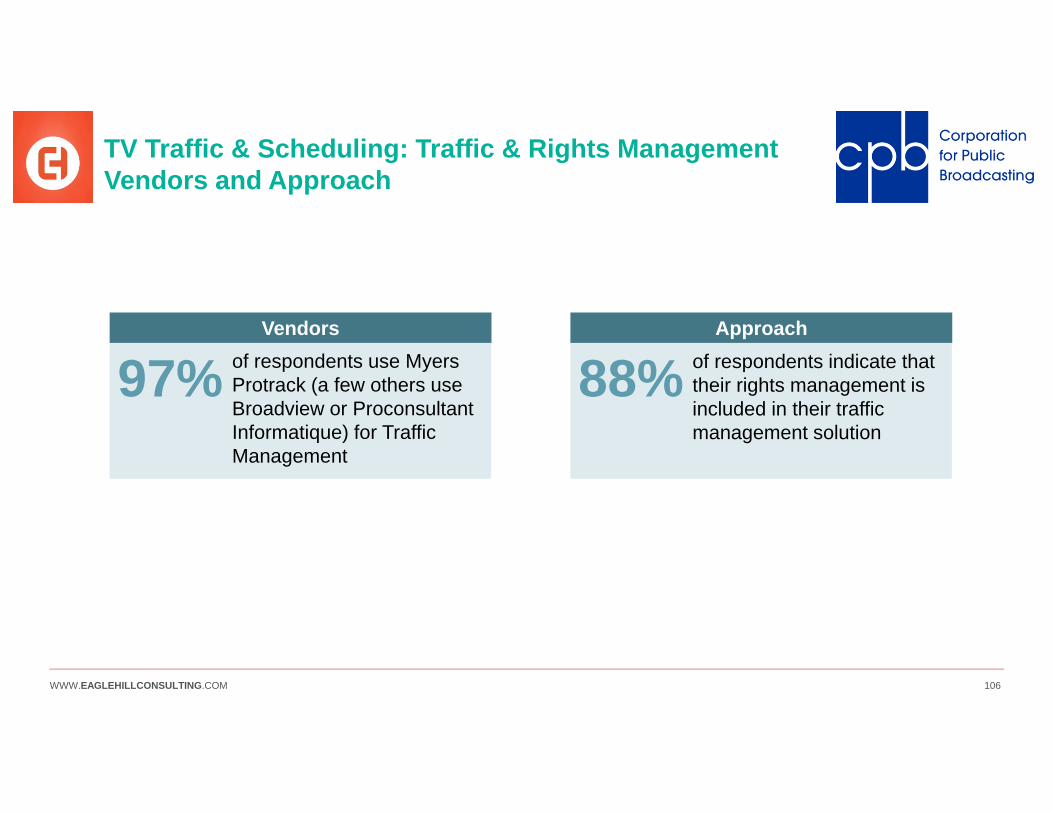
WWW.EAGLEHILLCONSULTING.COM 106
TV Traffic & Scheduling: Traffic & Rights Management Vendors and Approach
97% of respondents use Myers Protrack (a few others use Broadview or Proconsultant Informatique) for Traffic Management
88% of respondents indicate that their rights management is included in their traffic management solution
Vendors Approach
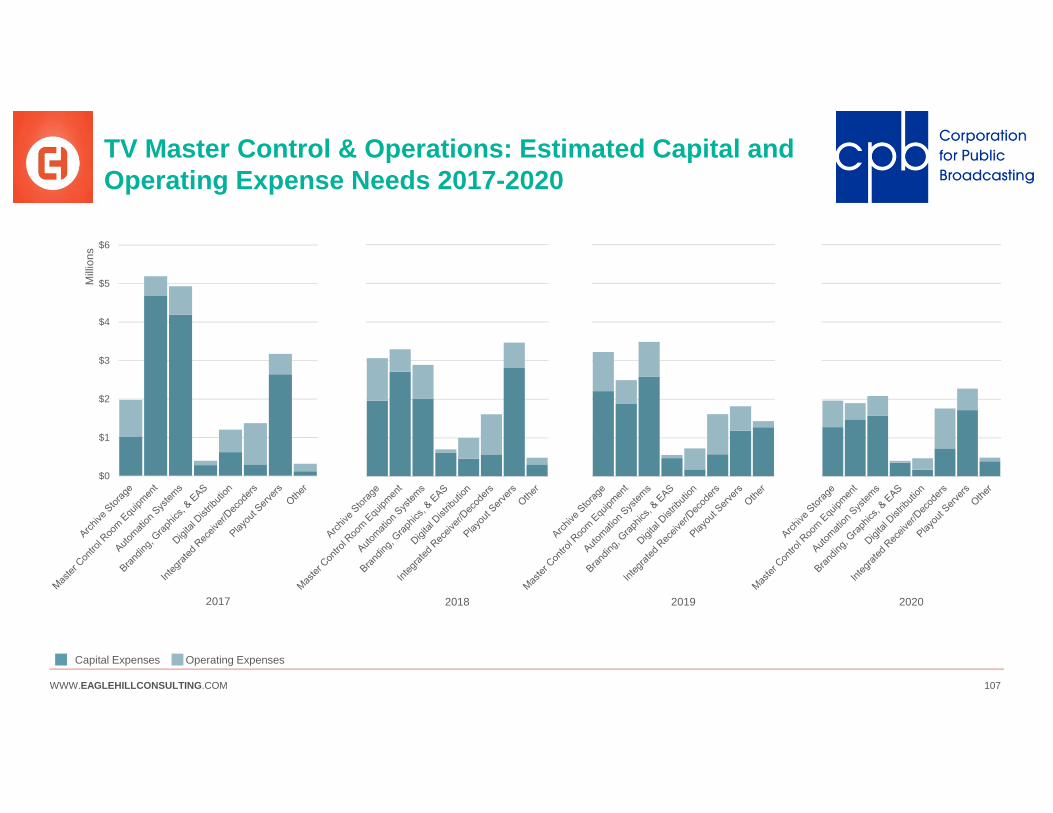
WWW.EAGLEHILLCONSULTING.COM 107
TV Master Control & Operations: Estimated Capital and Operating Expense Needs 2017-2020
2020
$0
$1
$2
$3
$4
$5
$6
Mill
ions
2017 2018 2019
Operating ExpensesCapital Expenses
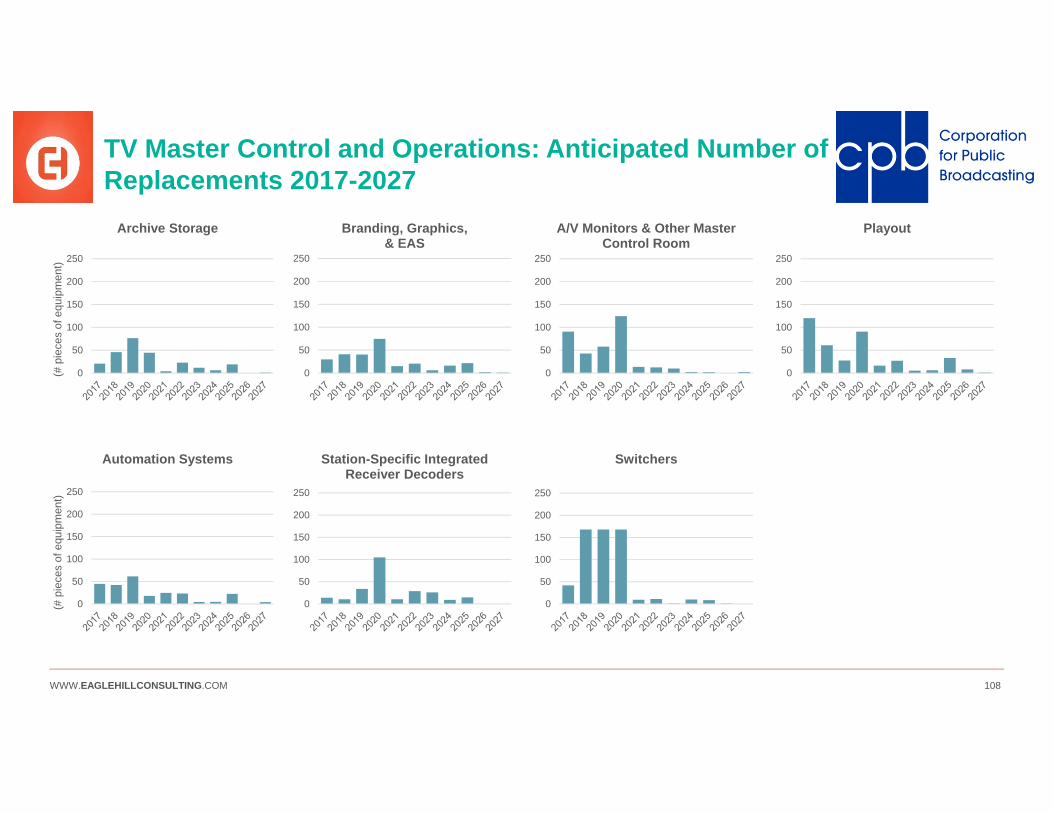
WWW.EAGLEHILLCONSULTING.COM 108
TV Master Control and Operations: Anticipated Number of Replacements 2017-2027
0
50
100
150
200
250
(# p
iece
s of
equ
ipm
ent)
Archive Storage
0
50
100
150
200
250
Branding, Graphics, & EAS
0
50
100
150
200
250
A/V Monitors & Other Master Control Room
0
50
100
150
200
250
Playout
0
50
100
150
200
250
(# p
iece
s of
equ
ipm
ent)
Automation Systems
0
50
100
150
200
250
Station-Specific Integrated Receiver Decoders
0
50
100
150
200
250
Switchers
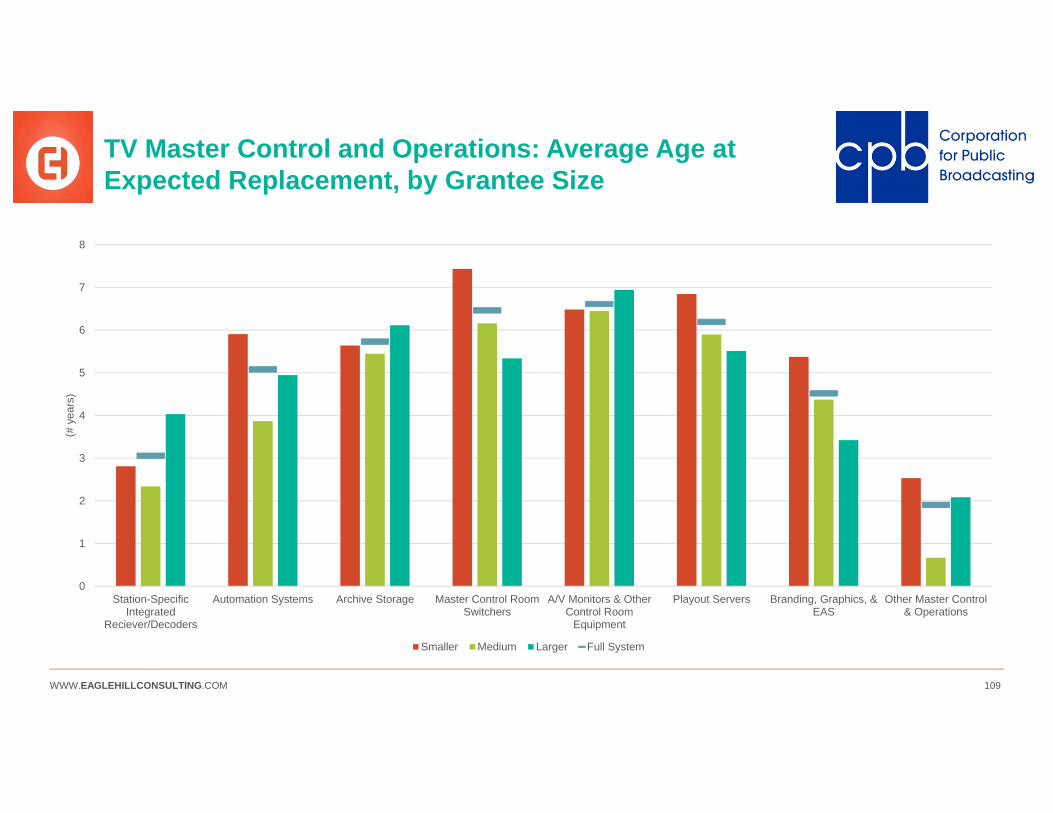
WWW.EAGLEHILLCONSULTING.COM 109
TV Master Control and Operations: Average Age at Expected Replacement, by Grantee Size
0
1
2
3
4
5
6
7
8
Station-SpecificIntegrated
Reciever/Decoders
Automation Systems Archive Storage Master Control RoomSwitchers
A/V Monitors & OtherControl Room
Equipment
Playout Servers Branding, Graphics, &EAS
Other Master Control& Operations
(# y
ears
)
Smaller Medium Larger Full System

WWW.EAGLEHILLCONSULTING.COM 110
TV Master Control and Operations: Average Age at Expected Replacement, by Licensee Type
0
2
4
6
8
10
12
Station-SpecificIntegrated
Reciever/Decoders
Automation Systems Archive Storage Master Control RoomSwitchers
A/V Monitors & OtherControl Room
Equipment
Playout Servers Branding, Graphics, &EAS
Other Master Control& Operations
(# y
ears
)
State Local Authority University Community Full System

WWW.EAGLEHILLCONSULTING.COM 111
TV Master Control and Operations: Vendors
Integrated Receiver/ Decoders (IRD) Vendors Branding, Graphics, & EAS Vendors Third Party Digital Distribution VendorsAdtec Adobe Alaska CommunicationsAteme Avid AmazonBitlink Broadstream BrightcoveCinegy Chyron CenturyLinkCisco DASDEC ComcastDirectTV Digital Alert Systems COVEDish Network DTP Digital Convergence AllianceDVB Evertz DirecTVEricson Gorman Redlidge DishTVFujitsu GrassValley/Thompson FacebookGeneral Instrument Harmonic FastserveHarmonic Omneon GoogleHeartland Video Systems Harris Live StreamImagine Imagine Communications OPBImmedia Leitch OVEELive Time Net Miranda PBSLTN Monroe SpectrumMotorola Orad TVWNHK PIxel Power UstreamPower Vu RGB Networks U-VaultSencore Ross Video VerizonTandberg Sage WestelcomUpCom TFT WHRO
Utah WowzaUtah Scientific YouTubeVizRT
* Denotes major vendor
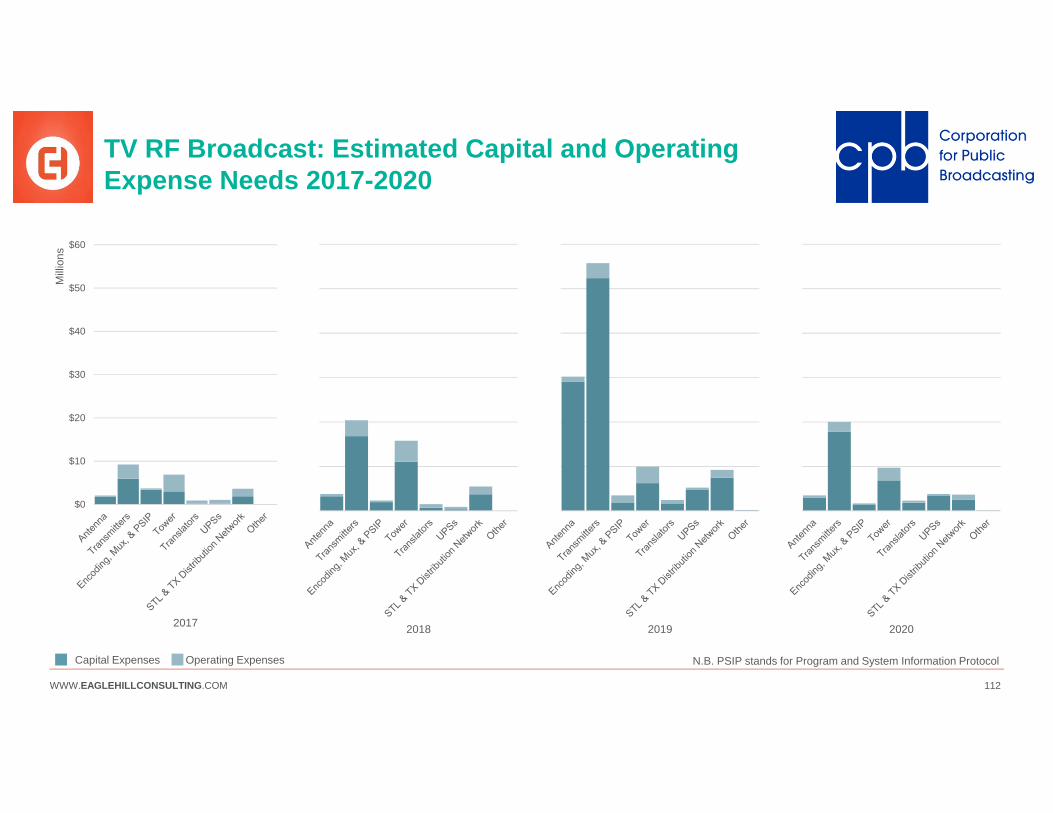
WWW.EAGLEHILLCONSULTING.COM 112
TV RF Broadcast: Estimated Capital and Operating Expense Needs 2017-2020
Operating ExpensesCapital Expenses
2020
$0
$10
$20
$30
$40
$50
$60
Mill
ions
2017 2018 2019
N.B. PSIP stands for Program and System Information Protocol
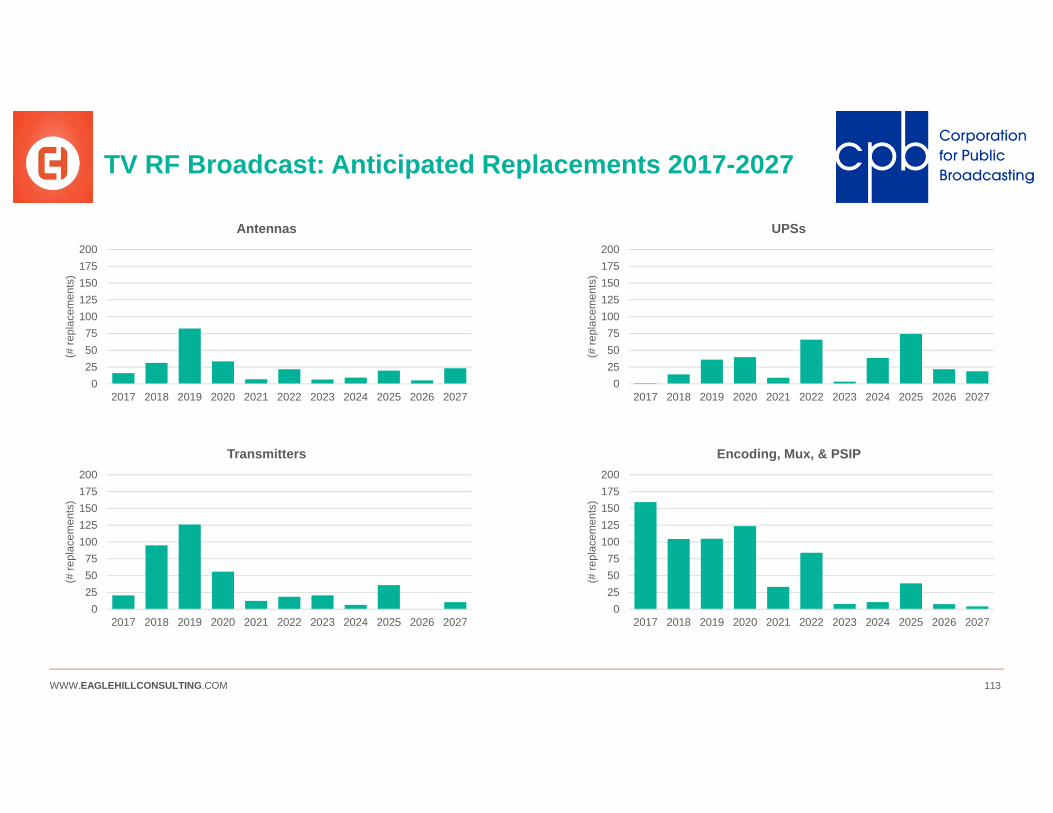
WWW.EAGLEHILLCONSULTING.COM 113
TV RF Broadcast: Anticipated Replacements 2017-2027
0255075
100125150175200
2017 2018 2019 2020 2021 2022 2023 2024 2025 2026 2027
(# re
plac
emen
ts)
Antennas
0255075
100125150175200
2017 2018 2019 2020 2021 2022 2023 2024 2025 2026 2027
(# re
plac
emen
ts)
UPSs
0255075
100125150175200
2017 2018 2019 2020 2021 2022 2023 2024 2025 2026 2027
(# re
plac
emen
ts)
Transmitters
0255075
100125150175200
2017 2018 2019 2020 2021 2022 2023 2024 2025 2026 2027
(# re
plac
emen
ts)
Encoding, Mux, & PSIP
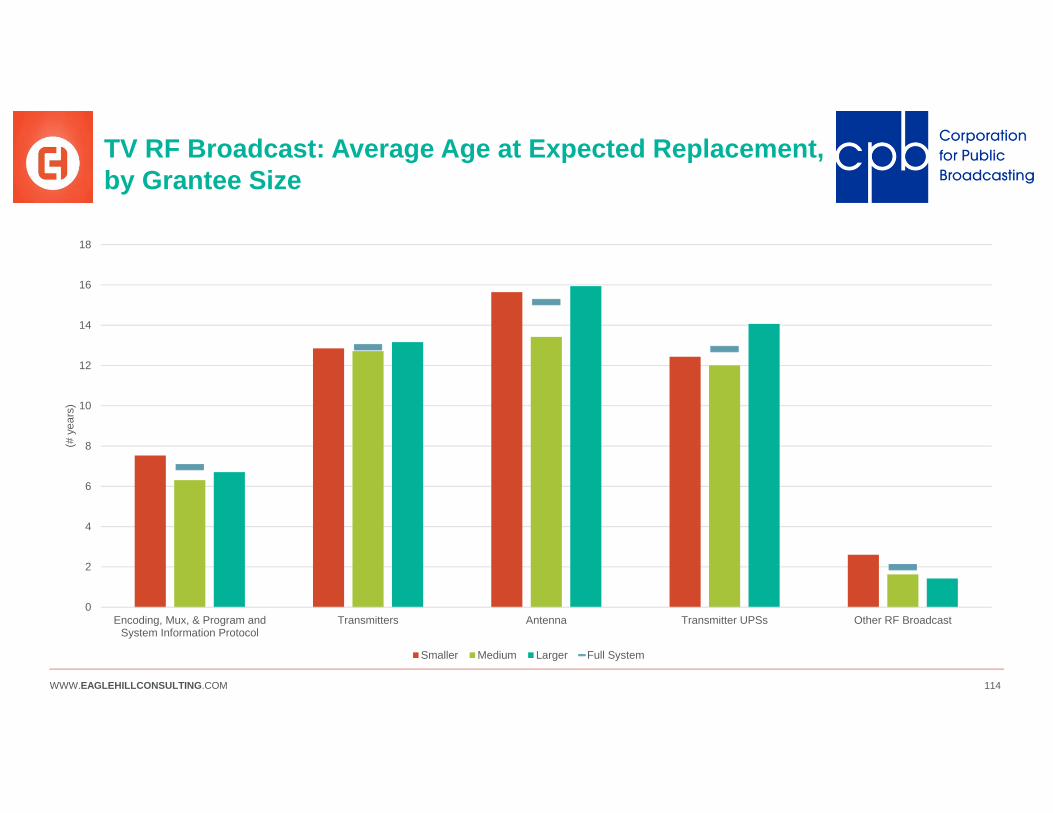
WWW.EAGLEHILLCONSULTING.COM 114
TV RF Broadcast: Average Age at Expected Replacement, by Grantee Size
0
2
4
6
8
10
12
14
16
18
Encoding, Mux, & Program andSystem Information Protocol
Transmitters Antenna Transmitter UPSs Other RF Broadcast
(# y
ears
)
Smaller Medium Larger Full System

WWW.EAGLEHILLCONSULTING.COM 115
TV RF Broadcast: Average age at Expected Replacement, by Licensee Type
0
2
4
6
8
10
12
14
16
18
Encoding, Mux, & Program andSystem Information Protocol
Transmitters Antenna Transmitter UPSs Other RF Broadcast
(# y
ears
)
State Local Authority University Community Full System
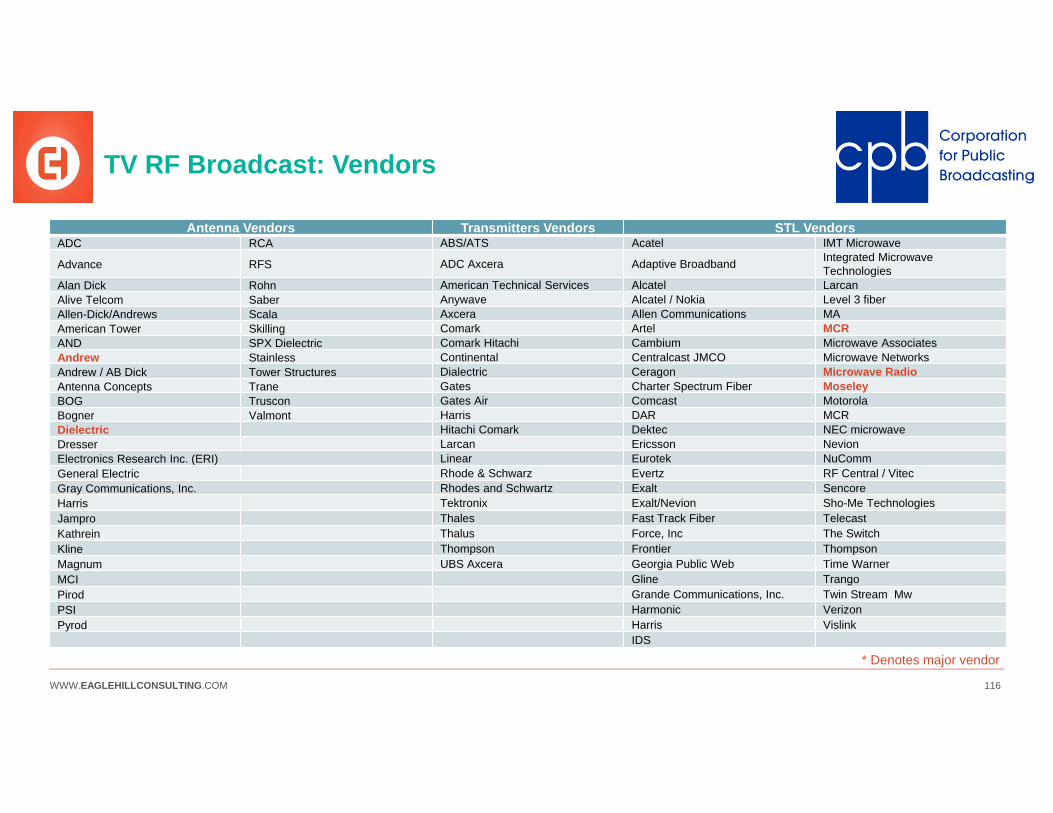
WWW.EAGLEHILLCONSULTING.COM 116
TV RF Broadcast: Vendors
* Denotes major vendor
Antenna Vendors Transmitters Vendors STL VendorsADC RCA ABS/ATS Acatel IMT Microwave
Advance RFS ADC Axcera Adaptive Broadband Integrated Microwave Technologies
Alan Dick Rohn American Technical Services Alcatel LarcanAlive Telcom Saber Anywave Alcatel / Nokia Level 3 fiberAllen-Dick/Andrews Scala Axcera Allen Communications MAAmerican Tower Skilling Comark Artel MCRAND SPX Dielectric Comark Hitachi Cambium Microwave AssociatesAndrew Stainless Continental Centralcast JMCO Microwave NetworksAndrew / AB Dick Tower Structures Dialectric Ceragon Microwave RadioAntenna Concepts Trane Gates Charter Spectrum Fiber MoseleyBOG Truscon Gates Air Comcast MotorolaBogner Valmont Harris DAR MCRDielectric Hitachi Comark Dektec NEC microwaveDresser Larcan Ericsson NevionElectronics Research Inc. (ERI) Linear Eurotek NuCommGeneral Electric Rhode & Schwarz Evertz RF Central / VitecGray Communications, Inc. Rhodes and Schwartz Exalt SencoreHarris Tektronix Exalt/Nevion Sho-Me TechnologiesJampro Thales Fast Track Fiber TelecastKathrein Thalus Force, Inc The SwitchKline Thompson Frontier ThompsonMagnum UBS Axcera Georgia Public Web Time WarnerMCI Gline TrangoPirod Grande Communications, Inc. Twin Stream MwPSI Harmonic VerizonPyrod Harris Vislink
IDS

WWW.EAGLEHILLCONSULTING.COM 117
TV Common Infrastructure: Estimated Capital and Operating Expense Needs 2017-2020
2020
$0
$1
$2
$3
$4
$5
$6
$7
$8
$9
$10
Mill
ions
2017 2018 2019
Operating ExpensesCapital Expenses
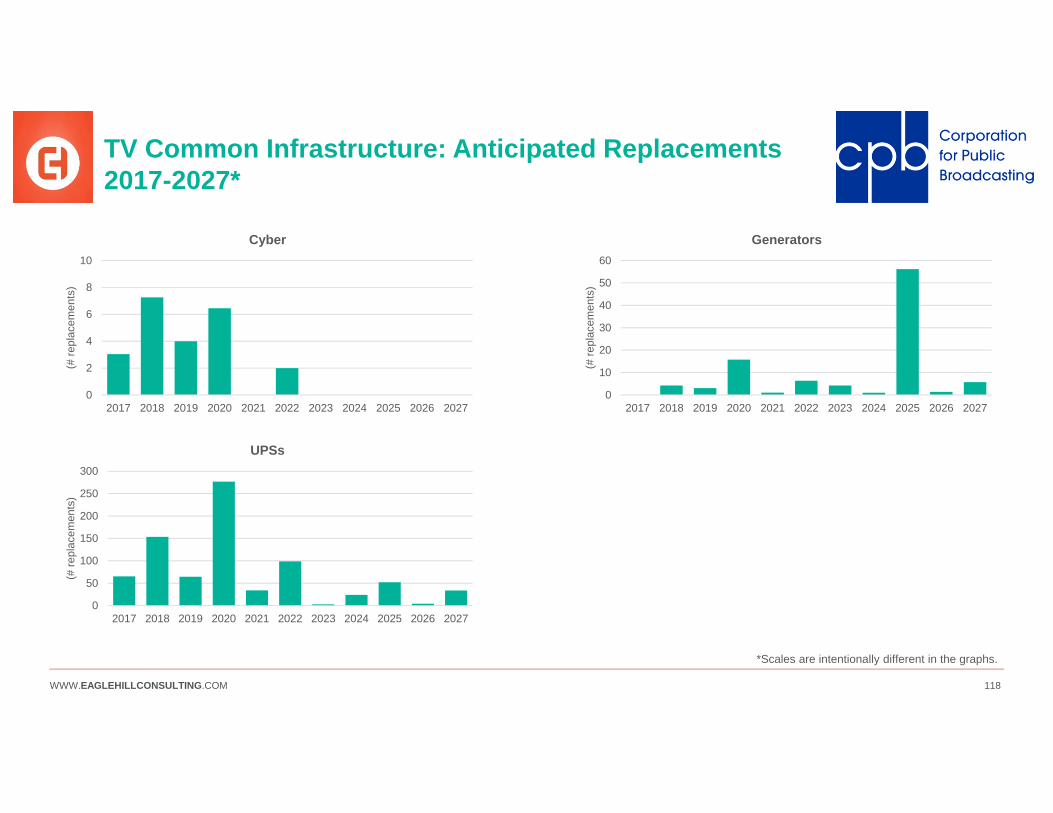
WWW.EAGLEHILLCONSULTING.COM 118
TV Common Infrastructure: Anticipated Replacements 2017-2027*
0
2
4
6
8
10
2017 2018 2019 2020 2021 2022 2023 2024 2025 2026 2027
(# re
plac
emen
ts)
Cyber
0
10
20
30
40
50
60
2017 2018 2019 2020 2021 2022 2023 2024 2025 2026 2027
(# re
plac
emen
ts)
Generators
0
50
100
150
200
250
300
2017 2018 2019 2020 2021 2022 2023 2024 2025 2026 2027
(# re
plac
emen
ts)
UPSs
*Scales are intentionally different in the graphs.
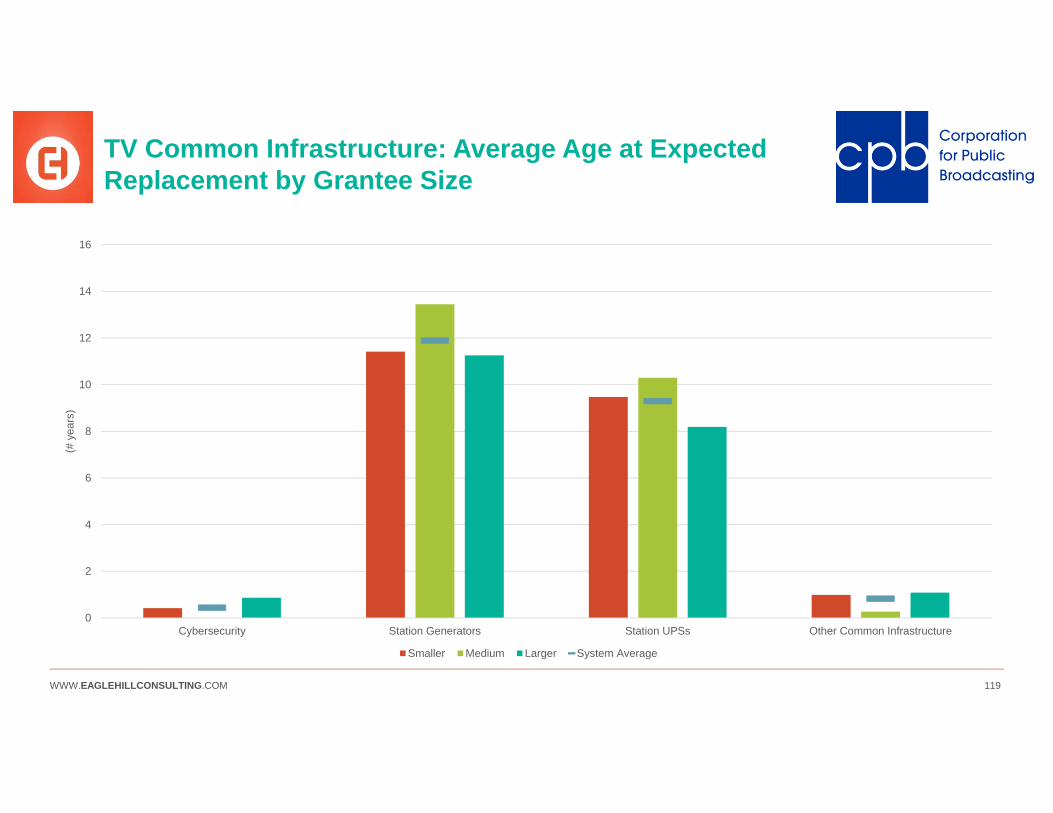
WWW.EAGLEHILLCONSULTING.COM 119
TV Common Infrastructure: Average Age at Expected Replacement by Grantee Size
0
2
4
6
8
10
12
14
16
Cybersecurity Station Generators Station UPSs Other Common Infrastructure
(# y
ears
)
Smaller Medium Larger System Average
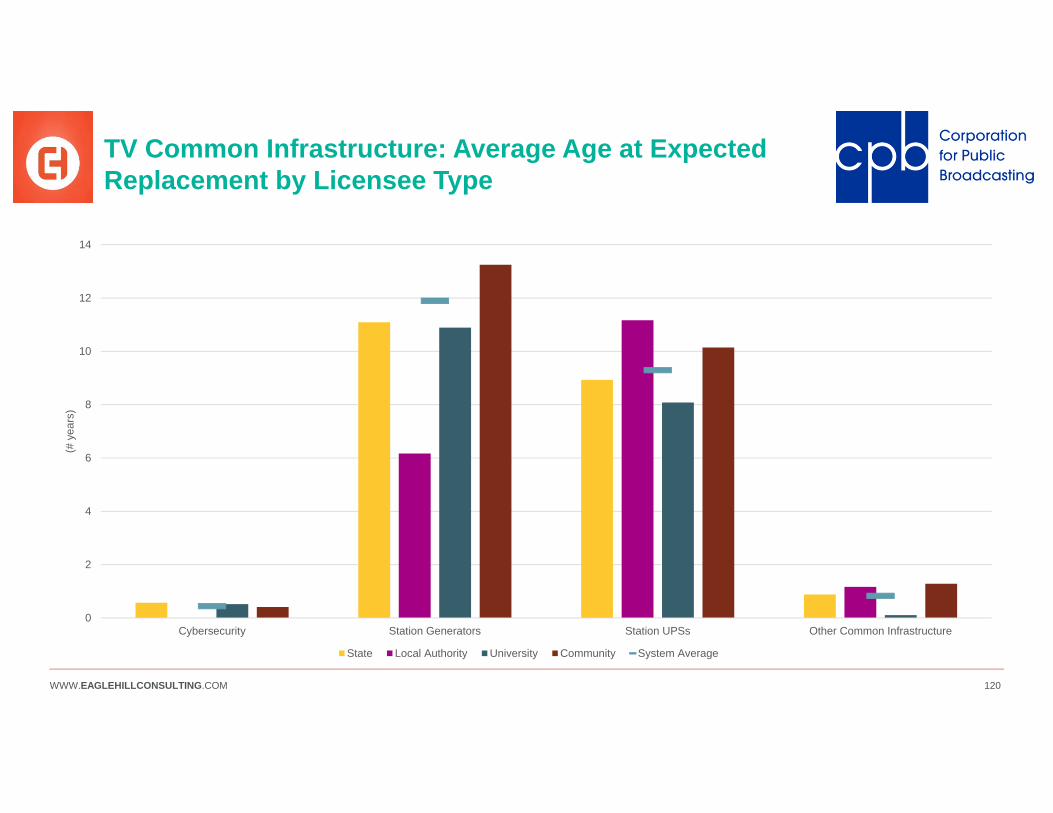
WWW.EAGLEHILLCONSULTING.COM 120
TV Common Infrastructure: Average Age at Expected Replacement by Licensee Type
0
2
4
6
8
10
12
14
Cybersecurity Station Generators Station UPSs Other Common Infrastructure
(# y
ears
)
State Local Authority University Community System Average
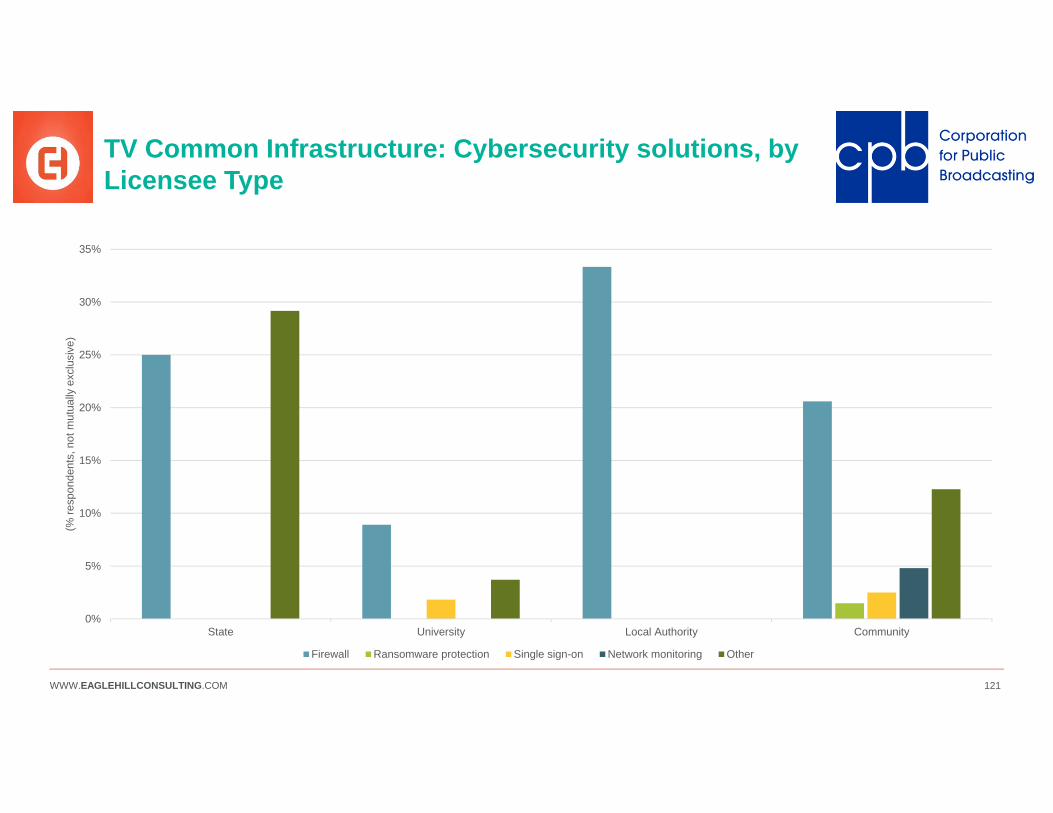
WWW.EAGLEHILLCONSULTING.COM 121
TV Common Infrastructure: Cybersecurity solutions, by Licensee Type
0%
5%
10%
15%
20%
25%
30%
35%
State University Local Authority Community
(% re
spon
dent
s, n
ot m
utua
lly e
xclu
sive
)
Firewall Ransomware protection Single sign-on Network monitoring Other

WWW.EAGLEHILLCONSULTING.COM 122
TV Common Infrastructure: Cybersecurity vendors
Cybersecurity Vendors
Applied Trust Norton
Astaro Okta
BAE Systems Qualsys
Checkpoint Raytheon
Cisco Service
Cloud Watcher Sky High
Dell SonicWall
Fortinet Sophos
GFI Splunk
Ideal Integrators Symantec
i-Evolve Technology Services Trustwave
Juniper Watchguard
Malware Webroot
MicroTik
NetGate
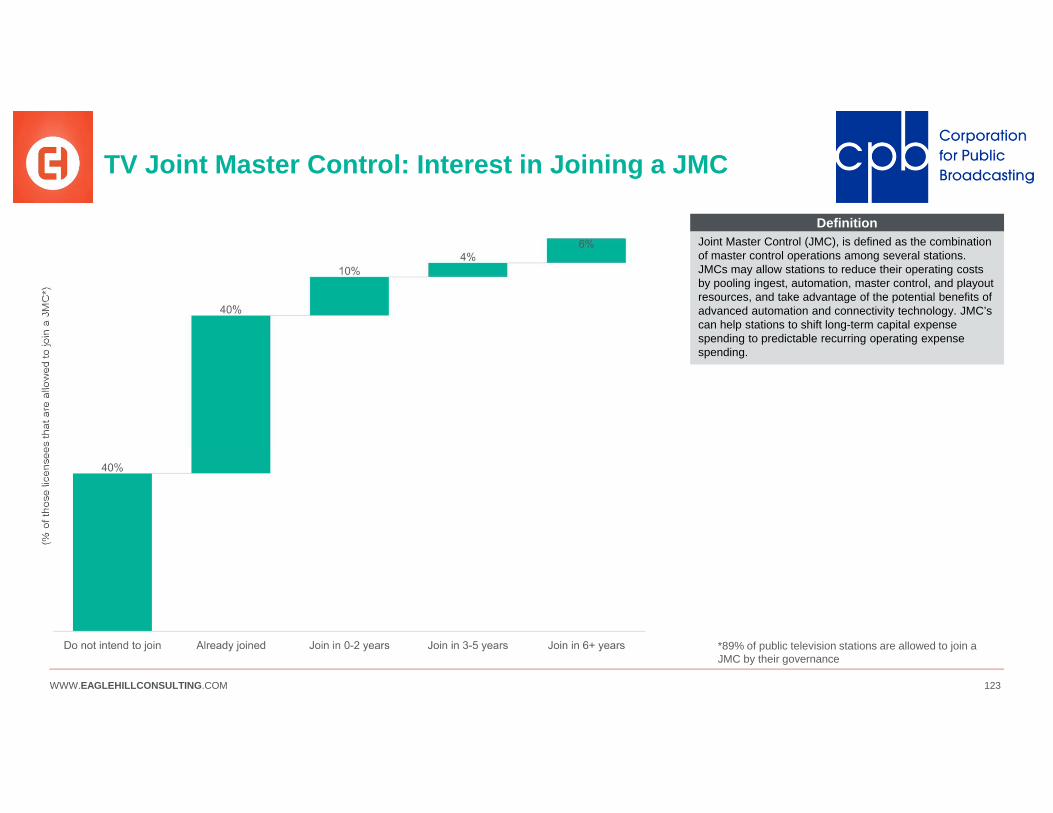
WWW.EAGLEHILLCONSULTING.COM 123
TV Joint Master Control: Interest in Joining a JMC
Joint Master Control (JMC), is defined as the combination of master control operations among several stations. JMCs may allow stations to reduce their operating costs by pooling ingest, automation, master control, and playout resources, and take advantage of the potential benefits of advanced automation and connectivity technology. JMC’s can help stations to shift long-term capital expense spending to predictable recurring operating expense spending.
*89% of public television stations are allowed to join a JMC by their governance
(% o
f tho
se li
cens
ees
that
are
allo
wed
to jo
in a
JM
C*)
Definition
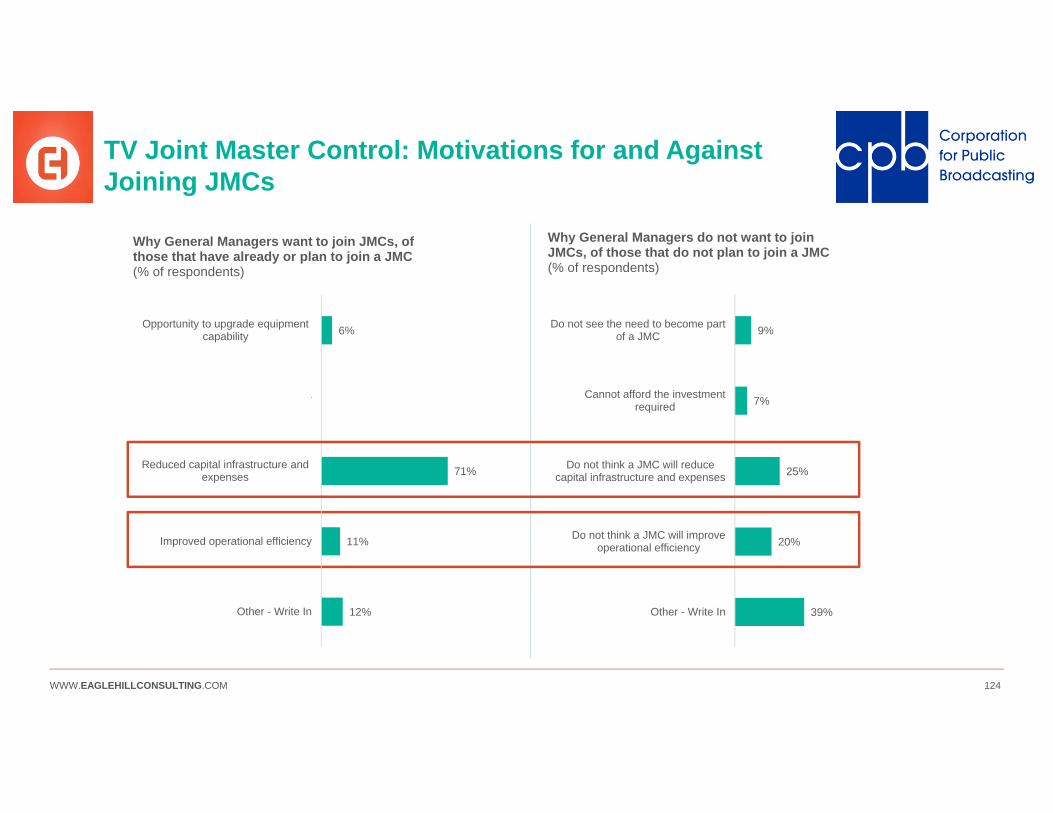
WWW.EAGLEHILLCONSULTING.COM 124
TV Joint Master Control: Motivations for and Against Joining JMCs
39%
20%
25%
7%
9%
Other - Write In
Do not think a JMC will improveoperational efficiency
Do not think a JMC will reducecapital infrastructure and expenses
Cannot afford the investmentrequired
Do not see the need to become partof a JMC
Why General Managers do not want to join JMCs, of those that do not plan to join a JMC(% of respondents)
12%
11%
71%
0%
6%
Other - Write In
Improved operational efficiency
Reduced capital infrastructure andexpenses
aaaaaaaaaaaaaaaaaaaaaaaaaaaaaaaaaaaaaaaaaaaaaaaaa
Opportunity to upgrade equipmentcapability
Why General Managers want to join JMCs, of those that have already or plan to join a JMC(% of respondents)
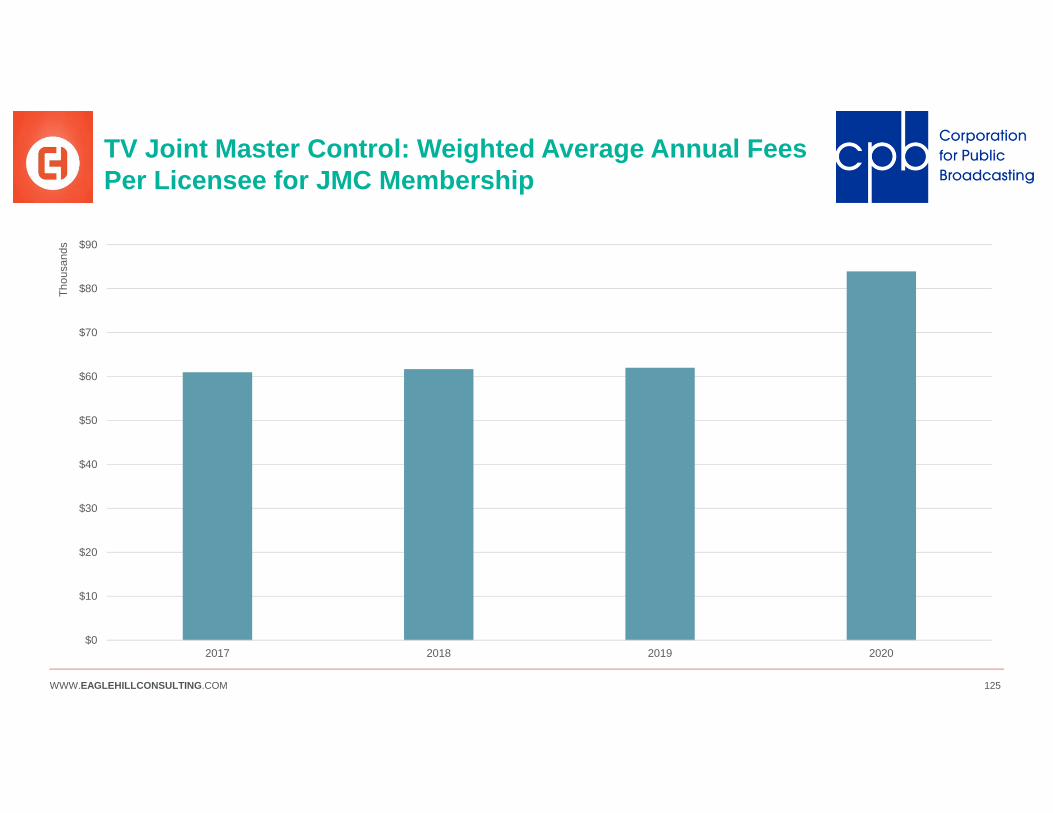
WWW.EAGLEHILLCONSULTING.COM 125
TV Joint Master Control: Weighted Average Annual Fees Per Licensee for JMC Membership
$0
$10
$20
$30
$40
$50
$60
$70
$80
$90
2017 2018 2019 2020
Thou
sand
s

WWW.EAGLEHILLCONSULTING.COM 126WWW.EAGLEHILLCONSULTING.COM 126
Radio Technology
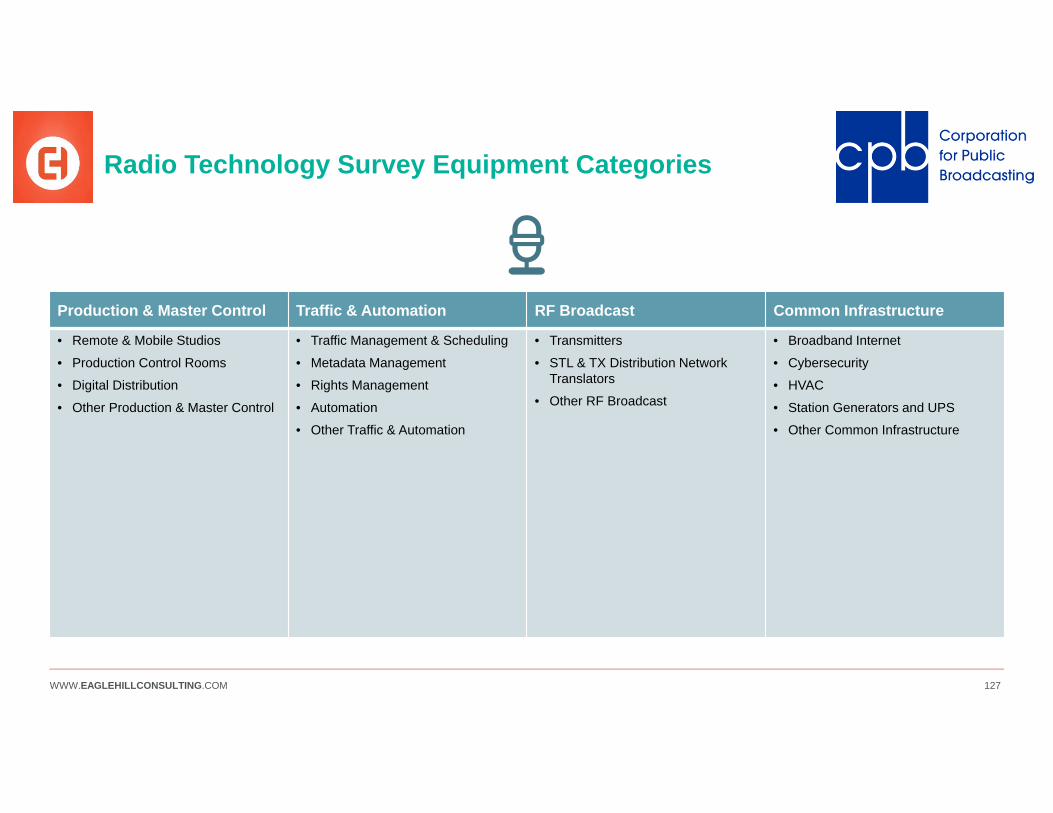
WWW.EAGLEHILLCONSULTING.COM 127
Radio Technology Survey Equipment Categories
Production & Master Control Traffic & Automation RF Broadcast Common Infrastructure
• Remote & Mobile Studios
• Production Control Rooms
• Digital Distribution
• Other Production & Master Control
• Traffic Management & Scheduling
• Metadata Management
• Rights Management
• Automation
• Other Traffic & Automation
• Transmitters
• STL & TX Distribution Network Translators
• Other RF Broadcast
• Broadband Internet
• Cybersecurity
• HVAC
• Station Generators and UPS
• Other Common Infrastructure
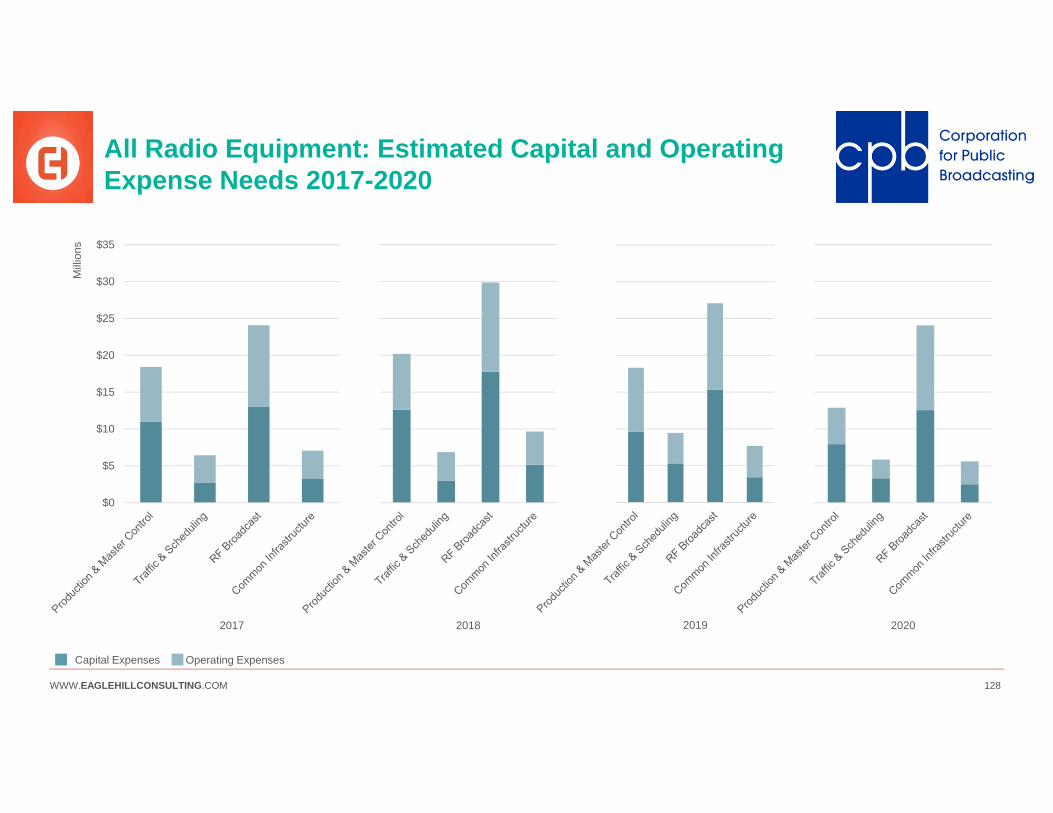
WWW.EAGLEHILLCONSULTING.COM 128
All Radio Equipment: Estimated Capital and Operating Expense Needs 2017-2020
2020
$0
$5
$10
$15
$20
$25
$30
$35
Mill
ions
2017 2018
Operating ExpensesCapital Expenses
2019
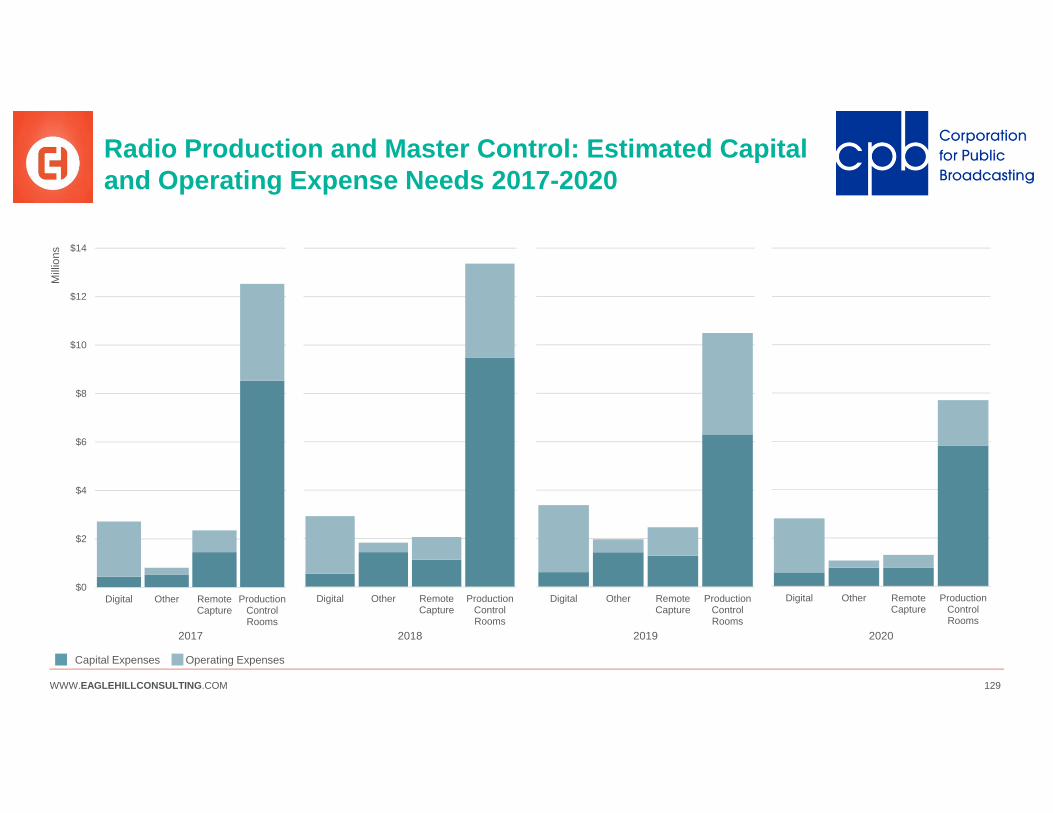
WWW.EAGLEHILLCONSULTING.COM 129
Radio Production and Master Control: Estimated Capital and Operating Expense Needs 2017-2020
Digital Other RemoteCapture
ProductionControlRooms
2020
$0
$2
$4
$6
$8
$10
$12
$14
Digital Other RemoteCapture
ProductionControlRooms
Mill
ions
2017
Digital Other RemoteCapture
ProductionControlRooms
2018
Digital Other RemoteCapture
ProductionControlRooms
2019
Operating ExpensesCapital Expenses

WWW.EAGLEHILLCONSULTING.COM 130
Radio Production and Master Control: Anticipated Replacements 2017-2027
0
100
200
300
400
500
600
700
800
900
1000
2017 2018 2019 2020 2021 2022 2023 2024 2025 2026 2027
(# p
iece
s of
equ
ipm
ent)
Production Control Rooms
0
100
200
300
400
500
600
700
800
900
1000
2017 2018 2019 2020 2021 2022 2023 2024 2025 2026 2027
(# p
iece
s of
equ
ipm
ent)
Remote & Mobile Studios
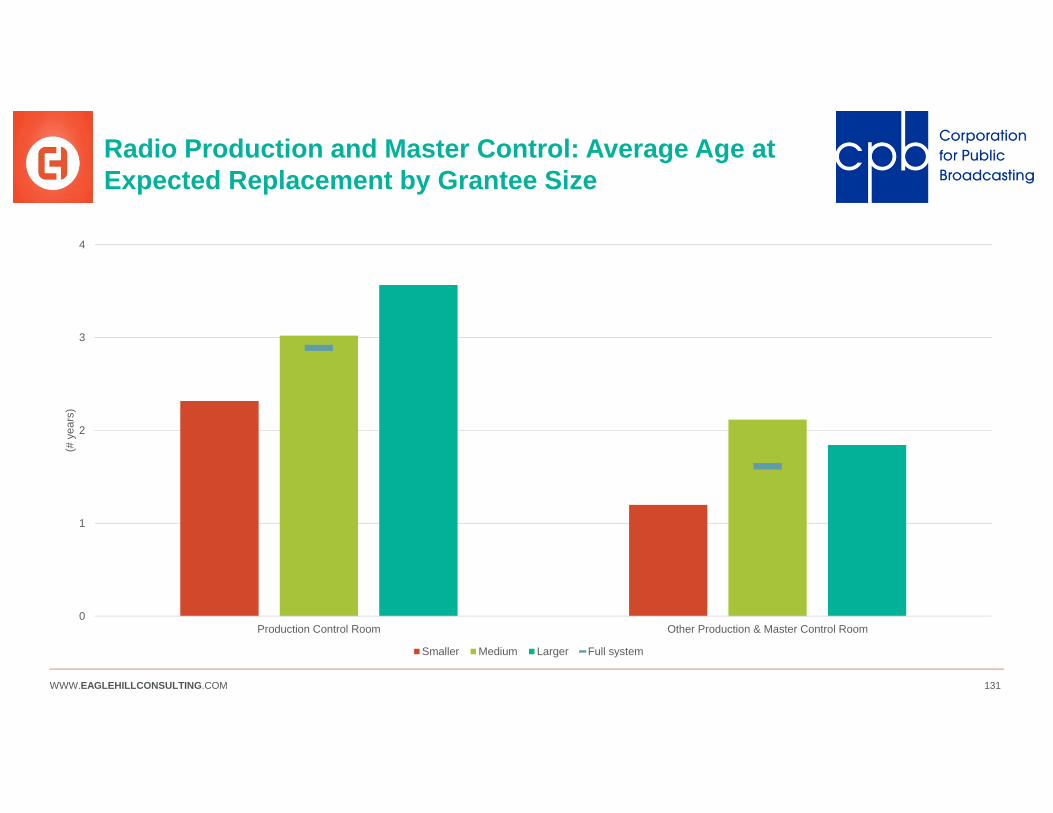
WWW.EAGLEHILLCONSULTING.COM 131
Radio Production and Master Control: Average Age at Expected Replacement by Grantee Size
0
1
2
3
4
Production Control Room Other Production & Master Control Room
(# y
ears
)
Smaller Medium Larger Full system
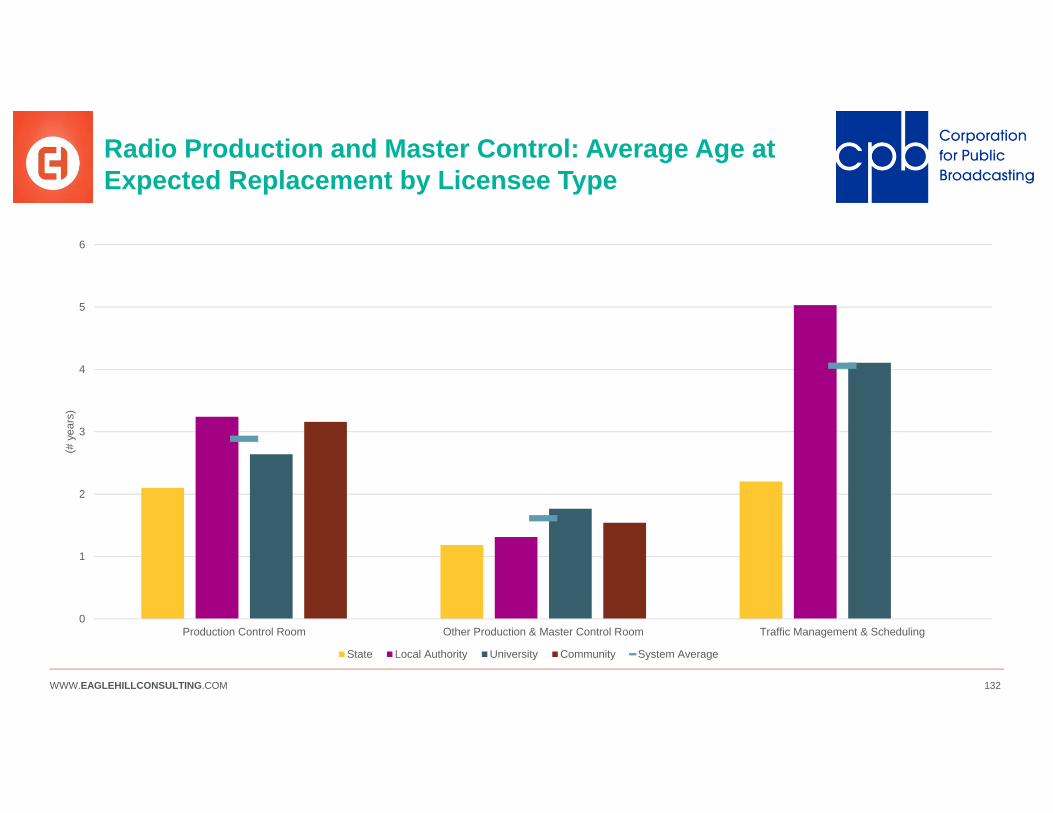
WWW.EAGLEHILLCONSULTING.COM 132
Radio Production and Master Control: Average Age at Expected Replacement by Licensee Type
0
1
2
3
4
5
6
Production Control Room Other Production & Master Control Room Traffic Management & Scheduling
(# y
ears
)
State Local Authority University Community System Average
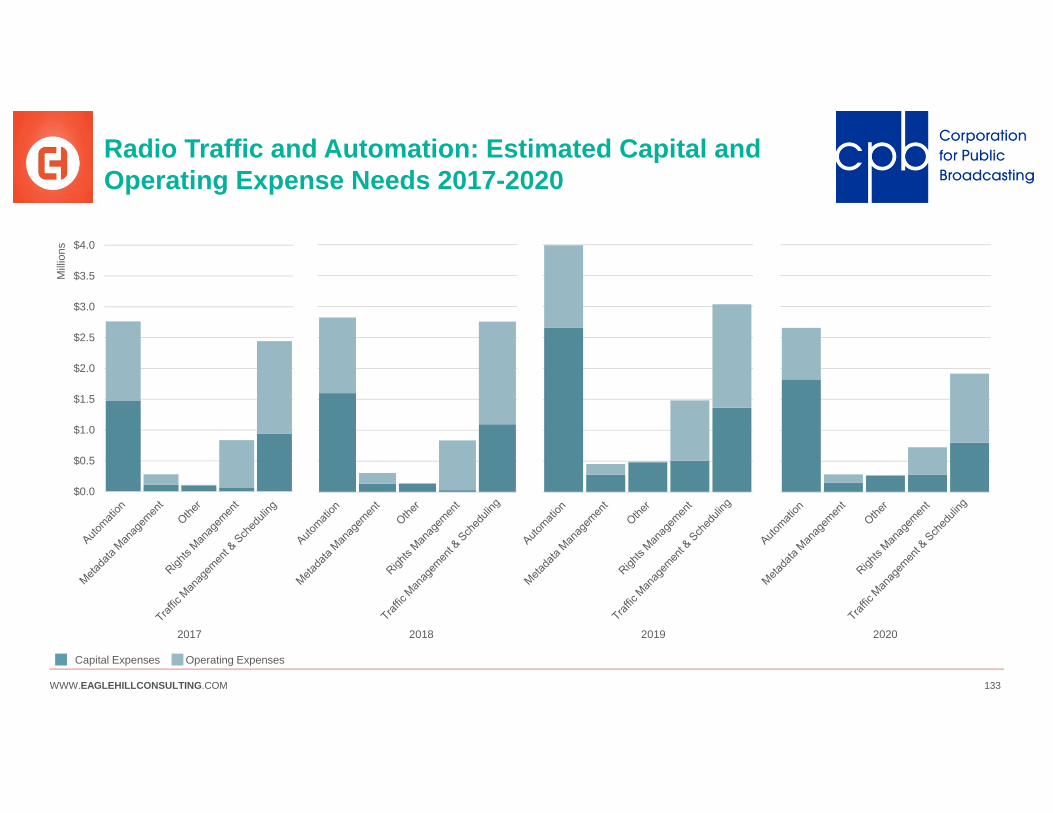
WWW.EAGLEHILLCONSULTING.COM 133
Radio Traffic and Automation: Estimated Capital and Operating Expense Needs 2017-2020
$0.0
$0.5
$1.0
$1.5
$2.0
$2.5
$3.0
$3.5
$4.0
Mill
ions
Operating ExpensesCapital Expenses
2017 2018 2019 2020

WWW.EAGLEHILLCONSULTING.COM 134
Radio Traffic and Automation: Anticipated Replacements 2017-2027
0
50
100
150
200
250
300
350
400
450
500
550
600
650
700
750
2017 2018 2019 2020 2021 2022 2023 2024 2025 2026 2027
(# p
iece
s of
equ
ipm
ent)
Automation
0
50
100
150
200
250
300
350
400
450
500
550
600
650
700
750
2017 2018 2019 2020 2021 2022 2023 2024 2025 2026 2027
(# p
iece
s of
equ
ipm
ent)
Traffic Management & Scheduling
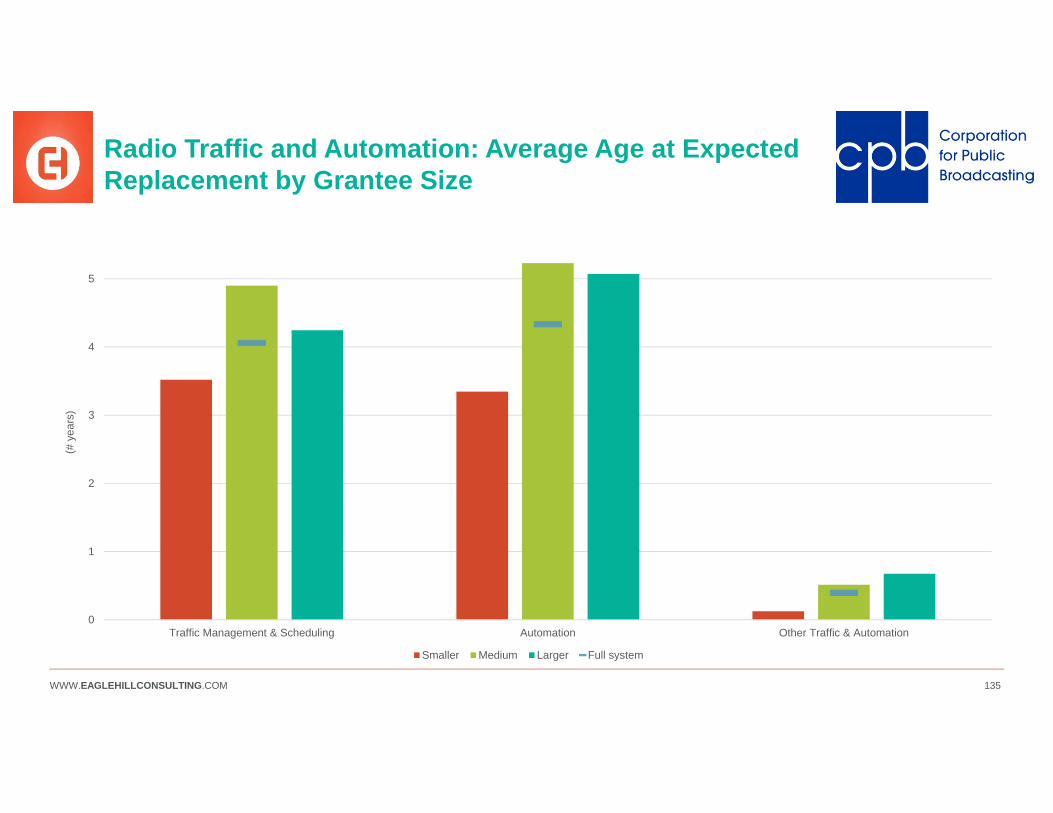
WWW.EAGLEHILLCONSULTING.COM 135
Radio Traffic and Automation: Average Age at Expected Replacement by Grantee Size
0
1
2
3
4
5
Traffic Management & Scheduling Automation Other Traffic & Automation
(# y
ears
)
Smaller Medium Larger Full system

WWW.EAGLEHILLCONSULTING.COM 136
Radio Traffic and Automation: Average Age at Expected Replacement by Licensee Type
0
1
2
3
4
5
6
Traffic Management & Scheduling Automation Other Traffic & Automation
(# y
ears
)
State Local Authority University Community System Average

WWW.EAGLEHILLCONSULTING.COM 137
Radio Traffic and Automation: Automation Vendors
Automation Vendors11 Software Paravel360 Systems PowerGoldApple RadioDJArrakis RCSAudioVault SeaLevelBEI SimianBroadcast Electronics SundanceBSI SupermicroCrispin Telos/AxiaDalet WideOrbitDAVID Systems Wire ReadyDellDigital JukeboxDroboEnco SystemsIMediaTouchLegitekMacroMedia, Inc.MediatouchMicrofirstMiller CASMusicMasterNatural Broadcast Systems
* Denotes major vendor
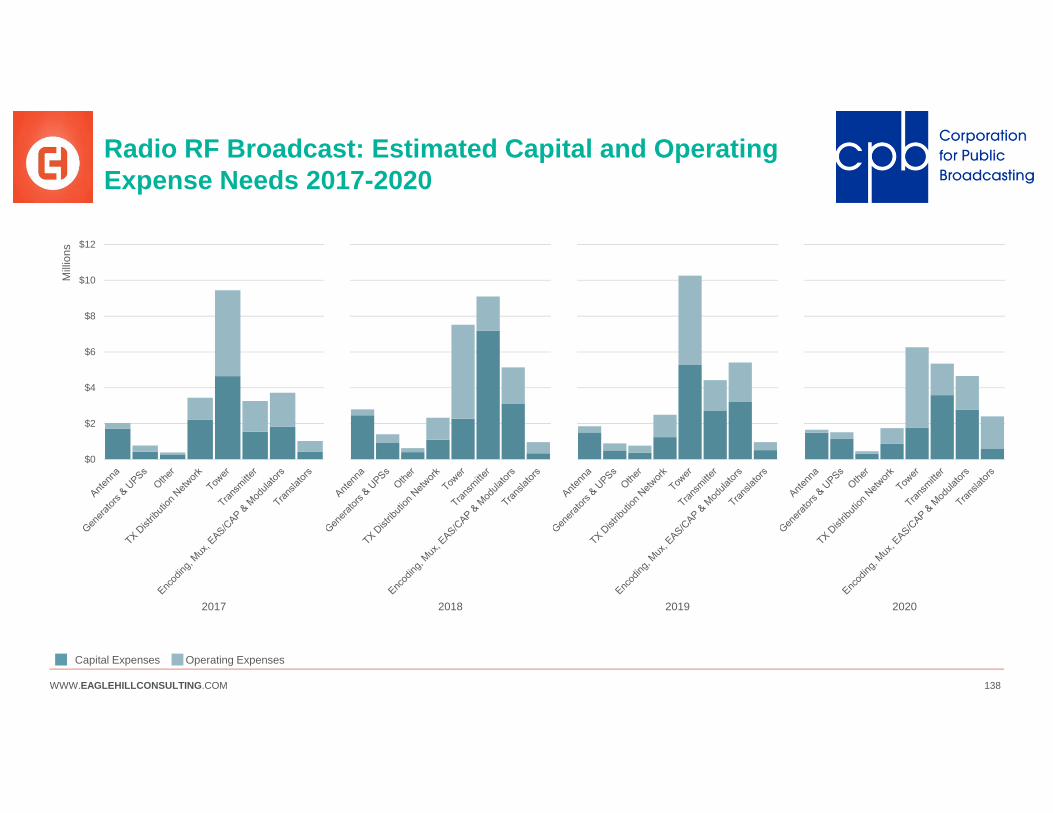
WWW.EAGLEHILLCONSULTING.COM 138
Radio RF Broadcast: Estimated Capital and Operating Expense Needs 2017-2020
2020
$0
$2
$4
$6
$8
$10
$12
Mill
ions
2017 2019
Operating ExpensesCapital Expenses
2018
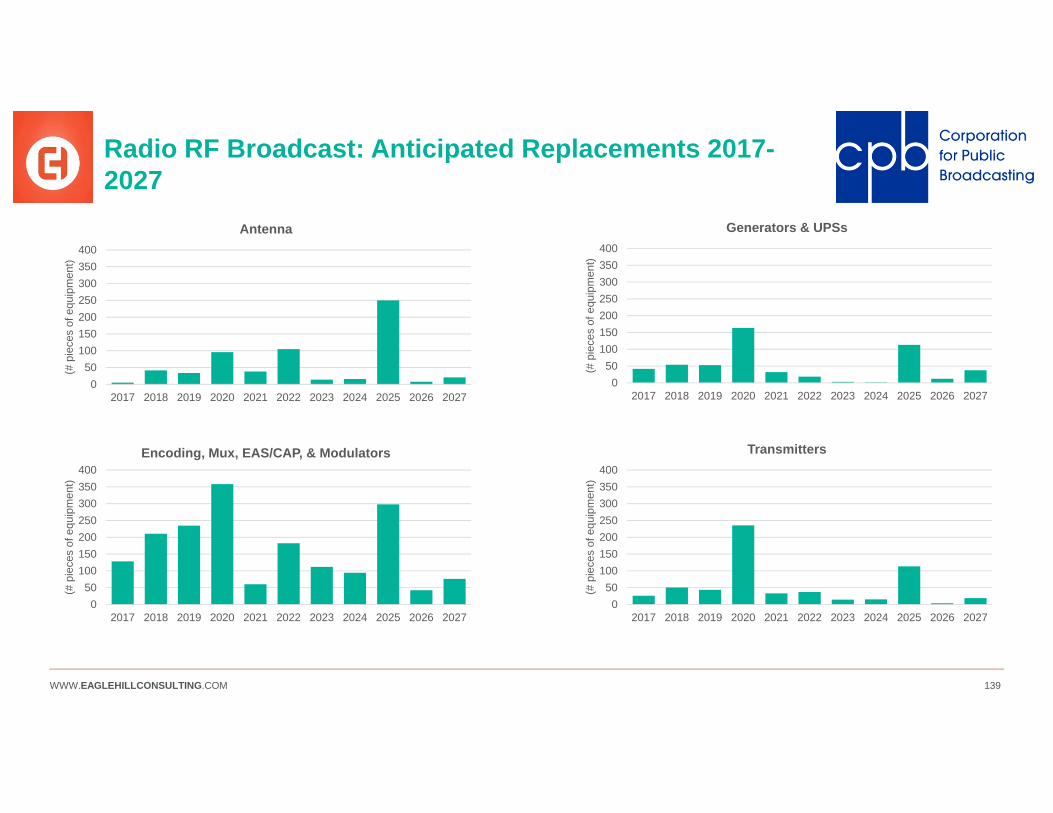
WWW.EAGLEHILLCONSULTING.COM 139
Radio RF Broadcast: Anticipated Replacements 2017-2027
050
100150200250300350400
2017 2018 2019 2020 2021 2022 2023 2024 2025 2026 2027
(# p
iece
s of
equ
ipm
ent)
Antenna
050
100150200250300350400
2017 2018 2019 2020 2021 2022 2023 2024 2025 2026 2027
(# p
iece
s of
equ
ipm
ent)
Generators & UPSs
050
100150200250300350400
2017 2018 2019 2020 2021 2022 2023 2024 2025 2026 2027
(# p
iece
s of
equ
ipm
ent)
Encoding, Mux, EAS/CAP, & Modulators
050
100150200250300350400
2017 2018 2019 2020 2021 2022 2023 2024 2025 2026 2027
(# p
iece
s of
equ
ipm
ent)
Transmitters
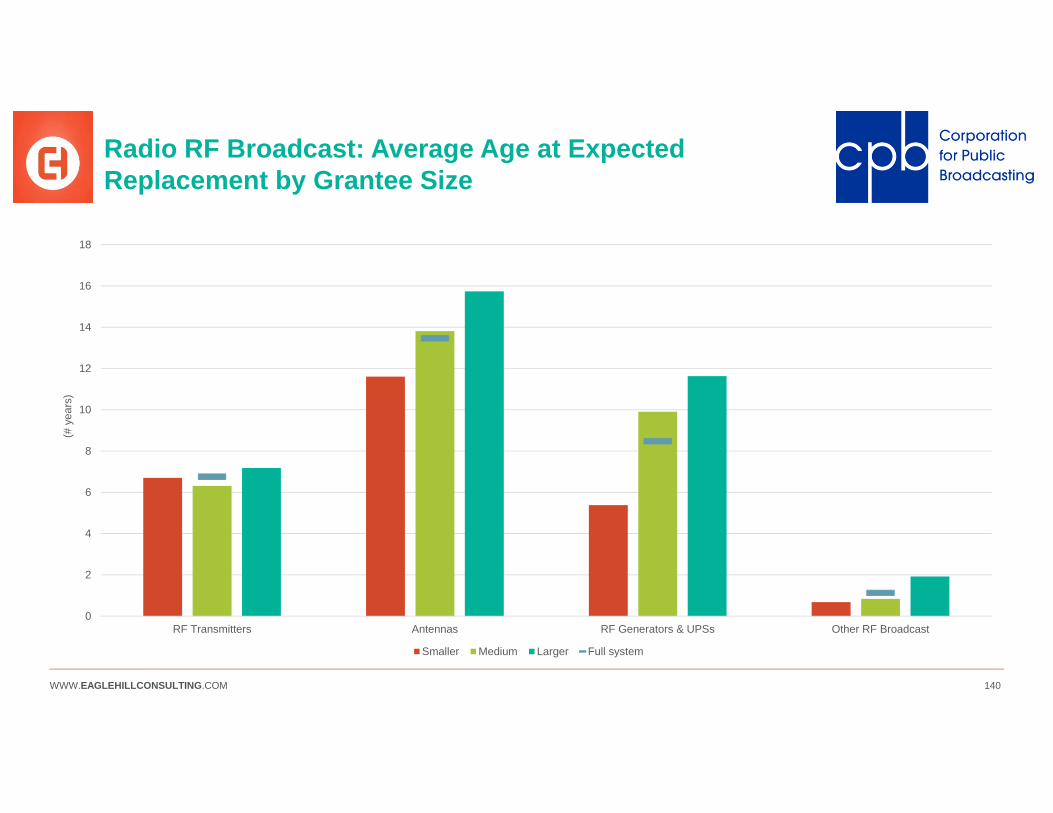
WWW.EAGLEHILLCONSULTING.COM 140
Radio RF Broadcast: Average Age at Expected Replacement by Grantee Size
0
2
4
6
8
10
12
14
16
18
RF Transmitters Antennas RF Generators & UPSs Other RF Broadcast
(# y
ears
)
Smaller Medium Larger Full system
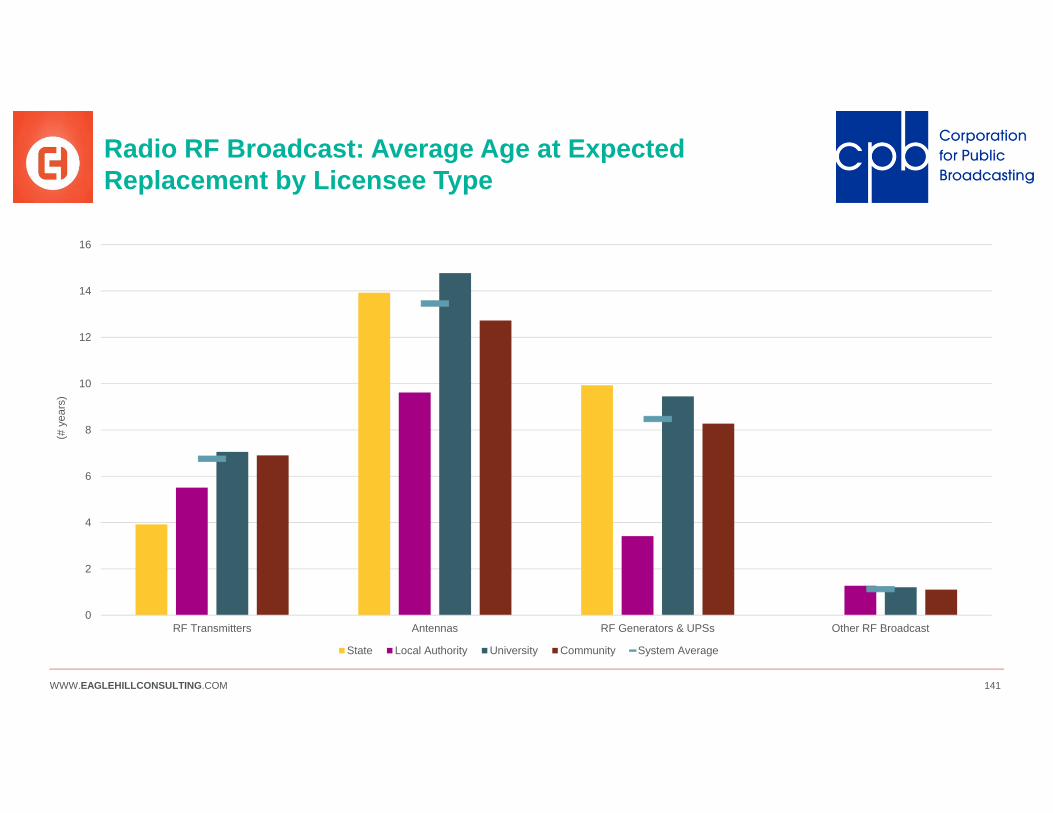
WWW.EAGLEHILLCONSULTING.COM 141
Radio RF Broadcast: Average Age at Expected Replacement by Licensee Type
0
2
4
6
8
10
12
14
16
RF Transmitters Antennas RF Generators & UPSs Other RF Broadcast
(# y
ears
)
State Local Authority University Community System Average
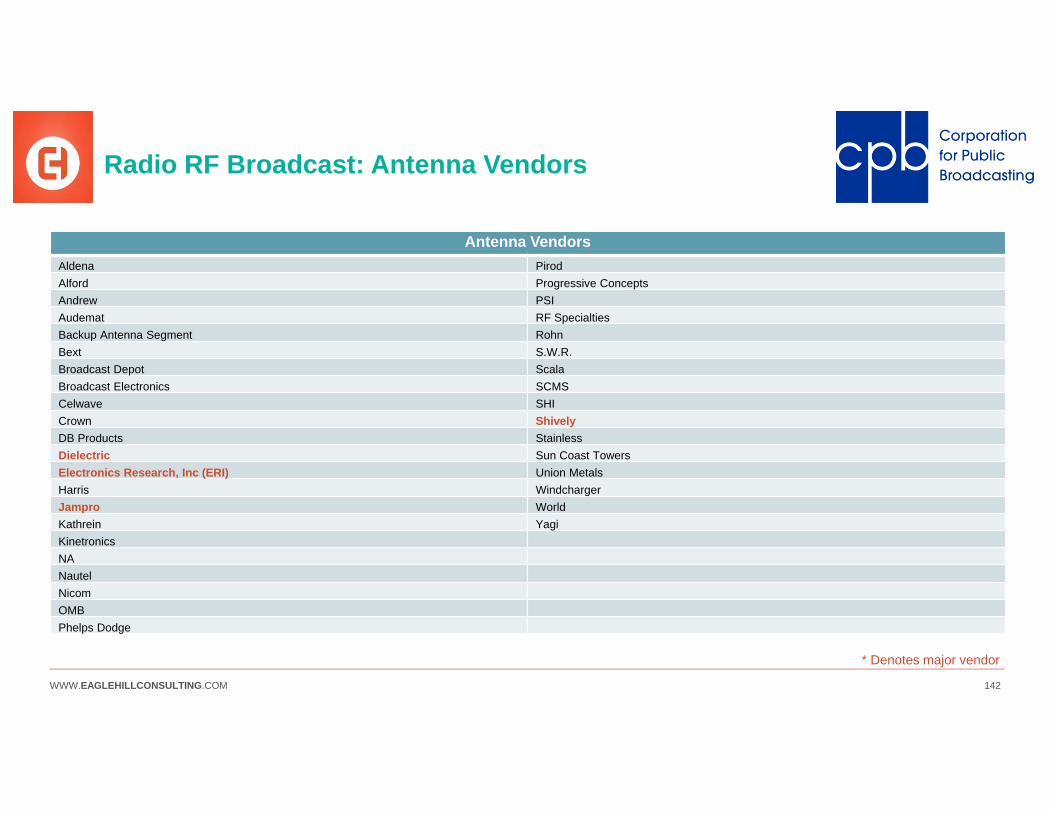
WWW.EAGLEHILLCONSULTING.COM 142
Radio RF Broadcast: Antenna Vendors
Antenna VendorsAldena PirodAlford Progressive ConceptsAndrew PSIAudemat RF SpecialtiesBackup Antenna Segment RohnBext S.W.R.Broadcast Depot ScalaBroadcast Electronics SCMSCelwave SHICrown ShivelyDB Products StainlessDielectric Sun Coast TowersElectronics Research, Inc (ERI) Union MetalsHarris WindchargerJampro WorldKathrein YagiKinetronicsNANautelNicomOMBPhelps Dodge
* Denotes major vendor

WWW.EAGLEHILLCONSULTING.COM 143
Radio RF Broadcast: Encoding, Mux, EAS/CAP and Modulators Vendors
Encoding, Mux, EAS/CAP and Modulators VendorsAltronic Research Cummins Nielsen Telos/AxiaAphex DASDEC NPR/PRSS TFTArbitron Davicom Omnia TielineArmstrong DaySequerra Opticomm TiernanAudemat Electro Impulse Opto22 TrilithicAxxess Endec Orban TTC translator / PTEK amplifierBarix Energy Onyx Potomac Instruments UrbanBEi ERI PTEK Valmont/MicroflectBelar Ericsson P-Tek ValvconBext Eventide QEI WheatstoneBird Flexiva Radyne WorldCast SystemsBroadcast Depot GatesAir RCABroadcast Electronics Gentner ReBroadcast Tools Gorman Redlich Rexburg TranslatorBSW Harris RF SpecialtiesBurk Henry RF SystemsBW Broadcast Innovonics RohnCambium Intraplex RVRCCA Kohler SageCircuitWerks Larcan SAGE Alerting SystemsCisco McMartin SCMSCollins MDO UK SICONComex Modulation Sciences Silicon ValleyComlabs Monroe SINEComrex Moseley Sine SystemContinental Electronics Nautel SpartaCrown Broadcast NiCom Team
* Denotes major vendor
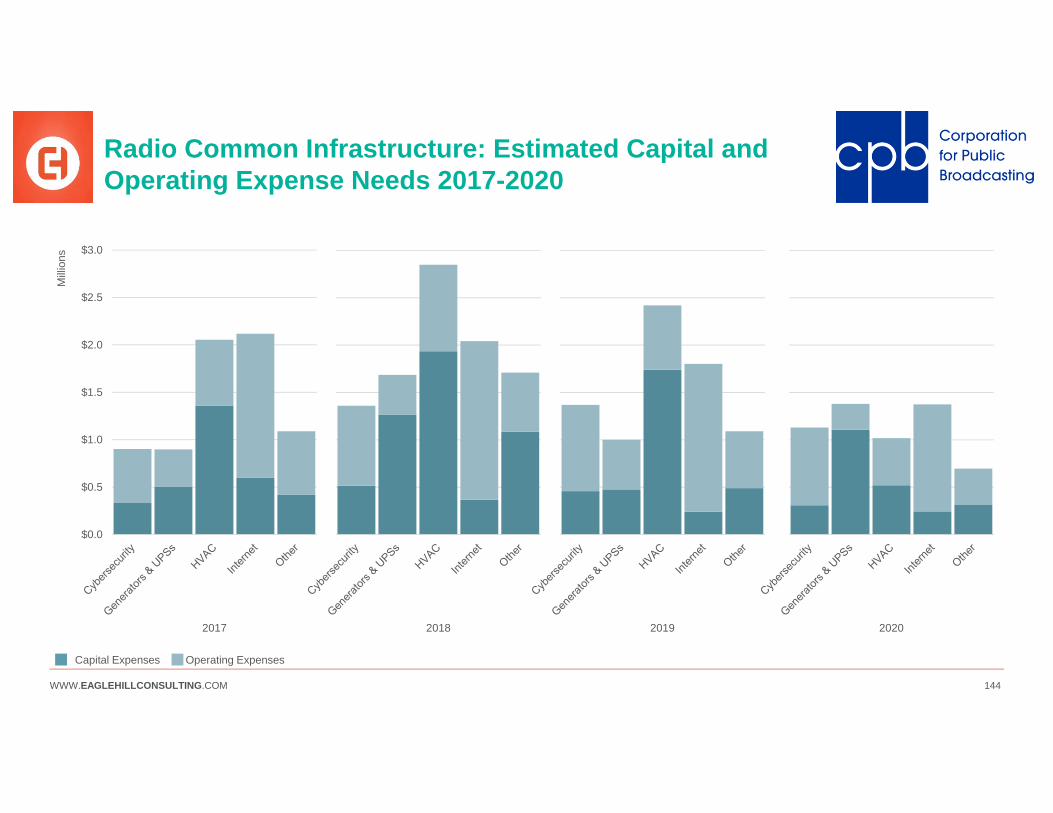
WWW.EAGLEHILLCONSULTING.COM 144
Radio Common Infrastructure: Estimated Capital and Operating Expense Needs 2017-2020
2020
$0.0
$0.5
$1.0
$1.5
$2.0
$2.5
$3.0
Mill
ions
2017 2018 2019
Operating ExpensesCapital Expenses
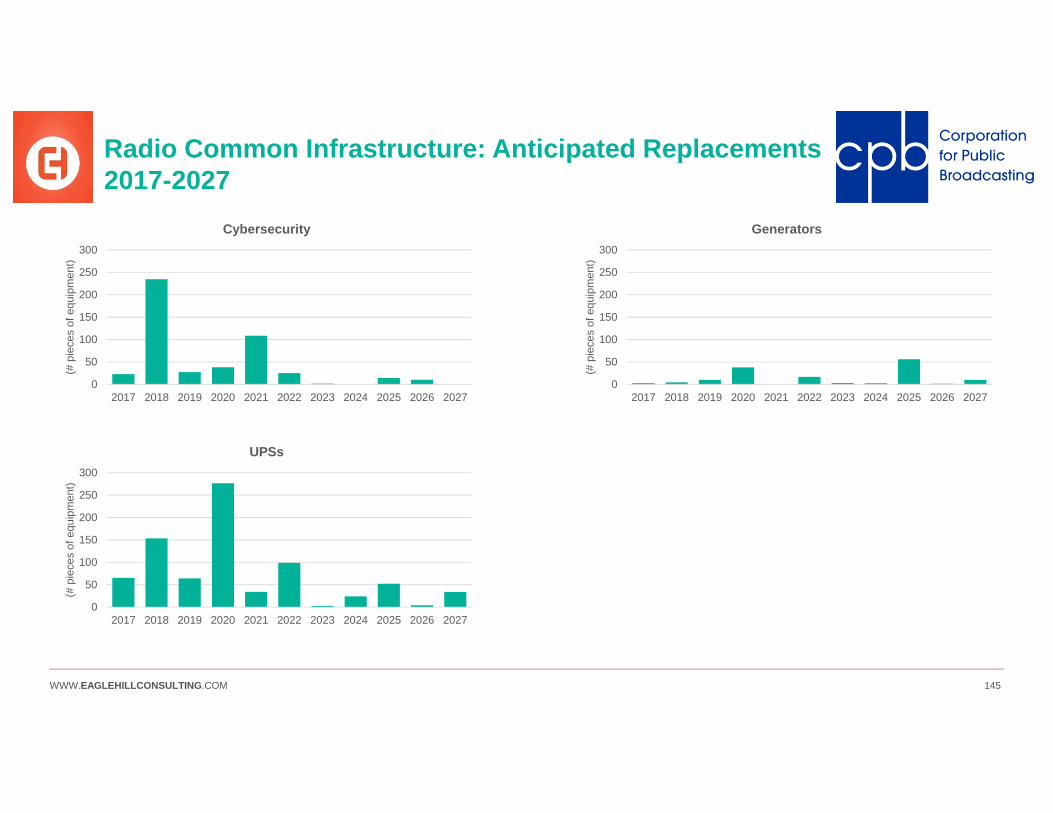
WWW.EAGLEHILLCONSULTING.COM 145
Radio Common Infrastructure: Anticipated Replacements 2017-2027
0
50
100
150
200
250
300
2017 2018 2019 2020 2021 2022 2023 2024 2025 2026 2027
(# p
iece
s of
equ
ipm
ent)
Generators
0
50
100
150
200
250
300
2017 2018 2019 2020 2021 2022 2023 2024 2025 2026 2027
(# p
iece
s of
equ
ipm
ent)
UPSs
0
50
100
150
200
250
300
2017 2018 2019 2020 2021 2022 2023 2024 2025 2026 2027
(# p
iece
s of
equ
ipm
ent)
Cybersecurity
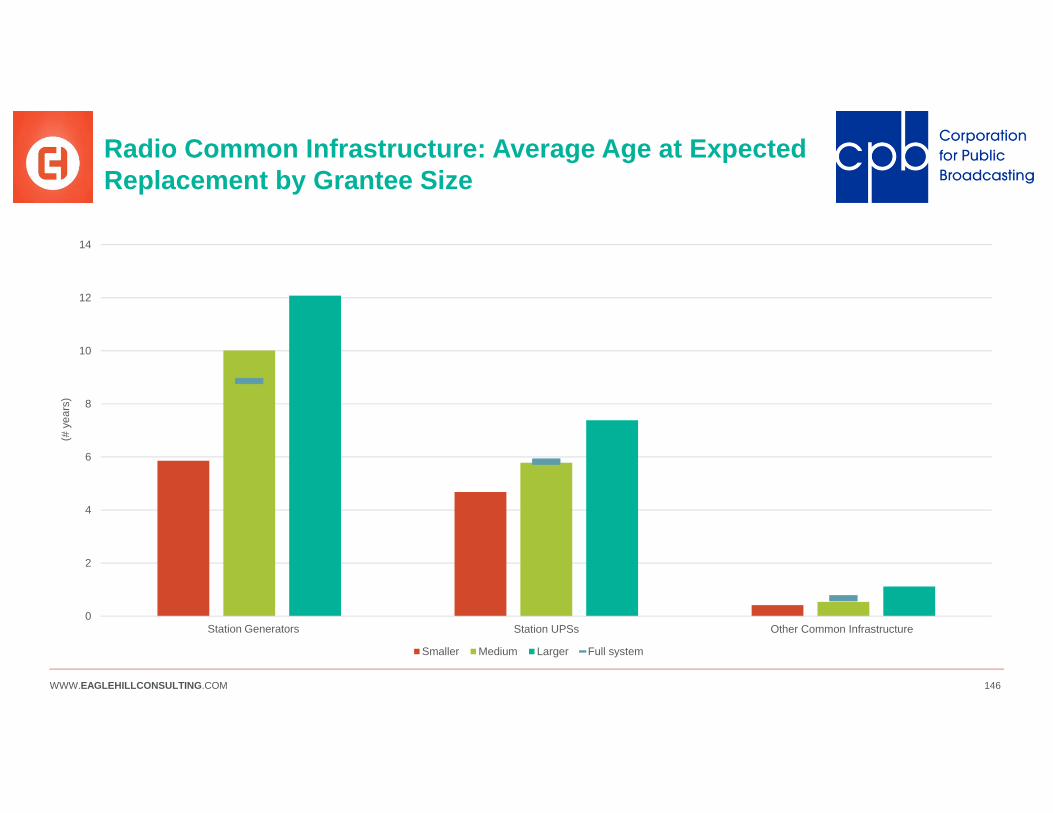
WWW.EAGLEHILLCONSULTING.COM 146
Radio Common Infrastructure: Average Age at Expected Replacement by Grantee Size
0
2
4
6
8
10
12
14
StationGenerators Station UPSs Other Common Infrastructure
(# y
ears
)
Smaller Medium Larger Full system
Station Generators
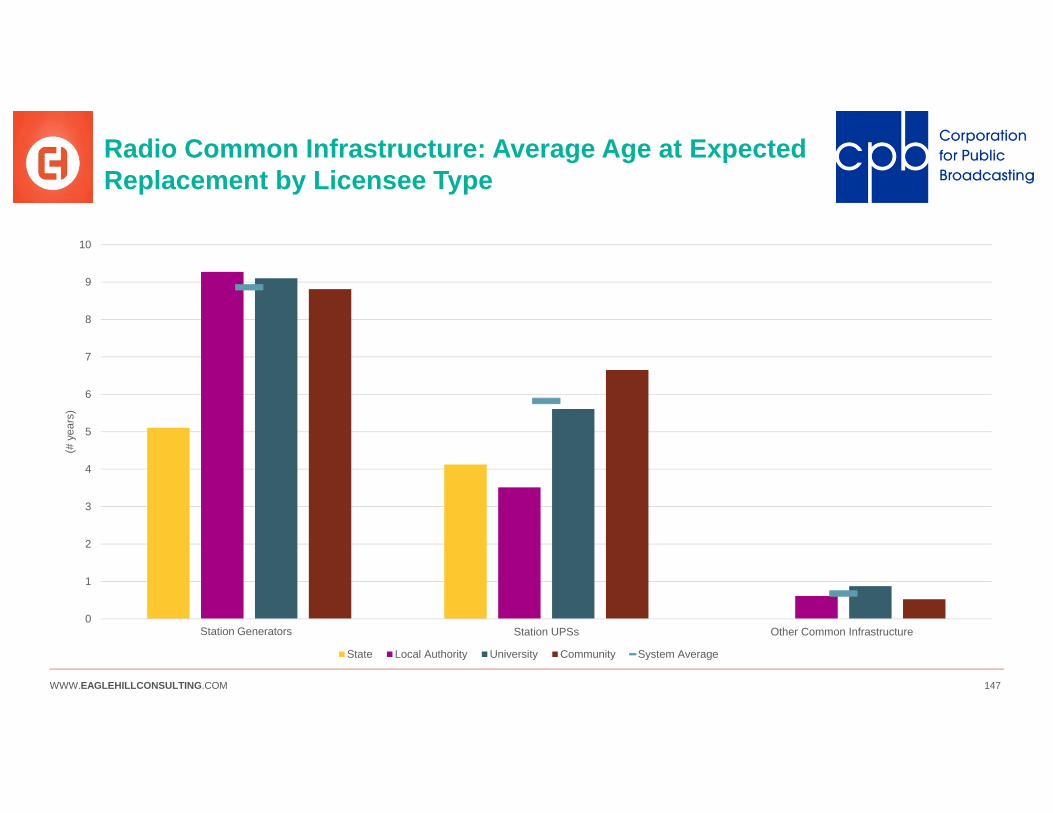
WWW.EAGLEHILLCONSULTING.COM 147
Radio Common Infrastructure: Average Age at Expected Replacement by Licensee Type
0
1
2
3
4
5
6
7
8
9
10
StationGenerators Station UPSs Other Common Infrastructure
(# y
ears
)
State Local Authority University Community System Average
Station Generators
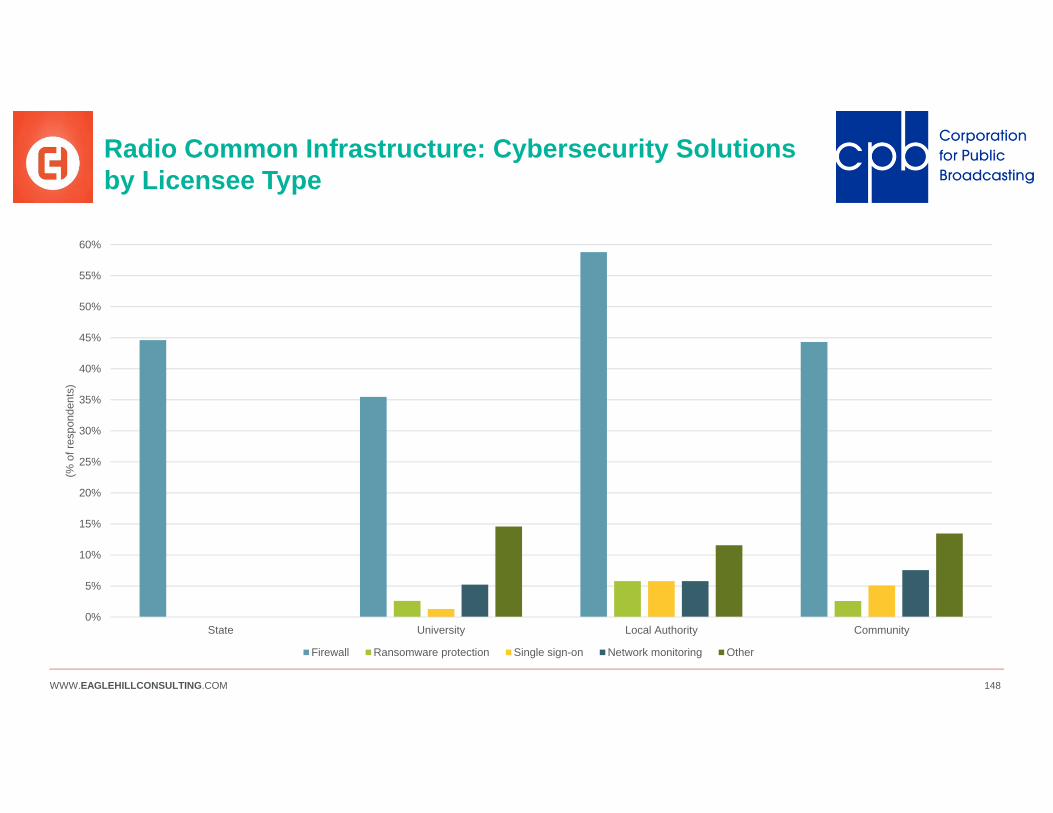
WWW.EAGLEHILLCONSULTING.COM 148
Radio Common Infrastructure: Cybersecurity Solutions by Licensee Type
0%
5%
10%
15%
20%
25%
30%
35%
40%
45%
50%
55%
60%
State University Local Authority Community
(% o
f res
pond
ents
)
Firewall Ransomware protection Single sign-on Network monitoring Other

WWW.EAGLEHILLCONSULTING.COM 149WWW.EAGLEHILLCONSULTING.COM 149
KEY LEARNINGS FROM INTERVIEWS AND PILOT

WWW.EAGLEHILLCONSULTING.COM 150
Collaborative Project Team Structure
Public Media StakeholdersRound 1 Interviewees
Public Media StakeholdersRound 2 Interviewees
CPB Project SponsorsTed Krichels, Deborah Carr, Lainie Tompkins
• Provide overall project guidance and direction• Review and approve major project issues, decisions, and
plans• Attend three in-depth review meetings
Project ExecutiveJohn McCoskey
• Update CPB Project Advisory Group on project status• Act as a single point of contact for CPB• Provide insight and industry perspectives on complex and
challenging issues
Project TeamJennifer Keister, Anna Wiinberg-
Freitas, Ron Clifton
• Facilitate executive reviews and Advisory Panel sessions• Manage the project including timeline, schedule, and budget• Conduct interviews; design, field, and analyze survey• Develop deliverables aligning with project outcomes• Assess and provide recommendations on solutions and
implementation plan
Project AdvisorSam Kassar
Provide advice and counsel on key issues, best practices, and survey methodology and analysis
• Provide input into implementation planning• Review survey format and content• Provide input on risk mitigation strategies
• Validate survey approach and value-add• Identify best outreach methods to ensure high
response rates
• Validate translation of technical detail into survey architecture and logical flow
• Validate technical survey content
CPB EHC
Advisory PanelEric Wolf, Ling Ling Sun, Bill Hayes, Stacey Decker, Laura Hunter, Perry Metz, Becky Magura, Lonna Thompson,
Victoria St. John, Mike Beach, Tom Thomas, Eric Hyyppa, Bruce Jacobs, Scott McPherson, Bill Sanford
WWW.EAGLEHILLCONSULTING.COM 151
Advisory Panel Members
Eric Wolf
Ling Ling Sun
Bill Hayes
Stacey Decker
Laura Hunter
Perry Metz
Becky Magura
Lonna Thompson
Victoria St. John
Mike Beach
Tom Thomas
Eric Hyyppa
Bruce Jacobs
Scott McPherson
Bill Sanford

WWW.EAGLEHILLCONSULTING.COM 152
Victoria St. John [Vermont Public Radio]Don Mussell [Hawaii Public Radio]
Lille Buck [Illinois Public Media]
Perry Metz [WFIU/WTIU]
Bruce Jacobs [TPT]
Ralph Hogan [KJZZ]
Alan Popkin [KLCS]
Tim Eby [KWMU]
Eric Hyyppa [Montana PBS]
Mike Starling [WHCP]
Sally Kane [NFCB]
Greg Petrowich [WISU]
Bill Sanford [Lakeland Public Television]
Tom Thomas and Terry Clifford [SRG]
Ling Ling Sun [NET]
Michael Beach [NPR]
Eric Wolf [PBS]
Loris Taylor and Melissa Begay [NPM]
Bill Hayes [Iowa Public Television]
Steve Holmes [PBS]
Lonna Thompson [APTS]
Becky Magura [WCTE-TV]
Laura Hunter [UEN]
• Value• Scope• Financial Planning
• Communication & Engagement• Operational & Technology
Trends• Capturing Survey Data
• Survey Architecture• Survey Mechanics• Level of Detail
• Question Wording• Use of Previously-Collected
Data
Public Media Stakeholders
Interview Focus Interview Focus
Round One Round Two
Public Media Stakeholders that Participated in Round One and Round Two Interviews
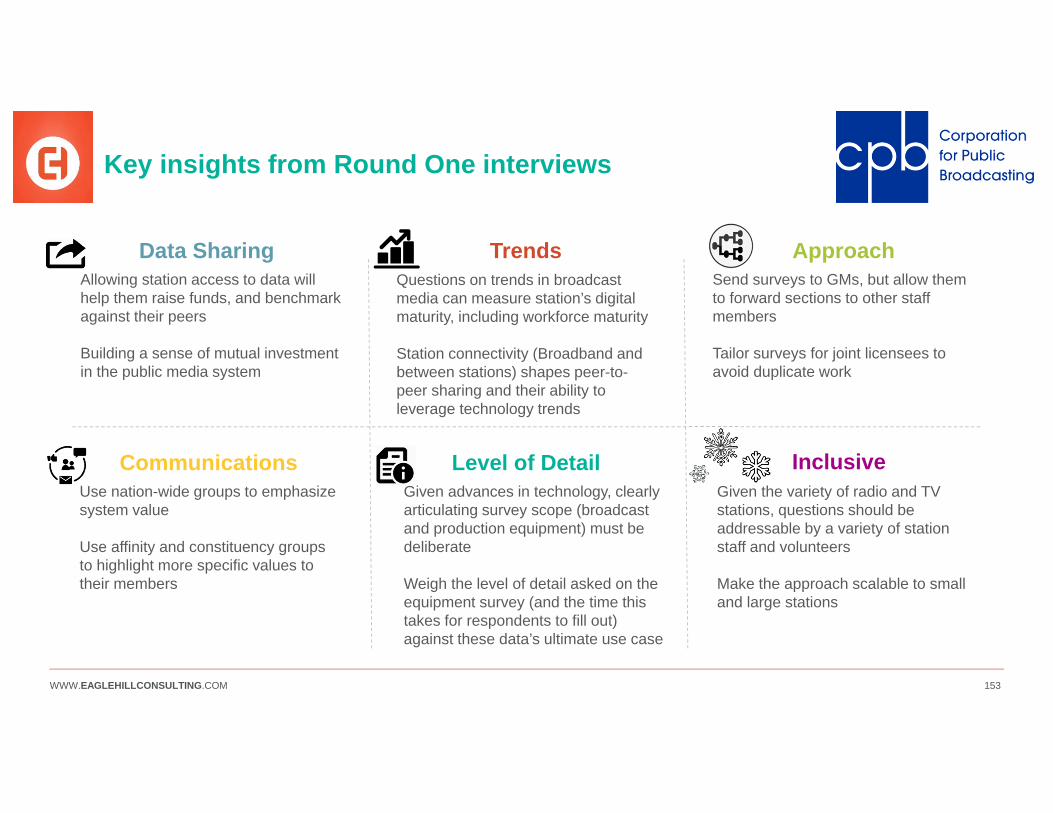
WWW.EAGLEHILLCONSULTING.COM 153
Data Sharing Trends ApproachAllowing station access to data will help them raise funds, and benchmark against their peers
Building a sense of mutual investment in the public media system
Questions on trends in broadcast media can measure station’s digital maturity, including workforce maturity
Station connectivity (Broadband and between stations) shapes peer-to-peer sharing and their ability to leverage technology trends
Send surveys to GMs, but allow themto forward sections to other staff members
Tailor surveys for joint licensees to avoid duplicate work
CommunicationsUse nation-wide groups to emphasize system value
Use affinity and constituency groups to highlight more specific values to their members
Level of DetailGiven advances in technology, clearly articulating survey scope (broadcast and production equipment) must be deliberate
Weigh the level of detail asked on the equipment survey (and the time this takes for respondents to fill out) against these data’s ultimate use case
InclusiveGiven the variety of radio and TV stations, questions should be addressable by a variety of station staff and volunteers
Make the approach scalable to small and large stations
Key insights from Round One interviews
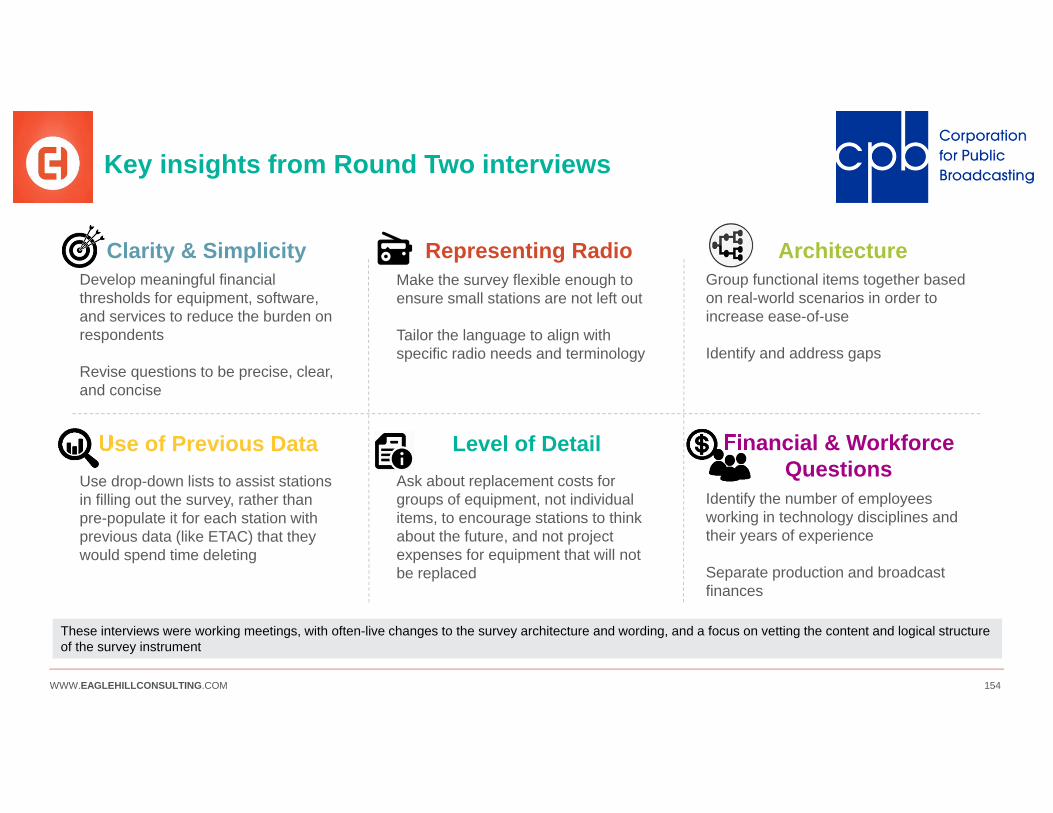
WWW.EAGLEHILLCONSULTING.COM 154
Clarity & Simplicity Representing Radio ArchitectureDevelop meaningful financial thresholds for equipment, software, and services to reduce the burden on respondents
Revise questions to be precise, clear, and concise
Make the survey flexible enough to ensure small stations are not left out
Tailor the language to align with specific radio needs and terminology
Group functional items together based on real-world scenarios in order to increase ease-of-use
Identify and address gaps
Use of Previous DataUse drop-down lists to assist stations in filling out the survey, rather than pre-populate it for each station with previous data (like ETAC) that they would spend time deleting
These interviews were working meetings, with often-live changes to the survey architecture and wording, and a focus on vetting the content and logical structure of the survey instrument
Level of DetailAsk about replacement costs for groups of equipment, not individual items, to encourage stations to think about the future, and not project expenses for equipment that will not be replaced
Financial & Workforce Questions
Identify the number of employees working in technology disciplines and their years of experience
Separate production and broadcast finances
Key insights from Round Two interviews
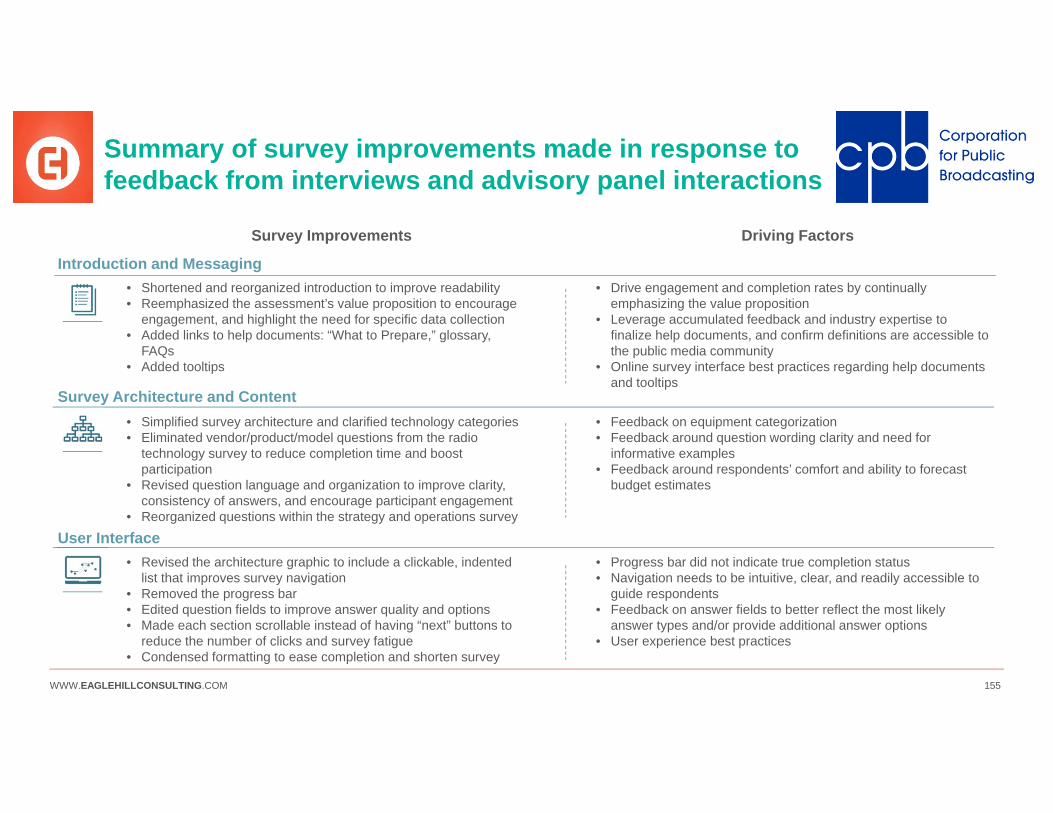
WWW.EAGLEHILLCONSULTING.COM 155
Summary of survey improvements made in response to feedback from interviews and advisory panel interactions
Introduction and Messaging
Survey Architecture and Content
User Interface
• Shortened and reorganized introduction to improve readability• Reemphasized the assessment’s value proposition to encourage
engagement, and highlight the need for specific data collection• Added links to help documents: “What to Prepare,” glossary,
FAQs• Added tooltips
• Drive engagement and completion rates by continually emphasizing the value proposition
• Leverage accumulated feedback and industry expertise to finalize help documents, and confirm definitions are accessible to the public media community
• Online survey interface best practices regarding help documents and tooltips
• Simplified survey architecture and clarified technology categories• Eliminated vendor/product/model questions from the radio
technology survey to reduce completion time and boost participation
• Revised question language and organization to improve clarity, consistency of answers, and encourage participant engagement
• Reorganized questions within the strategy and operations survey
• Feedback on equipment categorization• Feedback around question wording clarity and need for
informative examples• Feedback around respondents’ comfort and ability to forecast
budget estimates
• Revised the architecture graphic to include a clickable, indented list that improves survey navigation
• Removed the progress bar• Edited question fields to improve answer quality and options• Made each section scrollable instead of having “next” buttons to
reduce the number of clicks and survey fatigue• Condensed formatting to ease completion and shorten survey
• Progress bar did not indicate true completion status• Navigation needs to be intuitive, clear, and readily accessible to
guide respondents• Feedback on answer fields to better reflect the most likely
answer types and/or provide additional answer options• User experience best practices
Survey Improvements Driving Factors