cpc analytics - company presentation
TRANSCRIPT

CPC Analytics Data analysis for industry, marketing and public policy

CPC analytics helps to unlock the potential data
Data Exploration
Data Analytics
Data Strategy
Our data analysis algorithms help to extract novel findings from large numerical and text datasets.
Our multidisciplinary team combines quantitative and qualitative methods with domain expertise to provide reliable and contextualized insights.
Our expertise in data analysis, modelling, and automation helps to create data-driven innovation strategies and research approaches.

CPC Analytics develops data analysis algorithms and models for the industry, marketing, and public policy
Forecasting Pattern detection
Modeling Text analytics
Data Collection & Processing
Potential across sectors
Industry 4.0: • Predictive maintenance • Demand & stock forecasting Marketing: • Customer sentiment mining Public Policy: • Discourse analysis • Influencer identification
Machine Learning Automation Visualization
Capacities of CPC

Geographical outreach
Germany India
France
Switzerland Denmark
Haiti Nepal Egypt
Tanzania
+
Offices Project locations

Our Clients

Case studies of recent projects Private and Public sector work

Experience: Analysis of sentiments in e-commerce
Problem statement: We were commissioned by an e-commerce platform to conduct an analysis on client reviews with regard to their satisfaction.
Our approach: ▪ Data-collection: Our algorithms automatically collected
client reviews from webpages and stored them. ▪ Data structuring: In order to analyze the sentiment of a
reviewer, the stored text was structured according to different word and syntax characteristics (e.g. labelling adjectives with an underlying feeling)
▪ Machine learning: Once the algorithm can “read” the sentiment from the text it is trained to become more accurate by feeding more data into the system.
Key value addition: ▪ Automate textual analysis with regard to certain
sentiments occurring in the text. ▪ Enables large scale textual analysis
Sentiment analysis of customer reviews
(top) Graph depicting satisfaction levels | (bottom) Info-graphic explaining the technology behind | all rights reserved.
1.4 COMPARE!PRODUCTS!BY!FEATURE!!
Feature! level! summaries! can! help! you! compare! two! products! at! a! glance.! Below! are! some!
screenshots!showing!a!feature!comparison!of!two!hotels:!
!
1. Sentiment+comparison+of+most+talked+about+features+
+
!
! !
!
!
Figure:!Sirius!extracts!featureHopinion!pairs!from!textual!data!and!generates!concise!summaries!that!
can!help!the!user!evaluate!the!pros!and!cons!of!a!product!in!a!matter!of!seconds!
!
!
!
!
!
!
+
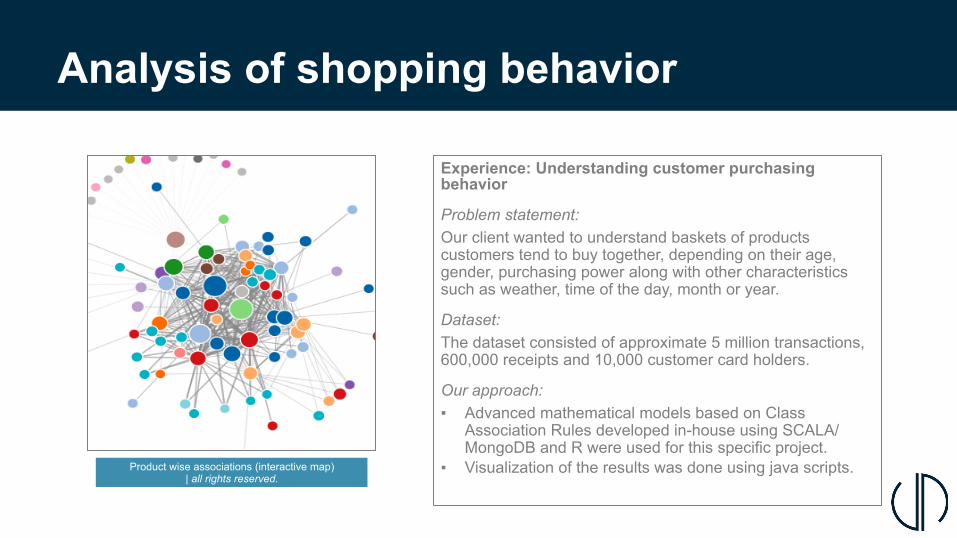
Experience: Understanding customer purchasing behavior
Problem statement: Our client wanted to understand baskets of products customers tend to buy together, depending on their age, gender, purchasing power along with other characteristics such as weather, time of the day, month or year.
Dataset: The dataset consisted of approximate 5 million transactions, 600,000 receipts and 10,000 customer card holders.
Our approach: ▪ Advanced mathematical models based on Class
Association Rules developed in-house using SCALA/MongoDB and R were used for this specific project.
▪ Visualization of the results was done using java scripts.
Analysis of shopping behavior
Product wise associations (interactive map) | all rights reserved.

Experience: Analysis and forecasting of sales data
Problem statement: For a retail firm we were commissioned to analyze the sales growth evolution as well as creating forecasts. Moreover the client asked cpc to analyze the composition or regional sales and the importance of regional shops.
Our approach: ▪ Re-structure data: In order to make the analysis
possible we re-structured the data from the internal ERP system.
▪ Identifying correlations: We used characteristics such as geography, shop, etc. to correlate them with sales/clients.
▪ Forecasting: We used hist. data and external indicators (such as humidity) to develop and test sales forecasts.
Key value addition: ▪ Understanding links between the sales of different
shops and products. ▪ Providing planning and forecasting tools.
Sales Forecasting
Indicative graphs | all rights reserved.

An industrial machine manufacturer loses after-sales revenue for not having the spare parts available
• High manufacturing complexity • Hundreds of possible factors • Thousands of measurements • Defective assembly in spite of faultless individual parts
• Prevention of defects • Added Value on OK products • Prevention of rework
• +3 years of data • +1000 variables per final product • >100 GB
Machining
FinalAssembly
FinalTest
SubAssy
SubAssy
SubAssy…
Upto2%undetecteddefects
Predict the assembly of defective final products before final assembly
Context
Potential
Results
Analytics

Experience: Deriving insights from client communication for a manufacturing firm
Problem statement: Our client wanted to extract insights about competitors and internal processes based on external communication with potential or existing clients.
Dataset: The dataset consisted of approximate 50,000 messages exchanged with potential or existing clients. We estimate it would have taken 42 days to read all these messages once.
Our approach: ▪ Proprietary textual classifiers (enhanced Bayes
classifiers) developed in-house using SCALA/MongoDB were used for this specific project.
▪ Visualization of the results was done using java scripts.
Automated analysis of communication
Heat map showing perception of different competitors based on a set of attributes | all rights reserved.

Experience: Measuring the impact of communications in macroeconomic variables.
Problem statement: We were tasked with commissioning a study measuring the impact of external communication of the Reserve Bank of India (RBI) on macroeconomic fundamentals.
Our approach: ▪ We collected data on the press releases and media
articles dating from 2008 - 2013. Analyzed nearly 12000 articles in toto.
▪ Proprietary textual classifiers developed to identify content along with the magnitude of change offered.
▪ Comprehensive econometric testing of our data using GARCH framework for modeling volatility
Impact of institutional communications
Graph plotting variations in exchange rates with changes in content | all rights reserved.

Experience: Measuring sustainability of firms through compliance history
Problem statement:
We were tasked to formalise the impact of sustainability of the risk of default for violating firms, through creation of a unique list of ESG defaulters in India.
Our approach: ▪ Dataset: The dataset consisted of millions of media
articles from 2001 onwards. Hundreds of thousands of legal text regarding ESG compliance similarly scraped
▪ Customary textual flaggers to identify firms engaging in violation of ESG norms.
Key Value addition: § Formalizing of the link between sustainability and
financial performance § Predictive modeling on the risks of default based
upon compliance history
Analysis of ESG violations among firms
Annual notional loss borne by MSMEs due to ESG norm violations | all rights reserved.
600 Billion INR
500 Billion INR
150 Billion
INR
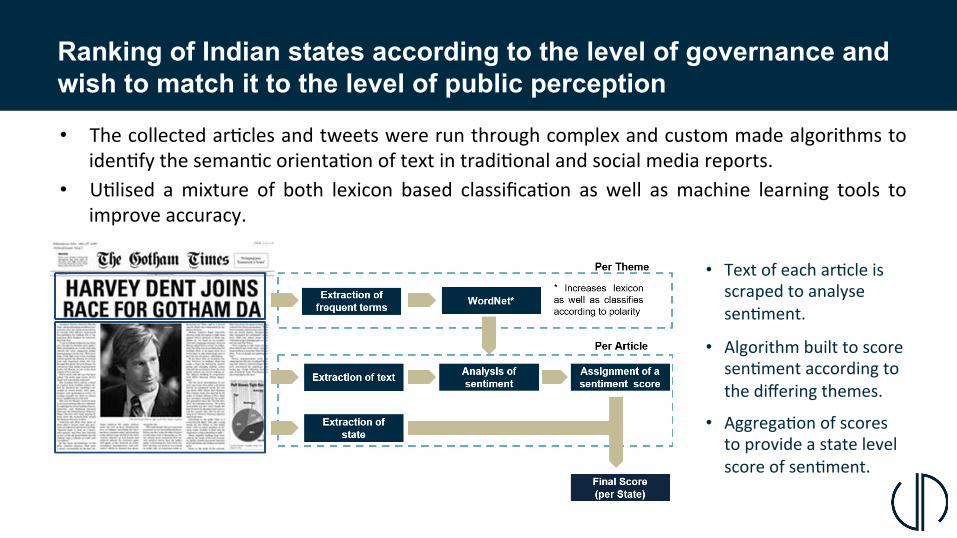
Ranking of Indian states according to the level of governance and wish to match it to the level of public perception
• Thecollectedar>clesandtweetswererunthroughcomplexandcustommadealgorithmstoiden>fytheseman>corienta>onoftextintradi>onalandsocialmediareports.
• U>lised amixture of both lexicon based classifica>on as well asmachine learning tools toimproveaccuracy.
• Aggrega>onofscorestoprovideastatelevelscoreofsen>ment.
• Algorithmbuilttoscoresen>mentaccordingtothedifferingthemes.
• Textofeachar>cleisscrapedtoanalysesen>ment.

Germany – Gneisenaustr 52, 10961 Berlin
France 8 rue du Saint-Gothard, 67000 Strasbourg
India – Plot No. 4, Survey No. 249, Baner, Pune 411007
Chris&anFranzPartner&CEOMobile: (+49)17681127808Email: c.franz@cpc-analy>cs.comWeb: www.cpc-analy>cs.com