c:program filesqualcommeudora proattachwhat do unions do ... · 8 for a critique see teixera...
TRANSCRIPT

NBER WORKING PAPER SERIES
WHAT DO UNIONS DO ... TO VOTING?
Richard B. Freeman
Working Paper 9992http://www.nber.org/papers/w9992
NATIONAL BUREAU OF ECONOMIC RESEARCH1050 Massachusetts Avenue
Cambridge, MA 02138September 2003
I have benefitted from discussion with Ruy Teixeira, Joel Rogers, and participants at the Harvard UniversityCAPs seminar and at Cornell University. Alida Castillo-Freeman analyzed an extraordinary number of datafiles from different surveys. The views expressed herein are those of the authors and are not necessarily thoseof the National Bureau of Economic Research.
©2003 by Richard B. Freeman. All rights reserved. Short sections of text, not to exceed two paragraphs, maybe quoted without explicit permission provided that full credit, including © notice, is given to the source.

What Do Unions Do ... to Voting?Richard B. FreemanNBER Working Paper No. 9992September 2003JEL No. J0, J5
ABSTRACT
This paper uses data from four different data sets to examine the union impact on the turnout of
members and their support for union-preferred candidates. It rejects the claim that the union share
of the electorate rose massively in the 1990s. It finds that union members are about 12 percentage
points more likely to vote than non-union members and nonunion persons in union households are
modestly more likely to vote than persons in nonunion households, but shows that most of the higher
rate of turnout of unionists is due to socioeconomic factors that differentiate union members from
others. With respect to voting preferences, union members are more likely to vote for a Democrat
for the House or Presidency than demographically comparable nonunion voters, largely because
union members have attitudes and voting inclinations favorable to the Democrats and to liberalism
prior to a given campaign. Finally, the study identifies a sizable group of nonunion persons with pro-
union attitudes that unions could potentially influence to maintain the union impact on elections
even with declines in union density.
Richard B. FreemanNBER1050 Massachusetts AvenueCambridge, MA 02135and Harvard [email protected]

1
1 AFL-CIO power point presentations. Tracy Chang (2001) “The Labour Vote in USNational Elections, 1948-2000, The Political Quarterly, 72 no 3, p 375. In1999-2000 unions gave22.5 million dollars in soft money contributions to the Democratic National Committee,Democratic Senatorial Campaign Committee, and Congressional Campaign Committee.
2http://www.aflcio.org/issuespolitics/politics/fs_0202.cfm
3 Freeman and Medoff (1984) have a chapter on unions in politics. Juravich andShergold (1988) studied the impact of unions on the voting using a small sample of Pennsylvaniaunion members. Masters and Delaney(1987) review studies of union political activities. Delaney and co-authors (1999) argue that unions have invested increasing resources in politicalaction to defeat laws designed to weaken unions
American trade unions spend considerable resources on political activity. As union
density has fallen, unions have increased their effort to mobilize union voters. In the 2000
Presidential election, AFL-CIO unions made 8 million phone calls to members, sent out 12
million pieces of mail, distributed 14 million leaflets at union workplaces once a week from
September to Election day and spent more than $43 million to help win a popular vote victory
for the Democratic presidential candidate.1 In 2001, faced with declining resources due to falling
membership and the Carpenters’ Union withdrawal from the AFL-CIO, the General Board of the
federation voted to increase its levy on unions to fund political activity through 2005. The AFL-
CIO’s Political Committee sought to elect 5,000 union members to public office – Target 5000. 2
To what extent do union members turn out on election day more than non-union
members? How much, if at all, do unions influence their members to vote for union-preferred
candidates? In the face of declining density, can unions maintain their political influence?
Despite the importance that unions attach to political activity and the potential effect this
activity has on election results, research on what unions do to voting is limited. Studies of union
activity by economists focus on wages and other labor market outcomes.3 Studies of turnout and
voting by political scientists focus on socio-economic determinants of voting but rarely examine

2
4 Shlotzman, Brady, and Verba (1995) show that union members are more exposed topolitical discussion and activity and to developing civic skills than others (table 13.4). Chang(2003) examines get out the vote campaigns of 140 local unions in the South. Delaney, Fiorito,and Masters (1988) examine the determinants of union political action committee and lobbyingexpenditures. Verba, Nie and Kim (1978) provide evidence that class-based institutions such asunions also mobilize citizens. Radcliff and Davis (2000) attribute some of the low level ofturnout and high class bias of voting in the US to the weakness of US trade unions.
5 Examining the turnout of union members and their response to COPE endorsements inthe 1978 election John Delaney and co-authors (1988, 1990) concluded that union membersturned out more than non-members but that persons in union households did not; Radcliff’s(2002) examination of electoral participation of persons in union households in the NES from1952 to 1992 found a union effect that differed substantially between models.
6 Various AFL-CIO representatives have presented these data. See Steve Rosenthal,power point presentation “How Can Labor Impact the Current Political Debate?” Harvard TradeUnion Program, January 14, 2003. This claim is repeated often in newspaper stories: “labor'srelative strength at the ballot box continues to grow in the face of overall declines in voterturnout. The share of union household voters has grown from 19 percent in 1992 to 23 percent in1996 to 26 percent in 2000.” Leigh Strope, “Gebhardt Adds to Growing Union Support”Associated Press, August 5 http://www.thestate.com/mld/thestate/news/politics/6459981.htm
7 Senator Joe Biden “If Al Gore wins, he’ll win for one simple reason: organized labor”Associated Press, 11/4/00. William Schneider “If Gore becomes President, he’ll owe organized
the impact of union activity on voting.4 The few social science studies that focus on unionization
and voting have not pinned down the union impact on turnout and voting preferences.5
Absent extensive academic research, discussions of how unions affect turnout and voting
are dominated by practitioner analyses of exit polls. Tabulations of Voter News Service (VNS)
polls underlie claims that unions had a huge and increasing impact on elections in the 1990s.
The most widely cited statistic is that the share of voters from union households rose from 19%
in 1992 to 26%, despite drops in union density.6 Exit polls indicate that in the 2000 Presidential
election Vice President Gore obtained 63% of the union vote, and that heavy union campaigning
gave him victory in several swing states -- Michigan, Pennsylvania, Wisconsin, and Iowa. Both
Republican and Democratic politicians attributed Gore’s near win to organized labor.7

3
labor big time” CNN, 11//00. “We know the unions to be our chief adversary in this election”Executive Director, Pennsylvania Republican Party, 11/00. All from AFL-CIO presentation
This study examines the VNS exit poll data that underlie claims of increased union
political effectiveness in the 1990s and data on unionism and voting from the November Current
Population Survey (CPS) supplements on voting, National Election Studies (NES) surveys, and
the General Social Survey (GSS). Investigating the relation between unionism and voting in
these four sources of data provides a more complete and different picture of what unions do to
voting than that given in previous studies.
There are five substantive findings:
1. Exit poll data give a misleading picture of the trend in the union share of the electorate,
and thus of the extent to which unions offset loss of density through get-out-the-vote campaigns.
2. Current Population Survey voting supplements understate the union share of voters by
excluding retirees and other non employed persons with union affiliation from their measure of
union members. Counting non employed persons who claim union membership as union voters,
the union share of voters is about 50% higher than the union share of workers.
2. Union members are 10-13 percentage points more likely to vote than non-union
members, but the union voting premium – defined as the difference in turnout between members
and non-members with comparable characteristics – is much smaller: about 4 percentage
points.
4. Union members are 12 to 13 percentage points more likely to vote for a Democrat than
are demographically comparable nonunion voters, but about half of this difference is due to
union members holding favorable attitudes toward liberalism and the Democratic party. All but
2-3 percentage points of the difference arises prior to a given campaign.

4
8 For a critique see Teixera (1992), Rogers and Teixera (2001)
5. Three to four times more non-union than union voters hold very positive views of trade
unions, suggesting that in an era of declining density a successful union political strategy
depends on union ability to reach and influence these non-members.
1. The Union Share of the Electorate: Exit Polls vs Surveys
The political world uses exit polls to judge the importance of unions in the electoral
process. Exit polls ask voters who leave the polling place to fill out a short questionnaire on how
they voted and on their demographic and economic characteristics. Prior to 1992 different news
services had their own exit polls. From 1992 to 2000 the TV networks and newspapers
combined resources to create the Voting News Service to conduct exit polls in national elections.
Exit polls influence political thinking. In the 1990s some analysts argued that the
Democratic Party should seek upper income groups – soccer moms in suburbia rather than blue
collar workers, in part because exit polls show that college graduates make up a large proportion
of voters.8 As noted, claims that union political activity became more effective in the 1990s rests
in part on exit poll data that show a rising share of voters from union households.
Figure 1 displays the VNS estimate of the proportion of voters from union households
from 1992 to 2000 and the proportion of voters who were union members in 2000. Until 2000,
exit polls did not ask voters whether they were union members. Instead, it asked if they had
union members in their household. For this reason trend studies of the union share of voters
focus on the proportion of voters in union households rather than the proportion of voters who
are union members. The reported exit poll trend is striking: a seven percentage point increase in
the proportion of voters from union households between 1992 and 2000 driven by an increase of
4.8 million voters in union household compared to a decrease of 15.5 million voters from

5
9 US Census Bureau, Statistical Abstract of the United States gives 202.6. millionpersons of voting age and 104.7 million households in 2000 (table 54) , which gives 1.94 adultsper household in that year. The size of households has been falling.
10 If half of the nonunion adult population voted, and the turnout of union membersexceeded that of nonunion adults by 10 percentage points, the union share of voters would be17.5%; if turnout among union members was 20 percentage points above that of nonunionadults, the union share of voters would be 19.8% — far below the 26% reported by VNS.
11 The following calculations show this. For 1992 the VNS estimates that 21.6 millionvoters were in union households; CPS data show that approximately 31.2 million persons werein households with union members in 1992. This implies a turnout in union households of 69%. For 2000 the VNS estimates that 26.3 million voters were in union households while CPS datashow that about 31 million persons were in households with union members, giving a turnout inunion households of 85%. By contrast, the VNS estimates that 92.2 million voters were innonunion households in 1992; CPS data suggest that approximately 162 million persons were innonunion households in 1992 , giving a turnout rate of 58%. In 2000 the VNS estimates that
nonunion households. This, despite a drop in union density of 2.6 percentage points over the
same period. With numbers like these it is no wonder that union leaders saw the political
process as an efficacious way to exercise influence on behalf of workers.
But the VNS picture of the union voting population is inconsistent with estimates of
union membership at workplaces. In 2000 the voting age population consisted of 206 million
adults. Unions had 16.3 million members,13 million in the AFL-CIO, 2.6 million in the NEA,
0.4 million in the Carpenters union, and the remainder in various independent unions. Thus,
union members made up 7.9% of the voting age population. Census data indicate that
households average 1.9 adults, so that approximately 15% of all persons of voting age were in
union households.9 Higher turnout by union members than non-members could readily raise the
proportion of voters in union households 2-3 percentage points above 15% but not to the 26% of
voters shown in figure 1.10 To increase the proportion of voters in union households by the 7
percentage points shown in the figure would require union turnout to rise by 30 percentage
points relative to nonunion turnout. This is a near arithmetic impossibility11 and a near political

6
76.8 million persons from nonunion households voted; CPS data suggest that approximately 176million persons were in nonunion households, giving a turnout rate of 44%. Thus, the figure 1data imply a 16 point increase in turnout from union households and a 14 point fall in turnout innonunion households! One problem is that the VNS shows a 10.7 million fall in voters between1992 and 2000, whereas administrative data show an increase of 1.2 million. (Seewww.fec.gov/votregis/turn/natto.htm and www.fec.gov/pages/2000turnout/reg&to00.htm.)
12 It is possible to obtain data on the union status of persons not in the outgoing rotationgroup in the November samples by matching them to union data for the months when they are inthe outgoing rotation group. Since the November sample has approximately 12,000 persons inthe outgoing rotation group, there is no need to expand the sample through such matching.
impossibility since it implies that Clinton won the 1992 election with low union voting.
If the VNS trend data are inaccurate, where can we get a better picture of
the union share of the electorate? And what exactly is wrong with the VNS numbers?
Alternative Sources: CPS , NES, and GSS
Three nationally representative surveys provide information on voting by union status:
the CPS November voting supplements; the National Election Study (NES) conducted by the
University of Michigan; and General Social Survey (GSS) conducted by the National Opinion
Research Center of the University of Chicago.
The CPS asks all adults or all adults eligible to vote about their registration and voting in
November of each national election year. The survey also asks employed respondents in the
outgoing rotation group about union membership and collective bargaining coverage at their
workplace. Combining respondents who report their union status and voting behavior gives a
sample of roughly 12,000 persons per year – the largest survey based sample with information
on unionism and voting. While the CPS does not ask if other members of the household are
union, the CPS sample contains a household identifier from which I construct households and
thus determine which households have union members.12
The NES provides information on whether a voter was in a union household from 1948 to

7
13 See http://www.umich.edu/~nes/studyres/nes48_00/nes48_00.htm for the number ofpersons in each years’ election sample.
14 CPS response rates average around 93%. The National Center for EducationalStatistics, Supplemental notes 2 shows the low over-reporting bias in the CPShttp://nces.ed.gov/programs/coe/2003/notes/n02.asp
15 There were 134 persons who reported union membership on the 2000 NES and 167persons who reported union membership on the 1996 GES.
2000 and whether the voter was a union member from 1996 to 2000. It is the most detailed
survey on voting behavior, asking about political activity and attitudes through both a pre-
election survey and post-election survey. The NES asks about the party/candidate for whom the
respondent voted. It validated self-reported voting in several elections from 1964 to 1990 by
sending field interviewers to local election offices to look at the office's record of participation
for NES respondents. This is important given that more individuals report having voted than
actually do so. But the NES sample is much smaller than the CPS sample -- around 1700
respondents per election.13
The GSS contains information on the union membership of the respondent and their
spouse and whether they voted in elections from 1972 to 1998. It also contains questions on the
persons’ attitudes toward political and economic issues and whether they engage in other
political activities, such as contributing to a political party or going to rallies.
In this study I concentrate on the CPS files because the CPS has the largest number of
respondents, low non response rates, and a smaller reporting bias in voting than the NES;14 and
because the small sample sizes of the NES and GSS surveys gives them few union respondents
from which to examine the voting behavior of union members.15 Still, the NES and GSS are
helpful in assessing divergences between the VNS and CPS and the NES is critical for
estimating how union status affects party/candidate preference, on which the CPS is silent.

8
16 The number of persons who report that they have a collective bargaining contract butare not members is less than 10%. The CPS does not ask whether union members have acollective contract.
Table 1 records the union share of voters in the CPS, NES, and GSS surveys from 1990
to 2000 and compares that information with VNS exit poll data. The CPS asks two questions
about union status: whether the person is a union member and, for non members, whether their
workplace is covered by a collective bargaining contract. Since a union affects all workers at an
organized work site and the union wage literature focuses on having a collective contract, I
measure unionism as the sum of these responses.16 The NES and GSS questions relate to union
membership only. The first four columns of table 1 record the percentage of voters who say they
are union members/covered by a union contract. The next four columns record the percentage of
voters from a household with at least one union member. Because the CPS scrambled the
household identification variable in the November 1994 survey, I cannot estimate union
household voting in that year.
There are striking differences between the VNS and the other surveys in the level and
trend in the union share of voters. In 2000 the CPS and NES show similar proportions of voters
in unions, (11% (CPS); 10% (NES)) and in union households (17% (NES); 19% (CPS)). By
contrast, the VNS reports a union share of voters of 16% and a share of voters from union
households of 26%. The GSS estimated share of union members among voters in 1992 and 1996
modestly exceeds the CPS estimates, but the GSS estimated share of voters from union
households are in the same range as the NES and CPS estimates in those years. With regard to
trend, the CPS and NES show slight drops in the union household share of voters while the GSS
shows stability in the union share. This contrasts to the 1992-2000 increase in the union
household share of voters in the VNS.

9
17 Voter News Service General Election Exit Polls, ICPSR 2780, 1988 VNS Exit PollMethodology, p 8,
Why does the VNS give a rising trend?
The reason the VNS gives a rising trend in the union household share of voters whereas
the other surveys show stable or falling density can be readily determined. The reason is that the
VNS changed its questions about union status over time in a way that biases the trend upward.
Panel A of table 2 records the VNS questions about union status in 2000, 1996, and 1992. In
2000 the VNS asked if the respondent or someone else in their household was in a union and
probed whether the individual, someone else, or both were in the union. In 1996 the question
was: “do you or does someone in your household belong to a labor union?” and had places for
the respondent to mark yes or no. The probes in 2000 arguably led to more people reporting
union members in their household than in 1996, but the big change in questions occurred
between 1992 and 1996.
In 1992 the VNS did not ask a regular question about union status. Instead, it asked
respondents to check yes if they were in a union household as part of a “Grabbag” of 9 items –
questions about whether the person was a born-again Christian, whether they once thought they
would vote for Ross Perot, were a first-time voter, and so on. The grabbag item was the last
question on the second page of the questionnaire, which some persons did not read or read but
did not answer. This design necessarily underestimates the union share of persons in that year’s
poll. The VNS warns: “Exit poll users are cautioned against comparing estimates from the
Grabbag with those from full questions because the Grabbag significantly underestimates the
population values”.17 Failure to heed this warning produced the putative jump in the union share
of voters from 1992 to 1996 and 2000.

10
Panel B of table 2 uses information from earlier exit polls to show that the change in
question design can indeed account for the reported trend. In 1988 CBS and ABC ran their own
exit polls. CBS used a question comparable to the 1996 VNS question: “Are you or is any
person living in your household a member of a labor union?” and obtained a positive response
from 26.6% of voters. ABC listed a set of 14 items under the question “do any of the following
apply to you?” including being a member of a union household. Barely 10 percent of
respondents checked this item. Thus within the same year the two questions elicited responses
that varied by 17 percentage points. Going further, in 1984 ABC asked a question “is anyone in
the household in the union?” as a separate item and obtained a 26.9% response. The responses
to different forms of the union question validates the VNS warning that responses from the
grabbag design cannot be compared to responses from single question items.
On the basis of the CPS trend data in table 1, I conclude that the share of voters in unions
fell by about 1 percentage point and the share of voters in union households fell by about 2
percentage points from 1990 to 2000. The VNS-based estimated increase in the union share is
erroneous.
What is the correct union share of voters?
So much for the trend. Which of the numbers in table 1 provide the best estimate of the
the union proportion of voters in 2000? Why does the VNS record higher shares of union voters
than the CPS and other surveys even though union status questions in 2000 are quite similar?
One reason the VNS reports a higher union percentage than the CPS is that the VNS asks
the union status of persons regardless of their employment status, whereas the CPS asks union
membership only for wage and salary employees. By asking non employed as well as employed
persons to declare their union status, the VNS necessarily reports a larger union share of the
voting population than the CPS. But the NES and GSS also ask all respondents about their union

11
status and report union shares of voters closer to the CPS estimates than to the VNS estimates.
To get a better handle on the differences in the union share of voters among surveys, I
computed the union share of voters by employment status and age. Since the CPS asks union
status only of employed persons, the comparable figures from the other surveys relate to
employed persons. If many non employed persons call themselves union members because they
are retirees affiliated with a union, the VNS, NES, and GSS should show a high union share of
older non employed voters.
Table 3 gives the share of voters who report themselves union members by employment
status and age in the CPS, VNS, and NES in 2000 and in the GSS for 1996. In the CPS, NES,
and GSS, employment is defined by a standard labor force activity question; whereas the VNS
asks whether or not the person works full-time. Although this excludes part-time workers, the
VNS sample contains a higher proportion of employed persons than the CPS sample of voters
(presumably due to response bias in exit polls, where employed educated persons are more likely
to respond). Still, among employed persons, the union share of voters in the VNS is similar to
that in the CPS. The outlier in terms of the voting of employed persons in 2000 is the NES,
which shows a relatively low union share of employed voters. The similarity between the VNS
and CPS figures in the union share of employed voters supports the claim that the union share of
voters is higher in the VNS because the VNS includes non employed persons as union voters.
Among non employed persons, the VNS and 1966 GSS estimates of the union share of voters
give similar estimates, with the NES again recording the lowest union share.
So the question becomes,”should we regard non employed voters who declare themselves
to be union members on the VNS and other surveys as genuine unionists for calculating the
union share of the electorate, or should we view the large number of non employed members as

12
18 These are all based on small samples, as pointed out in footnote 15.
largely measurement error?” If the estimated number of non employed union members is valid,
the VNS gives a better measure of the union share of voters (though not of the trend in the share)
than the CPS. If the estimated number of non employed union members is due largely to
measurement error, the CPS gives a better measure of the union share of voters than the VNS.
As noted, some non employed persons reporting themselves as union members are likely
to be retirees who retain union membership or otherwise identify with the union that represented
them when they were employed. In this case, we would expect that the VNS, NES, and GSS to
show a larger union share of voters among older non employed persons than among younger non
employed persons. Table 3 does not support this expectation. The union shares of voters
among non employed persons are not markedly different for persons aged 60 or older than for
younger persons. Still, because older persons are more likely to be non employed and are more
likely to vote than younger persons, the older persons make up a large proportion of non
employed union voters. In the VNS 41.3% of non employed union voters were aged 60 or more;
in the NES 41.7% of non employed union voters were aged 60 or more; in the GSS 75% of non
employed union voters were aged 60 or more. In addition, on the NES 50% of non employed
union voters said that they were retired, while on the GSS 69.4% of non employed union voters
said that they were retired.18 Thus, a sizeable proportion of non employed persons who say they
are union members are retirees likely to be connected to unions in some fashion.
Union estimates of the number of retirees affiliated with them provide an independent
check on the importance of this group in the union share of voters. The AFL-CIO claims that 2.5
million retirees are part of its Alliance for Retired Americans – a group set up by the unions to

13
19 See http://www.retiredamericans.org/ But the AFL-CIO automatically enrolls retiredmembers of participating unions and members of its predecessor organization the NationalCouncil of Senior Citizens into the Alliance for Retired Americans without charging dues. Many retirees may not know they are affiliated with the union group or may reject such anaffiliation.
20 http://www.uaw.org/about/uawmembership.html
21 http://www.nea.org/retired/about/history.html
22 This statistic is obtained by dividing the 2.7 million retirees reported by the AFL-CIOand NEA by the 15.6 million members in the two groups, giving a figure of 16% and assuming asimilar percentage for
provide a voice for retired workers, that includes retirees from all federation unions.19 The
United Automobile Workers reports approximately 710,000 active members and over 500,000
retired members in the United States, Canada and Puerto Rico.20 Outside the Federation, the
National Education Association reports over 205,000 members in its NEA-Retired affiliate.21
Other independent unions presumably also have retirees who maintain a union link. If the CPS
had asked these persons their union status and they had declared themselves as “union”, the
union proportion of adults of voting age would be 16% higher than reported on the CPS22. If,
moreover, the turnout of these persons exceeded that of nonunion persons by an amount similar
to that found among the employed on the CPS, the union share of voters would be 13% rather
than the 11% given in the CPS column in table 1. This two percentage point difference is
roughly one third of the difference between the VNS and CPS estimates of the union members’
share of voters in table 1.
The VNS and CPS differ in other ways, however, that suggest that, retirees aside, CPS-
based estimates of union voters may be more accurate than VNS-based estimates. The response
rate of the VNS in 2000 was just 51% – a decline from 60% in 1992 – whereas the CPS response
rate has been fairly constant at about 93%. The VNS reports a higher share of voters with

14
23 In 2000 I find the following proportions of voters in a union by education groups: college graduates, 5+ college grads, 4 college 1-3 hsgrads less than hs
CPS 10.7% 20.9 30.5 28.7 9.3VNS 17.7% 23.9 32.4 20.9 5.2
college degrees and a smaller share of voters with high school or less education than the CPS
(Texeira, 2000).23 In addition, whereas the VNS and CPS surveys report similar union shares of
voters among those with 4 or 5+ years of college, the VNS reports a much larger union share of
voters among less educated workers than the CPS. The implication is that the VNS under
represents less educated nonunion voters, and thus may overestimate the union share of voters.
Voting behavior to judge union responses
Another way to assess the validity of the union status of non employed persons whom
the VNS counts as union is to examine how these “union members” vote. If non employed union
members vote in the same manner as employed union members, counting them as union voters
would seem reasonable. By contrast, if non employed union members vote in the same manner
as nonunion voters, counting them as union voters would seem to be erroneous. Formally,
assume that non employed union respondents are a mixture of “real” unionists and persons
given that label due to measurement errors. Let " be the share who are real unionists, P be the
proportion of real union (employed) persons who support union favored candidates, and Q be the
proportion of nonunion non employed persons who support union favored candidates. Then "P
+ (1-") Q would be the observed proportion of non employed persons claiming to be union
members who support union favored candidates. In 2000 unions supported the Democratic
candidate for President and Democratic candidates in most House races, so I use the proportion
of voters who favored the Democrats to measure Q.
Figure 3 displays the relevant conditional probabilities in the 2000 VNS. It shows the

15
24 See US Statistical Abstract 2001, table 401
25 Here I take the CPS estimate that each family has about 1.9 adults.
proportion of employed and non employed voters by union status who supported the Democrats
in the 2000 Presidential and Congressional elections. The non employed persons who claimed
union status voted Democratic in proportions much closer to employed unionists than to
nonunion voters. For the Presidential election, the estimated " is 0.82 ; for the House election, it
is 0.72. To be conservative I will count 75% of the reported union non employed persons on the
VNS as being valid union responses in assessing union proportion of non employed voters.
Given an estimate of the proportion of non employed voters who are union, I form a
weighted average of the union share of employed voters and of the union share of non employed
voters to obtain the union share of all voters. In 2000 67% of all voters were employed and 33%
were non employed.24 Given its size and representativeness, the CPS offers the best estimate of
the union share of voters among the employed: 18% in 2000. For the union share of non
employed voters, I average the VNS, NES, and GSS’s (1996) estimated union shares of note
employed voters to obtain 9.2% and discount this average by 25%. This gives an estimate of the
union share of non employed voters of 6.9% and an estimate of the union share of all voters of
14.4%. This statistic is closer to the VNS estimate than to the CPS estimate in table 1. To
transform this into an estimate of the proportion of voters in union households, I multiply it by
the ratio of the union household share of voters to the union share of voters in the 2000 CPS
from table 1. This yields an estimate that 25% of voters come from households with a union
member – again closer to the VNS statistic than to the CPS statistic.25
2. The Effect of Union Membership on Turnout
The union share of the electorate depends on the union share of the voting age

16
population, and on the turnout of union members and their families. In this section I use the
CPS, NES, and GSS to compare the turnout of persons associated with unions to the turnout of
persons with no union connection. I estimate two statistics: the union voting gap, defined as the
mean difference between the proportion of union members (or members of union households)
who vote and the proportion of nonunion members who vote; and the union voting premium,
defined as the difference in voting rates among persons with and without union attachment who
have observationally similar characteristics. The union voting gap is analogous to the mean
difference in wages between union and nonunion workers. Given the union share of the voting
age population, it determines the share of voters who are union. The union voting premium
provides an estimate of the causal impact of unionization on turnout analogous to labor
economists’ estimates of the union wage effect.
the union voting gap
To assess the union voting gap, I tabulated the proportion of persons who vote by union
status in the CPS, NES, and GSS surveys. Because some survey respondents report that they
voted in an election when they did not, the raw figures yield an upwardly biased estimate of the
turnout of both union and nonunion persons. To see if the bias is correlated with union status, I
examined the level of misreporting of voting by union status in NES surveys that included a
validation check based on administrative records. These calculations show that a similar
proportion of reported votes were valid between union and nonunion members (Appendix table
A). On average the NES validated the votes of 84% of union members who said they had voted
and validated the votes of 82% of nonunion members who said they had voted. Thus, on this
survey at least, union members and nonmembers exaggerated their participation at the ballot box
similarly, in a way that can be rectified by multiplying the reported turnouts by the estimated

17
rates of over reporting.
Table 4 records the proportion of persons who vote in the CPS by their employment
status, their union status, and the union status of their household. Because the CPS scrambled
household IDs in the November 1994 survey, I could not construct households in that year, so
there are no 1994 union household figures. The columns headed “Employed persons” record the
voting rates of four groups: union members, nonunion employed persons, and nonunion
employed persons in union households and nonunion employed persons in nonunion households.
The differences in voting rates between union members and all employed persons average 10.0
points in presidential year elections and 13.0 points in midyear elections (bottom lines, column 1
- column 2). In addition, employed nonunion persons in union households have a 4 point higher
rate of voting than employed nonunion persons in nonunion households (column 3-column 4).
Within union households, members have a 7 to 9 percentage point voting advantage over
employed non-members (column 1- column 3).
The columns headed “non employed persons” contrast the voting rates of non employed
persons in union households with the voting rates of non employed persons in nonunion
households. Here, the story is quite different. Non employed persons in union households vote
less frequently than non employed persons in nonunion households. The union/nonunion
difference is - 1.3 points in presidential elections and -7.2 points in non-presidential elections.
One possible explanation for the differential union household effect on the voting of
non-members by their employment status is that the workplace and employment issues that
unions stress resonate more with the employed than with the non employed. One possible
explanation for the negative effect of unionism on the voting of non employed members is that
the non employed in nonunion households tend to be older than the non employed in union

18
households.
Ensuing regression analyses will examine this possibility.
Finally, the columns headed “all” in table 4 give the voting rates of all persons in
households with union members and the voting rates of all persons in households with no union
members. Persons in union households have 5 to 6 point voting advantage over persons in
nonunion households.
Figure 2A shows the union voting gap between persons in union households and those in
nonunion households on the NES for each election from 1948 to 2000. In all but two elections
persons from union households had a higher voting rate than persons from nonunion households.
Over time the union voting advantage in the NES rises from 3-4 percentage points to 10 or so
percentage points in the 1990s, which is larger than the CPS union household advantage in the
1990s. Figure 2B displays the percent of persons in union households and the percent of persons
in nonunion households who voted in presidential elections in the GSS surveys from 1968 to
1998. Again, there is a union turnout gap, which rises to 10 or so points in the 1990s.
On the basis of these data, I conclude that union members and persons in union
households are more likely to vote than non-members, with a 10 percentage point gap for
members and a 5-6 percentage point gap for households in the CPS and larger differentials for
households in the other surveys in the 1990s.
the union voting premium
To what extent, if at all, do to the mean union/nonunion differences in voting rates reflect
differences in the characteristics of union/nonunion associated persons as opposed to the impact
of unionism per se or union mobilization campaigns on their voting behavior?
An ideal way to answer this question would be to compare the voting behavior of the

19
26 This comparison has complexities. If unions induced someone to vote, persistence ofvoting would bias downward the estimates of the union impact on voting behavior when a personwent from union to non-union status. In this case, a better test of the union effect would be tocompare the change in voting among persons who switched from a nonunion job to a union job.
27 This also has complexities, since the decision to devote effort to one election ratherthan another will be partially influenced by union leaders’ belief in how the elections mightproceed and in the effectiveness of a union mobilization campaign.
28 There are five nonunion groups: nonunion employed person living alone, nonunionnon employed person living alone; for persons living with another person: two nonunionemployed persons; one employed person and one non employed person, and two non employedpersons. There are four union groups: union persons living alone; two employed union persons,one union and one nonunion employed; and one union and one non employed person.
same person from one election to another as they moved from a union to a nonunion job or
conversely.26 An alternative research strategy would be to relate union members voting behavior
to differences in unions allotting more/less resources to mobilizing voters among elections.27
The CPS data do not follow persons from one election to the next, and there are no readily
available data on the allocation of union resources across states, so that the best I can do in this
study is to estimate the extent to which the union voting gaps shown in table 4 are attributable to
differences in measurable socioeconomic characteristics between union members and non-
members. Accordingly, I estimate a linear probability model that relates a dichotomous VOTE
variable (1=voted; 0 = did not vote) to socioeconomic covariates and dummy variables for the
union status of a person or their household.
Because the CPS differentiates persons by their employment status, union status,
residence in a household with another adult, and by the employment and union status of that
other adult, variations along these dimensions create 9 non-overlapping groups of union and
nonunion persons28 from which one can make various union/nonunion comparisons Rather than
presenting a full set of group differences, I focus on three main comparisons.
20
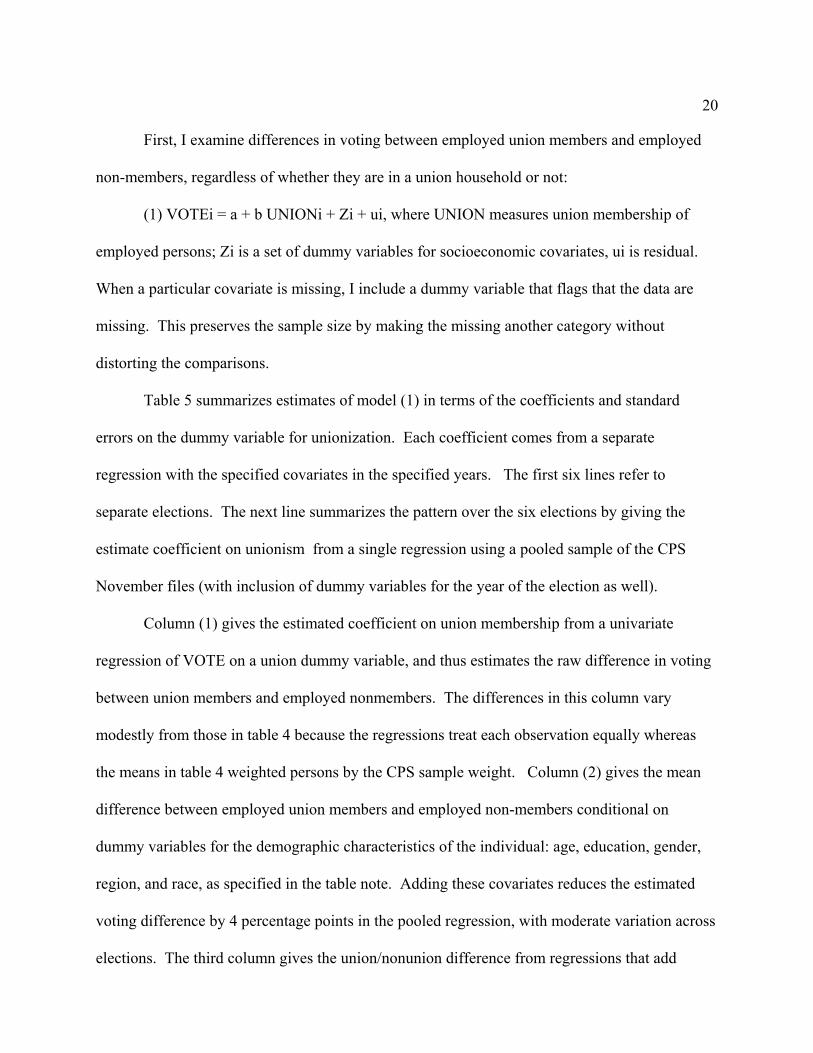
First, I examine differences in voting between employed union members and employed
non-members, regardless of whether they are in a union household or not:
(1) VOTEi = a + b UNIONi + Zi + ui, where UNION measures union membership of
employed persons; Zi is a set of dummy variables for socioeconomic covariates, ui is residual.
When a particular covariate is missing, I include a dummy variable that flags that the data are
missing. This preserves the sample size by making the missing another category without
distorting the comparisons.
Table 5 summarizes estimates of model (1) in terms of the coefficients and standard
errors on the dummy variable for unionization. Each coefficient comes from a separate
regression with the specified covariates in the specified years. The first six lines refer to
separate elections. The next line summarizes the pattern over the six elections by giving the
estimate coefficient on unionism from a single regression using a pooled sample of the CPS
November files (with inclusion of dummy variables for the year of the election as well).
Column (1) gives the estimated coefficient on union membership from a univariate
regression of VOTE on a union dummy variable, and thus estimates the raw difference in voting
between union members and employed nonmembers. The differences in this column vary
modestly from those in table 4 because the regressions treat each observation equally whereas
the means in table 4 weighted persons by the CPS sample weight. Column (2) gives the mean
difference between employed union members and employed non-members conditional on
dummy variables for the demographic characteristics of the individual: age, education, gender,
region, and race, as specified in the table note. Adding these covariates reduces the estimated
voting difference by 4 percentage points in the pooled regression, with moderate variation across
elections. The third column gives the union/nonunion difference from regressions that add

21
dummy variables for occupation and class of employment to the covariates, as specified in the
table note. This reduces the union/nonunion difference by 2 percentage points on average. The
union coefficient of 0.06 in the pooled sample is just half of the initial 12 point union/ nonunion
member difference in voting. The fourth column gives the union coefficient from regressions
that include dummy variables for family income. This lowers the union coefficient by another 2
percentage points in the pooled sample. Comparing the 0.04 coefficient in column (4) with the
0.12 coefficient in column (1) for the pooled sample, we see that the regression accounts for
2/3rds of the union voting gap.
My second comparison deletes from the sample employed nonunion persons in union
households, on the assumption that unions affect the voting behavior of nonunion members in
union households as well as affecting the voting behavior of members. The line listed
“employed union and employed nonunion in nonunion household” records the coefficients and
standard errors from regressions limited to those groups for the pooled 1990-2000 sample. If
unions raise the probability of voting for nonunion employed persons in union households, the
the estimated coefficients on unionism in these lines should be larger than those in the preceding
line and give a more valid estimate of the union impact on voting. In fact, the coefficients on
unionism in these regressions are similar to those from the sample that includes all employed
nonunion members: there simply are not enough employed nonmembers in union households for
the change in sample to have much impact on the regressions.
The last line in table 5 limits the sample comparisons even further. It presents regression
coefficients for the union impact on voting for persons in 2 adult households only. This enables
me to assess the possibility that characteristics of another adult in a household as well as the
person’s own characteristics affects their voting. It is possible that some of the estimated union

22
29 Since this analysis focuses on the characteristics of another person in the household butnot on that persons voting behavior, it does not run into the Manski “reflection problem” thatresults from having the dependent variable on both sides of the equation.
effect on voting could be due to the characteristics of other members of a union household rather
than with union status. Union members might, for example, have older highly educated spouses
than nonmembers, which would increase their likelihood of voting independently of unionism
per se. To the extent that union members have other household members with characteristics
that lead persons to vote, the regressions that exclude the characteristics of other household
members could overstate the impact of unionism on turnout. Accordingly, the regressions in line
4 limit analysis to households with two adults where at most one is a union member and adds
dummy variables for the age, education, occupation, and class of worker of the other adult in the
household to equation (1).29 The column 5 regression shows that inclusion of the characteristics
of the other adult resident in the household does not change the coefficient on union membership
from that in column 4 when those characteristics are not included. The estimated final union
effect in this line is 0.05, which compares to an initial differential of 0.11 in this sample.
In sum, there is a union/nonunion voting premium among persons with observationally
equivalent characteristics, including characteristics of the other adult in their household, of about
0.04 points, with some variation among elections and samples. Much of the union/ nonunion
voting gap is due to the differential characteristics of union and nonunion workers.
The effect of a union household on nonunion persons
As noted, unions may affect the voting behavior of nonunion members of households
with members. Indeed, an implicit assumption in analyses that focus on the share of voters from
union households is that the voting behavior of non-union persons in union households differs
from that of persons in nonunion households. To examine the impact of being in a union

23
household on the voting behavior of nonunion members, I estimate the following equation:
(2) VOTEi = a + b UHi + Zi + ui, where UH is a dummy variable that measures whether
the household has a union member.
For ease of presentation, I summarize in table 6 the results of estimating equation (2) for
the pooled 1990-2000 sample (with 1994 excluded due to the Census’s scrambling family IDs).
Since I am concerned with the effects of a union person on nonunion members in a household, I
limit the sample to nonunion persons living in households with more than one adult. Each of the
coefficients in table 6 comes from a separate regression with the covariates as specified in the
relevant column. Line 1 estimates the effect of being in a union household on all persons in
households with more than one adult. The coefficient absent any covariates in 0.03.
This differential is one-quarter of the 0.12 differential between union members vs nonmembers
in the comparable table 5 calculation (line 2, column 1, for pooled all employed sample). The
estimated union effect in table 6 rises with the addition of demographic and job covariates
(columns 2 and 3) but then falls back to 0.03 in column 4 with the addition of the dummy
variables for household income. In column 5, I examine the possibility that the characteristics of
union members of households rather than their union status underlies the higher voting rate of
nonunion persons in union households, by adding dummy variables for the age, education,
occupation, and class of worker of the other person in the household. This calculation compares
the voting behavior of persons in union and nonunion households with otherwise observationally
equivalent household members. The coefficient on union household member falls to 0.02. This
union impact is smaller than the union voting premium estimated for members in table 5.
To examine whether the table 4 finding that being in a union household is associated with
higher turnout of employed nonmembers but lower turnout of non employed non-members, I

24
estimated equation (2) separately for nonunion persons who are employed and those who are non
employed. Lines 2 and 3 of table 6 give the regression coefficients from these calculations. The
coefficients on unionization in lines 2 and 3 of table 6 suggests that much of the differential
voting behavior between employed and non employed nonunion members in union households is
attributable to their differing characteristics. Column 1 estimates that unionism has a 0.07
impact on the voting of non-members among employed persons compared to a -0.02 impact on
non employed members of the household. But addition of demographic covariates reduces this 9
percentage point gap in voting to just 2 percentage points, and the addition of other covariates
keeps the estimate in the 1 to 2 percentage point range. In the calculation with all the covariates
the difference between the estimated union coefficients for employed and non employed
nonunion members is modest, about 1 percentage point. Thus these calculations show that
unions do only marginally better mobilizing employed persons in union households than they do
in mobilizing non employed persons to vote.
Finally, note that the comparison of employed nonunion persons in union households to
employed nonunion persons in nonunion households in line 2 of table 6 uses the same nonunion
household group as its base for estimating the union effect as did the calculations for the pooled
sample that excluded employed nonunion persons in union households in line 2 of table 5. The
difference in the coefficients between these two lines give the union voting effect on union
members and on employed nonmembers in households relative to the same nonunion employed
group. The coefficient on union members is much larger than that for nonmembers in union
households in the relevant column 1 regressions of tables 5 and 6 (a 5 percentage point gap =
0.12 - 0.07), but the difference in coefficients decline rapidly with the addition of covariates to 0
percentage points in columns 3 and 4 between the two tables. The implication is that unions

25
have as great an effect on the turnout of employed nonmembers in union households as on
members.
In sum, the CPS data shows that among observationally equivalent persons, union
members have a higher turnout than non-members, while nonunion persons in union households
also have higher turnout than persons in nonunion households. Although the regression analyses
cannot rule out the possibility that some unobserved fixed characteristic of union members or
households underlies the differences, at the minimum they show that the union voting premium
is much smaller than the raw union/nonunion difference in voting rates.
3. The Effect of Unions on Party Voting Preferences
If union members voted similarly to other voters in elections, their higher turnout would
not influence election outcomes. Exit polls show, however, that union voters disproportionately
support Democrats in national elections. In the Presidential election of 2000 union members
voted 62% for Gore while non-members voted 52% for Bush. In the 2000 New Hampshire
Democratic primary, 60% of union household members voted for Gore while 51% of nonunion
households voted for his rival, Bradley. Political analysts often cite statistics like these to show
the influence unions have on the voting behavior of their members.
Simple comparisons of the voting choices of union members and nonmembers are,
however, likely to overstate the extent to which unions affect the votes of their members. Such
comparisons do not distinguish between preferences that union members have independent of
union politicking. As democratic organizations, unions generally endorse candidates favored by
a majority of members, so that even if unions did not influence how members voted, a majority
of members would vote for union-endorsed candidates. To determine whether unions influence
members’ votes requires analysis of the voting behavior of union members on the margin

26
30 Mark Bucher, "Strong Majority of California Voters Support Paycheck ProtectionInitiative," Yes on 226, Press Release, February 27, 1998. Dana Milbank, "California'sProposition 226, a Powerful Threat to Labor's Political Clout, Draws Many Workers," The WallStreet Journal, March 18, 1998, p. A24.
between candidates or inclined toward union-opposed candidates compared to the voting
behavior of otherwise comparable nonunion voters, and to the extent to which union members
intending to vote for union favored candidates end up voting for them compared to otherwise
comparable nonunion voters intending to vote for union favored candidates.
Perhaps the most striking example of union success in changing votes occurred in the
1998 California referendum over proposition 226, the so-called paycheck protection bill. This
proposition required unions to obtain members’ written permission before they could use dues
money for political purposes and prohibited employers from making automatic deductions from
paychecks for political contributions or expenditures without the workers' annual written
permission. Claiming that unions in California spent approximately $81 million of their dues for
political purposes over a typical two-year election cycle, conservatives introduced the
referendum to reduce union political spending and influence. Initially, most voters supported the
proposition. A January 1998 California Field poll found that 71 percent of the general public
and two-thirds of union households favored the proposition.30 But the AFL-CIO and California
unions undertook a massive campaign to convince voters that the initiative would unbalance
politics by reducing union spending while allowing corporate funding of candidates to continue
unabated. The AFL-CIO Executive Council approved the allocation of $13 million to launch a
campaign to defeat Proposition 226. Unions in California made 650,000 phone calls to voters,
visited 18,000 work sites, sent 500,000 pieces of mail to union members' homes, and went block
by block in 5005 precincts talking to voters face-to- face. The campaign convinced members

27
and other voters that the proposition would silence the voice of labor and allow business to
dominate the political scene. Fifty-four percent of the electorate rejected the proposition.
Unions have defeated similar paycheck protection propositions in other states as well, and have
beaten back most efforts to enact state level laws outlawing contracts that require non-members
to pay dues or fees in workplaces with collective bargaining (so-called right to work laws).
But union ability to influence members and other voters in these battles does not
necessarily translate into influencing members to support union favored candidates in standard
elections. Thirty to forty percent of union members vote Republican. Many belong to the
National Rifle Association or other groups whose political agenda usually differs from that of
unions. Most union members are relatively high wage workers (in part because of collective
bargaining) who might be expected to favor more conservative economic or tax policies than
union leaders typically favor. Substantial numbers of union members supported Ronald Reagan
in his Presidential bids, though to a lesser extent than nonunion members. The key issue is the
magnitude of the union impact on the voting preferences of members. In their analysis of the
1978 election, Delaney, Masters, and Schwochau (1990) found that union members and to a
lesser extent nonmembers in union households supported candidates endorsed by the AFL-CIO’s
Committee on Political Action (COPE) to a substantially greater extent than did otherwise
similar persons from nonunion households. By contrast, Clark and Masters (2001) report that
while union members favored union candidates in the 1994 Pennsylvania elections enough
agreed with the Christian Coalition and National Rifle Association on some union political goals,
to have voted against their economic interests to have produced a defeat for unions.
To see how unions affect the voting behavior of union members and persons in union
households on a broad set of elections, I use the cumulative NES data files from 1948 to 2000. I

28
31 The codebook describes the interviewer statement: “ratings between 50 degrees and100 degrees mean that you feel favorable ... ratings between 0 degrees and 50 degrees mean thatyou don’t feel favorable” http://www.umich.edu/~nes/studyres/nes2000/cbk00all.htm
focus on two issues: the extent to which the political attitudes of union members differ from
those of nonunion members with similar characteristics, which I will call the long run impact of
unionism; and the extent to which unions alter workers’ voting in particular elections conditional
on those attitudes, which I call the immediate impact of unionism. Although unions sometimes
endorse Republican candidates, in most elections and areas, unions favor the Democrats, so I
take voting Democratic as the best measure of the union preferred candidate. First, I estimate an
equation in which voter attitudes depend on the socioeconomic characteristics of the voter (Zi)
and their connection to unions:
(3) ATTi = cUNIONi + Zi + ui
Then I estimate an equation relating the decision to vote Democratic to unionism and
characteristics:
(4) DEMi = a + b Unioni + Zi + ui,
Finally, I add the attitude variable to equation (4):
(5) DEMi = a’ + b’ Unioni + Zi + c ATTi + ui,
If the union effect on members voting Democratic operates solely through the intervening
attitude variable, addition of ATTi to the model would reduce the coefficient on unionism to
insignificance, producing a recursive model of the union impact on voting: unionism –> attitudes
–> voting. Contrarily, if addition of the attitude variable does not affect the coefficient on
unionism, then the union impact will be immediate, dependent on that particular campaign..
To measure attitudes I use the NES’s thermometer scales. Thermometer scale questions
ask respondents to give a 0 to 100 score on how they view a particular institution or policy.31 I

29
take the difference between the thermometer score respondents gave the Democratic Party and
the thermometer score they give the Republican Party as a measure of the propensity to favor the
Democrats. Similarly, I take the difference in the thermometer score each respondent gave to
liberalism and the thermometer each gives to conservativism as a measure of liberal attitudes.
By taking differences, I eliminate personal scaling factors due to persons giving high or low
scores in general. For instance, the difference in scores gives someone who places the
Democrats at 30 and Republicans at 40 the same measure as a person who places the Democrats
at 60 and Republicans at 70.
Using the NES data, I estimated models based on equations (3) - (5) for the 2000 election
and for a pooled sample of all elections from 1948 to 2000. Panel A of Table 7 gives the
estimated coefficients (standard errors) on a dummy variable for union membership under
different regression specifications. As in previous tables, each coefficient comes from a separate
regression with the specified dependent and independent variables. Column 1, which gives the
coefficient on unionism in a uni-variate regression, measures the mean difference between union
members and non-members on the specified outcome. The first two lines show that union
members are more favorable to Democrats vs Republicans and toward liberalism vs
conservativism. Addition of demographic characteristics ( age, gender, years of education, race,
and household income) in column 2 increases the impact of unions on these attitudinal
indicators. This reflects the fact that union members are older, more skilled, and are in the upper
half of the income distribution, where persons have more conservative Republican leanings.
Unionism moves members to the left of where they would be given their socioeconomic status.
Line 3 of table 7 examines the impact of unionism on members’ intentions to vote for the
Democratic candidate for President prior to the election. It is taken from the pre-election NES

30
survey, in which interviewing begins in September and continues until the day before the
election. On average the pre-election data measure voting intentions about one month before the
election. In the 2000 election union members were 10 points more likely to intend to vote for
the Democratic candidate for President than nonunion members and were 14 points more likely
to say they planned to vote for that candidate after controlling for characteristics. But addition of
the thermometer variables reduces the coefficient on unionism by 5 percentage points between
the column 2 and column 3 regressions. The implication is that much of the union impact on the
pre-election intention of members to vote Democratic operates through the longer run impact of
unionism on attitudes toward liberalism/conservativism and toward the two parties.
The dependent variables in lines 4 and 5 are dummy variables for voting Democratic. As
in the earlier calculations, the coefficient on unionism rises with the addition of demographic
covariates and falls with the addition of the thermometer measures. The drop in the union
coefficient between column 2 regressions and the column 3 regressions imply that 40-50% of the
union impact on members voting Democratic in house and presidential elections occurs through
the thermometer indicators. The existence of a union effect conditional upon the thermometer
measures rejects a fully recursive model.
In the column 4 regressions I added to the equation a dummy variable for the voters’
intention to vote Democratic in the Presidential vote from the pre-election survey. In this case,
the coefficient on unionism for actually voting Democratic falls to insignificance. The
implication is that most of the union impact on members voting Democratic occurs prior to
election campaigns, either through the union impact on attitudes or on intention to vote. The
“immediate” union impact on voting during the campaign period was minimal.
An alternative way to examine the effect of unions on the voting behavior of members

31
32 These are from my tabulations of the NES data, unweighted. The sample sizes are just112 union respondents and 975 nonunion respondents. NES data for the 1996 Presidentialelection also shows insignificant differences between union and nonunion voters in the retentionof voters who said they intended to vote for Clinton and in the proportion of union and nonunionvoters switching from Dole to Clinton. Again, the sample sizes were small with just 152 unionrespondents and 923 nonunion respondents.
during the campaign season is to compare the extent to which union members and non-members
changed their initial intended vote during the campaign. If unions influenced votes during a
campaign, union voters who intended to support the Democrat should be more likely to stay with
that candidate than nonunion voters with the same initial intention, while union voters intending
to support the Republican should be more likely than nonunion voters intending to vote
Republican to shift toward the Democrat. In the 2000 election, the NES data show no such
pattern. In 2000, 91.3% of union members who said that they intended to vote for Gore reported
voting for him, but 95.2% of nonunion voters who said they intended to vote for Gore reported
doing so. Of the voters who initially favored Bush, 2.9% of union voters switched to Gore
compared to 4.5% of nonunion voters. Given the small number of union voters in the 2000 NES,
these differences are not significant. Still, they indicate that in the last month or so of the
campaign, unions did not induce members to switch to the union favored candidate more
frequently than nonunion voters switched to the union favored candidate.32
In Panel B of table 7, I expand the analysis from the 2000 election to all the elections
covered by the NES. The union variable in these regressions relate to having a household
member in a union – the standard NES question about unions prior to 1996. By pooling all of
the elections from 1948 to 2000, I greatly increase the sample size, which yields stronger
statistical results than are possible with the sample for the 2000 election. Panel B confirms the
main finding of panel A that much of the union effect on voting occurs through unionism

32
33 Steve Rosenthal, How Can Labor Impact the Current Political Agenda?”Labor andWorklife Forum January 14, 2003 Harvard University, power point presentation. “The morepersonal the form of contact the more likely we are to win union members’ support”.
34 Rosenthal, op cit.
affecting long term attitudes. The calculations in columns 1 and 2 show that over the longer
period, unions increased the favorableness with which members viewed the Democrats and
liberalism relative to Republicans and conservatism. The estimated coefficients on unionism in
the line 8 regression on intention to vote for the Democrat for President falls by 60% from 0.14
to 0.60 between columns 2 and 3, implying that the disproportionate union vote for Democrats
operates largely through the thermometer indicators. The column 4 regressions in lines 9 and 10
show that with the larger sample there is a statistically significant union effect on voting
Democratic even conditional on intention to vote Democratic, though the magnitude of the
coefficient on unionism is just 10-20 percent as large as coefficients in columns (1) and (2).
4. Union political activity and declining union density
Union leaders believe that unions affect the voting behavior of members and their
families by providing them with information about elections and candidates, particularly
through face to face discussions: “Talking to union members is the key”.33 AFL-CIO data on the
2000 election show that unions contacted 45% of members at the work site in states targeted for
special attention and 28% of members at work sites in states not so targeted. Ninety-three
percent of members said they had received some union contact regarding the election;34 69% of
members with “4 or more contacts” voted for Gore whereas only 61% of members with “0-1
contacts” voted for Gore. Unions estimate that among members receiving “high union
information” 76% voted Democratic in House races compared to 61% of members with “low
union information”.

33
35 All of these data are from the 2000 NES.
Data comparing union and nonunion persons from the NES Post-Election survey tell a
similar story. In 2000 the NES asked respondents about their receipt of political messages and
campaign participation. These data show that interested groups contacted union members more
frequently about the election than they contacted non-members. For example, 45% of union
members compared to 37% of non-members said that a political party had contacted them about
the election; 21% of union members said that someone else had talked with them about voting or
registering to vote compared to 10% of non-members; 40% of members said they had received
mail about the election compared to 25% of non-members. The sole exception to the union edge
is the use of the Internet, where 49% of nonunion respondents compared to 36% of union
respondents said that they had seen information on the Internet. With respect to campaign
participation, union members also showed greater involvement than non-members: 47% of
unionists said that they tried to influence the vote of others compared to 34% of non unionists;
more union members said that they attended meetings or rallies and contributed money to a
political campaign. Consistent with the AFL-CIO evidence, the NES data shows that union
members contacted more often or more involved in campaigns were more likely to support the
Democrats than members who are less involved.35
While both the union and NES data are consistent with the claim that unions affect
members’ voting by personal contacts and provision of information, neither data set can rule out
an alternative explanation – that union activists contact members who are likely to vote and
favor union candidates more than members unlikely to vote or opposed to the endorsed
candidates. To rule out this explanation for the correlations between voting and contacts
requires analysis beyond that in this study: comparisons of voting between campaigns where

34
unions invested substantial efforts in contacting voters and campaigns where unions did little.
Withe low and declining union density, it seems natural to expect union ability to
influence turnout and election results to fall over time. However, as long as unions maintain
millions of members and allocate resources to politics, they can maintain or increase their impact
on elections even with declining density at work places. They can do this by contacting and
influencing the millions of non-union persons favorably inclined to unions but whom unions
cannot organize under current US labor laws and procedures. To get some notion of the number
of non-members who might respond positively to union initiatives, I tabulated the thermometer
question regarding unions on the 2000 NES. This question asked respondents “still using the
thermometer, how would you rate ... labor unions” as part of a battery of thermometer questions.
Table 8 gives the results of this tabulation. Column 1 shows that most union members
have reasonably high valuations of unions. Forty-six percent give unions thermometer scores
from 80 to 100 and just 15 percent give unions low scores below 40. Column 2 shows that just
16 percent of non-union members give unions thermometer scores above 80 while 28% give
unions scores below 40. The key finding, however, is not that union members have higher
opinions of unions than non-members, but that because union density is so low, non members
make up the vast bulk of persons with highly favorable views of unions. Column 3 shows that
80% of voters who rate unions in the 81-100 thermometer range and 73% of those who rate
unions at 100 are non-members. Since the NES reported an especially low union share of voters,
the proportion of persons giving high marks to unions is probably a bit lower than in the NES
survey, but declines in the nonunion proportion of NES respondents of 5 or so percent would
still leave non members as the vast majority of persons with highly favorable views to unions.
Who are these non-union persons favorable to unions? My tabulations of the 2000 NES

35
36Blacks are more than twice as likely to give unions a high score. Of those giving unionsa high score 58% are high school graduates or less, compared to 37% of the sample. Similarly49% of those giving unions a high thermometer rate themselves as working class compared to35% of the sample; 9.2% of nonunion persons in a union household give unions a highthermometer, while they make up 6.2% of the sample.
37 Among persons who answered the thermometer question, nonunion persons who giveunions an 81-100 thermometer score had a voting rate of 69% compared to a 72% voting rate forother nonunion persons and an 84% voting rate for union persons. The high rates show the overreporting bias in the NES survey.
38 http://www.aflcio.org/aboutaflcio/ecouncil/ec08062003f.cfm. Also see Greenhouse,Steven, A.F.L.-C.I.O. Begins Group for Workers Not in Unions, NY Times,http://www.nytimes.com/2003/08/29/national/29LABO.html. Another union effort focused onnon-union households, Working America, the Partnership for America’s Family, a Section 27non-profit organization, which sought to increase turnout foundered due to infighting amongunion leaders. Harry Kelber “Partnership’s Election Role Endangered as Top AFL-CIO PoliticalLeaders Resign” The Labor Educator, June 4, 2003, www.laboreducator.org/partelec.htm
show that some are non-members in union households but that 91% are in households where no
one is a union member. These pro-union persons are more likely to be black and less educated
and to have lower household income than the average non-union person. They are
disproportionately likely to view themselves as average working class persons.36 They are less
likely to vote than union members, which makes them a potentially good target for get-out-the-
vote drives.37 Recognizing the need to influence non-union members in the political sphere, the
AFL-CIO developed in 2003 a program to engage nonunion members about national policies in
selected communities – Working America .38 Modern information, communication, technology
– notably the low cost of reaching people through the Internet – makes it technically and
financially feasible for unions to reach pro-union non members and to try to enlist their active
support for union positions in political campaigns. By itself, this may not help unions to reverse
the downward trend in collective bargaining representation at workplaces, but it could lead to
unions delivering other information to persons without collective bargaining contracts, for

36
instance on issues relevant to their workplace, and ultimately to create a broader union
movement in the US of the open source unionism form that Freeman and Rogers (2002, 2003)
have proposed – as opposed to unionism based primarily on the attainment of majority status
collective bargaining contracts, per the CPS definition.
5. Conclusion
Using data on unionism and voting in four different data sets, this study has found that
the voting rate of union members averages some 12 points above that of non-union members;
and that the voting rate of nonunion persons in union households averages 3 points above that of
persons in nonunion households. Most of the higher rate of turnout of unionists is due to
socioeconomic factors that differentiate union members from others, but there remains a union
voting premium for both members and other persons in union households. The difference in
turnout between members and non-members with comparable characteristics is about 4
percentage points. The data reject the claim based on exit poll data that the union share of the
electorate rose massively in the 1990s. But analysis of the number of retired union members and
other nonemployed persons who identify with unions show that the union share of voters in
unions and in union households in 2000 is closer to the exit poll estimates than to CPS based
estimates. The exit polls give a reasonably accurate measure of the level of union share of
voting but not of the 1990s trend in that share.
With respect to voting preferences, this study has found that union members are more
likely to vote for a Democrat for the House or Presidency than demographically comparable
nonunion voters, largely because union members have attitudes and voting inclinations favorable
to the Democrats and to liberalism prior to a given campaign. From this perspective union
political activity is more of an investment in long run political influence rather than delivery of

37
votes in a particular election. Finally, this study has identified a sizable group of nonunion
persons with pro-union attitudes that unions could potentially influence to maintain the union
impact on elections, even though these persons cannot gain collective bargaining contracts.

38
References
Casper, Lynne, and Loretta Bass. 1998. “Voting and Registration in the Election of November1996." Current Population Reports, series P20, no.504 (July). Washington: U.S. GovernmentPrinting House for U.S. Bureau of the Census.
Chang, Tracy F. 2001 “ The Labour Vote in US National Elections, 1948-2000”, The PoliticalQuarterly 72, no 3, 375-385
Chang, Tracy F. “ Electoral Activities of Southern Local Unions in the 2000 Election” 2003Labor Studies Journal vol 28 no 1(Spring 2003); 53-81.
Clark, Paul and Marick F. Masters (2001) “Of General Interest Competing Interest Groups andUnion Members Voting” Social Science Quarterlym Volume 82 Issue 1 pp 105 - 116
Dark, Taylor, The Unions and the Democrats: an enduring alliance, Ithaca NY, Cornell, 1999
Day, Jennifer, and Avalaura Gaither. 2000. “Voting and Registration in the Election ofNovember 1998.” Current Population Reports, series P20-523RV (August). Washington: U.S.Government Printing House for U.S. Bureau of the Census.
Delaney, John, Jack Fiorito, and Marick Masters “The effects of organizational andenvironmental characteristics on union political action” American Journal of Political Sciencevol 32, issue 3 (Aug 1988), 616-642
DeLaney, John, Marick Masters, and Susan Schwochau 1988 “Unionism and Voter Turnout”Journal of Labor Research vol 9 no 3, 221-236
Delaney, John, Jack Fiorito, and Paul Jarley 1999 “Evolutionary Politics? Union Differencesand Political Activities in the 1990s Journal of Labor Research vol 20 no 3, 277-96
Delaney, John 1991 “The future of unions as political organizations” Journal of Labor Researchvol 12, no 4 373-385
Fields, Mitchell, Marick Masters, and James Thacker 1987 “Union Commitment andMembership Support for Political Action: an exploratory analysis” Journal of Labor Researchvol 13, no 2, 141-157
Freeman, Richard and Medoff, James (1984) What Do Unions Do? Basic Books, NY
Freeman, Richard and Joel Rogers (2002) “A Proposal to American Labor” The Nation, June 24,2002 http://www.thenation.com/doc.mhtml%3Fi=20020624&s=rogersFreeman, Richard and Joel Rogers (2002) “Open Source Unionism: Beyond Exclusive CollectiveBargaining", Working USA, Spring, volume 6. No 1, Gerber, Alan and Donald Green. 2000. “The Effects of Canvassing, Telephone Calls, and Direct

39
Mail on Voter Turnout: a field experiment.” American Political Science Review 94: 653-63.
Jamieson, Amis, Hyon B. Shin, and Jennifer Day. 2002. “Voting and Registration in the Election ofNovember 2000.” Current Population Reports, series P20, no.542. Washington: USGPO
Juravich, Tom and Peter Shergold (1988) “The Impact of Unions on the Voting Behavior of theirmembers”, Industrial and Labor Relations Review, 1988, pp 374-85
Lipjhat, Arend.1997 . “Unequal Participation: Democracy’s Unresolved Dilemma.” AmericanPolitical Science Review 91: 1-15.
Marick F. Masters and John Thomas Delaney. "Union Political Activities: A Review of theEmpirical Literature." Industrial and Labor Relations Review, Vol. 40, No. 3 (April 1987), pp.336-353.
McDonald, Michael. 2003. “On the Over-Report Bias of the National Election Study TurnoutRate.”Political Analysis, forthcoming.
McKee, Seth. 2002. “Was Turnout Significantly Higher in the Battleground States in the 2000Presidential Election?” Paper presented to the 2002 Annual Meeting of the American PoliticalScience Association. Boston (September 24-28, 2002).
Radcliff, Benjamin, and Patricia Davis. 2000. “Labor Organization and Electoral Participation inIndustrial Democracies.” American Journal of Political Science 44(1) (January): 132-41.
Radcliff, Benjamin. "Organized Labor and Electoral Participation in American National Elections."Journal of Labor Relations 22, no. 2 (2001).
Rogers, Joel and Ruy Teixera (2001) America's Forgotten Majority: Why the White Working ClassStill Matters NY: Basic Books
Rosenstone, Steven, and John Hansen. 1993. Mobilization, Participation, and Democracy inAmerica. NY: Macmillan.
Silver, Brian, Barbara Anderson, and Paul Abramson. 1986. “Who Overreports Voting?”AmericanPolitical Science Review, 80(2) (June): 613-24.
Teixeira, Ruy A. 1992. The Disappearing American Voter. Washington D.C.: Brookings.
Verba, Sidney, Kay Schlozman, Henry Brady. 1996. Voice and Equality: Civic Voluntarism inAmerican Politics. Cambridge: Harvard University Press.
Marvin Wattenberg. 2002.Where Have All the Voters Gone? Cambridge: Harvard University Press.
Wolfinger, Raymond and Steven Rosenstone. 1980. Who Votes? New Haven Yale University Press.

40
Table 1: Percentage of Voters Who are Union Members or Who are in a Household with aunion member, 1990-2000
Union Members in Union Households
VNS CPS NES GSS VNS CPS NES GSS
2000 16 11 10 % 26 19 17 %
1998 % 11 14 % 23 19 21 %
1996 % 11 14 14 24 20 21 19
1994 % 13 % % 14 NA 21 %
1992 % 11 % 14 18 20 18 19
1990 % 12 % % 11a 21 19 %
SOURCE: Tabulated from VNS exit polls for 1992 (ICPSR 6102); 1994(ICPSR, 6520), 1996 (ICPSR,6989); 1998 (ICPSR, 2780); 2000, (ICPSR, 3527). Current Population Survey November VotingSupplements for Out-going Rotation Group; National Election Studies 1948-2000 NES Cumulative Datafile, (www.umich.edu/~nes/studyres/nes48_00/nes48_00.htm)General Social Survey 1972-2000 Cumulative, www.icpsr.umich.edu/GSS/
The CPS household estimates obtained by forming households using the household identification code inthe CPS.
a In 1990 VNS did not exist, so this figure is from predecessor exit poll by CBS News/New York TimesGeneral Exit poll 1990, ICPSR 9602.
NA –No estimate is possible because between June and December 1994 sample redesigns by the Censusled to a scrambling of the household identification number.

41
Table 2: VNS and Earlier Exit Poll Questions on Union Status, and Percentages of Rerspondents inHouseholds with Union Members, Presidential Year Elections, 1984-2000
Panel A: VNS Exit Poll Source Year Percentageof Voters in
UnionHouseholds
Do you or does anyone in your household belong to a laborunion? (Responses: Self; Someone else; Self and Someoneelse)
VNS exit polls
2000 26.7
Do you or does someone in your household belong to a laborunion? Responses: (yes or no separate item)
VNS exit polls
1996 24.6
Do any of the following apply to you (list of 9 items) Someone in household belongs to a labor union (yes or no)
VNS exit polls
1992 18.7
Panel B: Prior Exit Polls
Are you or is any person living in your household a member ofa labor union? Response (Self; Other family member)
CBS 1998 26.6
Do any of the following describe you Member of union household? (List of 14 items) Response:check yes, no chance to respond no on individual items
ABC 1988 9.9
Is respondent or anyone in respondent’s household a unionmember? Response (yes, no)
ABC 1984 26.9
SOURCE: VNS exit polls for 1992 (ICPSR 6102); 1996 (ICPSR, 6989); 2000 (ICPSR 3527). ABC News General Election exit polls: 1984, ICSPR 8416 1988, ICSPR 9118. CBS News/New York Times General Exit poll 1988, ICPSR 9138.
Percentages are unweighted in this table

42
Table 3: Percentage of Voters Who Are Union Members, by Employment Status and age, 2000
VNS CPS NES GSS (1996)
Employed 17.9 18.2 11.6 16.2
18-24 15.1 7.1 0.0 10.0
25-29 16.4 14.9 10.0 13.4
30-39 15.8 15.9 14.2 13.4
40-44 17.3 20.8 10.5 13.5
45-49 21.6 21.7 13.5 23.5
50-59 19.9 25.0 14.6 20.0
60-64 22.1 19.3 5.1 25.0
65-74 16.9 10.6 3.3}5.0
75+ 4.4 18.3 0.0
Not Employed* 10.3 % 7.5 9.9
18-24 7.5 % 9.1 0.0
25-29 17.2 % 11.1 7.1
30-39 7.8 % 8.2 3.0
40-44 11.1 % 9.4 0.0
45-49 13.0 % 8.7 12.5
50-59 10.6 % 7.3 15.0
60-64 13.4 % 0.0 11.6
65-74 9.3 % 9.011.2
75+ 9.7 % 6.5
Retired % % 8.6 16.6
SOURCE: Tabulated from 2000 VNS exit poll; November 2000 CPS Voter Supplement File Out-goingrotation group; National Election Studies Survey 2000; General Social Survey 1996. All data are weightedby appropriate survey weights. * In the VNS, 41.3% of nonemployed union voters are aged 60 and over; in the NES, 41.7% of nonemployed union voters are aged 60 and over and 50% of the non employed union voters are retirees; in theGSS, 75.0% of non employed union voters are aged 60 and over and 69.4% are retirees.

43
Table 4: Percentage of Persons Who Vote and Differences in Percentage Voting, by Union Status and Employment Status CPS files, 1990-2000
A. Percentages of Persons Who Vote
Employed Non employed All
Union Members
(1)
AllNonunionEmployed
Persons
(2)
NonunionEmployedpersons in
UnionHousehold
(3)
NonunionEmployedPersons inNonunionHousehold
(4)
NonemployedPersons in
UnionHousehold
(5)
NonemployedPersons inNonunionHousehold
(6)
AllPersons in
UnionHousehold
(7)
AllPersons inNonuion
Household
(8)
2000 68.3 58.0 62.0 57.5 59.0 58.2 64.8 57.8
1998 55.2 40.6 45.8 40.0 46.3 48.6 50.9 44.0
1996 67.1 55.3 59.1 54.8 56.9 58.5 62.9 56.6
1994 59.6 44.9 -- -- -- -- -- --
1992 73.9 66.2 68.0 65.9 59.5 65.0 69.4 65.5
1990 54.7 44.9 50.1 44.1 41.3 52.0 50.7 48.1
Ave,pres yr
69.8 59.8 63.0 59.4 58.5 60.7 65.7 60.0
Ave,otheryrs
56.5 43.5 48.0 42.1 43.3 50.3 50.8 46.1
SOURCE: November CPS Voter Supplement Files for outgoing rotation group with observations weighted bysample weight. Averages are unweighted means of the voting rates for the individual years.

44
Table 5: Coefficients and Standard Errors for Estimates of the Impact of Union Membership on Voting, EmployedPersons only CPS, 1990-2000
Sample NoCovariates
DemographicCovariates
(2) +Job
Covariates
(3) +FamilyIncome
(4)+Other Adult’s
Characteristics
Number ofObservations
1. All Employed, by year
(1) (2) (3) (4) (5)
2000 .09(.01)
.06(.01)
.05(.01)
.04(.01)
-- 11976
1998 .16(.01)
.11(.02)
.07(.01)
.06(.01)
-- 12094
1996 .11(.01)
.07(.01)
.05(.01)
.04(.01)
-- 11876
1994 .15(.01)
.10(.01)
.07(.01)
.06(.01)
-- 13246
1992 .08(.01)
.05(.01)
.04(.01)
.03(.01)
-- 13177
1990 .11(.01)
.07(.01)
.04(.01)
.03(.01)
-- 13252
Pooled Sample,1990-2000a
2. All employed .12(.005)
.07(.004)
.06(.005)
.04(.005)
-- 77151
3. Union and employednonunion in nonunion hhlds
.11(.005)
.08(.005)
.06(.005)
.05(.005)
-- 58200
4. All Employedin 2 adult hhldsb
.11(.01)
.08(.01)
.06(.01)
.05(.01)
.05(.01)
37416
SOURCE: Estimated by linear regression from November CPS, with dummy variables for covariates: Demographic: 9 age groups, 5 education groups, race and sex, 9 region groups;Occupation covariates, 14 1 digit occupation groups; 7 class of occupation groups. Familyincome, 15 groups, as described in appendix B.
. a- Includes dummy variables for yearb –1994 excluded because June and December 1994 sample redesigns by the Census scrambledhousehold identification numbers.

45
Table 6: Coefficients and Standard Errors for Estimates of the Impact of Being in a Union Household onthe Voting of Nonunion Members, CPS, 1990-2000, Pooled Sample of Persons in two Adult Householdsa
Sample NoCovariates
DemographicCovariates
(2) + JobCovariates
(3) +Household
Income
(4) + OtherAdult’s
Characteristics
# ofObservation
s
(1) (2) (3) (4) (5)
1. Allpersons not inunion:
.03(.01)
.05(.01)
.05(.01)
.03(.01)
.02(.01)
59,640
2. Employedpersons not inunion
.07(.01)
.06(.01)
.06(.01)
.04(.01)
.03(.01)
30,835
3. NonEmployedpersons not inunion
-.02(.01)
.04(.01)
.05(.01)
.02(.01)
.02(.01)
28,805
SOURCE: Estimated by linear regression from November CPS.
a – 1994 Excluded from pooled sample because no estimate is possible due to Census sample redesignsthat scrambled family ids.

46
Table 7: Estimates of the Impact of Unionism on Voting Democratic, NES, 1948-2000
No Covariates DemographicCovariates
(2) + ThermometerCovariates
(3) + IntendedPresidential Vote
(1) (2) (3) (4)
PANEL A: Election 2000: Union Variable is Own Membership
1. Thermometer Attitudes Democrat-Republican
5.78(3.44)
9.32(3.36)
2. Thermometer Attitudes Liberal-Conservative
7.31(2.92)
8.51(2.94)
3. Intended Presidential Vote for Democrats
.10(.05)
.14(.04)
.09(.04)
4. House Vote forDemocrats
.11(.05)
.13(.05)
.08(.04)
.04(.04)
5. Presidential Vote forDemocrats
.09(.05)
.12(.05)
.06(.04)
-.02(.03)
PANEL B: Elections, 1948-2000: Union Variable is Union Household
6. Thermometer Attitudes Democrat-Republican
8.7(.6)
10.8(.6)
7. Thermometer Attitudes Liberal-Conservative
4.3(.4)
5.5(.5)
8. Intended PresidentialVote for Democrats
.13(.01)
.14(.01)
.06(.01)
9. House Vote forDemocrats
.14(.01)
.13(.01)
.05(.01)
.03 (.01)
10. Presidential Vote forDemocrats
.16(.01)
.15(.01)
.06(.01)
.02(.01)
SOURCE: National Election Studies 1948-2000 NES Cumulatived Data file. Sample sizes vary depending on thepanel and variable. For 2000, they range from 832 to 1731, with high value for pre-election variables and the lowestfor voting for the house. For 1996, they range from 860 to 1637. For all elections they vary from 5240 to 23789.

47
Table 8: Union Thermometer Scores by Union Status
Distribution of Scores PercentageNonunion of Group
Score Union member Nonunion
0-20 6.1 9.7 94%
21-40 8.4 18.4 96%
41-60 30.4 40.3 93%
61-80 25.9 20.6 89%
81-100 29.6 11.6 80%
100 15.9 4.2 73%
SOURCE: Tabulated from National Election Studies, 2000, variable 001312, with totalsample of 1468, of whom 132 are union members

48
Appendix Table A: Percentage Votes Validated by Union Status and Sample Size inParenthesis, National Election Studies, 1964, 1976-1990
Union Nonunion 1964 81.2 (314) 82.2 ( 957)1976 86.0 (519) 82.8 (1736)1978 79.7 (581) 73.8 (1666)1980 83.9 (331) 83.3 ( 959)1984 87.3 (358) 86.1 (1260)1986 83.0 (316) 82.3 (1208)1988 85.4 (270) 85.3 (1090)1990 84.5 (251) 82.8 (1110)
average 83.9 82.3
SOURCE: Tabulated from NES

49
Appendix Table B: Definitions of Covariates used in CPS Regressions
9 Age Groups: <24, 25-29, 30- 39, 40-44, 45-49, 50-59, 60-64, 65-74, 75+5 Education Groups: <12 years, HS Grad, Some College, College Grad, Post College2 Race Groups: White, Nonwhite2 Sex Groups: Male, Female9 Region Groups: New England, Mid Atlantic, East North Central West North Central, SouthAtalantic Division, East South Central, West South Central Mountain, Pacific. (Based on firstdigit of state code)
14 One digit Occupations: Armed forces; Executive; Professional; Technician; Sales; Adminsupport; Private Household; Protective Service; Other Service; Precision Production craft andrepair; Machine operators; Transportation;. Handlers; Farming
7 Class of Occupation groups: Missing; Federal Govt; State Govt; Local Govt; Private; SelfEmployed-incorp; Self Employed- not incorp
15 Family Income Groups: No income; <$5,000; $5,000-7,4900;. $7,500-9,999;. $1,000-12,499;$12,500-14,999; $15,000-19,999; $20,000-24,999; $25,000-29,999; $30,000-34,999; $35,000-39,999; $40,000-49,999; $50,000-59,000; $60,000-74,999; $75,000+

19
23
26
0
5
10
15
20
25
30
Figure 1: Percent of Voters in Union Household, 1992-2000, VNS Exit Polls
MILLIONS OF VOTERSUnionNonunion
21.692.2
22.272.5
26.376.8
SOURCE: Tabulated from VNS Exit Polls
1992 1996 2000
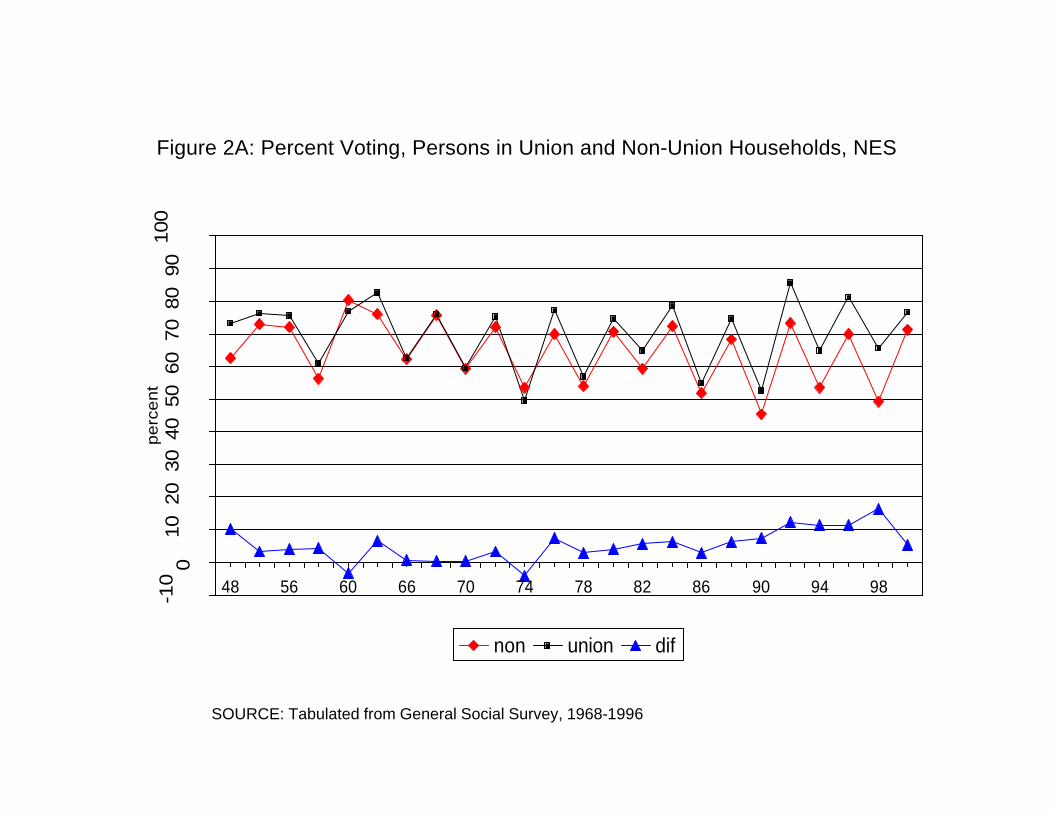
Figure 2A: Percent Voting, Persons in Union and Non-Union Households, NES-1
00
1020
3040
5060
7080
9010
0
48 56 60 66 70 74 78 82 86 90 94 98
pe
rce
nt
non union dif
SOURCE: Tabulated from General Social Survey, 1968-1996

Figure 2B: Percent Voting, Union and Non-Union Members, GSS
0
10
20
30
40
50
60
70
80
68 72 76 80 84 88 92 96
perc
ent
union non difference
SOURCE: Tabulated from National Election Study, cumulative files, 1948-2000

Figure 3: Proportion of VNS Respondents Who Voted Democratic, by Union and Employment Status, 2000
Voted for Congress
53
58
4035
45
55
65
75
union employed union not employed non union
Voted for President
6259
45
35
45
55
65
75
SOURCE: Tabulated from the VNS Exit Polls for 2000 (ICPSR, 3527).