cps troubleshooting guide, release 19.4 - cisco...cpstroubleshootingguide,release19.4.0...
TRANSCRIPT

CPS Troubleshooting Guide, Release 19.4.0First Published: 2019-07-25
Last Modified: 2019-07-25
Americas HeadquartersCisco Systems, Inc.170 West Tasman DriveSan Jose, CA 95134-1706USAhttp://www.cisco.comTel: 408 526-4000
800 553-NETS (6387)Fax: 408 527-0883

THE SPECIFICATIONS AND INFORMATION REGARDING THE PRODUCTS IN THIS MANUAL ARE SUBJECT TO CHANGE WITHOUT NOTICE. ALL STATEMENTS,INFORMATION, AND RECOMMENDATIONS IN THIS MANUAL ARE BELIEVED TO BE ACCURATE BUT ARE PRESENTED WITHOUT WARRANTY OF ANY KIND,EXPRESS OR IMPLIED. USERS MUST TAKE FULL RESPONSIBILITY FOR THEIR APPLICATION OF ANY PRODUCTS.
THE SOFTWARE LICENSE AND LIMITED WARRANTY FOR THE ACCOMPANYING PRODUCT ARE SET FORTH IN THE INFORMATION PACKET THAT SHIPPED WITHTHE PRODUCT AND ARE INCORPORATED HEREIN BY THIS REFERENCE. IF YOU ARE UNABLE TO LOCATE THE SOFTWARE LICENSE OR LIMITED WARRANTY,CONTACT YOUR CISCO REPRESENTATIVE FOR A COPY.
The Cisco implementation of TCP header compression is an adaptation of a program developed by the University of California, Berkeley (UCB) as part of UCB's public domain version ofthe UNIX operating system. All rights reserved. Copyright © 1981, Regents of the University of California.
NOTWITHSTANDING ANY OTHERWARRANTY HEREIN, ALL DOCUMENT FILES AND SOFTWARE OF THESE SUPPLIERS ARE PROVIDED “AS IS" WITH ALL FAULTS.CISCO AND THE ABOVE-NAMED SUPPLIERS DISCLAIM ALL WARRANTIES, EXPRESSED OR IMPLIED, INCLUDING, WITHOUT LIMITATION, THOSE OFMERCHANTABILITY, FITNESS FOR A PARTICULAR PURPOSE AND NONINFRINGEMENT OR ARISING FROM A COURSE OF DEALING, USAGE, OR TRADE PRACTICE.
IN NO EVENT SHALL CISCO OR ITS SUPPLIERS BE LIABLE FOR ANY INDIRECT, SPECIAL, CONSEQUENTIAL, OR INCIDENTAL DAMAGES, INCLUDING, WITHOUTLIMITATION, LOST PROFITS OR LOSS OR DAMAGE TO DATA ARISING OUT OF THE USE OR INABILITY TO USE THIS MANUAL, EVEN IF CISCO OR ITS SUPPLIERSHAVE BEEN ADVISED OF THE POSSIBILITY OF SUCH DAMAGES.
Any Internet Protocol (IP) addresses and phone numbers used in this document are not intended to be actual addresses and phone numbers. Any examples, command display output, networktopology diagrams, and other figures included in the document are shown for illustrative purposes only. Any use of actual IP addresses or phone numbers in illustrative content is unintentionaland coincidental.
All printed copies and duplicate soft copies of this document are considered uncontrolled. See the current online version for the latest version.
Cisco has more than 200 offices worldwide. Addresses and phone numbers are listed on the Cisco website at www.cisco.com/go/offices.
Cisco and the Cisco logo are trademarks or registered trademarks of Cisco and/or its affiliates in the U.S. and other countries. To view a list of Cisco trademarks, go to this URL: www.cisco.comgo trademarks. Third-party trademarks mentioned are the property of their respective owners. The use of the word partner does not imply a partnership relationship between Cisco and anyother company. (1721R)
© 2019 Cisco Systems, Inc. All rights reserved.

C O N T E N T S
Preface xiP R E F A C E
About This Guide xi
Audience xi
Additional Support xi
Conventions (all documentation) xii
Communications, Services, and Additional Information xiii
Important Notes xiii
Troubleshooting CPS 1C H A P T E R 1
General Troubleshooting 1
Gathering Information 1
Collecting MongoDB Information for Troubleshooting 2
High CPU Usage Issue 3
JVM Crash 3
High Memory Usage/Out of Memory Error 4
Issues with Output displayed on Grafana 4
Basic Troubleshooting 5
Trace Support Commands 6
trace.sh 6
trace_id.sh 7
Periodic Monitoring 7
E2E Call Flow Troubleshooting 10
Recovery using Remove/Add Members Option 11
Remove Failed Members 11
Add Failed Members 13
Maintenance Window Procedures 14
CPS Troubleshooting Guide, Release 19.4.0iii

Prior to Any Maintenance 14
Change Request Procedure 14
Software Upgrades 14
VM Restarts 14
Hardware Restarts 15
Planned Outages 15
Non-maintenance Window Procedures 15
Common Troubleshooting Tasks 15
Low or Out of Disk Space 15
df Command 15
du Command 16
LDAP Error Codes 16
Diameter Issues and Errors 27
Diameter Issues 27
Diameter Proxy Error in diagnostics.sh Output 28
Diameter Peer Connectivity is Down 28
No Response to Diameter Request 29
Diagnose Diameter No Response for Peer Message 30
Diameter Result Codes and Scenarios 36
Diameter Experimental Result Codes 41
Frequently Encountered Scenarios 47
Subscriber not Mapped on SCE 47
CPS Server Will Not Start and Nothing is in the Log 48
Server returned HTTP Response Code: 401 for URL 48
com.broadhop.exception.BroadhopException Unable to Find System Configuration for System 49
Log Files Display the Wrong Time but the Linux Time is Correct 49
REST Web Service Queries Returns an Empty XML Response for an Existing User 50
Error in Datastore: "err" : "E11000 Duplicate Key Error Index 50
Error Processing Request: Unknown Action 50
Memcached Server is in Error 51
Firewall Error: Log shows Host Not Reachable, or Connection Refused 51
Unknown Error in Logging: License Manager 52
Logging Does Not Appear to be Working 52
Cannot Connect to Server Using JMX: No Such Object in Table 53
CPS Troubleshooting Guide, Release 19.4.0iv
Contents

File System Check (FSCK) Errors 53
CPS: Session Cache mongoDB Stuck in STARTUP2 after sessionMgr01/2 Reboot 55
Multi-user Policy Builder Errors 57
Policy Reporting Configuration not getting updated post CPS Upgrade 58
CPS Memory Usage 59
Errors while Installing HA Setup 60
Enable/disable Debit Compression 61
Not able to Publish the Policy in Policy Builder 62
CPS not sending SNMP traps to External NMS server 63
Policy Builder Loses Repositories 63
Not able to access IPv6 Gx port from PCEF/GGSN 64
Bring up sessionmgr VM from RECOVERY state to PRIMARY or SECONDARY State 64
ZeroMQ Connection Established between Policy Director and other site Policy Server 64
Incorrect Version after Upgrade from 7.0.0 System 66
Not able to access Policy Builder 67
Graphs in Grafana are lost when time on VMs are changed 68
Systems is not enabled for Plugin Configuration 68
Publishing is not Enabled 68
Added Check to Switch to Unknown Service if Subscriber is deleted Mid Session 68
Could not Build Indexes for Table 72
Error Submitting Message to Policy Director (lb) during Longevity 72
Mismatch between Statistics Count and Session Count 72
Disk Statistics not Populated in Grafana after CPS Upgrade 74
Re-create Session Shards 74
Re-create SK Shards 76
Session Switches from Known to Unknown in CCR-U Request 78
Intermittent BSON Object Size Error in createsub with Mongo v3.2.1 79
No Traps Generated When Number of Sessions Exceeds the Limit 80
RAR Message Not Received 80
Time Zone and Location Information Not Received 81
Admin Database shows Problem in Connecting to the Server 81
Locale MAC Error 83
Sessions Stored in a Single Shard 83
Licensing not Throwing Traps or Diagnostic Errors upon Breach 85
CPS Troubleshooting Guide, Release 19.4.0v
Contents
Corosync Process Taking lot of Time to Unload and is Stuck 85
Issue related to Firewall 85
CPS Setup cannot Handle High TPS 86
CPS System is Crashing when Running More than 6K TPS 87
Old VIP is not deleted After Modifying VIP Name 88
lbvip not moving to Secondary Policy Director (lb) VM 88
Internal Session Sharding not Recovered on Power Outage 88
Flow Information Parameters Not Derived As Per Actions 90
Mapped Target AVPs Not Received In Diameter Message 90
Running Puppet on Cluster Manager in HA Setup 90
Not Able to Rebalance and Migrate after Shards Recreation 91
pcrfclient01 Automatically Becomes Unresponsive 92
Primary Member Isolated from all Arbiters Displaying Incorrect State 92
No Alarm is Generated When Mongo Process Stop/Restart 92
Zookeeper becoming Unavailable on Cluster Manager 93
Upgrade Fails due to monit Race Condition 93
Messages Timed Out When Running Heap Dump 94
mongod Process Not Running on both pcrfclient after Fresh Install 94
Replica-set ID is Getting Changed after pcrfclient (arbiter) Failover 95
Errors/Warnings Observed during PS Node Warmup 95
Total Number of Session Exceeding Allowed Limit 97
Application Bundles or Plugins Unable to Start After Site Recovery 100
Troubleshoot REDIS 101
Troubleshooting REDIS Reporting Database 101
Reporting does not occur 103
REDIS does not receive or push out CDR records 104
Troubleshooting Graphite DB Issues 105
Unable to Access Graphite DB Using Default Graphite User 105
Grafana UI displays Continuous Prompt for Username and Password 106
Graphite Queries to Fetch Diameter Statistics 106
Grafana Statistics Missing after Stopping Carbon Cache 107
SNMP Traps and Key Performance Indicators (KPIs) 107
Full (HA) Setup 107
All-in-one (AIO) Setup 109
CPS Troubleshooting Guide, Release 19.4.0vi
Contents

Testing Traps Generated by CPS 109
Component Notifications 110
Application Notifications 113
SNMP System and Application KPI Values 130
SNMP System KPIs 130
Application KPI Values 132
Troubleshooting Scenarios in OpenStack Environment 134
Unable to Call API due to Puppet Time-out 134
FAQs 135
Reference Document 136
Troubleshooting ANDSF 137C H A P T E R 2
Policy Builder Scenarios 137
Not Able to See DM Configuration Tab in Policy Builder after Installation 137
Diagnostic.sh throws Errors after Restart 138
Not Getting GCM Notifications in Logs 138
Session is not created for iPhone and Android Users 139
Check for service Use Case Templates for GCM, APNS, General, and default Services 140
Policy Builder Session Timeout Frequently and not able to Login from another Browser 140
Control Center Scenarios 141
Subscriber Session not getting Created and Getting Exception Error (401) 141
SSID Credentials are Wrongly Passed in Policy 141
DM Tree Lookups Fail and Exception in consolidated-qns.log 141
Data Populated in MongoDB ANDSF Collection, but values are not shown in Control Center 142
Not able to see the Mobile Configuration Certificate sub screen in Control Center 143
Control Center session timeout frequently and not able to login from another browser 143
Geo-location is not read Properly in Control Center 143
ANDSF Server Scenarios 144
API Error Codes 144
General Errors 144
Problem Accessing ua/soap Getting Jetty Related Error 144
Check if Blank Policy is Retrieved in SyncML Response 145
Policy Engine not Returning a Management Response 145
Notification Errors 145
CPS Troubleshooting Guide, Release 19.4.0vii
Contents

GCM Notification 145
APNS Notification 147
Basic Troubleshooting Using ANDSF Logs 149
Debugging Common Errors using Logging Techniques of ANDSF 149
Debugging Common Call Flow Scenarios for ANDSF using Logging Patterns 149
Generic Call Flow For Android 149
Generic Call Flow For Apple 151
GCM Notification 152
APNS Notification 153
Notification for Revalidation Timer 154
Check Subscriber Access 157C H A P T E R 3
Checking Access 157
Testing Subscriber Access with 00.testAccessRequest.sh 157
Testing Subscriber Access with soapUI 158
TCP Dumps 163C H A P T E R 4
About TCP Dumps 163
TCPDUMP Command 163
Options 163
Specific Traffic Types 164
Capture SNMP Traffic 164
Other Ports 164
Call Flows 167C H A P T E R 5
One-Click Call Flow 168
User/Password Login Call Flow 169
Data-limited Voucher Call Flow 170
Time-limited Voucher Call Flow 171
EAP-TTLS Call Flow 172
Service Selection Call Flow 173
MAC TAL Call Flow 174
Tiered Services Call Flow 175
CPS Troubleshooting Guide, Release 19.4.0viii
Contents

Logging 177C H A P T E R 6
Overview 177
CPS Logs 178
Application/Script Produces Logs: Deploy Logs 178
Application/Script Produces Logs: policy server 178
Application/Script Produces Logs: policy server pb 180
Application/Script Produces Logs: mongo 180
Application/Script Produces Logs: httpd 180
Application/Script Produces Logs: license manager 181
Application/Script Produces Logs: svn 181
Application/Script Produces Logs: auditd 182
Application/Script Produces Logs: prometheus 182
Application/Script Produces Logs: collectd_exporter 182
Application/Script Produces Logs: kernel 182
Policy Builder and Control Center Activity Logs 183
Basic Troubleshooting Using CPS Logs 184
Logging Level and Effective Logging Level 184
Consolidated Application Logging 186
Enable Debug Logs 187
Enable Unified API Request and Response Logging 189
Rsyslog Log Processing 190
Rsyslog Overview 190
Rsyslog-proxy 190
Configuration for HA Environments 191
Configuration for AIO 192
Enable Consolidated Syslog Output to Files on OAM VMs 192
Configuration of Logback.xml 193
Rsyslog Customization 194
Viewing Logs Without Superuser Privileges 194
CPS Troubleshooting Guide, Release 19.4.0ix
Contents

CPS Troubleshooting Guide, Release 19.4.0x
Contents

Preface
• About This Guide, on page xi• Audience, on page xi• Additional Support, on page xi• Conventions (all documentation), on page xii• Communications, Services, and Additional Information, on page xiii• Important Notes, on page xiii
About This GuideThis document is a part of the Cisco Policy Suite documentation set.
For information about available documentation, see theCPSDocumentationMap for this release at Cisco.com.
AudienceThis guide is best used by these readers:
• Network administrators
• Network engineers
• Network operators
• System administrators
This document assumes a general understanding of network architecture, configuration, and operations.
Additional SupportFor further documentation and support:
• Contact your Cisco Systems, Inc. technical representative.
• Call the Cisco Systems, Inc. technical support number.
• Write to Cisco Systems, Inc. at [email protected].
CPS Troubleshooting Guide, Release 19.4.0xi

• Refer to support matrix at https://www.cisco.com/c/en/us/support/index.html and to other documentsrelated to Cisco Policy Suite.
Conventions (all documentation)This document uses the following conventions.
IndicationConventions
Commands and keywords and user-entered text appearin bold font.
bold font
Document titles, new or emphasized terms, andarguments for which you supply values are in italicfont.
italic font
Elements in square brackets are optional.[ ]
Required alternative keywords are grouped in bracesand separated by vertical bars.
{x | y | z }
Optional alternative keywords are grouped in bracketsand separated by vertical bars.
[ x | y | z ]
A nonquoted set of characters. Do not use quotationmarks around the string or the string will include thequotation marks.
string
Terminal sessions and information the system displaysappear in courier font.
courier font
Nonprinting characters such as passwords are in anglebrackets.
< >
Default responses to system prompts are in squarebrackets.
[ ]
An exclamation point (!) or a pound sign (#) at thebeginning of a line of code indicates a comment line.
!, #
Means reader take note. Notes contain helpful suggestions or references to material not covered in the manual.Note
Means reader be careful. In this situation, you might perform an action that could result in equipment damageor loss of data.
Caution
CPS Troubleshooting Guide, Release 19.4.0xii
PrefaceConventions (all documentation)

IMPORTANT SAFETY INSTRUCTIONS.
Means danger. You are in a situation that could cause bodily injury. Before you work on any equipment, beaware of the hazards involved with electrical circuitry and be familiar with standard practices for preventingaccidents. Use the statement number provided at the end of each warning to locate its translation in thetranslated safety warnings that accompanied this device.
SAVE THESE INSTRUCTIONS
Warning
Regulatory: Provided for additional information and to comply with regulatory and customer requirements.Note
Communications, Services, and Additional Information• To receive timely, relevant information from Cisco, sign up at Cisco Profile Manager.
• To get the business impact you’re looking for with the technologies that matter, visit Cisco Services.
• To submit a service request, visit Cisco Support.
• To discover and browse secure, validated enterprise-class apps, products, solutions and services, visitCisco Marketplace.
• To obtain general networking, training, and certification titles, visit Cisco Press.
• To find warranty information for a specific product or product family, access Cisco Warranty Finder.
Cisco Bug Search Tool
Cisco Bug Search Tool (BST) is a web-based tool that acts as a gateway to the Cisco bug tracking systemthat maintains a comprehensive list of defects and vulnerabilities in Cisco products and software. BST providesyou with detailed defect information about your products and software.
Important Notes
Any feature or GUI functionality that is not documented may not be supported in this release or may becustomer specific, and must not be used without consulting your Cisco Account representative.
Important
CPS Troubleshooting Guide, Release 19.4.0xiii
PrefaceCommunications, Services, and Additional Information

CPS Troubleshooting Guide, Release 19.4.0xiv
PrefaceImportant Notes

C H A P T E R 1Troubleshooting CPS
• General Troubleshooting, on page 1• Recovery using Remove/Add Members Option, on page 11• Maintenance Window Procedures, on page 14• Non-maintenance Window Procedures, on page 15• Common Troubleshooting Tasks, on page 15• LDAP Error Codes, on page 16• Diameter Issues and Errors, on page 27• Frequently Encountered Scenarios, on page 47• Troubleshoot REDIS, on page 101• Troubleshooting Graphite DB Issues, on page 105• SNMP Traps and Key Performance Indicators (KPIs), on page 107• Troubleshooting Scenarios in OpenStack Environment, on page 134• FAQs, on page 135• Reference Document, on page 136
General Troubleshooting• Find out if your problem is related to CPS or another part of your network.
• Gather information that facilitate the support call.
• Are their specific SNMP traps being reported that can help you isolate the issue?
Gathering InformationDetermine the Impact of the Issue
• Is the issue affecting subscriber experience?
• Is the issue affecting billing?
• Is the issue affecting all subscribers?
• Is the issue affecting all subscribers on a specific service?
• Is there anything else common to the issue?
CPS Troubleshooting Guide, Release 19.4.01

• Have there been any changes performed on the CPS system or any other systems?
• Has there been an increase in subscribers?
• Initially, categorize the issue to determine the level of support needed.
Use the dump_utility.py script to collect useful troubleshooting information for Cisco technical support.Information is printed on the terminal and stored in a log file:/var/tmp/dumputility-<date_time_when_executed>.log.
For more information about this utility, refer to the list of CPS Commands in the CPS Operations Guide.
Important
Collecting MongoDB Information for TroubleshootingThis sections describes steps on how to collect information regarding mongo if a customer has issues withMongoDB:
Step 1 Collect the information from /etc/broadhop/mongoConfig.cfg file from pcrfclient01 VM.Step 2 Collect diagnostics.sh --get_replica_status output.
If a member is shown in an unknown state, it is likely that the member is not accessible from one of othermembers, mostly an arbiter or the member itself is down. In that case, you must go to that member VM andcheck its connectivity with other members as well the mongo process. Also, you can login to mongo on thatmember and check its actual status.
• If a mongo member is up and running, then check the network connectivity with other members. In case,there is a connectivity issue, report the issue to network administrator.
• If a member is up and running and network connectivity is also good, check the status of member usingmongo CLI. In case, status is "OTHER" , restart the mongo process again. After restart, the replica-setwill come up as Secondary (based on its priority).
• If a member is down, start the mongo process.
Note
Step 3 Collect the information from /var/log/broadhop/mongodb-<dbportnum>.log file from the sessionmgr VMswhere database is hosted (primary/secondary/arbiter for all hosts in the configured replica set. If multiple replica setsexperience issues collect from 1 replica set).
Step 4 Connect to the primary sessionmgr VMhosting the database and collect the data (for example, for 10minutes) by executingthe following commands:
/usr/bin/mongotop --port <dbportnum> | awk '{ print strftime("%Y-%m-%d %H:%M:%S"), $0; fflush(); }'
>
/var/tmp/mongotop-dbportnum.log &
where,<dbportnum> is the mongoDB port for the given database (session/SPR/balance/admin), such as 27717 for balancedatabase.
vmstat 1 | awk '{ print strftime("%Y-%m-%d %H:%M:%S"), $0; fflush(); }' > /var/tmp/vmstat.log &
CPS Troubleshooting Guide, Release 19.4.02
Troubleshooting CPSCollecting MongoDB Information for Troubleshooting

The above mentioned three commands must not be left running on the system, otherwise there will beperformance degradation. After 10 min (or so), kill the above mentioned three processes using the 'kill -9'command on each of the three processes.
Note
Step 5 Connect to the primary sessionmgr VM hosting the balance and collect all the database dumps by executing the followingcommand:
mongodump --host <ipaddress> --port <dbport>
The mongo dump is a disk space intensive operation based on your database size, so run it from a VM whichhas enough disk space. It is also recommended to remove the collected dump/logs once diagnosis is complete.
Note
Step 6 Use the following command to check mongoDB statistics on queries/inserts/updates/deletes for all CPS databases (andon all primary and secondary databases) and verify if there are any abnormalities (for example, high number ofinsert/update/delete considering TPS, large number of queries going to other site). Here considering the session databaseas an example:
mongostat --host <sessionmgr VM name> --port <dBportnumber>
For example,
mongostat --host sessionmgr01 --port 27717
High CPU Usage Issue• Thread details and jstack output. It could be captured as:
• From top output see if java process is taking high CPU.
• Capture output of the following command:
ps -C java -L -o pcpucpunicestatecputimepidtid | sort > tid.log
• Capture output of the following command where <process pid> is the pid of process causing highCPU (as per top output):
If java process is running as a root user:
jstack <process pid> > jstack.log
If java process is running as policy server (qns) user :
sudo -u qns "jstack <process pid>" > jstack.log
If running above commands report error for process hung/not responding then use -F option afterjstack.
Capture another jstack output as above but with an additional -l option
JVM CrashJVM generates a fatal error log file that contains the state of process at the time of the fatal error. By default,the name of file has format hs_err_pid<pid>.log and it is generated in the working directory from where thecorresponding java processes were started (that is the working directory of the user when user started thepolicy server (qns) process). If the working directory is not known then one could search system for file withname hs_err_pid*.log and look into file which has timestamp same as time of error.
CPS Troubleshooting Guide, Release 19.4.03
Troubleshooting CPSHigh CPU Usage Issue

High Memory Usage/Out of Memory Error• JVM could generate heap dump in case of out of memory error. By default, CPS is not configured togenerate heap dump. For generating heap dump the following parameters need to be added to/etc/broadhop/jvm.conf file for different CPS instances present.
-XX+HeapDumpOnOutOfMemoryError
-XXHeapDumpPath=/tmp
Note that the heap dump generation may fail if limit for core is not set correctly. Limit could be set infile /etc/security/limits.conf for root and policy server (qns) user.
• If no dump is generated but memory usage is high and is growing for sometime followed by reductionin usage (may be due to garbage collection) then the heap dump can be explicitly generated by runningthe following command:
• If java process is running as user root:
jmap -dumpformat=bfile=<filename> <process_id>
• If java process is running as policy server (qns) user:
jmap -J-d64 -dump:format=b,file=<filename> <process id>
Example: jmap -J-d64 -dump:format=b,file=/var/tmp/jmapheapdump_18643.map 13382
• Capture this during off-peak hour. In addition to that, nice utility could beused to reduce priority of the process so that it does not impact other runningprocesses.
• Create archive of dump for transfer and make sure to delete dump/archiveafter transfer.
Note
• Use the following procedure to log Garbage Collection:
• Login to VM instance where GC (Garbage Collection) logging needs to be enabled.
• Run the following commands:cd /opt/broadhop/qns-1/bin/chmod +x jmxterm.sh./jmxterm.sh> open <host>:<port>> bean com.sun.management:type=HotSpotDiagnostic> run setVMOption PrintGC true> run setVMOption PrintGCDateStamps true> run setVMOption PrintGCDetails true> run setVMOption PrintGCDetails true> exit
• Revert the changes once the required GC logs are collected.
Issues with Output displayed on GrafanaIn case of Grafana issue, whisper database output is required.
CPS Troubleshooting Guide, Release 19.4.04
Troubleshooting CPSHigh Memory Usage/Out of Memory Error

whisper-fetch --pretty /var/lib/carbon/whisper/cisco/quantum/qps/hosts/*
For example,
whisper-fetch --pretty
/var/lib/carbon/whisper/cisco/quantum/qps/dc1-pcrfclient02/load/midterm.wsp
Basic TroubleshootingCapture the following details in most error cases:
Step 1 Output of the following commands:
diagnostics.sh
For more information on diagnostics.sh, refer to diagnostics.sh section in CPS Operations Guide.
about.sh
Step 2 Collect all the logs:
• Archive created at /var/log/broadhop on pcrfclient01 and pcrfclient02 includes consolidated policy server(qns) logs. Make sure that consolidated logs cover logs of time when issue happened.
• SSH to all available policy server (qns) and load balancer (lb) VMs and capture the following logs:
/var/log/broadhop/qns-*.log
/var/log/broadhop/qns-*.log.gz
/var/log/broadhop/service-qns-*.log
/var/log/broadhop/service-qns-*.log.gz
• SSH to all the available sessionmgr VMs and capture the following mongoDB logs:
/var/log/mongodb-*.log
/var/log/mongodb-*.log.gz
• SSH to all available VMs and capture the following logs:
/var/log/messages*
Step 3 CPS configuration details present at /etc/broadhop.Step 4 SVN repository
To export SVN repository, go to /etc/broadhop/qns.conf and copy the URL specified againstcom.broadhop.config.url.
For example,
-Dcom.broadhop.config.url=http://pcrfclient01/repos/run
Run the following command to export SVN repository:
svn export <url of run repo copied from qns.conf> <folder name where data is to be exported>
Instead of performing Step 2, on page 5 to Step 4, on page 5, you can use dump_utility.py to collect allthe logs, configuration and SVN repository details.
Note
CPS Troubleshooting Guide, Release 19.4.05
Troubleshooting CPSBasic Troubleshooting

Step 5 Top command on all available VMs to display the top CPU processes on the system:
top -b -n 30
Step 6 Output of the following command from pcrfclient01 VM top_qps.sh with output period of 10-15 min and interval of 5sec:
top_qps.sh 5
Step 7 Output of the following command on load balancer (lb) VMs having issue.
netstat -plan
Step 8 Output of the following command on all VMs.
service iptables status
Step 9 Details mentioned in Periodic Monitoring.
Trace Support CommandsThis section covers the following two commands:
• trace.sh
• trace_id.sh
For more information on trace commands, refer to Policy Tracing and Execution Analyzer section in CPSOperations Guide.
trace.shtrace.sh usage:/var/qps/bin/control/trace.sh -i <specific id> -d sessionmgr01:27719/policy_trace/var/qps/bin/control/trace.sh -x <specific id> -d sessionmgr01:27719/policy_trace/var/qps/bin/control/trace.sh -a -d sessionmgr01:27719/policy_trace/var/qps/bin/control/trace.sh -e -d sessionmgr01:27719/policy_trace
This script starts a selective trace and outputs it to standard out.
• Specific Audit Id Tracing
/var/qps/bin/control/trace.sh -i <specific id>
• Dump All Traces for Specific Audit Id
/var/qps/bin/control/trace.sh -x <specific id>
• Trace All.
/var/qps/bin/control/trace.sh -a
• Trace All Errors.
/var/qps/bin/control/trace.sh -e
CPS Troubleshooting Guide, Release 19.4.06
Troubleshooting CPSTrace Support Commands

trace_id.shtrace_id.sh usage:/var/qps/bin/control/trace_ids.sh -i <specific id> -d sessionmgr01:27719/policy_trace/var/qps/bin/control/trace_ids.sh -r <specific id> -d sessionmgr01:27719/policy_trace/var/qps/bin/control/trace_ids.sh -x -d sessionmgr01:27719/policy_trace/var/qps/bin/control/trace_ids.sh -l -d sessionmgr01:27719/policy_trace
This script starts a selective trace and outputs it to standard out.
• Add Specific Audit Id Tracing
/var/qps/bin/control/trace_ids.sh -i <specific id>
• Remove Trace for Specific Audit Id
/var/qps/bin/control/trace_ids.sh -r <specific id>
• Remove Trace for All Ids
/var/qps/bin/control/trace_ids.sh -x
• List All Ids under Trace
/var/qps/bin/control/trace_ids.sh -l
Periodic Monitoring• Run the following command on pcrfclient01 and verify that all the processes are reported as Running.
For CPS 7.0.0 and higher releases:
/var/qps/bin/control/statusall.sh
Program 'cpu_load_trap'status Waitingmonitoring status Waiting
Process 'collectd'status Runningmonitoring status Monitoreduptime 42d 17h 23m
Process 'auditrpms.sh'status Runningmonitoring status Monitoreduptime 28d 20h 26m
System 'qns01'status Runningmonitoring status Monitored
The Monit daemon 5.5 uptime: 21d 10h 26mProcess 'snmpd'status Runningmonitoring status Monitoreduptime 21d 10h 26m
Process 'qns-1'status Runningmonitoring status Monitoreduptime 6d 17h 9m
• Run /var/qps/bin/diag/diagnostics.sh command on pcrfclient01 and verify that no errors/failuresare reported in output.
CPS Troubleshooting Guide, Release 19.4.07
Troubleshooting CPStrace_id.sh

/var/qps/bin/diag/diagnostics.shCPS Diagnostics HA Multi-Node Environment---------------------------Ping check for all VMs...Hosts that are not 'pingable' are added to the IGNORED_HOSTS variable...[PASS
]Checking basic ports for all VMs...[PASS]Checking qns passwordless logins for all VMs...[PASS]Checking disk space for all VMs...[PASS]Checking swap space for all VMs...[PASS]Checking for clock skew for all VMs...[PASS]Checking CPS diagnostics...Retrieving diagnostics from qns01:9045...[PASS]Retrieving diagnostics from qns02:9045...[PASS]Retrieving diagnostics from qns03:9045...[PASS]Retrieving diagnostics from qns04:9045...[PASS]Retrieving diagnostics from pcrfclient01:9045...[PASS]Retrieving diagnostics from pcrfclient02:9045...[PASS]
Checking svn sync status between pcrfclient01 & 02...svn is not sync between pcrfclient01 & pcrfclient02...[FAIL]Corrective Action(s): Run ssh pcrfclient01 /var/qps/bin/support/recover_svn_sync.shChecking HAProxy statistics and ports...
For more information on diagnostics.sh, refer to diagnostics.sh section in CPS Operations Guide.
• Perform the following actions to verify VMs status is reported as UP and healthy and no alarms aregenerated for any VMs.
• Login to the VMware console
• Verify the VM statistics, graphs and alarms through the console.
• Verify if any trap is generated by CPS.
/var/log/snmp/trap file is updated on active load balancer (LB) onlywhenever the trap is generated.
Note
cd /var/log/snmp
tailf trap
• Verify if any error is reported in CPS logs.
cd /var/log/broadhop
grep -i error consolidated-qns.log
grep -i error consolidated-engine.log
• Monitor the following KPIs on Grafana for any abnormal behavior:
• CPU usage of all instances on all the VMs
• Memory usage of all instances on all VMs
• Free disk space on all instances on all VMs
• Diameter messages load: CCR-I, CCR-U, CCR-T, AAR, RAR, STR, ASR, SDR
• Diameter messages response time: CCR-I, CCR-U, CCR-T, AAR, RAR, STR, ASR, SDA
CPS Troubleshooting Guide, Release 19.4.08
Troubleshooting CPSPeriodic Monitoring
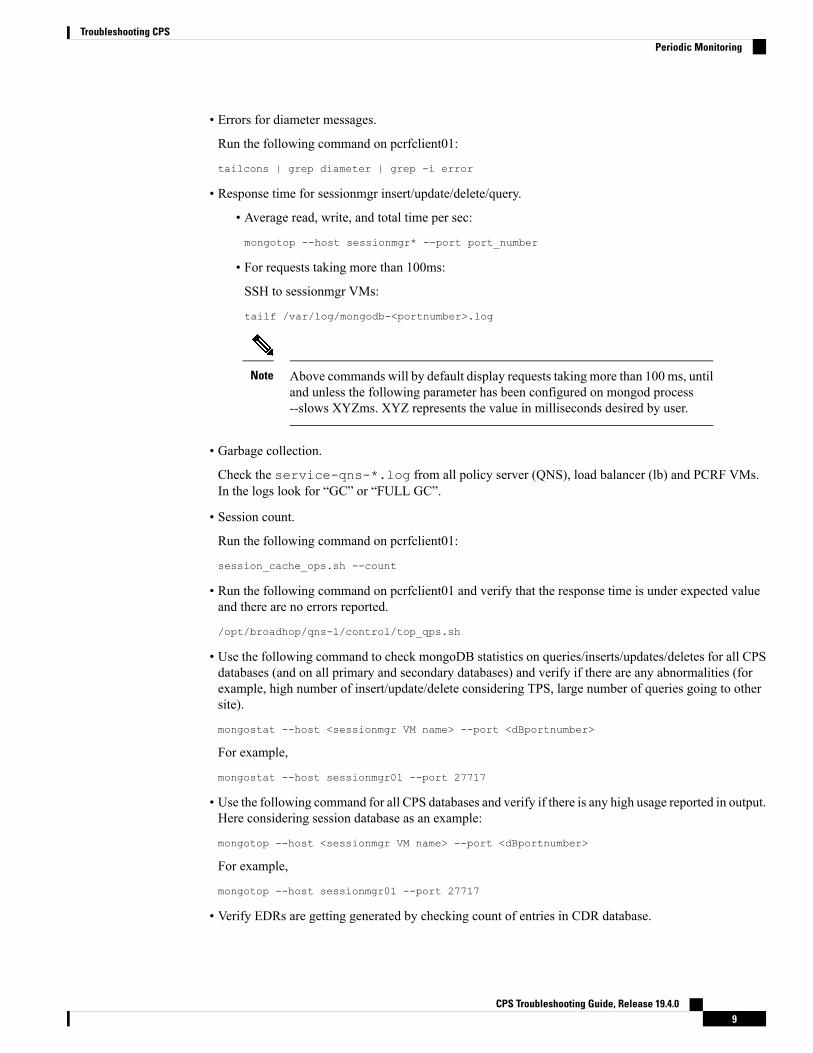
• Errors for diameter messages.
Run the following command on pcrfclient01:
tailcons | grep diameter | grep -i error
• Response time for sessionmgr insert/update/delete/query.
• Average read, write, and total time per sec:
mongotop --host sessionmgr* --port port_number
• For requests taking more than 100ms:
SSH to sessionmgr VMs:
tailf /var/log/mongodb-<portnumber>.log
Above commands will by default display requests taking more than 100 ms, untiland unless the following parameter has been configured on mongod process--slows XYZms. XYZ represents the value in milliseconds desired by user.
Note
• Garbage collection.
Check the service-qns-*.log from all policy server (QNS), load balancer (lb) and PCRF VMs.In the logs look for “GC” or “FULL GC”.
• Session count.
Run the following command on pcrfclient01:
session_cache_ops.sh --count
• Run the following command on pcrfclient01 and verify that the response time is under expected valueand there are no errors reported.
/opt/broadhop/qns-1/control/top_qps.sh
• Use the following command to check mongoDB statistics on queries/inserts/updates/deletes for all CPSdatabases (and on all primary and secondary databases) and verify if there are any abnormalities (forexample, high number of insert/update/delete considering TPS, large number of queries going to othersite).
mongostat --host <sessionmgr VM name> --port <dBportnumber>
For example,
mongostat --host sessionmgr01 --port 27717
• Use the following command for all CPS databases and verify if there is any high usage reported in output.Here considering session database as an example:
mongotop --host <sessionmgr VM name> --port <dBportnumber>
For example,
mongotop --host sessionmgr01 --port 27717
• Verify EDRs are getting generated by checking count of entries in CDR database.
CPS Troubleshooting Guide, Release 19.4.09
Troubleshooting CPSPeriodic Monitoring

• Verify EDRs are getting replicated by checking count of entries in the databases.
• Determine most recently inserted CDR record in MySQL database and compare the insert time with thetime the CDR was generated. Time difference should be within 2 min or otherwise signifies lag inreplication.
• Count of CCR-I/CCR-U/CCR-T/RAR messages from/to GW.
• Count of failed CCR-I/CCR-U/CCR-T/RARmessages from/to GW. If GWhas capability, capture detailsat error code level.
Run the following command on pcrfclient01:
cd /var/broadhop/stats
grep "Gx_CCR-" bulk-*.csv
• Response time of CCR-I/CCR-U/CCR-T messages at GW.
• Count of session in PCRF and count of session in GW. There could be some mismatch between the countdue to time gap between determining session count from CPS and GW. If the count difference is highthen it could indicate stale sessions on PCRF or GW.
• Count of AAR/RAR/STR/ASR messages from/to Application Function.
• Count of failed AAR/RAR/STR/ASR messages from/to Application Function. If Application Functionhas capability, capture details at error code level.
Run the following command on pcrfclient01:
cd /var/broadhop/stats
grep "Gx_CCR-" bulk-*.csv
• Response time of AAR/RAR/STR/ASR messages at Application Function.
• Count of session in PCRF and count of session in Application Function. There could be some mismatchbetween the count due to time gap between determining session count fromCPS andApplication Function.If the count difference is high then it could indicate stale sessions on PCRF or Application Function.
Count of session in PCRF:
session_cache_ops.sh -count
E2E Call Flow Troubleshooting• On an All-in-One deployment, run the following commands:
tcpdump -i <any port 80 or 8080 or 1812 or 1700 or 1813 or 3868> -s 0 -vv
• Append a –w /tmp/callflow.pcap to capture output to Wireshark file
• Open the file in WireShark and filter on HTTP to assist debugging the call flow.
• In a distributed model, you need to tcpdump on individual VMs:
• Load balancers on port 1812, 1813, 1700, 8080 and 3868
Correct call flows are shown Call Flows.
CPS Troubleshooting Guide, Release 19.4.010
Troubleshooting CPSE2E Call Flow Troubleshooting

Recovery using Remove/Add Members OptionWhen Arbiter blade and a sessionmgr blade goes down there is not any primary sessionmgr node to caterrequests coming from CPS VMs (Classic HA setup-1 arbiter 2 sessionmgrs). As a result the system becomesunstable.
A safe way to recover from the issue is to bring UP the down blades to working state. If bringing blades backto working state is not possible then only way to keep setup working is removing failed members of replica-setfrom mongo-config. In doing so UP and running sessionmgr node becomes primary. It is must to add failedmembers back to replica-set once they come online.
The following sections describe how to remove failed members from mongo-replica set and how to add themback in replica-set once they are online.
The steps mentioned in the following sections should be executed properly.Note
The following steps are done only when only one sessionmgr is UP but is in secondary mode and cannotbecome primary on its own and bringing back down blades (holding arbiter and primary sessionmgr VMs)to operational mode is not possible.
Note
Remove Failed MembersThis option is usually used when member/s are not running and treated as failed member. The script removesall such failed members from replica-set.
Step 1 Login to pcrfclient01/02.Step 2 Execute the diagnostics script to know which replica-set or respective component is failed and you want to remove.
diagnostics.sh --get_replica_status
If a member is shown in an unknown state, it is likely that the member is not accessible from one of othermembers, mostly an arbiter. In that case, you must go to that member and check its connectivity with othermembers.
Also, you can login to mongo on that member and check its actual status.
Note
Step 3 Execute build_set.sh with below options to remove failed member/s from replica set. This operation removes the allfailed members across the site.
cd /var/qps/bin/support/mongo/
For session database:
./build_set.sh --session --remove-failed-members
For SPR database:
./build_set.sh --spr --remove-failed-members
CPS Troubleshooting Guide, Release 19.4.011
Troubleshooting CPSRecovery using Remove/Add Members Option

For balance database:
./build_set.sh --balance --remove-failed-members
For report database:
./build_set.sh --report --remove-failed-members
Step 4 Execute the diagnostics script again to verify if that particular member is removed.
diagnostics.sh --get_replica_status
If status is not seen properly by above command, login to mongo port on sessionmgr and check replica status.Note
Figure 1: Replica Status
If a member is shown in an unknown state, it is likely that the member is not accessible from one of othermembers, mostly an arbiter. In that case, you must go to that member and check its connectivity with othermembers.
Also, you can login to mongo on that member and check its actual status.
Note
CPS Troubleshooting Guide, Release 19.4.012
Troubleshooting CPSRemove Failed Members

Add Failed Members
Step 1 Login to pcrfclient01/02.Step 2 Once the failed members are back online, they can be added back in replica-set.Step 3 Execute the diagnostics script to know which replica-set member is not in configuration or failed member.
diagnostics.sh --get_replica_status
If status is not seen properly by above command, login to mongo port on sessionmgr and check replica status.
If a member is shown in an unknown state, it is likely that the member is not accessible from one of othermembers, mostly an arbiter. In that case, you must go to that member and check its connectivity with othermembers.
Also, you can login to mongo on that member and check its actual status.
Note
Figure 2: Replica Status
cd /var/qps/bin/support/mongo
For session database:
./build_set.sh --session --add-members
For SPR database:
CPS Troubleshooting Guide, Release 19.4.013
Troubleshooting CPSAdd Failed Members

./build_set.sh --spr --add-members
For balance database:
./build_set.sh --balance --add-members
For report database:
./build_set.sh --report --add-members
Maintenance Window ProceduresThe usual tasks for a maintenance window might include these:
Prior to Any MaintenanceBackup all relevant information to an offline resource. For more information on backup see Cisco Policy SuiteBackup and Restore Guide.
• Data - Backup all database information. This includes Cisco MsBM Cisco Unified SuM.
Sessions can be backed up as well.Note
• Configurations - Backup all configuration information. This includes SVN (from PCRF Client) the/etc/broadhop directory from all PCRFs
• Logs - Backup all logs for comparison to the upgrade. This is not required but will be helpful if there areany issues.
Change Request Procedure• Have proper sign off for any change request. Cisco and all customer teams must sign off.• Make sure the proposed procedures are well defined.• Make sure the rollback procedures are correct and available.
Software Upgrades• Determine if the software upgrade will cause an outage and requires a maintenance window to performthe upgrade.
• Typically software upgrades can be done on one node a time and so minimize or eliminate any outage.• Most of the time an upgrade requires a restart of the application. Most applications can be started in lessthan 1 minute.
VM Restarts• LINUX must be shutdown normally for VM restarts.
CPS Troubleshooting Guide, Release 19.4.014
Troubleshooting CPSMaintenance Window Procedures
• All VMs are Linux.• The preferred methods are init 0 or shutdown –h
• Failure to use the Linux OS shutdown can result in VM corruption and problems restarting the VM andapplications.
• VM restart is typically done to increase resources to the VM (disk memory CPU).
Hardware Restarts• Hardware restarts should be rare.• When a hardware restart is needed VMs must be shutdown first.• When all VMs are stopped shutdown the hardware with either the ESXi console or as a power off.
Planned Outages• Planned outages are similar to hardware restarts.• VMs need to be shutdown hardware can then be stopped.• When hardware is started the typical hardware starting order is:
• Start the servers with PCRFClient01 LB01 and SessionMgr01 first.
• Start all other servers in any order after that.
Non-maintenance Window ProceduresTasks you can perform as non-maintenance that is at any time are these
• Data archiving or warehousing• Log removal
Common Troubleshooting TasksThis section describes frequently used troubleshooting tasks youmight use before calling support or as directedby support.
Low or Out of Disk SpaceTo determine the disk space used use these Linux disk usage and disk free commands
• du• df
df Commanddf
For example:
CPS Troubleshooting Guide, Release 19.4.015
Troubleshooting CPSHardware Restarts
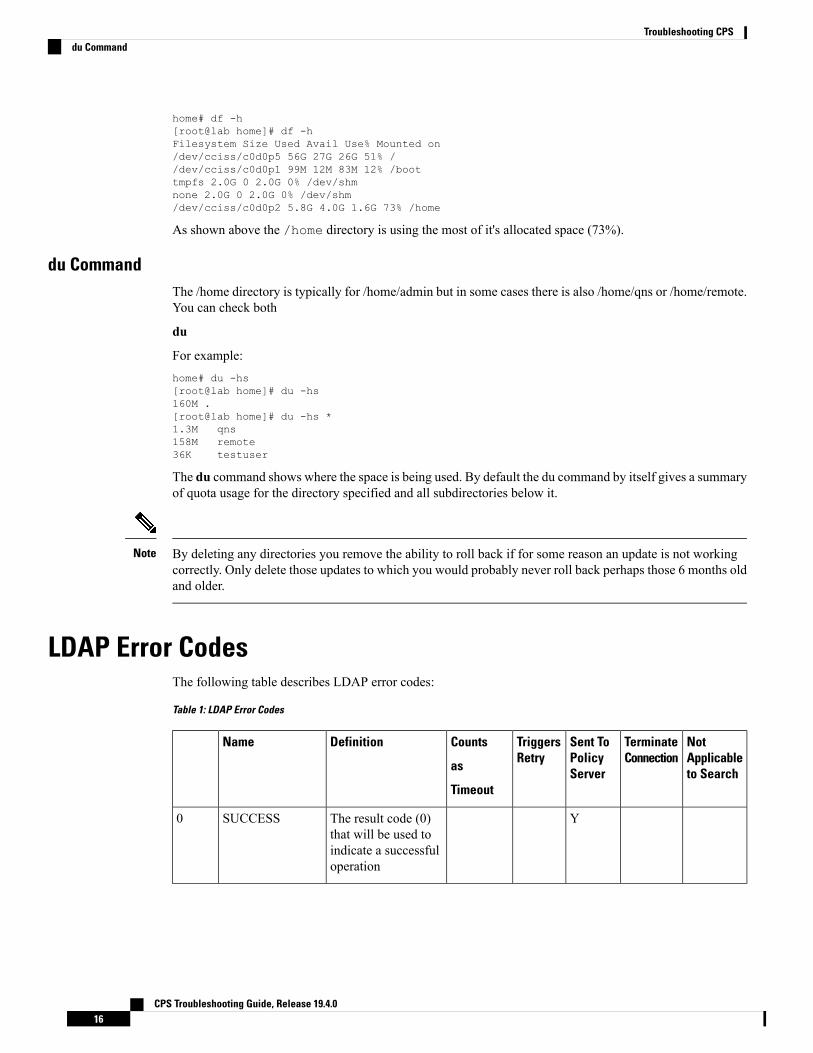
home# df -h[root@lab home]# df -hFilesystem Size Used Avail Use% Mounted on/dev/cciss/c0d0p5 56G 27G 26G 51% //dev/cciss/c0d0p1 99M 12M 83M 12% /boottmpfs 2.0G 0 2.0G 0% /dev/shmnone 2.0G 0 2.0G 0% /dev/shm/dev/cciss/c0d0p2 5.8G 4.0G 1.6G 73% /home
As shown above the /home directory is using the most of it's allocated space (73%).
du CommandThe /home directory is typically for /home/admin but in some cases there is also /home/qns or /home/remote.You can check both
du
For example:home# du -hs[root@lab home]# du -hs160M .[root@lab home]# du -hs *1.3M qns158M remote36K testuser
The du command shows where the space is being used. By default the du command by itself gives a summaryof quota usage for the directory specified and all subdirectories below it.
By deleting any directories you remove the ability to roll back if for some reason an update is not workingcorrectly. Only delete those updates to which you would probably never roll back perhaps those 6 months oldand older.
Note
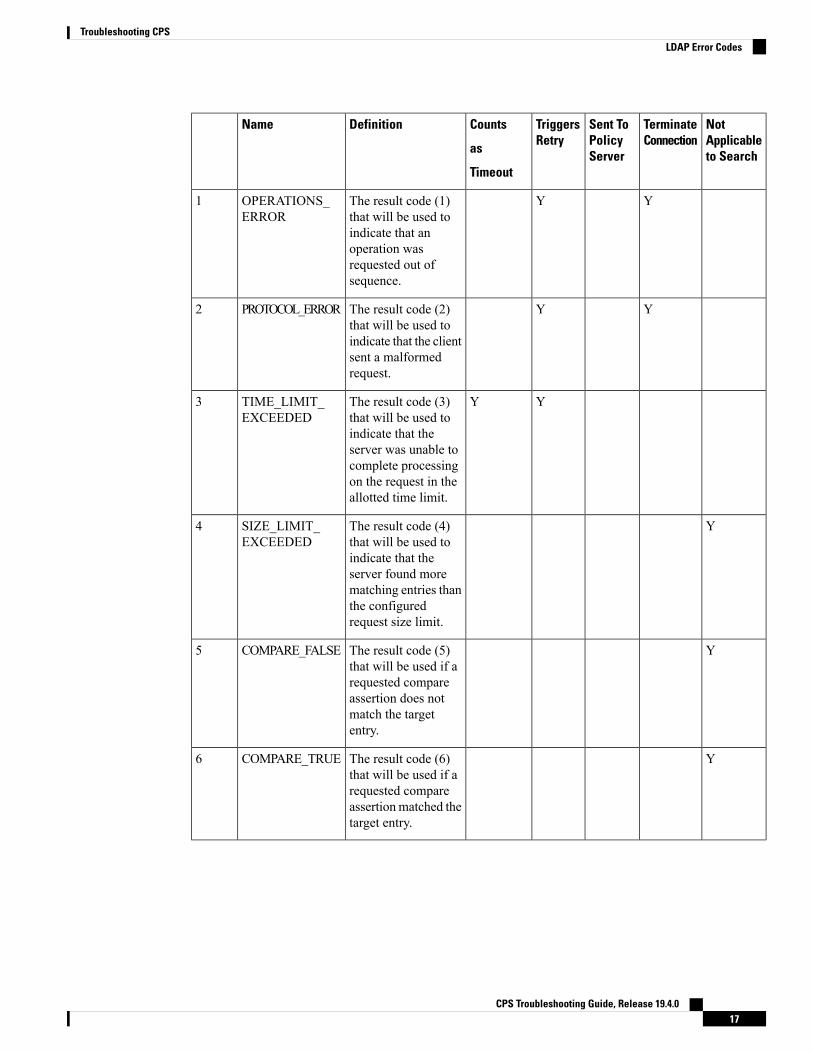
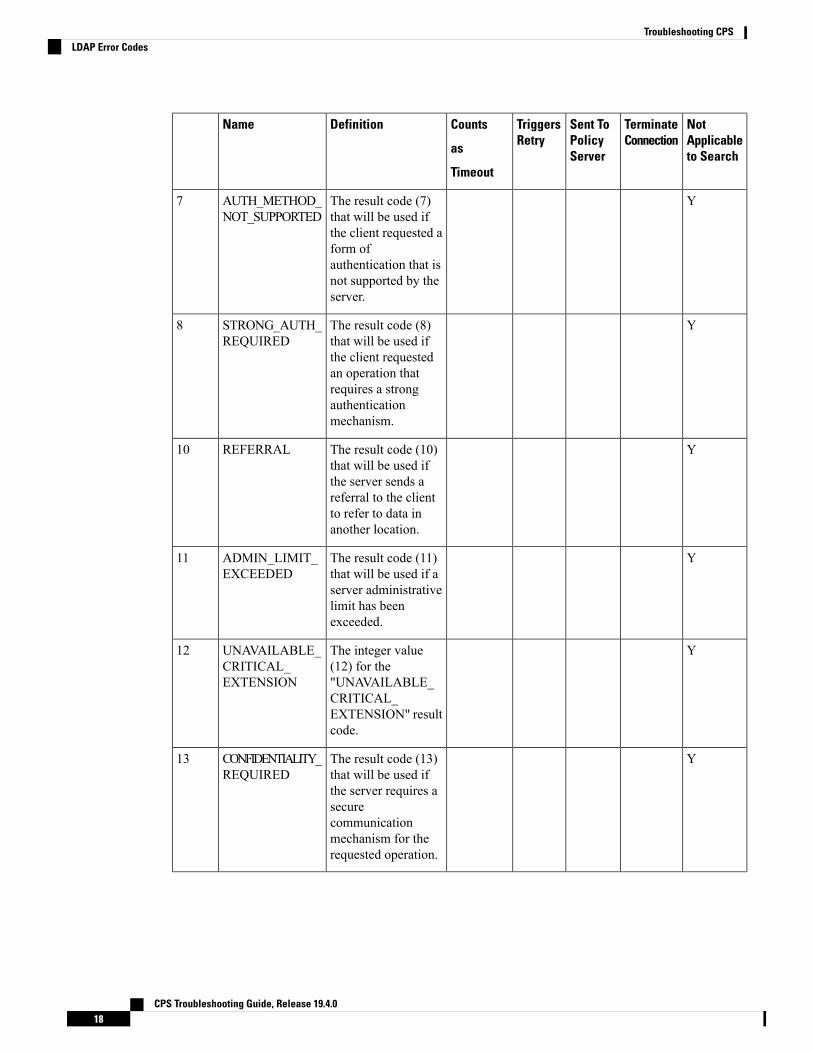
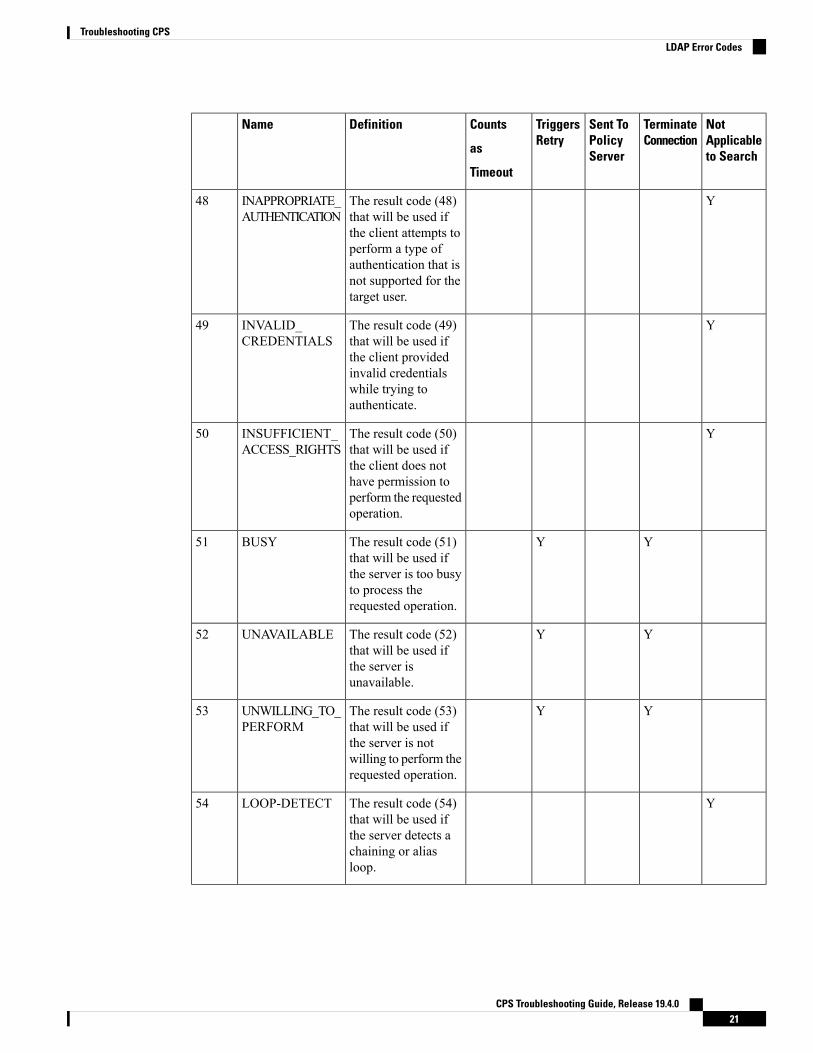
LDAP Error CodesThe following table describes LDAP error codes:
Table 1: LDAP Error Codes
NotApplicableto Search
TerminateConnection
Sent ToPolicyServer
TriggersRetry
Counts
as
Timeout
DefinitionName
YThe result code (0)that will be used toindicate a successfuloperation
SUCCESS0
CPS Troubleshooting Guide, Release 19.4.016
Troubleshooting CPSdu Command
NotApplicableto Search
TerminateConnection
Sent ToPolicyServer
TriggersRetry
Counts
as
Timeout
DefinitionName
YYThe result code (1)that will be used toindicate that anoperation wasrequested out ofsequence.
OPERATIONS_ERROR
1
YYThe result code (2)that will be used toindicate that the clientsent a malformedrequest.
PROTOCOL_ERROR2
YYThe result code (3)that will be used toindicate that theserver was unable tocomplete processingon the request in theallotted time limit.
TIME_LIMIT_EXCEEDED
3
YThe result code (4)that will be used toindicate that theserver found morematching entries thanthe configuredrequest size limit.
SIZE_LIMIT_EXCEEDED
4
YThe result code (5)that will be used if arequested compareassertion does notmatch the targetentry.
COMPARE_FALSE5
YThe result code (6)that will be used if arequested compareassertionmatched thetarget entry.
COMPARE_TRUE6
CPS Troubleshooting Guide, Release 19.4.017
Troubleshooting CPSLDAP Error Codes
NotApplicableto Search
TerminateConnection
Sent ToPolicyServer
TriggersRetry
Counts
as
Timeout
DefinitionName
YThe result code (7)that will be used ifthe client requested aform ofauthentication that isnot supported by theserver.
AUTH_METHOD_NOT_SUPPORTED
7
YThe result code (8)that will be used ifthe client requestedan operation thatrequires a strongauthenticationmechanism.
STRONG_AUTH_REQUIRED
8
YThe result code (10)that will be used ifthe server sends areferral to the clientto refer to data inanother location.
REFERRAL10
YThe result code (11)that will be used if aserver administrativelimit has beenexceeded.
ADMIN_LIMIT_EXCEEDED
11
YThe integer value(12) for the"UNAVAILABLE_CRITICAL_EXTENSION" resultcode.
UNAVAILABLE_CRITICAL_EXTENSION
12
YThe result code (13)that will be used ifthe server requires asecurecommunicationmechanism for therequested operation.
CONFIDENTIALITY_REQUIRED
13
CPS Troubleshooting Guide, Release 19.4.018
Troubleshooting CPSLDAP Error Codes

NotApplicableto Search
TerminateConnection
Sent ToPolicyServer
TriggersRetry
Counts
as
Timeout
DefinitionName
YThe result code (14)that will be returnedfrom the server afterSASL bind stages inwhich moreprocessing isrequired.
SASL_BIND_IN_PROGRESS
14
YThe result code (16)that will be used ifthe client referencedan attribute that doesnot exist in the targetentry.
NO_SUCH_ATTRIBUTE
16
YThe result code (17)that will be used ifthe client referencedan attribute that is notdefined in the serverschema.
UNDEFINED_ATTRIBUTE_TYPE
17
YThe result code (18)that will be used ifthe client attemptedto use an attribute ina search filter in amanner not supportedby the matching rulesassociated with thatattribute.
INAPPROPRIATE_MATCHING
18
YThe result code (19)that will be used ifthe requestedoperation wouldviolate someconstraint defined inthe server.
CONSTRAINT_VIOLATION
19
CPS Troubleshooting Guide, Release 19.4.019
Troubleshooting CPSLDAP Error Codes

NotApplicableto Search
TerminateConnection
Sent ToPolicyServer
TriggersRetry
Counts
as
Timeout
DefinitionName
YThe result code (20)that will be used ifthe client attempts tomodify an entry in away that would createa duplicate value, orcreatemultiple valuesfor a single-valuedattribute.
ATTRIBUTE_OR_VALUE_ EXISTS
20
YThe result code (21)that will be used ifthe client attempts toperform an operationthat would create anattribute value thatviolates the syntax forthat attribute.
INVALID_ATTRIBUTE_SYNTAX
21
YThe result code (32)that will be used ifthe client targeted anentry that does notexist.
NO_SUCH_OBJECT32
YThe result code (33)that will be used ifthe client targeted anentry that as an alias.
ALIAS_PROBLEM33
YThe result code (34)that will be used ifthe client provided aninvalid DN.
INVALID_DN_SYNTAX34
YThe result code (36)that will be used if aproblem isencounteredwhile theserver is attemptingto dereference analias.
ALIAS_DEREFERENCING_PROBLEM
36
CPS Troubleshooting Guide, Release 19.4.020
Troubleshooting CPSLDAP Error Codes
NotApplicableto Search
TerminateConnection
Sent ToPolicyServer
TriggersRetry
Counts
as
Timeout
DefinitionName
YThe result code (48)that will be used ifthe client attempts toperform a type ofauthentication that isnot supported for thetarget user.
INAPPROPRIATE_AUTHENTICATION
48
YThe result code (49)that will be used ifthe client providedinvalid credentialswhile trying toauthenticate.
INVALID_CREDENTIALS
49
YThe result code (50)that will be used ifthe client does nothave permission toperform the requestedoperation.
INSUFFICIENT_ACCESS_RIGHTS
50
YYThe result code (51)that will be used ifthe server is too busyto process therequested operation.
BUSY51
YYThe result code (52)that will be used ifthe server isunavailable.
UNAVAILABLE52
YYThe result code (53)that will be used ifthe server is notwilling to perform therequested operation.
UNWILLING_TO_PERFORM
53
YThe result code (54)that will be used ifthe server detects achaining or aliasloop.
LOOP-DETECT54
CPS Troubleshooting Guide, Release 19.4.021
Troubleshooting CPSLDAP Error Codes

NotApplicableto Search
TerminateConnection
Sent ToPolicyServer
TriggersRetry
Counts
as
Timeout
DefinitionName
YThe result code (60)that will be used ifthe client sends avirtual list viewcontrol without aserver-side sortcontrol.
SORT_CONTROL_MISSING
60
YThe result code (61)that will be used ifthe client provides avirtual list viewcontrol with a targetoffset that is out ofrange for theavailable data set.
OFFSET_RANGE_ERROR
61
YThe result code (64)that will be used ifthe client requestviolates a namingconstraint (e.g., aname form or DITstructure rule)defined in the server.
NAMING_VIOLATION
64
YThe result code (65)that will be used ifthe client requestviolates an objectclass constraint (e.g.,an undefined objectclass, a disallowedattribute, or a missingrequired attribute)defined in the server.
OBJECT_CLASS_VIOLATION
65
YThe result code (66)that will be used ifthe requestedoperation is notallowed to beperformed onnon-leaf entries.
NOT_ALLOWED_ON_NONLEAF
66
CPS Troubleshooting Guide, Release 19.4.022
Troubleshooting CPSLDAP Error Codes

NotApplicableto Search
TerminateConnection
Sent ToPolicyServer
TriggersRetry
Counts
as
Timeout
DefinitionName
YThe result code (67)that will be used ifthe requestedoperation would alterthe RDN of the entrybut the operation wasnot a modify DNrequest.
NOT_ALLOWED_ON_RDN
67
YThe result code (68)that will be used ifthe requestedoperation wouldcreate a conflict withan entry that alreadyexists in the server.
ENTRY_ALREADY_EXISTS
68
YThe result code (69)that will be used ifthe requestedoperation would alterthe set of objectclasses defined in theentry in a disallowedmanner.
OBJECT_CLASS_MODS_PROHIBITED
69
YThe result code (71)that will be used ifthe requestedoperation wouldimpact entries inmultiple data sources.
AFFECTS_MULTIPLE_DSAS
71
YThe result code (76)that will be used if anerror occurred whileperformingprocessing associatedwith the virtual listview control.
VIRTUAL_LIST_VIEW_ERROR
76
YYThe result code (80)that will be used ifnone of the otherresult codes areappropriate.
OTHER80
CPS Troubleshooting Guide, Release 19.4.023
Troubleshooting CPSLDAP Error Codes

NotApplicableto Search
TerminateConnection
Sent ToPolicyServer
TriggersRetry
Counts
as
Timeout
DefinitionName
YYThe client-side resultcode (81) that will beused if an establishedconnection to theserver is lost.
SERVER_DOWN81
YYThe client-side resultcode (82) that will beused if a genericclient-side erroroccurs duringprocessing.
LOCAL_ERROR82
YYThe client-side resultcode (83) that will beused if an erroroccurs whileencoding a request.
ENCODING_ERROR
83
YYThe client-side resultcode (84) that will beused if an erroroccurs whiledecoding a response.
DECODING_ERROR
84
YYYThe client-side resultcode (85) that will beused if a clienttimeout occurs whilewaiting for a responsefrom the server.
TIMEOUT85
YThe client-side resultcode (86) that will beused if the clientattempts to use anunknownauthentication type.
AUTH_UNKNOWN86
YThe client-side resultcode (87) that will beused if an erroroccurs whileattempting to encodea search filter.
FILTER_ERROR87
CPS Troubleshooting Guide, Release 19.4.024
Troubleshooting CPSLDAP Error Codes

NotApplicableto Search
TerminateConnection
Sent ToPolicyServer
TriggersRetry
Counts
as
Timeout
DefinitionName
YThe client-side resultcode (88) that will beused if the end usercanceled theoperation in progress.
USER_CANCELED88
YThe client-side resultcode (89) that will beused if there is aproblem with theparameters providedfor a request.
PARAM_ERROR89
YYThe client-side resultcode (90) that will beused if the client doesnot have sufficientmemory to performthe requestedoperation.
NO_MEMORY90
YYThe client-side resultcode (91) that will beused if an erroroccurs whileattempting to connectto a target server.
CONNECT_ERROR
91
YThe client-side resultcode (92) that will beused if the requestedoperation is notsupported.
NOT_SUPPORTED92
YThe client-side resultcode (93) that will beused if the responsefrom the server didnot include anexpected control.
CONTROL_NOT_FOUND
93
YThe client-side resultcode (94) that will beused if the server didnot send any results.
NO_RESULTS_RETURNED
94
CPS Troubleshooting Guide, Release 19.4.025
Troubleshooting CPSLDAP Error Codes

NotApplicableto Search
TerminateConnection
Sent ToPolicyServer
TriggersRetry
Counts
as
Timeout
DefinitionName
YThe client-side resultcode (95) that will beused if there are stillmore results to return.
MORE_RESULTS_TO_RETURN
95
YThe client-side resultcode (96) that will beused if the clientdetects a loop whileattempting to followreferrals.
CLIENT_LOOP96
YThe client-side resultcode (97) that will beused if the clientencountered toomany referrals in thecourse of processingan operation.
REFERRAL_LIMIT_EXCEEDED
97
YThe result code (118)that will be used ifthe operation wascanceled
CANCELED118
YThe result code (119)that will be used ifthe client attempts tocancel an operationthat the client doesn'texist in the server.
NO_SUCH_OPERATION
119
YThe result code (120)that will be used ifthe client attempts tocancel an operationtoo late in theprocessing for thatoperation.
TOO_LATE120
YThe result code (121)that will be used ifthe client attempts tocancel an operationthat cannot becanceled.
CANNOT_CANCEL
121
CPS Troubleshooting Guide, Release 19.4.026
Troubleshooting CPSLDAP Error Codes

NotApplicableto Search
TerminateConnection
Sent ToPolicyServer
TriggersRetry
Counts
as
Timeout
DefinitionName
YThe result code (122)that will be used ifthe requestedoperation includedthe LDAP assertioncontrol but theassertion did notmatch the targetentry.
ASSERTION_FAILED
122
YThe result code (123)that will be used ifthe client is deniedthe ability to use theproxied authorizationcontrol.
AUTHORIZATION_DENIED
123
Diameter Issues and Errors
Diameter IssuesThe following details need to be captured for diameter issues:
• Details of service associated with subscribers in failure case.• Pcaps capturing calls having issue.• If the issue is with no response pcap should be captured both at CPS and the peer.• Subscriber trace information can be captured using the following process
• To add the subscriber that needs to be traced
/var/qps/bin/control/trace_ids.sh -i <msisdn/imsi> -d sessionmgr01:<port
no>/policy_trace
cd /var/qps/bin/control
• Run the following command to obtain subscriber information
/var/qps/bin/control/trace.sh -i <msisdn/imsi> -d sessionmgr01<port no>/policy_trace
If CPS receives the request message for the same subscriber the trace result will be displayed.
Port no. can be found in “Trace DB Database” configuration in Cluster-1. If Trace Database is not configuredthen by default “Admin Db Configuration” will pick up the trace database.
Note
CPS Troubleshooting Guide, Release 19.4.027
Troubleshooting CPSDiameter Issues and Errors
Diameter Proxy Error in diagnostics.sh OutputWhen you execute diagnostics.sh script on pcrfclient01 VM and it shows the following errors related todiameter proxy
For more information on diagnostics.sh, refer to diagnostics.sh section in CPS Operations Guide.diameter_proxy-lb01_A DOWN L4CONSessions (current,max,limit): 0,0, Rate (sessions,max,limit): 0,0, Last Status change(seconds): 2513094diameter_proxy-lb01_B DOWN L4CONSessions (current,max,limit): 0,0, Rate (sessions,max,limit): 0,0, Last Status change(seconds): 2513093diameter_proxy-lb01_C DOWN L4CONSessions (current,max,limit): 0,0, Rate (sessions,max,limit): 0,0, Last Status change(seconds): 2513092diameter_proxy-BACKEND DOWNSessions (current,max,limit): 0,0,2000 Rate (sessions,max,limit): 0,0, Last Status change(seconds): 2513092
The error L4CONmessage indicates that there is connection problem (e.g. “Connection refused” or “No routeto host”) at layer 1-4. And the error message diameter_proxy-BACKENDDOWN signifies that all the servicespecified in diameter_proxy section in haproxy.cfg file are down.
1. Check whether HAProxy is running on load balancer VM. Specifically for this error message we shouldcheck in lb01.
2. Check the HAProxy configuration:
vi /etc/haproxy/haproxy.cfg
It should show similar entries as shown below. Try to telnet to corresponding load balancer VM withcorresponding ports:diameter_proxy-lb01_A DOWN L4CONSessions (current,max,limit): 0,0, Rate (sessions,max,limit): 0,0, Last Status change(seconds): 2513094diameter_proxy-lb01_B DOWN L4CONSessions (current,max,limit): 0,0, Rate (sessions,max,limit): 0,0, Last Status change(seconds): 2513093diameter_proxy-lb01_C DOWN L4CONSessions (current,max,limit): 0,0, Rate (sessions,max,limit): 0,0, Last Status change(seconds): 2513092diameter_proxy-BACKEND DOWNSessions (current,max,limit): 0,0,2000 Rate (sessions,max,limit): 0,0, Last Status change(seconds): 2513092
Diameter Peer Connectivity is DownIf your Diameter Peer connectivity is down check the following:
1. Check the TCP connection on the diameter port (i.e.,) “netstat -pant | grep 3868". It should be in establishedstate.
2. If the TCP connection is not getting established disable the firewall service iptables stop and checkthe port status /opt/broadhop/installer/support/add_open_port.sh pcrf 3868.
3. Open the Internet browser and go to your repository and check the published policies in runtimeenvironment. You should notice the following configuration. If the following configuration is not there,then most probably it is a bad publish.
CPS Troubleshooting Guide, Release 19.4.028
Troubleshooting CPSDiameter Proxy Error in diagnostics.sh Output

DiameterConfiguration-_4davIF2KEeOXe-MDH-2FEQ.xmi
DiameterStack-default-_A5cgQF2LEeOXe-MDH-2FEQ.xmi
4. If the problem is not in CPS and something is mis-configured in PCEF then you may notice the followingmessages in CPS
tail -f /var/log/broadhop/service-qns-1.log
Sending Alert Notification for host pcef realm lab.realm is downSending Alert Notification for host pcef realm lab.realm is back upSending Alert Notification for host pcef realm lab.realm is downSending Alert Notification for host pcef realm lab.realm is back up
No Response to Diameter Request
Using TCPDUMP
• Collect tcpdump packet capture from the primary policy director (IOmanager).
tcpdump –i any –port 3868 –s0 –w filename test.pcap
In the collected trace file,
• Verify that the response message is sent back to PCEF.• Use Session-Id as filter if the Session-Id of the user’s session is available.• If Session-Id for the user is not available use MSISDN as filter to retrieve the Session-Id. Then applySession-Id filter to view all the messages for the session.
• Match the request to response for Credit Control Request CC-Request-Type attribute(Initial/Update/Terminate).
CPS Logs
• Verify the consolidated-qns.log on PCRFCLIENT01 for any exceptions with policy executions forexample Null Pointer Exception.
• Filter using Session-Id
CPS Troubleshooting Guide, Release 19.4.029
Troubleshooting CPSNo Response to Diameter Request

TCPDUMP – User Id Filter
Figure 3: TCPDUMP – User Id Filter
• Filter using Subscription-Id-Data (MSISDN) to retrieve the CCR initial request.
Diagnose Diameter No Response for Peer Message
The port numbers provided in this section are an example and can differ based on the network deployment.For more information on port numbers contact your Cisco Technical Representative.
Note
Traffic Failover or Similar
In a Geo-Redundant deployment when there are issues in message processing on primary-site A policy director(LB) VMs then there is an increase in diameter traffic sent to secondary-site. This is an indication that thereis a failure in responding to messages sent on primary-site A due to message response timeouts. For example,the following zabbix graphs shows diameter traffic failing over to secondary from 30th Mar 2300 onwards.
CPS Troubleshooting Guide, Release 19.4.030
Troubleshooting CPSDiagnose Diameter No Response for Peer Message
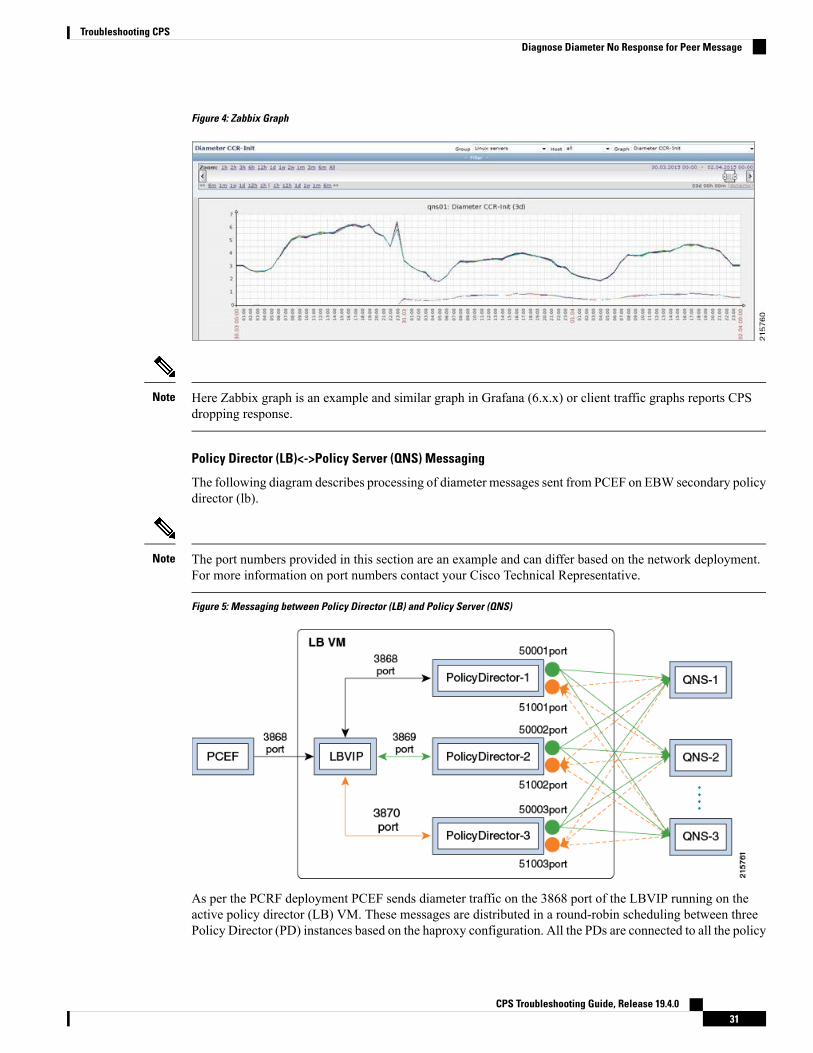
Figure 4: Zabbix Graph
Here Zabbix graph is an example and similar graph in Grafana (6.x.x) or client traffic graphs reports CPSdropping response.
Note
Policy Director (LB)<->Policy Server (QNS) Messaging
The following diagram describes processing of diameter messages sent from PCEF on EBW secondary policydirector (lb).
The port numbers provided in this section are an example and can differ based on the network deployment.For more information on port numbers contact your Cisco Technical Representative.
Note
Figure 5: Messaging between Policy Director (LB) and Policy Server (QNS)
As per the PCRF deployment PCEF sends diameter traffic on the 3868 port of the LBVIP running on theactive policy director (LB) VM. These messages are distributed in a round-robin scheduling between threePolicy Director (PD) instances based on the haproxy configuration. All the PDs are connected to all the policy
CPS Troubleshooting Guide, Release 19.4.031
Troubleshooting CPSDiagnose Diameter No Response for Peer Message

server (QNS) VMs instances using the ZMQ queues. Each PD uses a PUSH queue to send data to policyserver (QNS) VM and PULLQueue to process a response from policy server (QNS) VM. The following tabledescribes the various PUSH and PULL queue ports mapping
Table 2: Policy Director Ports Mapping
HA ProxyPort
Pull QueuePort
PUSH Queue PortPD Instance
38685100150001PD-1
38695100250002PD-2
38705100350003PD-3
Port Details
1. HaProxy portsmonit status qnsXX
PD-1 portnetstat -anp | grep 31654 | grep 3868tcp 0 0 ::ffff:10.192.131.3:3868 :::* LISTEN31654/javatcp 0 0 ::ffff:10.192.131.3:3868 ::ffff:10.192.131.3:52762 ESTABLISHED31654/java
PD-2 portnetstat -anp | grep 31701 | grep 3869tcp 0 0 ::ffff:10.192.131.3:3869 :::* LISTEN31701/javatcp 0 0 ::ffff:10.192.131.3:3869 ::ffff:10.192.131.3:60936 ESTABLISHED31701/java
PD-3 portnetstat -anp | grep 31753 | grep 3870tcp 0 0 ::ffff:10.192.131.3:3870 :::* LISTEN31753/javatcp 0 0 ::ffff:10.192.131.3:3870 ::ffff:10.192.131.3:34338 ESTABLISHED31753/java
2. ZMQ PUSH queue ports for PD-1netstat -anp | grep 31654 | grep 50001tcp 0 0 ::ffff:10.192.131.3:50001 :::* LISTEN31654/javatcp 0 0 ::ffff:10.192.131.3:50001 ::ffff:10.192.131.17:53572 ESTABLISHED31654/javatcp 0 0 ::ffff:10.192.131.3:50001 ::ffff:10.192.131.15:60186 ESTABLISHED31654/javatcp 0 0 ::ffff:10.192.131.3:50001 ::ffff:10.192.131.23:52481 ESTABLISHED31654/java......
All 10 policy server (QNS) VMs are connected on the ZMQ PUSH queue.
3. ZMQ PULL Queue ports for PD-2
CPS Troubleshooting Guide, Release 19.4.032
Troubleshooting CPSDiagnose Diameter No Response for Peer Message

netstat -anp | grep 31654 | grep 50001tcp 0 0 ::ffff:10.192.131.3:50001 :::* LISTEN31654/javatcp 0 0 ::ffff:10.192.131.3:50001 ::ffff:10.192.131.17:53572 ESTABLISHED31654/javatcp 0 0 ::ffff:10.192.131.3:50001 ::ffff:10.192.131.15:60186 ESTABLISHED31654/javatcp 0 0 ::ffff:10.192.131.3:50001 ::ffff:10.192.131.23:52481 ESTABLISHED31654/java......
All 10 policy server (QNS) VMs are connected on the ZMQ PULL queue.
Similarly PD-2 and PD-3 will be connected to all the policy server (QNS) VMs on their respective PUSHand PULL queues port for internal IPC messaging.
Successful Message Handling
The following snapshot shows filtered packets for a successful CCR/CCA message handling done for PD-3.Packet capture was taken using tcpdump on all Ethernet interfaces of active policy director (LB).Figure 6: Filtered Packet
Packet Details
1. Packet#25 CCR message from PCEF to lbvipFigure 7: PCEF to lbvip CCR Message
2. Packet#26 CCR message sent to HaProxy port 3870 of PD-3Figure 8: CCR Message to HaProxy
3. Packet#27 PD-3 sends message to policy server (QNS) VM by adding message to PUSH Queue port50003
CPS Troubleshooting Guide, Release 19.4.033
Troubleshooting CPSDiagnose Diameter No Response for Peer Message

Figure 9: PD-3 Message
4. Packet#74 policy server (QNS) VM sends response back to PD-3 on PULL Queue port 51003Figure 10: Policy Server (QNS) VM Response
5. Packet#76 PD-3 sends CCA message to HaProxy port 3870Figure 11: PD-3 Message
6. Packet#78 CCA sent to PCEFFigure 12: CCA Message
All the above packets are co-related based on the “Diameter Session-Id” found in the Wireshark hex/bytes“ascii character” details as shown above.
Wireshark Filters for capturing messages between PCEF, lbvip, Policy Director and Policy Server (QNS)when tcpdump taken on all Ethernet interfaces of active policy director (LB):
• Filter PD-1 ---> “tcp.srcport == 3868 || tcp.dstport == 3868 || tcp.srcport == 50001 || tcp.dstport == 50001|| tcp.dstport == 3868 || tcp.srcport == 3868 || tcp.srcport == 51001 || tcp.dstport == 51001"
• Filter PB-2 ---> “tcp.srcport == 3869 || tcp.dstport == 3869 || tcp.srcport == 50002 || tcp.dstport == 50002|| tcp.dstport == 3868 || tcp.srcport == 3868 || tcp.srcport == 51002 || tcp.dstport == 51002"
• Filter PD-3 ---> “tcp.srcport == 3870 || tcp.dstport == 3870 || tcp.srcport == 50003 || tcp.dstport == 50003|| tcp.dstport == 3868 || tcp.srcport == 3868 || tcp.srcport == 51003 || tcp.dstport == 51003"
Message Drops at Diameter Interface
Based on the zabbix graphs (an example) if there are messages failing over to secondary then tcpdump takenon primary site active policy director (LB) VM should show the diameter messages for which no responsewas sent to PCEF. On a sample tcpdump we can apply following filter to check the number of messagesdropped and find the list of corresponding peers
Filter in Wireshark - “(!diameter.answer_in ) && !(diameter.answer_to ) && diameter”
CPS Troubleshooting Guide, Release 19.4.034
Troubleshooting CPSDiagnose Diameter No Response for Peer Message

Figure 13: Message Drops
Now filtered packets can be checked to find the number of packets dropped for each peer connections. Allthe packets dropped should be for a given list of Peers which are currently not being processed at primary-site.
Message Dropped between Policy Director (LB)<->Policy Server (QNS)
The next step is to identify the PolicyDirector instance where these messages are being dropped.
1. top command output on active policy director (lb) should show that the PD instance not using any CPUas there are no messages being processed on the process-id, note the PD-instance.
2. Start a tcpdump on all Ethernet interfaces of the policy director VMwhich should contain all packets sentbetween lbvip, policy director instance and policy server (QNS) VMs. This tcpdump will also contain therequests which do not have any response from PCRF, so apply the filter “(!diameter.answer_in) && !(diameter.answer_to) && diameter” in wireshark and note a single request which was not processed.
3. This packet should be then forwarded to PD-instance HaProxy port.Figure 14: Forwarded Packets
Packet 6499 CCR-I request from PCEF was not answered and the message is forwarded to HaProxy port3869 which is PD-2 instance in packet 6501 but no subsequent forwarding to policy server (QNS) VMsoccurred. Hence PD-2 was not processing and forwarding any requests from PCEF to policy server (QNS)VMs. Similarly, this can be verified for other filtered packets as identified in Step 2 above.
In such cases, your Cisco Technical Representative can be contacted to further diagnose the issue andfind the cause for message drops at PD level. Similarly, above analysis can be applied to identify messagesdropped at policy server (QNS) level if packets are forwarded from PD to policy server (QNS) on PUSHqueue but no response from policy server (QNS) VM on PULL queue found.
Recovering Hung Peers
Based on the above diagnosis from tcpdump and top command messages were dropped at the PD-2 instance.This caused all traffic for peers connected to this PD-2 instance to failover to secondary-site LoadBalancersas shown in Zabbix graphs. In order to recover from this situation the LoadBalancer processes should berestarted as follows:
1. Login to the active policy director (lb) of primary-site and execute the following:monit status qnsXXservice heartbeat statusservice monit status
2. Stop the services.
CPS Troubleshooting Guide, Release 19.4.035
Troubleshooting CPSDiagnose Diameter No Response for Peer Message

service heartbeat stopservice monit stopmonit stop qnsXX
3. Start the policy server (QNS) service and check its status.monit start qnsXXmonit status qnsXX
4. Start the monit and heartbeat service.service monit startservice heartbeat start
5. Repeat Step 1 to Step 4 on newly active policy director (lb).
6. Verify from Zabbix graphs or similar graphs that traffic has stopped failing over to secondary-site.
7. Take a tcpdump on all Ethernet interfaces of active policy director (lb) and verify that all the three PolicyDirectors are sending/receiving messages from policy server (QNS) instances as explained in SuccessfulMessage Handling.
Diameter Result Codes and ScenariosThe following table describes some common diameter result codes and scenarios:
Table 3: Common Diameter Result Codes and Scenarios
CPS ScenariosNameCode
Everything went well and Requestprocessed successfully.
DIAMETER_SUCCESS2001
The Request was successfully completed,but additional processing is required bythe application in order to provide serviceto the user.
DIAMETER_LIMITED_SUCCESS2002
TheRequest contained a Command-Codethat the receiver did not recognize orsupport. This MUST be used when aDiameter node receives an experimentalcommand that it does not understand.
DIAMETER_COMMAND_UNSUPPORTED3001
Message cannot be delivered, eitherbecause no host within the realmsupporting the required application wasavailable to process the request orbecause Destination-Host AVPwas givenwithout the associatedDestination-RealmAVP.
DIAMETER_UNABLE_TO_DELIVER3002
The intended realm of the request is notrecognized.
DIAMETER_REALM_NOT_SERVED3003
CPS Troubleshooting Guide, Release 19.4.036
Troubleshooting CPSDiameter Result Codes and Scenarios

CPS ScenariosNameCode
Message got discarded by the overloadhandlingmechanism. Note: CPS 7.5 addsthe option to silently discard instead ofsending DIAMETER_TOO_BUSY asdiscarding is often a better way to haveother node back off instead ofimmediately resending the request in anoverload scenario.
DIAMETER_TOO_BUSY3004
An agent detected a loop while trying toget the message to the intended recipient.The messageMAY be sent to an alternatepeer, if one is available, but the peerreporting the error has identified aconfiguration problem.
DIAMETER_LOOP_DETECTED3005
A redirect agent has determined that therequest could not be satisfied locally andthe initiator of the request should directthe request directly to the server, whosecontact information has been added to theresponse. When set, the Redirect-HostAVP MUST be present.
DIAMETER_REDIRECT_INDICATION3006
A request was sent for an application thatis not supported.
DIAMETER_APPLICATION_UNSUPPORTED3007
A request was received whose bits in theDiameter header were either set to aninvalid combination, or to a value that isinconsistent with the command code'sdefinition.
DIAMETER_INVALID_HDR_BITS3008
A request was received that included anAVP whose flag bits are set to anunrecognized value, or that is inconsistentwith the AVP's definition.
DIAMETER_INVALID_AVP_BITS3009
A CER was received from an unknownpeer.
DIAMETER_UNKNOWN_PEER3010
The authentication process for the userfailed, most likely due to an invalidpassword used by the user. Furtherattempts MUST only be tried afterprompting the user for a new password.
DIAMETER_AUTHENTICATION_REJECTED4001
ADiameter node received the accountingrequest but was unable to commit it tostable storage due to a temporary lack ofspace.
DIAMETER_OUT_OF_SPACE4002
CPS Troubleshooting Guide, Release 19.4.037
Troubleshooting CPSDiameter Result Codes and Scenarios

CPS ScenariosNameCode
The peer has determined that it has lostthe election process and has thereforedisconnected the transport connection.
ELECTION_LOST4003
The credit-control server denies theservice request due to service restrictions.If the CCR contained used-service-unitsthey are deducted, if possible.
DIAMETER_END_USER_SERVICE_DENIED4010
The credit-control server determines thatthe service can be granted to the end userbut no further credit-control is needed forthe service (eg, service is free of charge).
DIAMETER_CREDIT_CONTROL_NOT_APPLICABLE4011
The credit-control server denies theservice request since the end-user'saccount could not cover the requestedservice. If the CCR containedused-service-units they are deducted, ifpossible.
DIAMETER_CREDIT_LIMIT_REACHED4012
When for some reason a PCC rule cannotbe enforced or modified successfully ina network initiated procedure. The reasonis provided in the Event Trigger AVPvalue.
DIAMETER_PCC_BEARER_EVENT4141
Error used by the OCS to indicate to thePCRF that the OCS has no availablepolicy counters for the subscriber.
DIAMETER_ERROR_NO_AVAILABLE_POLICY_COUNTERS
4241
The peer received a message thatcontained an AVP that is not recognizedor supported and was marked with theMandatory bit. A Diameter message withthis error MUST contain one or moreFailed- AVP AVP containing the AVPsthat caused the failure.
DIAMETER_AVP_UNSUPPORTED5001
The request contained an unknownSession-Id.
DIAMETER_UNKNOWN_SESSION_ID5002
A request was received for which the usercould not be authorized. No sessioncreated due to various reasons. Forexample, this error could occur if theservice requested is not permitted to theuser.
DIAMETER_AUTHORIZATION_REJECTED5003
CPS Troubleshooting Guide, Release 19.4.038
Troubleshooting CPSDiameter Result Codes and Scenarios

CPS ScenariosNameCode
The request contained an AVP with aninvalid value in its data portion. ADiameter message indicating this errorMUST include the offending AVPswithin a Failed-AVP AVP.
DIAMETER_INVALID_AVP_VALUE5004
The request did not contain an AVP thatis required by the Command Codedefinition. If this value is sent in theResult-Code AVP, a Failed-AVP AVPSHOULD be included in the message.The Failed-AVP AVP MUST contain anexample of the missing AVP completewith the Vendor-Id if applicable. Thevalue field of the missing AVP should beof correct minimum length and containzeroes.
DIAMETER_MISSING_AVP5005
A request was received that cannot beauthorized because the user has alreadyexpended allowed resources. An exampleof this error condition is a user that isrestricted to one dial-up PPP port,attempts to establish a second PPPconnection.
DIAMETER_RESOURCES_EXCEEDED5006
The Home Diameter server has detectedAVPs in the request that contradictedeach other, and is not willing to provideservice to the user. One or moreFailed-AVP AVPs MUST be present,containing the AVPs that contradictedeach other.
DIAMETER_CONTRADICTING_AVPS5007
A message was received with an AVPthat MUST NOT be present. TheFailed-AVPAVPMUST be included andcontain a copy of the offending AVP.
DIAMETER_AVP_NOT_ALLOWED5008
Amessage was received that included anAVP that appeared more often thanpermitted in the message definition. TheFailed-AVPAVPMUST be included andcontain a copy of the first instance of theoffending AVP that exceeded themaximum number of occurrences
DIAMETER_AVP_OCCURS_TOO_MANY_TIMES
5009
When a CER message is received, andthere are no common applicationssupported between the peers.
DIAMETER_NO_COMMON_APPLICATION5010
CPS Troubleshooting Guide, Release 19.4.039
Troubleshooting CPSDiameter Result Codes and Scenarios

CPS ScenariosNameCode
A request was received, whose versionnumber is unsupported.
DIAMETER_UNSUPPORTED_VERSION5011
Message rejected as something else thatwent wrong and there's no specificreason.
DIAMETER_UNABLE_TO_COMPLY5012
An unrecognized bit in the Diameterheader is set to one (1).
DIAMETER_INVALID_BIT_IN_HEADER5013
The request contained an AVP with aninvalid length. A Diameter messageindicating this error MUST include theoffending AVPs within a Failed-AVPAVP.
DIAMETER_INVALID_AVP_LENGTH5014
A request is received with an invalidmessage length.
DIAMETER_INVALID_MESSAGE_LENGTH5015
The request contained an AVP withwhich is not allowed to have the givenvalue in the AVP Flags field. A Diametermessage indicating this error MUSTinclude the offending AVPs within aFailed-AVP AVP.
DIAMETER_INVALID_AVP_BIT_COMBO5016
A CER message is received, and thereare no common security mechanismssupported between the peers. ACapabilities-Exchange-Answer (CEA)MUST be returned with the Result-CodeAVP set toDIAMETER_NO_COMMON_SECURITY.
DIAMETER_NO_COMMON_SECURITY5017
The subscriber was not found in SPR.DIAMETER_USER_UNKNOWN5030
Informs the credit-control client that thecredit-control server cannot rate theservice request due to insufficient ratinginput, incorrect AVP combination or dueto an AVP or an AVP value that is notrecognized or supported in the rating.
DIAMETER_RATING_FAILED5031
When the set of bearer/sessioninformation sent in a CCR originated dueto a trigger event been met is incoherentwith the previous set of bearer/sessioninformation for the same bearer/session.
DIAMETER_ERROR_TRIGGER_EVENT5141
CPS Troubleshooting Guide, Release 19.4.040
Troubleshooting CPSDiameter Result Codes and Scenarios

CPS ScenariosNameCode
When for some reason the PCC rulescannot be installed/activated. The reasonis provided in the Event Trigger AVPvalue.
DIAMETER_PCC_RULE_EVENT5142
Emergency service related - Used whenthe PCRF cannot authorize an IP-CANbearer upon the reception of an IP-CANbearer authorization request coming fromthe PCEF.
DIAMETER_ERROR_BEARER_NOT_AUTHORIZED
5143
Emergency service related - Used whenthe PCRF does not accept one or more ofthe traffic mapping filters.
DIAMETER_ERROR_TRAFFIC_MAPPING_INFO_REJECTED
5144
Error used by the OCS to indicate to thePCRF that the OCS does not recognizeone or more Policy Counters specified inthe request, when the OCS is configuredto reject the request provided withunknown policy counter identifier(s).
DIAMETER_ERROR_UNKNOWN_POLICY_COUNTERS
5570
Diameter Experimental Result CodesThe following table describes some common Diameter experimental result codes and scenarios:
Table 4: Common Diameter Experimental Result Codes
CPS ScenariosNameCode
The HSS informs the I-CSCF that: - Theuser is authorized to register this publicidentity; - A S-CSCF shall be assigned tothe user.
DIAMETER_FIRST_REGISTRATION2001
The HSS informs the I-CSCF that: - Theuser is authorized to register this publicidentity; - A S-CSCF is already assignedand there is no need to select a new one.
DIAMETER_SUBSEQUENT_REGISTRATION2002
The HSS informs the I-CSCF that: - Thepublic identity is not registered but hasservices related to unregistered state; - AS-CSCF shall be assigned to the user.
DIAMETER_UNREGISTERED_SERVICE2003
The HSS informs to the S-CSCF that: -The de-registration is completed; - TheS-CSCF name is not stored in the HSS.
DIAMETER_SUCCESS_SERVER_NAME_NOT_STORED
2004
CPS Troubleshooting Guide, Release 19.4.041
Troubleshooting CPSDiameter Experimental Result Codes

CPS ScenariosNameCode
The requested user data is not availableat this time to satisfy the requestedoperation.
DIAMETER_USER_DATA_NOT_AVAILABLE4100
The request to update the repository dataat the HSS could not be completedbecause the related repository data iscurrently being updated by another entity.
DIAMETER_PRIOR_UPDATE_IN_PROGRESS4101
The policy decisions (i.e.installation/modification of PCC rules orprovisioning of policy decisions notrelated to a PCC rule) received within aRAR initiated by the PCRF cannot beenforced by the PCEF because theAN-Gateway has failed. If one or morePCC Rules are affected, these PCC Ruleswill be provided in theCharging-Rule-Report AVP including theRule-Failure-Code AVP set toAN_GW_FAILED (17), andPCC-Rule-Status AVP set to INACTIVEas described in Clause 4.5.12. Applicableonly to 3GPP-EPS.
DIAMETER_AN_GW_FAILED4143
A node that supports thePendingTransaction feature receives anincoming request on a session while it hasan ongoing transaction on the samesession and cannot handle the request asdescribed in Clause 8.2 of 3GPP TS29.213 [8].
TGPP_DIAMETER_PENDING_TRANSACTION4144
Returned by PCEF when it doesn't findthe session info for the requested sessionin SDR.
DIAMETER_REQUESTED_SESSION_NOT_FOUND4196
DIAMETER_SESSION_RECOVERY_REQUESTED4197
The PCRF expects a response to apending request that it initiated. ThePCRF can also retry the request messageif needed.
DIAMETER_PENDING_TRANSACTION4198
Message was received for a user or awildcarded identity that is unknown.
DIAMETER_ERROR_USER_UNKNOWN5001
CPS Troubleshooting Guide, Release 19.4.042
Troubleshooting CPSDiameter Experimental Result Codes
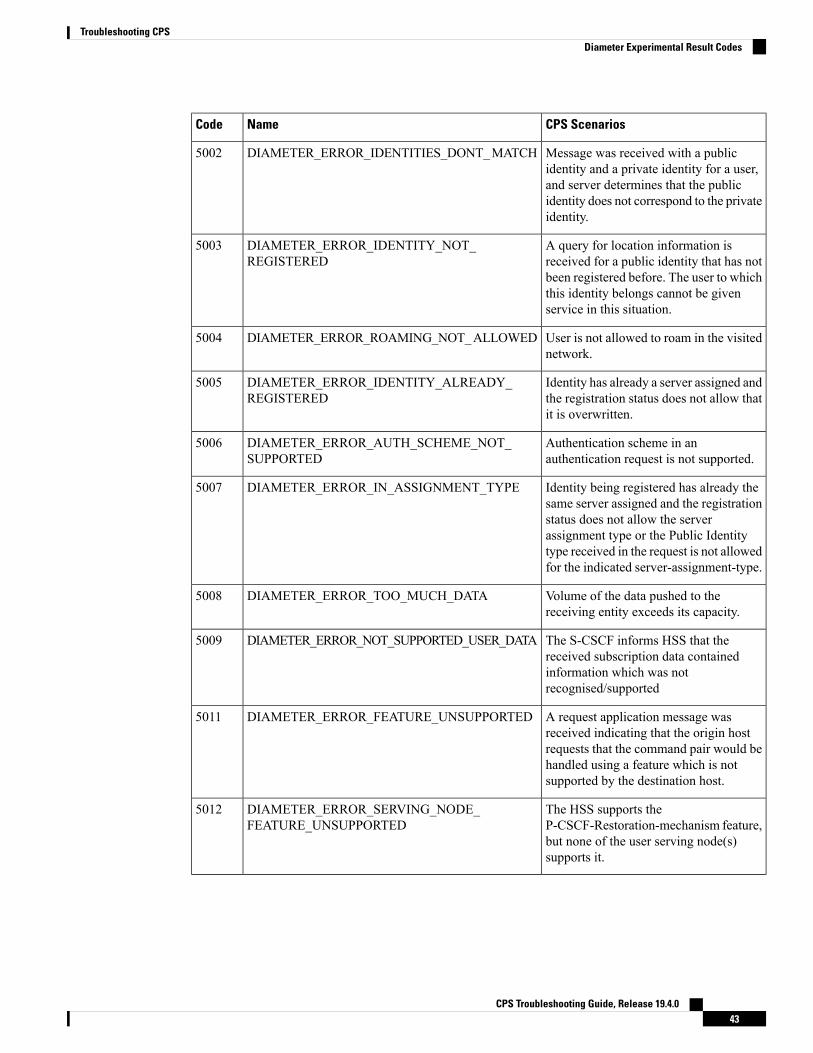
CPS ScenariosNameCode
Message was received with a publicidentity and a private identity for a user,and server determines that the publicidentity does not correspond to the privateidentity.
DIAMETER_ERROR_IDENTITIES_DONT_MATCH5002
A query for location information isreceived for a public identity that has notbeen registered before. The user to whichthis identity belongs cannot be givenservice in this situation.
DIAMETER_ERROR_IDENTITY_NOT_REGISTERED
5003
User is not allowed to roam in the visitednetwork.
DIAMETER_ERROR_ROAMING_NOT_ALLOWED5004
Identity has already a server assigned andthe registration status does not allow thatit is overwritten.
DIAMETER_ERROR_IDENTITY_ALREADY_REGISTERED
5005
Authentication scheme in anauthentication request is not supported.
DIAMETER_ERROR_AUTH_SCHEME_NOT_SUPPORTED
5006
Identity being registered has already thesame server assigned and the registrationstatus does not allow the serverassignment type or the Public Identitytype received in the request is not allowedfor the indicated server-assignment-type.
DIAMETER_ERROR_IN_ASSIGNMENT_TYPE5007
Volume of the data pushed to thereceiving entity exceeds its capacity.
DIAMETER_ERROR_TOO_MUCH_DATA5008
The S-CSCF informs HSS that thereceived subscription data containedinformation which was notrecognised/supported
DIAMETER_ERROR_NOT_SUPPORTED_USER_DATA5009
A request application message wasreceived indicating that the origin hostrequests that the command pair would behandled using a feature which is notsupported by the destination host.
DIAMETER_ERROR_FEATURE_UNSUPPORTED5011
The HSS supports theP-CSCF-Restoration-mechanism feature,but none of the user serving node(s)supports it.
DIAMETER_ERROR_SERVING_NODE_FEATURE_UNSUPPORTED
5012
CPS Troubleshooting Guide, Release 19.4.043
Troubleshooting CPSDiameter Experimental Result Codes

CPS ScenariosNameCode
PCRF rejects new or modified serviceinformation the service informationprovided by the AF is invalid /insufficientfor the server to perform the requestedaction.
INVALID_SERVICE_INFORMATION5061
PCRF rejects new or modified serviceinformation because the Flow-DescriptionAVPs cannot be handled by the server.
FILTER_RESTRICTIONS5062
PCRF rejects new or modified serviceinformation because the requested serviceis not consistent with the relatedsubscription information /operator definedpolicy rules and/or the supported featuresin the IP-CAN network.
REQUESTED_SERVICE_NOT_AUTHORIZED5063
PCRF rejects a new Rx session setupbecause the new Rx session relates to anAF session with another related active Rxsession.
DUPLICATED_AF_SESSION5064
PCRF rejects a new Rx session setupwhen it fails to associate the describedservice IP flows within the sessioninformation received from the AF to anexisting IP-CAN session.
IP_CAN_SESSION_NOT_AVAILABLE5065
PCRF rejects new Rx session setupbecause the session binding functionassociated a non-Emergency IMS sessionto an IP-CAN session established to anEmergency APN.
UNAUTHORIZED_NON_EMERGENCY_SESSION5066
The PCRF rejects a new Rx session setupbecause the PCRF can’t authorize thesponsored data connectivity based on thesponsored data connectivity profile or theoperator policy.
UNAUTHORIZED_SPONSORED_DATA_CONNECTIVITY5067
TEMPORARY_NETWORK_FAILURE5068
The data received by the AS is notsupported or recognized.
DIAMETER_ERROR_USER_DATA_NOT_RECOGNIZED5100
The requested operation is not allowedfor the user.
DIAMETER_ERROR_OPERATION_NOT_ALLOWED5101
The requested user data is not allowed tobe read.
DIAMETER_ERROR_USER_DATA_CANNOT_BE_READ5102
CPS Troubleshooting Guide, Release 19.4.044
Troubleshooting CPSDiameter Experimental Result Codes

CPS ScenariosNameCode
The requested user data is not allowed tobe modified.
DIAMETER_ERROR_USER_DATA_CANNOT_BE_MODIFIED
5103
The requested user data is not allowed tobe notified on changes
DIAMETER_ERROR_USER_DATA_CANNOT_BE_NOTIFIED
5104
The request to update the repository dataat the HSS could not be completedbecause the requested update is based onan out-of-date version of the repositorydata. That is, the sequence number in theSh-Update Request message, does notmatch with the immediate successor ofthe associated sequence number storedfor that repository data at the HSS. It isalso used where an AS tries to create anew set of repository data when theidentified repository data already existsin the HSS.
DIAMETER_ERROR_TRANSPARENT_DATA_OUT_OF_SYNC
5105
The Application Server requested tosubscribe to changes to Repository Datathat is not present in the HSS.
DIAMETER_ERROR_SUBS_DATA_ABSENT5106
The AS received a notification of changesof some information to which it is notsubscribed
DIAMETER_ERROR_NO_SUBSCRIPTION_TO_DATA5107
TheApplication Server addressed a DSAInot configured in the HSS.
DIAMETER_ERROR_DSAI_NOT_AVAILABLE5108
Used when the set of bearer or session orsubscriber information needed by thePCRF for rule selection is incomplete/erroneous/not available for the decisionto be made.
DIAMETER_ERROR_INITIAL_PARAMETERS5140
The set of bearer/session information sentin a CCR originated due to a trigger eventbeen met is incoherent with the previousset of bearer/session information for thesame bearer/session. (E.g. event triggermet was RAT changed, and the RATnotified is the same as before)
DIAMETER_ERROR_TRIGGER_EVENT5141
CPS Troubleshooting Guide, Release 19.4.045
Troubleshooting CPSDiameter Experimental Result Codes

CPS ScenariosNameCode
The PCC rules cannot beinstalled/activated. Affected PCC-Ruleswill be provided in theCharging-Rule-Report AVP including thereason and status as described in Clause4.5.12. Absence of theCharging-Rule-Report means that allprovided PCC rules for that specificbearer/session are affected.
DIAMETER_PCC_RULE_EVENT5142
The PCRF cannot authorize an IP-CANbearer (e.g. the authorized QoS wouldexceed the subscribed QoS) upon thereception of an IP-CAN bearerauthorization request coming from thePCEF. The affected IP-CAN bearer is theone that triggered the corresponding CCR.The PCEF shall reject the attempt toinitiate or modify the bearer indicated inthe related CCR command.
DIAMETER_ERROR_BEARER_NOT_AUTHORIZED5143
The PCRF does not accept one or moreof the traffic mapping filters (e.g. TFTfilters for GPRS) provided by the PCEFin a CC Request.
DIAMETER_ERROR_TRAFFIC_MAPPING_INFO_REJECTED
5144
The PCRF cannot accept the UE-initiatedresource request as a network-initiatedresource allocation is already in progressthat has packet filters that cover the packetfilters in the received UE-initiatedresource request. The PCEF shall rejectthe attempt for UE-initiated resourcerequest.
DIAMETER_ERROR_CONFLICTING_REQUEST5147
The ADC rules cannot beinstalled/activated. Affected ADC Rulesshall be provided in theADC-Rule-ReportAVP including the reason and status asdescribed in Clause 5b.3.6. Absence ofthe ADC-Rule-Report means that allprovided ADC rules for that IP-CANsession are affected.
DIAMETER_ADC_RULE_EVENT5148
Received in the authentication responsemessage. This result code is introducedto detect stale message requests andsupport session uniqueness.
DIAMETER_NEWER_SESSION_DETECTED5199
CPS Troubleshooting Guide, Release 19.4.046
Troubleshooting CPSDiameter Experimental Result Codes

Frequently Encountered Scenarios
Subscriber not Mapped on SCEThis issue was causing the subscriber to get no mapping on the SCE.
Step 1 Write an awk script to perform the following grep to create a text file of over 1000 instances of this message:
grep "No member in system" policy.log* >
no_member_found.txt
This grep resulted in a file with these lines:policy.log:2009-07-17 11:00:21,201 INFOwikiimport:com.broadhop.sme.business.network.accounting.NetworkAccountingUtil No member in system for d162818policy.log:2009-07-17 11:02:06,108 INFOwikiimport:com.broadhop.sme.business.network.accounting.NetworkAccountingUtil No member in system for D02625policy.log.1:2009-07-17 09:25:29,036 INFOwikiimport:com.broadhop.sme.business.network.accounting.NetworkAccountingUtil No member in system for D162346policy.log.1:2009-07-17 09:27:28,718 INFOwikiimport:com.broadhop.sme.business.network.accounting.NetworkAccountingUtil No member in system for d162365policy.log.1:2009-07-17 09:27:37,193 INFOwikiimport:com.broadhop.sme.business.network.accounting.NetworkAccountingUtil No member in system for d162365policy.log.1:2009-07-17 09:27:42,257 INFOwikiimport:com.broadhop.sme.business.network.accounting.NetworkAccountingUtil No member in system for d162365policy.log.1:2009-07-17 09:38:09,010 INFOwikiimport:com.broadhop.sme.business.network.accounting.NetworkAccountingUtil No member in system for d02116policy.log.1:2009-07-17 09:38:12,618 INFOwikiimport:com.broadhop.sme.business.network.accounting.NetworkAccountingUtil No member in system for D163647policy.log.1:2009-07-17 09:40:42,751 INFOwikiimport:com.broadhop.sme.business.network.accounting.NetworkAccountingUtil No member in system for d102096
Step 2 Then use the following awk script to generate a new file that only has the user name. The script says print the 10th field:
awk '{print $10}' no_member_found.txt >
no_member_found_usernames_with_dupes.txt
Step 3 Run the following command to remove duplicates:
sort no_member_found_usernames_with_dupes.txt | uniq >
uniq_sorted_no_member_found_usernames.txt
This resulted in a file with usernames only:
D00059
D00077
CPS Troubleshooting Guide, Release 19.4.047
Troubleshooting CPSFrequently Encountered Scenarios

D001088
D00112
d001313
D00145
D001452
d00156
D00186
d00198
D00200
d00224
CPS Server Will Not Start and Nothing is in the LogIf the CPS server does not start (or starts and immediately crashes) and no errors appear in/var/log/broadhop/qns.log file to give reasons it did not start check the following list
1. Check /var/log/broadhop/service-qns-1.log file.
2. Check /etc/broadhop/servers.
• There should be an entry in this file for the current host name (Type 'hostname' in the console windowto find the local hostname)
• There must be directory that corresponds to the hostname entry with config files. That is if the serversfile has svn01=controlcenter there must be a /etc/broadhop/controlcenter directory.
3. Attempt to start the server directly from the command line and look for errors.
• Type: /opt/broadhop/qns/bin/qns.sh
• The server should start up successfully and the command line should not return. If the commandprompt returns then the server did not start successfully.
• Look for any errors displayed in the console output.
4. Look for OSGi errors.
• Look in /opt/broadhop/qns/configuration for a log file. If any exist examine the logfile for error messages.
Server returned HTTP Response Code: 401 for URLA 401 type error means you're not logging in to SVN with proper credentials.
The server won't start and the following appears in the log:
CPS Troubleshooting Guide, Release 19.4.048
Troubleshooting CPSCPS Server Will Not Start and Nothing is in the Log

2010-12-10 01:05:26,668 \[SpringOsgiExtenderThread-8\]ERROR c.b.runtime.impl.RuntimeLoader - There was an errorinitializing reference data\!java.io.IOException: Server returned HTTP response code:401 for URL: http://lbvip01/repos/run/config.propertiessun.net.www.protocol.http.HttpURLConnection.getInputStream(HttpURLConnection.java:1313) \~\[na:1.6.0_20\]org.springframework.core.io.UrlResource.getInputStream(UrlResource.java:124) \~\[org.springframework.core_3.0.0.REL
To fix this error:
• Edit /etc/broadhop/qns.conf
• Ensure that the configuration URL and repository credentials hostnames match.
\-Dcom.broadhop.config.url=http://lbvip01/repos/run/
\-Dcom.broadhop.repository.credentials=broadhop/
broadhop@lbvip01
com.broadhop.exception.BroadhopException Unable to Find SystemConfiguration for System
Symptoms server won't stay started and the log displays this:com.broadhop.exception.BroadhopException: Unable to find system configuration for system:The system that is set up in your Quantum Policy Builder (and cluster name) must match theonespecified in /etc/broadhop/qns.conf. Either add or change this via the Quantum Policy Builder
interface, and then publish or update the system/clustername in /etc/broadhop/qns.conf\-Dcom.broadhop.run.systemId=poc-system\-Dcom.broadhop.run.clusterId=cluster-1
Log Files Display the Wrong Time but the Linux Time is CorrectIf log files or other dates are showing in the incorrect time zone despite the Linux time being set to the propertime zone, most likely the time zone that the JVM reads is incorrect.
Step 1 In /etc/sysconfig, run the command cat clock to see this output:
ZONE="America/Denver"
UTC=false
ARC=false
Step 2 Change the ZONE line to the time zone you desire, for instance you could change it to:
ZONE="Asia/Singapore"
UTC=false
ARC=false
to change the JVM time zone to Singapore time.
CPS Troubleshooting Guide, Release 19.4.049
Troubleshooting CPScom.broadhop.exception.BroadhopException Unable to Find System Configuration for System

The value for ZONE is driven by the directories in /usr/share/zoneinfo
REST Web Service Queries Returns an Empty XML Response for an ExistingUser
For example:
<subscriberProfile><content/></subscriberProfile>
Because there are multiple ways needed to return web service data, the BroadHop Web Service Blueprintdoesn't return any XML by default. To fix this issue, configure the 'Default Web Service Query Response'blueprint under the 'BroadHop Web Services' Blueprint.
Error in Datastore: "err" : "E11000 Duplicate Key Error IndexHere mongo database has been used an example. The same steps can be replicated for all the databases.
This removes all the sessions.Note
Typically, duplicate keys like this happen when initially configuring policies and switching primary keys. Ina production scenario, you may not want to remove all sessions.
Step 1 SSH to sessionmgr01.Step 2 Open sessionmgr CLI usin the following command:
/usr/bin/mongo --port 27717
Using /usr/bin/mong indicates whether the mongo replica set is primary or secondary.
Step 3 Enter following commands on the MongoDB CLI:
use session_cache;
db.session.remove({});
Step 4 If it gives you a 'not master' error, log into sessionmgr02 and perform the same steps.
Error Processing Request: Unknown Actioncom.broadhop.policy.impl.RulesPolicyService - Errorprocessing policy request: Unknown action:com.broadhop.pop3auth.actions.IPOP3AuthRequest and RemoteActions are disabled.
If you see an error of the type above, it means that the implementation class it's looking for is not availableon the server. This can be caused by:
CPS Troubleshooting Guide, Release 19.4.050
Troubleshooting CPSREST Web Service Queries Returns an Empty XML Response for an Existing User

• The component needed is not installed on the server.• Ensure that the pop3auth service is installed in your server.• Look for exceptions in the logs when starting up.• Try restarting the service bundle (pop3auth service in this case) using the OSGi console and looking atthe logs.
Memcached Server is in ErrorERROR c.b.d.impl.DiagnosticController - Diagnostic failed.
A problem exists with the system --> Common Services:
2:Memcached server is in error
Step 1 Log on to the server where policy server (qns) is runningStep 2 Telnet to the memcache server's IP and port 11211 (For example, telnet lbvip01 11211).
You can figure out which memcache server CPS is pointing to in Cisco Policy Builder. Look at:Reference Data >Systems > System Name > Cluster Name.
a) If you cannot telnet to the port, do the following:
Make sure memcache is running:
• Log on to server where memcache is running.
run service memcached status
[root@sessionmgr01 ~]# monit status memcached
memcached is stopped
• If the service is stopped, start it:
[root@sessionmgr01 ~]# monit start memcached
Starting a new distributed memory caching
(memcached) process for 11211:
b) Make sure firewall configuration is OK.
To check if this is the problem, stop the firewall.
/usr/bin/systemctl stop iptables
If it is the problem, add an exception in /etc/sysconfig/iptables. Look at other entries in the file for anexample.
After adding an exception, restart the IP tables: /usr/bin/systemctl start iptables.
Firewall Error: Log shows Host Not Reachable, or Connection RefusedIn HA environment if we see some connection refused errors stop the firewall and execute
CPS Troubleshooting Guide, Release 19.4.051
Troubleshooting CPSMemcached Server is in Error
service iptables stop
to see if the problem is related to the iptables firewall issue.
Unknown Error in Logging: License Manager2010-12-12 18:51:32,258 [pool-4-thread-1] ERRORc.b.licensing.impl.LicenseManager - Unknown error inloggingjava.lang.NullPointerException: nullatcom.broadhop.licensing.impl.LicenseManager.checkFeatures(LicenseManager.java:311) ~[na:na]
This issue may occur if no license has been assigned yet.
Option 1: If this is for development or Proof Of Concept deployments you can turn on developer mode. Thiseffectively gives you 100 users but is not for use in production.
1. Login to CPS.
2. Add the following to the /etc/broadhop/qns.conf file:
-Dcom.broadhop.developer.mode=true
3. Restart CPS
Option 2: Generate a real license. Have your Cisco technical representative send you the Technical ArticleTool com.broadhop.licensing.service - Creating a CPS License.
Option 3: If we have license error in the logs, check the MAC address of the VM and compare that with theMAC address in the license file in /etc/broadhop/license/.
Logging Does Not Appear to be Working
Step 1 Run the JMX Command:
/opt/broadhop/qns/bin/jmxcmd.sh
ch.qos.logback.classic:Name=default,Type=ch.qos.logback
.classic.jmx.JMXConfigurator Statuses
or
Step 2 Access that bean using JMXTerm or JConsole to view the status of the Logback Appenders. To access JMX Term, followthese steps:a) Execute the script: /opt/broadhop/qns-1/bin/jmxterm.shb) If user does not have permission to execute the command then change the permission using below command:
chmod 777 opt/broadhop/qns-1/bin/jmxterm.sh
c) Again execute the script: /opt/broadhop/qns-1/bin/jmxterm.shd) Once command is executed, JMX terminal opens up.e) Execute the following command to open connection:
$>open qns01:9045
CPS Troubleshooting Guide, Release 19.4.052
Troubleshooting CPSUnknown Error in Logging: License Manager

f) All beans can be seen using the following command:$>beans#domain = JMImplementation:JMImplementation:type=MBeanServerDelegate#domain = ch.qos.logback.classic:ch.qos.logback.classic:Name=default,Type=ch.qos.logback.classic.jmx.JMXConfigurator#domain = com.broadhop.action:com.broadhop.action:name=AddSubscriberService,type=histogramcom.broadhop.action:name=AddSubscriberService,type=servicecom.broadhop.action:name=GetSessionAction,type=histogramcom.broadhop.action:name=GetSessionAction,type=servicecom.broadhop.action:name=GetSubscriberActionImpl,type=histogramcom.broadhop.action:name=GetSubscriberActionImpl,type=servicecom.broadhop.action:name=LockSessionAction,type=histogramcom.broadhop.action:name=LockSessionAction,type=servicecom.broadhop.action:name=LogMessage,type=histogramcom.broadhop.action:name=LogMessage,type=servicecom.broadhop.action:name=OCSLoadBalanceState,type=histogramcom.broadhop.action:name=OCSLoadBalanceState,type=servicejava.nio:name=mapped,type=BufferPool#domain = java.util.logging:java.util.logging:type=Logging
Cannot Connect to Server Using JMX: No Such Object in TableThis is likely caused because the server's name is not set up in the hosts file with its proper IP address.
In /etc/hosts the hostname (e.g. qns01) SHOULD NOT be aliased to 127.0.0.1 or localhost.
If improperly aliased JMX tells the server it's connecting to connect back with the IP of it's hostname. If it'saliased to localhost (127.0.0.1) the server attempts to open connections with itself which is unfortunate.
Example Error:
ERROR com.broadhop.management.JmxClient -
Unable to connect to JmxClient iomgr019045. Cause no
such object in table Will attempt to reconnect.
File System Check (FSCK) ErrorsDuring machine boot fsck is run on file systems to check its consistency. This consistency check is donewithout user intervention and automatically fixes errors which it can. But sometimes if there is a hard resetto CPS VM/machine for example because of abrupt power failure then during fsck all the problems are not
CPS Troubleshooting Guide, Release 19.4.053
Troubleshooting CPSCannot Connect to Server Using JMX: No Such Object in Table

automatically fixed and user intervention is must to fix the errors reported by fsck. The table below describesthe common fsck errors along with their description and solution.
Table 5: File System Errors and Solutions
Description/SolutionFSCK ErrorSNo.
This error comes when file system is cleanly unmounted. Somesuperblock corruptions can be automatically repaired. But for somelike BAD MAGIC number fsck aborts and alternate superblockmust be specified to fsck command to continue file system check.
Refer to the link to fix the issue.
BAD SUPER BLOCKMAGICNUMBERWRONGUSE ALTERNATESUPER-BLOCK TOSUPPLY NEEDEDINFORMATION
1
When this error occurs data on the device need to be restored usingdd or any other device specific command.
Refer to the following links to fix the issue:
Link 1, Link 2
Block bitmap not in agroup/inode bitmap not in agroup
2
When this error occurs data on the device need to be restored usingdd or any other device specific command.
Refer to the link to fix the issue
Inode table not in a group3
Please refer to Error 1 apart from bad magic number if fsck detectscorruption in any static parameters of primary superblock (filesystem size inode list size etc) it requests operator to specifylocation of alternate superblock.
Primary superblock is corrupt4
Please refer to Error 1 to 4 to fix this issue.Journal superblock has anunknown read-only featureflag set
5
This error occurs after file system is resized.
Refer to the link to fix this issue.
Resize inode is invalid6
This error occurs after reboot system clock is not synchronizedwith UTC.
Refer to the link to fix the issue.
Last mount time is in thefuture
7
If primary superblock is corrupt this error occurs alternatesuperblock needs to be specified to fsck in this case.
Refer to the following links to fix the issue:
Link 1, Link 2
Root directory is not an inode8
CPS Troubleshooting Guide, Release 19.4.054
Troubleshooting CPSFile System Check (FSCK) Errors

Description/SolutionFSCK ErrorSNo.
An indirect block is a pointer to a list of every block claimed byan inode. fsck checks every block number against a list of allocatedblocks if two inodes claim the same block number that blocknumber is added to a list of duplicate block numbers.
The administrator may be asked to choose which inode is correctand usually time to verify files against backups. fsck additionallychecks the integrity of the actual block numbers which can alsobecome corrupt - it should always lie in the interval between thefirst data block and the last data block. If a bad block number isdetected the inode is cleared.
Similar to above example this issue is with file systemsynchronization with actual disk. If machine is powered OFF beforefs synchronization to hardware disk on next reboot fsck will askcorrective questions to the user to take the action accordingly.
For which manual intervention is needed as corrective actions willdefer case to case. For example if one record is created by databaseoperation and at the same time another record is deleted and sameblock number (of deleted record) is used for the newly createdrecord duplicate block error might come.
Duplicate '..' entry9
This error stops the user from continuing with the fsck scan andcorrecting the problem. Disks that have physical hardware errorsoften report - being unable to read inodes error.
To resolve this issue replace the disk rather than attempting anycorrective action.
Error reading block<block_no> (Attempt to readfrom filesystem resulted inshort read) while doing inodescan.
10
Feature flag specifies what features a file system has. If this flagis corrupted fsck asks whether you want to abort the operation. Youneed to specify "no" and after this fix the superblock corruption.
Refer to the link to fix the issue.
Journal superblock has anunknown incompatiblefeature flag set
11
• The link gives list of all the errors which are automatically fixed by fsck as well as list of errors whereuser intervention is must -
• The link gives general idea about various phases in fsck.• The link describes all the errors in case of UFS file system.
This link can be used as a reference to fix the errors reported by fsck on CPS file system which is ext3.
CPS:SessionCachemongoDBStuckinSTARTUP2aftersessionMgr01/2RebootThere can be a situation where session cache mongoDB process is stuck after sessionMgr01/02 is rebooted.In this situation follow the steps below to bring up session cache database mongo processes from STARTUP2state to PRIMARY/SECONDARY state specific to session database only.
CPS Troubleshooting Guide, Release 19.4.055
Troubleshooting CPSCPS: Session Cache mongoDB Stuck in STARTUP2 after sessionMgr01/2 Reboot

The steps mentioned in this section are applicable to GR deployments. For HA, the mongo processes arerecovered automatically. In case they are not recovered automatically, then only the steps mentioned in thissection should be used.
Note
Step 1 Stop the CPS processes.Step 2 Log onto pcrfclient01.Step 3 Execute the diagnostic.sh script to know which replica set (all members) have failed.
diagnostics.sh --get_replica_status
If a member is shown in an unknown state, it is likely that the member is not accessible from one of othermembers, mostly an arbiter. In that case, you must go to that member and check its connectivity with othermembers.
Also, you can login to mongo on that member and check its actual status.
Note
The figure shows all replica set members of replica set set01 for session data are in STARTUP2 state.Figure 15: Replica Set Members
Step 4 Build the session replica sets. Select 2 for session non-sharded sets.
./build_set.sh --create --setname <setname>
Step 5 Set the priority by executing the following command from Cluster Manager.
In case of GR: set_priority.sh --db session --replSet <setname> --sitename <site1>
In case of HA: set_priority.sh --db session --replSet <setname>
Step 6 Verify if priority is set correctly for newly created replica set.
diagnostics.sh --get_replica_status
If a member is shown in an unknown state, it is likely that the member is not accessible from one of othermembers, mostly an arbiter. In that case, you must go to that member and check its connectivity with othermembers.
Also, you can login to mongo on that member and check its actual status.
Note
Step 7 To recover other failed sets, follow the recovery Step 1, on page 56 to Step 6, on page 56.Step 8 Restart CPS.
CPS Troubleshooting Guide, Release 19.4.056
Troubleshooting CPSCPS: Session Cache mongoDB Stuck in STARTUP2 after sessionMgr01/2 Reboot

/var/qps/bin/control/restartall.sh
Multi-user Policy Builder Errors
Not able to do any edits after login
Verify the newly created SVN user has write permission. User should be specified under admins in/var/www/svn/users-access-file file.
Error in login due to conflict
If error similar to below is seen during login, then revert the configuration and login again.Figure 16: Login Error
No configuration visible in Policy Builder after login
1. Verify the directory /var/broadhop/pb/workspace/<username>/checkout is created on pcrfclient01and it contains .xmi files.
2. If directory does not exist or does not have .xmi files then delete existing repository using Remove onlogin page and then add new repository using Add on login page.Figure 17: Delete Existing Repository
CPS Troubleshooting Guide, Release 19.4.057
Troubleshooting CPSMulti-user Policy Builder Errors
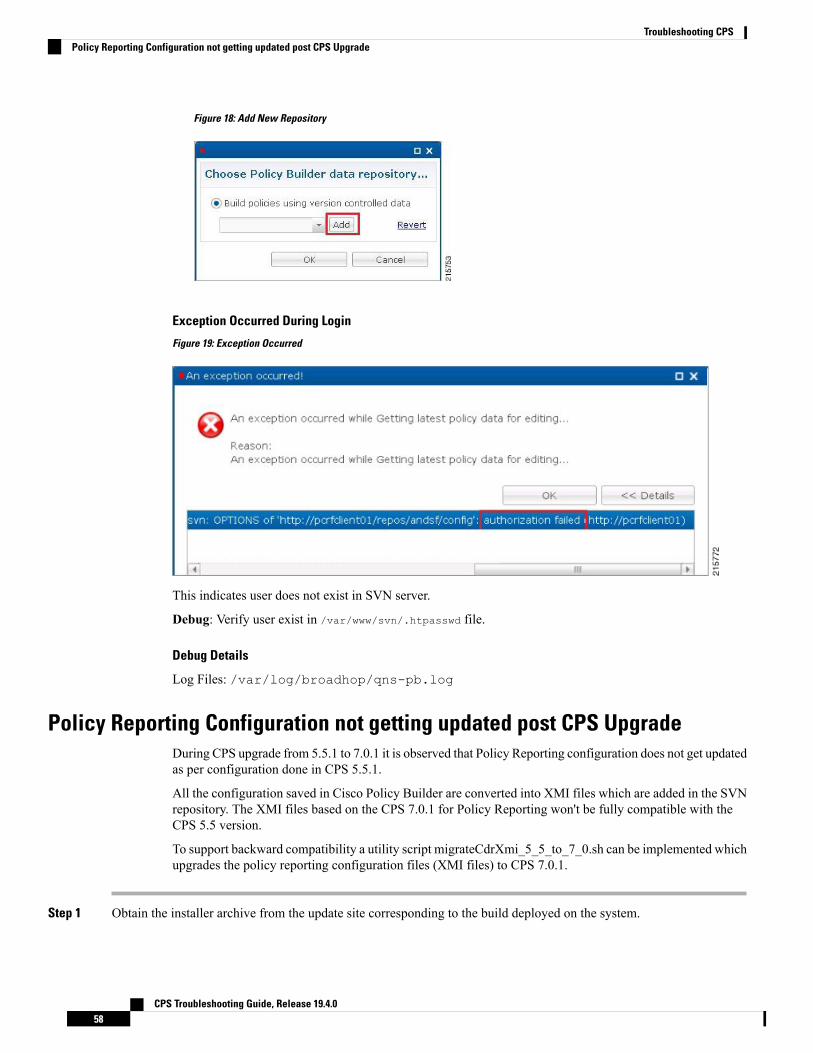
Figure 18: Add New Repository
Exception Occurred During Login
Figure 19: Exception Occurred
This indicates user does not exist in SVN server.
Debug: Verify user exist in /var/www/svn/.htpasswd file.
Debug Details
Log Files: /var/log/broadhop/qns-pb.log
Policy Reporting Configuration not getting updated post CPS UpgradeDuring CPS upgrade from 5.5.1 to 7.0.1 it is observed that Policy Reporting configuration does not get updatedas per configuration done in CPS 5.5.1.
All the configuration saved in Cisco Policy Builder are converted into XMI files which are added in the SVNrepository. The XMI files based on the CPS 7.0.1 for Policy Reporting won't be fully compatible with theCPS 5.5 version.
To support backward compatibility a utility script migrateCdrXmi_5_5_to_7_0.sh can be implemented whichupgrades the policy reporting configuration files (XMI files) to CPS 7.0.1.
Step 1 Obtain the installer archive from the update site corresponding to the build deployed on the system.
CPS Troubleshooting Guide, Release 19.4.058
Troubleshooting CPSPolicy Reporting Configuration not getting updated post CPS Upgrade
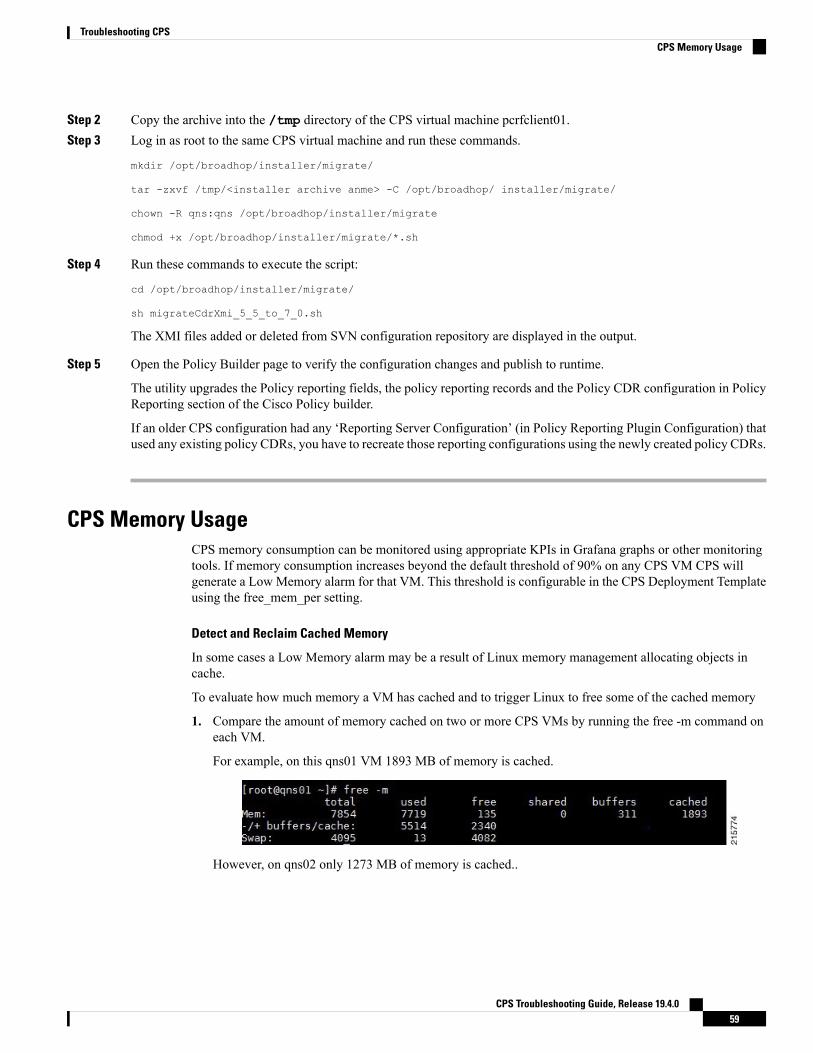
Step 2 Copy the archive into the /tmp directory of the CPS virtual machine pcrfclient01.Step 3 Log in as root to the same CPS virtual machine and run these commands.
mkdir /opt/broadhop/installer/migrate/
tar -zxvf /tmp/<installer archive anme> -C /opt/broadhop/ installer/migrate/
chown -R qns:qns /opt/broadhop/installer/migrate
chmod +x /opt/broadhop/installer/migrate/*.sh
Step 4 Run these commands to execute the script:
cd /opt/broadhop/installer/migrate/
sh migrateCdrXmi_5_5_to_7_0.sh
The XMI files added or deleted from SVN configuration repository are displayed in the output.
Step 5 Open the Policy Builder page to verify the configuration changes and publish to runtime.
The utility upgrades the Policy reporting fields, the policy reporting records and the Policy CDR configuration in PolicyReporting section of the Cisco Policy builder.
If an older CPS configuration had any ‘Reporting Server Configuration’ (in Policy Reporting Plugin Configuration) thatused any existing policy CDRs, you have to recreate those reporting configurations using the newly created policy CDRs.
CPS Memory UsageCPS memory consumption can be monitored using appropriate KPIs in Grafana graphs or other monitoringtools. If memory consumption increases beyond the default threshold of 90% on any CPS VM CPS willgenerate a Low Memory alarm for that VM. This threshold is configurable in the CPS Deployment Templateusing the free_mem_per setting.
Detect and Reclaim Cached Memory
In some cases a Low Memory alarm may be a result of Linux memory management allocating objects incache.
To evaluate how much memory a VM has cached and to trigger Linux to free some of the cached memory
1. Compare the amount of memory cached on two or more CPS VMs by running the free -m command oneach VM.
For example, on this qns01 VM 1893 MB of memory is cached.
However, on qns02 only 1273 MB of memory is cached..
CPS Troubleshooting Guide, Release 19.4.059
Troubleshooting CPSCPS Memory Usage

From this example qns01 is storing 620 MB more memory in cache than qns02.
2. To reclaim some of the inactive cached memory execute the following command:
free && sync && echo 3 > /proc/sys/vm/drop_caches && echo "" && free
Running this command will discard cache objects which can cause a temporary increase in IO and CPU usage,so it is recommend to run this command during off-peak hours/maintenance window.
Caution
This is a non-destructive command and will only free memory that is not in use.Note
Errors while Installing HA Setup
Step 1 Modify file /var/qps/config/deploy/csv/AdditionalHosts.csv to correct lbvip02 IP address and support sslvip01.a) Correct lbvip02 IP address.b) Add sslvip01 IP address.c) Convert to json /var/qps/install/current/scripts/import/import_deploy.sh.d) Synchronize host /var/qps/bin/update/synchosts.sh.e) Restart all CPS process using the following commands:
/var/qps/bin/control/stopall.sh
/var/qps/bin/control/startall.sh
f) SSH to lbvip01 and update pcs resources.g) Delete lbvip02 resource.
/usr/sbin/pcs resource delete lbvip02
h) Create lbvip02 and sslvip01 resources.
/var/broadhop/init_pacemaker_res.sh
i) Restart httpd to use correct lbvip02 IP.
Step 2 27717 replica set members are in startup state, recreate replica set.a) Go to pcrfclient01, sessionmgr01 and sessionmgr02, and execute the following command:
/usr/bin/systemctl stop sessionmgr-27717
b) Delete current data directory.
\rm -fr /var/data/sessions.1/*
CPS Troubleshooting Guide, Release 19.4.060
Troubleshooting CPSErrors while Installing HA Setup

c) Go to pcrfclient01, sessionmgr01 and sessionmgr02, and execute the following command:
/usr/bin/systemctl start sessionmgr-27717
/var/broadhop/initialize_replicaset.sh --port 27717 --hosts sessionmgr01,sessionmgr02 --arbiter
pcrfclient01 --set set01
Step 3 Execute the following command to check errors:
/var/qps/install/current/scripts/bin/diag/diagnostics.sh (shows some memory and basic port unreachable
errors)
For more information on diagnostics.sh, refer to diagnostics.sh section in CPS Operations Guide.
Step 4 Install bc and nc, using the following commands:yum install bcyum install nc
Open port 6514 on pcrfclient01 and pcrfclient02, add highlighted bold mark line in/etc/sysconfig/iptables and restart iptables.-A INPUT -i eth0 -p udp -m multiport --ports 6514 -m comment --comment "100 allow logstash syslogaccess" -j ACCEPT-A INPUT -i eth0 -p tcp -m multiport --ports 6514 -m comment --comment "100 allow logstash syslogaccess tcp" -j ACCEPT/usr/bin/systemctl start iptables
Enable/disable Debit CompressionDebit compression can be used to identify what all the debits have happened for the subscriber. This data canalso be used to cross check the debits with external entities.
• To disable compression add/edit the following flag in /etc/broadhop/qns.conf file.
-DcompressDebits=false
• To enable compression add/edit the following flag in /etc/broadhop/qns.conf file.
-DcompressDebits=true
We can also check directly in mongo how balance has been debited /credited for subscriber using the followingqueries
Command to find subscriber:
• SPR database:$use spr$db.subscriber.find({
“credentials_key” : [{
“network_id_key” : "111111201"}]});
Or
• db.subscriber.find({“network_id_key” : “886906007135”})db.subscriber.find({“network_id_key” :“111111201”})
CPS Troubleshooting Guide, Release 19.4.061
Troubleshooting CPSEnable/disable Debit Compression

Output:
{“_id” : ObjectId(“001000009576290454afdc77”),“_id_key” : “001000009576290454afdc77”,“name_key” : {
},“end_date_key” : null,“realm_key” : null,“parent_id_key” : null,“billing_info_key” : {
“rate_plan_code_key” : null,“charging_id_key” : null
},“status_key” : "ACTIVE",“version_key” : 0,“start_date_key” : null,“credentials_key” : [
{“network_id_key” : "111",“description_key” : null,“password_key” : null,“type_key” : null,“expiration_date_key” : null
}],“role_key” : “READ_ALL”,“external_id_key” : null,“_transId” : “d2a3f602-69bb-4047-af6f-c979ec36732f-1”
}
Use “_id_key” output from the above command as subscriber id:
Balance_mgmt
$use balance_mgmt
$db.account.find({“subscriberId” : “001000009576290454afdc77”}).pretty();
Not able to Publish the Policy in Policy Builder• Check whether you are getting any errors in diagnostics.sh and try to fix the error.• Make sure that you have the correct URL for the run time environment. For examplehttp//pcrfclient01/repos/run
• Make sure that you have following configuration on /etc/broadhop/pb/pb.conf configuration file. If notthen do the changes as shown below and run the synconfig.sh and restartall.sh for the changes to comeinto effect:
AIO Sample Configuration:SESSION_TIMEOUT="-Dsession.timeout=9000"QNS_SESSION_DATABASE="-Dsession.db.primary=sessionmgr01-Dsession.db.secondary=sessionmgr02 -Dsession.db.port=27717-Dua.client.submit.audit=false"HA System Sample Configuration:SESSION_TIMEOUT="-Dsession.timeout=9000"QNS_SESSION_DATABASE="-Dsession.db.primary=sessionmgr01-Dsession.db.secondary=sessionmgr02 -Dsession.db.port=27717-Dua.client.submit.audit=true-Dua.client.server.url=http://:8080
CPS Troubleshooting Guide, Release 19.4.062
Troubleshooting CPSNot able to Publish the Policy in Policy Builder

The IP-address is usually LBVIP01 where the SOAP requests are sent to UnifiedAPI for our configuration.
Note
• If you still face issue collect and analyze the following logs:
• /var/log/broadhop/qns-engine-pb.log• /var/log/broadhop/service-qns-pb.log.
CPS not sending SNMP traps to External NMS server• Check whether the “snmpd” process is running in respective VM with the command monit status
snmpd. If it is stopped start the snmpd process with the command monit start snmpd.
• Check whether all the IP tables have been turned off and check the status of UDP port 162 provided youare using the same UDP port 162 at the NMS as well.
• Check the external NMS IP is defined in policy director (lb) VM under /etc/hosts and also in the/etc/snmp/scripts/component_trap_convert in place of corporate_nms_ip.
• Check the file cat /etc/snmp/snmpd.conf has the line “rocommunity Broadhop” because all theinternal traps from various policy server (QNS) VM to active policy director (lb) VM is been sent overthis default community name “Broadhop” as mentioned above.
• Check the trap community name is same both in policy director and as well as in external NMS system.For example, cat /etc/snmp/scripts/snmp_communities trap_community=k0ptr0 (customer externalNMS system should also have this same “k0ptr0” community name.
• Check whether the traps from respective policy server (QNS) VM is properly reaching active policydirector (lb) VM this can be checked under /var/log/snmp/trap.
• Check for /var/log/messages on active policy director (lb) for further analysis.
Policy Builder Loses RepositoriesWhen an hapoxy load balancer which forwards request to Policy Builder server on pcrfclient01 is not availablethen it forwards the request to backup server on pcrfclient02.
Consider pcrfclient01 is up and a new repository is added using Policy Builder. This repository is saved onpcrfclient01 (on file at /etc/broadhop/pb/policyRepositories.xml/etc/broadhop/pb/publishRepositories.xml).
If pcrfclient01 becomes inaccessible haproxy sends request to pcrfclient02 where it does not find the abovementioned two files (publishRepositories.xml policyRepositories.xml) and does notdisplay any repository on PB GUI.
Fix
CPS does not currently support automatic synchronization of the two repository files/etc/broadhop/pb/policyRepositories.xml/etc/broadhop/pb/publishRepositories.xml
CPS Troubleshooting Guide, Release 19.4.063
Troubleshooting CPSCPS not sending SNMP traps to External NMS server

You must manually copy the two files from pcrfclient01 to pcrfclient02 or vice versa.
Not able to access IPv6 Gx port from PCEF/GGSNMake sure the IPv6 firewall is disabled on lb01and lb02. If the firewall is not disabled then you can disableit by executing the command
service ip6tables stop
Bring up sessionmgr VM from RECOVERY state to PRIMARY or SECONDARYState
When any sessionmgr VMmongo instance is stuck at RECOVERY state for a long time, perform the followingsteps to bring up sessionmgr VM mongo instance to PRIMARY or SECONDARY state.
The recovery steps must be performed during maintenance window only.Note
Step 1 Execute the following command script to recover the member:
high_tps_db_recovery.sh <replica_setname>
For Example:
high_tps_db_recovery.sh SPR-SET1
Step 2 Execute diagnostics.sh command to check whether the RECOVERING member has recovered.
diagnostics.sh --get_replica_status
If a member is shown in an unknown state, it is likely that the member is not accessible from one of othermembers, mostly an arbiter. In that case, you must go to that member and check its connectivity with othermembers.
Also, you can login to mongo on that member and check its actual status.
Note
After the replica set member is recovered, the state will change to SECONDARY and all the process logs arestored in a log file at the location:/var/log/broadhop/scripts//high_tps_db_recovery_xxxxxxxxxx.log.
ZeroMQ Connection Established between Policy Director and other site PolicyServer
ZeroMQ connection established between Policy Director (lb) and other site Policy Server (qns).
CPS Troubleshooting Guide, Release 19.4.064
Troubleshooting CPSNot able to access IPv6 Gx port from PCEF/GGSN

How to check
Execute netstat -apn | grep 2800” on policy director (lb) and check if other site policy server (qns) areconnected to this policy director (lb).
You may also see the following logs:
L2-CA-SEC-lb01 2015-05-10 18:58:04,943 [pool-2-thread-1] ERROR c.b.d.impl.server.StackManager- Stackis Null and Realm is not found null:16777238 - realmToStacks [ocs1.sy.server.cisco.com:7,
ocs3.sy.server.cisco.com:7, ocs4.sy.server.cisco.com:7, cscf3.cisco.com:16777236,ocs2.sy.server.cisco.com:7, cscf6.cisco.com:16777236, ocs6.sy.server.cisco.com:7,ocs5.sy.server.cisco.com:7]L2-CA-SEC-lb01 2015-05-10 18:58:04,944 [pool-3-thread-1] WARN c.b.d.impl.server.StackManager-Dropping message Outbound: Cmd: 272/1/0 E2E: 1431976189, HBH: 2798797074, Session-ID:ds4;333241;2883160674, Result-Code: 2001L2-CA-SEC-lb01 2015-05-10 18:58:04,944 [pool-2-thread-1] ERROR c.b.d.impl.server.StackManager- Stackis Null and Realm is not found null:16777238 - realmToStacks [ocs1.sy.server.cisco.com:7,
ocs3.sy.server.cisco.com:7, ocs4.sy.server.cisco.com:7, cscf3.cisco.com:16777236,ocs2.sy.server.cisco.com:7, cscf6.cisco.com:16777236, ocs6.sy.server.cisco.com:7,ocs5.sy.server.cisco.com:7]L2-CA-SEC-lb01 2015-05-10 18:58:04,944 [pool-3-thread-1] WARN c.b.d.impl.server.StackManager-Dropping message Outbound: Cmd: 272/2/1 E2E: 1431980725, HBH: 2798442695, Session-ID:ds1;333241;2799910481, Result-Code: 2001
Fix
To fix the above mentioned problem, perform the following steps to clean the zmq endpoint registry.
1. Connect to admin database.
mongo adminDbIpAddress:adminDbPort
2. Delete endpoint registry
use queueing
db.endpoints.remove({});
3. Restart the application by executing the command:
/var/qps/bin/control/restartall.sh
4. Verify by executing netstat command:netstat -plan | grep 2800tcp 0 0 ::ffff:172.20.7.18:28001 :::* LISTEN32352/javatcp 0 0 ::ffff:172.20.7.18:28002 :::* LISTEN32294/javatcp 0 0 ::ffff:172.20.7.18:28003 :::* LISTEN32235/javatcp 0 0 ::ffff:172.20.7.18:28003 ::ffff:172.20.7.26:35308 ESTABLISHED32235/javatcp 0 0 ::ffff:172.20.7.18:28001 ::ffff:172.20.7.30:60045 ESTABLISHED32352/javatcp 0 0 ::ffff:172.20.7.18:28003 ::ffff:172.20.7.34:46369 ESTABLISHED32235/javatcp 0 0 ::ffff:172.20.7.18:28003 ::ffff:172.20.7.24:38216 ESTABLISHED
CPS Troubleshooting Guide, Release 19.4.065
Troubleshooting CPSZeroMQ Connection Established between Policy Director and other site Policy Server

32235/javatcp 0 0 ::ffff:172.20.7.18:28002 ::ffff:172.20.7.32:55328 ESTABLISHED32294/javatcp 0 1130 ::ffff:172.20.7.18:28001 ::ffff:172.20.7.28:58586 ESTABLISHED32352/javatcp 0 1123 ::ffff:172.20.7.18:28002 ::ffff:172.20.7.30:49349 ESTABLISHED32294/javatcp 0 0 ::ffff:172.20.7.18:28001 ::ffff:172.20.7.34:40201 ESTABLISHED32352/javatcp 0 0 ::ffff:172.20.7.18:28002 ::ffff:172.20.7.34:40447 ESTABLISHED32294/javatcp 0 0 ::ffff:172.20.7.18:28003 ::ffff:172.20.7.30:52127 ESTABLISHED32235/javatcp 0 0 ::ffff:172.20.7.18:28001 ::ffff:172.20.7.24:34238 ESTABLISHED32352/javatcp 0 0 ::ffff:172.20.7.18:28002 ::ffff:172.20.7.36:52364 ESTABLISHED32294/javatcp 0 0 ::ffff:172.20.7.18:28003 ::ffff:172.20.7.28:38456 ESTABLISHED32235/javatcp 0 0 ::ffff:172.20.7.18:28001 ::ffff:172.20.7.36:50427 ESTABLISHED32352/javatcp 0 0 ::ffff:172.20.7.18:28003 ::ffff:172.20.7.22:44375 ESTABLISHED32235/javatcp 0 0 ::ffff:172.20.7.18:28003 ::ffff:172.20.7.32:60651 ESTABLISHED32235/javatcp 0 0 ::ffff:172.20.7.18:28002 ::ffff:172.20.7.22:45991 ESTABLISHED32294/javatcp 0 0 ::ffff:172.20.7.18:28003 ::ffff:172.20.7.36:38120 ESTABLISHED32235/javatcp 0 0 ::ffff:172.20.7.18:28001 ::ffff:172.20.7.26:46593 ESTABLISHED32352/javatcp 0 1130 ::ffff:172.20.7.18:28002 ::ffff:172.20.7.28:56499 ESTABLISHED32294/javatcp 0 1130 ::ffff:172.20.7.18:28002 ::ffff:172.20.7.24:57277 ESTABLISHED32294/javatcp 0 0 ::ffff:172.20.7.18:28001 ::ffff:172.20.7.32:48030 ESTABLISHED32352/javatcp 0 0 ::ffff:172.20.7.18:28001 ::ffff:172.20.7.22:36000 ESTABLISHED32352/javatcp 0 1130 ::ffff:172.20.7.18:28002 ::ffff:172.20.7.26:53322 ESTABLISHED32294/java
Incorrect Version after Upgrade from 7.0.0 SystemIf Upgrade from Existing 7.0 System does not show latest version then perform the following steps to showthe latest version:
1. Reinitialize your environment by executing the following command from Cluster Manager:
/var/qps/install/current/scripts/upgrade/reinit.sh
2. To restart all the policy server (qns) services execute the following command from Cluster Manager:
/var/qps/install/current/scripts/bin/control/restartall.sh
3. Verify CPS Status by running diagnostics.sh and about.sh scripts from Cluster Manager.
For more information on diagnostics.sh, refer to diagnostics.sh section in CPS Operations Guide.
CPS Troubleshooting Guide, Release 19.4.066
Troubleshooting CPSIncorrect Version after Upgrade from 7.0.0 System

Not able to access Policy BuilderScenario 1: When the svn-repos password expires the Policy Builder opens only in Read-only mode.
Scenario 2: Invalid username or password.
To resolve the errors described in Scenarios 1 and 2 above perform the following steps:
1. Login to Cluster Manager VM as the root user. The default credentials are root/cisco123.
2. Execute change -l <username> to check the status of repository password.
For example,[root@lab ~]# chage -l qnsLast password change : Jun 17, 2015Password expires : Aug 16, 2015Password inactive : neverAccount expires : neverMinimum number of days between password change : 7Maximum number of days between password change : 60Number of days of warning before password expires : 7
3. If the password has expired, execute change_passwd.sh to change the password.
/var/qps/bin/support/change_passwd.sh
4. When prompted, enter qns.
Enter username whose password needs to be changed: qns
5. When prompted, enter and reconfirm the desired password for the policy server (qns) user.
Enter new password:
CPS Troubleshooting Guide, Release 19.4.067
Troubleshooting CPSNot able to access Policy Builder

Re-enter new password:
The script changes the policy server (qns) user password on all the CPS VMs in the cluster.
Changing password on $host...
Connection to $host closed.
Password for qns changed successfully on $host
6. You can use the above steps to set or change the passwords for root and qns-svn users.
For more information about this and other CPS administrative commands, refer to theCPS Operations Guide.Note
Graphs in Grafana are lost when time on VMs are changedCase: Graphs in Grafana are lost when system time on VMs are changed.
Solution: Change the system timing on all VMs. Also change the browser time according to graphite servertime and restart the collectd service on each VM.
The graphite server time and browser time should match then only we will be able to see graphs.
Systems is not enabled for Plugin ConfigurationCase: Systems configuration is not displayed for Plugin Configuration in Reference Data tab.
Possible Cause: This issue could occur if Systems plugin configuration is configured using system.json file.
Solution: Check whether your system.json file is valid or not using any json validator.
Publishing is not EnabledCase: Publishing is not available
Possible Cause: SVN configuration is manually exported and imported from one setup to another. Whileperforming import user missed to import .broadhopFileRepository or deleted it unknowingly.
Solution: Check whether .broadhopFileRepository is present in pcrfclient01. If it not present import thefile.
Added Check to Switch to Unknown Service if Subscriber is deleted MidSession
Problem: There is an impact on 7.5.0 and higher releases with a new feature “check to switch to unknownservice if subscriber is deleted mid session” due to the custom policies defined in some customer locations.
Solution: For the customers who are on pre-7.5.0 release and don't want the new feature a work around hasbeen suggested with an addition of custom policy that will bypass this feature.
The custom policy has to be added in the call flow based on the conditions. This custom policy will add a“IgnoreSPR” AVP to policy state. If this AVP is present internally the code will skip the feature.
CPS Troubleshooting Guide, Release 19.4.068
Troubleshooting CPSGraphs in Grafana are lost when time on VMs are changed

Below are screenshots of the policy where the customer wants to skip the feature in some specific conditionsof flow like when “Authenticating a subscriber onAAA server” since we don't store subscriber informationin SPR.
Without this custom polices we will see session switching from known to unknown service during SPRupdate/Accounting. This will be visible in information logs in engine and policy server (qns) with “Sessionhas switched from known to unknown as subscriber could not be found”.
Conditions
Figure 20: Conditions - 1
CPS Troubleshooting Guide, Release 19.4.069
Troubleshooting CPSAdded Check to Switch to Unknown Service if Subscriber is deleted Mid Session

Figure 21: Conditions - 2
Figure 22: Conditions - 3
CPS Troubleshooting Guide, Release 19.4.070
Troubleshooting CPSAdded Check to Switch to Unknown Service if Subscriber is deleted Mid Session

Actions
Figure 23: Actions - 1
Figure 24: Actions - 2
CPS Troubleshooting Guide, Release 19.4.071
Troubleshooting CPSAdded Check to Switch to Unknown Service if Subscriber is deleted Mid Session
Could not Build Indexes for TableIssue: Policy Builder is not able to build indexes for table (Custom Reference Table).
Case: While publishing Policy Builder CPS logs below exception in policy server (qns) log.
For example,
ERROR c.b.custrefdata.impl.dao.GenericDao - Could not build indexes for table
QoS-Reference-Mapping
com.mongodb.CommandFailureException
Possible Cause: This could happen when CRD table key columns are changed from back-end (xmi) in Policy.Due to this underlying composite index on CRD table does not reflect new/changed key columns.
Solution: Drop the index on CRD table in mongo and publish the policy.
Error Submitting Message to Policy Director (lb) during LongevityCase: Messages timed out intermittently. CPS logs reports following exceptions
2015-10-11 145054918 [pool-2-thread-1] ERROR c.b.d.p.event.DiameterMessageDealer.? - Error
submitting message to lb
2015-10-11 145054918 [pool-2-thread-1] ERROR c.b.d.p.event.DiameterMessageDealer.? - Error
submitting message to lb
Possible Cause: Message timed out intermittently problem happens when a GC pause greater than 10 secondsis occurring on policy server (qns) and policy director (lb). Due to this pause queue gets overloaded and thereare message drops and timeouts. This pause happens when the service-qns logs are getting rotated with size100 M.
Solution: The following changes need to be done on cluster manager
• Change Daily > hourly, size 100M > 25M and rotate 5 > 20cat /etc/logrotate.d/qps/var/log/broadhop/determine_cluster_state.log/var/log/broadhop/service-qns-*.log/var/log/elasticsearch/*.log{
dailynodateextcopytruncatesize 25Mrotate 20missingokcompress
}
• Copy the changes to all the VMs using copytoall command.
Mismatch between Statistics Count and Session CountCase: There are no sessions on CPS but the statistics count still showing statistics.
CPS Troubleshooting Guide, Release 19.4.072
Troubleshooting CPSCould not Build Indexes for Table

#session_cache_ops.sh --countSession cache operation scriptFri Nov 13 01:26:08 EST 2015------------------------------------------------------Session Replica-set SESSION-SET1------------------------------------------------------Session Database : Session Count------------------------------------------------------session_cache : 0session_cache_2 : 0session_cache_3 : 0session_cache_4 : 0------------------------------------------------------No of Sessions in SET1 : 0------------------------------------------------------
Total Number of Sessions : 0
#session_cache_ops.sh --statistics-countSession cache operation scriptFri Nov 13 01:26:31 EST 2015------------------------------------------------------Sessions statistic counter on Genaral------------------------------------------------------Session Type : Session Count
------------------------------------------------------ADMIN-SET1RX_TGPP : 364GX_TGPP : 983269SY_PRIME : 974457
------------------------------------------------------#
Possible Cause: CPS monitors the session count and updates the aggregation of message type into counterscollection in the admin database. This query is performed on secondary databases. If due to some reason allsecondary members are not in healthy state or are in recovering state, then we can incur that the discrepancyis in session count.mongo rtpclabqps5g-sm01a:47721MongoDB shell version: 2.6.3set05:PRIMARY> use shardingset05:PRIMARY> db.counters.find(){ "_id" : 8, "db" : "session_cache_3", "session_type" : [ ] }{ "_id" : 9, "db" : "session_cache_4", "session_type" : [ ] }{ "_id" : 10, "db" : "session_cache", "session_type" : [ { "type" : "SY_PRIME", "count" :246563 },{ "type" : "GX_TGPP", "count" : 248921 }, { "type" : "RX_TGPP", "count" : 93 } ] }{ "_id" : 11, "db" : "session_cache_2", "session_type" : [ { "type" : "SY_PRIME", "count": 247330 },{ "type" : "GX_TGPP", "count" : 249614 }, { "type" : "RX_TGPP", "count" : 94 } ] }{ "_id" : 12, "db" : "session_cache_3", "session_type" : [ { "type" : "SY_PRIME", "count": 227624 },{ "type" : "GX_TGPP", "count" : 229542 }, { "type" : "RX_TGPP", "count" : 90 } ] }{ "_id" : 13, "db" : "session_cache_4", "session_type" : [ { "type" : "SY_PRIME", "count": 252940 },{ "type" : "GX_TGPP", "count" : 255192 }, { "type" : "RX_TGPP", "count" : 87 } ] }{ "_id" : 18, "db" : "session_cache_2", "session_type" : [ ] }
CPS Troubleshooting Guide, Release 19.4.073
Troubleshooting CPSMismatch between Statistics Count and Session Count

Diagnostic showing all secondary members are in bad shape:
Figure 25: Secondary Members
Consolidated CPS log throws below exception
rtpclabqps5g-qns09b rtpclabqps5g-qns09b 2015-11-13 03:06:45,603 [pool-2-thread-1] WARNc.b.c.m.dao.impl.ShardInterface - Unable to get direct connection for DB shard { "_id" :10 ,"seed_1" : "sessionmgr21" , "seed_2" : "sessionmgr22" , "port" : 27737 , "db" :"session_cache" ,"online" : true , "count" : 0 , "backup_db" : false , "lockTime" : { "$date" :"2015-11-13T08:06:25.997Z"} , "isLocked" : false , "lockedBy" : null } - bypassing typecountsrtpclabqps5g-qns09b rtpclabqps5g-qns09b 2015-11-13 03:06:45,605 [pool-2-thread-1] WARNc.b.c.m.dao.impl.ShardInterface - Unable to get direct connection for DB shard { "_id" :11 ,"seed_1" : "sessionmgr21" , "seed_2" : "sessionmgr22" , "port" : 27737 , "db" :"session_cache_2" ,"online" : true , "count" : 0 , "backup_db" : false
Solution: Recovers all the secondary database members.
Disk Statistics not Populated in Grafana after CPS UpgradeCase: After CPS upgrade disk statistics are not populated in Grafana.
Possible Cause: Configurations are not refreshed after collectd package is upgraded.
Solution: Restart collectd service on respective VM/VMs.
Re-create Session ShardsAll sessions require to be cleared/removed from CPS.
Steps are NOT recommended to be performed in Production environment.Note
To delete all shards and then re-create shards, perform the following steps:
Step 1 Take the backup of admin database.a) Run diagnostics command on pcrfclient01 and find admin database primary member and port
diagnostics.sh --get_replica_status
If a member is shown in an unknown state, it is likely that the member is not accessible from one of othermembers, mostly an arbiter. In that case, you must go to that member and check its connectivity with othermembers.
Also, you can login to mongo on that member and check its actual status.
Note
CPS Troubleshooting Guide, Release 19.4.074
Troubleshooting CPSDisk Statistics not Populated in Grafana after CPS Upgrade

Table 6: Admin Database and Port Information
PRIORITYLAST SYNCHEALTHHOST NAMEREPLICASTATE
IP ADDRESSPORTSET NAME
ADMIN:set06
0-------ON-LINEpcrfclient01ARBITER192.167.82.3527721Member-1
1-------ON-LINEsessionmgr01PRIMARY192.167.82.2927721Member-2
10ON-LINEsessionmgr02SECONDARY192.167.82.3027721Member-3
b) Execute mongo dump command with primary member, and port to backup admin database:
mongodump --host sessionmgr01 --port 27721
This command creates the mongo dump files in the file system.
Step 2 Clear all sessions from all the shards (execute command from pcrfclient01)
session_cache_ops.sh --remove
When prompted for input, input yes
Step 3 To recreate the shards you have two options:a) Option-1: Delete or drop the “sharding” database and recreate the shards.
1. Stop all QNS process using stopall.sh script.PRIMARY> use shardingPRIMARY> Db.dropDatabase()
2. Start all QNS process using startall.sh script.
3. Once diagnostics shows green, you can start OSGi command to create the shards.
b) Option-2: Delete the collection entries in the “sharding” database.
1. Login to the ADMIN replica-set primary member by executing mongo --sessionmgr01 --port 27721 and dropthe “sharding” database.PRIMARY> use shardingPRIMARY> db.shards.remove({});PRIMARY> db.buckets.remove({});PRIMARY> db.config.remove({});PRIMARY> db.instances.remove({});
2. Start and execute OSGi command to create the shards.
Step 4 (Optional) Change default shards (skip this step if default shard does not need to be changed).
By default, one shard gets created. Default shard is sessionmgr01/sessionmgr02 27717.
In case user wants to change default shards, add/modify following parameter in /etc/broadhop/qns.conf file oncluster manager.
-Dsession.db.init.1=sessionmgr01
-Dsession.db.init.2=sessionmgr02
CPS Troubleshooting Guide, Release 19.4.075
Troubleshooting CPSRe-create Session Shards
-Dsession.db.init.port=27717
Copy this file to all nodes (run script from Cluster Manager)
copytoall.sh /etc/broadhop/qns.conf /etc/broadhop/qns.conf
Step 5 Restart policy server (QNS) services (execute script from cluster manager).
restartall.sh
Step 6 Once policy servers (QNS) are UP, verify default shard is created in shard collection.
1. Login to admin database.
mongo - sessionmgr01 -port 27721
Check for default shard.
set01:PRIMARY> use sharding
set01:PRIMARY> db.shards.count();
{
"_id" : 1,
"seed_1" : "sessionmgr01",
"seed_2" : "sessionmgr02",
"port" : 27717,
"db" : "session_cache",
"online" : true,
"count" : NumberLong(0),
"lockTime" : ISODate("2016-02-04T11:41:47.259Z"),
"isLocked" : false,
"lockedBy" : null
}
Step 7 To add shard, refer to section Create Session Shards in CPS Installation Guide for VMware.
Re-create SK Shards
Steps are NOT recommended to be performed in Production environment.Note
To delete all SK shards and then re-create SK shards, perform the following steps:
Step 1 Take the backup of admin database.a) Run diagnostics command on pcrfclient01 and find admin database primary member and port number.
CPS Troubleshooting Guide, Release 19.4.076
Troubleshooting CPSRe-create SK Shards

diagnostics.sh --get_replica_status
If a member is shown in an unknown state, it is likely that the member is not accessible from one of othermembers, mostly an arbiter. In that case, you must go to that member and check its connectivity with othermembers.
Also, you can login to mongo on that member and check its actual status.
Note
Table 7: Admin Database and Port Information
PRIORITYLAST SYNCHEALTHHOST NAMEREPLICASTATE
IP ADDRESSPORTSET NAME
ADMIN:set06
0-------ON-LINEpcrfclient01ARBITER192.167.82.3527721Member-1
1-------ON-LINEsessionmgr01PRIMARY192.167.82.2927721Member-2
10ON-LINEsessionmgr02SECONDARY192.167.82.3027721Member-3
b) Execute mongo dump command with primary member, and port to backup admin database:
mongodump --host sessionmgr01 --port 27721
This command creates the mongo dump files in the file system.
Step 2 Clear all the secondary keys from the SK shards.a) Login to admin database.
mongo --host sessionmgr01 --port 27721
b) Delete all SK entries from all SK shards (this might take some time depending upon number of records).set01:PRIMARY> use shardingset01:PRIMARY> db.sk_shards.find({},{_id:0,seed_1:1,seed_2:1,port:1,db:1}).forEach(function(rec){var mongo = new Mongo(rec.seed_1, rec.port);var db = mongo.getDB(rec.db);var coll = db.getCollection("secondary_key");print(coll.remove({}));
});
Step 3 Drop all SK sharding collections:set01:PRIMARY> use shardingset01:PRIMARY> db.sk_shards.remove({});set01:PRIMARY> db.sk_buckets.remove({});set01:PRIMARY> db.sk_config.remove({});set01:PRIMARY> db.sk_instances.remove({});set01:PRIMARY> db.sk_order.remove({});set01:PRIMARY> show collections
There should be no sk_ collection after running drop command
Step 4 Clear rebuildSkDb tasks.set01:PRIMARY> use schedulerset01:PRIMARY> db.tasks.remove({"type" : "rebuildSkDb"})
CPS Troubleshooting Guide, Release 19.4.077
Troubleshooting CPSRe-create SK Shards

Step 5 (Optional) Change default SK shards (skip this step if default SK shard does not need to be changed). By default, oneSK shard gets created. Default SK shard is sessionmgr01/sessionmgr02 27717.
If you want to change the default SK shards, add/modify following parameter in /etc/broadhop/qns.conf fileon Cluster Manager.-Dsk.db.init.1=sessionmgr01-Dsk.db.init.2=sessionmgr02-Dsk.db.init.port=27717
Copy the updated qns.conf file to all the nodes by executing the following script from Cluster Manager:
copytoall.sh /etc/broadhop/qns.conf /etc/broadhop/qns.conf
Step 6 Restart Policy Server (QNS) services by executing the following script from Cluster Manager:.
restartall.sh
Step 7 Once Policy Servers (QNS) are UP, verify default shard is created in shard collection.a) Login to admin database.
mongo --host sessionmgr01 --port 27721
b) Check for default shard.set01:PRIMARY> use shardingset01:PRIMARY> db.sk_shards.find();{"_id" : 1,"seed_1" : "sessionmgr01","seed_2" : "sessionmgr02","port" : 27717,"db" : "sk_cache","online" : true,"count" : NumberLong(0),…
}
Step 8 To add SK shard again, refer to Configuring SK DB in CPS Installation Guide for VMware.
Session Switches from Known to Unknown in CCR-U RequestCase: On running a load with Total TPS of 1200 for a CPS having four policy servers (qns) and for 500000subscribers it was seen that for some of the CCR-U request the CPS sends “Session has switched from knownto unknown as subscriber could not be found” causing the CCA-U to give a result code of 5012.
The call model that is used here is a simple Gx call model involving several CCR-U for Charging-Rule-Reportwere the subscribers are provisioned in a Auto-provisioning manner.
Possible Cause: The call model being run was auto provisioning call model with 200 TPS CCR-I 800 CCR-Uand 200 CCR-T. On every CCR-I we had a subscriber being automatically provisioned and the balanceprovisioned automatically with the Automatic Balance Provisioning service.
We saw lot of locking errors for balance being the cause as there was a version mismatch being seen whileupdating balance.qns02 qns02 2016-02-11 06:11:21,231 [pool-1315-thread-1] ERRORc.b.b.i.d.i.MongoBalanceRepository -Cache data is out of date for object 0057170054ce8d1a56bc6c59
CPS Troubleshooting Guide, Release 19.4.078
Troubleshooting CPSSession Switches from Known to Unknown in CCR-U Request

qns03 qns03 2016-02-11 06:11:22,041 [pool-1308-thread-1] WARNc.b.b.i.a.AutowireBalanceManagerBlueprint - Couldn't find a current Account Balance Statusfortemplate: dailyqns02 qns02 2016-02-11 06:11:21,232 [pool-1315-thread-1] WARNc.b.d.p.g.t.DiameterGxTGPPDeviceMgr -Issue getting reservation status for external reservation id: 1234ds1;338812;2613626736,BalanceCode 1234, Subscriber Id: 0057170054ce8d1a56bc6c59com.broadhop.exception.CachedDataIsOutOfDate: Optimistic Locking Error - the version numberdoesnot match the database version for subscriber: 0057170054ce8d1a56bc6c59
Solution: Thus with balance auto provisioning enabled and high TPS of balance provisioning (high CCR-ITPS which causes balance to be provisioned) it is suggested to keep the Db Read Preference as Primary orPrimaryPreferred under Balance Configuration plug-in in Policy Builder. This will avoid the balancelocking errors.
Intermittent BSON Object Size Error in createsub with Mongo v3.2.1Case: While retrieving/searching subscriber profile using CPS Control Center/Unified API or using mongoclient, the query results into BSONObj Size error. Due to this error, the subscriber is not displayed and anerror is recorded in MongoDB.
Example:set27:PRIMARY> db.subscriber.findOne({"credentials_key.network_id_key" : "910010100034"})2016-02-17T02:42:18.263-0500 E QUERY [thread1] Error: error: {"ok" : 0,"errmsg" : "BSONObj size: 117440514 (0x7000002) is invalid. Size must be between 0 and16793600(16MB) First element: id: ?type=95","code" : 10334} :
Possible Cause: Data corruption can have many causes.
Solution: Repair all databases:
Step 1 Repair all secondary databases.
mongo <hostname>:<port>/spr --eval "db.repairDatabase();"
Step 2 Repair primary database.
/usr/bin/systemctl repair sessionmgr-<port#>
Step 3 After stopping check another secondary has become primary or not.
/usr/bin/systemctl repair sessionmgr-<port#>
ps -ef | grep <port#>
Step 4 After repairing, mongod process is stopped. Make sure it is not running.
/usr/bin/systemctl start sessionmgr-<port#>
Repairing database takes more time when database size is more (approx 30 sec for 1 GB database), so thisactivity should be performed in maintenance window (in non-peak hour).
Note
CPS Troubleshooting Guide, Release 19.4.079
Troubleshooting CPSIntermittent BSON Object Size Error in createsub with Mongo v3.2.1

No Traps Generated When Number of Sessions Exceeds the LimitCase: No traps are generated for license threshold when number of sessions exceeds the assigned limit.
Possible Cause: Parameter not added in qns.conf file.
Solution:
Step 1 To generate license usage threshold trap, we need to configure the following parameter in /etc/broadhop/qns.conf file.
-Dcom.cisco.enforcementfree.mode=false
Step 2 After adding the above entry in qns.conf file, execute copytoall.sh to synchronize the configuration changes to all VMsin the CPS cluster:
copytoall.sh /etc/broadhop/qns.conf /etc/broadhop/qns.conf
Step 3 After modifying the configuration file, to make the changes permanent for future use (when any VM is redeployed orrestarted...etc.), user needs to rebuild etc.tar.gz.
/var/qps/install/current/scripts/build/build_etc.sh
Step 4 Restart the CPS service.
/var/qps/bin/control/restartall.sh
RAR Message Not ReceivedCase: Sometimes the RAR message is not sent out from policy director (lb) even though CPS records inengine logs that the message (RAR, ASR and so on) has been sent. It is an intermittent behavior.
The following logs can be seen on the occurrence of this issue:qns02 qns02 2016-02-22 18:07:31,634 [pool-2-thread-1] DEBUG c.b.d.p.registry.EndpointRegistry- Noendpoint available and current endpoint is down lb01-4:diameter-lb site nullqns02 qns02 2016-02-22 18:07:31,634 [pool-2-thread-1] DEBUG c.b.d.p.registry.EndpointRegistry-Unable to get alternate endpoint for realm site-rx-client.com, host site-host-rx. Settingdestination to null.
Possible Cause: This issuemay occur if the correct value of the parameter -Ddiameter.peer.reload.intervalis not configured in /etc/broadhop/qns.conf file.
CPS reloads the peer endpoints after every 30 seconds. It also reloads endpoints whenever there is an occurrenceof peer flapping or new peer tries to connect.
To avoid unnecessary reloading of endpoints CPS checks that if endpoint reload request comes within the 3second interval after 30 seconds regular reload. If the reload request does not come within the stipulated timeCPS does not allow to reload.
Sometimes if request comes within this 3 second interval then the request is not processed and endpoints arenot loaded due to which the message in question at that time will not be sent out from policy director (lb)though it is visible in engine logs that the message has been sent out.
CPS Troubleshooting Guide, Release 19.4.080
Troubleshooting CPSNo Traps Generated When Number of Sessions Exceeds the Limit

Solution: This 3 second interval can be tweaked using -Ddiameter.peer.reload.interval parameter in/etc/broadhop/qns.conf file.
If it is kept to default value (0 millisecond) then there is a very less probability of collision so a 0 millisecondor very small value is advisable.
Time Zone and Location Information Not ReceivedCase: Sometimes the time zone information and the location information are not received in AAA responsemessage from CPS.
Solution:
• Ensure that you have Rx-Client configured under the Diameter Client (in Reference Data tab) matchingthe realm received in the AAR message. The Rx Client should have Send timezone and location infoin AAA Response check box checked.
• Enable logging is set to debug level for Diameter and check for the following log messages:
• Unable to decode timezone value {} in gx-session with msg {} indicates that the time zoneinformation received from PCEF is not in correct hex format.
• 3gpp-ms-timezone value not found on Gx session to send in AAA response indicates thatCPS did not receive the 3GPP-MS-TimeZone AVP in the CCR message.
• 3gpp-user-location-info value not found on Gx session to send in AAA response indicatesthat CPS did not receive the 3GPP-User-Location-Info AVP in the CCR message.
• Ensure that the UE_LOCATION_CHANGE andUE_TIMEZONE_CHANGE event triggers are enabledto receive the updated time zone and location information.
Admin Database shows Problem in Connecting to the ServerCase: Admin database shows problem in connecting to the server in diagnostics. It throws the following errormessage while checking replica set status.
diagnostics.sh --get_replica_status
Current setup have problem while connecting to the server on port 27721
Possible Cause: The oplog collection is a circular capped collection. It is possible that the corruption occurreddue to abrupt failure of VM and exception comes when the collection wrapped around to the corrupted region.
• Check which specific replica-set member is corrupted. It can be verified using rs.status() command.
For example,mongo sessionmgr01:27721>rs.status()"_id" : 3,"name" : "L3-CA-SEC-sessionmgr01:27721","health" : 1,"state" : 2,"stateStr" : "SECONDARY","lastHeartbeatMessage" : "syncThread: 17322 write to oplog failed: InternalError nospace in capped collection","syncingTo" : "L3-CA-SEC-sessionmgr02:27721"
CPS Troubleshooting Guide, Release 19.4.081
Troubleshooting CPSTime Zone and Location Information Not Received
• Also verify if mongo logs shows the following related errors:2016-03-09T14:33:24.101+0530 [rsHealthPoll] replSet member L3-CA-SEC-sessionmgr01:27721is up2016-03-09T14:33:24.101+0530 [rsHealthPoll] replSet member L3-CA-SEC-sessionmgr01:27721is now in state SECONDARY2016-03-09T14:33:29.801+0530 [rsSync] couldn't make room for new record (len: 172) incapped ns local.oplog.rs2016-03-09T14:33:29.801+0530 [rsSync] Extent 02016-03-09T14:33:29.801+0530 [rsSync] (capExtent)2016-03-09T14:33:29.801+0530 [rsSync]2016-03-09T14:33:29.801+0530 [rsSync] magic: 41424344 extent->ns: local.oplog.rs2016-03-09T14:33:29.801+0530 [rsSync] fr: null lr: 1:1b8dedd4 extent->len: 10737418242016-03-09T14:33:29.801+0530 [rsSync] local.oplog.rs Assertion failure len * 5 >_lastExtentSizesrc/mongo/db/structure/catalog/namespace_details.cpp 366
Solution: Make sure there is at least one survivingmember that is primary databasemember using rs.status()command.
1. Stop mongo process.
/etc/init.d/sessionmgr-27721 stop
2. Go to the data directory.
For example,
cd /var/data/sessions.3
3. Take backup of local file at a temporary location.
ls -l local*
-rw------- 1 root root 67108864 Jan 7 2253 local.0
-rw------- 1 root root 2146435072 Jan 27 0251 local.1
-rw------- 1 root root 16777216 Jan 27 0251 local.ns
4. Remove the local files.
rm -rf local.*
5. Start the mongo process.
/etc/init.d/sessionmgr-27719 start
6. Check whether the local files have been re-created again.
ls -l local*
-rw------- 1 root root 67108864 Jan 7 2253 local.0
-rw------- 1 root root 2146435072 Jan 27 0251 local.1
-rw------- 1 root root 16777216 Jan 27 0251 local.ns
7. Repeat Step 1 to Step 6 for other corrupted member.
CPS Troubleshooting Guide, Release 19.4.082
Troubleshooting CPSAdmin Database shows Problem in Connecting to the Server
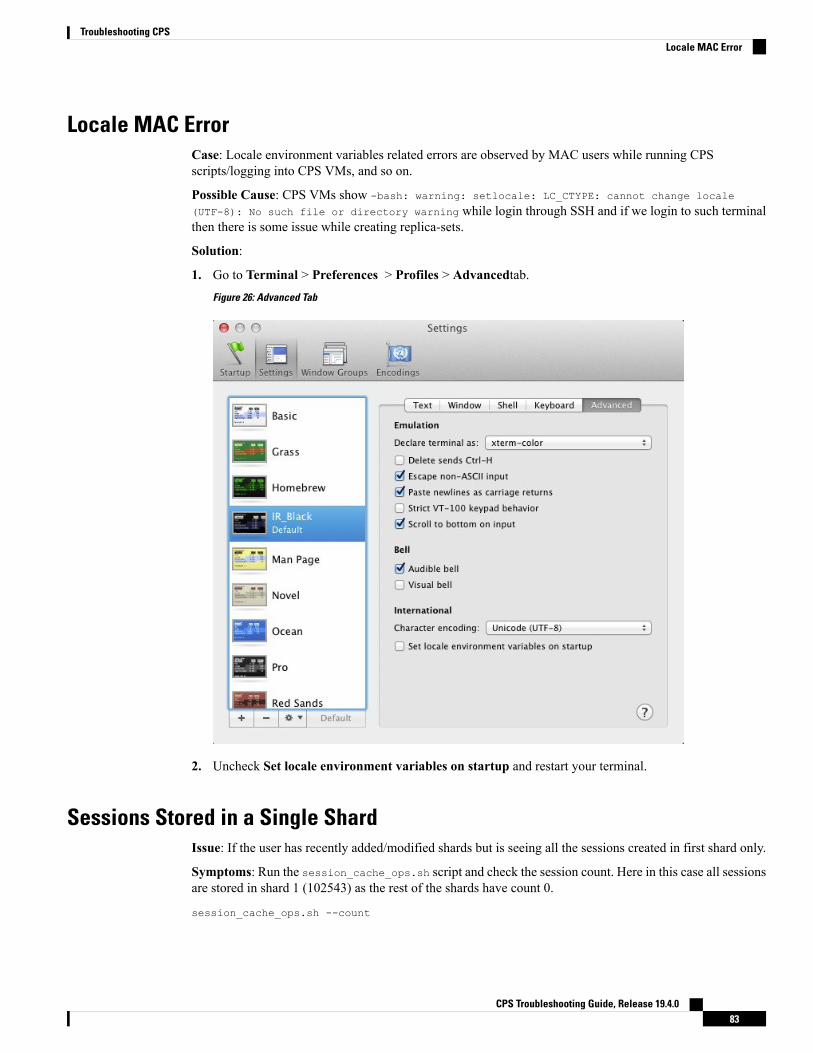
Locale MAC ErrorCase: Locale environment variables related errors are observed by MAC users while running CPSscripts/logging into CPS VMs, and so on.
Possible Cause: CPS VMs show -bash: warning: setlocale: LC_CTYPE: cannot change locale
(UTF-8): No such file or directory warning while login through SSH and if we login to such terminalthen there is some issue while creating replica-sets.
Solution:
1. Go to Terminal > Preferences > Profiles > Advancedtab.Figure 26: Advanced Tab
2. Uncheck Set locale environment variables on startup and restart your terminal.
Sessions Stored in a Single ShardIssue: If the user has recently added/modified shards but is seeing all the sessions created in first shard only.
Symptoms: Run the session_cache_ops.sh script and check the session count. Here in this case all sessionsare stored in shard 1 (102543) as the rest of the shards have count 0.
session_cache_ops.sh --count
CPS Troubleshooting Guide, Release 19.4.083
Troubleshooting CPSLocale MAC Error

Session cache operation scriptThu Jun 16 02:07:45 EDT 2016------------------------------------------------------Session Replica-set SESSION-SET1------------------------------------------------------Session Database : Session Count------------------------------------------------------session_cache : 102543session_cache_2 : 0session_cache_3 : 0session_cache_4 : 0------------------------------------------------------No of Sessions in SET1 : 0------------------------------------------------------
------------------------------------------------------Session Replica-set SESSION-SET2------------------------------------------------------Session Database : Session Count------------------------------------------------------session_cache : 0session_cache_2 : 0session_cache_3 : 0session_cache_4 : 0------------------------------------------------------No of Sessions in SET2 : 0------------------------------------------------------
Total Number of Sessions : 0
Solution:
1. Find admin database in use.
Open Policy Builder, check for Admin Database under Cluster configuration.
2. Login to admin database and run the following query:
For example, mongo sessionmgr01:27721
set01:PRIMARY> use shardingswitched to db shardingset01:PRIMARY> db.buckets.count({"shard":1})8192
If the bucket count is 8192 (means all the buckets are in shard 1 and rebalance is required).
3. Run rebalance and migrate OSGi commands from pcrfclient01.
For production environment, this needs to be done in maintenance window.Note
echo "rebalance" | nc qns01 9091
echo "migrate" | nc qns01 9091
4. After rebalance is completed, verify by re-running session_cache_ops.sh --count script.
CPS Troubleshooting Guide, Release 19.4.084
Troubleshooting CPSSessions Stored in a Single Shard
Licensing not Throwing Traps or Diagnostic Errors upon BreachIssue: Licensing is not throwing traps or diagnostic errors upon breach.
Symptoms: Application traps are not generated.
Solution: Check log level for logger com.broadhop.eventlogging in /etc/broadhop/qns.conf file.<logger name="com.broadhop.eventlogging" level="info">
<appender-ref ref="JSON-LOGGER" /></logger>
Log level must be set to info.Important
If log level is set to warn/error, SNMP traps related to licensing will not be generated. You need to changethe log level to info to generate traps related to licensing.
After changing the log level to info, execute the following commands:
/var/qps/install/current/scripts/build_all.sh
/var/qps/install/current/scripts/upgrade/reinit.sh
Corosync Process Taking lot of Time to Unload and is StuckIssue: The corosync process is taking a lot of time to unload and is stuck.
Solution: If user finds corosync process is stuck, while doing monit restart corosync or monit stop
corosync, perform the following steps:
Step 1 Exit from the process by pressing Ctrl+c.Step 2 Note down corosync process pid by executing the following command:
cat /var/run/corosync.pid
Step 3 Stop coroysnc and its child processes by executing the following command:
kill -2 <coroysnc process pid>
Step 4 Check whether all the corosync and all the child processes are stopped by executing the following command:
ps -ef | grep "corosync\|pacemaker"
Step 5 If you are still seeing that the processes are UP then kill all the processes (corosync and pacemaker), which are shownin Step 4, on page 85 by executing the following commands:
kill -9 <all pid of processes, space seprated>
Issue related to FirewallIssue: When firewall state is changed from enabled to disabled state or vice versa, sometimes firewall is notcompletely purged on some VMs.
CPS Troubleshooting Guide, Release 19.4.085
Troubleshooting CPSLicensing not Throwing Traps or Diagnostic Errors upon Breach

Solution: Perform the following when you are changing firewall state:
• If the firewall state is being changed from disabled to enabled, execute the following command twiceafter SSH to VM:
vm-init-client.sh
• If the firewall state is being changed from enabled to disabled, check if /etc/sysconfig/iptableshas any old rules by executing the following command by SSH to VM:
/etc/init.d/vm-init.sh
If Yes, delete it manually and execute the following command again on a VM:
vm-init-client.sh
CPS Setup cannot Handle High TPSIssue: Too many request to query mongo.
Case: Consider user is running a very basic call model (Gx only) on CPS setup. On reaching close to 15KTPS (1 CCR-I, 3- CCR-U and 1-CCR-T), timeouts are observed in grafana and average response time goesup.
Response time:[root@pcrfclient01 ~]# mongostat --host sessionmgr01 --port 27717connected to: sessionmgr01:27717insert query update delete getmore command flushes mapped vsize res faults locked db idxmiss % qr|qw ar|aw netInnetOut conn set repl time1055 17691 3868 921 248 328|0 0 5.03g 5.84g 4.12g 0 session_cache:32.0% 0 73|0 0|4 19m 33m137 set01 PRI 15:26:15973 16848 3568 752 200 257|0 0 5.03g 5.84g 4.12g 0 session_cache_2:29.7% 0 4|0 6|1 18m 31m138 set01 PRI 15:26:161049 17023 4162 809 215 283|0 0 5.03g 5.84g 4.12g 0 session_cache_3:33.7% 0 74|1 2|3 20m35m 138 set01 PRI 15:26:171010 17200 3956 804 211 278|0 0 5.03g 5.84g 4.12g 0 session_cache_4:32.1% 0 18|0 3|1 19m33m 137 set01 PRI 15:26:18975 17027 3912 816 206 275|0 0 5.03g 5.84g 4.13g 0 session_cache:31.8% 0 34|0 0|4 19m 33m138 set01 PRI 15:26:19990 16631 3643 904 204 279|0 0 5.03g 5.84g 4.13g 0 session_cache_2:34.4% 0 58|0 0|4 18m 31m138 set01 PRI 15:26:20913 15475 3806 881 185 257|0 0 5.03g 5.84g 4.13g 0 session_cache_4:30.7% 0 40|0 1|3 18m 32m140 set01 PRI 15:26:21
Possible Cause: Selecting the following settings in Policy Builder, system sends multiple queries to mongowhich impacts the performance. (Timeouts are observed and average response time goes up.)
1. Enable Multi Primary Key check box is selected for your system.
2. Load By Nai, Imsi Based Nai, Limit with Requested QoS on modification failure check boxes areselected under your Diameter client.
3. Max Timer T P S value has been configured to 2000 for your cluster.
4. Re-evaluation diffusion interval value has been configured to 20000 for your cluster.
Solution:
1. Login to Cisco Policy Builder.
CPS Troubleshooting Guide, Release 19.4.086
Troubleshooting CPSCPS Setup cannot Handle High TPS

2. From left side, select name of your system and uncheck Enable Multi Primary Key check box.
3. Under Diameter Clients, expand Gx Clients and select the name of your Gx client. For example, Gx.
4. Uncheck Load By Nai, Imsi Based Nai, Limit with Requested QoS on modification failure checkboxes.
5. From left side, select name of your cluster under name of your system.
6. From right side pane, updateMax Timer T P S value to 100.
7. Also, change the Re-evaluation diffusion interval value to 20 milliseconds for your cluster.
CPS System is Crashing when Running More than 6K TPSIssue: High response time is observed when system is running with all the default features installed and hasGx traffic with 6K TPS.
Consideration: It is recommended to create session replica-set as per performance requirements for scaling.
Solution:
Step 1 Create/update /etc/broadhop/mongoConfig.cfg file on Cluster Manager VM to create session cache shards incriss-cross manner.
[SESSION-SET1]SETNAME=set01OPLOG_SIZE=5120ARBITER1=arbitervip:27717ARBITER_DATA_PATH=/var/data/sessions.1MEMBER1=sessionmgr01:27717MEMBER2=sessionmgr02:27717DATA_PATH=/var/data/sessions.1/1[SESSION-SET1-END]
[SESSION-SET2]SETNAME=set07OPLOG_SIZE=5120ARBITER1=arbitervip:27727ARBITER_DATA_PATH=/var/data/sessions.7MEMBER1=sessionmgr02:27727MEMBER2=sessionmgr01:27727DATA_PATH=/var/data/sessions.1/2[SESSION-SET2-END]
Step 2 Refer to Create Specific Replica-set and Session Cache Replica-set sections in CPS Installation Guide for VMware forfurther information on how to create replica sets.
Step 3 Set session database priority so that the PRIMARY members will be on separate VM:
cd /var/qps/bin/support/mongo
./set_priority.sh --db session
For more information on set_priority.sh script, refer to CPS Operations Guide and CPS Geographic RedundancyGuide.
CPS Troubleshooting Guide, Release 19.4.087
Troubleshooting CPSCPS System is Crashing when Running More than 6K TPS
Step 4 To create session shards, refer to the Create Session Shards section in CPS Installation Guide for VMware.
Old VIP is not deleted After Modifying VIP NameIf VIP name is modified then user has to manually delete old VIP from active policy director (lb)/OAM(pcrfclient) using the following below command:
pcs resource delete <old-vip-name>
where, <old-vip-name> is the old VIP name.
lbvip not moving to Secondary Policy Director (lb) VMIssue: lbvip does not move cleanly to the secondary policy director (lb) VM when the network on primarypolicy director (lb) VM is stopped.
Scenario: For example, consider lbvip is on lb01 VM.
To stop the network on lb01 VM, execute the following command:
service network stop
lbvip moves to lb02 VM immediately but it is not pingable from anywhere which stops the traffic and grafana.
After performing service network restart on lb02 VM, the traffic restored partially with lot of errors (andlbvip is pingable from everwhere).
After stopping the network on lb01 VM, lbvip was seen on both the lb VMs (even after doing network restraton lb02 VM).
Solution:
Before executing service network stop, stop corosyn from the node using monit stop corosync command.
This is needed since corosync has the functionality to bring up an interface if they are down. So after servicenetwork stop is executed all interfaces are down and corosync brings up the interfaces (like, eth0:0, eth1:0,and so on).
Note
Internal Session Sharding not Recovered on Power OutageCase: session_cache_ops.sh --count shows the error: There is no session db found.
Symptoms: On power outage, if all the members of session database replica were down and came up, sessiondatabase replica-set will get automatically re-created. However after this if you run session_cache_ops.sh
--count script, it may show the error: There is no session db found.
This is because, script do not create session_cache databases on its own. session_cache databases would getcreated by application automatically when calls would run.
Here is an example:Session cache operation scriptMon Oct 17 05:40:34 EDT 2016
CPS Troubleshooting Guide, Release 19.4.088
Troubleshooting CPSOld VIP is not deleted After Modifying VIP Name

There is no session db found for site SITE1
There is no session db found for site SITE1
There is no session db found for site SITE1
There is no session db found for site SITE1
Validate: Run listshards command to verify the internal shards are not deleted.
For HA, run the following command:
echo "listshards" | nc qns01 9091
For Active active GR, run the following command:
echo "listshards <site name>" | nc qns01 9091
This command displays all the shards configured in the system.
Here is an example:echo "listshards clusterA_PRI" | nc qns01 9091osgi>Shard Id Mongo DB State Backup DB Removed SessionCount
1 sessionmgr01:27717/session_cache online false false 261758
2 sessionmgr01:27717/session_cache_2 online false false 261439
3 sessionmgr01:27717/session_cache_3 online false false 261139
4 sessionmgr01:27717/session_cache_4 online false false 262069
5 sessionmgr03:27722/session_cache online false false 261984
6 sessionmgr03:27722/session_cache_2 online false false 260759
7 sessionmgr03:27722/session_cache_3 online false false 262147
8 sessionmgr03:27722/session_cache_4 online false false 262087
9 sessionmgr05:27723/session_cache online false false 261627
10 sessionmgr05:27723/session_cache_2 online false false 262118
11 sessionmgr05:27723/session_cache_3 online false false 262088
12 sessionmgr05:27723/session_cache_4 online false false 261775
13 sessionmgr09:47717/session_cache online true false 0
14 sessionmgr09:47717/session_cache_2 online true false 0
15 sessionmgr09:47717/session_cache_3 online true false 0
16 sessionmgr09:47717/session_cache_4 online true false 0
Rebalance Status: Rebalanced
CPS Troubleshooting Guide, Release 19.4.089
Troubleshooting CPSInternal Session Sharding not Recovered on Power Outage

Flow Information Parameters Not Derived As Per ActionsIf the Flow-Information parameters are not derived as per the Actions (Enforce/Mirror), check for the followingconfiguration details:
• Ensure that the AVP name defined in the ColumnAndAvpPair in the RxSTGConfiguration serviceoption is the correct action name ("Flow Status" or "Flow Description) to derive the action. Also checkthe 3GPP AVP name to derive the CRD value for the field.
• Confirm that the action values in the CRD are correctly entered (Mirror/Enforce).
• Check if the Flow-Description value defined in the CRD for Enforce action is in correct format. If theIPFilterRule syntax is not proper then CPS logs a warn message to indicate the same.
• Enable logs at debug level and confirm the CRD evaluation and logs for applying the action of theindividual fields in the flow information.
Mapped Target AVPs Not Received In Diameter MessageIf the source AVP is a Session/Policy State Data Retriever, the target AVPs are sent in the outbound diametermessages only if the data to be retrieved is available in the Session/Policy State data.
If the mapped target AVPs are not received in the respective diameter message, check for the following:
• Ensure that you have correctly configured Custom Avp Table and Avp Mappings under ReferenceData > Diameter Defaults. Verify that the mandatory fields (marked with asterisk) are configuredcorrectly.
• Enable logs at debug level for Diameter and check for the following log messages:
• AVP Mappings are not defined
Indicates that no AVP mappings have been defined in Policy Builder.
• No mappings found for {}
Indicates that no target AVP mappings were found for a particular policy derived attribute.
• submit object is null or not a message
Indicates that CPS did not receive a Diameter message.
Running Puppet on Cluster Manager in HA SetupIssue: After applying patch or updating kernel in HA setup, when you run puppet apply command/etc/httpd/conf/httpd.conf file was modified, not all VMs are configured with the modifiedhttpd.conf file:
Solution: After applying a patch or updating kernel in HA setup, run the following command from ClusterManager:
puppet apply --logdest=/var/log/cluman/puppet-custom-run.log --
modulepath=/opt/cluman/puppet/modules --config=/opt/cluman/puppet/ puppet.conf
/opt/cluman/puppet/nodes/node_repo.pp
CPS Troubleshooting Guide, Release 19.4.090
Troubleshooting CPSFlow Information Parameters Not Derived As Per Actions

Manually enter puppet apply command in your system.Note
After applying the puppet apply command, run the following command from Cluster Manager to update the/etc/httpd/conf/httpd.conf file on all VMs:
/var/qps/install/current/scripts/modules/update_httpd_conf.py
Not Able to Rebalance and Migrate after Shards RecreationCase: Unable to complete rebalance operation displaying following error:osgi> rebalance GR-S1Rebalancing ...Unable to complete operation.
Reason:
• Instance site1-qns90-1 is on older version (1) of sharding configuration. Latest version is: (10)
• Make sure all the instances are up and running and try running rebalance command again
• If the instance in the error does not exist, manually clear it from instances collection (admindb/sharding)and try running rebalance command again
Possible Cause: qns90 VM is either deleted or is no more in use or policy server (QNS) process is down
Solution:
If QNS process was down unintentionally, perform the following steps:
1. Start the policy server (qns) process.
2. Verify that the diagnostics is clear.
3. Run the rebalance command again.
If qns90 VM is deleted or is no more in use, perform the follow steps:
1. Login to the admin database.
2. Clear the instance in error from "instances" collection.
use sharding
1. Delete the instance in error.
db.instances.find({"_id":"Site1-qns90-1"})
db.instances.remove({"_id":"Site1-qns90-1"})
2. Reload configuration.
db.config.update({},{$inc:{"version": NumberInt(1)}})
db.changes.insert({"ts":new Timestamp(), "change" : "Manually deleting qns90"})
3. Run the rebalance command again.
CPS Troubleshooting Guide, Release 19.4.091
Troubleshooting CPSNot Able to Rebalance and Migrate after Shards Recreation

pcrfclient01 Automatically Becomes UnresponsiveCase: pcrfclient01 automatically becomes unresponsive after some time in OpenStack environment
Condition: You are not able to SSH to any VM.
Solution: Refer to the following fix:
The Errata for OSP10 (Newton) is:
RHSA-2018*0058 - Security Advisory Issued:2018-01-05 Updated: 2018-01-05 Errata:
https://access.redhat.com/errata/RHSA-2018T0058
Fixes:
• BZ - 1519780 - CVE-2017-5715 hw: cpu: speculative execution branch target injection
• BZ - 1525502 - QEMU's AIO subsystem gets stuck inhibiting all I/O operations on virtio-blk-pci devices[OSP 10]
Primary Member Isolated from all Arbiters Displaying Incorrect StateIssue: If the primary database member gets isolated from all the arbiters then diagnostics output displaysincorrect state for the primary member.
Solution: If a member is displayed in an unknown state when using diagnostics.sh --get_replica_status
command, it is likely that the member is not accessible from one of other members, mostly an arbiter. In thatcase, you must go to that member and check its connectivity with other members.
Also, you can login to mongo on that member and check its actual status.
No Alarm is Generated When Mongo Process Stop/RestartCase: No SNMP alarm is generated when Mongo process is stopped or restarted.
Possible Cause: This can happen due to the timing difference between AIDO functionality and SNMP alarmschedule.
• When the Mongo process is stopped, it gets restarted by AIDO.
• Before SNMP scheduler detects theMongo failure, it is restarted by AIDO. Hence, no alarm is generated.
Solution:
If youwant to stopAIDO from restarting theMongo process, you need to create/var/tmp/stopped-PORTfile on the AIDO client node.
This stops AIDO from monitoring or handling the Mongo process. The alarm is generated when Mongoprocess is stopped or restarted.
Example: During ISSU, you need to stop and start mongod process which is done by upgrade script. So, youneed to execute the following steps:
1. Create /vat/tmp/stopped-PORT file on AIDO client node.
2. Stop mongod using /etc/init.d/sessionmgr-PORT stop
CPS Troubleshooting Guide, Release 19.4.092
Troubleshooting CPSpcrfclient01 Automatically Becomes Unresponsive

3. Upgrade your system (ISSU). AIDO does not restart themongod process as/vat/tmp/stopped-PORTfile is created on AIDO client node.
4. Start mongod using /etc/init.d/sessionmgr-PORT start
5. Remove /vat/tmp/stopped-PORT file from AIDO client node
Zookeeper becoming Unavailable on Cluster ManagerCase: Zookeeper in an endless restart cycle. In monit summary, the zookeeper-server is displayed in Initiaizingstate.Process 'zookeeper-server' Initializing
Possible Cause: Zookeeper server with version 3.4.6 fails to start.
Solution: Go to /var/opt/zookeeper/version-2 and delete zero byte file or move the file to someother location.ls -ltotal 1988-rw-r--r-- 1 root root 67108880 Feb 20 2018 log.1-rw-r--r-- 1 root root 67108880 Aug 23 04:58 log.1f43-rw-r--r-- 1 root root 0 Aug 23 04:58 log.31fd
After moving out zero byte file from /var/opt/zookeeper/version-2, check monit summary. Thezookeeper-server must be in running state.
Upgrade Fails due to monit Race ConditionCase: Upgrade fails when running puppet.
During upgrade, the following error is encountered:2018-12-10 05:10:17,909 INFO [__main__.run_recipe] Performing installation stage:ApplyClumanPuppet2018-12-10 05:10:17,910 INFO [cluman_puppet.run] Applying puppet on cluman2018-12-10 05:10:53,133 ERROR [cluman_puppet.run] Puppet failed! For details check log/var/log/cluman/puppet-run.log2018-12-10 05:10:53,133 ERROR [__main__.<module>] Error during installation2018-12-10 05:10:53,133 ERROR [__main__.<module>]Traceback (most recent call last):File "/mnt/iso/modules/install/__main__.py", line 780, in <module>main(sys.argv[1:])
File "/mnt/iso/modules/install/__main__.py", line 770, in maininstall(argv[1:])
File "/mnt/iso/modules/install/__main__.py", line 208, in installrun_recipe(install_recipe)
File "/mnt/iso/modules/install/__main__.py", line 763, in run_recipestage.run()
File "install/cluman_puppet.py", line 55, in runpuppet_cmd.execute()
File "util/command.py", line 106, in executeraise RuntimeError(' '.join(self.command) + ' returned ' + str(self.exitcode) + ' instead
of ' + str(self.expected_exitcode))RuntimeError: /usr/bin/puppet apply --detailed-exitcodes --debug --verbose --logdest/var/log/cluman/puppet-run.log --modulepath=/opt/cluman/puppet/modules --config/opt/cluman/puppet/puppet.conf /opt/cluman/puppet/nodes/node_repo.pp returned 6 instead of[0, 2]2018-12-10 05:10:53,134 INFO [__main__.<module>] =====================
CPS Troubleshooting Guide, Release 19.4.093
Troubleshooting CPSZookeeper becoming Unavailable on Cluster Manager

2018-12-10 05:10:53,134 INFO [__main__.<module>] FAILURE2018-12-10 05:10:53,134 INFO [__main__.<module>] ======== END ========2018-12-10 05:10:53,134 INFO [__main__.<module>] To have the environment variable updated,please logout and login from all opened shell on the current system
Solution: Re-run the install.sh.
Messages Timed Out When Running Heap DumpCase:Messages timed out when running Heap Dump of Policy Server (QNS)/Policy Director (LB) processon Policy Server (QNS)/Policy Director (LB) VM.
Condition: Taking heap dump of Policy Server (QNS)/Policy Director (LB) process on Policy Server(QNS)/Policy Director (LB) VM. Heap dumps taken results in full GC. This in turn results in applicationpause which causes message time out.
Solution: It is recommended to take the heap dump during Maintenance Window (MW).
mongod Process Not Running on both pcrfclient after Fresh InstallCase: mongod process not running on both pcrfclients after fresh installation.
pcs status throwing not installed error as follows:pcs statusCluster name: cpsWARNING: corosync and pacemaker node names do not match (IPs used in setup?)Stack: corosyncCurrent DC: pcrfclientXX (version 1.1.18-11.el7_5.3-2b07d5c5a9) - partition with quorumLast updated: Thu Jan 17 14:09:38 2019Last change: Thu Jan 17 12:27:52 2019 by root via cibadmin on pcrfclientXX
2 nodes configured10 resources configured
Online: [ pcrfclientXX pcrfclientXX ]
Full list of resources:
Resource Group: mongodarbitervip (ocf::heartbeat:IPaddr2): Started pcrfclientXXsessionmgr-27721 (systemd:sessionmgr-27721): Stoppedsessionmgr-27717 (systemd:sessionmgr-27717): Stoppedsessionmgr-27727 (systemd:sessionmgr-27727): Stoppedsessionmgr-27017 (systemd:sessionmgr-27017): Stoppedsessionmgr-27718 (systemd:sessionmgr-27718): Stoppedsessionmgr-27719 (systemd:sessionmgr-27719): Stoppedsessionmgr-27720 (systemd:sessionmgr-27720): Stopped
Clone Set: PingIP-clone [PingIP]Started: [ AB-RT-pcrfclient01 AB-RT-pcrfclient02 ]
Failed Actions:* sessionmgr-27721_start_0 on pcrfclientXX 'not installed' (5): call=12, status=Not installed,exitreason='',
last-rc-change='Thu Jan 17 12:25:40 2019', queued=0ms, exec=41ms* sessionmgr-27721_start_0 on pcrfclientXX 'not installed' (5): call=39, status=Not installed,exitreason='',
last-rc-change='Thu Jan 17 12:36:59 2019', queued=0ms, exec=40ms* sessionmgr-27717_start_0 on pcrfclientXX 'not installed' (5): call=40, status=Not installed,exitreason='',
last-rc-change='Thu Jan 17 12:36:59 2019', queued=1ms, exec=77ms
CPS Troubleshooting Guide, Release 19.4.094
Troubleshooting CPSMessages Timed Out When Running Heap Dump

* sessionmgr-27727_start_0 on pcrfclientXX 'not installed' (5): call=41, status=Not installed,exitreason='',
last-rc-change='Thu Jan 17 12:36:59 2019', queued=0ms, exec=115ms* sessionmgr-27017_start_0 on pcrfclientXX 'not installed' (5): call=42, status=Not installed,exitreason='',
last-rc-change='Thu Jan 17 12:36:59 2019', queued=0ms, exec=151ms* sessionmgr-27718_start_0 on pcrfclientXX 'not installed' (5): call=44, status=Not installed,exitreason='',
last-rc-change='Thu Jan 17 12:36:59 2019', queued=0ms, exec=159ms
Daemon Status:corosync: active/disabledpacemaker: active/disabledpcsd: inactive/disabled
Solution: On pcrfclient, run crm_resource --clean command.
Replica-set ID is Getting Changed after pcrfclient (arbiter) FailoverCase:When the pcrfclient and the sessionmgr VM's are rebooted, it is observed that some of the sessionmanagers go offline.
Reason: Some session managers are not able to connect to arbiter because ofInvalidReplicaSetConfig: replica-set IDs do not match error. This is because thereplica-set ID in arbiter and sessionmgr's does not match.
Solution: Perform the following steps to change database path in mongoConfig.cfg file:
1. Remove reporting replica-set.
build_set.sh --report --remove-replica-set --setname replica-setID
For example, build_set.sh --report --remove-replica-set --setname set03
2. Update mongoConfig.cfg file with the new database path.
3. Run the /var/qps/install/current/scripts/build/build_etc.sh script from theCluster Manager to finalize mongoConfig.cfg file.
4. Create replica-set with force option.
build_set.sh --report --create --setname replica-setID --force
For example, build_set.sh --report --create --setname set03 --force
5. Verify the new database path in mongod instance.
Errors/Warnings Observed during PS Node WarmupCase: The warmup solution warms up the PS node(s) by internally initiating configured number of warm upmessages prior to connecting to the load balancer node and processing external calls. The warm up messagesare processed by policy engine like regular messages and sessions are created/deleted in session database.The actual response/request messages generated in response to incoming warm up requests are not sent towardsPolicy Director (lb) node, as there is no connectivity established towards Policy Director (lb). As PolicyDirector (lb) nodes accept traffic during processing node(s) warm up phase, it can result in some call failures(3004) towards DRA/Gateway.
CPS Troubleshooting Guide, Release 19.4.095
Troubleshooting CPSReplica-set ID is Getting Changed after pcrfclient (arbiter) Failover

Due to non-connectivity towards Policy Director (lb), if PS nodes are restarted (restartall.sh or individualrestart) the following errors/warnings can be observed.
The errors/warnings are not seen after all the nodes are warmed up.Note
1. Some calls can be rejected with 3004 (DIAMETER_TOO_BUSY) error code.
2. The following Warnings/Errors can be seen in qns logs.WARN c.b.d.p.event.DiameterMessageDealer - Unable to send messagehealthCheckHost.healthCheckRealm;1523905102;13492
site-1-pps06 site-1-pps06 2019-02-13 09:41:06,775[pool-2-thread-1] ERROR c.b.u.zmq.nodes.PushConnection - Exception sending messagecom.broadhop.exception.BroadhopException: No channels available
atcom.broadhop.utilities.zmq.nodes.PushConnection.getNextChannel(PushConnection.java:252)~[com.broadhop.utility_14.0.1.r132522.jar:na]
atcom.broadhop.utilities.zmq.nodes.PushConnection.send(PushConnection.java:285)~[com.broadhop.utility_14.0.1.r132522.jar:na]
atcom.broadhop.utilities.zmq.WorkerNode.send(WorkerNode.java:265)[com.broadhop.utility_14.0.1.r132522.jar:na]
atcom.broadhop.diameter2.policy.event.DiameterMessageDealer.processOutboundMessage(DiameterMessageDealer.java:671)[com.broadhop.diameter2.policy.endpoint_14.0.1.r132523.jar:n]
atcom.broadhop.diameter2.policy.event.DiameterMessageDealer.submit(DiameterMessageDealer.java:645)[com.broadhop.diameter2.policy.endpoint_14.0.1.r132523.jar:na]
atcom.broadhop.diameter2.policy.actions.SendDiameterResponse.execute(SendDiameterResponse.java:63)[com.broadhop.diameter2.policy.endpoint_14.0.1.r132523.jar:na]
atcom.broadhop.utilities.policy.async.PolicyLocalAsyncActionRunnable.run(PolicyLocalAsyncActionRunnable.java:33)[com.broadhop.utility_14.0.1.r132522.jar:na]
atjava.util.concurrent.Executors$RunnableAdapter.call(Executors.java:511) [na:1.8.0_72]
atjava.util.concurrent.FutureTask.run(FutureTask.java:266) [na:1.8.0_72]
ERROR c.b.policy.remote.jms.JmsReceiver - Error processing and deserializing incomingmessage com.esotericsoftware.kryo.SerializationException: Unable to deserialize objectof type: com.broadhop.policy.remote.RemoteActionRequest
atcom.esotericsoftware.kryo.Kryo.readClassAndObject(Kryo.java:571) ~[na:na]
atcom.esotericsoftware.kryo.ObjectBuffer.readClassAndObject(ObjectBuffer.java:206) ~[na:na]
atcom.broadhop.policy.remote.jms.Jms.deserialize(Jms.java:271)~[com.broadhop.policy.remote.jms_14.0.1.r131154.jar:na]
atcom.broadhop.policy.remote.jms.JmsReceiver.onMessage(JmsReceiver.java:170)~[com.broadhop.policy.remote.jms_14.0.1.r131154.jar:na]
atorg.apache.activemq.ActiveMQMessageConsumer.dispatch(ActiveMQMessageConsumer.java:1361)[activemq-all-5.9.0.jar:5.9.0]
atorg.apache.activemq.ActiveMQSessionExecutor.dispatch(ActiveMQSessionExecutor.java:131)[activemq-all-5.9.0.jar:5.9.0]
at
CPS Troubleshooting Guide, Release 19.4.096
Troubleshooting CPSErrors/Warnings Observed during PS Node Warmup

org.apache.activemq.ActiveMQSessionExecutor.iterate(ActiveMQSessionExecutor.java:202)[activemq-all-5.9.0.jar:5.9.0]
atorg.apache.activemq.thread.PooledTaskRunner.runTask(PooledTaskRunner.java:129)[activemq-all-5.9.0.jar:5.9.0]
atorg.apache.activemq.thread.PooledTaskRunner$1.run(PooledTaskRunner.java:47)[activemq-all-5.9.0.jar:5.9.0]
atjava.util.concurrent.ThreadPoolExecutor.runWorker(ThreadPoolExecutor.java:1142)[na:1.8.0_72]
atjava.util.concurrent.ThreadPoolExecutor$Worker.run(ThreadPoolExecutor.java:617)[na:1.8.0_72]
at java.lang.Thread.run(Thread.java:745)[na:1.8.0_72]
Caused by: com.esotericsoftware.kryo.SerializationException:Unable to find class: com.broadhop.diameter2.actions.ICreateClientSession
Total Number of Session Exceeding Allowed LimitCase: Session Limit Overload Protection is set to 400000 in Policy Builder. But when the calls are run at 2KTPS (CCR-I), the total number of sessions are growing till 475049 which is more than the allowed limit.However, CPS does not allow the sessions to grow after this, but still this is about 20%more than the allowedlimit.Mon Mar 4 09:55:52 UTC 2019
*** End-of-Collection ***--------------------------------------------------------------------------------------------Host Detail:qns10,qns07,qns13,qns05,qns16,qns08,qns12qns01,qns17,qns11,qns14,qns04,qns02,qns03qns19,qns06,qns20,qns18,qns15,qns09Measurement timer: 1 QNS Count: 20--------------------------------------------------------------------------------------------
Average Success TPS Error Time Used Messages16.9670 2100 2100.0000 0 35.6306 diameter_Gx_CCR-I13.1713 2005 2005.0000 0 26.4084 diameter_Rx_AAR
--------------------------------------------------------------------------------------------
Average Success TPS Error Time Used Actions3.2845 6358 6358.0000 0 20.8826
com.broadhop.cache.impl.actions.GetSessionAction6.7885 2100 2100.0000 0 14.2558 com.broadhop.session.CreateEntry4.6131 2218 2218.0000 0 10.2319 com.broadhop.session.UpdateEntry0.6030 8551 8551.0000 0 5.1565 ResolveServices0.2736 8550 8550.0000 0 2.3397 ResolveServiceOptions0.1966 2223 2223.0000 0 0.4371 send.diameter_Gx_RAR0.1638 2223 2223.0000 0 0.3640 send.diameter_Rx_AAA0.1436 2100 2100.0000 0 0.3016 send.diameter_Gx_CCA-I0.0404 4231 4231.0000 0 0.1709
com.broadhop.policy.impl.actions.FormatTimeWithOffsetAction0.0148 8544 8544.0000 0 0.1266 BundleVirtualServices0.0181 4231 4231.0000 0 0.0766
com.broadhop.policyintel.impl.actions.StartPolicyReporting0.0049 4290 4290.0000 0 0.0211
com.broadhop.policyintel.impl.actions.StopPolicyReporting
Mon Mar 4 09:55:53 UTC 2019
CPS Troubleshooting Guide, Release 19.4.097
Troubleshooting CPSTotal Number of Session Exceeding Allowed Limit

*** End-of-Collection ***
^C*** Exiting ***[root@pcrfclient01 ~]# session_cache_ops.sh --count|grep Total;dateTotal Number of Sessions : 393478Mon Mar 4 09:56:03 UTC 2019[root@pcrfclient01 ~]# top_qps.sh--------------------------------------------------------------------------------------------Host Detail:qns02,qns17,qns15,qns20,qns04,qns14,qns07qns11,qns08,qns01,qns12,qns06,qns05,qns16qns09,qns19,qns13,qns18,qns10,qns03Measurement timer: 1 QNS Count: 20--------------------------------------------------------------------------------------------
Average Success TPS Error Time Used Messages15.4398 2100 2100.0000 0 32.4236 diameter_Gx_CCR-I16.1731 1848 1848.0000 0 29.8879 diameter_Rx_AAR
--------------------------------------------------------------------------------------------
Average Success TPS Error Time Used Actions2.8085 6600 6600.0000 0 18.5362
com.broadhop.cache.impl.actions.GetSessionAction5.6463 2100 2100.0000 0 11.8572 com.broadhop.session.CreateEntry4.4516 2398 2398.0000 0 10.6750 com.broadhop.session.UpdateEntry0.5664 9000 9000.0000 0 5.0973 ResolveServices0.2597 9000 9000.0000 0 2.3369 ResolveServiceOptions0.1828 2398 2398.0000 0 0.4384 send.diameter_Gx_RAR0.1513 2398 2398.0000 0 0.3628 send.diameter_Rx_AAA0.1549 2100 2100.0000 0 0.3252 send.diameter_Gx_CCA-I0.0371 4500 4500.0000 0 0.1670
com.broadhop.policy.impl.actions.FormatTimeWithOffsetAction0.0137 9000 9000.0000 0 0.1234 BundleVirtualServices0.0166 4500 4500.0000 0 0.0747
com.broadhop.policyintel.impl.actions.StartPolicyReporting0.0047 4500 4500.0000 0 0.0214
com.broadhop.policyintel.impl.actions.StopPolicyReporting
Mon Mar 4 09:56:24 UTC 2019
*** End-of-Collection ***
^C*** Exiting ***[root@pcrfclient01 ~]# session_cache_ops.sh --count|grep Total;dateTotal Number of Sessions : 452341Mon Mar 4 09:56:36 UTC 2019[root@pcrfclient01 ~]# session_cache_ops.sh --count|grep Total;dateTotal Number of Sessions : 462917Mon Mar 4 09:56:46 UTC 2019[root@pcrfclient01 ~]# session_cache_ops.sh --count|grep Total;dateTotal Number of Sessions : 475049Mon Mar 4 09:57:16 UTC 2019[root@pcrfclient01 ~]# tailf /var/log/broadhop/consolidated-sessions.log2019-03-04 15:13:45 - TPS_COUNT: SESSION_COUNT:
LICENSE_COUNT: 2000002019-03-04 15:15:15 - TPS_COUNT: SESSION_COUNT:
LICENSE_COUNT: 2000002019-03-04 15:16:45 - TPS_COUNT: SESSION_COUNT:
LICENSE_COUNT: 2000002019-03-04 15:18:15 - TPS_COUNT: SESSION_COUNT:
LICENSE_COUNT: 2000002019-03-04 15:19:45 - TPS_COUNT: SESSION_COUNT:
CPS Troubleshooting Guide, Release 19.4.098
Troubleshooting CPSTotal Number of Session Exceeding Allowed Limit

LICENSE_COUNT: 2000002019-03-04 15:21:15 - TPS_COUNT: SESSION_COUNT:
LICENSE_COUNT: 2000002019-03-04 15:22:45 - TPS_COUNT: SESSION_COUNT:
LICENSE_COUNT: 2000002019-03-04 15:24:15 - TPS_COUNT: SESSION_COUNT:
LICENSE_COUNT: 2000002019-03-04 15:25:45 - TPS_COUNT: SESSION_COUNT:
LICENSE_COUNT: 2000002019-03-04 15:27:15 - TPS_COUNT: SESSION_COUNT:
LICENSE_COUNT: 200000^C[root@pcrfclient01 ~]# grep 'sessionLimitOverloadProtection'/var/broadhop/checkout/pcrfclient01-1/*/var/broadhop/checkout/pcrfclient01-1/System-default-_GrTxALOLEeWR0MXs_g7BPA.xmi:sessionLimitOverloadProtection="400000">[root@pcrfclient01 ~]# session_cache_ops.sh --count|grep Total;dateTotal Number of Sessions : 475049Mon Mar 4 09:58:00 UTC 2019[root@pcrfclient01 ~]# grep 'sessionLimitOverloadProtection'/var/broadhop/checkout/pcrfclient01-1/*;date/var/broadhop/checkout/pcrfclient01-1/System-default-_GrTxALOLEeWR0MXs_g7BPA.xmi:sessionLimitOverloadProtection="400000">Mon Mar 4 09:58:03 UTC 2019[root@pcrfclient01 ~]# cat /etc/broadhop/qns.confQNS_COMMON_OPTS="-Dcom.broadhop.run.systemId=system-1-DapirouterContextPath=/ua/soap-Dapi.ua.context.path=/ua/backend-Dcom.broadhop.run.clusterId=cluster-scale-Dcom.broadhop.run.instanceId=$HOSTNAME-$QNS_INSTANCE-Dcom.broadhop.config.url=http://lbvip02/repos/run/-Dcom.broadhop.repository.credentials.isEncrypted=true-Dcom.broadhop.repository.credentials=qns-svn/3300901EA069E81CE29D4F77DE3C85FA@lbvip02-Dcom.broadhop.referencedata.local.location=/var/broadhop/checkout-DjmsRebalanceClients=true-Denable.compression=true-Denable.dictionary.compression=true-DuseZlibCompression=true-Dcom.broadhop.locking.autodiscovery=true-DlookasideThreshold=3-DcompressDebits-Dnetworkguard.tcp.local=eth0-DrefreshOnChange=true-DenableRuntimePolling=true-DdefaultNasIp=127.0.0.1-Dua.version.2.0.compatible=true-DsessionPadding=1200-DnodeHeartBeatInterval=9000-Dcom.mongodb.updaterIntervalMS=400-Dcom.mongodb.updaterConnectTimeoutMS=600-Dcom.mongodb.updaterSocketTimeoutMS=600-DdbSocketTimeout=1000-DdbSocketTimeout.balance=1000-DdbConnectTimeout=1200-DdbConnectTimeout.balance=1200-Dmongo.client.thread.maxWaitTime=1200-Dmongo.client.thread.maxWaitTime.balance=1200-Dstatistics.step.interval=1-Dmongo.connections.per.host=10-Dmongo.connections.per.host.balance=12-Dmongo.threads.allowed.to.wait.for.connection=12-Dmongo.threads.allowed.to.wait.for.connection.balance=12-DmaxLockAttempts=3
CPS Troubleshooting Guide, Release 19.4.099
Troubleshooting CPSTotal Number of Session Exceeding Allowed Limit

-DretryMs=3-DmessageSlaMs=1500-DshardPingLoopLength=3-DshardPingCycle=200-DshardPingerTimeoutMs=75-Ddiameter.default.timeout.ms=1500-DmemcacheClientTimeout=200-Dlocking.disable=true-Dcontrolcenter.disableAndsf=true-DenableQueueSystem=false-Dredis.keystore.connection.string=lb01:lb02:6379:6381-Dcom.cisco.balance.dbs=6-Dcom.cisco.balance.compression=true-Duse.pre.v11.service.resolution=false-Ddo.service.bundling.without.profiles=true-Dpolicystate.optimize.inserts=true-Dvirtualservice.optimize.crd=true-Duse.ldap.vs.evaluation.order=true-DPCRF_Name=TMOSITE1-Djdiameter.accept.unknown_desthost=true-Djdiameter.replace.unknown_desthost=true-DmaxHash=2-DdbSocketTimeout.cdrrep=1000-DdbConnectTimeout.cdrrep=1200-Dmongo.client.thread.maxWaitTime.cdrrep=1200-Dmongo.connections.per.host.cdrrep=10-Dmongo.threads.allowed.to.wait.for.connection.cdrrep=10-DdbSocketTimeout.cdr=1000-DdbConnectTimeout.cdr=1200-Dmongo.client.thread.maxWaitTime.cdr=1200-Dmongo.connections.per.host.cdr=10-Dmongo.threads.allowed.to.wait.for.connection.cdr=10-Dcisco.cdr.compression=true-Dcisco.cdr.disableBlocking=true-DapirouterContextPath=/ua/soap-Dua.context.path=/ua/backend-Dapi.ua.context.path=/ua/backend-Dredis.keystore.connectionTimeout=20000-DdbSocketTimeout.remoteBalance=1000-DdbConnectTimeout.remoteBalance=1200-Dmongo.client.thread.maxWaitTime.remoteBalance=1200-Dmongo.connections.per.host.remoteBalance=12-Dmongo.threads.allowed.to.wait.for.connection.remoteBalance=12-Dmessage.buffer.early.processing.time=5-Dlog.cdr.csv=true-Dcom.broadhop.cdr.dir=/var/broadhop/cdr-Dcom.broadhop.cdr.rollover.dir=/var/broadhop/cdr/rollover-DuseV1ClientId=true-DaddOnlysvcPlanAsVirtualService=true-Dsk.db.replicateSessionSharding=true-Dsk.db.audit.perShardTPS=1000"[root@pcrfclient01 ~]#
Solution: In Policy Builder, Session Limit Overload Protection must be configured such that there shouldbe buffer/considerable difference between the configured value and the total system capacity. In sessiondatabase, additional sessions are created beyond value configured in Session Limit Overload Protectionuntil the Policy Server (QNS) process checks the current session count of the system in the next interval.
Application Bundles or Plugins Unable to Start After Site RecoveryIssue: Diagnostics script output displays "application bundle or plugins failed to start".
CPS Troubleshooting Guide, Release 19.4.0100
Troubleshooting CPSApplication Bundles or Plugins Unable to Start After Site Recovery

Solution: During the start or initialization of application, it loads the configured data from the Policy Builderand brings up the bundles or plugins. The following table lists reasons and corresponding actions for solvingthe issue.
SolutionReason
Correct the wrongly configured details in the PolicyBuilder.
If the data is not configured properly in Policy Builderfor specific feature plugin then the application failsto bring-up or start the bundle.
Correct the database configuration details and publishthe changes.
Database details are incorrect in Policy Builderconfiguration.
Verify if the firewalls are blocking the connections.If the firewalls are blocking the connections, stop thefirewall.
Verify database sessionmgr VMs are down. If thedatabase sessionmgr VMs are down, bring-up thereplica-set members.
Application fails to connect to the configured databasedue to network issues.
Restart the qns process.
If the application still fails to connect to the database,open the published configuration in Policy Builderand publish the same (without any change).
Application fails to connect to the configured databasedue to replica-set members not available (PRIMARYmight not available during the recovery procedure).
Configure the missing features in Policy Builder andpublish the changes.
Application fails to connect to the configured databaseif configuration for some required features is not donein Policy Builder.
Troubleshoot REDIS
Troubleshooting REDIS Reporting DatabaseThe following errors are outputted to the logs if there is an issue regardless of log level:
Table 8: Errors Outputted to Logs
SourceLog Level
Policy Server (QNS)ERROR
Unknown message received, no type information {cdrSession}
Unable to determine message type for message {message}
Errors specific to converting the records to bytes and submitting to REDIS
Exception in creating byte array output stream: {exception}
Exception in closing ObjectOutputStream: {exception}
CPS Troubleshooting Guide, Release 19.4.0101
Troubleshooting CPSTroubleshoot REDIS

SourceLog Level
Exception in closing ByteArrayOutputStream: {exception}
Policy Director (LB)ERROR
log.error("ERROR: dispatchMsg from Redis to reporting: Deserialization problem: ", ex);
ERROR Unable to create temp file: {FileName} for collection {Collection}
File handle not found for collection {collectionName}
Unable to create temp file: { tmpFileName } for collection {collectionName }
Throws broad hop exception
Exception during cleanup and removal of the oldest files from the directory {finalOutputDirectory}
Exception while closing files: {exception}
Unable to close properly output file for collection { collectionName }
To troubleshoot reporting issues, logging levels, in most cases, must be turned up. To turn up the logginglevel on one Policy Server (QNS) node rather than system wide do the following:
Step 1 Modify the logging levels in /etc/broadhop/logback.xml on one Policy Server (QNS) node if reporting doesnot occur.
<logger name="com.broadhop.policyintel" level="trace" />
<logger name="com.broadhop.reporting" level="trace" />
Step 2 Set the logging levels to TRACE. This shows the records being submitted and read by REDIS, and those records beingsubmitted to CSV files.
• Changing to TRACE on a Policy Server (QNS) node shows all reporting records being submitted to REDIS.
• Changing to TRACE on an Policy Director (LB) node shows all reporting records being read from REDIS andwritten to CSV files.
Table 9: Logging Levels
SourceLog Level
Policy Server (QNS)TRACE
Submitting message to redis: [record]
Example:
TRACE c.b.reporting.impl.dao.ReportingDao - Submitting message to redis:{timestamp=Tue May 24 22:50:13 MDT2016, type=cdr-2, sessionId=John_Doe, ….
Policy Director (LB)TRACE
CsvReplicationRunner - Writing to file [record]
CPS Troubleshooting Guide, Release 19.4.0102
Troubleshooting CPSTroubleshooting REDIS Reporting Database

SourceLog Level
Example:
22:50:13.775 [message-cluster-recv-queue-0] TRACE c.b.r.i.r.csv.CsvReplicationRunner - Writing to file [John_Doe,2122.3232.3434, 20160524105013000615123, Tue May 24 22:50:13 MDT 2016, Tue May 24 22:50:13 MDT 2016,cdr4]
Step 3 Change the node back to the original levels after troubleshooting.
This creates a lot of logging if TPS is high and can cause system performance issues.Caution
Reporting does not occur
Step 1 Restart a Policy Server (QNS) node. If the production environment is set to INFO, the following logs appear in the outputon startup.
Typical logback.xml default setting for production:<logger name="com.broadhop.policyintel" level="info" /><logger name="com.broadhop.reporting" level="info" />
Step 2 Examine one Policy Server (QNS) node, restart the Policy Server (QNS) service on that node and look for the followinglogs for success or reporting start up issues:
Table 10: Log Information
SourceLog Level
Policy Director (LB)INFO
ReplicationRunner - ReplicationRunner: Redis: Added Listener: {table name} {replication class}
Example:
INFO c.b.r.i.r.ReplicationRunner - ReplicationRunner: Redis: Added Listener: cdr-1 classcom.broadhop.refdata.policyintel.impl.CsvReplicationImpl
Writing out CSV files for {table name} to {output directory location}
Example:
INFO CsvReplicationRunner - Writing out CSV files for cdr-1 to /var/tmp/csv1
Writing out temporary CSV files for {table name} to {tmp output directory location}
Example:
INFO CsvReplicationRunner - Writing out temporary CSV files for cdr-1 to /var/tmp/csv1/tmp
Policy Server (QNS)INFO
CPS Troubleshooting Guide, Release 19.4.0103
Troubleshooting CPSReporting does not occur

SourceLog Level
Starting replication for destination {collectionName}
Example:
INFO c.b.r.i.r.ReplicationManager - Starting replication for destination cdr-1
Defining cdrs reporting queue with queue capacity : {cdrsQueueCapacity} and semaphore permits :{cdrsSemaphorePermits}
Example:
Defining cdrs reporting queue with queue capacity : 2000 and semaphore permits : 2000
Policy Server (QNS)ERROR
Unable to set date format for output CSV. Pattern is not valid: [Pattern]
Example:
ERROR CsvReplicationRunner Unabled to set date format for output CSV. Pattern is not valid:yyyyyMMddhhmmssSSSSSS
No reporting configuration found (Check PB reporting configuration if you see this error)
Example:
No reporting configuration found
REDIS does not receive or push out CDR records
Step 1 Check the redisTopology.ini file to locate the primary location of the REDIS database:a) /etc/broadhop/qns.conf for -DredisTopologyFile=[location]b) If parameter is absent the default location is /etc/broadhop/redisTopology.ini
redisTopology.ini example:policy.redis.qserver.1=lb02:6379policy.redis.qserver.2=lb01:6379policy.local-control-plane.redis.1=lb02:6379
Step 2 Go to qserver.1 location, in this case lb02.a) Verify that REDIS is running:
monit status redis
b) Login to REDIS using the following commands:redis-clilb02:6379> monitor
CPS Troubleshooting Guide, Release 19.4.0104
Troubleshooting CPSREDIS does not receive or push out CDR records
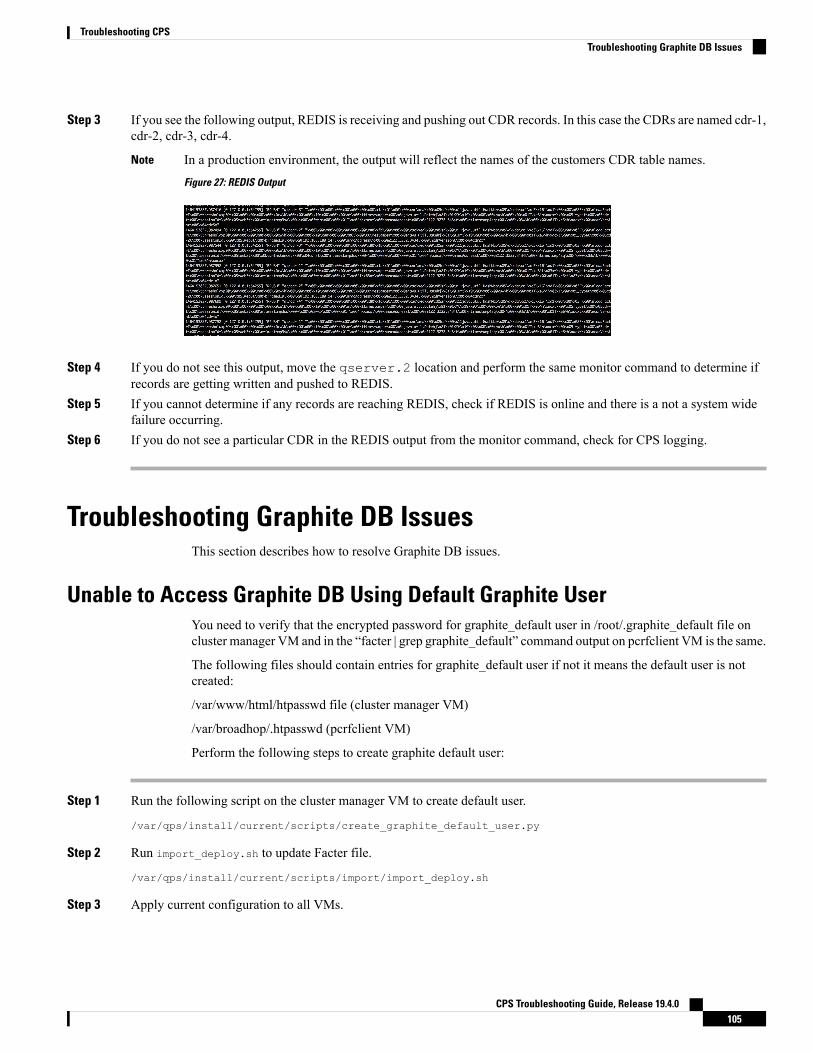
Step 3 If you see the following output, REDIS is receiving and pushing out CDR records. In this case the CDRs are named cdr-1,cdr-2, cdr-3, cdr-4.
In a production environment, the output will reflect the names of the customers CDR table names.Figure 27: REDIS Output
Note
Step 4 If you do not see this output, move the qserver.2 location and perform the same monitor command to determine ifrecords are getting written and pushed to REDIS.
Step 5 If you cannot determine if any records are reaching REDIS, check if REDIS is online and there is a not a system widefailure occurring.
Step 6 If you do not see a particular CDR in the REDIS output from the monitor command, check for CPS logging.
Troubleshooting Graphite DB IssuesThis section describes how to resolve Graphite DB issues.
Unable to Access Graphite DB Using Default Graphite UserYou need to verify that the encrypted password for graphite_default user in /root/.graphite_default file oncluster manager VM and in the “facter | grep graphite_default” command output on pcrfclient VM is the same.
The following files should contain entries for graphite_default user if not it means the default user is notcreated:
/var/www/html/htpasswd file (cluster manager VM)
/var/broadhop/.htpasswd (pcrfclient VM)
Perform the following steps to create graphite default user:
Step 1 Run the following script on the cluster manager VM to create default user.
/var/qps/install/current/scripts/create_graphite_default_user.py
Step 2 Run import_deploy.sh to update Facter file.
/var/qps/install/current/scripts/import/import_deploy.sh
Step 3 Apply current configuration to all VMs.
CPS Troubleshooting Guide, Release 19.4.0105
Troubleshooting CPSTroubleshooting Graphite DB Issues

/var/qps/install/current/scripts/upgrade/reinit.sh
Grafana UI displays Continuous Prompt for Username and PasswordGrafana UI displays continuous prompt for user credentials for any of the following reasons:
1. No user who is configured in graphite data source.
2. Current configured user in graphite data source does not have access to Graphite DB.
To confirm the cause behind the display of the continuous prompt for user credentials, you need to verify thatthe configured Graphite/Grafana user exits in /var/broadhop/.htpasswd file.
If the user does not exist, ensure that first graphite user is created using step that is mentioned inGRAPHITE/GRAFANA NEW USER CREATION and update graphite data source accordingly.
Graphite Queries to Fetch Diameter StatisticsCase:Graphite queries to fetch Diameter statistics (one particular chart alone) is not working after performingchassis down scenario.
Issue: Issue has been observed in retrieving the diameter statistics after rebooting all the VMs in the setup asa part of chassis down scenario. It has been observed that bulk statistics and WSP files are getting generatedin Graphite database directories.
Impact: Graphite queries are not yielding any results.
Root Cause Analysis (RCA): During reboot of VM (not all the time), some of the WSP files are gettingcorrupted/ broken.
Workaround:
1. Confirm by switching the Grafana page from one pcrfclient to other pcrfclient VM to identify in whichserver the broken WSP files are present.
• By default, the Grafana fetches the data from pcrfclient01 VM. To check the data from pcrfclient02VM, use the steps mentioned.
• If public IP address is assigned to pcrfclient02 VM, then fetch the graph from pcrfclient02 IP (insteadof lbvip01), else stop httpd service on pcrfclient01 VM (/usr/bin/systemctl stop httpd) andverify the data from Grafana. Once verified, start httpd service again on pcrfclient01 VM and verifythe URLs.
CPS Troubleshooting Guide, Release 19.4.0106
Troubleshooting CPSGrafana UI displays Continuous Prompt for Username and Password

2. Once determined, take the backup of the Grafana data (by moving the content to some other location)from the affected server and sync Grafana data from unaffected server to make it working. Assume ifpcrfclient01 has corrupted WSP files, refer the following steps to sync Grafana data from pcrfclient02VM to pcrfclient01 VM.
1. Login to pcrfclient01 and take the backup of Grafana data (/var/lib/carbon) by moving thecontent to some other location.ssh pcrfclient01monit stop carbon-aggregatormonit stop carbon-aggregator-bmonit stop carbon-cachemonit stop carbon-cache-bmonit stop carbon-cache-cmv /var/lib/carbon/* “PathForFilesToBeMoved”
2. Synchronize the Grafana data from pcrfclient02 (healthy) VM to pcrfclient01(affected) VM.rsync -a root@pcrfclient02:/var/lib/carbon /var/libmonit start carbon-aggregatormonit start carbon-aggregator-bmonit start carbon-cachemonit start carbon-cache-bmonit start carbon-cache-c
Grafana Statistics Missing after Stopping Carbon CacheCase: Observed that some Grafana statistics are missing when stopping one of the carbon_cache.
Same behavior is observed when stopping carbon-relay.[root@pcrfclient01 ~]# monit stop carbon-aggregator-b[root@pcrfclient01 ~]# monit status carbon-aggregator-bMonit 5.25.1 uptime: 1d 1h 14m
Process 'carbon-aggregator-b'status Not monitoredmonitoring status Not monitoredmonitoring mode activeon reboot startdata collected Tue, 12 Mar 2019 08:19:48
Solution: For any graph in Grafana, randomly if you see no statistics, then one reason can be that carbon-cacheprocess is not running on pcrfclient VMs.
Check if carbon-cache, carbon-cache@b, carbon-cache@c processes are running using systemctl command.
For example, systemctl status carbon-cache@b
SNMP Traps and Key Performance Indicators (KPIs)
Full (HA) Setup
Step 1 Check whether snmpd service is running on all VMs. If the service is not running then start it by executing the command:
CPS Troubleshooting Guide, Release 19.4.0107
Troubleshooting CPSGrafana Statistics Missing after Stopping Carbon Cache

monit start snmpd
Step 2 Check whether snmptrapd is running on policy director (lb) VMs. If the service is not running then start it by executingthe command:
monit start snmptrapd
Step 3 On pcrfclient01:a) Verify whether /etc/broadhop/<server_name>/snmp/manager.xml file has the following content. If
the content is not present, add the following content to the file:
server_name details can be found from /etc/broadhop/server file.<manager-list><manager><address>localhost</address><port>162</port><version>1</version>
</manager></manager-list>
Note
b) Execute the command syncconfig.sh so that the change done in Step 3.a, on page 108 gets synchronized to all VMs.c) Execute the command restartall.sh to restart all policy server (qns) processes.d) Verify whether service monit is running or not. If the service is not running then start it by executing the command:
service monit start
If monit in not installed on OAM (pcrfclient) VMs, then you need to get the monit rpm and install it in onall OAM (pcrfclient) VMs.
Note
e) Verify whether monit.conf file has entries of check_program executing different traps generating script. If theentries are not present, then get the latest monit.conf file for OAM (pcrfclient) VMs and update it on all OAM(pcrfclient) VMs setup.
f) Restart monit service.
service monit start
Step 4 On policy director (lb) VMs:a) Verify whether /etc/hosts file has the entry as corporate_nms_ip <ip_address> .
<ip_address> is the NMS address.Note
b) Verify whether service monit is running or not, If the service is not running then start it by executing the command:
service monit start
If monit in not installed on policy director (lb) VMs then you need to get the monit rpm and install it onall policy director (lb) VMs.
Note
c) Verify whether monit.conf file has entries of check_program executing different traps generating script. If theentries are not present then get the latest monit.conf file for policy director (lb) VMs and update it on all policydirector (lb) VMs,
d) Restart monit service.
service monit start
CPS Troubleshooting Guide, Release 19.4.0108
Troubleshooting CPSFull (HA) Setup

All-in-one (AIO) Setup
Step 1 Verify whether snmpd and snmptrapd services are running. If the services are not running, then start them by executingthe following commands:
monit start snmpd
monit start snmptrapd
Step 2 Verify whether /etc/broadhop/<server_name>/snmp/manager.xml file has below content. If the contentis not present, add the following content to the file:
server_name details can be found from /etc/broadhop/server file.Note
<manager-list><manager><address>localhost</address><port>162</port><version>1</version></manager></manager-list>
Step 3 Execute restartall.sh command to restart all Policy Server (qns) processes.Step 4 Verify whether /etc/hosts has entry as corporate_nms_ip <ip_address>.
<ip_address> is the NMS address.Note
Step 5 Verify whether service monit is running or not. If the service is not running then start it by executing the command:
service monit start
Testing Traps Generated by CPSThe following tables describe the SNMP notifications (traps) generated by CPS as well as the procedures thatcan be used to test their operation.
For a complete list of CPS traps, including detailed descriptions, refer to the CPS SNMP and Alarms Guide,Release 9.1.0 and prior releases or CPS SNMP, Alarms and Clearing Procedures Guide, Release 10.0.0 andlater releases.
CPS Troubleshooting Guide, Release 19.4.0109
Troubleshooting CPSAll-in-one (AIO) Setup

Component Notifications
Table 11: Component Notifications
Procedure to TestAlarm Name
1. In /etc/snmp/snmpd.conf, set "disk / 90%". (So when disk remaining is 90%i.e. Disk occupied is 10%, alarm is generated.)
2. Restart the snmpd process.
monit restart snmpd
3. Verify the generated alarm on NMS server and /var/log/snmp/trap of activePolicy Director (lb).
4. Trap have messages like :dskErrorMsg.1 = STRING: /: less than 90% free (= 100%)
DiskFull
1. In /etc/snmp/snmpd.conf, set "disk / X%". (X should just less than actualremaining space. For example, if drive / is 25% full, put 74% as value of X).
2. Restart the snmpd process.
monit restart snmpd
3. Now dump a big file which consumes at least 2-3 % space on drive /. This generatesdiskful alarm first.
4. Delete this file. This generates clear alarm.
5. Verify the generated alarm on NMS server and /var/log/snmp/trap of activePolicy Director (lb).
DiskFull
1. In /etc/snmp/snmpd.conf, set "load 1 1 1". (first digit corresponds to average1 min load. Second digit is for 5 minutes average load. Third is for 15 mins. Whenit crosses 1 %, alarm is generated.)
2. Restart the snmpd process.
monit restart snmpd
3. Verify the generated alarm on NMS server and /var/log/snmp/trap of activePolicy Director (lb).
4. Trap have message like 1 min Load Average too high (= 1.41)
HighLoadAlert
1. In /etc/snmp/snmpd.conf, set "load 1 1 1". (first digit corresponds to average1 min load. Second digit is for 5 minutes average load. Third is for 15 mins. Whenload is below value (as mentioned 1 % ), clear alarm is generated.)
2. Restart the snmpd process.
monit restart snmpd
3. Verify the generated alarm on NMS server and /var/log/snmp/trap of activePolicy Director (lb).
HighLoadClear
CPS Troubleshooting Guide, Release 19.4.0110
Troubleshooting CPSComponent Notifications

Procedure to TestAlarm Name
1. swapoff -a
This command disables all swap areas.
Use the top command to see that the swap has been disabled:
“Swap: 0k total”.
2. Verify the generated alarm on NMS server and /var/log/snmp/trap of activePolicy Director (lb): “QNS component notification Running out of swap space”.
LowSwapAlert
1. swapon -a
This command enables all swap areas again.
The top command output shows the correct swap memory size (not 0k total). Theclear trap gets generated if swap alarms was generated earlier.
2. Verify the generated alarm on NMS server and /var/log/snmp/trap of activepolicy director (lb): “QNS component notification Swap space recovered”.
LowSwapClear
1. ifconfig <interface_name> down (For example, ifconfig eth2 down)
2. Within 1 minute interval interface down trap gets generated.
3. Verify the generated alarm on NMS server and /var/log/snmp/trap of activepolicy director (lb).
Link Down
1. ifconfig <interface_name> up (For example, ifconfig eth2 up)
2. Within 1 minute interval interface up trap gets generated
3. Verify the generated alarm on NMS server and /var/log/snmp/trap of activepolicy director (lb).
Link Up
1. In output of top command find out the current free RAM memory value.
2. Update snmpd.conf file monitor entry for Low Memory Alert to have value justless than the current free RAM memory value.
3. Restart the snmpd process.
monit restart snmpd
4. Do some activity on VM such as running some command or starting some processso that free RAM value goes below the configured value.
5. The low memory alert alarm gets generated within a minute interval.
6. Verify the generated alarm on NMS server and /var/log/snmp/trap of activepolicy director (lb).
LowMemoryAlert
CPS Troubleshooting Guide, Release 19.4.0111
Troubleshooting CPSComponent Notifications

Procedure to TestAlarm Name
1. In output of top command find out the current free RAM memory value.
2. Update snmpd.conf file monitor entry for Low Memory Clear to have value justmore than the current free RAM memory value.
3. Restart the snmpd process.
monit restart snmpd
4. Kill some processes on VM so that free RAM memory value is more than theconfigured value.
5. The low memory clear alarm gets generated within a minute interval.
6. Verify the generated alarm on NMS server and /var/log/snmp/trap of activepolicy director (lb).
LowMemoryClear
1. On the Load Balancer VMs, issue the following command to stop the corosyncprocess:
monit stop corosync
2. Within 5 minutes of interval process down trap is generated.
3. Verify the generated alarm on NMS server and /var/log/snmp/trap of activepolicy director (lb): “QNS component notification corosync process is down”.
ProcessDown
1. Issue the following command to restart the corosync process:
monit start corosync
2. Within 5 minutes of interval process up trap is generated.
3. Verify the generated alarm on NMS server and /var/log/snmp/trap of activepolicy director (lb):“QNS component notification corosync process is up”.
ProcessUp
1. Change the threshold value for the CPU usage alert (cpu_usage_alert_threshold) toa lower value. The default value is 80 percent.
Refer to theCPS SNMP, Alarms and Clearing Procedures Guide for steps to configurethis threshold.
2. The system generates an Alert trap whenever the CPU usage of the VM goes abovebe higher than this value.
3. Verify the generated alarm on NMS server and /var/log/snmp/trap of activepolicy director (lb).
HIGH CPUUSAGE Alert
CPS Troubleshooting Guide, Release 19.4.0112
Troubleshooting CPSComponent Notifications

Procedure to TestAlarm Name
1. Change the clear threshold value for CPU usage (cpu_usage_clear_threshold) to ahigher value. The default value is 40 percent.
Refer to theCPS SNMP, Alarms and Clearing Procedures Guide for steps to configurethis threshold.
2. The system generates a Clear trap whenever the CPU usage of the VM drops belowthis threshold value. It is generated only when a High CPUUsage Alert was generatedearlier.
3. Verify the generated alarm on NMS server and /var/log/snmp/trap of activepolicy director (lb).
HIGH CPUUSAGE Clear
1. Configure critical file monitoring configuration on VMWare/OpenStack. For moreinformation, refer toCPS Installation Guide for VMware andCPS Installation Guidefor OpenStack..
2. Modify/change attributes in any monitored file.
3. The system generates a trap as per SNMP configuration (SNMP v2c/v3) on lbvip02VM and similar trap is forwarded to NMS server configured.
Critical FileOperation Alert
Application Notifications
Table 12: Application Notifications
Procedure to TestAlarm Name
1. Kill the memcached process running on active policy director (lb).
2. Within 5 minutes of interval memcached Connect Error trap getsgenerated from policy server (QNS) VMs.
3. Verify the generated alarm on NMS server and/var/log/snmp/trap of active policy director (lb).
MemcachedConnectError
Take the configuration backup before applying theprocedure.
Note
1. Remove the balance configuration from Policy Builder and publishthe changes.
2. Restart the policy server (QNS) process.
3. Within 5 minute of interval ApplicationStartError trap getsgenerated on active policy director (lb).
4. Verify the generated alarm on NMS server and/var/log/snmp/trap of active policy director (lb).
ApplicationStartError
CPS Troubleshooting Guide, Release 19.4.0113
Troubleshooting CPSApplication Notifications

Procedure to TestAlarm Name
1. Create the license having small number of Usage Threshold limit.
2. Install the above created license on setup.
3. Restart all policy server (QNS) processes.
4. Send multiple request so that it crosses the threshold limit.
5. The License Usage Threshold Exceeded alarm gets generated.
6. Verify the generated alarm on NMS server and/var/log/snmp/trap of active policy director (lb).
License Usage Threshold Exceeded
1. Create the license having small number of SessionUsage Thresholdlimit.
2. Install the above created license on setup.
3. Restart all policy server (QNS) processes.
4. Send multiple request so that it crosses session threshold limit.
5. For the next request after the limit over LicenseSessionCreationalarm gets generated.
6. Verify the generated alarm on NMS server and/var/log/snmp/trap of active policy director (lb).
LicensedSessionCreation
1. Copy the license of pcrfclient02 on pcrfclient01 or create a licensefor pcrfclient02 and install it on pcrfclient01.
2. Restart lmgrd service.
3. Restart the policy server (QNS) process.
4. Within 5minutes of interval the License invalid trap gets generated.
5. Verify the generated alarm on NMS server and/var/log/snmp/trap of active policy director (lb).
InvalidLicense
1. Configure some wrong policy in Policy Builder under the Policiestab.
2. Publish the configuration.
3. restartall.sh.
4. Last policy configuration failed with the following message:xxxtrap gets generated.
5. Verify the generated alarm on NMS server and/var/log/snmp/trap of active policy director (lb).
PolicyConfiguration
CPS Troubleshooting Guide, Release 19.4.0114
Troubleshooting CPSApplication Notifications

Procedure to TestAlarm Name
1. Create the invalid blueprint (java code having syntax error) inPolicy Builder under the Policies tab.
2. Assign the created blueprint to some policies.
3. Publish the configuration.
4. Restart all policy server (QNS) processes.
5. PoliciesNotConfigured trap gets generated.
6. Verify the generated alarm on NMS server and/var/log/snmp/trap of active policy director (lb).
PoliciesNotConfigured
1. Make a seagull diameter call.
2. After seagull script terminate it generates the diameter peer downtrap.
3. Verify the generated alarm on NMS server and/var/log/snmp/trap of active policy director (lb).
DiameterPeerDown
1. Integrate CPS with two Seagull/SITE Instances.
2. Make a seagull diameter call.
3. Simultaneously make a diameter call from another Seagull/SITEInstance.
4. After two Seagull/SITE scripts terminate it generates theDiameterAllPeersDown trap.
5. Verify the generated alarm on NMS server and/var/log/snmp/trap of active policy director (lb).
DiameterAllPeersDown
1. Cat /etc/broadhop/mongoConfig.cfg.
2. If there are two or more sessionmgr ports configured as replica setthen find out the one acting as a primary member usingrs.isMaster().primary.
3. Shutdown the primary instance of sessionmgr.
4. Within 1 minute of interval HA Failover trap gets generated.
5. Verify the generated alarm on NMS server and/var/log/snmp/trap of active policy director (lb).
HA_Failover
CPS Troubleshooting Guide, Release 19.4.0115
Troubleshooting CPSApplication Notifications

Procedure to TestAlarm Name
1. Cat /etc/broadhop/mongoConfig.cfg.
2. There should be primary and secondarymember set for each replicaset. Find the current active sessionmgr instance of a replica setusing rs.isMaster().primary.
3. Shutdown all sessionmgr instances of active sessionmgr instanceset.
4. Within 1 minute of interval Geo Failover trap gets generated.
5. Verify the generated alarm on NMS server and/var/log/snmp/trap of active policy director (lb).
GR_Failover
1. Get all members of replica set from/etc/broadhop/mongoconfig.cfg.
2. Go to each sessionMgr of a replica set and stop the sessionmgrservice or shutdown the sessionmgr VM.
3. Within 5 minutes of interval All replicas of DB Down trap getsgenerated.
4. Verify the generated alarm on NMS server and/var/log/snmp/trap of active policy director (lb).
All DB Member of replica Down
1. Perform the steps above to generate the All DBMember of replicaDown trap.
2. Once that trap is generated, start the session manager service orbring up the sessionmanager VM.
3. Within 5 minutes of interval All DB Member of replica Up trapgets generated.
4. Verify the generated alarm on NMS server and/var/log/snmp/trap of active policy director (lb).
All DB Member of replica Up
CPS Troubleshooting Guide, Release 19.4.0116
Troubleshooting CPSApplication Notifications
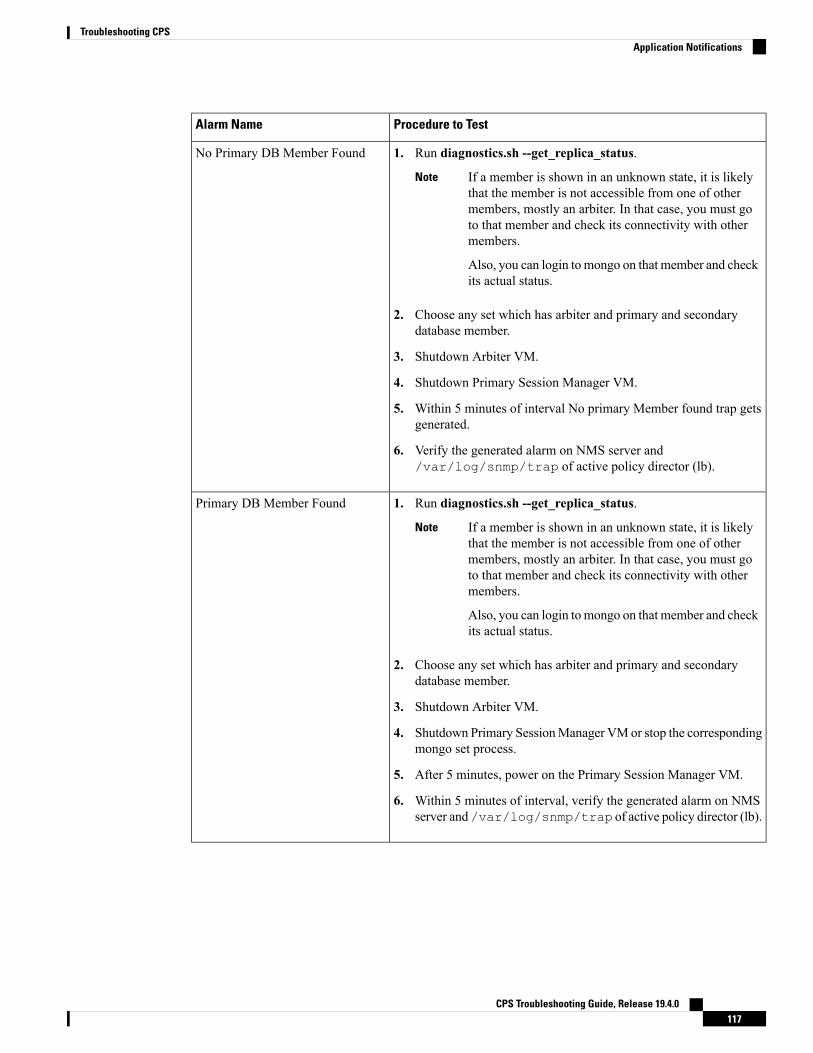
Procedure to TestAlarm Name
1. Run diagnostics.sh --get_replica_status.
If a member is shown in an unknown state, it is likelythat the member is not accessible from one of othermembers, mostly an arbiter. In that case, you must goto that member and check its connectivity with othermembers.
Also, you can login to mongo on that member and checkits actual status.
Note
2. Choose any set which has arbiter and primary and secondarydatabase member.
3. Shutdown Arbiter VM.
4. Shutdown Primary Session Manager VM.
5. Within 5 minutes of interval No primary Member found trap getsgenerated.
6. Verify the generated alarm on NMS server and/var/log/snmp/trap of active policy director (lb).
No Primary DB Member Found
1. Run diagnostics.sh --get_replica_status.
If a member is shown in an unknown state, it is likelythat the member is not accessible from one of othermembers, mostly an arbiter. In that case, you must goto that member and check its connectivity with othermembers.
Also, you can login to mongo on that member and checkits actual status.
Note
2. Choose any set which has arbiter and primary and secondarydatabase member.
3. Shutdown Arbiter VM.
4. Shutdown Primary SessionManager VMor stop the correspondingmongo set process.
5. After 5 minutes, power on the Primary Session Manager VM.
6. Within 5 minutes of interval, verify the generated alarm on NMSserver and/var/log/snmp/trap of active policy director (lb).
Primary DB Member Found
CPS Troubleshooting Guide, Release 19.4.0117
Troubleshooting CPSApplication Notifications

Procedure to TestAlarm Name
1. Cat /etc/broadhop/mongoConfig.cfg.
2. Shutdown any of the sessionmgr VM listed in the configurationas database member of replica set.
3. Within 5 minutes of interval database down trap gets generated.
4. Verify the generated alarm on NMS server and/var/log/snmp/trap of active policy director (lb).
DB Member Down
1. Perform the steps above to generate the DB Member Down trap.
2. After 5 minutes, power on the sessionmgr VM (the secondarydatabase) that was shutdown earlier.
3. Within 5 minutes of interval, verify the generated alarm on NMSserver and/var/log/snmp/trap of active policy director (lb).
DB Member Up
1. Cat /etc/broadhop/mongoConfig.cfg.
2. Shutdown any of the Arbiter VMs listed in the configuration.
3. Within 5 minutes of interval Arbiter down trap gets generated.
4. Verify the generated alarm on NMS server and/var/log/snmp/trap of active policy director (lb).
Arbiter Down
1. Perform the steps above to generate the Arbiter Down trap.
2. After 5 minutes, power on the Arbiter VM that was shutdownearlier.
3. Within 5 minutes of interval, verify the generated alarm on NMSserver and/var/log/snmp/trap of active policy director (lb).
Arbiter Up
CPS Troubleshooting Guide, Release 19.4.0118
Troubleshooting CPSApplication Notifications
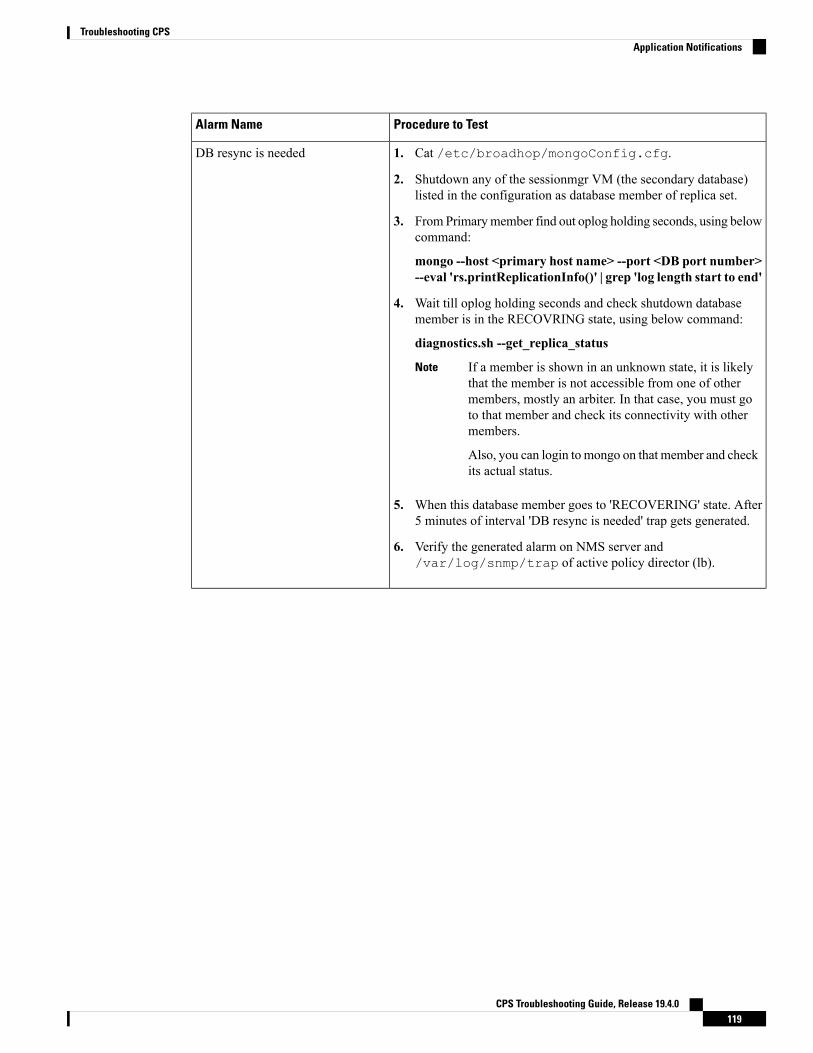
Procedure to TestAlarm Name
1. Cat /etc/broadhop/mongoConfig.cfg.
2. Shutdown any of the sessionmgr VM (the secondary database)listed in the configuration as database member of replica set.
3. From Primarymember find out oplog holding seconds, using belowcommand:
mongo --host <primary host name> --port <DB port number>--eval 'rs.printReplicationInfo()' | grep 'log length start to end'
4. Wait till oplog holding seconds and check shutdown databasemember is in the RECOVRING state, using below command:
diagnostics.sh --get_replica_status
If a member is shown in an unknown state, it is likelythat the member is not accessible from one of othermembers, mostly an arbiter. In that case, you must goto that member and check its connectivity with othermembers.
Also, you can login to mongo on that member and checkits actual status.
Note
5. When this database member goes to 'RECOVERING' state. After5 minutes of interval 'DB resync is needed' trap gets generated.
6. Verify the generated alarm on NMS server and/var/log/snmp/trap of active policy director (lb).
DB resync is needed
CPS Troubleshooting Guide, Release 19.4.0119
Troubleshooting CPSApplication Notifications

Procedure to TestAlarm Name
1. Power on the sessionmgr VM (the secondary database) that wasshutdown early.
2. Stop the sessionmgr mongod process, using below command(XXXXX change to database port number).
/usr/bin/systemctl stop sessionmgr-XXXXX
3. Clear data directory of that sessionmgr (specify correct datadirectory path).
\rm -fr <data directory path of that mongod>
4. Start the sessionmgr mongod process, using below command(XXXXX change to database port number).
/usr/bin/systemctl start sessionmgr-XXXXX
5. When this database member goes to 'SECONDARY' state. After5 minutes of interval 'DB resync is not needed' trap gets generated,using below command:
diagnostics.sh --get_replica_status
If a member is shown in an unknown state, it is likelythat the member is not accessible from one of othermembers, mostly an arbiter. In that case, you must goto that member and check its connectivity with othermembers.
Also, you can login to mongo on that member and checkits actual status.
Note
6. Verify the generated alarm on NMS server and/var/log/snmp/trap of active policy director (lb).
DB resync is not needed
1. Cat /etc/broadhop/mongoConfig.cfg.
2. Shutdown any of the Config Server VMs listed in the configuration.
3. Within 5 minutes of interval, Config Server Down trap getsgenerated.
4. Verify the generated alarm on NMS server and/var/log/snmp/trap of active policy director (lb).
Config Server Down
1. Perform the steps above to generate the Config Server Down trap.
2. After 5 minutes, power on the Config Server VM that wasshutdown earlier.
3. Within 5 minutes of interval, verify the generated alarm on NMSserver and/var/log/snmp/trap of active policy director (lb).
Config Server Up
CPS Troubleshooting Guide, Release 19.4.0120
Troubleshooting CPSApplication Notifications
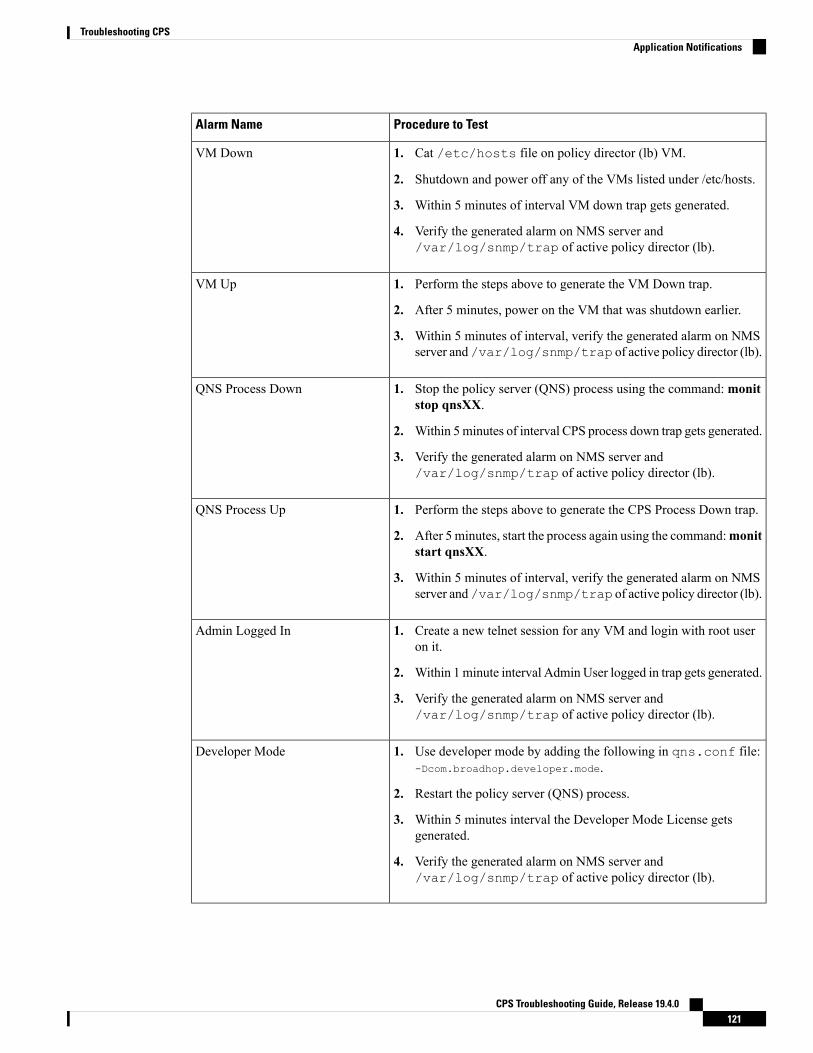
Procedure to TestAlarm Name
1. Cat /etc/hosts file on policy director (lb) VM.
2. Shutdown and power off any of the VMs listed under /etc/hosts.
3. Within 5 minutes of interval VM down trap gets generated.
4. Verify the generated alarm on NMS server and/var/log/snmp/trap of active policy director (lb).
VM Down
1. Perform the steps above to generate the VM Down trap.
2. After 5 minutes, power on the VM that was shutdown earlier.
3. Within 5 minutes of interval, verify the generated alarm on NMSserver and/var/log/snmp/trap of active policy director (lb).
VM Up
1. Stop the policy server (QNS) process using the command:monitstop qnsXX.
2. Within 5minutes of interval CPS process down trap gets generated.
3. Verify the generated alarm on NMS server and/var/log/snmp/trap of active policy director (lb).
QNS Process Down
1. Perform the steps above to generate the CPS Process Down trap.
2. After 5 minutes, start the process again using the command:monitstart qnsXX.
3. Within 5 minutes of interval, verify the generated alarm on NMSserver and/var/log/snmp/trap of active policy director (lb).
QNS Process Up
1. Create a new telnet session for any VM and login with root useron it.
2. Within 1 minute interval Admin User logged in trap gets generated.
3. Verify the generated alarm on NMS server and/var/log/snmp/trap of active policy director (lb).
Admin Logged In
1. Use developer mode by adding the following in qns.conf file:-Dcom.broadhop.developer.mode.
2. Restart the policy server (QNS) process.
3. Within 5 minutes interval the Developer Mode License getsgenerated.
4. Verify the generated alarm on NMS server and/var/log/snmp/trap of active policy director (lb).
Developer Mode
CPS Troubleshooting Guide, Release 19.4.0121
Troubleshooting CPSApplication Notifications

Procedure to TestAlarm Name
1. Perform the steps above to generate the Developer Mode Licensetrap.
2. Now remove the following line from the qns.conf file:-Dcom.broadhop.developer.mode.
3. Restart the policy server (QNS) process.
4. Within 5 minutes of interval, verify the generated alarm on NMSserver and/var/log/snmp/trap of active policy director (lb).
Developer Mode Clear
1. Start policy server (QNS).
2. Start Messaging Load (CCR-I,CCR-U,CCR-T) scenario at highTPS.
3. The trap will be seen if message sending over socket betweenpolicy director (lb) and policy server (QNS) fails (Due to socketsend errors). For subsequent failures there is no further trap raised.
4. Verify the generated alarm on NMS server and/var/log/snmp/trap of active policy director (lb).
ZeroMQConnectionError
1. This trap will be sent when message send on socket succeeds afterthe prior failure.
2. Verify the generated alarm on NMS server and/var/log/snmp/trap of active policy director (lb).
ZeroMQConnectionError Clear
1. Login to active policy director (lb) VM.
2. Run command ifconfig eth1:0 down.
3. VirtualInterface Down trap with the interface name gets generated.
4. You can see this trap on NMS server.
VirtualInterfaceDown
1. Login to active policy director (lb) VM.
2. Run command ifconfig eth1:0 up.
3. VirtualInterface Up trap with the interface name gets generated.
4. You can see this trap on NMS server.
VirtualInterfaceUp
CPS Troubleshooting Guide, Release 19.4.0122
Troubleshooting CPSApplication Notifications
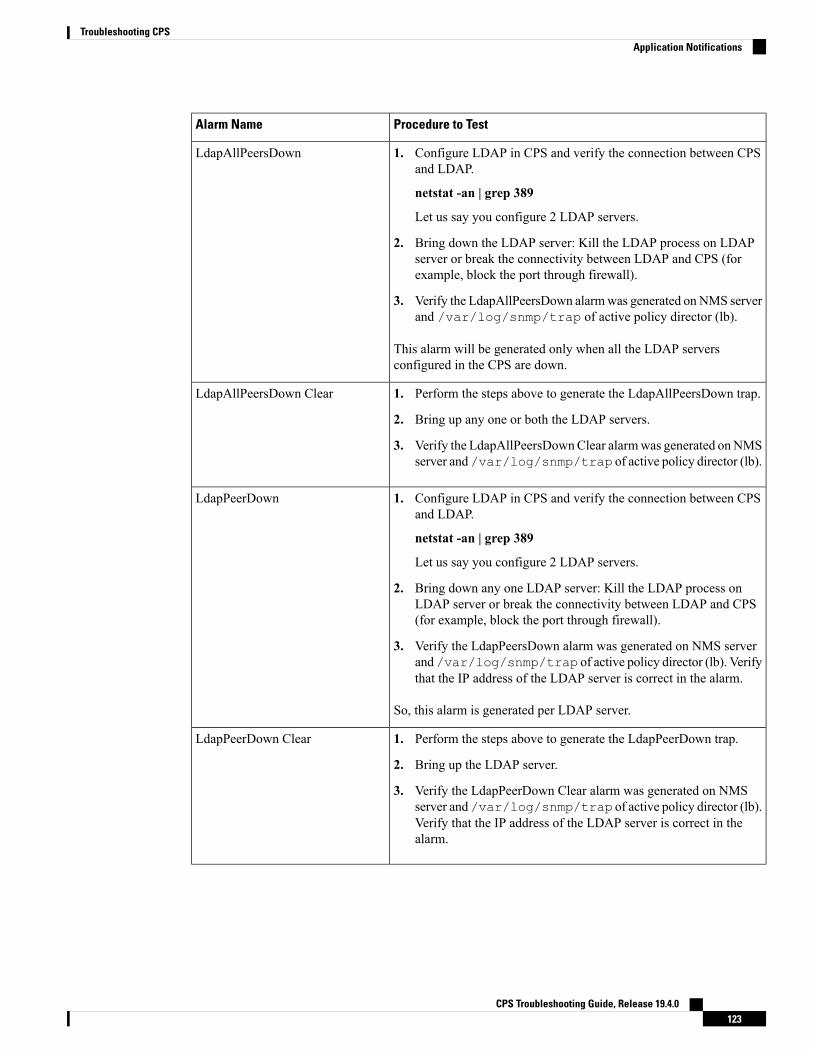
Procedure to TestAlarm Name
1. Configure LDAP in CPS and verify the connection between CPSand LDAP.
netstat -an | grep 389
Let us say you configure 2 LDAP servers.
2. Bring down the LDAP server: Kill the LDAP process on LDAPserver or break the connectivity between LDAP and CPS (forexample, block the port through firewall).
3. Verify the LdapAllPeersDown alarmwas generated onNMS serverand /var/log/snmp/trap of active policy director (lb).
This alarm will be generated only when all the LDAP serversconfigured in the CPS are down.
LdapAllPeersDown
1. Perform the steps above to generate the LdapAllPeersDown trap.
2. Bring up any one or both the LDAP servers.
3. Verify the LdapAllPeersDownClear alarmwas generated onNMSserver and/var/log/snmp/trap of active policy director (lb).
LdapAllPeersDown Clear
1. Configure LDAP in CPS and verify the connection between CPSand LDAP.
netstat -an | grep 389
Let us say you configure 2 LDAP servers.
2. Bring down any one LDAP server: Kill the LDAP process onLDAP server or break the connectivity between LDAP and CPS(for example, block the port through firewall).
3. Verify the LdapPeersDown alarm was generated on NMS serverand/var/log/snmp/trap of active policy director (lb). Verifythat the IP address of the LDAP server is correct in the alarm.
So, this alarm is generated per LDAP server.
LdapPeerDown
1. Perform the steps above to generate the LdapPeerDown trap.
2. Bring up the LDAP server.
3. Verify the LdapPeerDown Clear alarm was generated on NMSserver and/var/log/snmp/trap of active policy director (lb).Verify that the IP address of the LDAP server is correct in thealarm.
LdapPeerDown Clear
CPS Troubleshooting Guide, Release 19.4.0123
Troubleshooting CPSApplication Notifications

Procedure to TestAlarm Name
1. CPS HA is deployed as per guidelines provided in the CPSInstallation Guide for VMware (this alarm is not applicable forAIO deployments).
2. Run Gx diameter calls and LDAP (configure multiple LDAPservers).
3. Verify Call Model is stable using top_qps.sh command.
4. Check for latest log:/var/log/broadhop/scripts/gen-ldap-trap.log.
5. If system (all policy server (QNS) VMs) is processing Gx andLDAP messages normal, then normal text message will be loggedinto the log file.
6. Abruptly shutdown LDAP server.
7. Within 30 seconds of interval, trap (dropped alarm) is generated.Verify receipt of the alarm onNMS and/var/log/snmp/trapof active policy director (lb).
Percentage of LDAP retry
threshold Exceeded
1. After dropped trap alarm is generated, restart LDAP server.
2. Within 30 seconds of interval, trap (clear indicator) is generated
3. Verify the clear indicator was generated on NMS server and/var/log/snmp/trap of active policy director (lb).
Percentage of LDAP retry
threshold Normal
Refer to steps for “Percentage of LDAP retry threshold Normal” alarm.LDAP Requests as percentage
of CCR-I Dropped
Refer to steps for “Percentage of LDAP retry threshold Normal” alarm.LDAP Requests as percentage
of CCR-I Normal
Refer to steps for “Percentage of LDAP retry threshold Normal” alarm.LDAP Request Dropped
Refer to steps for “Percentage of LDAP retry threshold Normal” alarm.LDAP Requests Normal
Refer to steps for “Percentage of LDAP retry threshold Normal” alarm.LDAP Query Result Dropped
Refer to steps for “Percentage of LDAP retry threshold Normal” alarm.LDAP Query Result Normal
CPS Troubleshooting Guide, Release 19.4.0124
Troubleshooting CPSApplication Notifications

Procedure to TestAlarm Name
1. CPSHA is deployed as per guidelines provided in the Cisco PolicySuite Installation Guide (this alarm is not applicable for AIOdeployments).
2. Configure Message Handling Rules in Policy Builder.
3. Run Gx diameter calls (CCR-I, U or T).
4. Verify Call Model is stable using top_qps.sh command.
5. Check for latest log:/var/log/broadhop/scripts/gen-gx-drop-trap.log.
6. If system (all policy server (QNS) VMs) is processing Gxmessagesnormally, then normal text messages will be logged into the logfile.
7. Increase the Gx message load beyond system capacity, such thatthreshold configured in Policy Builder should be breached.
8. Within 30 seconds of interval, trap (dropped alarm) is generated.Verify receipt of the alarm onNMS and/var/log/snmp/trapof active policy director (lb).
Gx Message processing
Dropped
1. After Gx Message Dropped trap alarm is generated, reduce trafficwithin system capacity.
2. Within 30 seconds of interval, trap (clear indicator) is generated
3. Verify the Gx Message processing Normal alarm was generatedon NMS server and /var/log/snmp/trap of active policydirector (lb).
Gx Message processing
Normal
CPS Troubleshooting Guide, Release 19.4.0125
Troubleshooting CPSApplication Notifications

Procedure to TestAlarm Name
1. CPSHA is deployed as per guidelines provided in the Cisco PolicySuite Installation Guide (this alarm is not applicable for AIOdeployments).
2. Configure Message Handling Rules in Policy Builder.
3. Run Gx diameter calls (CCR-I, U or T).
4. Verify Call Model is stable using top_qps.sh command.
5. Check for latest log:/var/log/broadhop/scripts/gen-gx-drop-trap.log.
6. If system (all policy server (QNS) VMs) is processing Gxmessagesnormally, then normal text messages will be logged into the logfile.
7. Increase the Gx message load beyond system capacity, such thatthreshold configured in Policy Builder should be breached.
8. Within 30 seconds of interval, trap (dropped alarm) is generated.Verify receipt of the alarm onNMS and/var/log/snmp/trapof active policy director (lb).
Average Gx Message
processing Dropped
1. After Average GxMessage processing Dropped alarm is generated,reduce traffic within system capacity.
2. Within 30 seconds of interval, trap (clear indicator) is generated
3. Verify the Gx Message processing Normal alarm was generatedon NMS server and /var/log/snmp/trap of active policydirector (lb).
Average Gx Message
processing Normal
1. Stop all the Active SMSC servers.
2. Verify receipt of the alarm onNMS and/var/log/snmp/trapof active policy director (lb).
AllSMSCNotification
ServerDown
1. Start any of the configured SMSC servers.
2. Verify receipt of the alarm onNMS and/var/log/snmp/trapof active policy director (lb).
AtLeastOneSMSC
NotificationServerUp
1. Stop one of the active SMSC servers.
2. Verify receipt of the alarm onNMS and/var/log/snmp/trapof active policy director (lb).
SMSCNotification
ServerDown
1. Start one of the down and configured SMSC servers.
2. Verify receipt of the alarm onNMS and/var/log/snmp/trapof active policy director (lb).
SMSCNotification
ServerUp
CPS Troubleshooting Guide, Release 19.4.0126
Troubleshooting CPSApplication Notifications
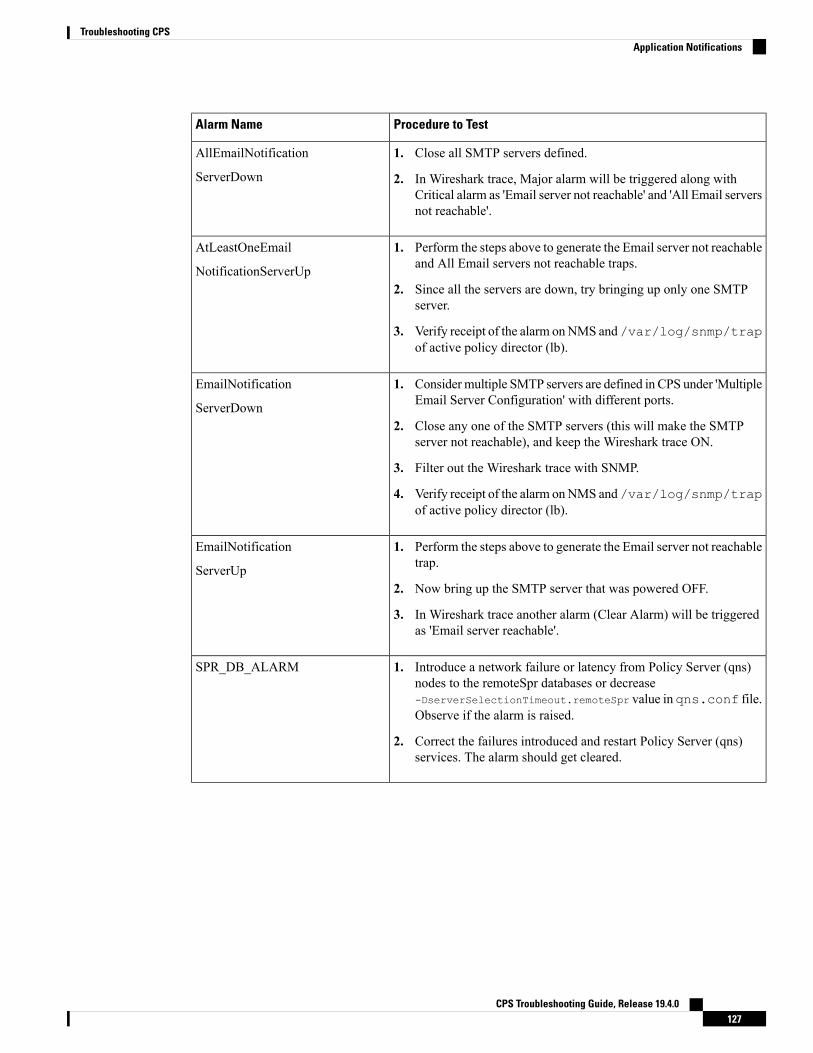
Procedure to TestAlarm Name
1. Close all SMTP servers defined.
2. In Wireshark trace, Major alarm will be triggered along withCritical alarm as 'Email server not reachable' and 'All Email serversnot reachable'.
AllEmailNotification
ServerDown
1. Perform the steps above to generate the Email server not reachableand All Email servers not reachable traps.
2. Since all the servers are down, try bringing up only one SMTPserver.
3. Verify receipt of the alarm onNMS and/var/log/snmp/trapof active policy director (lb).
AtLeastOneEmail
NotificationServerUp
1. Considermultiple SMTP servers are defined in CPS under 'MultipleEmail Server Configuration' with different ports.
2. Close any one of the SMTP servers (this will make the SMTPserver not reachable), and keep the Wireshark trace ON.
3. Filter out the Wireshark trace with SNMP.
4. Verify receipt of the alarm onNMS and/var/log/snmp/trapof active policy director (lb).
EmailNotification
ServerDown
1. Perform the steps above to generate the Email server not reachabletrap.
2. Now bring up the SMTP server that was powered OFF.
3. In Wireshark trace another alarm (Clear Alarm) will be triggeredas 'Email server reachable'.
EmailNotification
ServerUp
1. Introduce a network failure or latency from Policy Server (qns)nodes to the remoteSpr databases or decrease-DserverSelectionTimeout.remoteSpr value in qns.conf file.Observe if the alarm is raised.
2. Correct the failures introduced and restart Policy Server (qns)services. The alarm should get cleared.
SPR_DB_ALARM
CPS Troubleshooting Guide, Release 19.4.0127
Troubleshooting CPSApplication Notifications

Procedure to TestAlarm Name
1. Enable Binding-db-health-check feature for the APN.
2. PCRF sends health check AAR to Policy DRA.
3. Alarm is generated immediately if Policy DRA sends AAA witherror cause code configured in Policy Builder (DiameterConfiguration > PolicyDRA Health Check > Alarm Config >Alarm Clearance Interval > Policy Dra Resultcode).
4. Verify the generated alarm on NMS server and/var/log/snmp/trap of active policy director (lb).
Binding Not Available
at Policy DRA
1. Enable the warmup feature by configuring the qns.node.warmupto true in qns.conf file.
2. Do not configure qns.node.warmup.hostname.substringparameter in qns.conf.
3. The DiameterQnsWarmupError alarm is generated.
DiameterQnsWarmupError
1. Run diagnostics.sh --get_replica_status command to getthe status of replica sets.
2. Select the SPR repset configured under USuM Configuration >Shard Configuration.
3. Go to each sessionmgr of a replica-set and stop the sessionmgrservice for that replica-set or shutdown the sessionmgr VM.
4. Run diagnostics.sh –get_active_alarms to verify the alarm isgenerated.
5. Verify the generated alarm on NMS server and/var/log/snmp/trap of active policy director (lb).
SPRNodeNotAvailable
There is no procedure to test this alarm. This alarm is generated whenthere are memory leak issues in software.
GC State
There is no procedure to test this alarm. This alarm is generated whenthere are memory leak issues in software.
OldGen State
Set the recommended value for Session limit Overload Protectionunder System configuration in Policy Builder and publish it. Duringthe upgrade to the build where the parameter is introduced, the valuewill be defaulted to 0. In this case, alarm is raised so that you canchange the value to recommended value (the value differs for eachdeployment).
SessionLimitOverload
ProtectionNotSet
CPS Troubleshooting Guide, Release 19.4.0128
Troubleshooting CPSApplication Notifications

Procedure to TestAlarm Name
Send 'n' number of CCR-I's to CPS so that 'n' sessions are created insession database (this is total count of sessions from all the sessionreplica sets which can be found using session_cache_ops.sh
--count). Assume value set for Session Limit Overload Protectionas 'm'. If n > m, then the alarm will be raised within 30 seconds.
SessionLimitOverload
ProtectionExceeded
Bring down the VM. Wait for few seconds for the alarm to show upin diagnostics –get_active_alarms.
SESSION_SHARD_
UNREACHABLE
Either do not create shards after a fresh install in GR environment orremove all shard entries in the ADMIN replica-set > sharding database> shards collection.
It takes atleast “x” number of seconds before which this alarm isgenerated, the default being 30 seconds.
ADMIN_DB_MISSING_
SHARD_ENTRIES
Drop an existing index from any one of the session collections usingmongo CLI. This alarm shows up on a Policy Server (qns) restart onany one of the nodes, only when an index creation fails. In most casesthe indexes are successfully created during startup time hence onemight not see the alarm. Only when there is an index creation failure,the alarm is generated.
MISSING_SESSION_
INDEXES
Drop an existing index from any one of the SPR collections usingmongo CLI. This alarm shows up only on a Policy Server (qns) restarton any one of the nodes, as indexes get created during the processstartup time.
MISSING_SPR_
INDEXES
1. Stop qns processes on any of the VM where qns processes arerunning by running the following command.
kill -9 <process_pid>
2. Wait for some time (approximately 30-35 seconds) till process getrestarted.
3. Verify the ProcessRestarted trap generated on NMS and/var/log/snmp/trap file on active lb VM.
ProcessRestarted
CPS Troubleshooting Guide, Release 19.4.0129
Troubleshooting CPSApplication Notifications

Procedure to TestAlarm Name
1. Reboot the primary Session Manager VM which is having thehighest priority in a replica-set.
reboot
2. Once the primary Session Manager VM is up, change the timestamp of the VM to 00:00:00.
date -s "DD MM YYYY HH:MM:SS"
Example: date -s "19 APR 2019 00:00:00"
Once the primary state of replica-set is taken over by same sessionmanager, application fails to detect the session manager's role asprimary. As a result, application fails to perform the write operationand alarm is generated.
You will see the follwoing exception in the application logs:
2019-03-28 14:05:37,449 [pool-1008134-thread-1]ERROR c.b.i.a.impl.IpstaticApiServiceImpl.?- Error occured while calling theaddStaticIpForSinglePartnerTimed out after 1200 ms while waiting for a server thatmatchesWritableServerSelector.Client view of cluster state is{type=REPLICA_SET, servers= { Mongo Client details }
Database Operation
SNMP System and Application KPI Values• SNMP System KPIs, on page 130• Application KPI Values, on page 132
SNMP System KPIsIn this table, the system KPI information is provided:
CPS Troubleshooting Guide, Release 19.4.0130
Troubleshooting CPSSNMP System and Application KPI Values

Table 13: SNMP System KPIs
InformationComponent
CpuUser
CpuSystem
CpuIdle
CpuIdle
LoadAverage1
LoadAverage5
LoadAverage15
MemoryTotal
MemoryAvailable
SwapTotal
SwapAvailable
lb01/lb02
pcrfclient01/pcrfcient02
sessionMgr01/sessionMgr02
QNS01/QNS02/QNS03/QNS04...
CPS Troubleshooting Guide, Release 19.4.0131
Troubleshooting CPSSNMP System KPIs

Application KPI Values
Table 14: Application KPI Values
KPI Values
snmpwalk -v 2c -c broadhop -M +BROADHOP-MIB:CISCO-QNS-MIB<lb01> <OIDvalue>
For example, snmpwalk -v 2c -c broadhop -M+BROADHOP-MIB:CISCO-QNS-MIB lb01 .1.3.6.1.4.1.26878.200.3.3.70.11
List all KPIs value of load balancer (lb), if all values are 0 then
For ExternalCurrentSession:
1. Open another terminal.
2. Enter the following command:
telnet <lbvip01> 8443
3. On previous terminal run the above snmpwalk command again.
4. This time it will display the externalCurrentSession KPIs value to be 1.
5. Repeat the process with more telnet session open on lbvip01 8080 port
For InternalCurrentSession:
1. Open another terminal.
2. Enter the following command:
telnet <lbvip02> 8080
3. On previous terminal run the above snmpwalk command again.
4. This time it will display the internalCurrentSession KPIs value to be 1.
5. Repeat the process with more telnet sessions open on lbvip01 8080 port.
lb01/lb02
CPS Troubleshooting Guide, Release 19.4.0132
Troubleshooting CPSApplication KPI Values
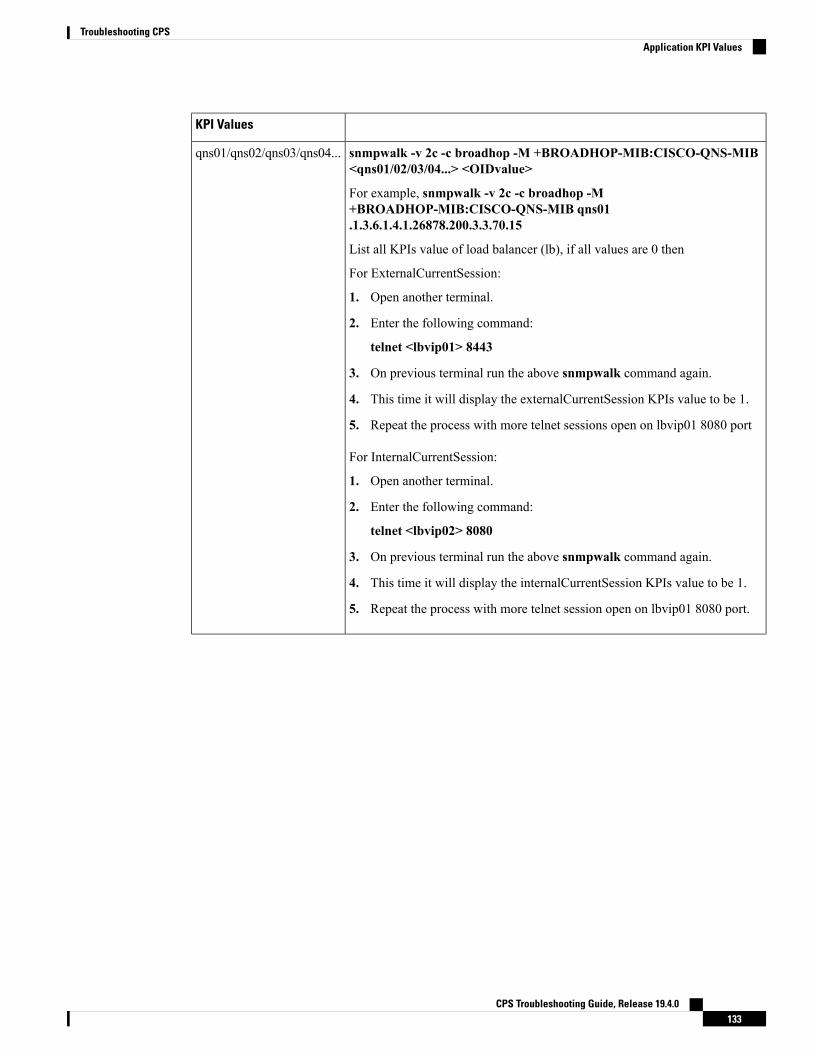
KPI Values
snmpwalk -v 2c -c broadhop -M +BROADHOP-MIB:CISCO-QNS-MIB<qns01/02/03/04...> <OIDvalue>
For example, snmpwalk -v 2c -c broadhop -M+BROADHOP-MIB:CISCO-QNS-MIB qns01.1.3.6.1.4.1.26878.200.3.3.70.15
List all KPIs value of load balancer (lb), if all values are 0 then
For ExternalCurrentSession:
1. Open another terminal.
2. Enter the following command:
telnet <lbvip01> 8443
3. On previous terminal run the above snmpwalk command again.
4. This time it will display the externalCurrentSession KPIs value to be 1.
5. Repeat the process with more telnet sessions open on lbvip01 8080 port
For InternalCurrentSession:
1. Open another terminal.
2. Enter the following command:
telnet <lbvip02> 8080
3. On previous terminal run the above snmpwalk command again.
4. This time it will display the internalCurrentSession KPIs value to be 1.
5. Repeat the process with more telnet session open on lbvip01 8080 port.
qns01/qns02/qns03/qns04...
CPS Troubleshooting Guide, Release 19.4.0133
Troubleshooting CPSApplication KPI Values
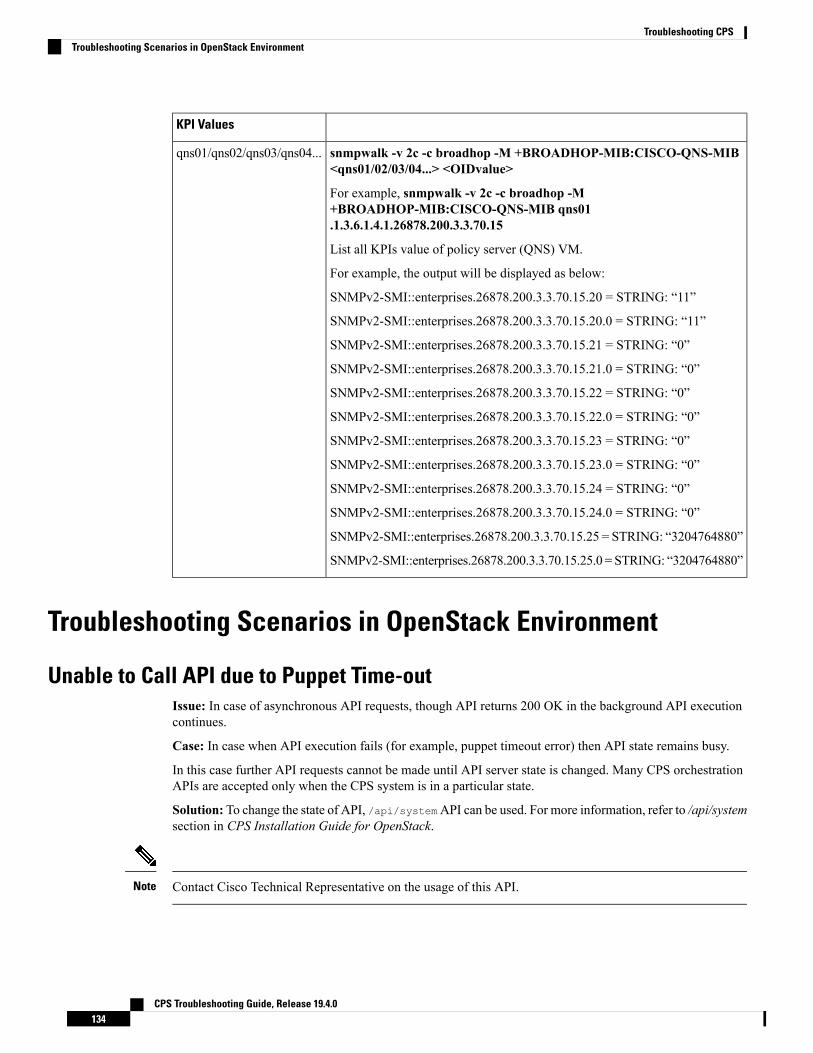
KPI Values
snmpwalk -v 2c -c broadhop -M +BROADHOP-MIB:CISCO-QNS-MIB<qns01/02/03/04...> <OIDvalue>
For example, snmpwalk -v 2c -c broadhop -M+BROADHOP-MIB:CISCO-QNS-MIB qns01.1.3.6.1.4.1.26878.200.3.3.70.15
List all KPIs value of policy server (QNS) VM.
For example, the output will be displayed as below:
SNMPv2-SMI::enterprises.26878.200.3.3.70.15.20 = STRING: “11”
SNMPv2-SMI::enterprises.26878.200.3.3.70.15.20.0 = STRING: “11”
SNMPv2-SMI::enterprises.26878.200.3.3.70.15.21 = STRING: “0”
SNMPv2-SMI::enterprises.26878.200.3.3.70.15.21.0 = STRING: “0”
SNMPv2-SMI::enterprises.26878.200.3.3.70.15.22 = STRING: “0”
SNMPv2-SMI::enterprises.26878.200.3.3.70.15.22.0 = STRING: “0”
SNMPv2-SMI::enterprises.26878.200.3.3.70.15.23 = STRING: “0”
SNMPv2-SMI::enterprises.26878.200.3.3.70.15.23.0 = STRING: “0”
SNMPv2-SMI::enterprises.26878.200.3.3.70.15.24 = STRING: “0”
SNMPv2-SMI::enterprises.26878.200.3.3.70.15.24.0 = STRING: “0”
SNMPv2-SMI::enterprises.26878.200.3.3.70.15.25 = STRING: “3204764880”
SNMPv2-SMI::enterprises.26878.200.3.3.70.15.25.0 = STRING: “3204764880”
qns01/qns02/qns03/qns04...
Troubleshooting Scenarios in OpenStack Environment
Unable to Call API due to Puppet Time-outIssue: In case of asynchronous API requests, though API returns 200 OK in the background API executioncontinues.
Case: In case when API execution fails (for example, puppet timeout error) then API state remains busy.
In this case further API requests cannot be made until API server state is changed. Many CPS orchestrationAPIs are accepted only when the CPS system is in a particular state.
Solution: To change the state of API, /api/systemAPI can be used. For more information, refer to /api/systemsection in CPS Installation Guide for OpenStack.
Contact Cisco Technical Representative on the usage of this API.Note
CPS Troubleshooting Guide, Release 19.4.0134
Troubleshooting CPSTroubleshooting Scenarios in OpenStack Environment

FAQsQ. Where to check if traps are getting generated or not?A. On active policy director (lb) VMs tail the below log file /var/log/snmp/trap to get the generated
trap.
Q. Traps are getting generated from different VMs such as OAM (pcrfclient) or policy server (QNS) VMsbut not getting logged to /var/log/snmp/trap and not appear on NMS receiver?
A. Check on active policy director (lb) VM if/etc/snmp/scripts/application_trapv1_convert andcomponent_trap_convertfiles are present or not. If the files are present but traps are not getting generated then try to execute thefollowing commands and test it again.dos2unix /etc/snmp/scripts/application_trapv1_convertdos2unix /etc/snmp/scripts/component_trap_convert
Q. The traps are getting logged in /var/log/snmp/trap but not receive on NMS?A. Check the setup configuration is correct or not as per the instruction given above.1.
2. Perform the steps given in the previous question.
3. Check if NMS IP is accessible from policy director (lb) VMs. Using command such as ping <nms_ip>.
Q. Database related traps not getting generated?A. Check the setup is configured and running as per instruction given above.1.
2. On pcrfclient/lb VMs all the scripts generating the traps are logging the details inside/var/log/broadhop/script/<script_name><date>.log file. Open log file to checkif there is any error in the script or is it generating the traps successfully or not. If not generated byscript then contact system administrator team to resolve the issue.
Q. What is the difference between pcrfclient01 and pcrfclient02 virtual machines?A. pcrfclient01 --Master / Standby•
• pcrfclient02 ---Slave / Standby
• pcrfclient02 support high availability of policy related services but it may not replicate all the serviceswhich were present in pcrfclient01.
Q. What is the ideal threshold limit for processor load in particular VM?A. A. Ideally the threshold limit should be equal to number of vCPU that are present in the VM.
You can check the vCPU on a particular VM using the following command: grep ^processor
/proc/cpuinfo | wc -l.
So if we have 12 vCPU, threshold limit for processor load is 12.
Q. I have multiple release trains (software releases) in my repository file (cat/etc/broadhop/repositories). Which one will take high precedence?
A. The highest version number is always selected and it is all merged. The versions are classified as followsand each type of versions will have version number and highest version takes high precedence:
1. Major
CPS Troubleshooting Guide, Release 19.4.0135
Troubleshooting CPSFAQs

2. Minor
3. Patch
4. Build
Reference DocumentFor more information on SNMP traps and KPIs, refer to CPS SNMP, Alarms and Clearing Procedures Guide.
CPS Troubleshooting Guide, Release 19.4.0136
Troubleshooting CPSReference Document

C H A P T E R 2Troubleshooting ANDSF
• Policy Builder Scenarios, on page 137• Control Center Scenarios, on page 141• ANDSF Server Scenarios, on page 144• Basic Troubleshooting Using ANDSF Logs, on page 149
Policy Builder Scenarios
Not Able to See DM Configuration Tab in Policy Builder after InstallationFigure 28: DM Configuration Tab
Step 1 Execute list_installed_features.sh script from Cluster Manager to verify whether the ANDSF feature(com.broadhop.client.feature.andsf) is enabled or not.list_installed_features.sh
CPS Troubleshooting Guide, Release 19.4.0137

Step 2 In case the above feature (com.broadhop.client.feature.andsf) is missing, edit the/etc/broadhop/pb/featuresfile from Cluster Manager VM and add the following lines:
com.broadhop.client.feature.andsf
com.broadhop.andsf.service.feature
Step 3 After modifying the feature files, execute the following commands from Cluster Manager:
/var/qps/install/current/scripts/build_all.sh
/var/qps/install/current/scripts/upgrade/reinit.sh
If the DM configuration does not show up then do a restartall.sh at the end.Note
Diagnostic.sh throws Errors after RestartCheck Client Name Value is not blank as shown in the following figure:Figure 29: DM Client Vendor
Not Getting GCM Notifications in LogsVerify the GCM tokens are configured in Policy Builder as shown in the following figure:
CPS Troubleshooting Guide, Release 19.4.0138
Troubleshooting ANDSFDiagnostic.sh throws Errors after Restart

Figure 30: Notification Configuration
Session is not created for iPhone and Android Users
Step 1 Go to Services > Domains in Policy Builder.Step 2 Under Domains, select USum Auth.Step 3 On right hand side, in the General tab, under Authorization tab, check that the User Id Field value is set to Session
User Name for both Android and Apple clients.
CPS Troubleshooting Guide, Release 19.4.0139
Troubleshooting ANDSFSession is not created for iPhone and Android Users

Figure 31: USum Auth
Check for service Use Case Templates for GCM, APNS, General, and defaultServices
Step 1 Go to Services tab in Policy Builder and click on Use Case Templates.Step 2 Check that the use case template is there for the service being attached to a particular subscriber.
There should be two use case templates for a general ANDSF service and one more use case template for GCM/APNSnotification if you have attached notification service to the subscriber.
Step 3 If the templates are not there, see the CPS ANDSF Configuration Guide to create Use case Templates for the aboveservices.
Policy Builder Session Timeout Frequently and not able to Login from anotherBrowser
To Increase the timeout edit the qns.conf file and add the following parameter:
session.timeout=9000
To increase the number of sessions limit which will allow to create more sessions, edit the qns.conf fileand add the following parameter:
pb.user.session.limit=5000
CPS Troubleshooting Guide, Release 19.4.0140
Troubleshooting ANDSFCheck for service Use Case Templates for GCM, APNS, General, and default Services

Control Center Scenarios
Subscriber Session not getting Created and Getting Exception Error (401)• Make sure username and name should be same and unique.
• In case of Android, username will be IMSI.
• In case of iPhone, username will be MSISDN.
Figure 32: Subscribers
SSID Credentials are Wrongly Passed in Policy
Step 1 Go to Subscriber section in Control Center.Step 2 Click on SSID section.Step 3 Check the subscriber credentials are populated for specific SSIDs.Step 4 Verify all the above three steps for all the subscribers.
DM Tree Lookups Fail and Exception in consolidated-qns.log
Step 1 Make sure CRD mapping is done properly in DM lookup.
CPS Troubleshooting Guide, Release 19.4.0141
Troubleshooting ANDSFControl Center Scenarios

Figure 33: DM Tree Lookups
Step 2 Check the CRD entries in DM tree lookup table.Step 3 Check whether the CRD tables (for example, check in configuration section) exists and have entries defined in the lookup
table.
Data Populated in MongoDB ANDSF Collection, but values are not shown inControl Center
Step 1 Go to all the policy server (QNS) nodes.Step 2 Edit the following qns.conf file at /etc/broadhop/.Step 3 Add the following parameter in the qns.conf file.
-Dandsf.mongo.thread.maxWaitTime=10000
Step 4 Execute restart.sh from Cluster Manager VM.
CPS Troubleshooting Guide, Release 19.4.0142
Troubleshooting ANDSFData Populated in MongoDB ANDSF Collection, but values are not shown in Control Center
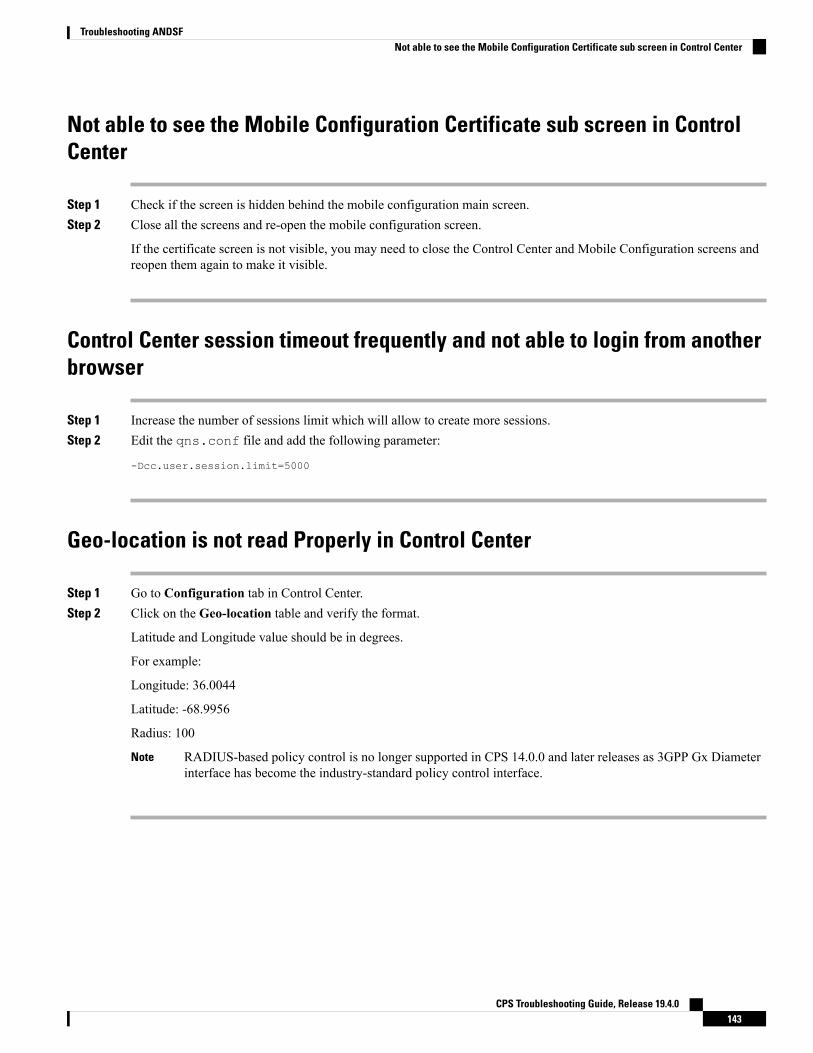
Not able to see the Mobile Configuration Certificate sub screen in ControlCenter
Step 1 Check if the screen is hidden behind the mobile configuration main screen.Step 2 Close all the screens and re-open the mobile configuration screen.
If the certificate screen is not visible, you may need to close the Control Center and Mobile Configuration screens andreopen them again to make it visible.
Control Center session timeout frequently and not able to login from anotherbrowser
Step 1 Increase the number of sessions limit which will allow to create more sessions.Step 2 Edit the qns.conf file and add the following parameter:
-Dcc.user.session.limit=5000
Geo-location is not read Properly in Control Center
Step 1 Go to Configuration tab in Control Center.Step 2 Click on the Geo-location table and verify the format.
Latitude and Longitude value should be in degrees.
For example:
Longitude: 36.0044
Latitude: -68.9956
Radius: 100
RADIUS-based policy control is no longer supported in CPS 14.0.0 and later releases as 3GPP Gx Diameterinterface has become the industry-standard policy control interface.
Note
CPS Troubleshooting Guide, Release 19.4.0143
Troubleshooting ANDSFNot able to see the Mobile Configuration Certificate sub screen in Control Center

ANDSF Server Scenarios
API Error CodesThe following table provides the information related to API Error Codes:
Table 15: API Error Codes
ScenarioError Code
The requested command could not be performed because of malformed syntax in thecommand. The malformed command may also be returned in the item Element typein the Status. Check SyncML syntax. For more information, refer to CPS ANDSFConfiguration Guide.
400 Bad request
The requested command failed because of improper authentication or authorization.If the property type of authentication was presented in the original request, then theresponse code indicates that the requested command has been refused for thosecredentials. Check cred data andAuthentication type in syncml. For more information,refer to CPS ANDSF Configuration Guide.
401 Invalidcredentials
The recipient encountered an unexpected condition which prevented it from fulfillingthe request. Verify ssids are attached to the subscriber and check qns consolidatedlogs in OAM (pcrfclient).
500 Commandfailed
The recipient is currently unable to handle the request due to a temporary overloadingor maintenance of the recipient. The implication is that this is a temporary condition,which will be alleviated after some delay Check qns consolidated logs in OAM(pcrfclient).
503 Serviceunavailable
General Errors
Problem Accessing ua/soap Getting Jetty Related ErrorThis problem occurs when Unified API service is not functioning.
Step 1 Execute list_installed_features command to check whether the following features are installed:
PCRF
• com.broadhop.unifiedapi.interface.feature
• com.broadhop.unifiedapi.ws.service.feature
Policy Builder
• com.broadhop.client.feature.andsf
• com.broadhop.client.feature.unifiedapi
CPS Troubleshooting Guide, Release 19.4.0144
Troubleshooting ANDSFANDSF Server Scenarios

Step 2 Add the missing features in Policy Builder and PCRF feature file (/etc/broadhop/pb/features,/etc/broadhop/pcrf/features).
Step 3 Execute the following commands from Cluster Manager.
/var/qps/install/current/scripts/build_all.sh
/var/qps/install/current/scripts/upgrade/reinit.sh
Check if Blank Policy is Retrieved in SyncML ResponseThis problem occurs whenever a respective policy for the UE request is not found.
Step 1 Make sure lookups defined in Control Center and Policy Builder are properly configured.Step 2 Map DM configuration templates in Policy Builder with the actual DM configuration in Control Center and also look
into subscriber mapped service configuration.
Step 3 Make sure no error object is being created for a non-matching option in Service Configuration. Check if options in UseCase Templates match corresponding Service Options and Service Configuration. They will be marked with a (X) if thereis an error.
Step 4 Publish the corrections.Step 5 After restarting policy server (QNS), run the use case again.
Policy Engine not Returning a Management ResponseThis problem occurs when a certain process during policy retrieval is failing due to an Exception in someprocess.
Step 1 Go to Policy Builder.Step 2 Check that all the configurations are correct as per CPS ANDSF Configuration Guide.Step 3 Check that the Control Center Lookup and associations are properly configured.Step 4 Check consolidated-qns.log in pcrfclient01 VM to debug any relevant exceptions.
Notification Errors
GCM Notification
No GCM Token Found
This generally happens when either UE is not sending the token in Device Info or Server is unable to retrievethis token for notification. Server can only retrieve token and store in the Device session if notification serviceis properly configured (if not using default configurations).
• Andsf_ISMP_Google_Notification
CPS Troubleshooting Guide, Release 19.4.0145
Troubleshooting ANDSFCheck if Blank Policy is Retrieved in SyncML Response
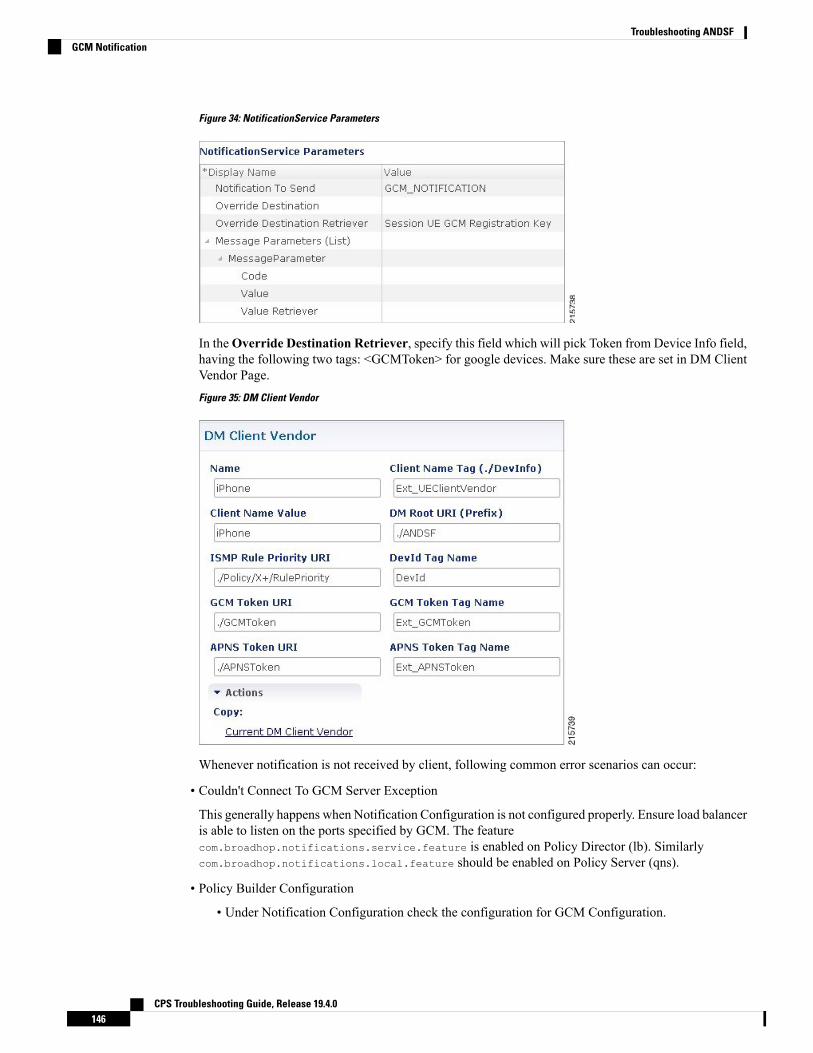
Figure 34: NotificationService Parameters
In theOverride Destination Retriever, specify this field which will pick Token from Device Info field,having the following two tags: <GCMToken> for google devices. Make sure these are set in DM ClientVendor Page.Figure 35: DM Client Vendor
Whenever notification is not received by client, following common error scenarios can occur:
• Couldn't Connect To GCM Server Exception
This generally happens when Notification Configuration is not configured properly. Ensure load balanceris able to listen on the ports specified by GCM. The featurecom.broadhop.notifications.service.feature is enabled on Policy Director (lb). Similarlycom.broadhop.notifications.local.feature should be enabled on Policy Server (qns).
• Policy Builder Configuration
• Under Notification Configuration check the configuration for GCM Configuration.
CPS Troubleshooting Guide, Release 19.4.0146
Troubleshooting ANDSFGCM Notification

• The configuration should not be in error. The correct API key and Sender Id should be present.
• Server Configuration
• Check there is an active connection established on the port 5235. The firewall is opened for the port.
service iptables stop
netstat -apn | grep 5235 (Connection should be in established state)
• Telnet connection is established for the port.
Ping to gcm.googleapis.com should be successful.
Ping to android.googleapis.com should be successful.
• A valid xmpp or http connection is established. The same should be visible in policy server (qns)logs on the active policy director (lb). Check Notification is being sent from policy server (qns) andthe same is being relayed correctly by the policy director (lb) to the GCM Server.
APNS Notification• No APNS Token Found
This generally happens when either UE is not sending the token in Device Info or Server is unable toretrieve this token for notification. Server can only retrieve token and store in the Device session ifnotification service is properly configured (if not using default configurations)
• Andsf_ISMP_Apple_NotificationFigure 36: NotificationService Parameters
In the Override Destination Retriever, specify this field which will pick Token from Device Infofield, having the following two tags: <APNSToken> for apple devices. Make sure these are set inDM Client Vendor Page.
CPS Troubleshooting Guide, Release 19.4.0147
Troubleshooting ANDSFAPNS Notification

Figure 37: DM Client Vendor
Whenever notification is not received by client, following common error scenarios can occur:
• Couldn't Connect To APNS Server Exception
This generally happens when Notification Configuration is not configured properly. Ensure load balanceris able to listen on the ports specified by APNS. The featurecom.broadhop.notifications.service.feature is enabled on policy director (lb). Similarly,com.broadhop.notifications.local.feature should be enabled on policy server (qns).
• Policy Builder Configuration
• Check the correct APNS Server is provided with the correct Server Port. The APNS token beingsent is valid.
• A valid Certificate and password is provided.
• Correct Geo Fence value is configured under the ANDSF Configuration.
• Server Configuration
• Check there is an active connection established on the port 2195. The firewall is opened for the port.
service iptables stop
netstat -apn | grep 2195 (Connection should be in established state)
• Telnet connection is established for the port.
• Check if the APNS token is updated with the correct value in the Session Data. This should be avalid APNS Token.
• Check Notification is being sent from policy server (qns) and the same is being relayed correctlyby the policy director (lb) to the APNS Server
CPS Troubleshooting Guide, Release 19.4.0148
Troubleshooting ANDSFAPNS Notification

Basic Troubleshooting Using ANDSF Logs
Debugging Common Errors using Logging Techniques of ANDSFThe following procedure describes how to enable logs in logback.xml.
Step 1 Edit /etc/broadhop/logback.xml.Step 2 Search for the following:
<!-- APS Loggers -->
Step 3 Change <logger name="com.broadhop" level="warn"/> to <logger name="com.broadhop" level="debug"/>.Step 4 (Optional) To enable module specific logging, set the debugging level to debug for the specific module.
For example, <logger name="com.broadhop.notifications" level="debug"/> will set the debug level log fornotifications module only.
Step 5 Copy this logback.xml file to all other policy server (qns) VMs using the following command:
copytoall.sh /etc/broadhop/logback.xml /etc/broadhop/logback.xml
Step 6 Capture the trace. Now run the call flow so that the trace is captured in the logs.Logs will be captured in /var/log/broadhop.
Step 7 After you have captured and debugged the logs, roll back the logback.xml file.
Debugging Common Call Flow Scenarios for ANDSF using Logging Patterns
Generic Call Flow For Android
Step 1 Enable the logging for broadhop module at debug level as described in Debugging Common Errors using LoggingTechniques of ANDSF, on page 149.
Step 2 On pcrfclient01, navigate to /var/log/broadhop.Step 3 Use the tail command to view the consolidated-engine.logStep 4 Send Package #1 for the subscriber. Look for the following values:
a) Correct Message and User Info is picked:Message Id: 1
Source: IMEI:User_UseCase_Tier
User Name: User_UseCase_Tier
The Correct IMEI and User Name value should be displayed as specified in Control Center.
b) Check if USUSM Authorization was successful. If not, check that the User Name is the same as in Control Centerand that Correct Authorization is given in Policy Builder.
CPS Troubleshooting Guide, Release 19.4.0149
Troubleshooting ANDSFBasic Troubleshooting Using ANDSF Logs

INFO : (auth) Success USUM_AUTHORIZATION
c) Check if DevInfo gets Processed.INFO : (ANSDF) DevInfo processed : vendor SmartSwitch
d) If a GCM token is supplied, see if it is read and updated.INFO : (ANSDF) Updating GCM registration key !Vendor: SmartSwitch
e) Check the correct Use Case is picked and a valid response is sent to the same Subscriber.INFO : (ANSDF) Sending response for sessionimei:User_UseCase_Tier;Session_User_UseCase_Tier
INFO : (use-cases) Use case 'Andsf_ISMP_LOC', status: true, Condition: No Condition Set
Step 5 Send Package #3 for the subscriber. The correct policy should to be sent to the user on the basis of the lookups definedin DM Configuration in Control Center.a) Correct Message and User Info is picked:
Message Id: 2
Source: IMEI:User_UseCase_Tier
User Name: User_UseCase_Tier
The Correct IMEI and User Name value should be displayed as specified in Control Center.
b) Check that the correct session is picked, as was given in Package #1:
Session ID: imei:User_UseCase_Tier;Session_User_UseCase_Tier
c) Check that correct TGPP and WLAN Location Values are picked as defined in Control Center under the DMConfiguration Tab:INFO : (ANSDF) Processing result cmd: 14
INFO : (ANSDF) Processed URI ./UE_Location/TGPP_Location value: [UseCase_Tier_TGPP]
INFO : (ANSDF) Processed URI ./UE_Location/WLAN_Location value: [UseCase_Tier_WLAN]
UseCase_Tier_TGPP is configured in TGPP_Location Table.
UseCase_Tier_WLAN is configured in WLAN_Location Table.
d) Check that the correct lookup is picked as defined in the DM Configuration and correct lookup filters are processed.INFO : (ANSDF) checking state: LOOKUP {90}
INFO : (ANSDF) Processing lookup Policy_EXT_TIER
INFO : (ANSDF) Lookup using ./UE_Location/TGPP_Location value: [UseCase_Tier_TGPP]
INFO : (ANSDF) Lookup using ./UE_Location/WLAN_Location value: [UseCase_Tier_WLAN]
INFO : (ANSDF) Lookup using TIER value: [Gold]
e) Correct DM Treee is picked:INFO : (ANSDF) Found subscriber specific node [SSIDTypeWLAN_Location2] in DMT[UseCase_SSID_Tier]
UseCase_SSID_Tier is the Tree that is configured for the Lookups defined above in Control Center DMConfiguration.
f) A valid response command is sent to the client:
CPS Troubleshooting Guide, Release 19.4.0150
Troubleshooting ANDSFGeneric Call Flow For Android

INFO : (ANDSF) Adding Replace [response=2,7] forimei:User_UseCase_Tier;Session_User_UseCase_Tier, msg=2
g) A valid Syncml response is sent:INFO : (ANSDF) Sending response for sessionimei:User_UseCase_Tier;Session_User_UseCase_Tier
Generic Call Flow For Apple
Step 1 Enable the logging for broadhop module at debug level as described in Debugging Common Errors using LoggingTechniques of ANDSF, on page 149.
Step 2 On pcrfclient01, navigate to /var/log/broadhop.Step 3 Use the tail command to view the consolidated-engine.log.Step 4 Send Package #1 for the subscriber. Look for the following values:
a) Correct Message and User Info is picked:Source: UUID:User_UseCase_IOS_1
User Name: User_UseCase_IOS
UUID: User_UseCase_IOS_1
The Correct UUID and User Name value should be displayed as specified in Control Center.
b) Correct Services are attached to the subscriber:
SERVICES: Andsf_ISMP_Apple_Notification Andsf_ISMP_GEO_LOC_STATIC
c) Check if USUSM Authorization was successful. If not, check that the User Name is the same as in Control Centerand that Correct Authorization is given in Policy Builder.
INFO : (auth) Success USUM_AUTHORIZATION
d) Check the correct Use Case is picked and a valid response is sent to the same Subscriber.INFO : (use-cases) Use case 'Andsf_ISMP_Apple_Notification', status: false, Condition:("DM Device MO"=false)
INFO : (use-cases) Use case 'Andsf_ISMP_GEO_LOC_STATIC', status: true, Condition: NoCondition Set
Step 5 Send Package #3 for the subscriber. The correct policy should to be sent to the user on the basis of the lookups definedin DM Configuration in Control Center.a) Correct Message and User Info is picked:
Message Id: 2
Source: UUID:User_UseCase_IOS_1
User Name: User_UseCase_IOS
UUID: User_UseCase_IOS_1
Correct UUID and User Name value should be displayed as specified in Control Center.
CPS Troubleshooting Guide, Release 19.4.0151
Troubleshooting ANDSFGeneric Call Flow For Apple

b) Correct Session is picked as was given in Package #1:
Session ID: uuid:User_UseCase_IOS_1;Session_User_UseCase_IOS_1
c) Check the DevInfo gets Processed:INFO : (ANSDF) Pre-fetch URI ./DevInfo cmd: 4
INFO : (ANSDF) DevInfo processed : vendor iPhone DevId: 12345 DevType: NA
d) If an APNS token is supplied, see if it is read and updated.INFO : (ANSDF) Reusing GCM/APNS token !!Vendor: iPhone, Client: NA, DevId: 12345,GCMToken: null
e) Check that correct Geo Location Values are picked as defined in Control Center under the DM Configuration Tab:
INFO : (ANSDF) Processed URI ./UE_Location/Geo_Location value: [geo_1]
geo_1 is configured in Geo_Location Table.
f) Check that the correct lookup is picked as defined in the DM Configuration and correct lookup filters are processed:INFO : (ANSDF) checking state: LOOKUP {90}
INFO : (ANSDF) Processing lookup Policy_EXT_GEO_LOC_STATIC
INFO : (ANSDF) Lookup using ./UE_Location/Geo_Location value: [geo_1]
g) A valid response command is sent to the client:INFO : (ANDSF) Adding Replace [response=2,6] foruuid:User_UseCase_IOS_1;Session_User_UseCase_IOS_1, msg=2
h) A valid Syncml response is sent:INFO : (ANSDF) Sending response for sessionuuid:User_UseCase_IOS_1;Session_User_UseCase_IOS_1
GCM Notification
Step 1 Check that the GCM Token is defined and updated in the Logs for the subscriber:UUID: Sub_Test_1
User Name: User_UseCase_GCM_1
INFO : (ANSDF) Reusing GCM/APNS token !!Vendor: SmartSwitch, Client: NA, DevId:User_UseCase_Tier, GCMToken:APA91bGbvmHGxpePBt_HkV3Rqw7SW01GyaiqoYdvJv1SPPtQDrO62RGEK-tbk5-bQ5VOCgj4fHM98LzEQPLw6uR4XlSqu-FW7lqwApCTf-ssjIo1_1oFmyd-VDpcyvN0PIkkGeW0wDNilcjyLmX92bfpusD6RUuIx_1m88maJJzSQPiMfdq3rTA
INFO : (ANSDF) Setting next evaluation time Tue Jun 23 14:54:43 IST 2015
Step 2 On Subscriber Version Update, check that the Notification is being sent:POLICY RESULT SUCCESS:
session action = None
CPS Troubleshooting Guide, Release 19.4.0152
Troubleshooting ANDSFGCM Notification

domainId = ANDSF
subscriberId = 00300000e4b0fb825589222c
SERVICES: NOTIF_GCM Andsf_ISMP_Tier
TRIGGER: com.broadhop.spr.impl.messages.RefreshSPRProfile Key:pk:userId:User_UseCase_GCM_1
DEBUG MSGS:
INFO : (core) Lock obtained on key: pk:userId:User_UseCase_GCM_1
INFO : (core) Successful load by key: pk:userId:User_UseCase_GCM_1
INFO : (ANSDF) Sending PUSH on subscriber-version update
INFO : (ANSDF) Setting next evaluation time Tue Jun 23 14:54:44 IST 2015
Step 3 On the Load Balancer, check qns-1.log:Received GCM Notification request : Request:
template name: GCM_NOTIFICATION
collapse key: COLL_KEY_1
time to live: 1
DEBUG c.b.n.gcm.GcmMessageManager.? - Standard parameters used for sending GCM notification: timeToLive(days) : 5, delayWhileIdle : false, collapseKey : COLL_K****,apiKeyAIzaSyAXV9L1lI7HLo2n*******************, senderId1380935*****
DEBUG c.b.n.gcm.GcmMessageManager.? - GCM message to be sent : Test Message
DEBUG c.b.notifications.gcm.GcmXmppServer.? - Listener Received: <message><gcm xmlns="goog
DEBUG c.b.notifications.gcm.GcmXmppServer.? - XMPP packate recieved : {"registration_id":
DEBUG c.b.notifications.gcm.GcmXmppServer.? - Collector Received: <message><gcmxmlns="google:mobile:data"
DEBUG c.b.notifications.gcm.GcmXmppServer.? - CCS ACK received !!
DEBUG c.b.n.i.a.SendGcmNotificationRequest.? - GCM Notification request processing gotcompleted !!
APNS Notification
Step 1 Check that the APNS Token is defined and updated in the Logs for the subscriber:UUID: Sub_Test_1
User Name: User_UseCase_IOS_8
INFO : (ANSDF) Reusing GCM/APNS token !!Vendor: SmartSwitch, Client: NA, DevId: 12345
INFO : (ANSDF) Setting next evaluation time Tue Jun 23 14:54:43 IST 2015
CPS Troubleshooting Guide, Release 19.4.0153
Troubleshooting ANDSFAPNS Notification

Step 2 On Subscriber Version Update, check that the Notification is being sent:POLICY RESULT SUCCESS:
session action = None
domainId = ANDSF
subscriberId = 00500000e4b0fb8255892f94
SERVICES: ISMP_Apple_Notification
TRIGGER: com.broadhop.spr.impl.messages.RefreshSPRProfile Key:pk:userId:User_UseCase_IOS_08
DEBUG MSGS:
INFO : (core) Lock obtained on key: pk:userId:User_UseCase_IOS_08
INFO : (core) Successful load by key: pk:userId:User_UseCase_IOS_08
INFO : (ANSDF) Sending PUSH on subscriber-version update
INFO : (ANSDF) Setting next evaluation time Tue Jun 23 14:54:43 IST 2015
Step 3 On the Load Balancer, check qns-1.log:DEBUG c.b.n.impl.NotificationsManager.? - sendApplePushNotification: Device Token beingpushed to is: 67349132e3631b7a5642d2dae5991359042120c9ca0c30236bcc0bcaed1741c7.
DEBUG c.n.apns.internal.ApnsConnectionImpl.? - Made a new connection to APNS
DEBUG c.n.apns.internal.ApnsConnectionImpl.? - Message"com.notnoop.apns.ApnsNotification@ecdaaeef"
Notification for Revalidation Timer
Step 1 Check that the value for revalidation timer (as defined in Policy Builder) is set in the logs:
INFO : (ANSDF) Setting next evaluation time Tue Jun 23 13:05:09 IST 2015
Step 2 Check that a revalidation Timer Push Notification is sent after the timer has expired. Check that correct Use Case andTrigger are used:qns02 [2015-06-23 13:03:05,317] ===============================================
POLICY RESULT SUCCESS:
session action = None
domainId = ANDSF
subscriberId = 00153c00e4b0c35e558901c0
SERVICES: Andsf_ISMP_Tier
TRIGGER: com.broadhop.cache.TimerExpired request:
key: null:userId:User_UseCase_Tier
CPS Troubleshooting Guide, Release 19.4.0154
Troubleshooting ANDSFNotification for Revalidation Timer

DEBUG MSGS:
INFO : (ANSDF) Sending PUSH for re-validation timer expiry
INFO : (ANSDF) Setting next evaluation time Tue Jun 23 13:13:05 IST 2015
INFO : (use-cases) Use case 'Andsf_ISMP_LOC', status: true, Condition: No Condition Set
=========================================================================
Step 3 On the Load Balancer, check qns-1.log:Received GCM Notification request : Request:
template name: GCM_NOTIFICATION
collapse key: COLL_KEY_1
time to live: 1
DEBUG c.b.n.gcm.GcmMessageManager.? - Standard parameters used for sending GCM notification: timeToLive(days) : 5, delayWhileIdle : false, collapseKey : COLL_K****,apiKeyAIzaSyAXV9L1lI7HLo2n*******************, senderId1380935*****
DEBUG c.b.n.gcm.GcmMessageManager.? - GCM message to be sent : Test Message
DEBUG c.b.notifications.gcm.GcmXmppServer.? - Listener Received: <message><gcm xmlns="goog
DEBUG c.b.notifications.gcm.GcmXmppServer.? - XMPP packate recieved : {"registration_id":
DEBUG c.b.notifications.gcm.GcmXmppServer.? - Collector Received: <message><gcmxmlns="google:mobile:data"
DEBUG c.b.notifications.gcm.GcmXmppServer.? - CCS ACK received !!
DEBUG c.b.n.i.a.SendGcmNotificationRequest.? - GCM Notification request processing gotcompleted !!
CPS Troubleshooting Guide, Release 19.4.0155
Troubleshooting ANDSFNotification for Revalidation Timer

CPS Troubleshooting Guide, Release 19.4.0156
Troubleshooting ANDSFNotification for Revalidation Timer
C H A P T E R 3Check Subscriber Access
• Checking Access, on page 157
Checking AccessWhen you are confident that the installation and configuration tasks are complete and processing properly,try running a small amount of test traffic, following it through the system. Here are three ways to ascertaincorrect process of access from a subscriber perspective.
Testing Subscriber Access with 00.testAccessRequest.sh00.testAccessRequest.sh is a test script used to test subscriber access to the ISG and CPS system.
You can find 00.testAccessRequest.sh in /opt/broadhop/installer/isg/troubleshootingdirectory on the CPS server.
To configure the subscriber used, edit the/opt/broadhop/installer/isg/troubleshooting/config.ini file.
Step 1 In the config.ini file, change the User-Name and Password fields.
You may need to change some of the other parameters in order to match your configuration. The other mainattributes to change will be the NAS-IP-Address and Framed-IP-Address.
Note
Step 2 Run the script from a command line. No arguments are necessary:
00.testAccessRequest.sh
Upon success, this output is displayed as follows:
CPS Troubleshooting Guide, Release 19.4.0157

Figure 38: 00.testAccessRequest.sh Output
Testing Subscriber Access with soapUIThis procedure tests end subscriber access to your system.
Step 1 Download soapUI from here: http://www.soapui.org/
You only need the freeware version (not the soapUI Pro).
Step 2 Launch soapUI.Step 3 Right click on Projects and select New soapUIProject from the drop-down list.Step 4 Name your project and enter into Initial WSDL/WADL the appropriate WSDL URL (you may have to replace the IP
in display with your own IP) and select OK.
CPS Troubleshooting Guide, Release 19.4.0158
Check Subscriber AccessTesting Subscriber Access with soapUI

Figure 39: New soapUIProject
Step 5 In the tree, select Demo > SubscriberBinding > GetSubscriber > Request 1 as shown in the following figure:
CPS Troubleshooting Guide, Release 19.4.0159
Check Subscriber AccessTesting Subscriber Access with soapUI
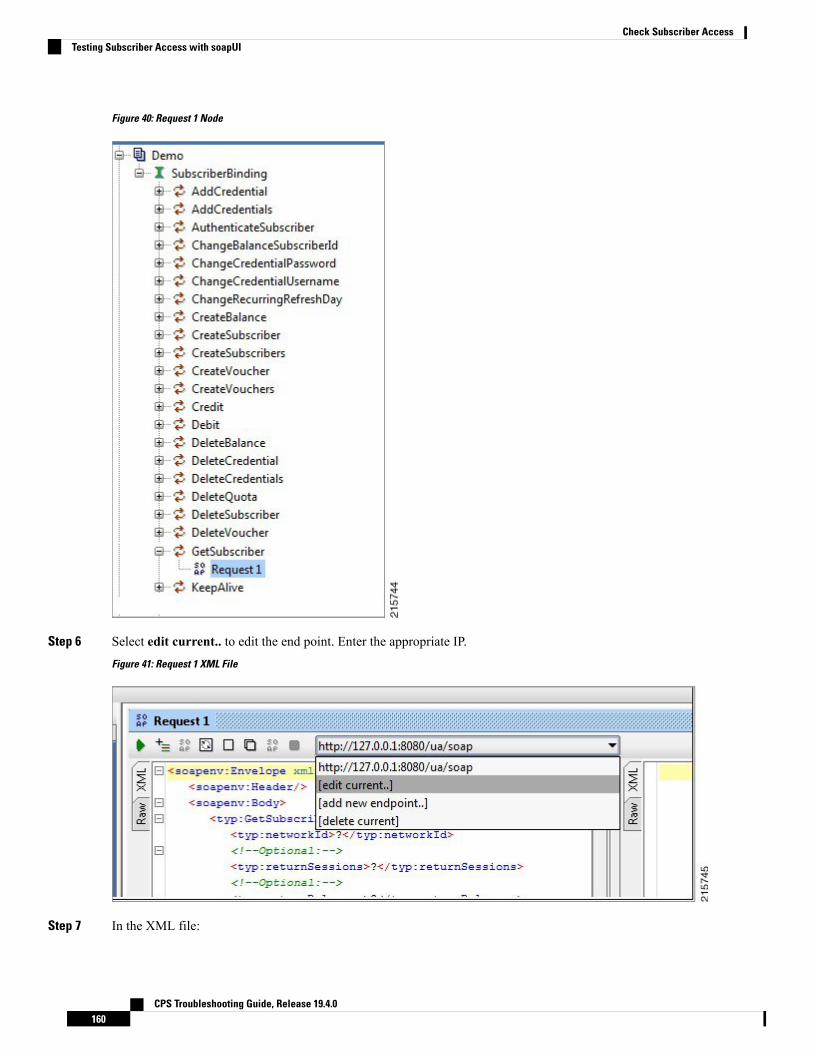
Figure 40: Request 1 Node
Step 6 Select edit current.. to edit the end point. Enter the appropriate IP.Figure 41: Request 1 XML File
Step 7 In the XML file:
CPS Troubleshooting Guide, Release 19.4.0160
Check Subscriber AccessTesting Subscriber Access with soapUI

• Replace ? in <typ:networkId>?</typ:networkId> with the appropriate credential or network ID.
• Replace ? in <typ:returnSessions>?</typ:returnSessions> with True.
• Replace ? in <typ:returnBalance>?</typ:returnBalance> with True.
Figure 42: Request 1 XML File
Step 8 Click the green arrow (underneath Request 1).Figure 43: Request 1 XML File
Step 9 Check the resulting XML output. Pay special attention to the relevant subscriber information.
CPS Troubleshooting Guide, Release 19.4.0161
Check Subscriber AccessTesting Subscriber Access with soapUI

Figure 44: XML Output
CPS Troubleshooting Guide, Release 19.4.0162
Check Subscriber AccessTesting Subscriber Access with soapUI

C H A P T E R 4TCP Dumps
• About TCP Dumps, on page 163
About TCP DumpsCPS administrators can use the tcpdump Linux command in the command line to intercept and display TCP/IPpackets, as well as others, as they are being transmitted or received.
With the tcpdump command, you can analyze network behavior, performance, and applications that generateor receive network traffic.
While not specific to CPS, the following examples of tcpdump are frequently helpful for troubleshootingCPS network packets.
Starting the heapdump on policy director (LB) will have an impact on performance.Note
TCPDUMP Commandtcpdump -i any -s 0 port XXXX
where, XXXX is the port number you are interested in.
Options
To Specify Multiple Ports
To capture more than one port:tcpdump -i any -s 0 port 1812 or 1813
To capture a port range:tcpdump -i any -s 0 portrange 1812-1817
Combining both techniques:tcpdump -i any -s 0 portrange 1812-1817 or port 1700
CPS Troubleshooting Guide, Release 19.4.0163

Verbose Mode
tcpdump -i any -s 0 -v port XXXX
Even more Verbose Mode
tcpdump -i any -s 0 -vv port XXXX
Restrict to a Specific Interface, such as eth0
tcpdump -i eth0 -s 0 port XXXX
Redirect Output of the Command to a File
tcpdump -i any -s 0 port 1812 -w output.pcap
The resulting output.pcap file can be opened and utilized using such tools as WireShark.
More options
From a UNIX/Linux prompt, typeman tcpdump.
Specific Traffic Types
These examples assume that the default ports have not been changed or have been specified in Cisco PolicyBuilder. One must modify these examples to use the appropriate ports that have been specified in Cisco PolicyBuilder if the default/typical values have been changed.
Note
Capture SNMP Traffictcpdump -i any -s 0 port 1161 or 1162 or 161 or 162
This command works for both the sending and receiving machine; the port just needs to match the source ordestination port.
Note
Other PortsThe following information is the information format:
Host/VM name Port "Service/traffic type"
where XX is the numeric value of the given host, i.e. pcrfclient01.
pcrfclientXX 80 "Subversion"
pcrfclientXX 7070 "Policy Builder"
sessionmgrXX 27717 "Session Database"
sessionmgrXX 27718 "Quota/Balance Database"
CPS Troubleshooting Guide, Release 19.4.0164
TCP DumpsSpecific Traffic Types
sessionmgrXX 27719 "Reporting Database"
sessionmgrXX 27720 "USuM Database"
lbvipXX 80 "Subversion vip external"
lbvipXX 8080 "QNS/Unified API VIP"
lbvipXX 11211 "Memcache vip internal"
lbvipXX 7070 "Policy Builder VIP"
qnsXX 9091 "QNS admin port"
CPS Troubleshooting Guide, Release 19.4.0165
TCP DumpsOther Ports

CPS Troubleshooting Guide, Release 19.4.0166
TCP DumpsOther Ports
C H A P T E R 5Call Flows
The following call flow diagrams are given to help you troubleshoot and understand CPS deployment.
• One-Click Call Flow, on page 168• User/Password Login Call Flow, on page 169• Data-limited Voucher Call Flow, on page 170• Time-limited Voucher Call Flow, on page 171• EAP-TTLS Call Flow, on page 172• Service Selection Call Flow, on page 173• MAC TAL Call Flow, on page 174• Tiered Services Call Flow, on page 175
CPS Troubleshooting Guide, Release 19.4.0167

One-Click Call FlowFigure 45: One-Click Call Flow
CPS Troubleshooting Guide, Release 19.4.0168
Call FlowsOne-Click Call Flow
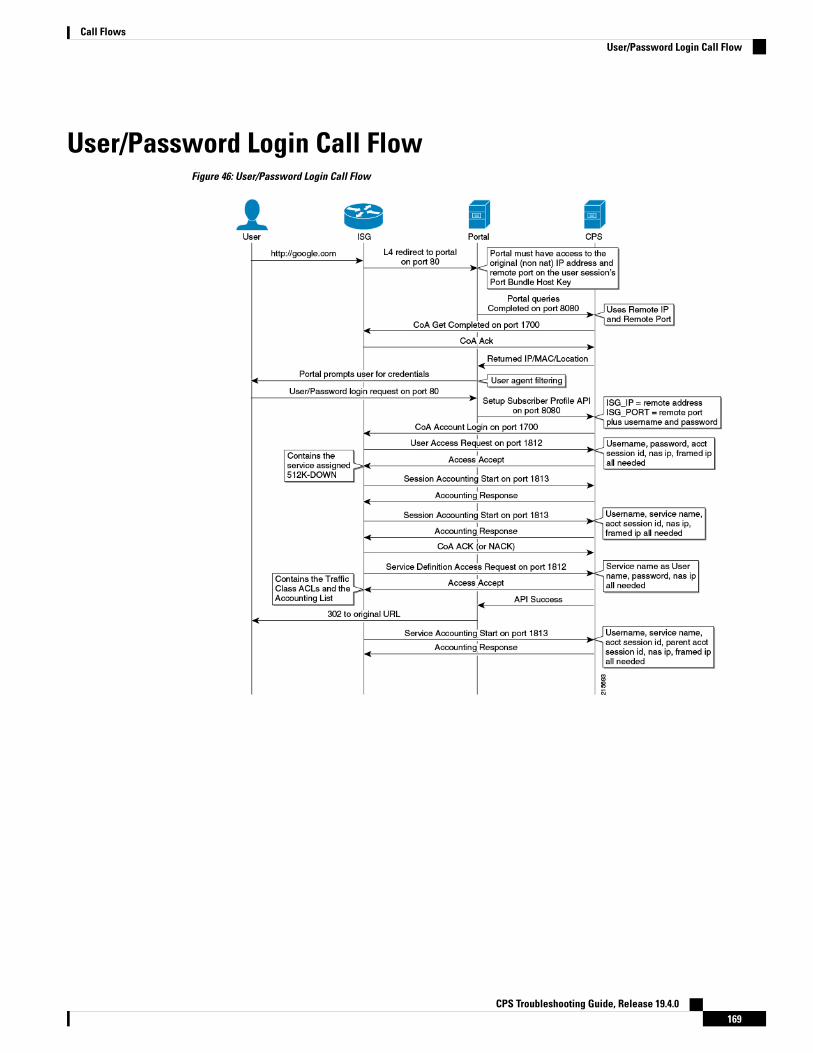
User/Password Login Call FlowFigure 46: User/Password Login Call Flow
CPS Troubleshooting Guide, Release 19.4.0169
Call FlowsUser/Password Login Call Flow

Data-limited Voucher Call FlowFigure 47: Data-limited Voucher Call Flow
CPS Troubleshooting Guide, Release 19.4.0170
Call FlowsData-limited Voucher Call Flow

Time-limited Voucher Call FlowFigure 48: Time-limited Voucher Call Flow
CPS Troubleshooting Guide, Release 19.4.0171
Call FlowsTime-limited Voucher Call Flow

EAP-TTLS Call FlowFigure 49: EAP-TTLS Call Flow
CPS Troubleshooting Guide, Release 19.4.0172
Call FlowsEAP-TTLS Call Flow

Service Selection Call FlowFigure 50: Service Selection Call Flow
CPS Troubleshooting Guide, Release 19.4.0173
Call FlowsService Selection Call Flow

MAC TAL Call FlowFigure 51: MAC TAL Call Flow
CPS Troubleshooting Guide, Release 19.4.0174
Call FlowsMAC TAL Call Flow
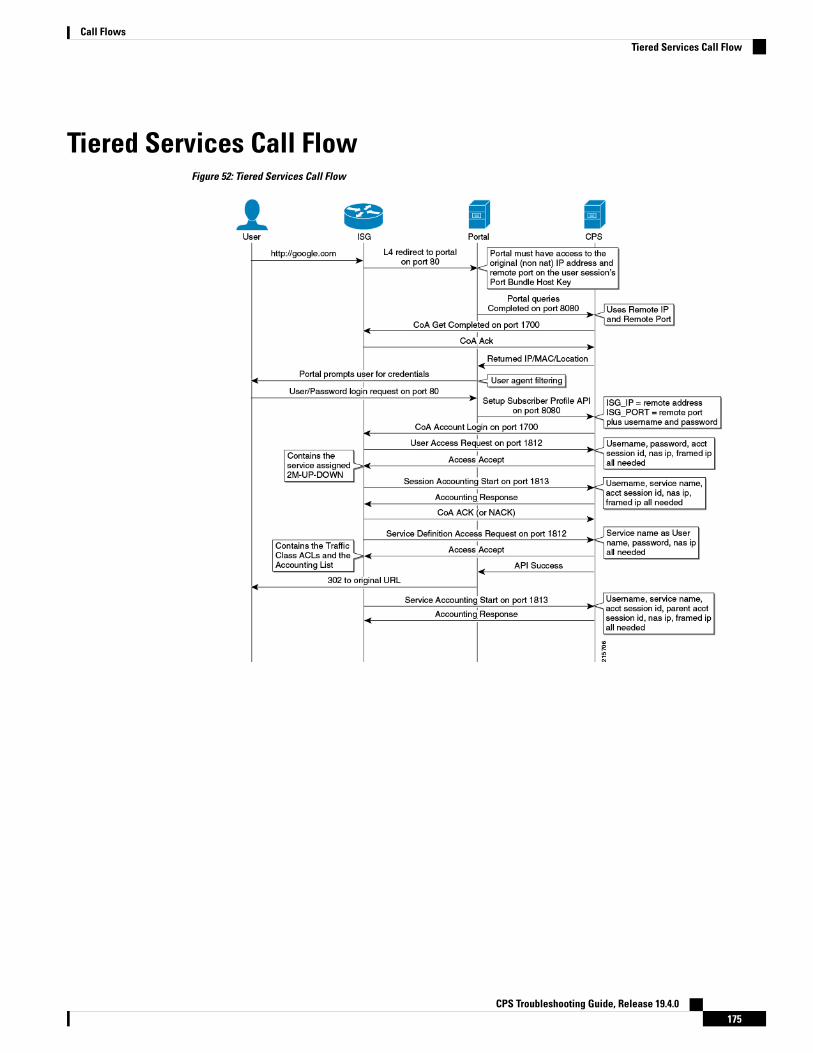
Tiered Services Call FlowFigure 52: Tiered Services Call Flow
CPS Troubleshooting Guide, Release 19.4.0175
Call FlowsTiered Services Call Flow

CPS Troubleshooting Guide, Release 19.4.0176
Call FlowsTiered Services Call Flow

C H A P T E R 6Logging
• Overview, on page 177• CPS Logs, on page 178• Basic Troubleshooting Using CPS Logs, on page 184• Consolidated Application Logging, on page 186• Rsyslog Log Processing, on page 190• Viewing Logs Without Superuser Privileges, on page 194
OverviewCPS logs can be divided into two types:
• Application Logs – generated by CPS applications
• VM Logs – generated by the underlying virtual machine operating system
The normal logs on the individual policy server/policy director/OAM (pcrfclient) VMs are:
Table 16: Normal Logs
Useful forContainsFile
finding initialization errors andapplication level errors.
main detailed policy server (qns)application logs.
/var/log/broadhop/qns-1.log
finding which services a subscriberhas, the state of a session, and otherdetailed information.
detailed event logs./var/log/broadhop/qns-engine-1.log
startup errors.the startup logs. Iflogback.xml is incorrectlyformatted, all other logstatements will go into this log.
/var/log/broadhop/service-qns-1.log
Policy Server (QNS) writes policy director (iomgr) and policy server (qns) logs to consolidated logs onpcrfclient01 including:
CPS Troubleshooting Guide, Release 19.4.0177

Table 17: policy director (iomgr) and policy server (qns) logs
Useful forContainsFile
finding initialization errors andapplication level errors.
the consolidation of all policyserver (qns) logs with the IP ofthe instance as part of the logevent.
/var/log/broadhop/consolidated-qns.log
finding which services asubscriber has, the state of asession, and other detailedinformation.
the consolidation of all policyserver (qns) engine logs withthe IP of the instance as partof the log event.
/var/log/broadhop/consolidated-engine.log
Each VM stores their log files locally before they are consolidated on pcrfclient01. The local logs are:/var/log/broadhop/qns-<#>.log/var/log/broadhop/service-qns-<#>.log
CPS LogsThe pcrfclient01 VM also contains the consolidated logs from all of the policy director (LB), policy server(QNS) and OAM (PCRFCLIENT) VMs.
The CPS logs can be divided based on Application/Script that produces the logs:
Application/Script Produces Logs: Deploy Logs• Log: deploy log
• Description: Log messages generated during CPS deployment.
• Log file name, format, path:
AIO: /var/log/deploy_cps.log
HA/GR: cluman: /var/log/install_console_YYYYMMDD_HHMMSS.log
• Log config File: NA
• Log Rollover: No
Application/Script Produces Logs: policy server• Log: policy server (qns) log
• Description:Main and most detailed logging. Contains initialization errors and application levelerrors.
• Log file name, format, path:
AIO: /var/log/broadhop/qns-<instance no>.log
HA/GR: VM: /var/log/broadhop/qns-<instance no.log
CPS Troubleshooting Guide, Release 19.4.0178
LoggingCPS Logs

• Log config File: /etc/broadhop/logback.xml
• Log Rollover: No
• Log: policy server (qns) service logs
• Description:Contains start up logs. If/etc/broadhop/logback.xml is incorrectly formatted,all logging statements go into this log.
• Log file name, format, path:
AIO: /var/log/broadhop/service-qns-<instance no.log
HA/GR: qns0*: /var/log/broadhop/service-qns-<instance no.log
• Log config File: /etc/broadhop/logback.xml
• Log Rollover: No
• Log: consolidated policy server (qns) logs
• Description: Contains the consolidation of all policy server (qns) logs with the IP of the instanceas part of the log event.
• Log file name, format, path:
AIO: NA
HA/GR: pcrfclient0*: /var/log/broadhop/consolidated-qns.log
• Log config File: /etc/broadhop/controlcenter/logback.xml
• Log Rollover: No
• Log: consolidated engine logs
• Description: Contains the consolidation of all policy server (qns) engine logs with the IP of theinstance as part of the log event.
• Log file name, format, path:
AIO: NA
HA/GR: /var/log/broadhop/consolidated-engine.log
• Log config File: /etc/broadhop/controlcenter/logback.xml
• Log Rollover: No
• Log: consolidated diagnostics logs
• Description: Contains logs about errors occurred during diagnostics of CPS.
• Log file name, format, path:
AIO: NA
HA/GR: pcrfclient0*: /var/log/broadhop/consolidated-diag.log
• Log config File: /etc/broadhop/controlcenter/logback.xml
CPS Troubleshooting Guide, Release 19.4.0179
LoggingApplication/Script Produces Logs: policy server

• Log Rollover: No
Application/Script Produces Logs: policy server pb• Log: policy server (qns) pb logs
• Description: Policy Builder startup, initialization, warnings, and errors get logged into this log file.
• Log file name, format, path:
AIO: /var/log/broadhop/qns-pb.log
HA/GR: pcrfclient0*: /var/log/broadhop/qns-pb.log
• Log config File: /etc/broadhop/logback.xml
• Log Rollover: No
• Log: service policy server (qns) pb logs
• Description: Policy Builder service logs.
• Log file name, format, path:
AIO: /var/log/broadhop/service-qns-pb.log
HA/GR: pcrfclient0*: /var/log/broadhop/service-qns-pb.log
• Log config File: /etc/broadhop/logback.xml
• Log Rollover: No
Application/Script Produces Logs: mongo• Log:MongoDB logs
• Description:Contains useful information about theMongoDB operations including queries, errors,warnings, and users' behavior.
• Log file name, format, path:
AIO: /var/log/mongodb-<port>.log
HA/GR: sessionmgr01: /var/log/mongodb-<port>.log
• Log config File: /etc/init.d/sessionmgr-* (the log options are hard coded into thesestartup scripts)
• Log Rollover: No
Application/Script Produces Logs: httpd• Log: httpd access logs
• Description: Apache server records all incoming requests and all requests processed to a log file.
CPS Troubleshooting Guide, Release 19.4.0180
LoggingApplication/Script Produces Logs: policy server pb

• Log file name, format, path:
AIO:/var/log/httpd/qns-default_access.log
HA/GR: pcrfclient0*: /var/log/httpd/qns-default_access.log
• Log config File: /etc/httpd/conf/httpd.conf
• Log Rollover: Yes
• Log: httpd error logs
• Description: All apache errors/diagnostic information about other errors found during servingrequests are logged to this file. This apache log file often contain details of what went wrong andhow to fix it.
• Log file name, format, path:
AIO: /var/log/httpd/error_log
HA/GR: pcrfclient0*: /var/log/httpd/error_log
• Log config File: /etc/httpd/conf/httpd.conf
• Log Rollover: Yes
Application/Script Produces Logs: license manager• Log: lmgrd logs
• Description: Contains license file related errors.
• Log file name, format, path:
AIO: /var/log/broadhop/lmgrd.log
HA/GR: pcrfclient0*: /var/log/broadhop/lmgrd.log
• Log config File: NA
• Log Rollover: No
Application/Script Produces Logs: svn• Log: SVN log
• Description:Displays commit logmessages. For more information refer: /usr/bin/svn log -help.For example:
./usr/bin/svn log http://lbvip02/repos/run
• Log file name, format, path:
AIO: NA
HA/GR: NA
• Log config File: NA
CPS Troubleshooting Guide, Release 19.4.0181
LoggingApplication/Script Produces Logs: license manager

• Log Rollover: No
Application/Script Produces Logs: auditd• Log: audit logs
• Description: Contains cron job logs and logs of all SSH sessions established to a CPS VM.
• Log file name, format, path:
AIO: /var/log/audit/audit.log
HA/GR: VM: /var/log/audit/audit.log
• Log config File: NA
• Log Rollover: Yes
Application/Script Produces Logs: prometheus• Log: prometheus logs
• Description: Contains prometheus logs.
• Log file name, format, path:
AIO: /var/log/prometheus/prometheus.log
HA/GR:pcrfclient0*:/var/log/prometheus/prometheus.log (Present only on pcrfclientVMs)
• Log Rollover: Yes
Application/Script Produces Logs: collectd_exporter• Log: collectd exporter logs
• Description: Contains collectd exporter logs.
• Log file name, format, path:
AIO: /var/log/prometheus/collectd_exporter.log
HA/GR: pcrfclient0*:/var/log/prometheus/collectd_exporter.log (Present onlyon pcrfclient VMs)
• Log Rollover: Yes
Application/Script Produces Logs: kernel• Log: haproxy
CPS Troubleshooting Guide, Release 19.4.0182
LoggingApplication/Script Produces Logs: auditd
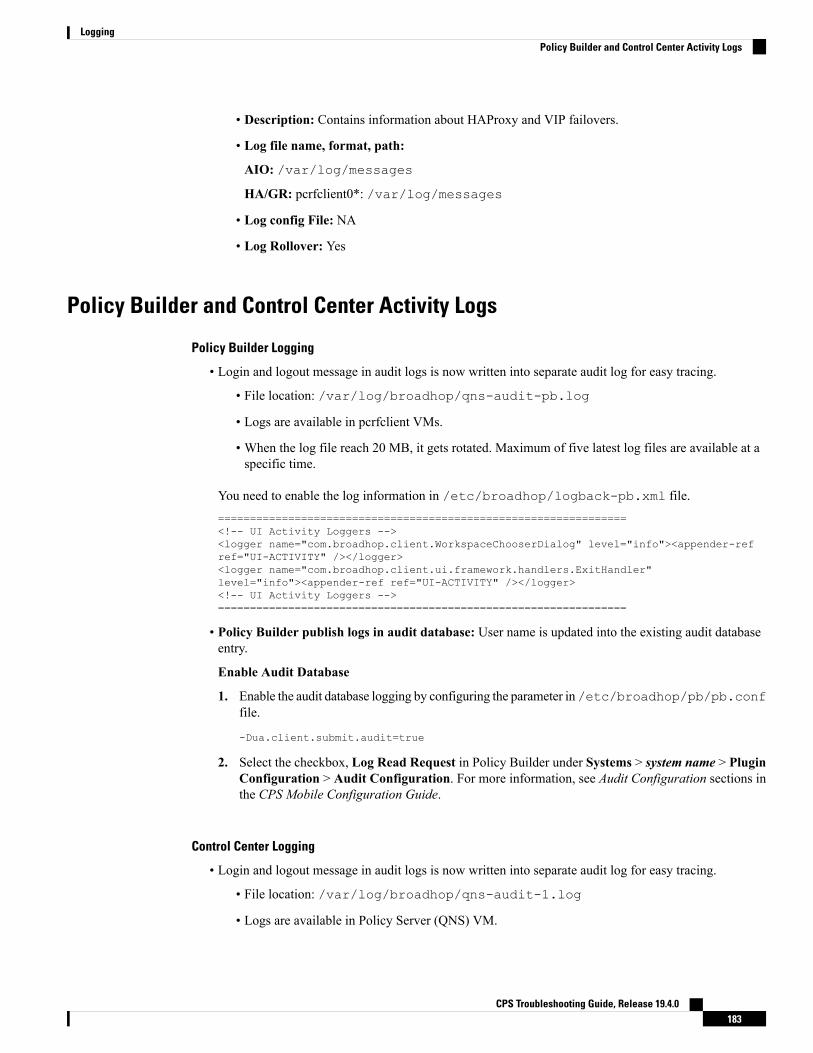
• Description: Contains information about HAProxy and VIP failovers.
• Log file name, format, path:
AIO: /var/log/messages
HA/GR: pcrfclient0*: /var/log/messages
• Log config File: NA
• Log Rollover: Yes
Policy Builder and Control Center Activity Logs
Policy Builder Logging
• Login and logout message in audit logs is now written into separate audit log for easy tracing.
• File location: /var/log/broadhop/qns-audit-pb.log
• Logs are available in pcrfclient VMs.
• When the log file reach 20 MB, it gets rotated. Maximum of five latest log files are available at aspecific time.
You need to enable the log information in /etc/broadhop/logback-pb.xml file.================================================================<!-- UI Activity Loggers --><logger name="com.broadhop.client.WorkspaceChooserDialog" level="info"><appender-refref="UI-ACTIVITY" /></logger><logger name="com.broadhop.client.ui.framework.handlers.ExitHandler"level="info"><appender-ref ref="UI-ACTIVITY" /></logger><!-- UI Activity Loggers -->================================================================
• Policy Builder publish logs in audit database: User name is updated into the existing audit databaseentry.
Enable Audit Database
1. Enable the audit database logging by configuring the parameter in/etc/broadhop/pb/pb.conffile.
-Dua.client.submit.audit=true
2. Select the checkbox, Log Read Request in Policy Builder under Systems > system name > PluginConfiguration > Audit Configuration. For more information, see Audit Configuration sections inthe CPS Mobile Configuration Guide.
Control Center Logging
• Login and logout message in audit logs is now written into separate audit log for easy tracing.
• File location: /var/log/broadhop/qns-audit-1.log
• Logs are available in Policy Server (QNS) VM.
CPS Troubleshooting Guide, Release 19.4.0183
LoggingPolicy Builder and Control Center Activity Logs

• When the log file reach 20 MB, it gets rotated. Maximum of five latest log files are available at aspecific time.
You need to enable the log information in /etc/broadhop/logback-pb.xml file.<!-- CC Login Logout --><logger name="com.broadhop.ui.security.server.SessionConcurrencyManager"
level="info"><appender-ref ref="UI-ACTIVITY" /></logger><!-- CC Login Logout -->
• By default, Control Center activity logs are captured in Audit database.
Basic Troubleshooting Using CPS Logs• Review the policy server (qns) engine logs on pcrfclient01/02:
AIO: /var/log/broadhop/qns-engine-<instance no>.log
HA/GR: /var/log/broadhop/consolidated-engine.log
These logs display issues or problems in the subscriber or services. If the event is not found in the enginelogs, check the policy server (qns) logs to look for anomalies.
• Determine when the call was supposed to occur in order to narrow down the issue.
• grep usernames, MAC addresses, IP addresses, or other relevant data to find required information.
Logging Level and Effective Logging LevelLogging level and the actual effective logging level can be two different levels because of the followinglogback logging rules:
• When a logging level is set, if the logging level of the parent process is higher than the logging level ofthe child process, then the effective logging level of the child process is that of the parent process. Thatis, even though the logging level of the child process is set, it cannot be below the logging level of theparent process and is automatically overridden to the higher logging level of the parent process.
• There is a global “root” logging level that each process can inherit as an effective default logging level.
• HA deployments default all logging to ‘warn’ level.
• AIO deployments default all logging to the ‘debug’ level.
• Each logging level prints the output of the lower logging levels.
The following table displays the logging level and the message types printed.
Table 18: Logging Level and Effective Logging Level
Message Types PrintedLevel
Equivalent to Trace and some more messages.All
Trace, Debug, Info, Warn, & ErrorTrace
CPS Troubleshooting Guide, Release 19.4.0184
LoggingBasic Troubleshooting Using CPS Logs

Message Types PrintedLevel
Debug, Info, Warn, & ErrorDebug
Info, Warn, & ErrorInfo
Warn & ErrorWarn
ErrorError
-Off
The following table describes the different logging levels and what they should be used for:
Table 19: Logging Levels
Invalid Use CaseValid Use CaseDescriptionLogging Level
Subscriber not found.Database is notavailable.
Error conditions that break a systemfeature. The error logging level should notbe used for call flow errors.
Error
Warnings should notbe used for individualcall flows.
No service found forsession.
Retrievedmore then oneGx QoS profile.
Helps to understand the early signs thatwill prevent the system from functioningin the near future OR are triggered byunexpected preconditions in a method.
Warn
Info should not beused for individualcall flows.
Troubleshootinglow-level applicationissues.
Helps to understand the life cycle ofcomponents and subsystems, such asplug-ins and databases.
Info
NATroubleshootinglow-level applicationissues.
Helps to understand the flow of the codeexecution at Class/Method level. i.e. in_createIsgDeviceSession({log...)
Debug
NATroubleshootinglow-level applicationissues.
Helps to understand the values of thestatement and branch of logics within themethod for troubleshooting.
Trace
You can configure target and log rotation for consolidated logs in the control center’s log configuration file/etc/broadhop/controlcenter/logback.xml.
The following parameters can be configured for target VM and port.<appender name="SOCKET-BASE" class="ch.qos.logback.classic.net.SocketAppender>"
<RemoteHost>${logging.controlcenter.host:-lbvip02}</RemoteHost><Port>${logging.controlcenter.port:-5644}</Port><ReconnectionDelay>10000</ReconnectionDelay><IncludeCallerData>false</IncludeCallerData>
</appender>
The configuration above is used to redirect consolidated logs to lbvip02 VM on port 5644 with reconnectiondelay.
CPS Troubleshooting Guide, Release 19.4.0185
LoggingLogging Level and Effective Logging Level
Consolidated log rotation is configured using the following configuration in/etc/broadhop/controlcenter/logback.xml.<rollingPolicy
class="ch.qos.logback.core.rolling.FixedWindowRollingPolicy"><fileNamePattern>
${com.broadhop.log.dir:-/var/log/broadhop}/consolidated-diag.%i.log.gz</fileNamePattern><minIndex>1</minIndex><maxIndex>5</maxIndex>
</rollingPolicy><triggeringPolicy
class="ch.qos.logback.core.rolling.SizeBasedTriggeringPolicy"><maxFileSize>100MB</maxFileSize>
</triggeringPolicy>
Using the above configuration, 100 MB log files are generated and after that, log files rotate from index 1 to5. This configuration will require 500 MB total available disk space.
Do not set maxFileSize greater than 100MB as this impacts performance in order to compress the log files.
Do not set maxIndex greater than 13, which is the limitation on the logging framework used by CPS.
Note
When the 100MB log file trigger condition is met, the order in which CPS system performs the file operationsis:
• log.5.gz > deleted
• log.4.gz > log.5.gz
• log.2.gz > log.3.gz
• log.1.gz > log.2.gz
• Current > log.1.gz
Similar configurations can be applied for policy server (qns) logs in /etc/broadhop/logback.xml.
Consolidated Application LoggingConsolidated logging is a function of all of the CPS VMs, and sends CPS application logs to a central server(either pcrfclient01 or pcrfclient02) to aid the debugging process. The following procedure describes how toconfigure the consolidated logging function.
Step 1 Edit the logback.xml file that is present in the /etc/broadhop directory and the logback.xml file that is presentin the /etc/broadhop/controlcenter directory.
Start by viewing the /etc/broadhop/logback.xml file. It must have a section that looks similar to this:<!-- Configure Loggers --><!-- Hide 'Could not load class...' noise. --><loggername="org.springframework.osgi.extensions.annotation.ServiceReferenceDependencyBeanFactoryPostProcessor" level="error" /><logger name="org.springframework" level="warn" />
CPS Troubleshooting Guide, Release 19.4.0186
LoggingConsolidated Application Logging

<logger name="com.broadhop.resource.impl" level="warn" /><logger name="com.danga" level="warn" /><logger name="httpclient.wire" level="warn" /><logger name="org.apache.commons.httpclient" level="warn" /><logger name="sun.rmi.tranrsport.tcp" level="warn" /><logger name="org.apache.activemq.transport.InactivityMonitor" level="warn" /><!-- Configure default Loggers --><root level="warn"><appender-ref ref="FILE" /><appender-ref ref="SOCKET" /></root>
The level can be configured to error, warn, info, or debug in the order of least logging to most logging. When debuggingan issue or during initial installation. We recommend that you set the logging level to debug. To change the logging level,change one of the levels or add additional categories, for which you must contact a Cisco support representative.
View the /etc/broadhop/controlcenter/logback.xml file. It must have a section that looks similar to this:<!-- Configure Remote Logger --><logger name="remote" level="info" additivity="false"><appender-ref ref="CONSOLIDATED-FILE" /><appender-ref ref="CONSOLIDATED-JMX" /></logger>
Step 2 If you do not want to have a default effective logging level, then set the root level to off, as shown:<!-- Configure default Loggers --><root level="off"><appender-ref ref="FILE" /><appender-ref ref="SOCKET" /></root>
Enable Debug LogsBy default, Cisco recommends to keep log level as WARN or ERROR. Sometimes for analysis the user mayneed more detailed logging. For this, the user needs the log level based on Cisco recommendation oncase-to-case basis.
The following are the various top-level loggers for which the user may need to change log level on case-to-casebasis. These loggers must be defined in /etc/broadhop/logback.xml file.
To make sure that all changes are controlled from one VM, synchronize all changes made in the ClusterManager to all the other VMs.
SSHUSER_PREFERROOT=true copytoall.sh <path of file where changes have been made> <path of
file in other VMs where changes are to be reflected>
For example,
SSHUSER_PREFERROOT=true copytoall.sh /etc/broadhop/logback.xml /etc/broadhop/logback.xml
• For Diameter issues: com.broadhop.diameter2
• For CDR/EDR issues: com.broadhop.policyintel
• For Custom Reference Data issues: com.broadhop.custrefdata
• For Notifications issues: com.broadhop.notifications
• For Session Manager Cache issues: com.broadhop.policy.mdb.cache
CPS Troubleshooting Guide, Release 19.4.0187
LoggingEnable Debug Logs

• For Control Center issues: com.broadhop.controlcenter
• For Fault Management issues: com.broadhop.faultmanagement
• For LDAP issues: com.broadhop.ldap
• For SPR issues: com.broadhop.spr
• For Unified API issues: com.broadhop.unifiedapi
• For audit issues: com.broadhop.audit
• For policy related issues: com.broadhop.policy
• For any CPS logs issues for which the log level is not overridden by other loggers: com.broadhop
• For CER/CEA DWR/DWA stack level message debugging: jdiameter logs with org.jdiameter
• For PB API issues: com.broadhop.client.api, com.broadhop.client.publish,com.broadhop.client.api.publish.svnImpl, com.broadhop.client
For consolidated logs make sure that the configuration specified in Control Center is correct to forward logsto OAM (pcrfclient) VMs.
Note
Do not set the root log level to anything higher than ‘warn’ in a production system. If needed, adjust theindividual loggers listed in logback.xml.
Note
The levels debug or info usually have logs rollover very quickly. After the log rolls over, the information islost. For this reason, warn or error generates a substantially smaller amount of logging, and gives you theability to look for issues in the system over a longer period of time.
Step 1 On the CPS node where you require debug logs, edit the /etc/broadhop/logback.xml file.
The default root logger level would be currently set to WARN. It must be changed to debug, as shown.<!-- Configure default Loggers --><root level="debug"><appender-ref ref="FILE" /><appender-ref ref="SOCKET" /></root>
Step 2 The specific component for which you require the debug log should be set to "debug" in the appropriate line. For example:
For Control Center:
On pcrfclient01, update the logback.xml on /etc/broadhop/controlcenter/.<logger name="com.broadhop.controlcenter" level="debug"/>And<root level="debug">
<appender-ref ref="FILE" /></root>
For Audit:
CPS Troubleshooting Guide, Release 19.4.0188
LoggingEnable Debug Logs

<logger name="com.broadhop.audit" level="debug"/>
For Balance:
<logger name="com.broadhop.balance" level="debug"/>
For SPR:
<logger name="com.broadhop.spr" level="debug"/>
For Congestion Reference Data:
<logger name="com.broadhop.CongestionRefData" level="debug"/>
For LDAP:
<logger name="com.broadhop.ldap" level="debug"/>
For DRA:
<logger name="com.broadhop.dra" level="debug"/>
For POP-3 Authentication:
<logger name="com.broadhop.pop3auth" level="debug"/>
For Scheduled Events:
<logger name="com.broadhop.scheduledevents" level="debug"/>
For Diameter:
<logger name="com.broadhop.diameter2" level="debug"/>
For CDR/EDR:
<logger name="com.broadhop.policyintel" level="debug"/>
For Custom Reference Data:
<logger name="com.broadhop.custrefdata" level="debug"/>
For Notification:
<logger name="com.broadhop.notifications" level="debug"/>
Session Manager Cache:
<logger name="com.broadhop.policy.mdb.cache" level="debug"/>
Step 3 Save and exit.Step 4 Run the following command to synchronize changes to all CPS VMs:
/var/qps/bin/update/syncconfig.sh
Enable Unified API Request and Response LoggingThe following procedure describes how to enable logging to debug Unified API requests and responses.
This level of logging is usually sufficient for the majority of debugging.
CPS Troubleshooting Guide, Release 19.4.0189
LoggingEnable Unified API Request and Response Logging

Step 1 On the Cluster Manager VM, add the following entry to /etc/broadhop/logback.xml:
<logger name="com.broadhop.unifiedapi.soap.servlet" level="debug"/>
Step 2 Copy the updated /etc/broadhop/logback.xml file to all other CPS VMs:
/var/qps/install/current/scripts/bin/control/copytoall.sh /etc/broadhop/logback.xml
Step 3 Search the logs for the following phrases to locate valid API requests/responses:request to server:response from server:
The logs will include a string containing the XML sent on the request and response for Unified API calls. This XML willNOT contain the SOAP wrapper information, such as the namespace info and envelope, header, and body tags. It willonly include the inner XML that policy server (QNS) actually processes.
The SOAP wrapper tags would need to be added to paste this into SoapUI and submit it. However, this is easily done byusing SoapUI to create a sample request after reading the WSDL and then just pasting in the piece from the log in theappropriate place in the XML in SoapUI.
Set the following parameter in the qns.conf file to output the Unified API logs in formatted XML insteadof a continuous string. You must restart the policy server (qns) processes after modifying qns.conf file.
Note
-Dpretty.print.responses=true
Rsyslog Log Processing
Rsyslog OverviewRsyslog logs Operating System (OS) data locally on each VM (/var/log/messages) using the/etc/rsyslog.conf and /etc/rsyslog.d/*conf configuration files.
rsyslog outputs all WARN level logs on CPS VMs to /var/log/warn.log file.
On all nodes, Rsyslog forwards the OS system log data to lbvip02 via UDP over the port defined in thelogback_syslog_daemon_port variable as set in the CPS deployment template (Excel spreadsheet). To downloadthe most current CPS Deployment Template(/var/qps/install/current/scripts/deployer/templates/QPS_deployment_config_template.xlsm),refer to the CPS Installation Guide for VMware or CPS Release Notes for this release.
Refer to http://www.rsyslog.com/doc/ for more details and Rsyslog documentation.
Rsyslog-proxyA second instance of Rsyslog called Rsyslog-proxy is installed only on AIO and Policy Director (LB) nodes.Rsyslog-proxy is only installed if the syslog_managers_list variable is set in the CPS Deployment Template.
Rsyslog-proxy is the main log forwarding process and is configured in /etc/rsyslog-proxy.conf onLB01/LB02 VMs.
CPS Troubleshooting Guide, Release 19.4.0190
LoggingRsyslog Log Processing

• It receives OS system log data from all the nodes via UDP over the PORT defined in thelogback_syslog_daemon_port variable. The default port number is 6514.
• The /etc/broadhop/controlcenter/logback.xml file on OAM (pcrfclients) or the/etc/broadhop/logback.xml file on AIO is configured to send logs to rsyslog-proxy via UDPusing the logback SyslogAppender. See Configuration of Logback.xml, on page 193 for more information.
• Rsyslog-proxy forwards the OS system log data and CPS log data to logstash via TCP on PORT 6513with a UDP backup.
• By default, Rsyslog-proxy does not log any syslog data to local files on the OAM (PCRFClient) VMs.To configure the system to output consolidated log files for syslog data on the OAM (PCRFclients), seeEnable Consolidated Syslog Output to Files on OAM VMs, on page 192.
• It receives CPS JSON formatted log data via TCP on PORT 5544. Rsyslog-proxy forwards that to logstashvia TCP on PORT 5543 with a UDP backup.
• It receives SNMP events via TCP on PORT 7546. rsyslog-proxy forwards that to logstash via TCP onPORT 7545 with a UDP backup.
• Rsyslog-proxy sends all OS system log data and CPS log data to any number of remote servers via UDPor TCP in case the encryption is enabled. (The remote servers must be configured to receive traffic butthat is not a part of the scope of this document.)
Configuration for HA EnvironmentsConfiguration of Rsyslog for High Availability CPS environments is performed using the CPS DeploymentTemplate.
Refer to the following information available in the template tabs.
Configuration Variables
The following variables can now be set in the CPS Deployment Template:
• syslog_managers_list — space separated list of remote logging servers (tuple protocol:hostname:port).Only UDP is currently supported.
• syslog_managers_ports— comma separated list of the remote logging server ports (must match the portsin the syslog_managers_list).
• logback_syslog_daemon_addr— hostname of the internal UDP server that rsyslog-proxy runs to receiveincoming logs from CPS and OS (defaults to lbvip02).
• logback_syslog_daemon_port — incoming port for rsyslog-proxy (defaults to 6514).
If the syslog_managers_list variable is empty, the rsyslog-proxy instance is not installed or configured.Note
Additional Hosts Tab
The following parameter can be configured in the Additional Hosts tab of the CPS Deployment Template file:
CPS Troubleshooting Guide, Release 19.4.0191
LoggingConfiguration for HA Environments

Table 20: Parameters in Additional Hosts Tab
<IP ADDR>syslog_managercorporate_syslog_ip
Configuration Tab
The following parameters can be configured in the Configuration tab of the CPS Deployment Template file:
udp:corporate_syslog_ip:<PORT>syslog_managers_list
<PORT>syslog_managers_ports
lbvip02logback_syslog_daemon_addr
6514logback_syslog_daemon_port
• lbvip02 is the default address for logback to send data.
• 6514 is the default port for logback to send data.
Configuration for AIOThe Rsyslog-proxy configuration for AIO environment uses a custom “facts” file:
/etc/facter/facts.d/rsyslog.txt
The same variables are used as in the CPS Deployment Template.
For example:
• syslog_managers_list=udp:corporate_syslog_ip:514
• syslog_managers_ports=514
• logback_syslog_daemon_addr=lbvip02
• logback_syslog_daemon_port=6514
OnAIOs, youmust add aliases to /etc/hosts for the remote servers as defined in the syslog_managers_list.
Enable Consolidated Syslog Output to Files on OAM VMsBy default, consolidated syslog logs from all VMs are not written to local files on the OAM (PCRFClient)VMs. The following procedure describes how to configure the system to output consolidated log files forsyslog data on the OAM (PCRFclients).
Step 1 On the Cluster Manager VM, edit the following file:
/etc/puppet/modules/qps/templates/logstash/logstash.conf
Step 2 Add the following section highlighted below:output {if [type] == "snmp-event-log" or [type] == "qps" {
CPS Troubleshooting Guide, Release 19.4.0192
LoggingConfiguration for AIO

udp {host => "127.0.0.1"port => 2121
}}if [type] == "syslog" {file {message_format => "%{[message_remainder]}"codec => "plain"path => "/var/log/broadhop/syslog/consolidated-messages.log"
}}
}
Step 3 The directory in the 'path' above must exist on pcrfclient01/pcrfclient02 VMs and the directory must be owned by'logstash:logstash'. If needed, SSH to each OAM (pcrfclient) to create the directory. Use the following command to changeownership of this directory:
chown -R logstash:logstash <dir>
Step 4 Once the configuration is in place on the Cluster Manager VM, run the following command to prepare the VMs usingthis new configuration:
/var/qps/install/current/scripts/build/build_puppet.sh
Step 5 Run the following command to propogate the changes to all VMs:
pupdate
Step 6 To control how often these log files are overwritten, edit the file /etc/logrotate.d/logstash on pcrfclient01/02VMs with the following content.
The path and filename specified below should match the 'path' value in/etc/puppet/modules/qps/templates/logstash/logstash.conf.
Note
/var/log/broadhop/syslog/*.log/var/log/logstash/*.log{
dailyrotate 7copytruncatecompressdelaycompressmissingoknotifempty
}
Configuration of Logback.xmlThe /etc/broadhop/controlcenter/logback.xml file on OAM (pcrfclients) or the/etc/broadhop/logback.xml file on AIO is configured to send logs to rsyslog-proxy via UDP usingthe logback SyslogAppender.
Refer to http://logback.qos.ch/manual/appenders.html#SyslogAppender for the SyslogAppender documentation.
The following appender forwards all CPS logs to a remote server.
CPS Troubleshooting Guide, Release 19.4.0193
LoggingConfiguration of Logback.xml

<appender name='SYSLOG' class='ch.qos.logback.classic.net.SyslogAppender'><syslogHost>lbvip02</syslogHost><!--#SAP#--><port>6514</port><!--#SAP#--><suffixPattern>[qps] [%d{yyyy-mm-dd'T'HH:mm:ss.SSSZ}] %msg</suffixPattern><facility>LOCAL0</facility>
</appender>
Rsyslog CustomizationCPS provides the ability to configure forwarding of consolidated syslogs from rsyslog-proxy on Policy DirectorVMs to remote syslog servers (refer to CPS Installation Guide for VMware). However, if additionalcustomizations are made to rsyslog configuration to forward logs to external syslog servers in customer'snetwork for monitoring purposes, such forwarding must be performed via dedicated action queues in rsyslog.In the absence of dedicated action queues, when rsyslog is unable to deliver a message to the remote server,its main message queue can fill up which can lead to severe issues, such as, preventing SSH logging, whichin turn can prevent SSH access to the VM.
In the example below, rsyslog is configured to forward syslogs related to 'authpriv' onto a remote syslog server(for example, 10.10.10.1). The forwarding is done via a dedicated 'disk-assisted in-memory' action queue:## Action queue for remote syslog forwarding## The action queue config is specified above the## directive to forward syslogs to remote server$ActionQueueType LinkedList$ActionQueueFileName remote$ActionQueueSize 10000$ActionQueueHighWatermark 8000$ActionQueueLowWatermark 2500$ActionQueueMaxDiskSpace 1G$ActionQueueTimeoutEnqueue 0
authpriv.*;auth.info @10.10.10.1
Refer to rsyslog documentation for further details on action queue configuration: http://www.rsyslog.com/doc/v5-stable/concepts/queues.html
Viewing Logs Without Superuser PrivilegesTACACS+ users who do not have superuser privileges can access all the files on the systems and some ofthe files (sudosh logs) that contain sensitive data. Currently read-only/admin users can read the sudosh logs.
Only qns-ro and qns-admin users are allowed to view log files at specific paths according to their role andmaintenance requirement. Access to logs are allowed only using the following paths:
• /var/log/
• /var/log/broadhop/scripts/
• /var/log/httpd
• /var/log/redis
• /var/log/broadhop
Commands such as cat, less, more, and find cannot be executed using sudo in CPS 10.0.0 or higher releases.
To read any file, execute the following script using sudo:
CPS Troubleshooting Guide, Release 19.4.0194
LoggingRsyslog Customization

$ sudo /var/qps/bin/support/logReader.py -r h -n 2 -f /var/log/puppet.log
where,
• -r: Corresponds to tail (t) ,tailf (tf), and head (h) respectively
• -n: Determines number of lines to be read. It works with the -r option. This is an optional parameter.
• -f: Determines the complete file path to be read.
• Non-root users cannot view the sudosh logs.
• Support to read gunzipped files is also available.
Note
CPS Troubleshooting Guide, Release 19.4.0195
LoggingViewing Logs Without Superuser Privileges

CPS Troubleshooting Guide, Release 19.4.0196
LoggingViewing Logs Without Superuser Privileges